AIR BUBBLES ENHANCE MEMBRANE CLEANING: A ... plant in order to test the compatibility of air with...
18
The International Desalination Association World Congress on Desalination and Water Reuse 2013 / Tianjin, China REF: IDAWC/TIAN13-225 AIR BUBBLES ENHANCE MEMBRANE CLEANING: A FUTURE PERSPECTIVE Authors: R. Wilson, M. Fazel, S. Jarrige, S. Chesters Presenter: Rachel Wilson Research Chemist, Genesys Manufacturing Ltd, UK [email protected] Abstract Air bubbles generated using a novel micro-bubble generator have displayed a dramatic enhancement in cleaning efficiency when used in conjunction with specially formulated cleaning chemicals. In order to establish the effect of this application on membrane performance, a series of experiments were conducted using both a flat sheet test rig and a small scale pilot plant. Experiments show that the size of the bubbles had a dramatic impact on the effects of cleaning. Air bubbles generated in combination with commodity chemicals are large and produce an inconsistent flow. However, in the presence of specially formulated cleaning chemicals, air bubbles become much smaller and refined (micro-bubbles), creating a pulsating-like action. This eases foulant removal and ultimately restores membrane performance to a greater magnitude. In addition to bubble size, the speed of the feed pump proves to be another important factor. An optimum flow speed and bubble size has been determined to achieve the best possible conditions for enhanced cleaning effects. Cleaning effectiveness was quantified by; flux increase, salt rejection increase, turbidity increase of the cleaning solution and by visual inspection of the membrane. Cleaning with air restores membrane performance to a greater extent than without air. Membranes from several major membrane manufacturers were used in this study to determine membrane compatibility with air. Membranes were then subsequently autopsied at Genesys labs in Madrid to establish the impacts of cleaning and whether the micro-bubbles had caused any damage to the membrane surface. A variety of analytical techniques were used including Scanning Electron Microscopy and Infra-Red Spectroscopy. Autopsy results are discussed in another paper. In this paper, the authors describe the equipment use, experimental methodology and results of cleaning with this novel approach.
Transcript of AIR BUBBLES ENHANCE MEMBRANE CLEANING: A ... plant in order to test the compatibility of air with...

The International Desalination Association World Congress on Desalination and Water Reuse 2013 / Tianjin, China
REF: IDAWC/TIAN13-225
AIR BUBBLES ENHANCE MEMBRANE CLEANING: A FUTURE
PERSPECTIVE
Authors: R. Wilson, M. Fazel, S. Jarrige, S. Chesters
Presenter: Rachel Wilson
Research Chemist, Genesys Manufacturing Ltd, UK
Abstract
Air bubbles generated using a novel micro-bubble generator have displayed a dramatic enhancement in
cleaning efficiency when used in conjunction with specially formulated cleaning chemicals. In order to
establish the effect of this application on membrane performance, a series of experiments were
conducted using both a flat sheet test rig and a small scale pilot plant. Experiments show that the size of
the bubbles had a dramatic impact on the effects of cleaning. Air bubbles generated in combination with
commodity chemicals are large and produce an inconsistent flow. However, in the presence of specially
formulated cleaning chemicals, air bubbles become much smaller and refined (micro-bubbles), creating
a pulsating-like action. This eases foulant removal and ultimately restores membrane performance to a
greater magnitude. In addition to bubble size, the speed of the feed pump proves to be another important
factor. An optimum flow speed and bubble size has been determined to achieve the best possible
conditions for enhanced cleaning effects. Cleaning effectiveness was quantified by; flux increase, salt
rejection increase, turbidity increase of the cleaning solution and by visual inspection of the membrane.
Cleaning with air restores membrane performance to a greater extent than without air. Membranes from
several major membrane manufacturers were used in this study to determine membrane compatibility
with air. Membranes were then subsequently autopsied at Genesys labs in Madrid to establish the
impacts of cleaning and whether the micro-bubbles had caused any damage to the membrane surface. A
variety of analytical techniques were used including Scanning Electron Microscopy and Infra-Red
Spectroscopy. Autopsy results are discussed in another paper. In this paper, the authors describe the
equipment use, experimental methodology and results of cleaning with this novel approach.
The International Desalination Association (IDA)
World Congress on Desalination and Water Reuse
REF: IDAWC/TIAN13-225
-- 2 --
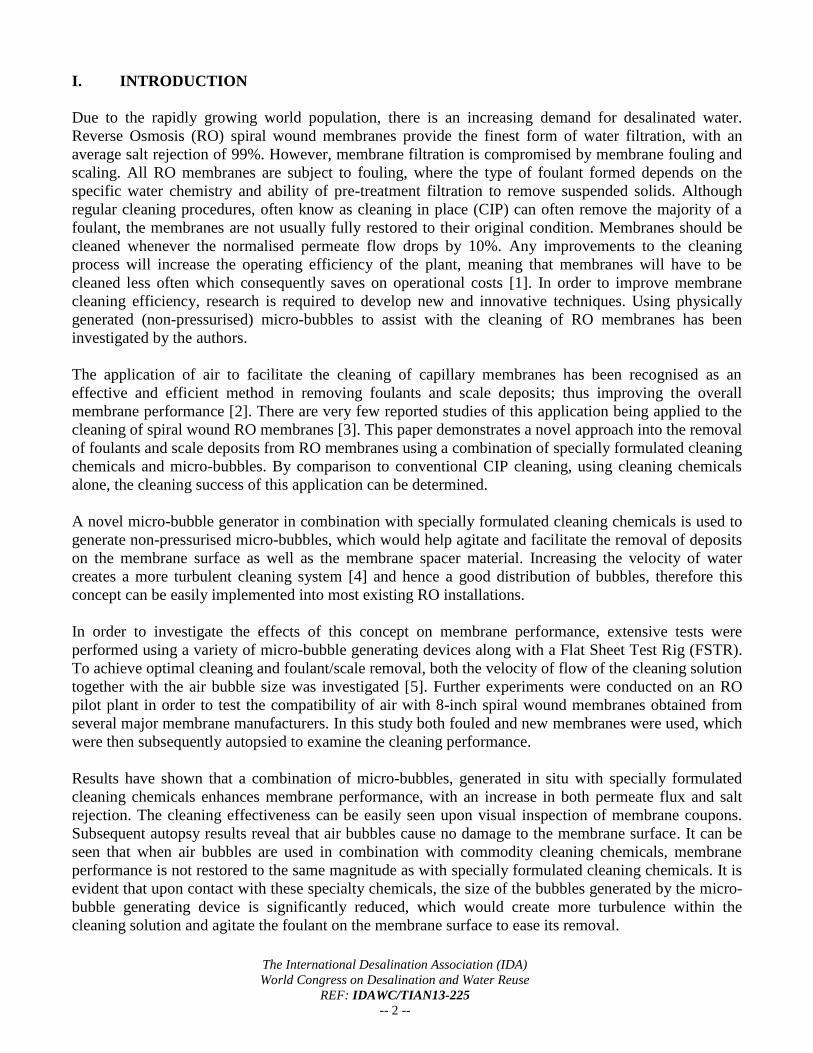
I. INTRODUCTION
Due to the rapidly growing world population, there is an increasing demand for desalinated water.
Reverse Osmosis (RO) spiral wound membranes provide the finest form of water filtration, with an
average salt rejection of 99%. However, membrane filtration is compromised by membrane fouling and
scaling. All RO membranes are subject to fouling, where the type of foulant formed depends on the
specific water chemistry and ability of pre-treatment filtration to remove suspended solids. Although
regular cleaning procedures, often know as cleaning in place (CIP) can often remove the majority of a
foulant, the membranes are not usually fully restored to their original condition. Membranes should be
cleaned whenever the normalised permeate flow drops by 10%. Any improvements to the cleaning
process will increase the operating efficiency of the plant, meaning that membranes will have to be
cleaned less often which consequently saves on operational costs [1]. In order to improve membrane
cleaning efficiency, research is required to develop new and innovative techniques. Using physically
generated (non-pressurised) micro-bubbles to assist with the cleaning of RO membranes has been
investigated by the authors.
The application of air to facilitate the cleaning of capillary membranes has been recognised as an
effective and efficient method in removing foulants and scale deposits; thus improving the overall
membrane performance [2]. There are very few reported studies of this application being applied to the
cleaning of spiral wound RO membranes [3]. This paper demonstrates a novel approach into the removal
of foulants and scale deposits from RO membranes using a combination of specially formulated cleaning
chemicals and micro-bubbles. By comparison to conventional CIP cleaning, using cleaning chemicals
alone, the cleaning success of this application can be determined.
A novel micro-bubble generator in combination with specially formulated cleaning chemicals is used to
generate non-pressurised micro-bubbles, which would help agitate and facilitate the removal of deposits
on the membrane surface as well as the membrane spacer material. Increasing the velocity of water
creates a more turbulent cleaning system [4] and hence a good distribution of bubbles, therefore this
concept can be easily implemented into most existing RO installations.
In order to investigate the effects of this concept on membrane performance, extensive tests were
performed using a variety of micro-bubble generating devices along with a Flat Sheet Test Rig (FSTR).
To achieve optimal cleaning and foulant/scale removal, both the velocity of flow of the cleaning solution
together with the air bubble size was investigated [5]. Further experiments were conducted on an RO
pilot plant in order to test the compatibility of air with 8-inch spiral wound membranes obtained from
several major membrane manufacturers. In this study both fouled and new membranes were used, which
were then subsequently autopsied to examine the cleaning performance.
Results have shown that a combination of micro-bubbles, generated in situ with specially formulated
cleaning chemicals enhances membrane performance, with an increase in both permeate flux and salt
rejection. The cleaning effectiveness can be easily seen upon visual inspection of membrane coupons.
Subsequent autopsy results reveal that air bubbles cause no damage to the membrane surface. It can be
seen that when air bubbles are used in combination with commodity cleaning chemicals, membrane
performance is not restored to the same magnitude as with specially formulated cleaning chemicals. It is
evident that upon contact with these specialty chemicals, the size of the bubbles generated by the micro-
bubble generating device is significantly reduced, which would create more turbulence within the
cleaning solution and agitate the foulant on the membrane surface to ease its removal.
The International Desalination Association (IDA)
World Congress on Desalination and Water Reuse
REF: IDAWC/TIAN13-225
-- 3 --
II. METHODOLOGY
The FSTR and the pilot plant rig were set up to simulate real life RO conditions. A series of experiments
were run on fouled and new membranes to show the effectiveness of the cleaning concept.
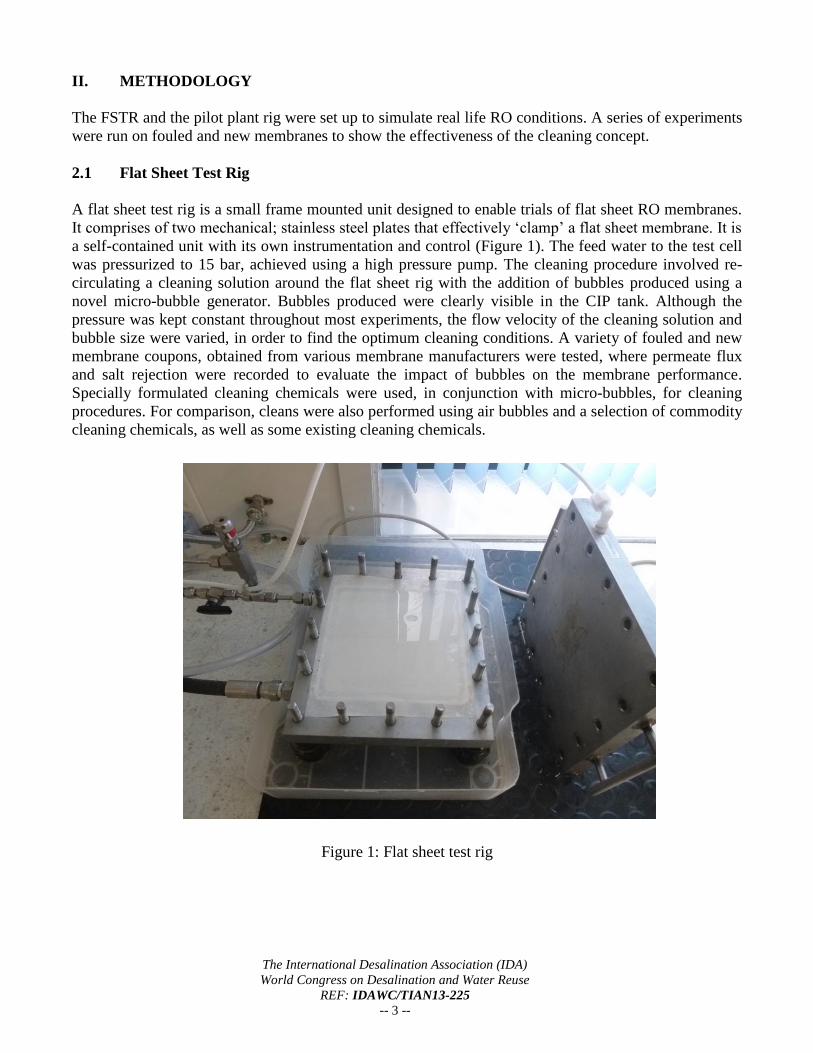
2.1 Flat Sheet Test Rig
A flat sheet test rig is a small frame mounted unit designed to enable trials of flat sheet RO membranes.
It comprises of two mechanical; stainless steel plates that effectively ‘clamp’ a flat sheet membrane. It is
a self-contained unit with its own instrumentation and control (Figure 1). The feed water to the test cell
was pressurized to 15 bar, achieved using a high pressure pump. The cleaning procedure involved re-
circulating a cleaning solution around the flat sheet rig with the addition of bubbles produced using a
novel micro-bubble generator. Bubbles produced were clearly visible in the CIP tank. Although the
pressure was kept constant throughout most experiments, the flow velocity of the cleaning solution and
bubble size were varied, in order to find the optimum cleaning conditions. A variety of fouled and new
membrane coupons, obtained from various membrane manufacturers were tested, where permeate flux
and salt rejection were recorded to evaluate the impact of bubbles on the membrane performance.
Specially formulated cleaning chemicals were used, in conjunction with micro-bubbles, for cleaning
procedures. For comparison, cleans were also performed using air bubbles and a selection of commodity
cleaning chemicals, as well as some existing cleaning chemicals.
Figure 1: Flat sheet test rig

The International Desalination Association (IDA)
World Congress on Desalination and Water Reuse
REF: IDAWC/TIAN13-225
-- 4 --
Membrane performance can be evaluated from permeate flux and salt rejection, which are dependent
upon three factors:
1. Feed water temperature – An increase in temperature decreases the driving pressure required
to produce permeate. Salt rejection decreases.
2. Feed water concentration – An increase in feed water concentration increases the driving
pressure required to produce permeate. Salt rejection decreases.
3. Feed water pressure – An increase in driving pressure increases permeate flux as flow rate
through membrane is proportional to differential pressure across membrane. Salt rejection is
proportional to the concentration differential. So an increase in pressure will increase flux
without changing the salt rejection, effectively giving a poorer quality permeate.
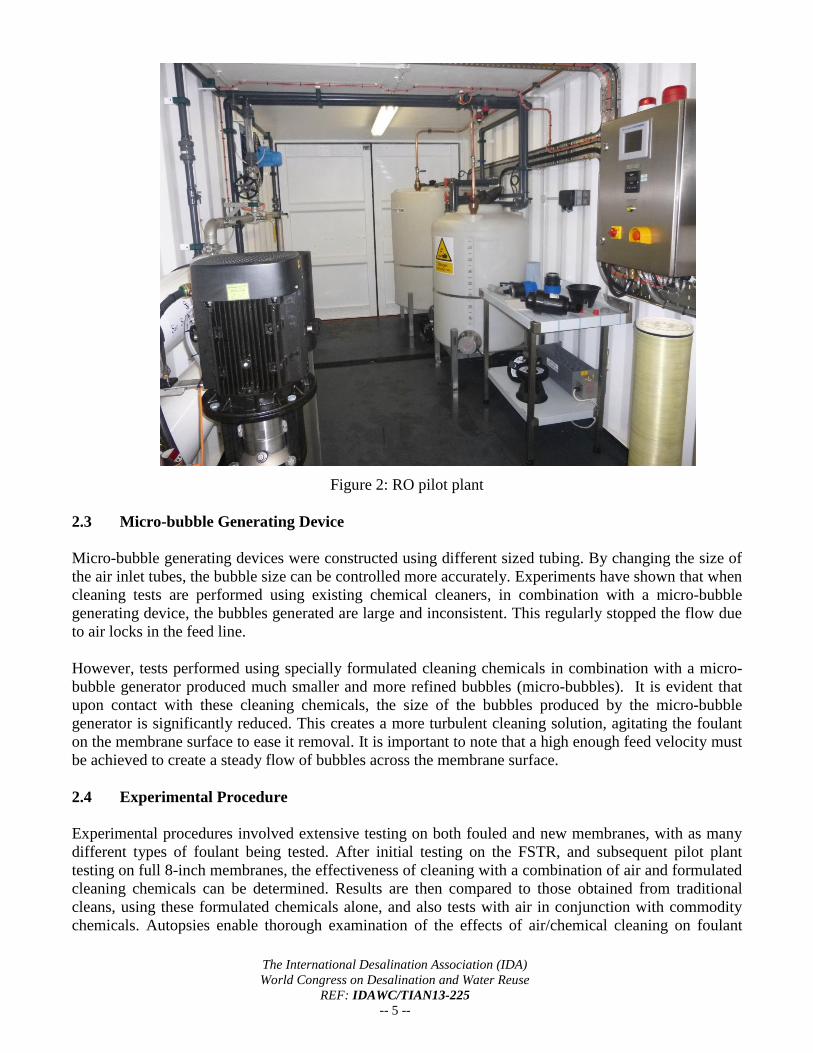
2.2 Pilot Plant
A pilot plant was designed for second stage testing of the air/chemical cleaning. It is a self-contained
unit with its own integral instrumentation and control system (Figure 2). The ability to conduct tests on
full 8-inch membranes gives a clearer indication of the effects of micro-bubbles and specialty cleaners.
Pre-treatment is essential to remove contaminants that are likely to foul the RO membranes. Feed water
is de-chlorinated using in-line carbon filters, which is then pressurised using a high pressure pump. The
feed water then enters 10µm cartridge filters which reduce the quantity of any particulate matter from
entering the RO membranes. These are generally replaced when the differential pressure increases by 1
bar. The plant consists of two 8-inch pressure vessels. One single element (40-inch) vessel and one three
element (3 x 40-inch) vessel. The vessels are arranged in parallel with isolation valves. The plant
includes an in-built CIP system to enable RO membrane cleaning/preservation. The micro-bubble
generator can be easily installed into the feed pipework of the system in order to generate air bubbles
during cleaning.
The pilot plant enables cleaning tests to be performed on many 8-inch membranes (both fouled and new)
obtained from several membrane manufacturers. Likewise with the FSTR, cleans are performed using a
combination of non-pressurised micro-bubbles and specialty cleaning chemicals. Selection of the
optimum pressure, flow, and bubble size, gives a good distribution of air bubbles throughout the
membranes during cleaning.
To assess membrane performance, there are important parameters which must be monitored:
1. Differential pressure
2. Permeate flux
3. Salt rejection
4. Conductivity
5. pH
6. Temperature
The International Desalination Association (IDA)
World Congress on Desalination and Water Reuse
REF: IDAWC/TIAN13-225
-- 5 --
Figure 2: RO pilot plant
2.3 Micro-bubble Generating Device
Micro-bubble generating devices were constructed using different sized tubing. By changing the size of
the air inlet tubes, the bubble size can be controlled more accurately. Experiments have shown that when
cleaning tests are performed using existing chemical cleaners, in combination with a micro-bubble
generating device, the bubbles generated are large and inconsistent. This regularly stopped the flow due
to air locks in the feed line.
However, tests performed using specially formulated cleaning chemicals in combination with a micro-
bubble generator produced much smaller and more refined bubbles (micro-bubbles). It is evident that
upon contact with these cleaning chemicals, the size of the bubbles produced by the micro-bubble
generator is significantly reduced. This creates a more turbulent cleaning solution, agitating the foulant
on the membrane surface to ease it removal. It is important to note that a high enough feed velocity must
be achieved to create a steady flow of bubbles across the membrane surface.
2.4 Experimental Procedure
Experimental procedures involved extensive testing on both fouled and new membranes, with as many
different types of foulant being tested. After initial testing on the FSTR, and subsequent pilot plant
testing on full 8-inch membranes, the effectiveness of cleaning with a combination of air and formulated
cleaning chemicals can be determined. Results are then compared to those obtained from traditional
cleans, using these formulated chemicals alone, and also tests with air in conjunction with commodity
chemicals. Autopsies enable thorough examination of the effects of air/chemical cleaning on foulant

The International Desalination Association (IDA)
World Congress on Desalination and Water Reuse
REF: IDAWC/TIAN13-225
-- 6 --
removal, from both the membrane surface and membrane spacer material. Analytical techniques used to
analyse the membrane surface included Scanning Electron Microscopy – Energy Dispersive X-ray
Analysis (SEM-EDXA) and Infra-Red Spectroscopy (IR). Results show that micro-bubbles cause no
damage to the membrane surface, and are discussed in another paper.
III. FLAT SHEET TEST RIG RESULTS
Cleaning tests were conducted on membrane coupons with various foulants/scalants from different
membrane manufacturers.
Cleaning tests were carried out following the set cleaning protocol:
1. The fouled membrane was characterised using a 2000ppm NaCl solution under standard test
conditions
2. A 2-4 hour clean was performed using the desired cleaner product, after which the membrane
was characterised again under standard test conditions.
3. An additional 2-4 hour clean was performed using the desired cleaner product, after which the
membrane performance was characterised again using 2000ppm NaCl solution under standard
test conditions.
Standard Test Conditions were:
The flux rate was measured at standard operating conditions for each membrane type
The recirculation rate was 1000 ml/min and normalized to 25°C
The cleaning solution was recirculated at ~2 bar for 30 minutes followed by a soak for 30
minutes followed by recirculation for 30 minutes and so on for the full duration of clean
Alkaline cleans were carried out at 30-35°C whereas acid cleans were carried out at 15-25°C
All cleaning tests were carried out both with and without air for comparison. The turbidity of the
cleaning solution was measured before and after the clean as a measure of the quantity of foulant/scalant
removed.
Note: Cleaners A and B are newly formulated powder cleaners with effervescent properties, containing
a mixture of detergents, surfactant and chelating agents. Cleaner C is an existing liquid cleaning product,
and Cleaner D is an existing powder alkaline cleaning product.
3.1 Clay/Al-Silicates/Iron fouled membrane
The cleaning tests were carried out on a Clay/Iron fouled membrane. The membrane was a Koch 8040-
XR-400 Brackish Water model with a standard permeate flux of 44.5 lm2h and salt rejection of 99.75%.
Table 1: Cleaning Programs for Clay/Iron fouled membrane
Tests Clay/Iron fouled membrane:
1a Fouled membrane flux and salt rejection before clean
1b Performance after clean with NaOH for 3 hours, pH 12 @ temperature 30-35 ºC
1c Performance after additional clean with Citric acid for 2 hours, pH 3-4 @ temperature 15-
25 ºC

The International Desalination Association (IDA)
World Congress on Desalination and Water Reuse
REF: IDAWC/TIAN13-225
-- 7 --
2a Fouled membrane flux and salt rejection before clean
2b Performance after clean with NaOH + air for 3 hours, pH 12 @ temperature 30-35 °C
2c Performance after additional clean with Citric acid + air for 2 hours, pH 3-4 @ temperature
15-25 °C
3a Fouled membrane flux and salt rejection before clean
3b Performance after clean with Cleaner A for 3 hours, pH 11.5 @ temperature 30-35 ºC
3c Performance after additional clean with Cleaner B for 2 hours, pH 2-3 @ temperature 15-
25 ºC
4a Fouled membrane flux and salt rejection before clean
4b Performance after clean with Cleaner A + air for 3 hours, pH 11.5 @ temperature 30-35 °C
4c Performance after additional clean with Cleaner B + air for 2 hours, pH 2-3 @ temperature
15-25 °C
Table 2: Results for Clay/Iron fouled membrane
Test
2000 ppm
NaCl Flux
(l/m2h)
% Flux
Change
% Salt
Rejection
Change in
Turbidity
(NTU)
Test 1: Clay/Fe fouled membrane (without air)
1a) Before Clean 25.3 - 95.2% -
1b) After 3hr clean with
0.2% NaOH, pH 12 26.4 +4% 96.2%
4 → 19
1c) Follow on 2hr clean with
2% Citric acid, pH 3-4 25.6 +1% 96.2%
2 → 2
Test 2: Clay/Fe fouled membrane + air
2a) Before Clean 26.9 - 97.9% -
2b) After 3hr clean with
0.2% NaOH + Air, pH 12 31.6 +17% 98.2%
4 → 38
2c) Follow on 2hr clean with
2% Citric acid + Air, pH 3-4 26.5 -2% 98.5%
4 → 11
Test 3: Clay/Fe fouled membrane (without air)
3a) Before Clean 29.2 - 97.0% -
3b) After 3hr clean with
1% Cleaner A, pH 11.5 38.4 +32% 98.6%
1 → 112
3c) Follow on 2hr clean with
1% Cleaner B, pH 2-3 37.8 +29% 98.7%
5 → 15
Test 4: Clay/Fe fouled membrane + air
4a) Before Clean 26.5 - 96.1% -
4b) After 3hr clean with 1% Cleaner
A + Air, pH 11.5 37.0 +40% 98.3%
4 → 110
4c) Follow on 2hr clean with 1%
Cleaner B + Air, pH 2-3 40.2 +52% 98.7%
4 → 4
The International Desalination Association (IDA)
World Congress on Desalination and Water Reuse
REF: IDAWC/TIAN13-225
-- 8 --
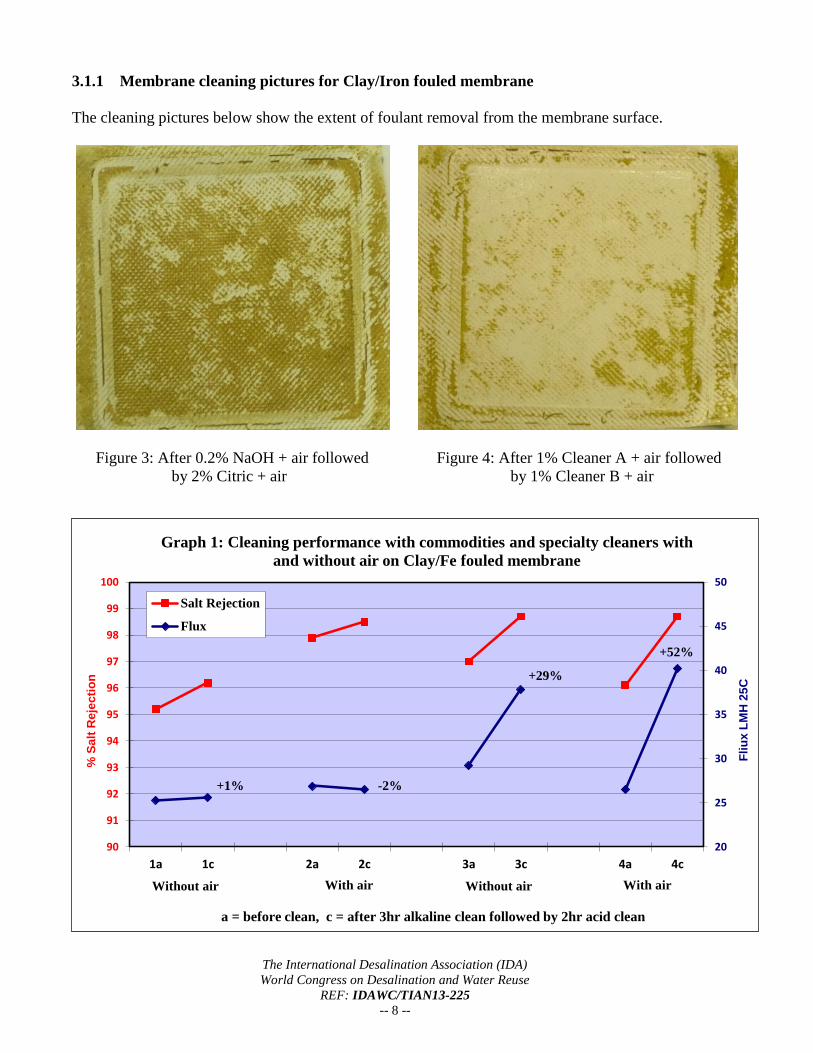
3.1.1 Membrane cleaning pictures for Clay/Iron fouled membrane
The cleaning pictures below show the extent of foulant removal from the membrane surface.
Figure 3: After 0.2% NaOH + air followed Figure 4: After 1% Cleaner A + air followed
by 2% Citric + air by 1% Cleaner B + air
+29%
+52%
20
25
30
35
40
45
50
90
91
92
93
94
95
96
97
98
99
100
1a 1c 2a 2c 3a 3c 4a 4c
Fli
ux
LM
H 2
5C
% S
alt
Reje
cti
on
a = before clean, c = after 3hr alkaline clean followed by 2hr acid clean
Graph 1: Cleaning performance with commodities and specialty cleaners with
and without air on Clay/Fe fouled membrane
Salt Rejection
Flux
Without air With air Without air With air
-2% +1%
The International Desalination Association (IDA)
World Congress on Desalination and Water Reuse
REF: IDAWC/TIAN13-225
-- 9 --
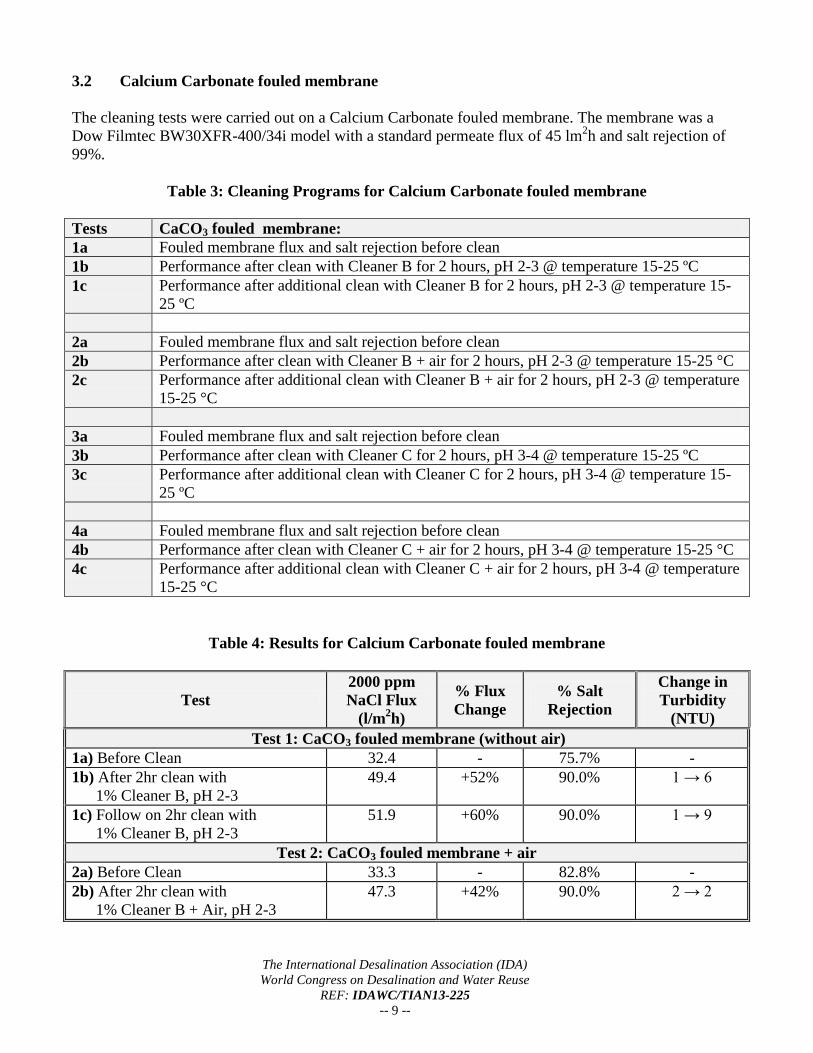
3.2 Calcium Carbonate fouled membrane
The cleaning tests were carried out on a Calcium Carbonate fouled membrane. The membrane was a
Dow Filmtec BW30XFR-400/34i model with a standard permeate flux of 45 lm2h and salt rejection of
99%.
Table 3: Cleaning Programs for Calcium Carbonate fouled membrane
Tests CaCO3 fouled membrane:
1a Fouled membrane flux and salt rejection before clean
1b Performance after clean with Cleaner B for 2 hours, pH 2-3 @ temperature 15-25 ºC
1c Performance after additional clean with Cleaner B for 2 hours, pH 2-3 @ temperature 15-
25 ºC
2a Fouled membrane flux and salt rejection before clean
2b Performance after clean with Cleaner B + air for 2 hours, pH 2-3 @ temperature 15-25 °C
2c Performance after additional clean with Cleaner B + air for 2 hours, pH 2-3 @ temperature
15-25 °C
3a Fouled membrane flux and salt rejection before clean
3b Performance after clean with Cleaner C for 2 hours, pH 3-4 @ temperature 15-25 ºC
3c Performance after additional clean with Cleaner C for 2 hours, pH 3-4 @ temperature 15-
25 ºC
4a Fouled membrane flux and salt rejection before clean
4b Performance after clean with Cleaner C + air for 2 hours, pH 3-4 @ temperature 15-25 °C
4c Performance after additional clean with Cleaner C + air for 2 hours, pH 3-4 @ temperature
15-25 °C
Table 4: Results for Calcium Carbonate fouled membrane
Test
2000 ppm
NaCl Flux
(l/m2h)
% Flux
Change
% Salt
Rejection
Change in
Turbidity
(NTU)
Test 1: CaCO3 fouled membrane (without air)
1a) Before Clean 32.4 - 75.7% -
1b) After 2hr clean with
1% Cleaner B, pH 2-3
49.4 +52% 90.0% 1 → 6
1c) Follow on 2hr clean with
1% Cleaner B, pH 2-3
51.9 +60% 90.0% 1 → 9
Test 2: CaCO3 fouled membrane + air
2a) Before Clean 33.3 - 82.8% -
2b) After 2hr clean with
1% Cleaner B + Air, pH 2-3
47.3 +42% 90.0% 2 → 2
The International Desalination Association (IDA)
World Congress on Desalination and Water Reuse
REF: IDAWC/TIAN13-225
-- 10 --
2c) Follow on 2hr clean with
1% Cleaner B + Air, pH 2-3
51.3 +54% 89.7% 1 → 2
Test 3: CaCO3 fouled membrane (without air)
3a) Before Clean 40.2 - 81.0% -
3b) After 2hr clean with
3% Cleaner C, pH 3-4
46.2 +15% 90.8% 0 → 4
3c) Follow on 2hr clean with
3% Cleaner C, pH 3-4
44.8 +11% 90.5% 0 → 5
Test 4: CaCO3 fouled membrane + air
4a) Before Clean 37.6 - 86.0% -
4b) After 2hr clean with 3% Cleaner
C + Air, pH 3-4
42.9 +14% 87.7% 2 → 2
4c) Follow on 2hr clean with 3%
Cleaner C + Air, pH 3-4
51.3 +37% 91.0% 2 → 5
N.B: Turbidity readings are undependable with acid cleaners because the foulant removed is readily
soluble in the cleaning solution, so turbidity does not increase by much.
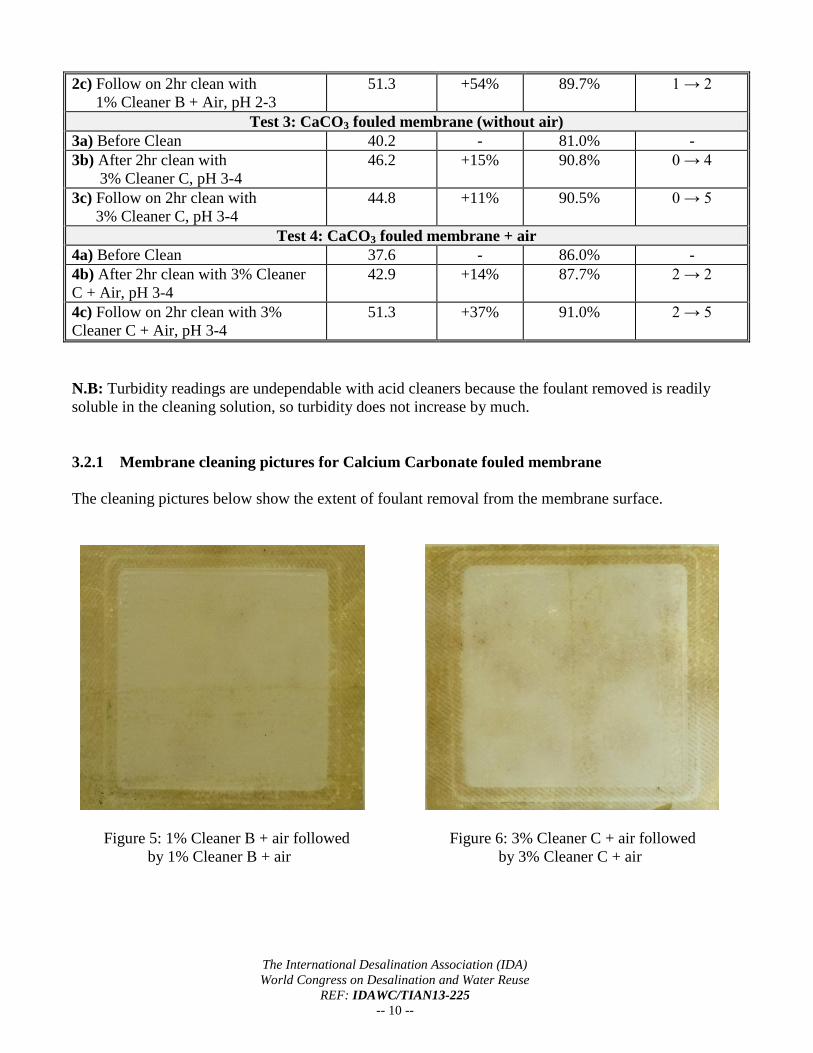
3.2.1 Membrane cleaning pictures for Calcium Carbonate fouled membrane
The cleaning pictures below show the extent of foulant removal from the membrane surface.
Figure 5: 1% Cleaner B + air followed Figure 6: 3% Cleaner C + air followed
by 1% Cleaner B + air by 3% Cleaner C + air

The International Desalination Association (IDA)
World Congress on Desalination and Water Reuse
REF: IDAWC/TIAN13-225
-- 11 --
IV. MEMBRANE AUTOPSY RESULTS
After testing on the flat sheet rig, membrane samples were analysed at Genesys labs in Madrid.
Autopsies enable thorough examination of the effects of air/chemical cleaning on foulant removal, from
both the membrane surface and membrane spacer material.
4.1 Scanning Electron Microscopy – Energy Dispersive X-ray Analysis (SEM-EDXA)
SEM-EDXA was used to study the membrane surface and to verify the elemental composition of its
foulant and deposits detected. For conventional imaging using SEM, the samples must be electrically
conductive at the surface, and electrically grounded to prevent the accumulation of electrostatic charge
at the surface. Membrane samples are therefore coated with an ultrathin coating of an electrically
conducting material, in this case gold.
The main components of the membranes are carbon, oxygen, nitrogen (which are not detectable by this
technique) and sulphur (polysulphone layer). In the absence of foulant, or when it is very thin, the
electron beam used for analysis can reach the polysulphone layer and hence sulphur is detected.
However, SEM cannot distinguish whether sulphur detected is from the membrane or the foulant; the
obtained percentage gives information about the thickness of the foulant.
+11%
+37%
30
35
40
45
50
55
60
70
75
80
85
90
95
1a 1c 2a 2c 3a 3c 4a 4c
Fli
ux
LM
H 2
5C
% S
alt
Re
jec
tio
n
a = before clean, c = after 2hr acid clean followed by 2hr acid clean
Graph 2: Cleaning performance with existing and specialty cleaners with and
without air on CaCO3 fouled membrane
Salt Rejection
Flux
+60% +54%
Without air Without air With air With air
The International Desalination Association (IDA)
World Congress on Desalination and Water Reuse
REF: IDAWC/TIAN13-225
-- 12 --
0
1
2
3
4
5
6
7
8
9
Aluminium Silicon Sulphur Iron Calcium Magnesium Potassium
Blank
Cleaner A + Cleaner B NO AIR
Cleaner A + Cleaner B + AIR
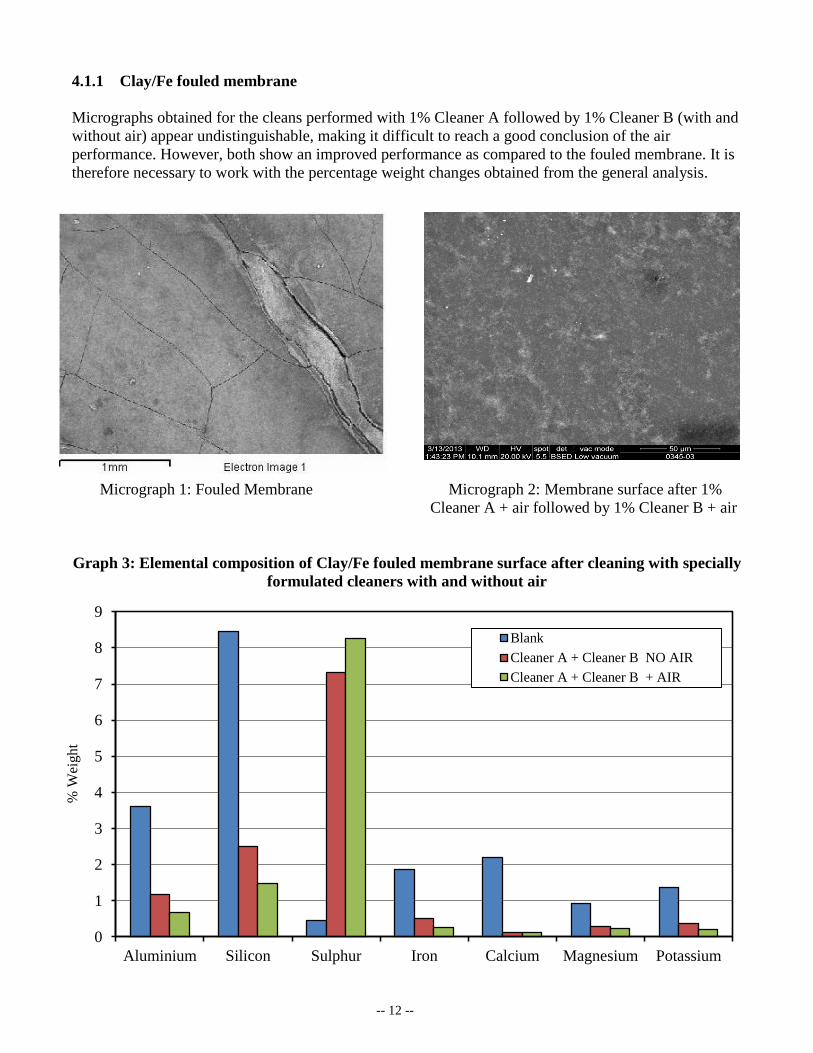
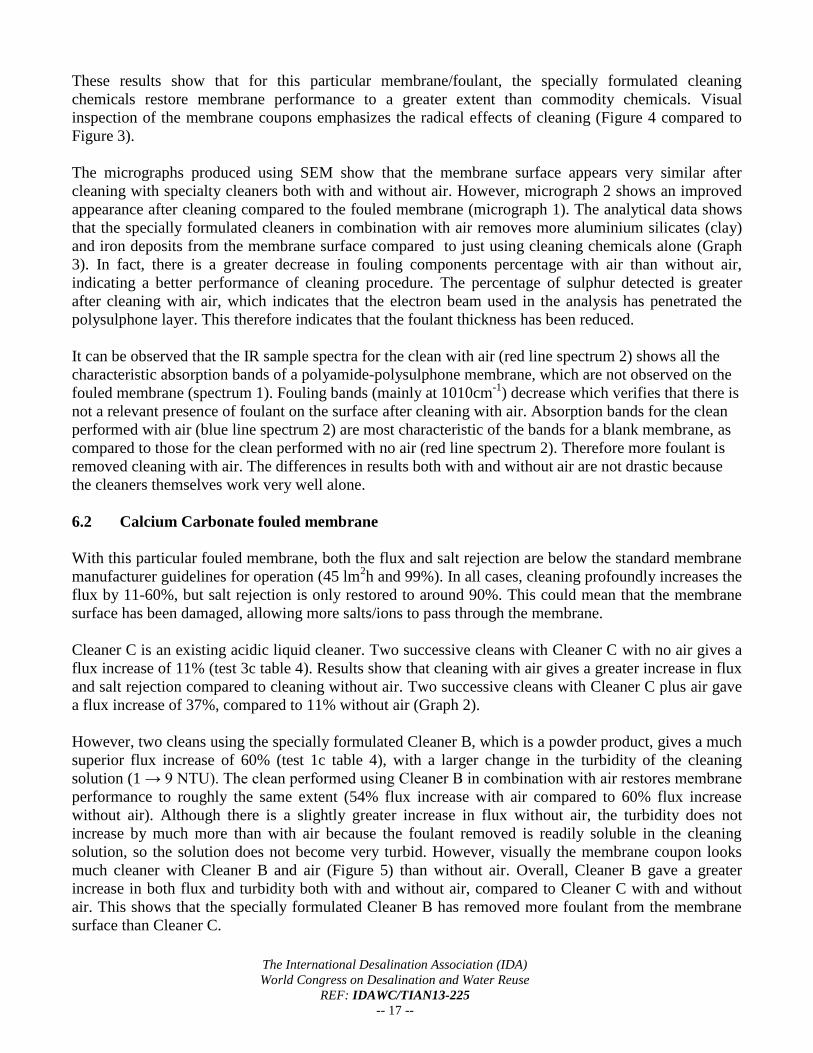
4.1.1 Clay/Fe fouled membrane
Micrographs obtained for the cleans performed with 1% Cleaner A followed by 1% Cleaner B (with and
without air) appear undistinguishable, making it difficult to reach a good conclusion of the air
performance. However, both show an improved performance as compared to the fouled membrane. It is
therefore necessary to work with the percentage weight changes obtained from the general analysis.
Micrograph 1: Fouled Membrane Micrograph 2: Membrane surface after 1%
Cleaner A + air followed by 1% Cleaner B + air
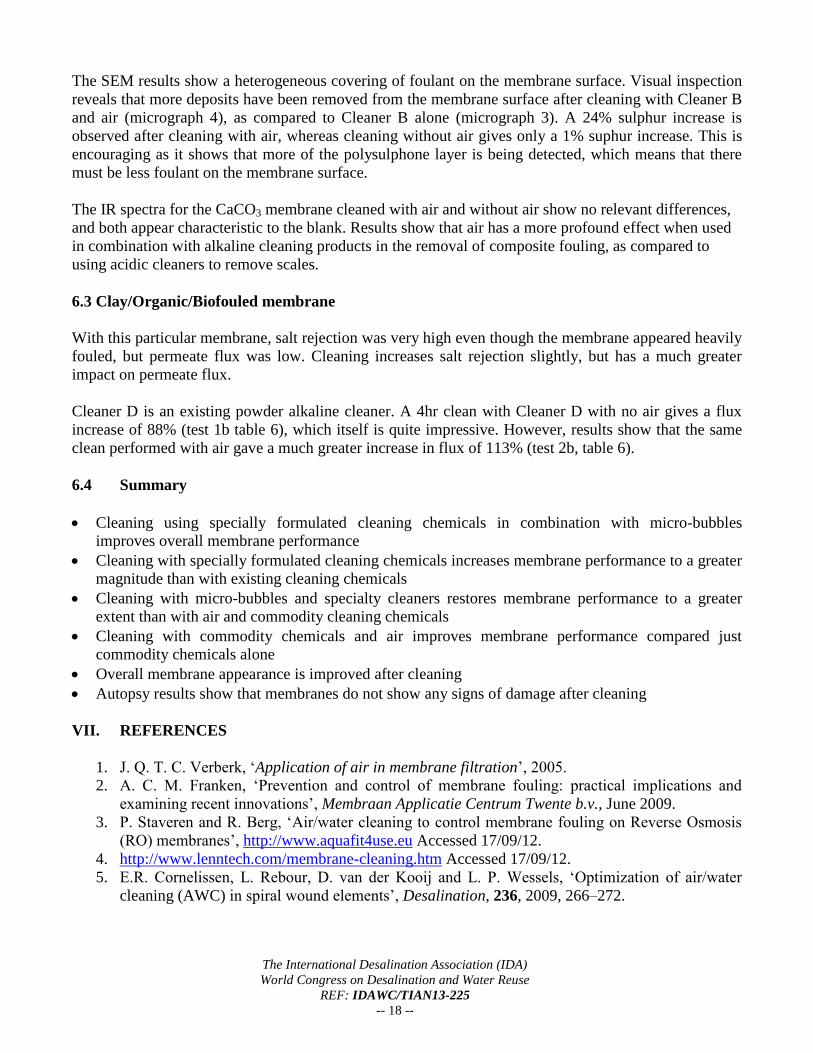
Graph 3: Elemental composition of Clay/Fe fouled membrane surface after cleaning with specially
formulated cleaners with and without air
% W
eigh
t

The International Desalination Association (IDA)
World Congress on Desalination and Water Reuse
REF: IDAWC/TIAN13-225
-- 13 --
4.1.2 CaCO3 fouled membrane
Micrograph 3: Membrane surface after Micrograph 4: Membrane surface after
1% Cleaner B without air 1% Cleaner B with air
A 24% sulphur increase is observed after cleaning with air, whereas cleaning without air gives only a
1% suphur increase. This is encouraging as it shows that more of the polysulphone layer is being
detected, which means that there must be less foulant on the membrane surface.
4.2 Infra-Red Spectroscopy
Infra-Red Spectroscopy (IR) can provide valuable information related to the chemical structure of
membranes, or to characterize the fouling layer that may be present on the membrane surface.
In the mid-infrared, absorption of radiation is related to the fundamental vibrations of the chemical
bonds. IR Spectroscopy provides information related to the presence or absence of specific functional
group. Shifts on the frequency of absorption bands and changes in relative band intensities indicate
changes in the chemical structure, or changes on the membrane surface. So if the sample spectrum looks
like the blank, then deposits have been removed.
4.2.1 Clay/Fe fouled membrane
Spectrum 1 shows the absorbance peaks produced for the fouled (‘raw’) membrane.
Spectrum 2 shows the absorbance peaks produced for the membrane cleaned with 1% Cleaner A
followed by 1% Cleaner B both with air (blue) and without air (red).

The International Desalination Association (IDA)
World Congress on Desalination and Water Reuse
REF: IDAWC/TIAN13-225
-- 14 --
Spectrum 1: IR spectrum for ‘raw’ Clay/Iron fouled membrane
Spectrum 2: IR spectra for Clay/Iron fouled membrane after cleaning with Cleaner A followed by
Cleaner B, with and without air
-0.050
0.000
0.050
0.100
0.150
0.200
0.250
0.300
652
760
868
976
1084
1192
1300
1408
1516
1624
1732
1840
1948
2056
2164
2272
2380
2488
2596
2704
2812
2920
3028
3136
3244
3352
3460
3568
3676
3784
3892
4000
Ab
so
rban
ce
Wavenumber, cm-1
Raw fouled…
-0.050
0.050
0.150
0.250
0.350
0.450
0.550
0.650
0.750
0.850
405
521
636
752
868
984
1099
1215
1331
1446
1562
1678
1794
1909
2025
2141
2256
2372
2488
2603
2719
2835
2951
3066
3182
3298
3413
3529
3645
3761
3876
3992
Ab
so
rban
ce
Wavenumber, cm-1
Cleaning without air
Cleaning with air

The International Desalination Association (IDA)
World Congress on Desalination and Water Reuse
REF: IDAWC/TIAN13-225
-- 15 --
Commonly, the identification of polyamide damage concerns the following bands:
Amide N-H bend: 1540 cm-1
C=C ring vibrations: near 1610 and 1448 cm-1
From spectrum 2, these polyamide bands can be observed after cleaning both with air and without air
and do not show any relevant changes (circled in yellow). This verifies that the polyamide layer has not
suffered any structural changes during cleaning These bands cannot be identified on the fouled
membrane (spectrum 1) because there is a thick layer of foulant on the membrane surface so the
polyamide absorption bands cannot be detected. Fouling bands (~1010cm-1
) intensity decreases more
with air; this demonstrates that more foulant is removed with air.
The IR spectra for the CaCO3 membrane cleaned with air and without air show no relevant differences,
and both appear characteristic to the blank. Like with the Clay/Iron fouled membrane, membrane bands
are more distinguished and the intensity of fouling bands decreases after cleaning with air.
V. PILOT PLANT RESULTS
Preliminary cleaning tests were conducted on full 8-inch membrane elements with various foulants from
different membrane manufacturers.
Cleaning tests were carried out following the set cleaning protocol:
1. The fouled membrane was characterised using a 1500ppm NaCl solution under standard test
conditions
2. A 4 hour clean was performed using the desired cleaner product, after which the membrane was
characterised again under standard test conditions.
3. An additional 4 hour clean was performed using the desired cleaner product, after which the
membrane performance was characterised again using 1500ppm NaCl solution under standard
test conditions.
Standard Test Conditions were:
The flux rate was measured at standard operating conditions for each membrane type
The recirculation rate was ~11 m3/hr and normalized to 25°C
The cleaning solution was recirculated at ~4 bar for 30 minutes followed by a soak for 30
minutes followed by recirculation for 30 minutes and so on for the full duration of clean
Recirculation rate without air was ~7 m3/hr, and with air it was ~6.4 m
3/hr
Alkaline cleans were carried out at 30-35°C
5.1 Clay/Organics/Biofilm fouled membrane
The cleaning tests were carried out on a membrane fouled with clays, organics and biofilm. The
membrane was a Hydranautics ESPA2-LD Brackish Water model with a standard permeate flux of 43
lm2h and salt rejection of 99.6%.
Cleaner D is an existing alkaline powder cleaning product containing a mix of detergents, surfactant and
chelating agents. Preliminary tests on the pilot plant show improved cleaning performance when using
air as shown by the example below. Additional test results will be presented in a separate paper when
available.
+11% Without air With air
NO AIR

The International Desalination Association (IDA)
World Congress on Desalination and Water Reuse
REF: IDAWC/TIAN13-225
-- 16 --
Table 5: Cleaning Programs for Clay/Organic/Biofouled membrane
Tests Clay/Organic/Biofouled membrane:
1a Fouled membrane flux and salt rejection before clean
1b Performance after clean with Cleaner D for 4 hours, pH 12 @ temperature 30-35 ºC
2a Fouled membrane flux and salt rejection before clean
2b Performance after clean with Cleaner D + air for 4 hours, pH 12 @ temperature 30-35 °C
Table 6: Results for Clay/Organic/Biofouled membrane
Test
1500 ppm
NaCl Flux
(l/m2h)
% Flux
Change
% Salt
Rejection
ΔP
(bar)
%
Recovery
Test 1: Fouled membrane (without air)
1a) Before Clean 16.4 - 99.1% 2.3 3.9
1b) After 4hr clean with 1%
Cleaner D, pH 12 30.8 +88% 99.3% 0.2 13.1
Test 2: Fouled membrane + air
2a) Before Clean 16.4 - 99.3% 1.9 3.9
2b) After 4hr clean with 1%
Cleaner D + Air, pH 12 34.9 +113% 99.4% 0.5 7.5
VI. CONCLUSION
6.1 Clay/Al-Silicates/Iron fouled membrane
With this particular membrane, fouling has not had significant impact on the salt rejection. Cleaning
increases salt rejection from around 96% to 98%. Though cleaning has a much greater impact on
permeate flux.
Graph 1 shows that the clean performed using commodity chemicals; NaOH followed by Citric gave
only a small increase in flux (+1%), but a fairly significant increase in the turbidity of the cleaning
solution (4 → 19 NTU). Cleaning with air gives a greater increase in flux and salt rejection compared to
using commodity chemicals alone. A clean with NaOH gives a flux increase of 17% with air (test 2b
table 2), compared to 4% without air (test 1b table 2). Although flux increases were a lot lower than with
using the specially formulated cleaning products A and B. Cleaning pictures also show that less foulant
was removed (Figure 3 compared to Figure 4).
A greater flux increase was seen after a clean with specially formulated Cleaner A followed by Cleaner
B, (which are powder products). The flux increases by 29% (test 3c table 2) without air, and the
turbidity of the cleaning solution increases dramatically from 1 → 112 NTU. However with air, the flux
increases by 52% (test 4c table 2), almost twice as much (Graph 1). The greater increase in flux with air
may indicate that some other (eg. Less coloured like organic) foulant was also removed as well as the
coloured clay and iron foulants.
The International Desalination Association (IDA)
World Congress on Desalination and Water Reuse
REF: IDAWC/TIAN13-225
-- 17 --
These results show that for this particular membrane/foulant, the specially formulated cleaning
chemicals restore membrane performance to a greater extent than commodity chemicals. Visual
inspection of the membrane coupons emphasizes the radical effects of cleaning (Figure 4 compared to
Figure 3).
The micrographs produced using SEM show that the membrane surface appears very similar after
cleaning with specialty cleaners both with and without air. However, micrograph 2 shows an improved
appearance after cleaning compared to the fouled membrane (micrograph 1). The analytical data shows
that the specially formulated cleaners in combination with air removes more aluminium silicates (clay)
and iron deposits from the membrane surface compared to just using cleaning chemicals alone (Graph
3). In fact, there is a greater decrease in fouling components percentage with air than without air,
indicating a better performance of cleaning procedure. The percentage of sulphur detected is greater
after cleaning with air, which indicates that the electron beam used in the analysis has penetrated the
polysulphone layer. This therefore indicates that the foulant thickness has been reduced.
It can be observed that the IR sample spectra for the clean with air (red line spectrum 2) shows all the
characteristic absorption bands of a polyamide-polysulphone membrane, which are not observed on the
fouled membrane (spectrum 1). Fouling bands (mainly at 1010cm-1
) decrease which verifies that there is
not a relevant presence of foulant on the surface after cleaning with air. Absorption bands for the clean
performed with air (blue line spectrum 2) are most characteristic of the bands for a blank membrane, as
compared to those for the clean performed with no air (red line spectrum 2). Therefore more foulant is
removed cleaning with air. The differences in results both with and without air are not drastic because
the cleaners themselves work very well alone.
6.2 Calcium Carbonate fouled membrane
With this particular fouled membrane, both the flux and salt rejection are below the standard membrane
manufacturer guidelines for operation (45 lm2h and 99%). In all cases, cleaning profoundly increases the
flux by 11-60%, but salt rejection is only restored to around 90%. This could mean that the membrane
surface has been damaged, allowing more salts/ions to pass through the membrane.
Cleaner C is an existing acidic liquid cleaner. Two successive cleans with Cleaner C with no air gives a
flux increase of 11% (test 3c table 4). Results show that cleaning with air gives a greater increase in flux
and salt rejection compared to cleaning without air. Two successive cleans with Cleaner C plus air gave
a flux increase of 37%, compared to 11% without air (Graph 2).
However, two cleans using the specially formulated Cleaner B, which is a powder product, gives a much
superior flux increase of 60% (test 1c table 4), with a larger change in the turbidity of the cleaning
solution (1 → 9 NTU). The clean performed using Cleaner B in combination with air restores membrane
performance to roughly the same extent (54% flux increase with air compared to 60% flux increase
without air). Although there is a slightly greater increase in flux without air, the turbidity does not
increase by much more than with air because the foulant removed is readily soluble in the cleaning
solution, so the solution does not become very turbid. However, visually the membrane coupon looks
much cleaner with Cleaner B and air (Figure 5) than without air. Overall, Cleaner B gave a greater
increase in both flux and turbidity both with and without air, compared to Cleaner C with and without
air. This shows that the specially formulated Cleaner B has removed more foulant from the membrane
surface than Cleaner C.
The International Desalination Association (IDA)
World Congress on Desalination and Water Reuse
REF: IDAWC/TIAN13-225
-- 18 --
The SEM results show a heterogeneous covering of foulant on the membrane surface. Visual inspection
reveals that more deposits have been removed from the membrane surface after cleaning with Cleaner B
and air (micrograph 4), as compared to Cleaner B alone (micrograph 3). A 24% sulphur increase is
observed after cleaning with air, whereas cleaning without air gives only a 1% suphur increase. This is
encouraging as it shows that more of the polysulphone layer is being detected, which means that there
must be less foulant on the membrane surface.
The IR spectra for the CaCO3 membrane cleaned with air and without air show no relevant differences,
and both appear characteristic to the blank. Results show that air has a more profound effect when used
in combination with alkaline cleaning products in the removal of composite fouling, as compared to
using acidic cleaners to remove scales.
6.3 Clay/Organic/Biofouled membrane
With this particular membrane, salt rejection was very high even though the membrane appeared heavily
fouled, but permeate flux was low. Cleaning increases salt rejection slightly, but has a much greater
impact on permeate flux.
Cleaner D is an existing powder alkaline cleaner. A 4hr clean with Cleaner D with no air gives a flux
increase of 88% (test 1b table 6), which itself is quite impressive. However, results show that the same
clean performed with air gave a much greater increase in flux of 113% (test 2b, table 6).
6.4 Summary
Cleaning using specially formulated cleaning chemicals in combination with micro-bubbles
improves overall membrane performance
Cleaning with specially formulated cleaning chemicals increases membrane performance to a greater
magnitude than with existing cleaning chemicals
Cleaning with micro-bubbles and specialty cleaners restores membrane performance to a greater
extent than with air and commodity cleaning chemicals
Cleaning with commodity chemicals and air improves membrane performance compared just
commodity chemicals alone
Overall membrane appearance is improved after cleaning
Autopsy results show that membranes do not show any signs of damage after cleaning
VII. REFERENCES
1. J. Q. T. C. Verberk, ‘Application of air in membrane filtration’, 2005.
2. A. C. M. Franken, ‘Prevention and control of membrane fouling: practical implications and
examining recent innovations’, Membraan Applicatie Centrum Twente b.v., June 2009.
3. P. Staveren and R. Berg, ‘Air/water cleaning to control membrane fouling on Reverse Osmosis
(RO) membranes’, http://www.aquafit4use.eu Accessed 17/09/12.
4. http://www.lenntech.com/membrane-cleaning.htm Accessed 17/09/12.
5. E.R. Cornelissen, L. Rebour, D. van der Kooij and L. P. Wessels, ‘Optimization of air/water
cleaning (AWC) in spiral wound elements’, Desalination, 236, 2009, 266–272.