Air blast attenuation by combining microphone and … · Air blast attenuation in data processing...
15
Air blast attenuation in data processing CREWES Research Report — Volume 20 (2008) 1 Air blast attenuation by combining microphone and geophone signals in the time-frequency domain Alejandro D. Alcudia and Robert R. Stewart ABSTRACT Microphone data have been recorded during land seismic operations to give air pressure measurements in proximity to the geophones. Air pressure and seismic data can be combined to attenuate air-related noise from seismic records. We have developed a combination method in the time-frequency domain with the aid of the Gabor transform, a type of localized Fourier transform. The basic idea behind this method is that a nonstationary filter can be designed in the time-frequency domain, provided that a signal can be reconstructed from a modified version of its time-frequency decomposition. A “mask” function is constructed from the microphone Gabor spectrum by thresholding its Gabor coefficients. Then, multiplying the geophone Gabor spectrum with the “mask” function achieves a deterministic cancellation of the associated air pressure component in the seismic signal. In our experiments, the largest noise signal measured with the microphones is the air blast. Therefore, at this point of the research the Gabor transform method is largely restricted to air blast attenuation. We have successfully applied this methodology to a number of common shot gathers from the Pikes Peak heavy oilfield and Priddis high-resolution near-surface surveys. INTRODUCTION In exploration seismology, source-generated noise can be troublesome during seismic data processing, especially for data collected during shallow reflection or refraction surveys (Steeples and Miller, 1998). Exploration geophysicists have encountered noise problems for almost any seismic source used at the surface: most sources not only generate vibrations in the form of body waves but also excite surface waves and produce strong air waves. Stewart (1998) proposed a noise-reducing multi-sensor for seismic land operations. It basically consists of a dual-sensor (two-element) instrument having a microphone within the geophone case or in the proximity to the geophone to give air pressure measurements. If sufficient correlation between seismic and air pressure records exists, then a combination of these data may be used to attenuate and reduce air-related noise. A procedure to remove air noise from seismic records by the combination of a microphone with the contaminated geophone signal in the time-frequency domain is presented. In general, the approach depends upon the degrees of correlation and coherence between the pressure signal recorded on the microphone and the ground velocity signal recorded on a geophone output. The algorithm is based on a type of localized Fourier transform and makes use of the similar local spectra characteristics between the reference signal and its associated component in the seismic signal. The main advantage of this approach is that a completely independent air pressure measurement is recorded in the field to provide a reference for the contaminated geophone signal. This reference signal can be used in seismic data processing to estimate and remove the airborne noise from seismic records in several ways. One robust and
Transcript of Air blast attenuation by combining microphone and … · Air blast attenuation in data processing...

Air blast attenuation in data processing
CREWES Research Report — Volume 20 (2008) 1
Air blast attenuation by combining microphone and geophone signals in the time-frequency domain
Alejandro D. Alcudia and Robert R. Stewart
ABSTRACT Microphone data have been recorded during land seismic operations to give air
pressure measurements in proximity to the geophones. Air pressure and seismic data can be combined to attenuate air-related noise from seismic records. We have developed a combination method in the time-frequency domain with the aid of the Gabor transform, a type of localized Fourier transform. The basic idea behind this method is that a nonstationary filter can be designed in the time-frequency domain, provided that a signal can be reconstructed from a modified version of its time-frequency decomposition. A “mask” function is constructed from the microphone Gabor spectrum by thresholding its Gabor coefficients. Then, multiplying the geophone Gabor spectrum with the “mask” function achieves a deterministic cancellation of the associated air pressure component in the seismic signal. In our experiments, the largest noise signal measured with the microphones is the air blast. Therefore, at this point of the research the Gabor transform method is largely restricted to air blast attenuation. We have successfully applied this methodology to a number of common shot gathers from the Pikes Peak heavy oilfield and Priddis high-resolution near-surface surveys.
INTRODUCTION In exploration seismology, source-generated noise can be troublesome during seismic
data processing, especially for data collected during shallow reflection or refraction surveys (Steeples and Miller, 1998). Exploration geophysicists have encountered noise problems for almost any seismic source used at the surface: most sources not only generate vibrations in the form of body waves but also excite surface waves and produce strong air waves. Stewart (1998) proposed a noise-reducing multi-sensor for seismic land operations. It basically consists of a dual-sensor (two-element) instrument having a microphone within the geophone case or in the proximity to the geophone to give air pressure measurements. If sufficient correlation between seismic and air pressure records exists, then a combination of these data may be used to attenuate and reduce air-related noise.
A procedure to remove air noise from seismic records by the combination of a microphone with the contaminated geophone signal in the time-frequency domain is presented. In general, the approach depends upon the degrees of correlation and coherence between the pressure signal recorded on the microphone and the ground velocity signal recorded on a geophone output. The algorithm is based on a type of localized Fourier transform and makes use of the similar local spectra characteristics between the reference signal and its associated component in the seismic signal. The main advantage of this approach is that a completely independent air pressure measurement is recorded in the field to provide a reference for the contaminated geophone signal. This reference signal can be used in seismic data processing to estimate and remove the airborne noise from seismic records in several ways. One robust and

Alcudia and Stewart
2 CREWES Research Report — Volume 20 (2008)
deterministic way is given by designing a filter in the time-frequency domain with the aid of the Gabor transform.
This paper is organized as follows: first, we review the fundamentals of time-frequency analysis with a particular emphasis on the Gabor transform and its application to nonstationary filter design. Second, we introduce the proposed algorithm for air-noise attenuation in the Gabor domain with graphic examples of how it operates. Third, we apply the proposed algorithm to a couple of common shot gathers from two different multicomponent surveys in the Western Canada Sedimentary Basin (WCSB). Other methods in the time domain may be designed via Wiener filter theory and Least-Squares adaptive filters. These methods are briefly discussed in Appendices A and B, respectively.
TIME-FREQUENCY ANALYSIS Most real world signals, representing the evolution of a physical process over a finite
period of time, are of finite energy and nonstationary. Seismic signals and biomedical signals are good examples. In a nonstationary physical process, the amplitude and frequency content of the signal describing the process evolves over time. The amplitude variations of a signal are conveniently represented in the time domain but only limited information about how often these variations occur and change over time (i.e., frequency) can be obtained. Engineers and scientists make use of a signal representation in the frequency domain to identify the rate of change in amplitude, analyze systems and design filters. This has been traditionally accomplished by means of the Fourier transform. The Fourier transform decomposes a signal as the sum of weighted sinusoidal functions extending from negative infinity to positive infinity in time (Qian and Chen, 1999). The Fourier representation describes which frequencies are present in the original signal by a simple interpretation of pure tones and overtones (i.e., second-order harmonics) in a plane of frequency versus weights (i.e., the magnitude of Fourier coefficients). However, the Fourier transform is not always the most helpful tool to analyze real-world signals because the power spectrum (i.e., the square of the Fourier transform) does not reveal how the frequency content evolves over time. Let’s consider the example below.
Figure 1 depicts the Fourier transform and the Gabor transform of a microphone output recorded close to a Vibroseis source. It is the uncorrelated pressure signal that represents the sound pressure variations emitted by the Vibroseis system as the seismic energy is being exerted into the ground. As stated above, from the time waveform very little information can be deducted about the frequency content and how it changes over the 20 s record length. For example, this particular signal has three lobes that produce notches in the frequency content as depicted in the amplitude spectrum, but we cannot establish the correspondence of a particular frequency notch to a particular lobe in time. In other words, we are able to identify the frequency tones and overtones but cannot determine how they change over time. By analyzing the signal in time and frequency jointly, through the Gabor transform, not only can we see how the frequencies change but we also can see the intensity of the frequency components by the relative brightness levels. The Gabor spectrum reveals the nonlinearity of the Vibroseis sweep and the linearity of other events such as the 60 Hz power-line noise and its higher harmonics.

Air blast attenuation in data processing
CREWES Research Report — Volume 20 (2008) 3
FIG. 1. Fourier and Gabor transforms of an uncorrelated Vibroseis signal recorded with a microphone. The lower right is the signal of interest represented in the time domain. Signal representations are achieved using the Fourier transform for the frequency domain representation (upper left) and the Gabor transform for the joint time-frequency domain representation (upper right).
NONSTATIONARY FILTERS IN THE GABOR DOMAIN The Gabor transform provides a means to measure the local spectral content of a
signal. Essentially, the Gabor transform is a time-frequency method based on the localized version of the Fourier transform. Put another way, for any time instant t the given signal s is multiplied (or modulated) by a Gaussian window of certain width and centered at time t0 and the ordinary Fourier transform of this windowed signal is taken (Lamoureux and Adler, 2004). If a suite of windows positions is used to compute a collection of local spectra, the result is a time-frequency decomposition of the signal (Margrave et al. 2005). According to Margrave et al. (2005), Lamoureux and Adler (2004), Qian and Chen (1999), and others, if a signal can be reconstructed from a time-frequency decomposition, then a nonstationary filter can be designed by modifying the decomposition first. This is the fundamental idea behind our method for air blast attenuation.
One simple but non-automatic way to design a nonstationary filter is by interactive picking with a computer mouse. This “on the fly” design is an effective way to identify regions in the Gabor domain that should be selectively filtered (Lamoureux and Adler, 2004). However, a semi-automatic design can be achieved by constructing a “mask” function from a reference signal.
The Gabor transform cannot achieve arbitrarily fine resolution in the time and frequency domain simultaneously due to the limitations imposed by the uncertainty principle (Qian and Chen , 1999). However, it is the Gaussian function that achieves the optimal time-frequency decomposition because the product of its time and frequency is

Alcudia and Stewart
4 CREWES Research Report — Volume 20 (2008)
minimal. In other words, the smoothness of the Gaussian window function guarantees fast decay of the frequency components of the window.
The discrete Gabor transform implementation of Margrave et al. (2005) is used in this paper. It is a discrete approximation that is based on a convenient summation property of Gaussians. However, if n windows are required and the trace is of length N, then the computation effort is proportional to nNlog2N. When using Gaussian windows, each windowed trace segment is as long as the original trace. A Gabor transform pair is available in the CREWES MATLAB Toolbox. A complete overview of this implementation and applications to seismic data deconvolution can be found in Margrave et al. (2005)
METHOD OF AIR BLAST ATTENUATION IN THE GABOR DOMAIN Gabor filtering is implemented by multiplying the Gabor spectrum or coefficients by a
“mask” or “filter” function. This observation suggests that we can use a mask to filter out the desired Gabor coefficients from the noise background or the undesired Gabor coefficients from the signal space, and then reconstruct the time waveform via the Gabor expansion (i.e., the inverse Gabor transform).
We have developed a simple method for air blast attenuation in the Gabor domain. The procedure in as follow:
• Compute the Gabor transform of microphone and geophone raw signals and take the magnitude of the Gabor coefficients
• Find the maximum Gabor coefficient (maxGC) in the microphone Gabor spectrum
• Set a threshold equal to maxGC/n, where n is an integer between 1 and 10. This parameter determines the size of the region in the Gabor spectrum that will be filtered out
• Find all indices (coefficients) in the microphone Gabor spectrum matrix that exceed the threshold and substitute their values with the minimum Gabor coefficient found in the geophone spectrum. Make all coefficients below the threshold equal to one. This modified microphone spectrum is called a “mask” filter.
• Multiply the geophone Gabor spectrum with the “mask” filter.
• Compute inverse Gabor transform of the filtered geophone spectrum.
• Repeat the procedure for next trace in common shot gather.

Air blast attenuation in data processing
CREWES Research Report — Volume 20 (2008) 5
FIG. 2. Step by step schematic of the air blast attenuation method by combination of microphone and geophone signals in the time-frequency domain (Gabor domain).
FIELD DATA EXAMPLES Two 3C-2D seismic surveys were conducted by the CREWES Project in the Western
Canada Sedimentary Basin (WCSB). The first at the Pikes Peak heavy oilfield located in Saskatchewan, Canada and the second at the Rothney Astrophysical Observatory located in Priddis, Alberta, Canada. Both surveys included experimental microphone recordings and production multicomponent data acquisition with the ARAM Aries™ recording system. To our knowledge, these experiments are the first of its kind ever undertaken in a production basis during seismic data acquisition. Other authors have reported similar air pressure - seismic measurements with a few microphones positioned at two or three geophone locations and not during a seismic survey (e.g., Brook et al., 1989; Sallas and Brook, 1989; Albert, 1993). However, Sallas and Moerig (2008) have patented a similar method for deterministic cancellation of air-coupled noise. Their method uses a speaker system in conjunction with a surface seismic source to determine a transfer function between the microphones, placed near the seismic spread, and the geophones. The transfer function is then used to filter out the airborne noise from the seismic records. Our method is different is that we use one microphone per receiver station and there is no need for a speaker system. In our method, the transfer function is determined implicitly by time-frequency decomposition of the microphone and geophones signals.
3C-2D survey at Pikes Peak heavy oilfield The seismic survey consisted of a 3.8 km seismic line, Vibroseis sources,
conventional geophone arrays, microphone prototypes and single 3-C geophones. The microphones were co-located with the 3C geophones every 20 m in the same augured holes. A detailed description of this survey can be found in Hoffe et al. (2000).

Alcudia and Stewart
6 CREWES Research Report — Volume 20 (2008)
3C-2D high-resolution near-surface survey at Priddis The 3C-2D high-resolution near-surface survey was undertaken at the Rothney
Astrophysical Observatory near Priddis, Alberta during the winter of 2008. The site is a rural area about 26 km southwest of downtown Calgary. The aim of the experiment was to acquire a unique dataset to test a 3C land streamer manufactured by Geostuff Inc. and CREWES. Our goal was to compare its shot records and processing results to those of a 200 m multicomponent seismic profile at 1 m spacing. We also deployed 32 of our microphones at 5 m spacing to span 155 m of the multicomponent line. In this paper, however, we only make use of the conventional 3C and microphone data. The shallow seismic profile consisted of 200 SM-24 3C coil geophones (10 Hz) manufactured by I/O Sensor. A small 15 cm deep by 6 cm wide hole was drilled for each geophone using a gas-powered handheld auger. Each microphone was powered by a 9V PP3 battery (square) and connected to a line cable with eight take outs. Four extra Remote Acquisition Units (RAM’s) were employed to support 32 microphones in total. The source was an environmental 18,000 lb Vibroseis (IVI EnviroVibe) manufactured by Industrial Vehicles International. Four sweeps were performed at each source location to increase the SNR. The radial component was oriented east-west (in-line with the source-receiver azimuth) and the transverse component north-south (cross-line with the source-receiver azimuth).
Data analysis and pre-processing Data analysis required the decimation of vertical component seismic data to match the
microphone data spacing. That was the case for both experiments since they were also designed for other purposes. Although microphone data interpolation was a viable option, we decided to keep it as simple as possible.
The first step in our analysis was to investigate the degree of correlation and dependency between the microphone and geophone data. The ordinary coherence function (or coherence squared) is a measure of the linear dependence between two signals as a function of frequency f (Douze and Sorrels 1975). Its mathematical definition is given by the equation
( ) ( ) ( )( ) ( )
( )( ) ( )ff
ffffffC
GGMM
MG
GGMM
GMMG
ϕϕϕ
ϕϕϕϕ
⋅=
⋅⋅=
22 (1),
where MGϕ is the cross-power spectrum between the microphone signal (i.e., the excitation signal) and the geophone signal (i.e., the response signal), and MMϕ and GGϕ are auto-power spectra of the microphone and geophone, respectively. The coherence function is a real-valued dimensionless function since the numerator is the magnitude squared of the cross-power spectrum and the denominator is the product of the auto-power spectra of the two signals. The range of values of the coherence function is limited to values between 0 and 1. Coherence values close to one mean higher correlation (strong linear relationship), whereas coherence values close to zero mean poor correlation at a particular frequency.

Air blast attenuation in data processing
CREWES Research Report — Volume 20 (2008) 7
FIG. 3. Location map of the Rothney Astrophysical Observatory at Priddis (from Google maps).
FIG. 4. CREWES students and staff provided a valuable help in the field. A small 15 cm deep by 6 cm wide hole was drilled for each geophone using a gas-powered handheld auger. Each microphone was placed besides a geophone every 5 m. An IVI EnviroVibe was used as the seismic source at 5 m spacing within the spread and 10 m for long offsets (Photos by Gabriela Suarez and first author).

Alcudia and Stewart
8 CREWES Research Report — Volume 20 (2008)
FIG. 6. Acquisition layout at Priddis survey (top). Common shot gather of microphone (bottom left) and vertical component (bottom right) seismic data. A 250 ms AGC has been applied to these data for display purposes only. Note that the airwave is a high-frequency coherent noise. A simple high-cut filter would attenuate the airwave. However, for shallow seismic surveys, high frequencies are very valuable to resolve shallow reflectors. Very good waveform consistency was observed in the microphone data with a few bad channels.
Figure 7 shows two coherence functions computed from the signals recorded at two different receiver stations in the Priddis survey. For frequencies between 110 and 250 Hz, the coherence function is close to 1 due to the direct air blast striking the geophones. This is evident from the time domain waveforms as well. A rapid and effective method to suppress this noise would be a high-cut filter with corner frequency at 110 Hz. However, for shallow surveys we are forced to preserve high frequencies to resolve shallow reflectors. At frequencies between 25 and 50 Hz, there is less relationship between the microphone and geophone outputs. For frequencies below 25 Hz the coherence values differ from station to station. For example, the coherence function for the first geophone and microphone pair in Figure 7 (left) shows strong linear relationship at low and high frequencies, but the second pair (right) shows strong linear relationship at high frequencies with moderate relationship at low frequencies. The large coherence values at low frequencies would suggest that the microphones recorded some of the low-frequency noise in the geophones. However, as shown in Figure 8, our microphone prototype

Air blast attenuation in data processing
CREWES Research Report — Volume 20 (2008) 9
frequency response is reliable from about 30 Hz and above. Coherence results for frequencies below 30 Hz are not reliable. For further details about a field comparison of our prototypes to other microphones, please refer to Alcudia et al. in this Research Volume.
FIG. 7. Coherence functions computed for two pairs of geophone and microphone signals. The large coherence values at low frequencies would suggest that the microphones recorded some of the low-frequency noise in the geophones. However, as shown in Figure 8 below, our microphone prototype frequency response is reliable from about 30 Hz and above. Coherence results for frequencies below 30 Hz are not reliable.
FIG. 8. Amplitude spectra average of microphone data from a field comparison test. A 5-260 Hz band-pass filter was applied to uncorrelated data. Note that all microphone responses (including a calibrated microphone) have a frequency notch at about 30 Hz. Power-line noise at 60 Hz introduced a spike in all microphone responses. Also note that high frequencies correspond to times where the sound coming from the vibrator system is very loud. Microphone responses are very similar from about 30 Hz to 260 Hz (filter cut-off frequency).

Alcudia and Stewart
10 CREWES Research Report — Volume 20 (2008)
Results This method of air blast attenuation by combining microphone and geophone signals
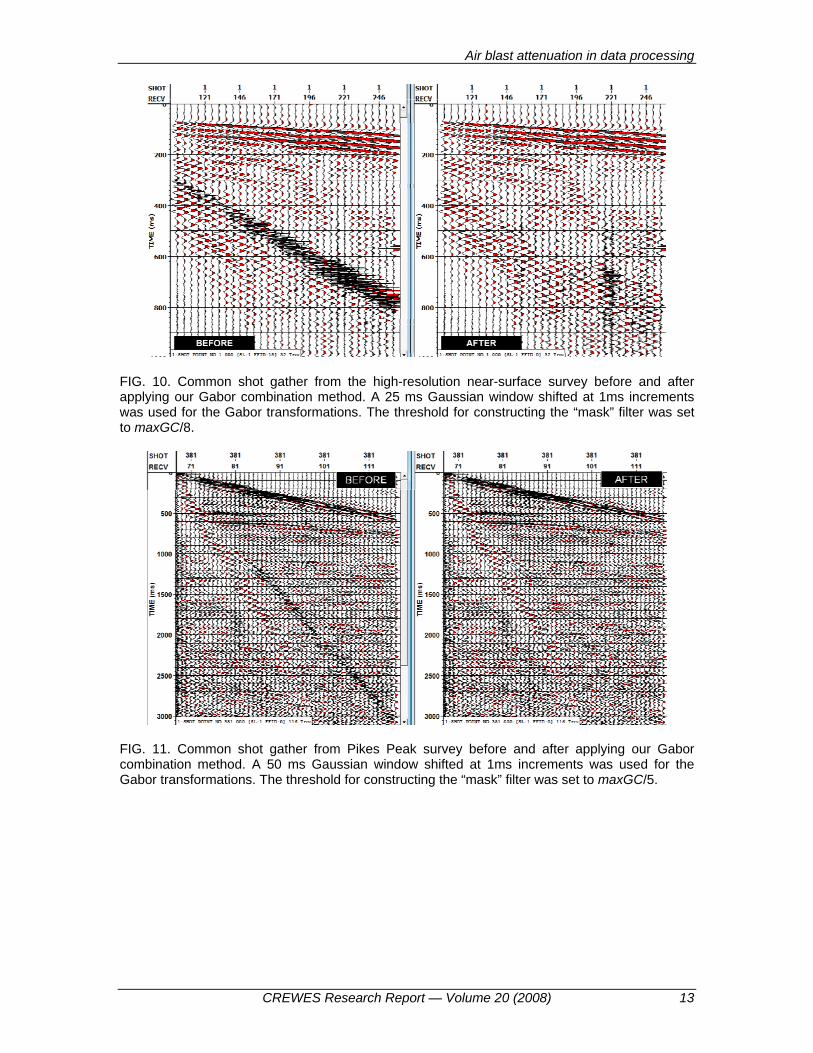
in the time-frequency domain was implemented using MATLAB. Two examples of air blast attenuation from different surveys are presented. The shot gather on top of Figure 9 is the vertical array data from Pikes Peak before applying signal combination. An automatic envelope correction (amplitude correction) was applied for display purposes only. The shot gather at the bottom of Figure 9 is a filtered version of these data. A 50 ms windows and 1 ms time-shift were selected for this example after some testing was performed. The threshold of the microphone Gabor coefficients was set to maxGC/5, which defined a sufficient “mask” area. Note that the airwave has been cancelled to a large extent while preserving the frequency content of other seismic events. An exception occurred at about 0.6 s in trace 105 because the microphone trace at this station was bad. These results were exported to VISTA processing for a better color display (see Figure 11).
Figure 10 is an example from the high-resolution survey conducted at the Rothney Astrophysical Observatory. The vertical component data was decimated to match the microphone spacing (5 m). Traces 257-301 are not shown because the microphones covered 155 m of line only. The Vibroseis shot point was located about 100 m west of receiver station 101. Therefore, the air blast arrival was at about 300 ms (for a speed of sound in air of 333 m/s). A 25 ms window and 1 ms time-shift were selected for the Gabor transformations. A threshold of maxGC/8 was used to construct the “mask” function. Note that the air blast has been attenuated while preserving the frequency content of other seismic events, as in the Pikes Peak example. The “mask” filter in the Gabor combination method failed to attenuate the air blast in traces 216 and 221 because the acoustic waterfront in the air was reflected by the recording truck at these locations.
CONCLUSIONS Microphone output signals can be measured and used for air-noise attenuation in
seismic records. A robust method for air blast attenuation has been developed in the Gabor domain, which combines microphone and geophone data. The procedure is semi-automatic in the sense that users need to specify three parameters only: the Gaussian window width and its time-shift increment, and a threshold.
Ideally, the suppression or attenuation of any manifestation of air-noise is desirable (e.g., air blast, winds, helicopter noise, etc.). In our experiments, the most signal noise measured with the microphones is the air blast. Therefore, at this point of the research the Gabor transform method is largely restricted to air blast attenuation.
FUTURE WORK
• Investigate the dynamic range properties of the microphones for air noise recording.
• Improve the “mask” function by generating a smooth attenuation function. This can be achieved by taking the inverse of the microphone Gabor spectrum.

Air blast attenuation in data processing
CREWES Research Report — Volume 20 (2008) 11
However, by inverting the Gabor spectrum we face numerical instability. More work has to be done in this matter.
• Reduce computation times with improved code efficiency. This will allow us to reprocess seismic data using this technology and compare brute stacks to those achieved by conventional processing.
ACKNOWLEDGEMENTS We thank Mr. Henry Bland and Mr. Malcolm Bertram who designed and tested our
microphone prototypes. We extend a special acknowledgement to Dr. Gary Margrave for his Gabor transform codes and other useful signal processing routines included in the CREWES MATLAB Toolbox. Finally, we thank the CREWES Project sponsors and staff for their continuing support.
REFERENCES Brook, R.A., Crews, G.A. and Sallas, J.J., 1989, Experimental analysis of the vibrator air wave: 59th Ann.
Internat. Mtg., Soc. Expl. Geophys., Expanded Abstracts, 683-685. Douze, E.J. and Sorrells, G.G., 1975, Prediction of pressure-generated earth motion using optimum filters:
Bulletin of the Seismological Society of America, 65, 3, 637-650. Hoffe. B.H., Bertram, M.B., Bland, H.C., Gallant, E.V., Lines, L.R., and Mewhort, L.E., 2000, Acquisition
and processing of the Pikes Peak 3C-2D seismic survey: CREWES Research Report, 12. Lamoureux, M.P. and Adler, D.H., 2004, Nonstationary image processing via Gabor transforms: CREWES
Research Report, 16. Margrave, G.F., Gibson, P.C., Grossman, J.P., Henley, D.C., Illiescu, V., and Lamoureux, M.P., 2005, The
Gabor transform, pseudodifferential operators, and seismic deconvolution: Integrated Computer-Aided Engineering, 12, 43-55.
Qian, S. and Chen, D., 1999, Joint time-frequency analysis: IEEE Signal Processing Magazine, 16, 2, 52-67.
Sallas, J.J. and Brook, R.A., 1989, Air-coupled noise produced by a seismic P-wave vibrator: 59th Ann. Internat. Mtg., Soc. Expl. Geophys., Expanded Abstracts, 686-689.
Sallas, J.J and Moerig, R., 2002, Deterministic cancellation of air-coupled noise produced by surface seismic sources: US Patent 6381544
Steeples, D.W. and Miller, R.D., 1998, Avoiding pitfalls in shallow reflection surveys: Geophysics, 63, 1213-1224.
Stewart, R.R., 1998, Air-noise reduction on geophone data using microphone records: CREWES Research Report, 10.

Alcudia and Stewart
12 CREWES Research Report — Volume 20 (2008)
FIG. 9. The Gabor method was implemented using MATLAB. This is an example from the Pikes Peak dataset. A 50 ms window and 1 ms time-shift was used for this shot gather. Note that the airwave has been attenuated while preserving the frequency content of other seismic events. An exception occurred about 0.6 s in trace 105 because the microphone trace recorded at this station was bad.
Air blast attenuation in data processing
CREWES Research Report — Volume 20 (2008) 13
FIG. 10. Common shot gather from the high-resolution near-surface survey before and after applying our Gabor combination method. A 25 ms Gaussian window shifted at 1ms increments was used for the Gabor transformations. The threshold for constructing the “mask” filter was set to maxGC/8.
FIG. 11. Common shot gather from Pikes Peak survey before and after applying our Gabor combination method. A 50 ms Gaussian window shifted at 1ms increments was used for the Gabor transformations. The threshold for constructing the “mask” filter was set to maxGC/5.
Alcudia and Stewart
14 CREWES Research Report — Volume 20 (2008)
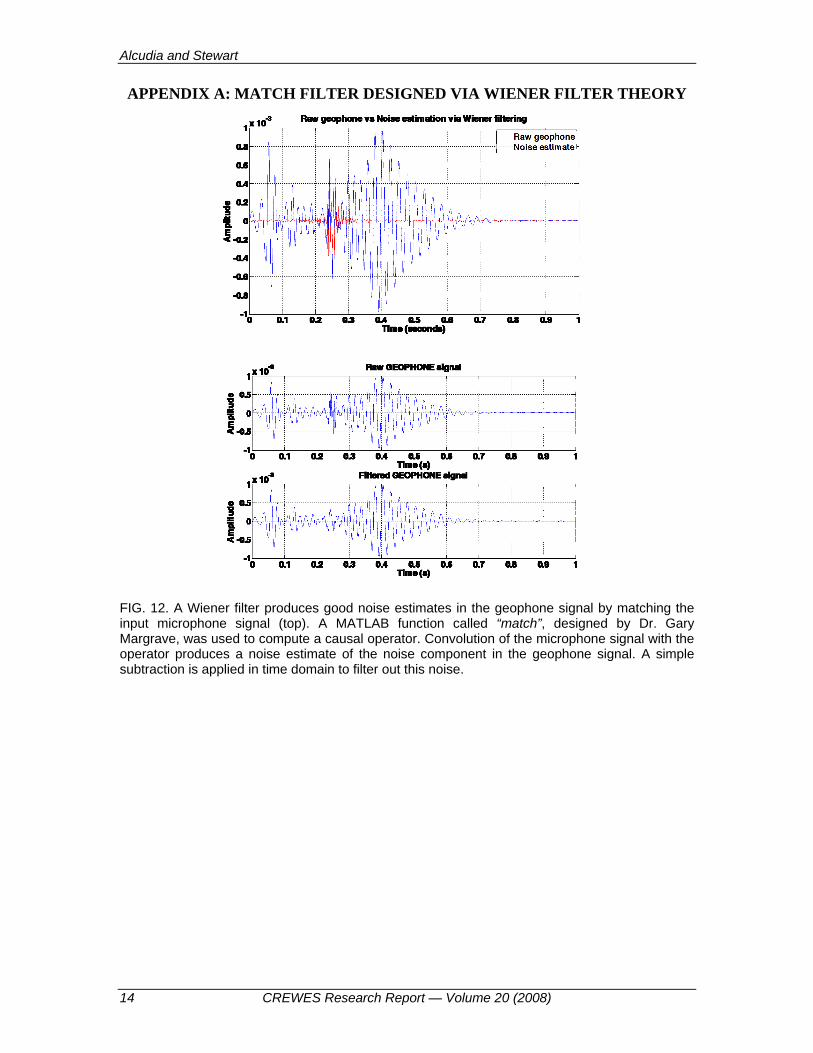
APPENDIX A: MATCH FILTER DESIGNED VIA WIENER FILTER THEORY
FIG. 12. A Wiener filter produces good noise estimates in the geophone signal by matching the input microphone signal (top). A MATLAB function called “match”, designed by Dr. Gary Margrave, was used to compute a causal operator. Convolution of the microphone signal with the operator produces a noise estimate of the noise component in the geophone signal. A simple subtraction is applied in time domain to filter out this noise.
Air blast attenuation in data processing
CREWES Research Report — Volume 20 (2008) 15
APPENDIX B: MATCH FILTER DESIGNED VIA LEAST-SQUARES ADAPTIVE FILTER
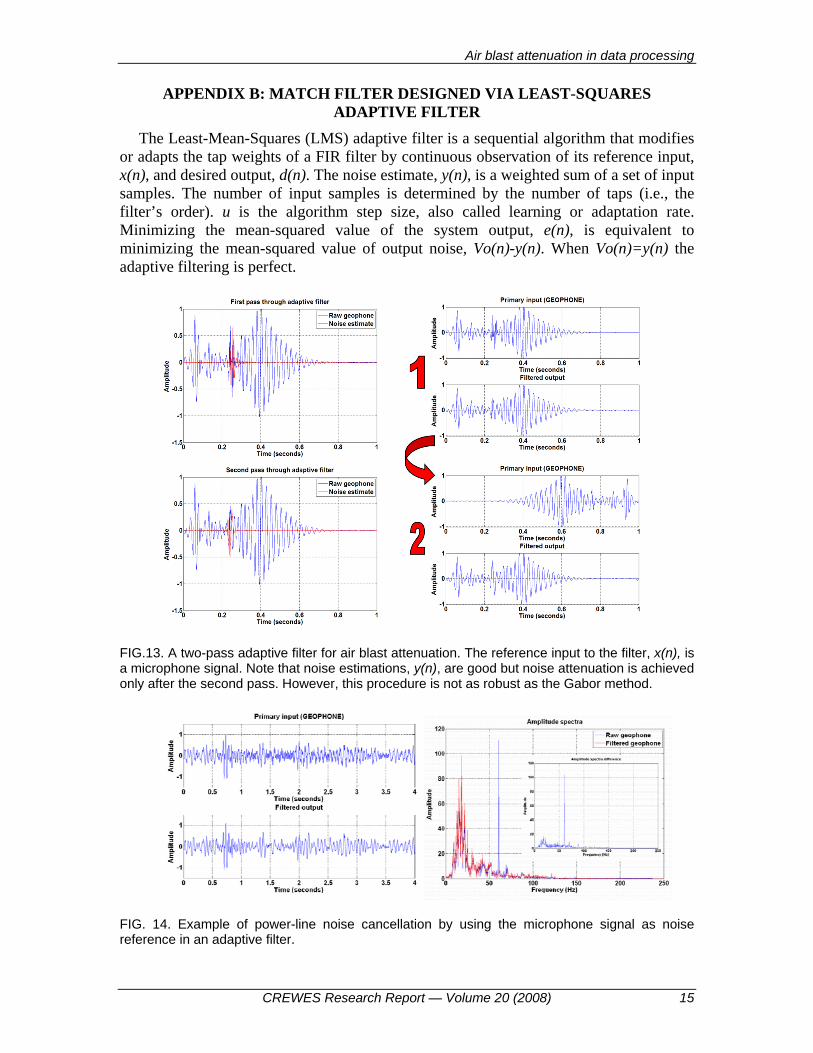
The Least-Mean-Squares (LMS) adaptive filter is a sequential algorithm that modifies or adapts the tap weights of a FIR filter by continuous observation of its reference input, x(n), and desired output, d(n). The noise estimate, y(n), is a weighted sum of a set of input samples. The number of input samples is determined by the number of taps (i.e., the filter’s order). u is the algorithm step size, also called learning or adaptation rate. Minimizing the mean-squared value of the system output, e(n), is equivalent to minimizing the mean-squared value of output noise, Vo(n)-y(n). When Vo(n)=y(n) the adaptive filtering is perfect.
FIG.13. A two-pass adaptive filter for air blast attenuation. The reference input to the filter, x(n), is a microphone signal. Note that noise estimations, y(n), are good but noise attenuation is achieved only after the second pass. However, this procedure is not as robust as the Gabor method.
FIG. 14. Example of power-line noise cancellation by using the microphone signal as noise reference in an adaptive filter.