Aims and Scope of the thesis -...
256
The use of liquid chromatography mass spectrometry for the absolute quantitation of bio-analytes: from small molecular mass compounds towards larger molecular mass proteins by means of marker-peptides Michael Storme Promoter: Prof. Dr. Apr. J. Van Bocxlaer Thesis submitted in fulfilment of the requirements for the degree of Doctor in Pharmaceutical Sciences 2008 Faculty of Pharmaceutical Sciences Department of Bio-Analysis Laboratory of Medical Biochemistry and Clinical Analysis
-
Upload
truongnhan -
Category
Documents
-
view
228 -
download
0
Transcript of Aims and Scope of the thesis -...

The use of liquid chromatography mass spectrometry for the absolute quantitation of bio-analytes:
from small molecular mass compounds towards larger molecular mass proteins by means of marker-peptides
Michael Storme
Promoter: Prof. Dr. Apr. J. Van Bocxlaer
Thesis submitted in fulfilment of the requirements for the degree of Doctor in Pharmaceutical Sciences
2008
Faculty of Pharmaceutical Sciences Department of Bio-Analysis
Laboratory of Medical Biochemistry and Clinical Analysis

Front cover image extracted from www.aob.com


The author and promoter give the permission to make this thesis available for consultation and
allow the copying of any part of the manuscript for personal use. Any other use is subjected to the
restrictions of authors' rights, in particular in relation to the obligation of explicit mention of the
source when any results are taken from the thesis.
Ghent, april 15th
, 2008
Author, Promotor,
Apr. M. Storme Prof. Dr. Apr. J. Van Bocxlaer

i
Dankwoord
Bij het afsluiten van een levenshoofdstuk komt er vaak wat weemoed kijken en kijk je even terug
naar wat geweest is. De voorbije 4 jaren waren heel intense jaren waar ik niet alleen op
professioneel vlak maar ook op persoonlijk vlak een hele ontwikkeling heb doorgemaakt. Dit
alles was zeker niet mogelijk geweest zonder de specifieke hulp van velen.
Vooreerst wens ik mijn promotor, Prof. Dr. Apr. J. Van Bocxlaer te danken voor de mij geboden
kansen. Doorheen de jaren stond zijn deur altijd open en was hij steeds bereid de meest
uiteenlopende problemen kordaat aan te pakken. Zijn expertise was hierbij niet alleen nuttig om
de juiste wetenschappelijke keuzes te maken of als hulp bij het schrijven van wetenschappelijke
publicaties maar vooral ook als technische bijstand bij de soms weigerende apparatuur.
Ook alle collega’s die doorheen de jaren in het labo vertoefd hebben en allen bij gebracht
hebben tot de toffe werksfeer draag ik mijn hart. Sommigen onder hen heb ik maar kort gekend,
anderen zijn echte vrienden geworden. Elk hebben ze echter bijgedragen tot het ontstaan en
vervolledigen van dit werk. Tineke, An, Reinhilde, Bart, Ruben, Julie, Koen, Sofie, Wim, Nadine,
bedankt!
Ook bedankt aan alle andere vrienden van het FFW. Jullie hebben allen bijgebracht tot een tijd
waarvan ik vermoed dat we als opa zullen zeggen dat het een van de mooiste uit ons leven was.
We hebben samen legendarische duels uitgevochten op de Vlaamse heuvels, vele voetbaloorlogen
gestreden, ...
Ook mijn familie en niet FFW-vrienden wens ik te danken voor de vele steun en mooie momenten
samen.
Tenslotte richt ik mij graag nog even tot Annemiek. Ook wij samen hebben een enorme evolutie
doorgemaakt deze vier jaren en weet dat ik zonder jou nooit zou staan waar ik, of liever wij, nu
staan!

ii
List of abbreviations
AcN Acetonitrile
AP(C)I Atmospheric Pressure (Chemical) Ionization
AUC Area Under the Curve
betaME beta Mercapto Ethanol
CI Chemical Ionization
CE Collision Energy
CE Capillary Electrophoresis
CID Collision Induced Dissociation (fragmentation)
CNBr Cyanogen Bromide
CRM Charged Residue Model
CSF CerebroSpinal Fluid
CTA Cellulose Tri-Acetate
CV(%) Coefficient of Variation (%)
Da Dalton, mass unit
DC Direct Current
DTT DiThioThreitol
EC External Calibration
EI Electron Impact
ELISA Enzyme-Linked ImmunoSorbent Assay
ES External Standard
ESI ElectroSpray Ionization
FA Formic Acid
FAB Fast-Atom Bombardment
FTICR Fourier Transform Ion Cyclotron Resonance
HAP High Abundant Protein(s)
GC Gas Chromatography
GFR Glomerular Filtration Rate
iii
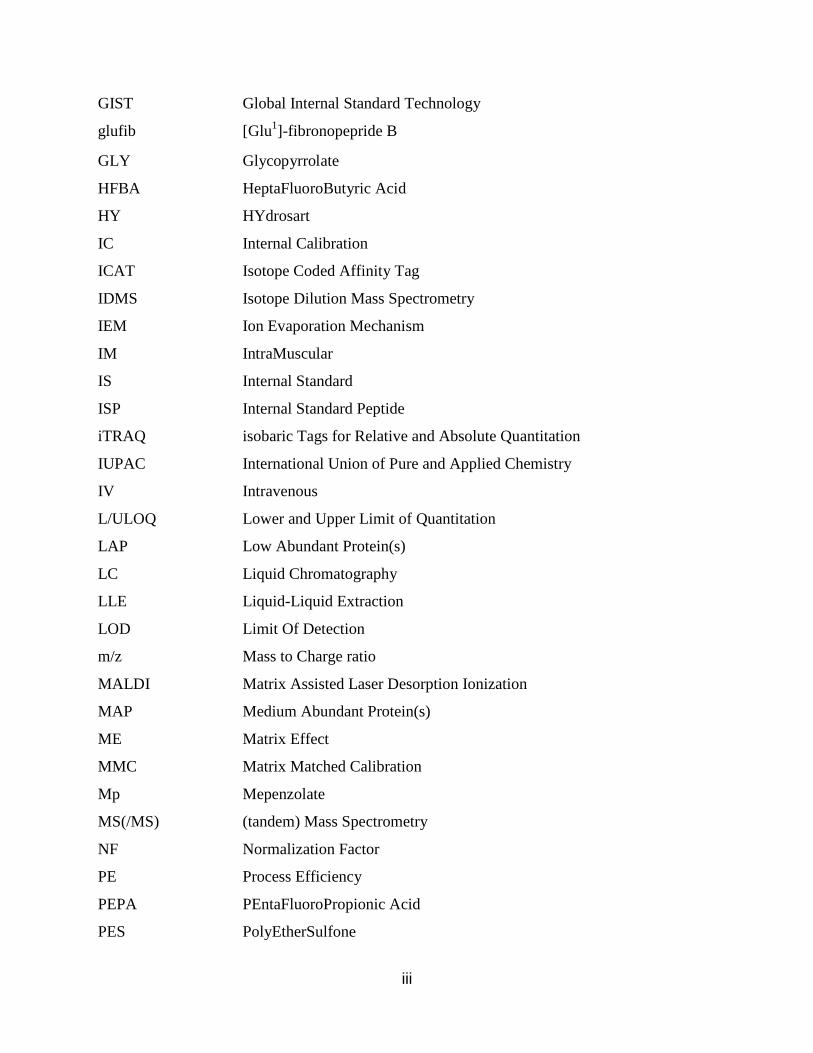
GIST Global Internal Standard Technology
glufib [Glu1
GLY
]-fibronopepride B
Glycopyrrolate
HFBA HeptaFluoroButyric Acid
HY HYdrosart
IC Internal Calibration
ICAT Isotope Coded Affinity Tag
IDMS Isotope Dilution Mass Spectrometry
IEM Ion Evaporation Mechanism
IM IntraMuscular
IS Internal Standard
ISP Internal Standard Peptide
iTRAQ isobaric Tags for Relative and Absolute Quantitation
IUPAC International Union of Pure and Applied Chemistry
IV Intravenous
L/ULOQ Lower and Upper Limit of Quantitation
LAP Low Abundant Protein(s)
LC Liquid Chromatography
LLE Liquid-Liquid Extraction
LOD Limit Of Detection
m/z Mass to Charge ratio
MALDI Matrix Assisted Laser Desorption Ionization
MAP Medium Abundant Protein(s)
ME Matrix Effect
MMC Matrix Matched Calibration
Mp Mepenzolate
MS(/MS) (tandem) Mass Spectrometry
NF Normalization Factor
PE Process Efficiency
PEPA PEntaFluoroPropionic Acid
PES PolyEtherSulfone

iv
PK PharmacoKinetic
Pm Pyrimethamine
PPT Protein PrecipiTation
Q Quadrupole
Q3 Triple-Quadrupole (mass spectrometer)
QA Quaternary Ammonium
QC Quality Control
Q-TOF Quadrupole-Time Of Flight tandem mass spectrometer
R Coefficient of Determination 2
RC Regenerated Cellulose
RE Recovery
RF Radio Frequency
S/MRM Single/Multiple Ion Monitoring
S/N Signal to Noise ratio
SAC Standard Addition Calibration
SD Standard Deviation
SILAC Stable Isotope Labelling by Amino acids in Culture
SIM/R Selective Ion Monitoring/Reaction
Sl Sulfalene (sulfamethoxypyrazine)
SPE Solid-Phase Extraction
Sq Sulfaquinoxaline
TFA TriFluoroacetic Acid
TOF Time Of Flight
T Retention Time r
(US)FDA (United States) Food and Drug Administration
v
Index
Aims and scope of the thesis 1
Mass spectrometry 5 1. Introduction 6
2. Electrospray ionization (ESI) 8
2.1 Definition 8
2.2 Electrospray ionization of peptides and proteins 11
2.2.1 Envelope formation 11
2.2.2 Protein/ peptide fragmentation 12
3. (Tandem) mass spectrometers used in our particular work 14 3.1 Quadrupole (Q) mass spectrometry 14
3.2 Time-of-flight (TOF) mass spectrometry 15
3.3 Tandem mass spectrometers 16
3.3.1 The Q-TOF mass spectrometer 17
3.3.2 The Q3
4. References 19
mass spectrometer 17
Bio-analytical method validation in mass spectrometric
applications 21 1. Introduction 22
2. Full analutical validation 25
2.1 Calibration 25
2.1.1 Multi-standard calibration 25
2.1.2 One and two standard calibration 28
2.1.3 Calibration methodology 29
2.2 Matrix effect in regard to LC-MS(/MS) analysis 32
2.2.1 Absolute versus relative matrix effect 32
2.2.1.1 Absolue matrix effect 32
2.2.1.2 Relative matrix effect 35
2.2.2 The assessment of matrix effect (based in Matuszewski) 36

vi
2.2.2.1 Post extraction addition 36
2.2.2.1.1 Absolute matrix effect 36
2.2.2.1.2 Relative matrix effect 37
2.2.2.2 Post-column infusion 40
2.2.3 How to eliminate matrix effect 43
2.3 Other validation parameters 45
2.3.1 Accuracy 46
2.3.2 Precision 46
2.3.3 Sensitivity 47
2.3.4 Selectivity 47
2.3.5 Recovery 49
2.3.6 Stability 50 3. References 52
Small molecular mass substances 57 Chapter 1: The simultaneous quantitative analysis of the antimalarials pyrimethamine and
sulfamethoxypyrazine in plasma samples 59 1. Introduction 61
2. Experimental 63
2.1 Chemicals 63
2.2 Analytical standards 63
2.3 Sample preparation and extraction 64
2.4 Mobile phases 64
2.5 Liquid chromatography 64
2.6 Mass spectrometry 65 2.7 Calibrators and quality control samples 67
2.8 Validation 67
2.9 Study samples 68
3. Results and discussion 69
3.1 Analytical procedure 69
3.2 Method performance and validation results 71
3.3 Pharmacokinetic application 75
4. Conclusion 76
5. Acknowledgments 77
6. References 77

vii
Chapter 2: The quantitative analysis of the anticholinergic agent glycopyrrolate
in plasma samples 79 1. Introduction 81
2. Experimental 84
2.1 Chemicals 84
2.2 Analytical standards 84
2.3 Calibrators and quality control samples 85
2.4 Sample preparation and extraction 85
2.5 Mobile phases 86
2.6 Liquid chromatography 86
2.7 Mass spectrometry 86
3. Results and discussion 88
3.1 Extraction procedure and its validation 88
3.2 Chromatographic performance 91
3.3 Calibration and method validation 92
3.4 Study samples 95
4. Conclusion 96
5. Acknowledgments 97
6. References 97
Larger molecular mass substances: a proof of concept study on
cystatin C 99 Chapter 1: General concept 101 1. Introduction 103
2. Selection of a model protein 104
2.1 Why cystatin C 104
2.2 Blood serum cystatin C reference ranges 107
2.3 Cystatin C structure 108
3. selection of an adequate internal standard 110
3.1 Labelling techniques 111
3.1.1 Stable isotope labelling by amino-acids in culture (SILAC) 111
3.1.2 Proteolytic labelling by with 18
3.1.3 Isotope incorporation by chemical derivatization 112
O isotopes 112
3.2 A protein analogue as internal standard 113
3.2.1 Chicken egg white cystatin 113
4. References 115

viii
Chapter 2: Optimization of an in-solution digest protocol 117 1. Introduction 119
2. Experimental 121
2.1 Proteolytic digestion 121
2.2 Liquid chromatography 121
2.3 Mass spectrometry 122
2.4 Calibrators 122
3. Results and discussion 123
4. Conclusion 130
5. Acknowledgments 131
6. References 131
Chapter 3: Multiple (trapping) large volume injection 133 1. Introduction 135
2. Experimental 138
2.1 Peptide Standards 138
2.1.1 [Glu1
2.1.2 MassPREP peptides 138
]-fibrinopeptide B (glufib) 138
2.1.3 Cystatin C and chicken egg white cystatin 138
2.2 Liquid chromatography 140
2.3 Mass spectrometry 141
3. Results and discussion 142
3.1 Optimization of the chromatographic conditions 142
3.2 Peptide standards 149
3.2.1 Glufib-peptide standards 149
3.2.2 MassPREP-peptide standards 150
3.3.3 Cystatin C and chicken egg white cystatin 152
4. Conclusion 154
5. Acknowledgments 155
6. References 155
Chapter 4: The investigation of chemical (CNBr) proteolysis as an alternative to enzymatic
(tryptic) digestion 159 1. Introduction 159
2. Experimental 164

ix
2.1 Proteins 164
2.2 Chemicals 164
2.3 Proteolysis protocols 164
2.3.1 Enzymatic proteolysis 165
2.3.2 Chemical proteolysis 165
2.4 Liquid chromatography 166
2.5 Mass spectrometry 166 3. Results and discussion 167
3.1 Selection of the internal standard 167
3.2 Selection of the marker-peptides 168
3.3 Enzymatic digestion 173
3.3.1 Cystatin C 174
3.3.2 Chicken egg white cystatin 178
3.4 Chemical digestion 180
4. Conclusion 186
5. Acknowledgments 187
6. References 187
Chapter 5: The application of chemical proteolysis on plasma samples 189 1. Introduction 191
2. Experimental 194
2.1 Cystatin C 194
2.2 Chicken egg white cystatin 195
2.3 Chemical proteolysis 195
2.4 Liquid chromatography 195
2.5 Mass spectrometry 196
2.6 Ultracentifugation 196
2.6.1 Centrisart devices 196
2.6.2 Vivaspin 2 concentrators 197
2.6.3 Centrifugation 198
3. Results and discussion 198
3.1 Optimization of the fractionation/extraction procedure 198
3.2 Application of the selected procedure 204
4. Conclusion 207
5. References 209
x
Conclusion and future perspectives 211
Conclusie en toekomstperspectieven 221
Aims and Scope of the thesis
- 1 -
Aims and scope of the thesis

Aims and scope of the thesis - 2 -
Nowadays, the use of liquid chromatography-(tandem) mass spectrometry (LC-MS(/MS)) for
the absolute quantitation of target compounds is widespread and probably one of the most
applied methodologies in modern bio-analytical work. Especially for small molecular mass
compounds, there are many well described approaches, “good-practices”, and quality
assurance guidelines with regard to their development, routine application and validation. LC-
MS based target compound analysis has evolved from bio-analysis using either GC-MS, LC-
UV, etc. and development and implementation of new methods follows a relatively
straightforward approach. Besides development of a method, its quality assurance is in
present day bio-analysis of prime importance. Again, the international (bio-) analytical
community and its analytical research efforts have, over the years, developed validation rules
which have become relatively generic in their application. One of the better known,
formulated by the US Food and Drug Administration (FDA), the “Guidance for Industry: Bio-
analytical Method Validation” will be briefly described and is used as the common guide
throughout.
During this work, quantitative target compound bio-analysis using LC-MS(/MS) is the central
theme. As so, in a first part, two quantitation tools for use in preliminary pharmacokinetic
(PK)-studies of therapeutic drugs are developed and the aforementioned guidelines are
implemented in the validation of these small molecule bio-analytical methods. In the first
application study, a quantitative LC-MS(/MS) procedure is intended for the simultaneous
analysis of two antimalarials pyrimethamine and sulfamethoxypyrazine in plasma samples
where the second application aimed for the quantitation of the anti-cholinergic agent
glycopyrrolate, also in plasma samples.
Aims and scope of the thesis - 3 -
However, the real challenge of this work lies in the extension of such LC-MS(/MS) based
procedures to a new application field, being the absolute quantitation of larger bio-molecules
such as proteins. Here, the use of mass spectrometry is also already widely accepted but
mainly, if not only, for qualitative or semi-quantitative purposes. Starting from the experience
and procedures established and acquired for small molecules, the main scientific goal of this
work is to investigate how and to what degree these approaches need adaptation to establish a
reliable LC-MS based absolute quantitative method for proteins. From that aim, it is clear
that, rather than aiming for the optimal approach for one protein, the development of a general
mass spectrometry based quantitation tool, theoretically applicable to any given protein
without the need of major adjustments, has to be the ultimate goal. In this perspective, the use
of marker-peptides as a measure of the protein of interest as a whole is a prime investigative
goal. Therefore, the protein needs to be cleaved into peptides by means of chemical or
enzymatic proteolysis. This most important and critical step is investigated in depth during the
first chapters, with special emphasis on reproducibility and internal standardization to
compensate for differential proteolysis’ efficiencies. The so gained peptides are then, in a next
step, chromatographically separated and quantitatively analyzed using MS(/MS). Using this
so-called “bottom-up” approach for mass spectrometric protein analysis, its quantitation is
redirected to the more straightforward quantitation of a small peptide subset.
Historically, in contrast to mass spectrometric based approaches for protein quantitation,
almost all protein quantitation methods are based upon immuno-assays. These allow high-
throughput but can essentially only be applied for the protein they have been developed for.
As such, there is a certain need for more generic methods. In order to investigate such an
approach, a model protein has to be chosen and applied in a proof of concept study. Cystatin
Aims and scope of the thesis - 4 -
C was chosen based on its possible clinical significance as a marker of kidney function and
based on its chemical properties.
Another most critical step in quantitative protein analysis is the often high complexity of
protein samples. For instance, in the case of plasma samples, the 22 most abundant plasma
proteins count for more than 99% of the plasma bulk protein mass. Thus, it is clear that the
effective removal of the major part of these proteins will be mandatory since the detection of
less abundant proteins will be suppressed by these (much) higher abundant ones. To achieve
this, the use of ultrafiltration will be investigated in the last part of this work.
Throughout the work, LC-MS(/MS) and reliable absolute quantitative analysis, both for low
and higher (proteins) molecular mass substances, are a central theme. We therefore
considered it worthwhile to introduce the reader or refocus his attention on certain aspects
used in our work in both the fields of mass spectrometry and quality assurance of an
analytical method.
Mass spectrometry - 5 -
Mass Spectrometry

Mass spectrometry - 6 -
Mass spectrometry (MS) determines the mass-to charge ratio’s (m/z) of gas-phase ions.
Hence, the analytes need to be transferred to the gas phase and ionized prior to analysis.
Besides molecular mass information, the technique also provides structural information. Mass
spectrometry as a technique already originates from the early twentieth century. In 1913, it
was Thomson who obtained the first mass spectra of small gaseous ions like e.g. O
1. Introduction
2, N2, CO,
CO2
, etc. [1]. His work was further developed by Aston who measured the masses of more
than 100 stable isotopes using similar techniques [2-4]. Mass spectrometry achieved another
performance boost by the coupling with a chromatographic separation technique (gas
chromatography).
The real breakthrough of mass-spectrometric (bio-) analysis of bio-molecules, however, came
not until the early 1980’s by the discovery of fast-atom bombardment (FAB) by Barber and
co-workers [2, 5]. Nevertheless, it was the revolutionizing introduction of soft-ionization
techniques like electrospray ionization (ESI) by Fenn further on in the 1980’s [6], and, later
matrix assisted laser desorption ionization (MALDI) that made mass spectrometry the most
important tool to analyze large bio-molecules. Before, mass spectrometry demanded
vaporized samples, ionized by either electron impact (EI) or chemical ionization (CI).
Unfortunately, larger, polar and/or thermally labile bio-molecules like peptides and proteins
could not be analyzed using these ionization techniques. This, in contrast to ESI and MALDI
which allow nowadays the analysis of bio-molecules as large as a few mega-Dalton [2, 7]. As
such, during the last decades, there has been an explosion in instrumentation and applications
of mass-spectrometry for the analysis of large bio-molecules.
Mass spectrometry - 7 -
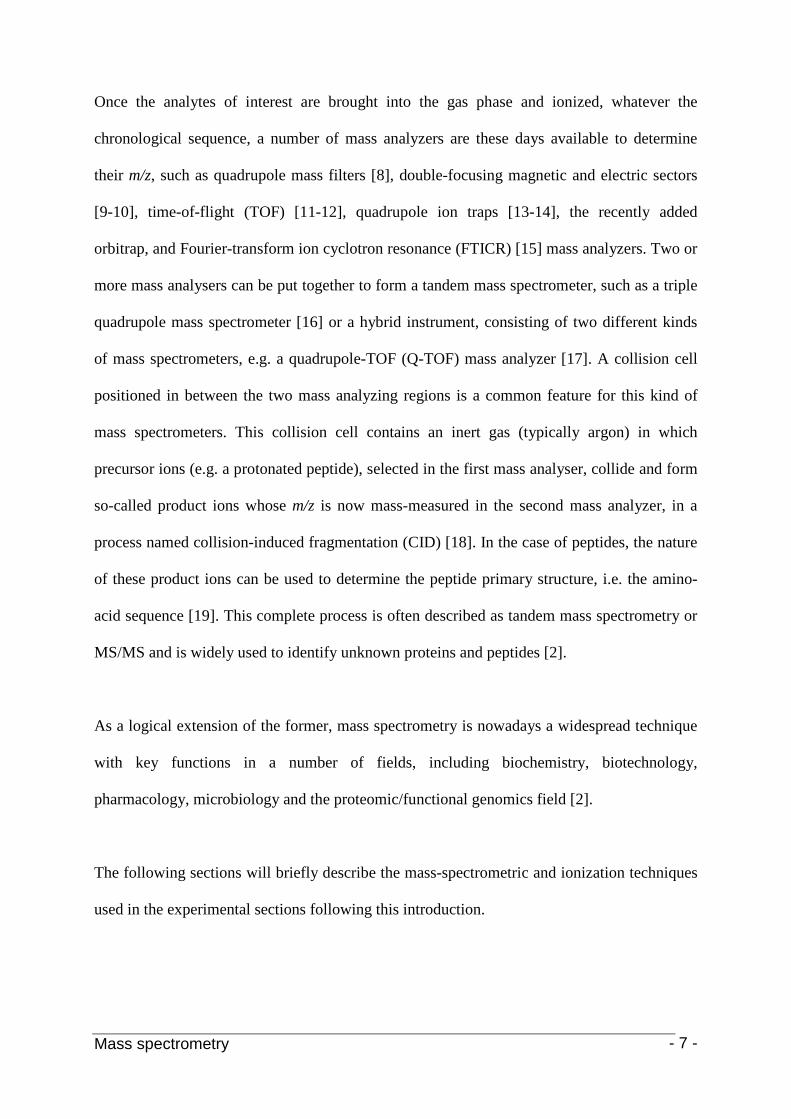
Once the analytes of interest are brought into the gas phase and ionized, whatever the
chronological sequence, a number of mass analyzers are these days available to determine
their m/z, such as quadrupole mass filters [8], double-focusing magnetic and electric sectors
[9-10], time-of-flight (TOF) [11-12], quadrupole ion traps [13-14], the recently added
orbitrap, and Fourier-transform ion cyclotron resonance (FTICR) [15] mass analyzers. Two or
more mass analysers can be put together to form a tandem mass spectrometer, such as a triple
quadrupole mass spectrometer [16] or a hybrid instrument, consisting of two different kinds
of mass spectrometers, e.g. a quadrupole-TOF (Q-TOF) mass analyzer [17]. A collision cell
positioned in between the two mass analyzing regions is a common feature for this kind of
mass spectrometers. This collision cell contains an inert gas (typically argon) in which
precursor ions (e.g. a protonated peptide), selected in the first mass analyser, collide and form
so-called product ions whose m/z is now mass-measured in the second mass analyzer, in a
process named collision-induced fragmentation (CID) [18]. In the case of peptides, the nature
of these product ions can be used to determine the peptide primary structure, i.e. the amino-
acid sequence [19]. This complete process is often described as tandem mass spectrometry or
MS/MS and is widely used to identify unknown proteins and peptides [2].
As a logical extension of the former, mass spectrometry is nowadays a widespread technique
with key functions in a number of fields, including biochemistry, biotechnology,
pharmacology, microbiology and the proteomic/functional genomics field [2].
The following sections will briefly describe the mass-spectrometric and ionization techniques
used in the experimental sections following this introduction.
Mass spectrometry - 8 -
2.1 Definition
2. Electrospray ionization (ESI)
The development of ESI by Fenn, almost two decades ago, has paved the way to the analysis
of large bio-molecules using mass spectrometry and was awarded the Nobel Prize in 2002 [6,
20, 21]. In fact, ESI is a continuous-flow ionisation device used as an interface in the coupling
of separation techniques such as LC to mass spectrometric devices. Especially the
combination of LC-ESI-MS(/MS) has become the analytical technique of choice in
quantitative bio-analytical work based on the excellent selectivity and sensitivity of the
technique [2, 22].
In conventional electrospray, a flow of liquid, either from a chromatographic system or a
syringe pump, is passed through a thin conducting needle at high voltage and a potential
difference is created between the needle tip and a counter electrode, being the inlet of the
mass spectrometer [2]. Due to the electric field gradient created at the tip, charge separation
occurs in the solution as anions migrate towards the capillary walls (positively charged) and
cations travel towards the meniscus of the droplet formed at the tip [23, 24]. The optimal
potential difference depends on experimental parameters, such as the charge state of the
analyte, the solution flow-rate, the solvent composition, and the distance between the tip and
the counter electrode [25]. For simplicity reasons, the further clarification of the electrospray
process will be done for the case of electrospray in the positive ionization mode (+ESI). The
same theoretical process takes place at –ESI, albeit that the direction of the potential
difference is then reversed.

Mass spectrometry - 9 -
Figure 1: schematic overview of the ESI process (www.chm.bris.ac.uk)
Owing to the presence of an electric field, liquid emerges from the tip of the capillary in the
shape of a cone, also known as the “Taylor cone” [26]. When the electrostatic repulsion
between charged molecules at the surface of the Taylor cone approaches the surface tension
of the solution -known as reaching the Rayleigh limit- charged droplets are expelled from the
tip (see Figure 1). A process, known as “Coulomb explosion”, results in the formation of
highly charged micro droplets. Evaporation of the offspring droplets solvent, assisted by the
presence of a (warm) nitrogen stream, leads to a fission series and the process repeats itself to
produce smaller and smaller droplets until ultimately gas phase ions are formed [23]. The
exact mechanism of formation of these gas phase ions, together with the exact mechanism of
charging the analytes, remains unclear but is thought to be a combination of two mechanisms
known as the “ion evaporation mechanism” (IEM), originally proposed by Iribarne and
Thomson [27], and the “charged residue model” (CRM), put forward by Dole et al. [28].
IEM suggests hereby that, when the electric field on a charged droplet is high enough, single
solvated, analyte molecules carrying some of the droplet charge are ejected into the gas phase.

Mass spectrometry - 10 -
This happens because the potential energy of the ions near the surface becomes high enough
to allow evaporation to occur [27-31]. By contrast, the CRM maintains that gas phase ions are
formed when successive droplet fissions lead to a charged droplet containing a single analyte
[23].
During ionization, the analytes become protonated or cation-adducted positive ions (+ESI),
while in –ESI, a hydrogen is extracted from the analyte. This is because in the first part of the
inlet, before the vacuum of the mass spectrometer is reached, the ions are continually
colliding with eluent molecules. During these collisions, the analytes lose excess of internal
energy and interchange protons (or cation). The resulting ions themselves have, however,
little excess of internal energy and therefore, little fragmentation is noticed during the
ionization process [32].
.
Many of the ions formed during +ESI occur as [M+nH]n+ (or other cations like Na+, K+,
NH4+); [M-nH]n- in –ESI. Because these ions have a molecular mass different from the
analyte (+nH+), the ions are often named “quasi-molecular” ions. Nevertheless, this
terminology is a subject of discussion in fundamental mass spectrometry circles. In the case of
larger bio-molecules like proteins, the formation of multiple charged ions up to 30+
is very
common and typical for ESI.
Thus, at the end of the electrospray process, sample molecules dissolved in a solvent have
been extracted from that solvent and turned into ions. Therefore, the system is both an inlet
and an ion source. The analyte hereby enters the mass analyzer under a protonated form
[M+nH]n+ with n being the number of protons attached to the analyte. Sometimes, also
[M+Na]+ and [M+NH4]+ ions are noticed.

Mass spectrometry - 11 -
2.2 Electrospray ionization of peptides and proteins
2.2.1 Envelope formation
Figure 2: electrospray mass spectrum of the protein, aerolysin K. The attachment of many protons per
protein molecule (from less than 30 to more than 50 here) leads to a series of m/z peaks for this single
protein. The inset shows a computer analysis of the data from this series of peaks that generates a single
peak at the correct molecular mass of the protein [33].
As mentioned above, ESI of larger molecules produces multiply charged ions. As a result,
proteins with molecular masses in the mass range of 10-100 kDa will, in general, produce an
envelope of ions (see Figure 2), different from each other in the number of attached protons
and hence charge state, with m/z values below 2500 Da. Ion transmission throughout the mass
spectrometer is generally very good within this region. As a result, mass measurement
statistics are excellent. These features make ESI one the most suitable ionization methods for
molecular mass determination of large bio-molecules. For structural information, however,
the use of MS/MS is needed (cfr. infra) as the ESI process in itself does not produce a
substantial number of fragment ions [2].
Mass spectrometry - 12 -
2.2.2 Protein/peptide fragmentation
For protein characterisation, proteins are typically first enzymatically or chemically digested
into peptides and these peptides are then fragmented by CID fragmentation. This so-called
“bottom-up” protein analysis process has for years been the gold standard approach in
proteomics for protein/peptide identification and characterisation. However, reducing a
protein to a collection of peptides could also be interesting for the absolute quantitation of the
protein (by means of one or more selected marker peptides, see later). In such a LC-MS(/MS)
experiment, the chromatographic separation is used to separate the peptides from a protein
digest and the first mass analyzer (MS1) is then set up so as to sequentially “mass-select”
these peptides for further analysis (see Figure 3). The selected peptide-ion is focused toward
the collision cell where the peptide collides with an inert gas (mostly argon). During these
collisions, the translational energy of the precursor peptide-ion will partly be converted into
internal energy and the ions become excited to an unstable state. Consequently, the precursor
ions dissociate (fragment) into smaller product ions. The mass of these product ions can then
be determined in the second mass analyzer (MS2). Because of the standardized way in which
polypeptides fragment (largely due to the repetitive nature of the peptide bond), the amino-
acid sequence of the peptide can be deduced. Alternatively, in the quantitation approach, one
or two product ions could be selected for quantitation [2].
Mass spectrometry - 13 -
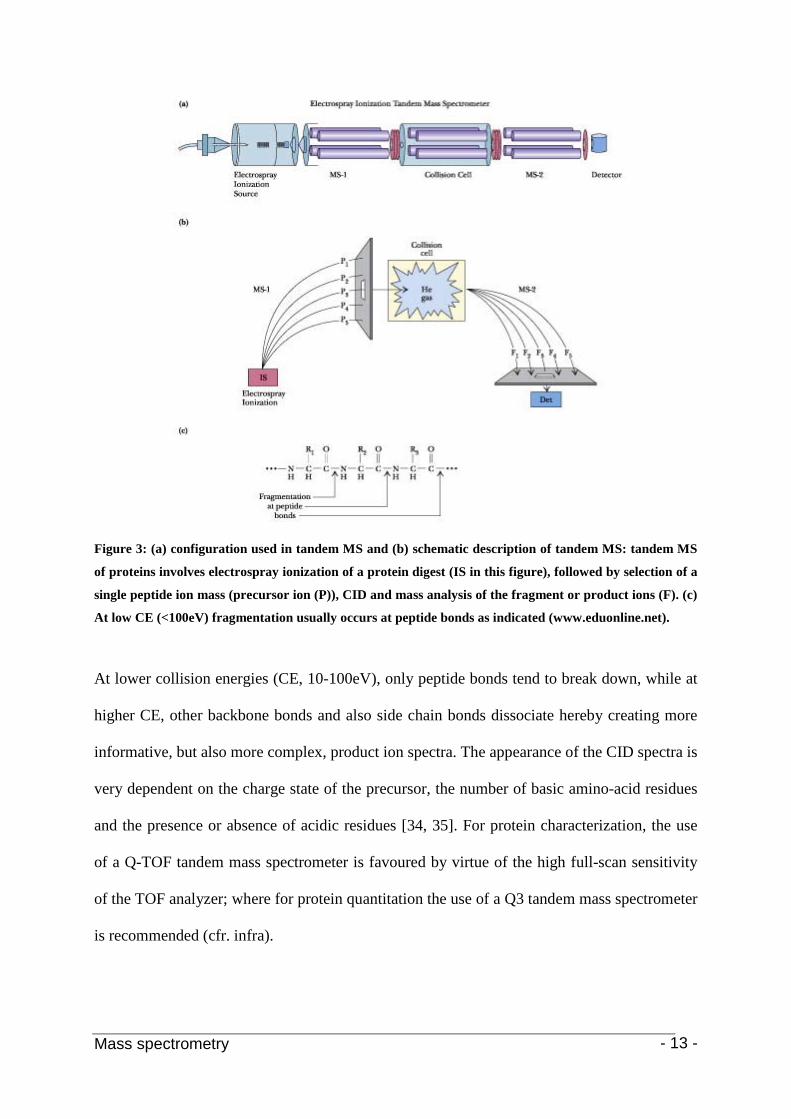
Figure 3: (a) configuration used in tandem MS and (b) schematic description of tandem MS: tandem MS
of proteins involves electrospray ionization of a protein digest (IS in this figure), followed by selection of a
single peptide ion mass (precursor ion (P)), CID and mass analysis of the fragment or product ions (F). (c)
At low CE (<100eV) fragmentation usually occurs at peptide bonds as indicated (www.eduonline.net).
At lower collision energies (CE, 10-100eV), only peptide bonds tend to break down, while at
higher CE, other backbone bonds and also side chain bonds dissociate hereby creating more
informative, but also more complex, product ion spectra. The appearance of the CID spectra is
very dependent on the charge state of the precursor, the number of basic amino-acid residues
and the presence or absence of acidic residues [34, 35]. For protein characterization, the use
of a Q-TOF tandem mass spectrometer is favoured by virtue of the high full-scan sensitivity
of the TOF analyzer; where for protein quantitation the use of a Q3 tandem mass spectrometer
is recommended (cfr. infra).
Mass spectrometry - 14 -
3.1 Quadrupole (Q) mass spectrometry
3. (Tandem) mass spectrometers used in our particular work
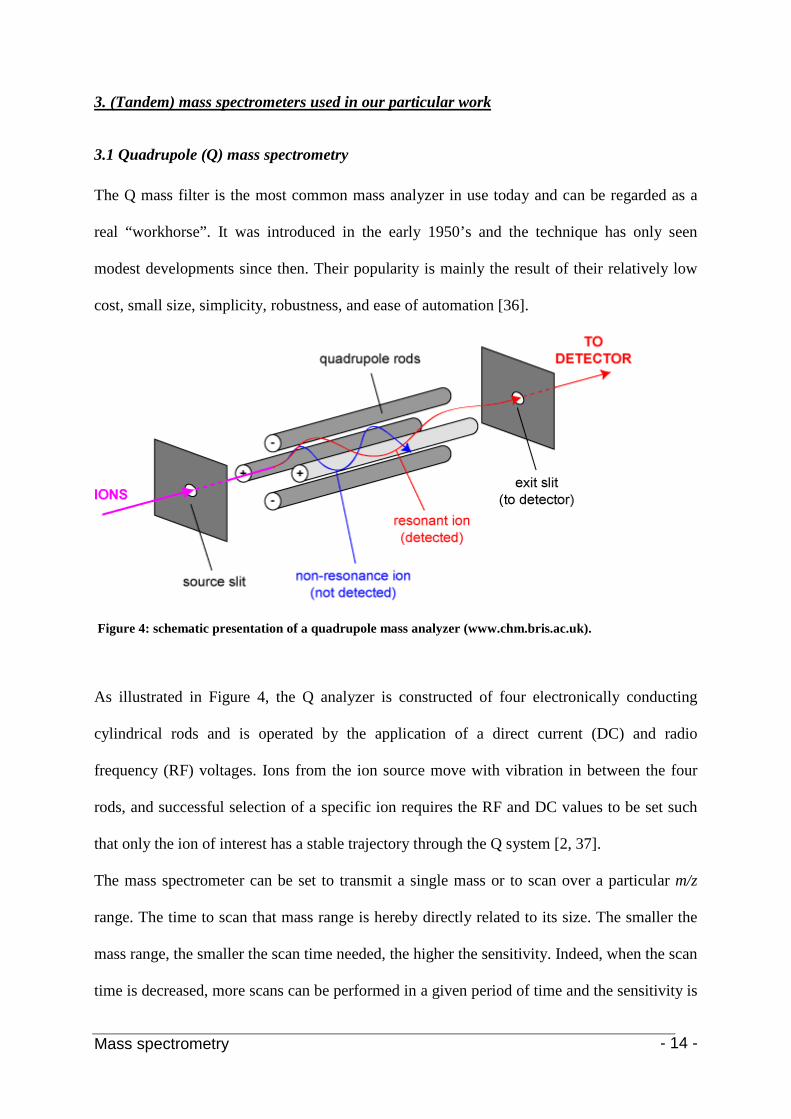
The Q mass filter is the most common mass analyzer in use today and can be regarded as a
real “workhorse”. It was introduced in the early 1950’s and the technique has only seen
modest developments since then. Their popularity is mainly the result of their relatively low
cost, small size, simplicity, robustness, and ease of automation [36].
Figure 4: schematic presentation of a quadrupole mass analyzer (www.chm.bris.ac.uk).
As illustrated in Figure 4, the Q analyzer is constructed of four electronically conducting
cylindrical rods and is operated by the application of a direct current (DC) and radio
frequency (RF) voltages. Ions from the ion source move with vibration in between the four
rods, and successful selection of a specific ion requires the RF and DC values to be set such
that only the ion of interest has a stable trajectory through the Q system [2, 37].
The mass spectrometer can be set to transmit a single mass or to scan over a particular m/z
range. The time to scan that mass range is hereby directly related to its size. The smaller the
mass range, the smaller the scan time needed, the higher the sensitivity. Indeed, when the scan
time is decreased, more scans can be performed in a given period of time and the sensitivity is

Mass spectrometry - 15 -
consequently enhanced. The mass range of most commercially available quadrupoles is now
about 4000 Da, albeit that the latest Q mass spectrometers are capable of analyzing ions as big
as m/z 10000 and higher [38]. Compared to the pulsed nature of TOF instruments, the Q mass
filter is a continuous analyzer and its mass accuracy is poor [7].
3.2 Time-of-flight (TOF) mass spectrometry
Conceptually, the simplest mass analyzer is probably the TOF mass spectrometer [39]. The
principle is based on “time-lag-focusing”, a term introduced by Wiley and McLaren in the
mid 1950’s [11]. As such, the m/z value of ions is deduced from the flight time of these ions
accelerated out of an ion source into a field-free drift tube towards a detector. Theoretically,
the ions are all formed at the same time and place in the ion source and then accelerated
through a fixed potential into the drift tube. As all the ions with the same charge obtain the
same kinetic energy after acceleration, the lower m/z ions achieve higher velocities than the
higher m/z ions. After acceleration, the ions travel throughout a fixed distance tube before
striking the detector. Thus, by measuring the time it takes to reach the detector, the m/z value
of the ion can be determined. As such, the ion velocity is inversely related to the square root
of the m/z [36].
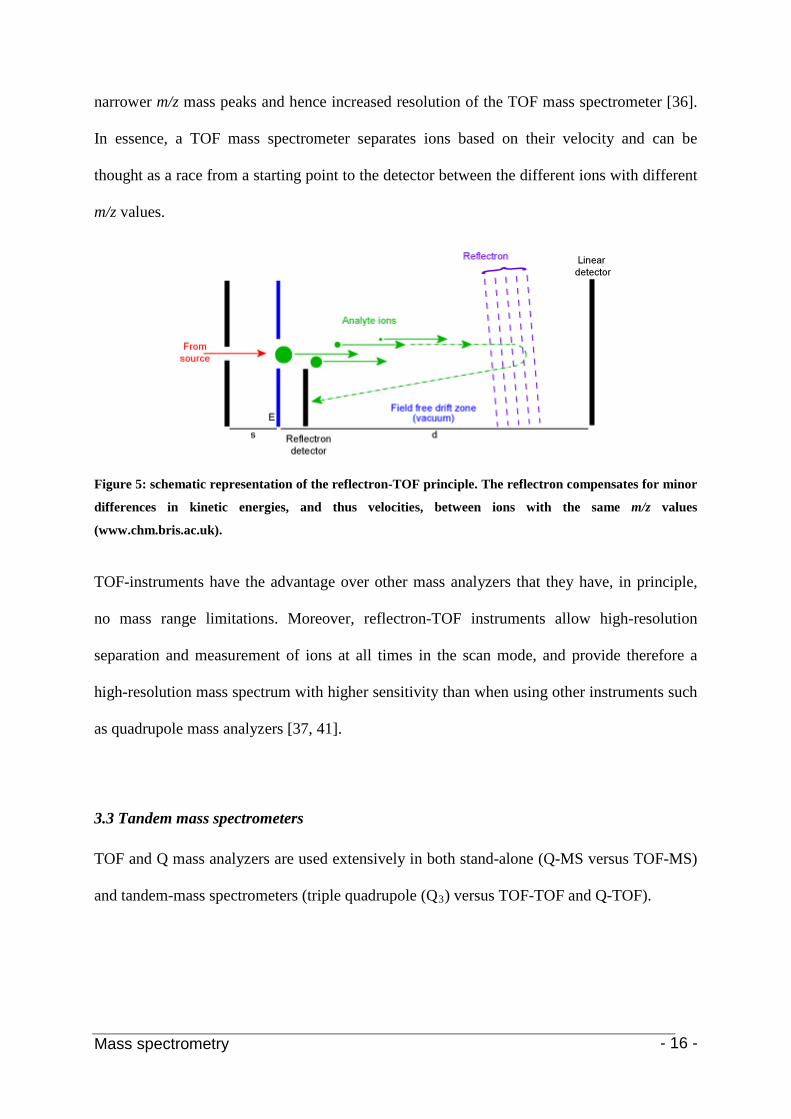
The above description is generally termed as linear TOF while the best performance is
actually reached on more sophisticated instruments that include a reflectron [40]. In such
reflectron-TOF instruments (see Figure 5), after travelling trough one flight distance, the ions
enter an electrostatic mirror, called the reflectron, that turns the ions around and sends them
down a second flight distance to the detector. The function of the reflectron hereby is to
compensate for minor differences in the velocities of ions with the same m/z resulting in
Mass spectrometry - 16 -
narrower m/z mass peaks and hence increased resolution of the TOF mass spectrometer [36].
In essence, a TOF mass spectrometer separates ions based on their velocity and can be
thought as a race from a starting point to the detector between the different ions with different
m/z values.
Figure 5: schematic representation of the reflectron-TOF principle. The reflectron compensates for minor
differences in kinetic energies, and thus velocities, between ions with the same m/z values
(www.chm.bris.ac.uk).
TOF-instruments have the advantage over other mass analyzers that they have, in principle,
no mass range limitations. Moreover, reflectron-TOF instruments allow high-resolution
separation and measurement of ions at all times in the scan mode, and provide therefore a
high-resolution mass spectrum with higher sensitivity than when using other instruments such
as quadrupole mass analyzers [37, 41].
3.3 Tandem mass spectrometers
TOF and Q mass analyzers are used extensively in both stand-alone (Q-MS versus TOF-MS)
and tandem-mass spectrometers (triple quadrupole (Q3) versus TOF-TOF and Q-TOF).

Mass spectrometry - 17 -
3.3.1 The Q-TOF mass spectrometer
Q-TOF instruments exhibit high resolutions and mass spectrometric measurements in (single)
MS and MS/MS modes. In the MS mode, the Q (MS1) acts as an ion guide to the TOF
analyzer (MS2) where the actual mass analysis takes place. In the MS/MS mode, the
precursor ions are selected in the first Q (MS1) and undergo CID fragmentation on their way
to the TOF analyzer (MS2) (cfr. supra) [41]. Q-TOF mass analyzers are extensively used for
proteomic (qualitative) applications based on their capability of scanning a broad mass range
during one single MS-scan (typically 0.5-5 seconds). In the frame of absolute quantitative
analysis of target compounds, their use is less recommended.
3.3.2 The Q3
For quantitative analysis of target compounds, Q
mass spectrometer
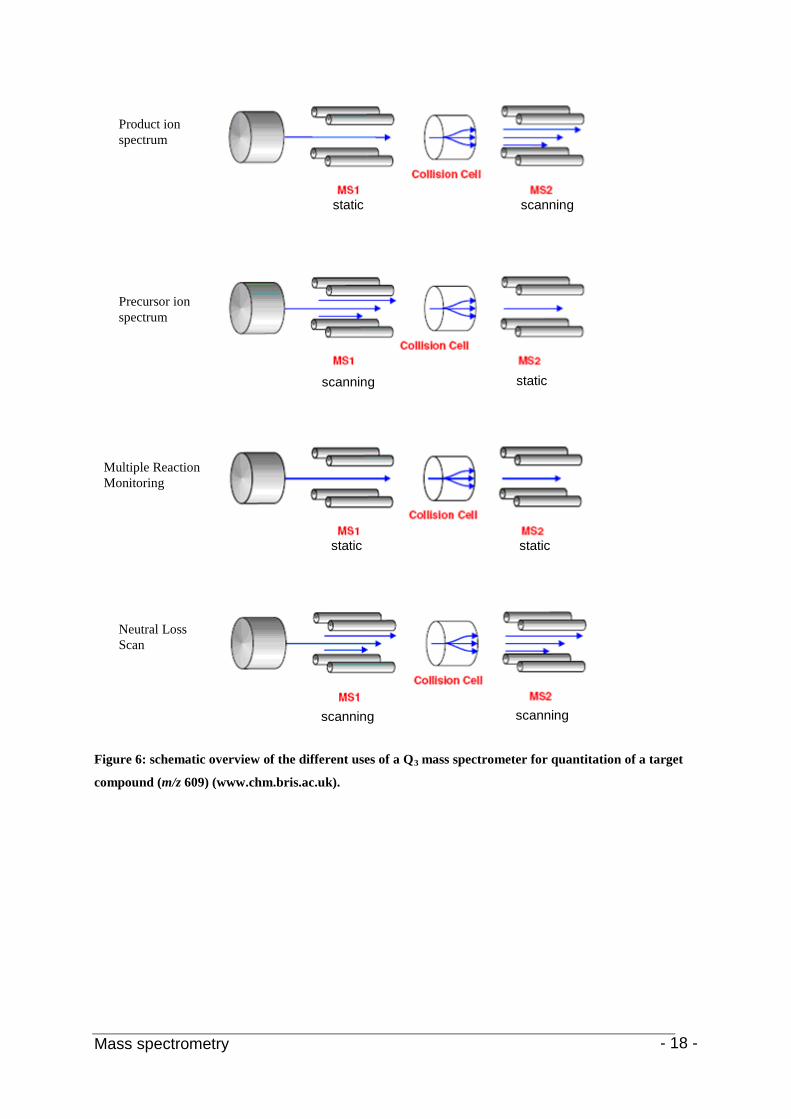
3 instruments are typically programmed in
the SIM/SIR (selection ion monitoring/reaction) or SRM/MRM (single/multiple reaction
monitoring) mode. S/MRM allows the detection and quantitation of known compounds with a
very high degree of sensitivity and selectivity. Other features include precursor ion scanning
and neutral loss scans. A schematic overview of the different MS and MS/MS modes on Q3
instruments is shown in Figure 6. Product ion spectrum and precursor ion spectrum refer
respectively to MS and MS/MS.
Mass spectrometry - 18 -
Figure 6: schematic overview of the different uses of a Q3
mass spectrometer for quantitation of a target
compound (m/z 609) (www.chm.bris.ac.uk).
Product ion spectrum
Precursor ion spectrum
Multiple Reaction Monitoring
Neutral Loss Scan
static
static
scanning
scanning
static static
scanning scanning

Mass spectrometry - 19 -
1. J.J. Thomson, Rays of positive electricity and their applications to chemical analysis, Longmans Green, Londen, U.K., 1913: p. 1-132
4. References
2. A.P. Jonsson, CMLS, Cell. Mol. Life Sci., 2001 (58): p. 868 3. F.W. Aston., Philos. Mag., 1919 (38): p. 707 4. F.W. Aston, Mass spectra and isotopes, Arnold, London, 1933 5. M. Barber, R.S. Bordoli, R.D. Sedgwick, and A.N. Tyler, J. Chem. Soc. Chem. Commun.,
1981: p. 325 6. J.B. Fenn, M. Mann, V.K. Meng, S.F. Wong, and C.M. Whitehouse, Mass Spectrom. Rev.
1989 (246): p. 64 7. A.A. Rostom, and C.V. Robinson, J. Am. Chem. Soc.,1999 (121): p. 4718 8. V.W. Paul, and H. Steinwedel, Z. Naturforsch., 1953 (8a): p. 448 9. A.J. Dempster, Phys. Rev., 1918 (11): p.316 10. E.G. Johnson, and A.O. Nier, Phys. Rev., 1953 (91): p.10 11. W.C. Wiley, and I.H. McLaren, Rev. Sci. Instrum., 1955 (26): p.1150 12. M. Guilhaus, V. Mlynski, and D. Selby, Rapid Commun. Mass Spectrom, 1997 (11): p.
951 13. W. Paul, and H. Steinwedel, US Patent number 2939952 14. R.E. March, J. Mass Spectrom, 1997 (32): p. 351 15. M.B. Comisarow, and A.G. Marshall, Chem. Phys. Lett., 1974 (25): p.282 16. R.A. Yost, C.G. Enke, J. Am. Chem. Soc., 1978 (100): p. 2274 17. H.R. Morris, T. Paxton, A. Dell, B. Langhorn, M. Berg, R.S. Bordoli, et al., Rapid
Commun. Mass Spectrom., 1996 (10): p.889 18. E. Hoffman, J. Mass Spectrom., 1996 (31): p.129 19. F.W. McLafferty, Tandem Mass Spectrometry, Wiley, NY, 1983 20. J.B. Fenn, M. Mann, V.K. Meng, S.F. Wong, and C.M. Whitehouse, Mass Spectrom. Rev.,
1990 (9): p.37 21. M. Man, Org. Mass Spectrom., 1990 (25): p.575 22. J.Z. Yang, K.C. Chad Bastian, R.D. Moore, J.F. Stobauh, and R.T. Borchardt, J.
Chromatgr. B, 2002 (780): p.269 23. I. Manisali, D.D.Y. Chen, B.B. Schneider, Trends Analyt Chem, 2006 (25): p.243 24. R.B. Cole, J. Mass Spectrom., 2000 (35): p.763 25. A.P. Bruins, Electrospray Ionization Mass Spectometry: fundamentals, Instrumentation,
and Applications, Wiley & Sons, NY (USA), 1997: p.107 26. G. Taylor, Proc. R. Soc. London, 1964: p.383 27. B.A. Thomson, and J.V Iribarne, J. Chem. Phys., 1979 (71): p.4451 28. M. Dole, L.L.Mack, and R.L.Hines, J. Chem. Phys., 1968 (49): p.2240 29. P. Kebarle, and M. Peschke, Anal. Chim. Acta, 1999 (406): p.11 30. N. Felitsyn, M. Peschke, and P. Kebarle, Int. J. Mass Spectrom., 2002 (219): p.39 31. M. Gamero-Castano, and F.J. de la Mora, J. Mass. Spectrom., 2000 (35): p.790 32. Back to Basics, Micomass UK, p.87 33. M. Mann, and M. Wilm, Trends in Biochem Sci.,1995 (20): p.219 34. R.S. Johnson, S.A. Martin, and K. Biemann, Int. J. Mass Spectrom. Ion Proces., 1988
(86): p.137 35. R.S. Johnson, S.A. Martin, and K. Biemann, Anal. Chem., 1987 (59): p.2621 36. G.L. Glish, and R.W. Vachet, Nature Rev. Drug disc., 2003 (2): p.140 37. N. Mano, J. Goto, Anal. Sci., 2003 (19): p.3 38. B.E. Winger, K.J. Light-Wahl, R.R. Ogorzalek Loo, H.R. Udseth, and R.D. Smith, J. Am.
Soc. Mass Spectrom., 1993 (4): p.536
Mass spectrometry - 20 -
39. C. Weickhardt, F. Moritz, and J. Grotemeyer, Mass Spectrom. Rev., 1996 (15): p.139 40. W.C. Wiley, and I.H. McLaren, Rev. Sci. Instr., 1955 (26): p.1150 41. B. Domon, and R. Aeberssold, Science, tools for biochemistry, 2006 (312): p.212
Bio-analytical method validation - 21 -
Bio-Analytical method validation
in mass spectrometric applications

Bio-analytical method validation - 22 -
During the last two decades, there have been enormous advancements in the field of mass
spectrometry in regard to the development of new interfaces and ionization techniques like
atmospheric pressure ionization (API), ESI and atmospheric pressure chemical ionization
(APCI) [1-8]. These advancements resulted in the rapid emergence and widespread
commercial use of hyphenated mass spectrometry based quantitative assays. Liquid
chromatography linked to mass spectrometry plays an ever growing role in modern
pharmacokinetics and metabolism studies [9] and have now largely replaced conventional
HPLC(-UV), GC and GC-MS for the quantitation of small molecule drugs, metabolites, and
other xenobiotic molecules in biological matrices. The inherent high selectivity and sensitivity
of the technique results in analytical methods with increased throughput by the use of
simplified sample preparation and/or rapid chromatography [1-18]. Despite the ever evolving
technology, the need for clearly defined validation criteria remains [19, 20].
1. Introduction
In this perspective, bio-analytical method validation includes all of the procedures to
demonstrate that a particular bio-analytical method for the quantitative measurement of an
analyte(s) in a particular biological matrix like e.g. blood, plasma, serum, or urine is suitable
and reliable for the intended use. Even though the majority of the principles, procedures, and
requirements of bio-analytical method validation are common to all types of analytical
methodologies, they will be outlined with special interest to LC-MS(/MS) [19, 20].
The fundamental parameters to be assessed in bio-analytical validation and acceptance
experiments are (i) accuracy, (ii) precision, (iii) selectivity, (iv) sensitivity, (v) reproducibility
and (vi) stability [20]. Only when the intended criteria (cfr. infra) for these parameters are
attained, a given method can be accepted for the quantitative determination of an analyte. The
Bio-analytical method validation - 23 -
developed method is then suitable for use in e.g. clinical pharmacology and/or
pharmacokinetic studies.
Matrix effect and (analytical) calibration are the two up most important issues influencing
these fundamental parameters of (mass spectrometric) bio-analytical method validation and
are related to the extraction/ sample preparation procedure used. This is of course caused by
the fact that samples from biological matrices are not directly compatible with LC-MS(/MS)
analysis. Traditionally, sample preparation has been performed using liquid-liquid extraction
(LLE), solid-phase extraction (SPE), and, somewhat more recently, protein precipitation
(PPT). During recent years, also in-line SPE methods have been developed and generate an
ever growing interest. In such a set-up, the SPE method is embedded in the chromatographic
separation system and most of the labour intensive and time-consuming manual operations
associated with the latter off-line procedures are eliminated [19].
The main perspective of analytical calibration is to find an empiric relationship, called
measurement function, which subsequently permits to calculate the values of the
amount/concentration of a substance in a sample (described as the x-variable) from the
measured values of an analytical signal (described as the y-variable) [21]. An IUPAC
recommendation describes (analytical) calibration as the operation that determines the
functional relationship between measured values (signal intensity, response), y-variable, and
analytical quantities characterizing types of analytes and their amount (content,
concentration), the x-variable. In most cases, the calibration has to take into account, and
needs to compensate for, the response related to all relevant constituents and interferences
[22, 23]. The latter is in LC-MS(/MS), however, also described by the matrix effect of the
Bio-analytical method validation - 24 -
analytical system, in literature often replaced by the more precise terms matrix ionization
effect or matrix suppression effect [9].
Indeed, matrix effect is defined as the effect of “invisible” and mostly unknown co-eluting
residual matrix components on the ionization of the target analyte [1, 10]. Based on the high
sensitivity, selectivity and specificity of LC-MS(/MS), it was, in the past, of common sense
that sample preparation prior to mass spectrometric analysis could be minimized or even
eliminated and chromatographic separation was achieved by the use of short analytical
columns (typically 3 cm and less) with steep gradients or short isocratic runs, often less then 2
min. [24]. This based on the apparent fact that no endogenous impurities from bio-fluids were
detected, and the only MS(/MS) signal observed was the one originating from the analyte
[25]. As such, analysis time and method development could significantly be reduced [1].
Nevertheless, it became soon apparent that inadequate sample clean-up and chromatography
often led to ionization suppression (/enhancement) that caused irreproducible results for some
bio-analytical methods [10, 24-28]. Since, the susceptibility of LC-MS(/MS) to this
undesirable phenomenon has been extensively described in literature with regard to complex
matrices, like e.g. plasma [1, 12, 25, 29-42]. Generally, matrix effect diminishes
reproducibility and repeatability between various sample batches or even samples and, thus,
compromises the utility of LC-MS(/MS) in quantitative assays [32, 43, 44]. In this
perspective, matrix effect needs to be properly investigated and controlled, additionally to all
other, longer established validation parameters, when using MS as a detection technique.
The importance of matrix effect is also recognized by the US FDA. The Guidance for
Industry on Bio-analytical Method Validation states that “In the case of LC-MS and LC-
MS/MS based procedures, matrix effects should be investigated to insure that precision,
Bio-analytical method validation - 25 -
selectivity and sensitivity will not be compromized”. However, the methodology to expose
matrix effect is left to the discretion of the investigator. In this regard, many researchers have
described methods to probe and/or control matrix effects [45-51].
All of the aforementioned issues and parameters will be individually discussed in the
following chapter.
2.1 Calibration
2. Full analytical validation
To generate good calibration functions, two basic requirements must be fulfilled: (i) standards
(calibrators) and samples composition must be as similar as possible and (ii) standards and
samples must have an identical behaviour in the measurement system (e.g. matrix effect, cfr.
infra). In any case, the standard must be a representative of the sample [21].
Calibration can be performed based on two major principles, external versus internal, and can
be executed using one-standard calibration, two-standard calibration or multi-standard
calibration.
2.1.1 Multi-standard calibration
Multi-standard calibration is the most applied calibration approach in bio-analysis as in those
applications a given sample-set is often spread out over a concentration range of 2 orders of
magnitude and more [21, 53]. It is based on the measurement of a calibration standard set
evenly spaced over the analytical method working range. Then, an adequate regression
algorithm is used to obtain a calibration function. The consistency of the regression results
depends hereby on the magnitude of the experimental random errors. There are numerous
Bio-analytical method validation - 26 -
guidelines and technical papers available describing the statistical approach of the regression
[52-60] but their review as such is beyond the aims of this chapter.
The calibration function is set up using a set of analyte standards used as “calibrants”. These
calibrants, also called “calibrators”, are by the International Vocabulary of Metrology defined
as a measurement standard specifically used in calibrating [21]. In relation to the number of
calibration standards which must be used, and the number of replicates at each calibration
level, different recommendations in recognized written standards and guidelines can also be
found. So, IUPAC [61] advises for method validation purposes, the use of six or more
calibration standards that should be run, at least in triplicate, in a randomized way while the
International Organisation for Standardisation advises the use of at least five calibration
standards, although they recommend the use of 10 standards in combination with 10 replicates
of the lowest and highest standards [53]. The method validation performed in this work was
based on the US Food and Drug Administration (FDA) “Guidance for Industry, Bio-analytical
Method Validation”. Accordingly, the standard curve, covering the entire range of the
expected concentrations, should consist of a minimum of six standard points, excluding
blanks.
The lower limit of quantitation (LLOQ) is hereby defined as the lowest standard
concentration level if the following conditions are met: (i) the analyte response should be at
least 5 times the response compared to the blank response. This means, in the case of LC-
MS(/MS) that the signal to noise ratio should be at least 5 at the LLOQ. This, if no analytical
signal is present in the blank sample; (ii) analyte (peak) response should be identifiable, and
reproducible with a precision of 20% and accuracy of 80-120% (cfr. infra). The (lower) limit

Bio-analytical method validation - 27 -
of detection ((L)LOD) is likewise defined as the lowest amount/concentration measurable
with a signal to noise ratio of at least 3.
In any case, the simplest model that adequately describes the concentration-response
relationship should be used. Special weightings or more complex regression equations should
be justified. Historically, if possible, the use of linear calibration curves has been favoured.
However, we experienced that using liquid chromatography-electrospray-mass spectrometry
(LC-ESI-MS) quadratic calibration curves are often noted, especially when the concentration
range exceeds 2 orders of magnitude. Moreover, the use of TOF mass spectrometric detection
even enhances this phenomenon. Nowadays, dedicated software tools like the Quanlynx®
(Masslynx) software make the evaluation of such curvilinear data as easy as the evaluation of
linear data sets. For instance, in the mass spectrometry based applications described in the
following chapters for the quantitation of pyrimethamine/sulfamethoxypyrazine and
glycopyrrolate, both applications make use of quadratic concentration response curves.
Furthermore, the deviation from nominal concentration should be below 15% (20% for the
LLOQ). For a method to be accepted, after validation, as quantitation tool in e.g.
pharmacokinetic studies, at least four out of six standards should meet these criteria, including
the LLOQ and the highest standard used. This highest standard is sometimes also
denominated as the upper limit of quantitation (ULOQ). Estimation of concentration in
unknown samples by extrapolation of the standard curves below the LLOQ or above the
ULOQ is not recommended. Instead, the calibration curve should be redefined or samples
with higher concentrations should be adequately diluted.

Bio-analytical method validation - 28 -
2.1.2 One and two-standard calibration
When the linearity of the calibration function is already proven during method development,
routine calibration can be obtained from only two calibration standards, preferably measured
in replicate. The standards must be selected in such way that the sample analyte(s)
quantity(ies) is (are) included in the range covered by them. The analyte concentration can
then be calculated using the following equation:
st1st2
st2anast1st1anast2ana
Y - Y )Y - (Y X - )Y - (Y X X =
Where X is the concentration of the standards (st) or analyte (ana) and Y is the analytical
response. All values should be obtained by means of multiple measurements, preferable three
or more. The analytes concentration can also be calculated out of the straight line through the
two standard points.
A particular type of the two-standard calibration is the so-called “bracketing calibration” [96,
103]. The basis of this strategy is to lower, as much as possible, the interval between the
standard concentrations used until the two calibrators “bracket” the analyte amount of the test
samples very closely. The calibrators, as well as the samples, should be analyzed at least in
duplicate. The method is of particular use when a high degree of accuracy is required, e.g. in
doping analysis but it demands a higher analysis time per sample [21].
When the concentration range is further and further downscaled, one standard calibration is
ultimately resulted in. The sample’s concentration can then be calculated as follows:
Xana = (Xst x Yana)/Y
The latter equation is only of value when the linearity of the method has been proven in
previous experiments and/or when the one-standard calibration is preceded by a concentration
st
Bio-analytical method validation - 29 -
estimation step so that a standard concentration very near to the one of the sample can be
selected. As such, it is stipulated that in the case that there is no previous evidence of the
linearity of the method, the samples’ analytical signal should be within ±10% of the analytical
signal generated by the calibration standard [21, 62]. When doing so, the method is related
with very high degrees of precision.
2.1.3 Calibration methodology
In most cases, calibration is performed using external calibrants, prepared and analysed
separately from the samples. In this sense, calibrants and samples form part of different
analytical preparations which are measured in a sequential way [21].
The most simple form is the pure external calibration (EC) in which the analyte itself in the
working solvent is used as external standard (ES). In the case of a linear concentration
response curve (y=ax+b), the concentration of the sample can then be calculated using the
equation: Xspl = (Yspl – B)/A, with Xspl the concentration of the sample (spl) and Y the
analytical response A and B are respectively the slope and intercept of the standard curve. The
intercept is hereby described by the method blank (Y0
). EC in working solvent, and thus not
sample matrix, is only advisable with samples in very simple matrices, e.g. water
contamination analysis.
When systematic errors appear in the quantitation method due to the presence of matrix
effects, caused by the influence of one or more undetected and unknown sample components
on the measurement of the analyte amount, it is not possible to perform external calibration in
the working solvent. It is better then to make use of “matrix matched calibration” (MMC)
because the matrix effect is variable and unpredictable in occurrence and therefore difficult to
Bio-analytical method validation - 30 -
eliminate, even with the use of extensive sample preparation procedures. The subject of
matrix effect in itself will, however, be further discussed in section 2.2. In MMC, the
calibration standards are prepared in a simulated sample that, if possible, does not contain any
analyte. For instance, during pharmacokinetic (PK) studies of a given drug in plasma (thus an
exogenous component), the calibration standards can also be made up in plasma. As such,
standards and samples are expected to suffer the same ME. The intercept is described by the
methods blank plus the matrix blank (Y0 + Ym
). For instance, an example of MMC can be
found in the chapter describing the quantitation of the exogenous drugs
pyrimethamine/sulfamethoxypyrazine and glycopyrrolate. In the case of e.g. the analysis of
endogenous components in human plasma, it is not possible to make calibration standards in
an analyte free environment (plasma). In such cases, calibration standards are made in the
presence of the analyte and hence, the intercept of the calibration function will be higher
owing to the analytical signal originating from the endogenous concentration.
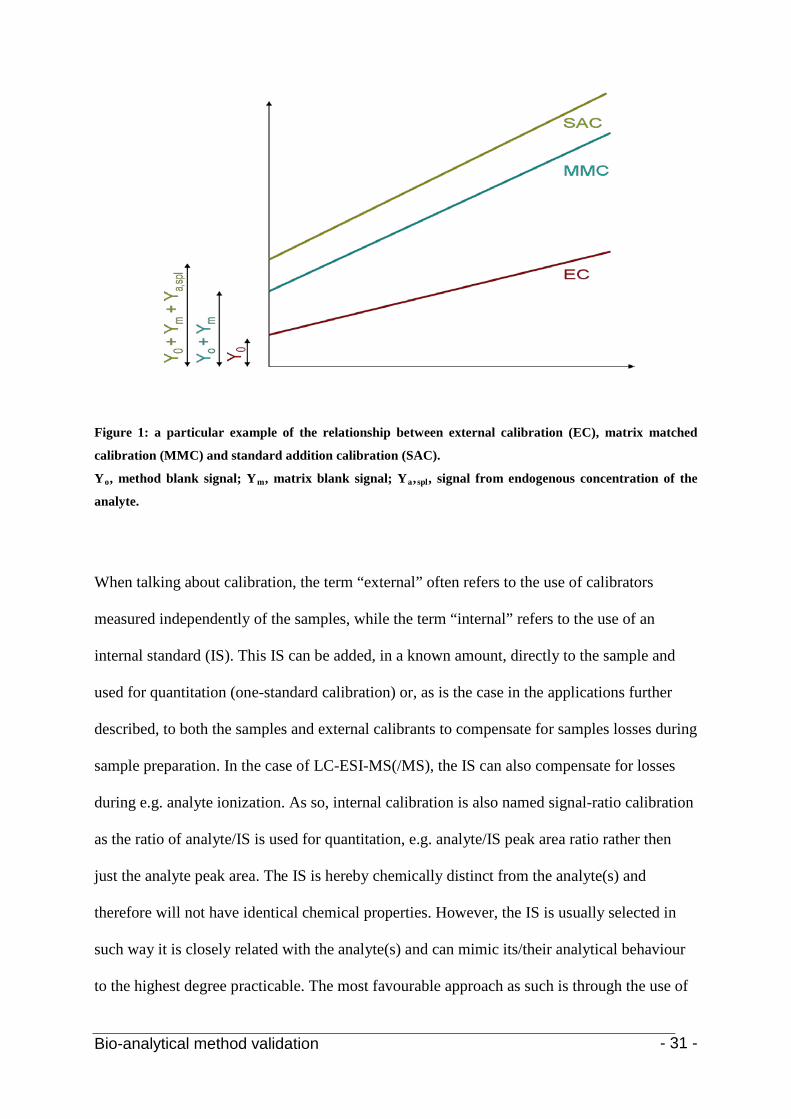
The ultimate form of MMC is “standard addition calibration” (SAC). The methodology is in
essence equal to MMC. Indeed, different standard concentrations are added to a sample
aliquot and used to compose a calibration function. This function will have the same slope but
a higher intercept. As so, the sample and the calibrators share the exact same matrix, as the
calibrators are made in a sample aliquot. This is only possible when larger amounts of sample
are present, e.g. in the case of water residue analysis. The differences between the different
approaches can be seen in Figure 1. As can be seen, ME has an effect on both the slope and
intercept of the method. The intercept is described by the methods blank, the matrix blank and
the blank of the endogenous component concentration (Y0 + Ym + Ya,spl).
Bio-analytical method validation - 31 -
Figure 1: a particular example of the relationship between external calibration (EC), matrix matched
calibration (MMC) and standard addition calibration (SAC).
Yo, method blank signal; Ym, matrix blank signal; Ya,spl
, signal from endogenous concentration of the
analyte.
When talking about calibration, the term “external” often refers to the use of calibrators
measured independently of the samples, while the term “internal” refers to the use of an
internal standard (IS). This IS can be added, in a known amount, directly to the sample and
used for quantitation (one-standard calibration) or, as is the case in the applications further
described, to both the samples and external calibrants to compensate for samples losses during
sample preparation. In the case of LC-ESI-MS(/MS), the IS can also compensate for losses
during e.g. analyte ionization. As so, internal calibration is also named signal-ratio calibration
as the ratio of analyte/IS is used for quantitation, e.g. analyte/IS peak area ratio rather then
just the analyte peak area. The IS is hereby chemically distinct from the analyte(s) and
therefore will not have identical chemical properties. However, the IS is usually selected in
such way it is closely related with the analyte(s) and can mimic its/their analytical behaviour
to the highest degree practicable. The most favourable approach as such is through the use of
Bio-analytical method validation - 32 -
an isotopically labelled IS, so the chemical properties of both the IS and the analyte are
virtually identical. In mass spectrometry, both can be measured independently from each
other. This principle forms the basis of isotope dilution mass spectrometry (IDMS). In the
case of multi-standard external calibration, the same IS concentration should be used in each
calibrator. Moreover, it is advisable to add the same IS in the same concentration to the
samples too [21]. In the case of linear calibration functions, y = ax + b; the analytical response
y is now defined as peak area ratio of ES/IS multiplied with the concentration of the internal
standard.
The methodology permits to make up for losses of analyte during sample preparation and, in a
moderate way, the matrix effect. The main disadvantage with internal calibration is the
requirement of an IS that reacts almost identically in the analytical system as the analyte. It is
hereby important that the quantity of IS added to the sample is carefully selected so that an
analytical signal response (peak area) is obtained in the same order of magnitude as the
analyte; otherwise, significant errors in quantitation are expected. This requires that there is a
certain knowledge of analyte concentration prior to the quantitation.
2.2 Matrix effect in regard to LC-MS(/MS) analysis
2.2.1 Absolute versus relative matrix effect
2.2.1.1 Absolute matrix effect
The phenomenon of matrix effects in (ESI-) mass spectrometry was first described by Kebarle
and Tang who stated that electrospray responses of organic bases decreased as the
concentrations of other organic bases were increased [41]. Until now, the exact mechanism of
it is unknown, but it probably originates, as already described, from the competition between
Bio-analytical method validation - 33 -
the analyte and co-eluting undetected matrix components in the formation of ions in the LC-
MS(/MS) interphase [64-66]. Indeed, to determine an analyte by LC-MS(/MS), the uncharged
molecules of this analyte need to be transformed to ions (in the gas phase) which can then be
analyzed by MS(/MS) according to their m/z ratios. As such, the LC-MS(/MS) interphase can
be considered as a “chemical reactor” in which primary ions react with analyte molecules in a
very complex series of charge-transfer and ion-transfer reactions [66]. King et al. were first to
prove this theory through a series of experiments. They found that matrix effect is indeed the
result of competition between non-volatile matrix components and analyte ions for access to
the droplet surface for transfer to the gas phase. The exact mechanism of the alteration of
analyte release into the gas phase was not figured out and remains until today unclear.
However, they postulate that “…a likely list of effects relating to the attractive force holding
the drop together and keeping smaller droplets from forming should account for a large
proportion of the ionization suppression with electrospray ionization” [28]. It is intuitively
clear that the efficiency of the formation of the desired ions must be very matrix-dependent
due to the competition between the molecule of interest and a number of other undetected but
co-eluting molecules present in the system that are capable of reacting with primary ions.
Depending on the environment in which the ionization and ion evaporation processes take
place, this competition may effectively decrease or increase the efficiency of the formation of
the desired analyte ions present [65]. When the analytical signal is enhanced, the term matrix
effect is often replaced by ionization enhancement. Likewise, when the analytical signal is
decreased, the term ionization suppression is used. Thus, the efficiency of the electrospray
process to ionize analytes is very dependent on the chemical environment the analyte is
located in at that precise moment.
Bio-analytical method validation - 34 -
The assumption that matrix effect is not only matrix related but also compound specific was
first proven by Bonfiglio et al. [64, 67]. In a study of four compounds of different polarities
under the same mass spectrometric conditions, the most polar compound was found to suffer
most from ion suppression. These findings have important repercussions, more particularly in
the selection of a suitable internal standard. For example, if a drug and a glucuronide
metabolite are simultaneously quantified using a chemically closely related analogue of the
parent drug (e.g. an isotopically labelled analogue), and matrix effects were found to be
dissimilar between different samples, then the change in ionization efficiency would probably
only be compensated by the internal standard for the parent drug and not for the more polar
metabolite. Not only is there the inherent different susceptibility to matrix effects due to the
different polarity, but additionally, differences in polarity will also lead to differences in
chromatographic behaviour and thus different retention times between analyte and internal
standard. Thus, generally spoken, if there are multiple analytes to be quantitated, there may be
requirements for multiple internal standards, especially with varying degrees of polarity [64].
In this regard, it was demonstrated that matrix-induced ion suppression is especially important
for early eluting compounds, while later eluting compounds are not affected as often [9]. In
reversed phase chromatography, the compounds eluting in the early stage of the
chromatographic separation, this means at low organic solvent composition, are the more
polar compounds.
With matrix effect being such an important issue, one has to question if ion suppression/
enhancement can also be the result of solvent additives and mobile phase components
(buffers) used in the chromatographic separation process. Although their influence on the
ionization process is a well-known phenomenon [29], their impact is relatively insignificant
when compared to ion suppression by the presence of endogenous material in biological

Bio-analytical method validation - 35 -
matrices [24, 27]. For the most commonly used mobile phase additives like e.g. FA, acetic
acid, TFA, etc., both ionization enhancement and suppression are nevertheless noticed [29].
2.2.1.2 Relative matrix effect
The reproducibility of a quantitative LC-ESI-MS(/MS) method is not only limited by the
absolute matrix effect but also by the presence of “relative” matrix effect [66]. The word
“relative” refers hereby to the comparison of matrix effect in different lots of matrix and is
thus related to inter-individual or inter-subject differences in matrix composition. As such,
when the absolute matrix affect is assessed, the experiments need to be performed in multiple
sets of matrix rather then in a single lot. In the case of human plasma, for example, at least 4
plasma pools originating from different persons should be used [65].
Relative matrix effect is of primary concern in quantitative bio-analysis since in everyday
practice, during method validation, the standard curve slopes are prepared in only one single
lot of bio-fluid. The resulting calibration curves are used next to determine the concentrations
of samples in that bio-fluid originating from different subjects/ patients, at various time points
after dosing (PK studies), and from different population pools. Different persons have a
different food state, different drug use and thus, the same fluid samples in a particular study,
originating from different persons, may contain different endogenous compounds that were
not present in the bio-fluid lot used during method validation. It is obvious that there is a
contradiction between the origin of the samples and the origin of the calibrators, used to
compose a calibration function. If the MS/MS response is affected by matrix effect, there is
no guarantee that this effect is similar in different pools and thus corresponding peak areas
may be erroneous. Therefore it is of critical importance to study, identify and, if possible,
eliminate the relative matrix effect in bio-analytical assay procedures [65-66].
Bio-analytical method validation - 36 -
2.2.2 The assessment of matrix effect (based on Matuszewski)
The two main techniques used to determine the degree of matrix effects of a HPLC-ESI-
MS(/MS) method are post-extraction addition and post-column infusion.
2.2.2.1 Post-extraction addition
2.2.2.1.1 Absolute matrix effect
This technique to evaluate matrix effect, thus the possibility of ionization suppression or
enhancement was first described by Matuszewski et al. and requires three sets of samples [65-
66] prepared as follows:
i. standards prepared by spiking an amount of analyte into neat mobile phase solvent. These
standards are referred to as “pure” standards.
ii. standards prepared by post-extraction spiking of analyte into the matrix. Thus, raw matrix
is exposed to the full sample preparation (extraction) procedure. The “clean” extract is
then spiked with the same amount of analyte as the pure standards. These standards are
referred to as “post” standards.
iii. standards prepared by spiking equal amounts of analyte into pure matrix, which is then
exposed to the full sample preparation (extraction) procedure. These standards are referred
to as “pre” standards.
The use of these three sets of samples allows not only the determination of the matrix effect
(ME) but also of the recovery (RE) of the extraction procedure, and the overall “process
efficiency” (PE) by comparing the absolute peak areas, thus not divided by the internal
standard peak area. Typically, during method validation experiments, the latter values are
determined at the different quality control concentrations levels (cfr. infra). In doing so, the
Bio-analytical method validation - 37 -
total number of samples needed for validation is dramatically diminished (3 QC concentration
levels versus 6 to 8 calibrator concentration levels). Nevertheless, some sources advocate to
evaluating the ME at the lowest calibrator level too.
Buhrman et al. [27] originally introduced the terms “process efficiency”, “extraction
efficiency” and “ion suppression”. As such, ion suppression was calculated as (100 –
(post/pure x 100)) and the potential for ion enhancement was not considered. The term
“matrix effect” covering both ion suppression and ion enhancement, was not yet in use. To
account for both, and to avoid negative values in the case of ion enhancement, the ratio
(post/pure x 100 (eq1)) was defined by Matuszewski et al. as ME [65].
The ME calculated in this manner (eq1) may be referred to as “absolute” matrix effect since
the signal response of the standard, present in the plasma extract, is compared to the response
of a standard made directly in a neat mobile phase not contaminated with compounds
extracted from a bio-fluid [65,66]. A value of 100% indicates that the peak areas in the neat
mobile phase are equal to the ones in bio-fluid extracts and no matrix effect is observed. A
value of >100% indicates ionization enhancement. Consequently, a value <100% indicates
ionization suppression.
2.2.2.1.2 Relative matrix effect
Although the absence of this absolute matrix effect is an important desire in method
validation, the more important parameter to be controlled during method development is the
presence of a “relative” matrix effect. As such, the term relative refers to the comparison of
ME values between different lots (sources) of bio-fluids [65]. As already described, samples
originating from different persons may have a slightly different matrix composition. In the
Bio-analytical method validation - 38 -
case of plasma, for one, different persons have a different eating habit, use different kind of
drugs, etc. Possibly, these inter-individual differences in matrix composition can interfere
with the analytical method. For instance, they can co-elute with the analyte of interest and
affect the efficiency of the ionization process leading to a person-related decrease or increase
in MS response. Therefore, it is critical to eliminate this kind of matrix effect to generate
reliable results [68].
Obviously, it is mostly impossible to generate calibration curves and quality control samples
for a given analyte in exactly the same matrix. This is not only caused by inter-individual
differences but also by e.g. different metabolites present in PK samples from different time-
points [66]. Moreover, Mei et al. [44] have shown that not all sources of relative matrix effect
can be linked to endogenous compounds but may originate from the used specimen
containers, preservatives, type of anticoagulant (plasma), etc. In this perspective, the use of
various bio-fluids from different sources or subjects, instead of only a single lot, may
considerably increase the probability of the method to be much more reliable. In the matrix
effect evaluation methodology proposed by Matuszewski et al. [65-66], five different sources
of bio-fluids are suggested to compensate sufficiently for these variations. This, however, in
view of a method developed for long-term bio-analytical support optimized to be used for the
analysis of hundreds or even thousands of different subjects with a widely different molecular
content of their plasma, urine, etc. In contrast, our existing laboratory standard procedures
always made use of four different pools. Until now, no real experimental evidence exists
about the exact numbers of plasma pools o be used [68].
The assessment of the presence of a relative matrix effect can be performed by comparison of
the peak area ratio of analyte to IS of an analyte spiked into extracts (post) originating from
Bio-analytical method validation - 39 -
different lots of bio-fluids. The variability in peak area ratio’s, expressed as CV% is then a
measure of the relative matrix effect. However, a significant part of this variability can be
caused by the analytical apparatus. Relative matrix effect is only present if the CV%post are
significantly higher then the CV% of the corresponding peak area ratio’s of analyte to IS in
pure eluent (CV% post >> CV% pure
). In the case of relative matrix effect, calculations should
take into account the presence of an IS and thus peak area ratio’s are used. This, in contrast
with absolute matrix effect, calculated on analyte peak areas, not corrected by the IS. This is
based on the fact that the IS, especially when co-eluting with the analyte, may be exhibiting
the same relative matrix effect profile. In that case, the IS largely nullifies the effect (which,
overall, is of course desirable and the reason why isotopically labelled internal standards are
preferred to decrease the risk of relative matrix effects). The evaluation of calibration curve
slopes produced in different bio-fluid subsets may act as an alternative approach to
unequivocally eliminate the relative matrix effect uncertainty. Matuszewski et al. were the
first to describe a relationship between the precision, as coefficient of variation (CV%), of
calibration curve slopes constructed in different lots of bio-fluid and the reliability
determination of the concentration measurement of an analyte in that particular bio-fluid [65-
66].
Accordingly, Matuszewski et al. investigated 52 analytical methods developed earlier by their
group by comparison of five calibration curve slopes obtained in five different lots of bio-
fluid to five calibration curve slopes obtained in one single lot of bio-fluid. They found that
the possibility of relative matrix effect can only be excluded if the coefficient of variation of
the calibration curve slopes between multiple sources of bio-fluid is not significantly higher
then the ones originating from a single bio-fluid. For a method being reliable for e.g. use in
PK studies, these values need to be in the recommended range of <3-4%. Indeed, for instance,

Bio-analytical method validation - 40 -
a difference in slope value of 14% (5 different lots of bio-fluid), and 2% in a single lot of bio-
fluid, indicates that due to a relative matrix effect, the concentration of the analyte in one lot
(for example lot "a") can be 12% higher/lower then in a different lot (lot"b"), for example in
which the calibration curve was constructed, even if the concentration of an analyte in both
lots was the same. Such a difference may already be of important significance in the overall
PK-evaluation of a drug (drug interaction studies, formulation comparison, etc.) [65-66].
2.2.2.2 Post-column infusion
The post-extraction addition technique can be considered as a static technique that only
provides information about matrix effects at the point of elution of the analyte of interest. This
in contrast to the post-column infusion procedure, developed by Bonfiglio et al. [1, 67] which
provides information of the matrix effect over the entire time-frame of the analytical run.
However, the latter method only provides a qualitative impression of the matrix effect while
the Matuszewski et al. approach is quantitative in nature.
As so, an extra infusion pump is used to deliver a constant flow of LC eluent in which the
analyte to be measured is dissolved. This analyte solution flow is then post-column coupled
by a T-piece in between the analytical column and the mass spectrometer ionization source
(see Figure 2). A blank extract, this is with no analyte spiked in it, is injected under the
desired chromatographic conditions and the MS response of the infused analyte is recorded
during the total analytical run [64, 67]. With no matrix effect present, the analytical response
Figure 2:
schematic overview of a post-column infusion experiment for the
assessment of ME.
Bio-analytical method validation - 41 -
for the analyte is constant. Following, when the response is increased, ionization enhancement
is noticed and vice versa. Thus, any possible endogenous component that elutes from the
column and causes a variation in ESI-MS response of the post-column infused analyte is
noticed. In addition, the post-column infusion experiments provide information on when the
interference happens and how long it takes [67].
However, it should be stated that using post-column infusion experiments, the degree of
matrix effect can only be put in figures by an intensity decrease or increase and thus no real
calculations take place to express the level of matrix effect. Post-column infusion data rather
confirms the presence or absence of matrix effect and aids in minimising their influence on
the results but the data do not provide evidence that a validated analytical method is
acceptable in terms of these effects. The analysis of matrix effect by post-column infusion
rather allows the comparison of different extraction techniques in a limited amount of time. It
is in that perspective that the infusion experiment is mostly compared to the same experiment
with neat mobile phase injected [67]. The biggest advantage of the technique is that it
provides data over the entire length of the chromatographic run and is therefore especially
useful when a variety of compounds is analyzed in a single run.
As an example, Figure 3 shows a comparison of an injection of (A) mobile phase, (B) a whole
blood sample prepared by protein precipitation, and (C) a whole blood sample prepared by
solid phase extraction. The analyte post-column infused (10 µg/mL) was sirolimus (50
µg/mL), an immunosuppressant drug, and was used in a study by Taylor and Johnson [64]. As
such, sirolimus was monitored by multiple reaction monitoring (MRM) using the following
mass transition: m/z 931.6864.6.The retention time window was 6 min. As can be deduced
out of the figure, the sirolimus signal was suppressed during a substantial time section of the
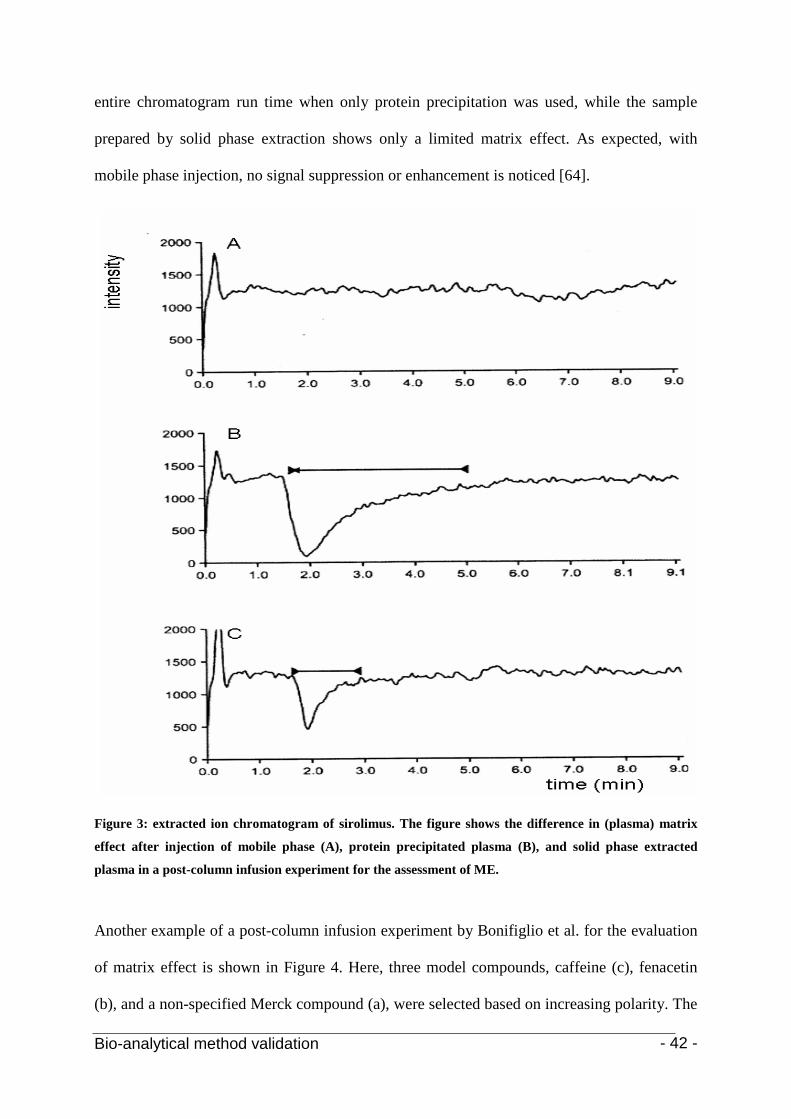
Bio-analytical method validation - 42 -
entire chromatogram run time when only protein precipitation was used, while the sample
prepared by solid phase extraction shows only a limited matrix effect. As expected, with
mobile phase injection, no signal suppression or enhancement is noticed [64].
Figure 3: extracted ion chromatogram of sirolimus. The figure shows the difference in (plasma) matrix
effect after injection of mobile phase (A), protein precipitated plasma (B), and solid phase extracted
plasma in a post-column infusion experiment for the assessment of ME.
Another example of a post-column infusion experiment by Bonifiglio et al. for the evaluation
of matrix effect is shown in Figure 4. Here, three model compounds, caffeine (c), fenacetin
(b), and a non-specified Merck compound (a), were selected based on increasing polarity. The
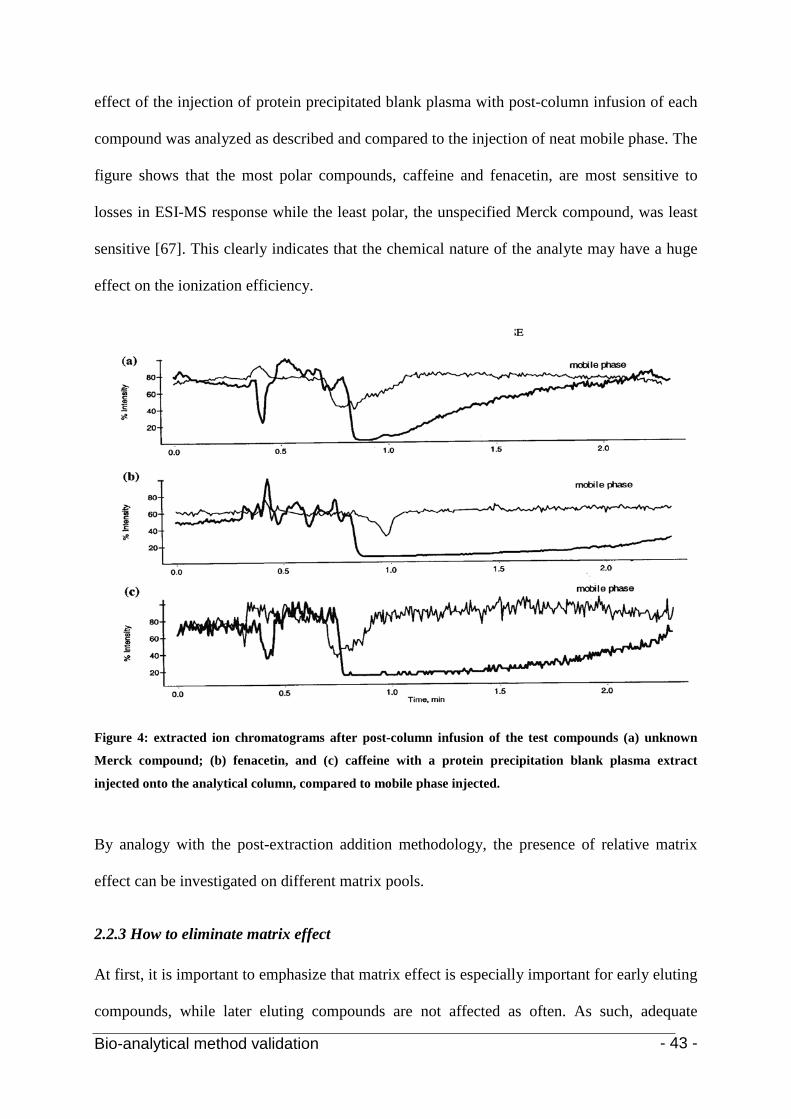
Bio-analytical method validation - 43 -
effect of the injection of protein precipitated blank plasma with post-column infusion of each
compound was analyzed as described and compared to the injection of neat mobile phase. The
figure shows that the most polar compounds, caffeine and fenacetin, are most sensitive to
losses in ESI-MS response while the least polar, the unspecified Merck compound, was least
sensitive [67]. This clearly indicates that the chemical nature of the analyte may have a huge
effect on the ionization efficiency.
Figure 4: extracted ion chromatograms after post-column infusion of the test compounds (a) unknown
Merck compound; (b) fenacetin, and (c) caffeine with a protein precipitation blank plasma extract
injected onto the analytical column, compared to mobile phase injected.
By analogy with the post-extraction addition methodology, the presence of relative matrix
effect can be investigated on different matrix pools.
2.2.3 How to eliminate matrix effect
At first, it is important to emphasize that matrix effect is especially important for early eluting
compounds, while later eluting compounds are not affected as often. As such, adequate
Bio-analytical method validation - 44 -
chromatographic retention is mandatory and can diminish the matrix effect in a simple way
[9]. Moreover, the chromatographic conditions can further decrease the matrix effect by
separation of the analyte from undetected endogenous constituents responsible for the effect.
Also the evaluation of different extraction procedures in their capability of eliminating
undetected matrix interferences is essential [65, 66]. All of these strategies can be summarized
as a reduction of the amount of matrix components entering the LC-MS interphase at the
same time of the analyte. Their optimization may, however, be time-consuming and the risk
of analyte losses or sample contamination increases with each additional clean-up step. Also,
improved chromatographic separation is often associated with longer analysis times, leading
to broader peaks and decreasing sensitivities [69-74].
Decreasing the amount of injected sample (e.g. by sample dilution) is another possibility to
lower the amount of plasma effect but is undeniably associated with decreasing sensitivities
and thus only applicable when sensitivity is not an issue [71].
The best way to eliminate the influence of matrix effect on an analytical method is, however,
through the use of appropriate calibration techniques in combination with the use of adequate
internal standardization [70, 75, 76]. As such, the most suitable internal standard to be used is
a stable isotopically labelled internal standard. It is important to add such an IS at the
beginning of the analytical method prior to sample pre-treatment. In that way, it can correct
for analyte losses during sample pre-treatment as well as matrix-related suppression or
enhancement during analyte ionization [9]. Although it is generally accepted that the use of an
isotopically labelled internal standard corrects for almost all matrix effects, the opposite is,
albeit exceptional, also demonstrated. For instance, in a study by Jemal et al. for the
quantitation of mevalonic acid in urine and human plasma, the use of a hepta-deuterated

Bio-analytical method validation - 45 -
analogue as IS, could not prevent that in certain batches of urine samples, when a large
sample volume is used during analysis, a high degree of matrix effect was noticed which
resulted not only in the attenuation of the absolute response (mevalonic acid peak area), but
also in a change of analyte/IS peak area ratio. This proves that, under certain conditions, the
use of a stable isotope labelled internal standard does not, contrary to conventional thinking,
guarantee the constancy of the analyte/internal response ratio, which is a prerequisite for a
rugged bio-analytical method [11]. In addition, there are a number of analytical issues
connected with the use of labelled IS in bio-analysis. These include problems with the
isotopic purity of the standards, “cross-contamination” or “cross-talk” between MS/MS
channels used for monitoring the drug and IS, isotopic integrity of the label in biological fluid
and during sample processing (stability of the isotopic label by absence of isotope exchange),
etc. These issues need to be carefully addressed and require separate studies [77]. Moreover,
limited availability and high costs have hampered the wide application of labelled internal
standards [9]. This, also taken into account that enough isotopic labels are needed for a
sufficient delta mass between the analyte and the IS.
2.3 Other validation parameters
The aforementioned issues of ME and (linear) calibration are of the most important aspects to
inquire in method validation. Notwithstanding the fact that evaluation of these issues is of
utmost importance, their evaluation on itself is insufficient to accept a bio-analytical method
for large-scale use. Other validation criteria are needed to serve this goal. As such, different
validation parameters and acceptance criteria have been formulated in the past. In this work,
the proposed analytical methods, some of them used during pharmacokinetic investigations,
were all optimized and validated according to the “Bio-analytical method Validation
Guidance for Industry” as developed by the US food and drug administration (FDA) [20]. In
Bio-analytical method validation - 46 -
doing so, the basic criteria to be assessed are accuracy, precision, selectivity, sensitivity,
reproducibility, and stability. During method development, these parameters can be
investigated, one following the other, as follows: (i) first, calibration (cfr. supra) (ii) second,
accuracy, precision, sensitivity, selectivity, and ME/recovery, (iii) third, stability of the
analyte standards in the matrix, but also under the preservation conditions used. The
definitions used for these parameters are also according to the FDA Guidance for Industry.
2.3.1 Accuracy
The (in)accuracy of a method describes the closeness of mean test results obtained by the
method to the true value (concentration) of the analyte. As such, (in)accuracy must be
determined by replicate analysis of samples containing known amounts of the analyte. The
mean value should be within 15%, except at the lower limit of quantitation (LLOQ), where it
should not deviate by more than 20%. In literature, the terms accuracy and inaccuracy are
often used interchanged. In this document, the accuracy is defined as [(100 + ((concentration
measured – concentration added)/concentration added) x 100)] where the equation
((concentration measured – concentration added)/concentration added) x 100) is defined as
the inaccuracy; hence, accuracy is equal to 100 + the inaccuracy.
2.3.2 Precision
The precision of an analytical method describes the closeness of individual measures of
multiple analyses of a single concentration level. Again, a minimum of 3 analyses per
concentration level in the desired analytical range is recommended and the result should not
exceed 15% (20% at the LLOQ) in terms of the coefficient of variation. In terms of precision,
the concepts of reproducibility and repeatability are also often encountered. Repeatability
refers to precision under relatively standardized conditions (same, instrument, same operator,
Bio-analytical method validation - 47 -
limited time frame, etc.) while reproducibility is broader, e.g. over a wide period of time, in
different laboratories, thus different instruments, operators, etc.).
2.3.3 Sensitivity
As already described, a method’s sensitivity is described by the LLOQ. Several guidelines, as
also the one of the US FDA, suggest that also the, in our opinion less informative, lower limit
of detection (LLOD) should be assessed. As so, the LLOD is defined as the lowest
concentration that can be measured with a S/N ratio of minimal 3 and can be calculated out of
the standard variation on the intercept of the calibration curves (y = ax + b) by the following
formula: LLOD = (3 * SDb
)/a; with a the mean slope of the different calibration functions and
b the mean intercept.
2.3.4 Selectivity
Selectivity is the ability of an analytical method to differentiate and quantify the analyte in the
presence of other components in the sample. As such, selectivity measures the “trueness” of
the detection signal and describes the plausibility that the MS(/MS) signal is not only
produced by the component of interest but also by other components. In LC-MS(/MS)
analysis, selectivity is only compromized if the interfering component, e.g. in the case of
drug-isomers in pharmacokinetic analysis, has the same characteristic precursor and product
ions and has a similar chromatographic retention behaviour [78, 79].
A methods’ selectivity can most easily be investigated by the analysis of blank samples in the
proposed matrix, obtained from at least six sources. Selectivity can then be ensured by the
absence of analytical signal (compared to the signal obtained at the lower limit of quantitation
Bio-analytical method validation - 48 -
(LLOQ)). The demand to use different matrix pools indicates that ME can be of some
influence on the selectivity.
If the selectivity seems compromized, further investigation whether the analytical (MS(/MS))
signal is affected by interferences or not, can be performed by monitoring the relative product
ion ratio’s (to the precursor ion). If these ratios are not constant, the method is likely to suffer
from a severe lack of selectivity [80]. If the collision induced fragmentation (CID) only
generates one dominant transition, selectivity can sometimes also alternatively be checked by
the analysis of isotopic ions, e.g. when chlorine, bromine or sulphur atoms are present.
Another way is to monitor the same transition at different collision energies. Despite the fact
that also other molecules can produce the same precursor/product ion, it is unlikely that the
ratio of intensities of the transitions obtained at different fragmentation conditions would be
the same among the analyte and interfering component(s) [78]. However, the simplest
approach is probably to compare the product ion ratios of the sample with product ion ratio’s
of “pure” standards.
In literature, the terms selectivity and specificity are often mixed together and there is some
controversy whether selectivity or specificity should be used. The International Union of Pure
and Applied Chemistry (IUPAC) recommends that the term specificity should be discouraged
in favour of selectivity, as it is incorrect, and that specificity can actual be seen as an ultimate
degree of selectivity. Indeed, the term specificity suggests that no component different from
the analyte contributes to the analytical signal. This is almost never the case [22].

Bio-analytical method validation - 49 -
2.3.5 Recovery
The recovery of an analyte in an assay is the detector response obtained from an amount of
the analyte added to and extracted from the biological matrix, compared to the detector
response obtained for the same amount of pure authentic standard. Consequently, based on
the three sample sets (“pre”, “post”, and “pure”) used for the evaluation of the ME in LC-
MS(/MS) based methods (car. supra), the recovery of a compound from a bio-fluid can be
assessed and is defined as the absolute peak area of the analyte spiked into the matrix bio-
fluid, extracted, reconstituted in mobile phase solvent and injected, to the absolute peak area
of the same amount of analyte spiked directly in the mobile phase. Thus, using the
aforementioned sample sets, the recovery can be described by the equation pre/pure x 100
(eq3).
However, the recovery calculated in this way can not be considered as a “true” value for the
extraction efficiency since it does take into account the influence of the matrix effect on the
pre to pure peak area ratio. Indeed, in literature, recovery values over 100% are often
reported. By definition, it is impossible that a compounds’ concentration increases during
extraction and the MS/MS signal is thus influenced by other components. In this perspective,
it is better to describe the “absolute (true) recovery” or “absolute (true) extraction efficiency”
by the peak area ratio of standards spiked in bio-fluid before extraction to standards spiked in
bio-fluid after the extraction process (pre/post x 100 (eq2)). The value pre/pure x 100 (eq3)
can instead be seen as the overall process efficiency describing both matrix effect and
recovery (extraction efficiency) [65, 66]. The recovery of the analyte does not require to be
100%, but the extent, and by extension also of its IS, should be consistent, precise, and
reproducible [20].
Bio-analytical method validation - 50 -
Thus, based also on the specifications described in section 3.2, matrix effect (ME), recovery
(RE) and process efficiency (PE) can be calculated using three sample sets (“post”, “pre” and
“pure”) by the following equations:
(eq1) ME% = post/pure x 100
(eq2) RE% = pre/post x 100
(eq3) PE% = pre/pure x 100 = (post/pure (ME) x pre/post (RE))
During method evaluation, typically, these calculations are not performed on all the standard
calibrator concentrations but only at 2, or mostly 3, quality control (QC) concentration levels:
(i) one within 3 times the LLOQ, (ii) one near the centre of the analytical range, and (iii) one
near the upper boundary of the concentration interval. The QC concentrations are chosen
independently of the calibrator concentrations and are spread over the concentration interval
of the calibration curve [65, 66].
2.3.6 Stability
Analyte stability in a biological fluid is a function of the storage conditions and the chemical
properties of the analyte. The stability should hereby be determined during sample collection
and handling, after short (benchtop) and long-term storage, and after going through different
freeze and thaw cycles. Of course, these stability tests should be performed under conditions
likely to be encountered during actual sample handling [20]. Stability studies are of prime
importance for new chemical entities for which this kind of information is absolutely
unknown. However, for already well described compounds, stability information data is often
known. Unless very different preservation conditions or chemical environments are
introduced by the new method, stability is often less of an issue in these cases. A limited
stability evaluation is often sufficient. In the further on described applications, stability is only
Bio-analytical method validation - 51 -
investigated by the use of at least 6 different calibration curves, measured on different days,
all using the same calibration concentration solutions.
Bio-analytical method validation - 52 -
1. R. Dams, M.A. Huestis, W.E. Lambert, and C.M. Murphy, J. Am. Soc. Mass Spectrom., 2003 (14): p.1290
3. References
2. A.M. Krstulovic, C.R. Lee, S. Firmin, G. Jacquet, C.N. Van Dau, and D. Tessier, LC-GC Europe, 2002 (15): p.31
3. J. Simal-Gandara, A.P. Damant, and L. Castle, Crit. Rev. Anal. Chem., 2002 (32): p.47 4. P. Marquet, Therapeut. Drug Monit., 2002 (24): p.255 5. R. Thomas, Spectroscopy, 2001 (16) : p.28 6. E. Hogendoorn, and P. Van Zoonen, J. Chromatogr. A, 2000 (892): p.435 7. A.P. Bruins, J. Chromatogr. A, 1998 (794): p.345 8. B.A. Thomson, L. Danylewychmay, and J.D. Henion, Am. Chem. Soc., 1983 (186): p.19 9. R. Naxing Xu, L. Fan, M.J. Rieser, and T.A. El-Shourbagy, J Pharm Biomed Anal, 2007
(44): p.342 10. P.J. Larger, M. Breda, D. Fraier, H. Hughes, and C.A. James, J Pharm Biomed Anal, 2005
(39): p.206 11. M. Jemal, A. Schuster, and D.B. Whigan, Rapid Commun Mass Spectrom., 2003 (17):
p.1723 12. S. Souverain, S. Rudaz, and J.L. Veuthey, J. Chrometogr. A, 2004 (1058) : p.61 13. J. Abian, J. Mass Spectrom., 1999 (34): p.157 14. P. Marquet, and G. Lachâtre, J. Chromatogr. B, 1999 (733): p.93 15. W.M.A. Niessen, and A.P. Tinke, J. Chromatogr. A, 1995 (703) : p.37 16. W.M.A. Niessen, J. Chromatogr. A, 1998 (794): p.407 17. C.K. Lim, and G. Lord, Biol. Pharm. Bull., 2002 (25): p.547 18. H.H. Maurer, J. Chromatogr. B, 1998 (713): p.3 19. V.P. Shah, K.K. Midha, J.W.A. Findlay, H.M. Hill, J.D. Hulse, I.J. McGilveray, et al.,
Pharmaceutical Research, 2000 (17): p.1551 20. Guidance for Industry: Bio-analytical Method Validation,US FDA, 2001 21. L. Cuadros-Rodriguez, M. Gracia Bagur-Gonzalez, M. Sanchez-Viñaz, A. Gonzalez-
Casado, and A.M. Gomez-Saez, J. Chromatogr. A, 2007 (1158): p.33 22. J. Vessman, R.I. Stefan, J.F. Van Staden, K. Danzer, W. Lindner, D.T. Burns, A. Fajgelj,
and H. Muller, Selectivity in Analytical Chemistry, Rocommendations for its use, IUPAC congress, 2001
23. K. Danzer, and L.A. Currie, Pure Appl. Chem, 1998 (70): p.993 24. J.X. Shen, R.J. Motyka, J.P. Roach, and N. Hayes, J Pharm Biomed Anal, 2005 (37):
p.359 25. B.K. Matuszewski, M.L. Constanzer, and C.M. Chavez-Eng, Anal. Chem., 1998 (70):
p.882 26. M.J. Avery, Rapid Commun. Mass Spectrom., 2003 (17), p.197 27. D.L. Buhrmann, P.I. Price, and P.J.Rudewicz, J. Am. Soc. Mass Spectrom., 1996 (7);
p.1099 28. R. King, R. Bonfiglio, C. Fernandez-Metzler, C. Miller-stein, and T. Olah, J. Am. Soc.
Mass Spectrom., 2000 (11): p.942 29. T. Benijts, R. Dams, W. Lambert, and A. De Leenheer, J. Chromatogr. A, 2004 (1029):
p.153 30. P.R. Tiller, and L.A. Romanyshyn, Rapid Commun. Mass Spectrom., 2002 (16): p.92 31. J. Smeraglia, S.F. Baldrey, and D. Watson, Chromatographia, 2002 (55): p.95 32. I. Fu, E.J. Woolf, and B.K. Matiszewski, J. Pharm. Biomed. Anal., 1998 (18): p.347
Bio-analytical method validation - 53 -
33. S. Bogialli, R. Curini, A. Di Corcia, M. Nazarri, and M. Sergi, Rapid Commun. Mass Spectrom., 2003 (17) : p.1146
34. S. Riediker, and R.H. Stadler, Anal. Chem., 2001 (73): p.1614 35. T.L. Constantopoulos, G.S. Jackson, and C.G. Enke, J. Am. Soc. Mass Spectrom., 1999
(10): p.625 36. S. Bogialli, R. Curini, A. Di Corcia, M. Nazarri, and M. Sergi, Anal. Chem., 2003 (75) :
p.1798 37. J.J. Zheng, E.D. Lynch, and S.E. Unger, J. Pharm. Biomed. Anal., 2002 (28): p.279 38. C. Muller, P. Schafer, M. Stortzel, S. Vogt, W. Weinmann, J. Chromatogr. B, 2002 (773):
p.47 39. M.D. Nelson, and J.W. Dolan, LC-GC, 2002 (20): p.24 40. Y. Hsieh, G. Wang, S. Chackalamannil, J.M. Brisson, K. Ng and W.A. Korfmacher,
Rapid Commun. Mass Spectrom., 2002 (16): p.944 41. L. Tang, and P. Kebarle, Anal. Chem., 1991 (63): p.2709 42. W.Z. Shou, and W. Naidong, Rapid Commun. Mass Spectrom., 2003 (17): p.589 43. R. King, A. Barrisch, R. Bonfiglio, D. McLoughlin, K. erkle, C. Miller-Stein, and T. Olah,
Proc. 46th
44. H. Mei, Y. Hsieh, C. Nardo, X. Xu, S. Wang, N. Ng, and W.A. Korfmacher, Rapid Commun Mass Spectrom., 2003 (17): p.97
ASMS Conference on Mass Spectrometry and Allied Topics, Orlando, FL (USA), 1998
45. J.L. Little, M.F. Wempe, and C.M. Buchanan, J. Chromatogr. B, 2006 (833): p.219 46. S. Zhou, Q. Song, Y. Tang, and W. Naidong, Curr. Pharm. Anal., 2005: p.3 47. M. Ahnoff, and H. Hagelin, Proc. 52th
48. P.K. Bennett, and K.C. Van Horne, Proc. ASPS Conference, Salt Lake City, UT (USA), 2003
ASMS Conference on Mass Spectrometry and Allied Topics, Nashville, TN (USA), 2004
49. S. Hua, and N. Weng, Pharm. Technol., 2003: p.74 50. C. Polson, P. Sarkar; B. Incledon, V. Ragyvaran, and R. Grant, J. Chromatogr. B, 2003
(785): p.263 51. K.J.P. Antigua, F. de Wasch, H. Monteau, F. De Brabander, B. Andre, and Le Bizec,
Anal. Cim. Acta, 2005 (529) : p.129 52. L. Cuadroz-Rodriguez, L. Gamiz Gracia, E. Almansa Lopez, and J.M. Bosque Sendra,
Trends Anal. Chem., 2001 (20): p.620 53. ISO 8466, International Organization for Standardization, Geneva (CH), 1990/1993 54. ISO 11095, International Organization for Standardization, Geneva (CH), 1992 55. LGC/VAM/2003/032, Laboratory of the Government Chemist (LGC), Cambridge (UK),
2003 56. J.N. Miller, Analyst, 1991 (116): p.3 57. D.L. MacTaggar, and S.O. Farwell, J AOAC Int., 1992 (75): p.594 58. K. Baumann, and H. Waetzig, Proc. Cont. Qual., 1997 (10): p.59 59. K. Baumann, Proc. Cont. Qual., 1997 (10): p.75 60. R. de Levie, Crit. Rev. Anal. Chem, 2000 (30) : p.59 61. M. Thompson, S.L.R. Ellison, and R. Wood, IUPAC Technical report ,Pure Appl. Chem.,
2002 (74): p.835 62. Document SANCO/10232/2006: Quality control procedures for pesticide residue analysis,
Brussels (EU), 2006 63. G. Zenkevitch, and E.D. Makarov, J. Cromatogr. A, 2007 (1150): p.117 64. P.J. Taylor, Clin. Biochem., 2005 (4): p.328 65. B.K. Matuszewski, M.L. Constanzer, and C.M. Chavez-Eng, Anal. Chem., 2003 (75):
p.3019
Bio-analytical method validation - 54 -
66. B.K. Matuszewski, J. Chromtogr. B, 2006 (830): p.293 67. R. Bonfiglio, R.C. King, T.V. Olah, and K. Merkle, Rapid Commun. Mass Spectrom.,
1999 (13): p.1175 68. P.J. Taylor, Roundtable, 9th
69. M. Stüber, and T. Reemtsma, Anal. Bioanal. Chem., 2004 (378): p.910
Congress of TDM and Clinical Toxicology, Louisville, KN (USA), 2005
70. B.K. Choi, A.I. Gusev, and D.M. Hercules, Anal. Chem., 1999 (71): p.4107 71. B.K. Choi, D.M. Hercules, and A.I. Gusev, J. Chromatogr. A, 2001 (907): p.337 72. B.K. Choi, D.M. Hercules, A.I. Gusev, and J. Fresenius, Anal. Chem., 2001 (369): p.370 73. R. Pascoe, J.P. Foley, and A.I. Gusev, Anal. Chem., 2001 (73): p.6014 74. E. Dijkman, D. Mooibroek, R. Hoogerbrugge, E. Hogendoorn, J-V Sancho, O. Pozo, and
F. Hernandez, J. Chromatogr. A, 2001 (926): p.113 75. T. Reemtsma, Trends Anal. Chem., 2001 (20): p.533 76. S. Ito, and K. Tsukada, J. Chromatogr. A, 2001 (943): p.39 77. C.M. Chavez-Eng, M.L. Constanzer, and B.K. Matuszewski, J. Cromatogr. B, 2002
(767): p.117 78. M.M. Kushnir, A.L. Rockwood, G.J. Nelson, B. Yue, and F.M. Urry, Clin. Biochem.,
2005 (38): p.319 79. T.M. Annesly, Clin. Chem., 2003 (49): p.1041 80. J.A. Sphone, J. AOAC, 1987 (61): p.124

Bio-analytical method validation - 55 -

Small molecular mass substances - 57 -
Small Molecular Mass substances:
applications in pharmacokinetic studies

Small molecular mass substances
- 58 -
Small molecular mass substances: pyrimethamine and sulfamethoxypyrazine - 59 -
Chapter 1
The simultaneous quantitative analysis of the antimalarials pyrimethamine and
sulfamethoxypyrazine in plasma samples
Published as:
Simultaneous quantitative analysis of the antimalarials pyrimethamine and sulfamethoxypyrazine in plasma
samples using Liquid Chromatography Tandem Mass Spectrometry.
M.L. Storme, F.H. Jansen, W. Goeteyn, and J.F. Van Bocxlaer
Rapid Communications in Mass Spectrometry, 2006 (20(19)): p. 2947

Small molecular mass substances: pyrimethamine and sulfamethoxypyrazine - 60 -
The work presented here deals with the development of a quantitative tool for the
simultaneous determination of sulfamethoxypyrazine (sulfalene)/pyrimethamine in plasma.
The chromatography used only takes 12.5 minutes, allowing a fast sample turnover time.
Relative standard deviation of retention times was never above 3.482% (n=66). Adequate
sample clean-up was achieved by a simple and relatively fast liquid liquid extraction. In this
way, ionization suppression effects, typical for more simple sample clean-up procedures,
could be largely avoided. For both pyrimethamine and sulfalene, quadratic calibration curves
from 0.00101 to 0.807 µg/mL for pyrimethamine and from 0.271 to 216 µg/mL for sulfalene
gave the best fit. Mean coefficients of determination (R2) were 0.9951 (n = 6, CV% 0.3952)
for pyrimethamine and 0.9942 (n = 6, CV% 0.1312) for sulfalene. Precision was below
9.352% for pyrimethamine and 13.95% for sulfalene. Inaccuracy remained below 15% at all
cases. The optimized method was used for a time-course study of the sulfalene/ pyrimethamine
combination concentration in plasma of patients treated with Co-arinate®, a new curative
antimalaria-medicine.
Small molecular mass substances: pyrimethamine and sulfamethoxypyrazine - 61 -
.

Small molecular mass substances: pyrimethamine and sulfamethoxypyrazine - 62 -
The emergence of Plasmodium falciparum resistance to many antimalarial drugs (e.g.
chloroquine) is becoming a severe problem all over the world, especially on the African
continent [1]. Consequently, the use of chloroquine as the first-line drug for the treatment of
uncomplicated malaria in Western-Africa is now very compromized [2]. At present,
alternative formulations based on sulfonamide antibacterials like sulfadoxine (Sd) or,
sulfamethoxypyrazine, also known as sulfalene (Sl), in combination with the dihydrofolate
reductase inhibitor pyrimethamine (Pm), become more and more important [3]. In 1998, the
sulfadoxine/Pyrimethamine (Sd/Pm) combination has replaced chloroquine as first line drug
for the treatment of uncomplicated malaria in Kenya, soon followed by other countries [4, 5].
Several other formulations in the struggle against malaria are now used in actual practice, of
which the artemisinins are the most promising [5].
1. Introduction
A new curative antimalaria-medicine, Co-arinate® developed by Dafra Pharma nv (Turnhout,
Belgium), has now been introduced into the market. Co-arinate® is an artesunate based
combination therapy with sulfamethoxypyrazine/pyrimethamine (Sl/Pm) (see Figure 1). The
drug artesunate (200mg dose) kills the Plasmodium falciparum parasites and potentiates the
effects of Sl/Pm (500/25mg dose). The longer elimination half life of the latter combination
provide a time-extended action to the preparation as a whole. This kind of combination
therapy should permit a shorter duration of treatment, thereby aiming to improve therapy
compliance. Also, the theoretical risk for drug resistance is significantly reduced. Using a
combination therapy in itself reduces drug resistance and the improved compliance reduces
the selection of more resistant parasite variants in a patient such as is the case when treatment
is incomplete.
Small molecular mass substances: pyrimethamine and sulfamethoxypyrazine - 63 -
Evaluation of a new drug combination therapy inevitably involves investigation into its
pharmacokinetic characteristics. In the past, for Sl, investigation of these pharmacokinetic
characteristics was done by colorimetry after derivatization of the free amine of the
sulfonamide [6]. The work presented here deals with the development of a quantitative tool
for the simultaneous determination of Sl/Pm in plasma. The optimized method was used for a
time-course study of the Sl/Pm combination concentration in plasma of patients treated with
Co-arinate®
. Analytical difficulties for the simultaneous determination of both drugs are
linked to their disparate chemical properties (sulfalene is both an acid and a weak base,
whereas pyrimethamine is a weak base) and especially to their high concentration ratio (Sl/Pm
≈ 300) in plasma [7,8]. Until now, several HPLC methods exist, few of them with mass
spectrometric detection, for the determination of Sl or Pm individually [5-16] but none for the
simultaneous determination of both. In contrast, a few methods for the simultaneous
determination of Sd/Pm, another more frequently used sulfonamide antibacterial combination
in malaria-treatment, do yet exist, but surprisingly only one using a LC-MS(/MS) approach
[3]. However, mass spectrometric detection, and more specifically tandem mass spectrometry,
combined with HPLC is nowadays increasingly being used in the clinical laboratory and is
widely accepted as the preferred analytical tool in target compound analysis, e.g. in
pharmacokinetics studies. LC-MS(/MS) combines the characteristics of high selectivity,
specificity and throughput [19]. We used this preferred approach and report here on a
validated method for the simultaneous determination of Sl/Pm that copes with the analytical
difficulties mentioned above; and its practical application in a pharmacokinetics study set-up.

Small molecular mass substances: pyrimethamine and sulfamethoxypyrazine - 64 -
2.1 Chemicals
2. Experimental
Pure reference standard of pyrimethamine was obtained from Sigma-Aldrich (Bornem,
Belgium). Sulfamethoxypyrazine (sulfalene) was kindly provided by Dafra Pharma
(Turnhout, Belgium) and the internal standard, sulfaquinoxaline (Sq) was from Laboratoria
Flandria (Ghent, Belgium). LC-MS grade methanol and acetonitrile (AcN) were from
Biosolve (Valkenswaard, The Netherlands), while dichloromethane, HPLC-grade, was
obtained from Acros (Geel, Belgium). Ultrapure water was produced by a Synergy 185
system (Millipore Comp., Bedford, MA, USA). Formic Acid (FA) and NaOH pellets finally
came from Sigma-Aldrich (Bornem, Belgium). Drug-free blank plasma (different patient
pools) was obtained at the local blood bank and kept frozen until use.
2.2 Analytical standards
Individual stock solutions of Pm (1.01 mg/mL), Sl (27.0 mg/mL), and Sq (0.421 mg/mL)
were prepared by accurately weighting the required amounts in separate volumetric flasks and
dissolving in appropriate volumes of AcN/methanol, 50/50 (v/v), except for Sq where 90/10
(v/v) AcN/water was used (Sq dissolves poorly in the AcN/methanol, 50/50 (v/v) mixture). A
mixed stock solution of Pm and Sl was prepared by accurately mixing 0.5 and 4.5 mL of the
respective stock solutions. This solution was appropriately diluted in pure AcN by serial
dilution using a Hamilton diluter (Hamilton, Bonaduz, Switzerland) to obtain the working
standard solutions used to spike plasma calibrators and quality control samples. Separate
weightings, dilutions and volumetric material were used in the preparation of the quality
control samples which were also used in the method accuracy investigation. All standards
were kept at -20°C and were used for a maximum of 3 months.
Small molecular mass substances: pyrimethamine and sulfamethoxypyrazine - 65 -
2.3 Sample preparation and extraction
After adding 50 µL of internal standard solution (IS, 0.421 mg/mL sulfaquinoxaline) to a 250
µL plasma sample aliquot, sample clean-up was achieved by liquid-liquid extraction (LLE).
To that end, 1 mL of a 0.01M NaOH solution was added and the mixture was vortex mixed
for 15 seconds, followed by addition of 4 mL of dichloromethane (CH2Cl2). After 10 minutes
of gentle shaking (rotatory mixer), the mixture is centrifuged for another 10 minutes at 2254 x
g (25°C). The water phase is removed and 2mL of the organic CH2Cl2 phase is evaporated
under nitrogen on a Zymark Turbovap LV evaporator (Zymark Corporation, Hopkinton, MA,
USA) at 40 °C. 500µL of a 0.2 % FA in H2
O/AcN(85/15) solution was used for reconstitution
of the residue. After mixing and centrifugation (5 min at 2254 x g, 25°C), 20 µL of the
supernatant was injected on the chromatographic system.
2.4 Mobile phases
LC eluents A and B consisted respectively of 0.1% (v/v) FA in water and 0.1% (v/v) FA in a
80/20 (v/v) AcN/water mixture. Both solvents (A) and (B) were filtered over a 0.45 µm
membrane filter before use.
2.5 Liquid chromatography
The Hypersil BDS phenyl column (2.1 mm I.D., length 100 mm, particle size 3 µm) used was
purchased from Alltech (Lokeren, Belgium). The chromatographic system consisted of a
Hewlett Packard (HP) Agilent 1100 capillary LC system equipped with an analytical
autosampler having a 100µL injection loop installed (Agilent, Böblingen, Germany). The LC
system was operated using the HP Chemstation® software. Linear gradient elution was used
from 20 to 80% of solvent B, within 5 minutes at a flow rate of 300 µL/min. After 2.5 minutes

Small molecular mass substances: pyrimethamine and sulfamethoxypyrazine - 66 -
at 80% B, the system then returned to its initial conditions within 0.5 min and was re-
equilibrated for 4.5 min, yielding a total run time of 12.5 min. Total pressure of the LC-
MS(/MS) system was typically around 150 bar.
2.6 Mass spectrometry
The HPLC system was interfaced with a Waters Quattro Ultima triple quadrupole system
(Micromass-Waters, Manchester, UK), equipped with an orthogonal electrospray source (Z-
spray®) operated in the positive ion mode. The mass spectrometer was operated in the
multiple reaction monitoring mode (MRM) allowing maximum sensitivity and specificity.
Nitrogen acted both as nebulizer (60 L/hr) and drying gas (580 L/hr) and argon served as
collision gas (4.5x10⁻³ mbar collision cell pressure). A standard 65µm capillary was used in
the electrospray interface. The source was operated at 140 °C and the desolvation temperature
was 450 °C. No effluent splitting was used. Electrospray voltage was 2.5 kV. The cone
voltage and the collision energy (CE) were optimised for each compound (Table 1) using
separate infusion experiments. Unit resolution was used for both quadrupole mass filters.
Figure 1 shows the obtained collision induced dissociation product ion spectra of Pm, Sl, and
Sq, together with their molecular structures.
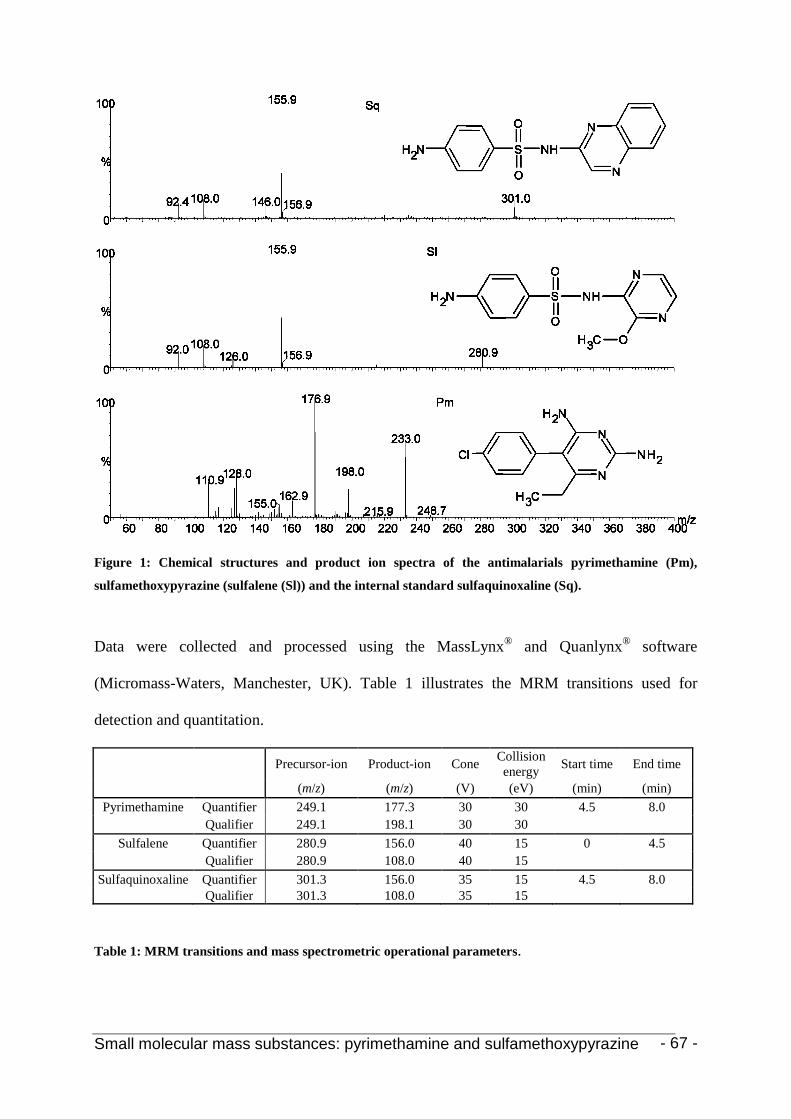
Small molecular mass substances: pyrimethamine and sulfamethoxypyrazine - 67 -
Figure 1: Chemical structures and product ion spectra of the antimalarials pyrimethamine (Pm),
sulfamethoxypyrazine (sulfalene (Sl)) and the internal standard sulfaquinoxaline (Sq).
Data were collected and processed using the MassLynx® and Quanlynx®
software
(Micromass-Waters, Manchester, UK). Table 1 illustrates the MRM transitions used for
detection and quantitation.
Precursor-ion Product-ion Cone Collision energy Start time End time
(m/z) (m/z) (V) (eV) (min) (min) Pyrimethamine Quantifier 249.1 177.3 30 30 4.5 8.0
Qualifier 249.1 198.1 30 30 Sulfalene Quantifier 280.9 156.0 40 15 0 4.5
Qualifier 280.9 108.0 40 15 Sulfaquinoxaline Quantifier 301.3 156.0 35 15 4.5 8.0
Qualifier 301.3 108.0 35 15
Table 1: MRM transitions and mass spectrometric operational parameters.
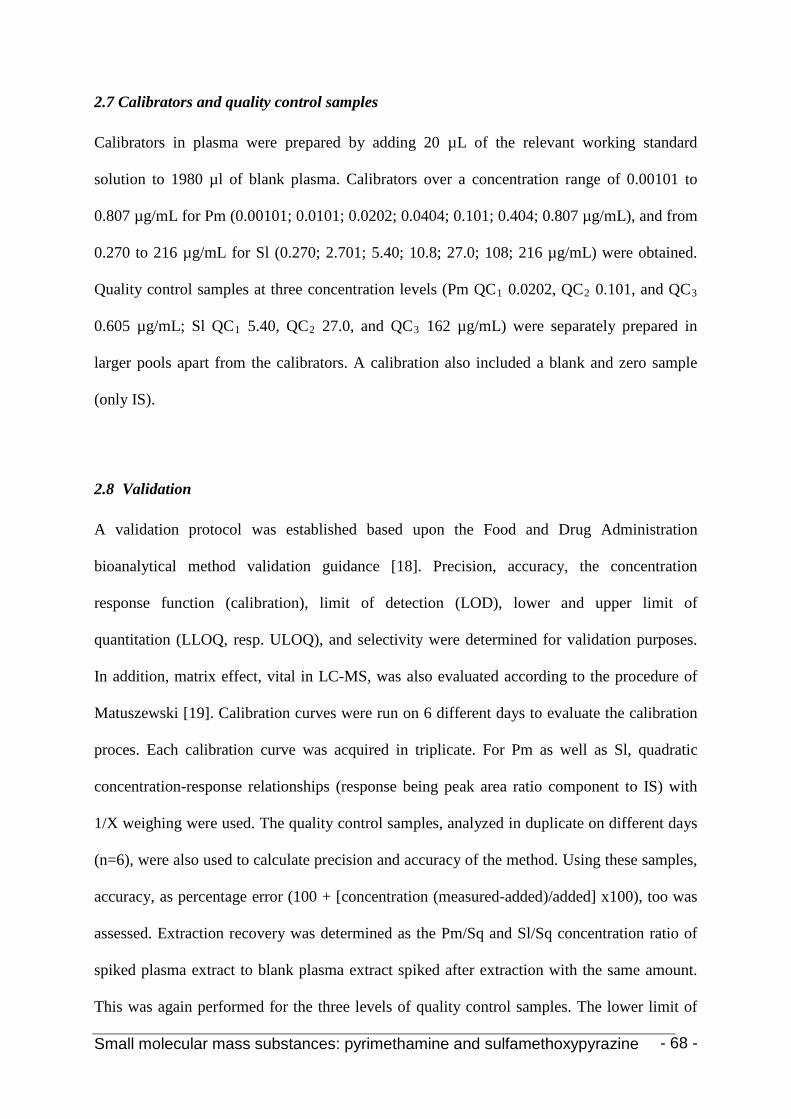
Small molecular mass substances: pyrimethamine and sulfamethoxypyrazine - 68 -
2.7 Calibrators and quality control samples
Calibrators in plasma were prepared by adding 20 µL of the relevant working standard
solution to 1980 µl of blank plasma. Calibrators over a concentration range of 0.00101 to
0.807 µg/mL for Pm (0.00101; 0.0101; 0.0202; 0.0404; 0.101; 0.404; 0.807 µg/mL), and from
0.270 to 216 µg/mL for Sl (0.270; 2.701; 5.40; 10.8; 27.0; 108; 216 µg/mL) were obtained.
Quality control samples at three concentration levels (Pm QC1 0.0202, QC2 0.101, and QC3
0.605 µg/mL; Sl QC1 5.40, QC2 27.0, and QC3
162 µg/mL) were separately prepared in
larger pools apart from the calibrators. A calibration also included a blank and zero sample
(only IS).
2.8 Validation
A validation protocol was established based upon the Food and Drug Administration
bioanalytical method validation guidance [18]. Precision, accuracy, the concentration
response function (calibration), limit of detection (LOD), lower and upper limit of
quantitation (LLOQ, resp. ULOQ), and selectivity were determined for validation purposes.
In addition, matrix effect, vital in LC-MS, was also evaluated according to the procedure of
Matuszewski [19]. Calibration curves were run on 6 different days to evaluate the calibration
proces. Each calibration curve was acquired in triplicate. For Pm as well as Sl, quadratic
concentration-response relationships (response being peak area ratio component to IS) with
1/X weighing were used. The quality control samples, analyzed in duplicate on different days
(n=6), were also used to calculate precision and accuracy of the method. Using these samples,
accuracy, as percentage error (100 + [concentration (measured-added)/added] x100), too was
assessed. Extraction recovery was determined as the Pm/Sq and Sl/Sq concentration ratio of
spiked plasma extract to blank plasma extract spiked after extraction with the same amount.
This was again performed for the three levels of quality control samples. The lower limit of

Small molecular mass substances: pyrimethamine and sulfamethoxypyrazine - 69 -
detection (LLOD) was estimated at a signal-to-noise ratio (S/N) equal to three in spiked
plasma. The lower limit of quantitation (LLOQ) was assessed at a minimum signal-to-noise
ratio (S/N) of 10 and an acceptable precision (RSD less than 20%) and accuracy (between 80
and 120%). Selectivity was demonstrated by running blank plasma samples from 6 different
patients and by evaluating the qualifier ion response ratio to the quantitation ion for which a
deviation of maximum 20% to a pure standard was allowed.
Absolute matrix effects were evaluated by spiking a quantity of target (Pm and Sl) into a
blank plasma extract and comparing the area to the same quantity spiked into solvent (0.1%
(v/v) FA in a 15/85 (v/v) AcN/water mixture). This was done at all three of the QC
concentration levels and in threefold. Moreover, the experiment was repeated for four plasma
lots, originating from four different individuals, allowing the evaluation of relative matrix
effects too. The same procedure was used for the IS, albeit at one single concentration level.
2.9 Study samples
Patient samples were sent to us by Dafra Pharma nv. for analysis of the Pm and Sl
concentration of patients (n=14) treated in a pre-defined study protocol with Co-Arinate®
. For
each volunteer, 10 plasma samples were taken at fixed time-points: 0, 2, 4, 6, 8, 24 (1 day), 48
(2 days), 96 (4 days), 168 (7 days) and 336 (14 days) hours after oral intake. Every group of
patient samples (in blocks of two patients) was run together with a calibration curve and
quality control samples. The results of the QC samples provided the basis of accepting or
rejecting the run, according to the guidelines in reference 18.

Small molecular mass substances: pyrimethamine and sulfamethoxypyrazine - 70 -
3.1 Analytical procedure
3. Results and discussion
Simultaneous analysis of Pm and Sl is complicated because of a number of factors. First, due
to the different chemical properties of both (see also Figure 1), an ideal common extraction
for both chemical entities can never be attained. Moreover, as a result of the very high Sl/Pm
concentration ratio in plasma, simultaneous MS detection results in either too little sensitivity
for Pm or, when optimizing the system for sensitivity, overloading of the MS with Sl. Earlier
investigations by Sinnaeve et al. [3] for the simultaneous quantitative analysis of Pm/Sd in
plasma handled this problem by detuning the mass spectrometer for Sd. The phenomenon of
overloading in the MS detection stage actually already takes place in the ionization phase.
Consequently, optimizing those MS parameters (cone voltage, specific ion transition, …)
which can be adjusted for individual compounds within a single analysis, never proved
adequate enough to really alleviate the overloading of Sl when introducing enough extract to
achieve acceptable sensitivity for Pm. In fact, it was surprising to experience that we were
now puzzled with a problem related to too much sensitivity, rather than too little as is most
often the case in bio-analytical work. In that respect, a feature to change the capillary voltage
during a run, thus selectively reducing the number of ions formed right from the start, would
be very interesting. However, the Masslynx® software does not allow to alter the capillary
voltage during an LC-run. Taking all of the above into account, we opted to solve both
quandaries by choosing for an optimal extraction for Pm. 0.1M NaOH was chosen to adjust
the sample pH before extraction. The addition of 100, 200, 300 and 400 µL of 0.1M NaOH
was tested. Adding 100 µL of 0.1M NaOH, later altered into 1 mL of 0.01M, up to a pH of
8.5 provided the best extraction conditions yielding an absolute recovery of 34.48 % ± 4.641
(QC2 level, n=4) for Pm (see Table 3). These figures should be evaluated bearing in mind the
fact that in our extraction, we only take 50% form the lower organic phase after phase

Small molecular mass substances: pyrimethamine and sulfamethoxypyrazine - 71 -
separation. Under these conditions, however, extraction for Sl, both an acid and a weak base,
was suboptimal (absolute recovery of 0.5052 % ± 0.08026 (QC2
level, n=4, Table 3)).
Nevertheless, in doing so, the Sl/Pm concentration ratio substantially decreases in the final
extract. As mentioned, the amount of Sl molecules in the electrospray ionization source would
otherwise be too high to produce enough positively charged ions in a quantitative way.
The chromatographic separation was optimized to be as short as possible keeping matrix
ionization suppression limitations in mind. By doing so, an acceptable sample turnover time is
obtained. Also, using a fast gradient (from 0 to 80 % eluent B in 5 minutes) restricts the risk
of ionization suppression, mostly caused by polar components. The use of such a so-called
“ballistic gradient” separates the analytes from the solvent front while maintaining high
throughput [17].
Figure 2: Typical chromatogram of the antimalarials pyrimethamine (RT 5.75), sulfamethoxypyrazine
(sulfalene) (RT 3.25) and the internal standard sulfaquinoxaline (RT 5.78). See text for chromatographic
conditions and table 1 for MRM transition data. Left pane (A) blank plasma, middle pane (B) LLOQ, and
right pane QC2
.
A typical chromatogram as obtained for a sample extract (LLOQ and QC2 levels) is shown in
Figure 2, together with the chromatogram obtained for a blank plasma sample.
1.0 2.0 3.0 4.0 5.0 6.0 7.0 8.0 9.0 Time
100%
1.0 2.0 3.0 4.0 5.0 6.0 7.0 8.0 9.0 Time
100%
1.0 2.0 3.0 4.0 5.0 6.0 7.0 8.0 9.0 Time
100%
Small molecular mass substances: pyrimethamine and sulfamethoxypyrazine - 72 -
Reproducibility of the retention times was checked by repetitive injections of quality control
samples. Relative standard deviation was never above 3.482% (n=20).
Adequate internal standardization is essential in quantitative target compound analysis. Sq is
chosen as IS because of its parallel chemical properties with Sl (see Figure 1). It should
therefore be well suited to counteract extraction differences. Good internal standardization is
much more important for Sl than for Pm because our deliberately chosen sub-optimal
extraction conditions for the sulfonamide type of compounds result in very low extraction
efficiencies and consequently an enhanced risk of variability in extraction due to small
changes in biological sample or extraction conditions. Sq was chosen above other chemically
related sulfonamide antibiotics because of its good elution characteristics. Although from an
analytical point of view less suited for Pm, a Pm to Sq area ratio is also used. Sq does co-elute
with Pm. Proguanil was evaluated as additional IS for Pm. However, we experienced no
further improvement.
3.2 Method performance and validation results
For calibration purposes, the analyte to IS peak area ratio plotted against analyte
concentration and weighted regression analysis was applied to calculate the calibration curves
for pyrimethamine and sulfalene. By doing so, data heteroscedasticity is counteracted and a
higher weight is allocated to the lower concentrations in the calibration curve, leading to an
improved quantitation of the low-level concentrations. A weighting factor 1/X was chosen,
based on the analysis of residuals and accuracy of quality control samples. For both Pm and
Sl, quadratic calibration curves (7 calibration points and one zero sample) gave the best fit
based on statistical regression analysis comparison (Statgraphics®, Manugistics, Inc.,
Small molecular mass substances: pyrimethamine and sulfamethoxypyrazine - 73 -
Rockville, MD), the analysis of residuals (i.e. lowest absolute sum) and the acceptance criteria
of the concomitant quality control samples calculated according the different fits applied to a
particular calibration set. The advent of powerful automated quantitation software tools, e.g.
Quanlynx®, makes quadratic calibrations nearly as easy in use as linear ones, provided one
accepts the statistically enforced requirement to use a somewhat higher number of points in
the calibration exercise. Nowadays in LC-MS(/MS), especially with electrospray ionisation,
linear calibration curves with a dynamic range exceeding 2 decades are hard to find. We have
often seen that electrospray ionization does not a priori generate analyte ions by a linear
process. Thus, forcing a linear function through, in essence, curvilinear data rather introduces
accuracy errors. Moreover, quadratic calibration curves clearly provide an extended
measurement interval, in our case from 0.00101 to 0.807 µg/mL for Pm and from 0.271 to
216 µg/mL for Sl. As expected, all patient sample concentrations measured comfortably lie
within these concentration ranges, none of the samples from this aforementioned study needed
re-analysing after dilution. The means (±SD, n=6) of the quadratic equation coefficients were:
y = -2.252 (±1.074)*x2 + 9.568 (±2.320)*x + 0.005001 (±0.004299) for Pm; and y = -
1,004*10-4 (±4.593*10-5)*x2 + 0.1017 (±0.02052)*x + 0.01473 (±0.004806) for Sl. Mean
coefficients of determination were 0.9951 (n = 6, CV% 0.39) for Pm and 0.9942 (n = 6, CV%
0.13) for Sl. ANOVA analysis always revealed a statistically significant calibration
relationship at the 99% confidence level. The 95% confidence interval for the intercept
always included zero, statistically indicating the calibration curve passes through zero. The
lower limit of quantitation (LLOQ) was established at the level of the lowest calibrator,
meaning 0.00101 µg/mL for Pm and 0.271 µg/mL for Sl. These concentrations gave a signal
to noise ratio of respectively 10.3 and 11.5 with a precision (RSD, n=12) of 10.72% and
13.44%, and an accuracy (n=12) of 110.1% and 110.4%, respectively. These data are within
the generally accepted validation criteria limits (precision < 20% and accuracy between 80

Small molecular mass substances: pyrimethamine and sulfamethoxypyrazine - 74 -
and 120 %). Accordingly, the ULOQ was established. The, less informative, limit of detection
(LOD) was defined at a signal to noise ratio equal to 3 and approximated from the lowest
calibrator. In doing so, the LOD of Pm was close to 0.400 * 10-3
µg/mL and for Sl close to
0.100 µg/mL.
Accuracy and precision were evaluated using the 3 different quality control levels. Precision
(n = 6) and accuracy (n = 6), all measured on different days, are summarized in Table 2.
Precision was below 9.352% for Pm and 13.95% for Sl. Inaccuracy remained below 15% at
all cases. These data are well within the generally required validation criteria limits.
Selectivity is an inherent aspect of LC-MS/MS procedures. It was confirmed by the absence
of signal in at least 6 blank plasma extracts of different patient origin.
Pyrimethamine (µg/mL) Sulfalene (µg/mL)
0.0202 (QC1 0.101 (QC) 2 0.605 (QC) 3 5.40 (QC) 1 27.0 (QC) 2 162 (QC) 3
Mean conc. )
0.02161 ± 0.002021
0.1066 ± 0.005895
0.5845 ± 0.03492
6.144 ± 0.3492
26.18 ± 3.253
155.8 ± 21.74
Accuracy (%, n = 6) 106.9 105.6 96.61 113.7 96.96 96.17
Precision (CV%, n=6) 9.352 5.530 5.974 4.424 12.43 13.95
Table 2: Accuracy and precision data for pyrimethamine (Pm) and sulfalene (Sl) at the three quality
control concentration levels.
Absolute matrix effect, process efficiency and inter-subject variability (relative matrix effects,
due to inter-individual differences in plasma composition) were determined at the
concentration level of the three quality control samples in four different plasma lots according
to the aforementioned procedure [19]. All are summarised in Table 3.

Small molecular mass substances: pyrimethamine and sulfalene - 75 -
Pyrimethamine (µg/ml) Sulfalene (µg/ml) IS
(µg/ml)
0.0202 (QC1
0.101 (QC) 2
0.605 (QC) 3
5.40 ) (QC1
27.0 ) (QC2
162 ) (QC3
20.0 )
Absolute matrix effect (%, n=4) 108.7 113.4 a 104.4 82.90 91.11 88.66 83.76
Relative matrixeffect (CV%, n=4) 4.962 7.233 9.548 4.378 5.914 5.626 13.58
Absolute recovery (% ± SD, n=4)
24.74 ± 1.375
34.48 ± 4.641
36.43 ± 6.495
0.6033 ± 0.1042
0.5052 ± 0.08026
0.8969 ± 0.1857 -
Proces efficiency (% ± SD, n=4)
26.85 ± 0.9560
39.45 ± 3.009
37.60 ± 13.53
0.4939 ± 0.05487
0.4700 ± 0.04597
0.8098 ± 0.1419 -
a
Table 3: Matrix effect (absolute and relative) and process efficiency for pyrimethamine and sulfalene.
100% means no matrix effect, lower means matrix suppression.
Introducing an extraction into the analytical method, contrary to our earlier report [3] for the
simultaneous quantitative analysis of Pm/Sd in plasma, simultaneously addressed the Sl
overloading problem in our MS detection, as well as the potential of a deleterious matrix
effect. Several studies in the past [17] have pointed out that a simple protein precipitation step
with AcN, our earlier approach for Pm/Sd, leads to a far greater risk of ionization suppression
effects. In bio-analytical mass spectrometry, absolute matrix effects are almost inescapable.
However, much more important is the demonstrable lack of relative matrix effects, i.e.
variance between patient results brought about by the inter-individual differences in the
constitution of their plasma. Standard validation efforts, based on pooled blank biological
fluids do not reveal this possibility peculiar to (ESI)-LC-MS(/MS). From the data in Table 3,
no evidence of a relative matrix effect could be found.
Based on the performance data of the procedure presented, we can conclude that a suitable
analytical tool for the simultaneous determination of Sl and Pm in plasma samples has been
established. Different analytical strategies have in the past been developed for the analysis of
Sl and/or Pm [3, 5-16, 20-21]. Earlier liquid chromatographic methods show their own

Small molecular mass substances: pyrimethamine and sulfalene - 76 -
specific disadvantages in terms of extraction (time consuming, labour-intensive (SPE) [7, 8])
and/or selectivity. Most often less selective detection techniques have been used (UV
detection)[7-8, 14, 20-21] . The superior approach of combining liquid chromatography with
mass spectrometry has only recently been introduced for this combination [3]. The use of
mass spectrometry, nowadays widely accepted as the analytical tool in bioanalytical
laboratories, for Sl (or Sd) and Pm simultaneously, seems hampered by the high
sulfonamide/Pm concentration ratio in plasma, mainly because of the limited dynamic range
of the electrospray interface. The presented LC-MS(/MS) method, in combination with a
simple LLE, levels out this issue. The method presented here is simple and fast and allows
accurate measurement of both analytes with validated confidence.
3.3 Pharmacokinetic application
Based on the developed method, clinical samples were analyzed. A block of patient samples
(generally two patients) was run in between two calibration curves, with the required quality
control samples in between. Based on the quantitative results, pharmacokinetic plasma
concentration-time profiles could be plotted. Figure 3 illustrates some of these data as an
illustration of the applicability of our analytical procedure. Full evaluation of these
pharmacokinetic data, however, exceeds the scope of this paper. Clearly, the method
developed is well suited for the simultaneous determination of Pm and Sl in plasma, even
despite the different chemical properties of both and their very high concentration ratio in
plasma. The use of LLE in combination with LC-MS(/MS) provides a fast and simple method
with samples being quantitatively measured over a pharmacokinetically useful dynamic
concentration range. This allowed full pharmacokinetic investigation of Sl/Pm in plasma for
patients treated with Co-Arinate®. Until now, no previous papers report the simultaneous
determination of both Pm and Sl in plasma.

Small molecular mass substances: pyrimethamine and sulfalene - 77 -
A quantitative LC-MS(/MS) method was developed for the simultaneous determination of
pyrimethamine and sulfalene in plasma. Adequate sample clean-up was achieved by a simple
and relatively fast LLE. In this way, ionization suppression effects typical for more simple
sample clean-up procedures such as protein precipitation could be avoided. The used
chromatographic step only takes 12.5 minutes allowing a fast sample turnover time. This
results in a high throughput capability, which proved favourable in view of pharmacokinetic
applications entailing a high sample load. The method was fully validated based upon
international accepted validation standards and was applied in the pharmacokinetic evaluation
of the bio-availability of the Sl/Pm formulation of patients treated with Co-Arinate®, a
artesunate based combination therapy with Sl/Pm for the curative treatment of malaria.
4. Conclusions
Figure 3:
Plasma concentration-time profile for
patients treated with Co-arinate®,
both for pyrimethamine (Pm) and sulfalene (Sl).

Small molecular mass substances: pyrimethamine and sulfalene - 78 -
This work was supported by grant B/06859-BOF06/24j/025 (Bijzonder OnderzoeksFonds of
the Ghent University) and grant G.0320.0 (FWO-Vlaanderen).
5. Acknowledgments
1. V.K. Dua, R. Sarin, N.C. Gupta, and V.P. Sharma, J. Chromatogr. B, 1998 (714): p390
6. References
2. I. Adam, M.E. Osman, G. Elghzali, G.I. Ahmed, L.L. Gustafssons, and M.I. Elbashir, Ann. Trop. Med. Par asit. 2004 (98): p.661
3. B.A. Sinnaeve, T.N. Decaestecker, P.G. Risha, J.P. Remon, C. Vervaet, and J.F. Van Bocxlaer, J. Chromatogr. A, 2005 (1076): p.97
4. P.G. Risha, D. Shewiyo, A. Msami, G. Masuki, G. Vergote, C. Vervaet, and J.P. Remon Trop. Med. Int. Health, 2002 (7): p.701
5. A.A. Amin, and R.W. Snow, Malaria journal, 2005 (4): p.36 6. A. Devriendt, F.H. Jansen, and I. Weemaes, europ. J. clin. Pharmacol., 1970 (3): p.36 7. M.D. Green, D.L. Mount, and H. Nettey, J. Chromatogr. B, 2002 (767): p.159 8. H. Astier, C. Renard, V. Cheminel, O. Soares, C. Mouier, F. Peyron, and Chaulet J.F. J.
Chromatogr. B, 1997 (698): p.217 9. M.D. Edstein, J. Chromatogr 1984 (305): p.502 10. M.D. Edstein, Chemotherapy, 1987 (33): p.229 11. C. Midskov, J. Chromatogr., 1984 (308): p.217 12. Y. Bergqvist, and M. Eriksson, Trans. R. Soc. Trop. Med. Hyg., 1985 (79): p.297 13. Y. Bergqvist, S. Eckerbom, H. Larsson, and M. Malekzadeh, J. Chromatogr., 1991 (571):
p.169 14. J. Eljaschewitsch, J. Padberg, D. Schürmann, and B., Ruf Ther. Drug Monit., 1996 (18):
p.592 15. J.K. Johannessen, I. Christiansen, D.R. Schmidt, E. Petersen, and S.H. Hansen, J. Pharm
Biomed Anal., 2005 (36): p.1093 16. K. Dau, and R. Sarin, J. Chromatogr., 1991 (563): p.333 17. J. Taylor, Clin. Biochem., 2005 (38): p.328 18. Guidance for Industry. Bioanalytical Method Validation. U.S. Department of Health and
Human Services, Food and Drug Administration. May 2001. 19. B.K. Matuszewski, M.L. Constanzer, and C.M. Chavez-Eng Anal Chem. 2003; 75: 3019

Small molecular mass substances: pyrimethamine and sulfalene
- 79 -
Small molecular mass substances: glycopyrrolate - 80 -
Chapter 2
The quantitative analysis of the anti-cholinergic agent
glycopyrrolate in plasma samples
Accepted for publication as:
Quantitative determination of glycopyrrolate in human plasma by liquid chromatography – electrospray
ionization mass spectrometry: the use of a volatile ion-pairing agent during both liquid-liquid extraction and
liquid chromatography.
M.L. Storme, R.S. t’Kindt, W. Goeteyn, K. Reyntjens
(Journal of Chromatography B)
and J.F. Van Bocxlaer
Small molecular mass substances: glycopyrrolate - 81 -
The work presented here deals with the development of a quantitative tool for the determination of the
quaternary ammonium anti-cholinergic agent glycopyrrolate in human plasma samples. Mepenzolate was used
as internal standard. The plasma samples were subjected to a suitable sample clean-up consisting of a simple
and relatively fast, two step liquid-liquid ion-pair extraction procedure. The chromatography, using the same
volatile ion-pair reagent heptafluorobutyric acid (HFBA), takes only 10 minutes. Relative standard deviation of
retention times was never above 2.257% (n=36). A quantitative ESI-LC-MS(/MS) (TOF-mass spectrometry)
method was used for the absolute quantitation of glycopyrrolate in human plasma in a concentration range from
0.1009 ng/mL up to 100.9 ng/mL, described by the quadratic calibration function (R2 0.9995) ,y = -2.210 * 10-4
(±3.926 * 10-5)*x2 + 5.847 * 10-2 (±5.274 * 10-3)*x + 4.081 * 10-3 (±4.816 * 10-4). Following, the optimized
method was fully validated based on the US FDA Bio-analytical Method Validation Guidance for Industry.For
the three QC concentrations (QC1 0.253, QC2 2.53, and QC3 25.3 ng/mL) and the LLOQ (0.101 ng/mL),
precision was under 15% (17.95% (n=6) at the LLOQ concentration) and maximum accuracy was 112.4%
(88.92% for the LLOQ n=6). Absolute matrix effect (maximum 143.9% ± 11.59, n=3), absolute recovery (better
than 41.77% ± 2.218, n=3), relative (inter-subject) matrix effect (maximum 10.89% ± 1.446, n=3) and process
efficiency (better then 45.17% ± 5.739, n=3) were assessed too at the 3 QC concentrations
Small molecular mass substances: glycopyrrolate - 82 -
Quaternary ammonium (QA) drugs are widely used as anti-cholinergic agents. Glycopyrrolate
(GLY), as a synthetic QA compound, has been used for decades as a preoperative
antimuscarinic. In addition, it diminishes the volume and free acidity of gastric secretions and
controls excessive pharyngeal, tracheal, and bronchial secretions [1-4]. In contrast to the
tertiary amines atropine sulfate and hyoscine hydrobromide, other well known anticholinergic
agents, the highly polar quaternary ammonium group of GLY limits its passage through the
blood-brain barrier. Although many anesthesiologists still routinely make use of GLY because
of the positive effects, its use has been cut back during the last twenty years, due to the need
for painful and anxiety-provoking intramuscular (IM) injection caused by short distribution
and elimination half-life [5]. Clifford et al. investigated other administration routes, such as
oral and intravenous (IV) routes. As expected by the known variable gastrointestinal
absorption of GLY, oral administration was found to be ineffective. IV administration on the
other hand proved to be superior to IM administration because of an additional decrease of
gastric secretions, not seen by IM administration [1].
1. Introduction
The scope of this study, as part of a larger clinical study, was to develop an analysis method
for GLY, allowing a pharmacokinetic evaluation of patients treated with Robinul® after IV
distribution through an arterial catheter. Past PK studies in normal volunteers, given a single
IV infusion of 0.4 mg GLY, already indicated that the drug undergoes a rapid
distribution/elimination phase (t1/2 = 1.7 hr). The peak plasma concentrations occur within the
minute after infusion and no wide distribution to the tissues takes place [6]. As for all
anticholinergics, the duration of action varies, with possible antisialogogue effects for up to 7
hours. Each Robinul® injection vial contains 1 mL of 0.4 mg GLY in water for injection with
9 mg of benzyl alcohol as preservative (Information for health professionals, Robinul data
Small molecular mass substances: glycopyrrolate - 83 -
sheet). For IM injection, the onset of reaction is 20 to 40 minutes with peak plasma
concentrations after approximately 30 to 45 minutes and the duration of action ranging from 4
to 6 hours.
During the past decades, several studies investigated possible quantitation approaches for
GLY and other QA compounds. Due to their cationic character, detection of the latter drugs is
still not straightforward. Coverage with immunoassays is limited. Traditionally, GLY was
analyzed by using enzyme-linked immunosorbent assays (ELISA) [7, 8] despite the fact that
cross reactions are often noted. Methods using gas chromatography-mass spectrometry (GC-
MS) on selected QA drugs have been developed but intact QA compounds cannot be analyzed
with GC-MS [9-12]. One approach is the hydrolysis of the isolated quaternary compound to
cyclopentyl mandelic acid which is then amenable to detection and confirmation following
derivatization and analysis by GC-MS. A broad range of other chromatographic and
spectrometric techniques have been reported for the analysis of QA drugs [13-26]. An
inherent disadvantage of most of these analytical methods is the lack of specificity, resulting
in identification and quantitation issues in complex matrices e.g. plasma [13]. Only methods
using mass spectrometry can unmistakably identify the detected analyte. Consequently, more
specific methods like capillary electrophoresis-mass spectrometry (CE-MS) have been
optimized for the analysis of QA, however, only in (horse) urine [9]. For QA drugs, indeed,
CE seems a better option considering the permanent ionic characteristic of the analyte
molecules. Unfortunately, coupling CE to MS is far from routine and does lack some
robustness.
Liquid chromatography mass spectrometry (LC-MS) at the other hand, using electrospray
ionization (ESI), has become the method of choice in both quantitative and qualitative bio-
Small molecular mass substances: glycopyrrolate - 84 -
analytical work due to its speed, sensitivity, specificity and robustness [13]. In reversed phase
type of separations, ion-pair chromatography allows the chromatography of ionic analytes.
Generally, ion-pair chromatography is performed with high concentrations of non-volatile
ion-pair reagents, obviously incompatible with (ESI-)mass spectrometry. Some of these issues
can be overcome by phase-system switching using an ion-exchange trapping column (2D-LC)
but, additional equipment (17, 27) is required and the complexity of the analytical method is
substantially enhanced. The use of volatile acids as ion-pairing agents was first described by
Castro et al. [12], allowing the direct coupling of ion-pair chromatography and mass
spectrometry. Heptafluorobutyric acid (HFBA), pentafluoropropionic acid (PFPA) and TFA
(TFA) were selected as possible ion-pairing agents. In their setup, HFBA yielded the most
promising results. Using the latter approach, Ariffin et al. [28] developed an efficient
procedure for the simultaneous determination of QA drugs and herbicides in human whole
blood using SPE extraction.
Solid phase extraction, mainly based upon cation-exchange, is the most investigated
extraction method for QA compounds. Indeed, the cationic nature of the drugs does not lend
itself well to liquid-liquid partition extraction methods [6, 9, 12-26]. Liquid-liquid extractions
can only be an alternative when ion pairing is introduced. Ion pair extraction was used for the
analysis of QA compounds in urine by Murray et al. after adjusting the pH of the urine to 10
and extracting the newly formed iodine-glycine drug complex into dichloromethane [27]. In
this way, a simple ion-pair liquid/liquid extraction was obtained with recoveries ranging from
56% to 90% [9]. A similar ion-pair liquid-liquid extraction utilizing heptane sulfonate was
used by Rudy et al. for the quantitation and confirmation of ipatropium in equine urine for
screening purposes. Of course, many of the ion pairing reagents, e.g. heptane sulfonate, do not
lend themselves all too well to ESI-MS detection.
Small molecular mass substances: glycopyrrolate - 85 -
In our approach, ion-pairing liquid/liquid extraction with dichloromethane is adjusted for
smooth LC-MS analysis by using the same ion-pairing agent as used for the chromatographic
separation step. In this way HFBA acts as ion pairing agent for both the extraction and
chromatographic separation step. This report is a detailed presentation of the development,
optimization and validation of this method for phamocokinetically-oriented quantitative
measurements.
2.1 Chemicals
2. Experimental
Pure reference standard of glycopyrrolate (GLY) was obtained from Boehringer Ingelheim
Chemicals Inc. (Petersburg, USA). The internal standard, mepenzolate (Mp) was obtained as
mepenzolate bromide from Sigma-Aldrich (Bornem, Belgium). LC-MS grade methanol and
acetonitrile (AcN) were from Biosolve (Valkenswaard, The Netherlands). Ultrapure water
was produced by a Synergy 185 system (Millipore Comp., Bedford, MA, USA).
Heptafluorobutyric acid, formic acid (FA), dichloromethane and ammonium formate, finally,
came from Sigma-Aldrich (Bornem, Belgium). Drug-free blank plasma (different patient
pools) was obtained at the local blood bank and kept frozen until use.
2.2 Analytical standards
Individual stock solutions of GLY (1.01 x 10⁶ ng/mL) and Mp (1.01 x 10⁶ ng/mL) were
prepared by accurately weighting the required amounts in separate volumetric flasks and
dissolving in appropriate volumes of high purity water. These solutions were appropriately
diluted in high purity water by serial dilution using a Hamilton diluter (Hamilton, Bonaduz,

Small molecular mass substances: glycopyrrolate - 86 -
Switzerland) to obtain the working standard solutions used to spike plasma calibrators and
quality control samples (see section 2.2). The standard solutions were prepared: 101 x 102
ng/mL; 505 x 101 ng/mL; 101 x 101
ng/mL; 505 ng/mL; 101 ng/mL; 75.7 ng/mL and 50.5
ng/mL. Separate weightings, dilutions and volumetric material were used in the preparation
of the quality control samples which were also used in the accuracy investigation method. All
standards were kept at -20°C and were used for a maximum of 3 months.
2.3 Calibrators and quality control samples
Calibrators in plasma were prepared by adding 20 µl of the relevant working standard solution
to 1980 µl of blank plasma. Calibrators over a concentration range of 0.101 to 101 ng/ml for
GLY (101; 50.5; 10.1; 5.05; 1.01; 0.757; 0.505; 0.101 ng/ml) were obtained. Quality control
samples at three different levels (QC1 0.253 QC2 2.53 and QC3
25.3ng/mL), different from
the calibration concentrations, were separately prepared in larger pools.
2.4 Sample preparation and extraction
To 1 ml of plasma sample, 1ml of 0.2M ammonium formate (adjusted to pH 3.0 with FA) and
4ml of dichloromethane were added. Also, a fixed amount of Mp, as internal standard, was
added (50 µl of a 1/2000 dilution of the stock solution; 25.3ng). After 10 min of rotation on a
rotatory mixer, the tubes were centrifuged for 20 min at 2254 x g (25°C). 750 µl was removed
from the upper water phase and transferred into new centrifuge tubes. After addition of 1ml of
0.1M aqueous HFBA and 4ml of dichloromethane, samples were rotated again on a rotatory
mixer for 10 min. After centrifugation (20 min, 2254 x g, 25°C), the upper (water) phase was
removed as waste. The lower dichloromethane layer was evaporated to dryness under a
nitrogen stream at 35°C (TurboVap LV evaporator, Zymark). Following, dried samples were
Small molecular mass substances: glycopyrrolate - 87 -
redissolved in 200µl of eluent A (15 mM HFBA-20 mM ammonium formate buffer) before
injection.
2.5 Mobile phases
LC eluent A consisted of HFBA (15 mM)-ammonium formate buffer (20 mM) adjusted to pH
3.30 with FA. Eluent B was pure methanol. Both solvents (A) and (B) were filtered over a
0.45 µm membrane filter before use.
2.6 Liquid chromatography
The Atlantis dC18 (2.1 mm I.D., length 50 mm, particle size 3 µm) used was purchased from
Waters (Milford, MA, USA). The chromatographic system consisted of an Alliance 2795 LC
system equipped with an analytical autosampler having a 100µL injection loop installed.
Isocratic elution was performed with a fixed composition of 30% eluent A and 70% eluent B
at a flow rate of 100µl/min. After injection of 20µl of sample, a total run cycle time of 10
minutes was used.
2.7 Mass Spectrometry
The HPLC system was interfaced with a QTOF1 mass spectrometer (Micromass-Waters,
Manchester, UK), equipped with an orthogonal electrospray source (Z-spray®) operated in the
positive ion mode. The mass spectrometer was operated in the MS/MS mode allowing
maximum sensitivity and specificity. Nitrogen acted both as nebulizer (60 L/hr) and drying
gas (580 L/hr) and argon served as collision gas (4.5x10⁻³ mbar collision cell pressure). A
standard 120µm capillary was used in the electrospray ionization (ESI) interface. The source
was operated at 120 °C and the desolvation temperature was 240 °C. Electrospray capillary
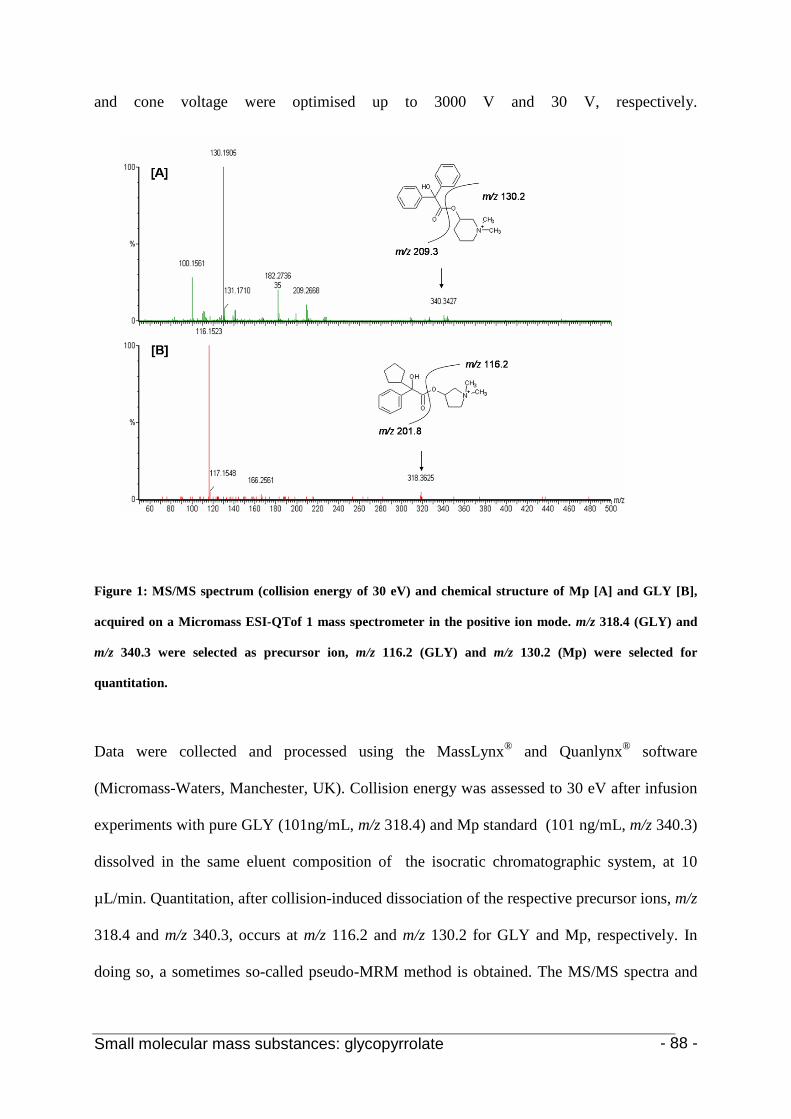
Small molecular mass substances: glycopyrrolate - 88 -
and cone voltage were optimised up to 3000 V and 30 V, respectively.
Figure 1: MS/MS spectrum (collision energy of 30 eV) and chemical structure of Mp [A] and GLY [B],
acquired on a Micromass ESI-QTof 1 mass spectrometer in the positive ion mode. m/z 318.4 (GLY) and
m/z 340.3 were selected as precursor ion, m/z 116.2 (GLY) and m/z 130.2 (Mp) were selected for
quantitation.
Data were collected and processed using the MassLynx® and Quanlynx® software
(Micromass-Waters, Manchester, UK). Collision energy was assessed to 30 eV after infusion
experiments with pure GLY (101ng/mL, m/z 318.4) and Mp standard (101 ng/mL, m/z 340.3)
dissolved in the same eluent composition of the isocratic chromatographic system, at 10
µL/min. Quantitation, after collision-induced dissociation of the respective precursor ions, m/z
318.4 and m/z 340.3, occurs at m/z 116.2 and m/z 130.2 for GLY and Mp, respectively. In
doing so, a sometimes so-called pseudo-MRM method is obtained. The MS/MS spectra and
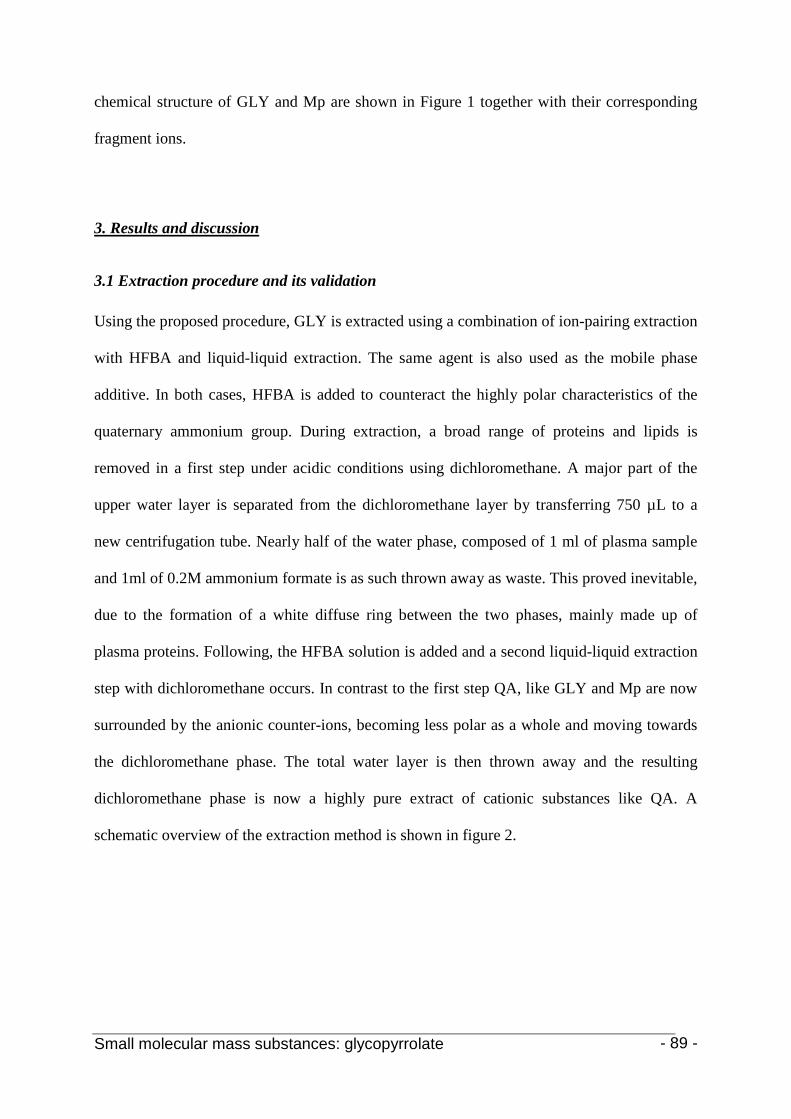
Small molecular mass substances: glycopyrrolate - 89 -
chemical structure of GLY and Mp are shown in Figure 1 together with their corresponding
fragment ions.
3.1 Extraction procedure and its validation
3. Results and discussion
Using the proposed procedure, GLY is extracted using a combination of ion-pairing extraction
with HFBA and liquid-liquid extraction. The same agent is also used as the mobile phase
additive. In both cases, HFBA is added to counteract the highly polar characteristics of the
quaternary ammonium group. During extraction, a broad range of proteins and lipids is
removed in a first step under acidic conditions using dichloromethane. A major part of the
upper water layer is separated from the dichloromethane layer by transferring 750 µL to a
new centrifugation tube. Nearly half of the water phase, composed of 1 ml of plasma sample
and 1ml of 0.2M ammonium formate is as such thrown away as waste. This proved inevitable,
due to the formation of a white diffuse ring between the two phases, mainly made up of
plasma proteins. Following, the HFBA solution is added and a second liquid-liquid extraction
step with dichloromethane occurs. In contrast to the first step QA, like GLY and Mp are now
surrounded by the anionic counter-ions, becoming less polar as a whole and moving towards
the dichloromethane phase. The total water layer is then thrown away and the resulting
dichloromethane phase is now a highly pure extract of cationic substances like QA. A
schematic overview of the extraction method is shown in figure 2.
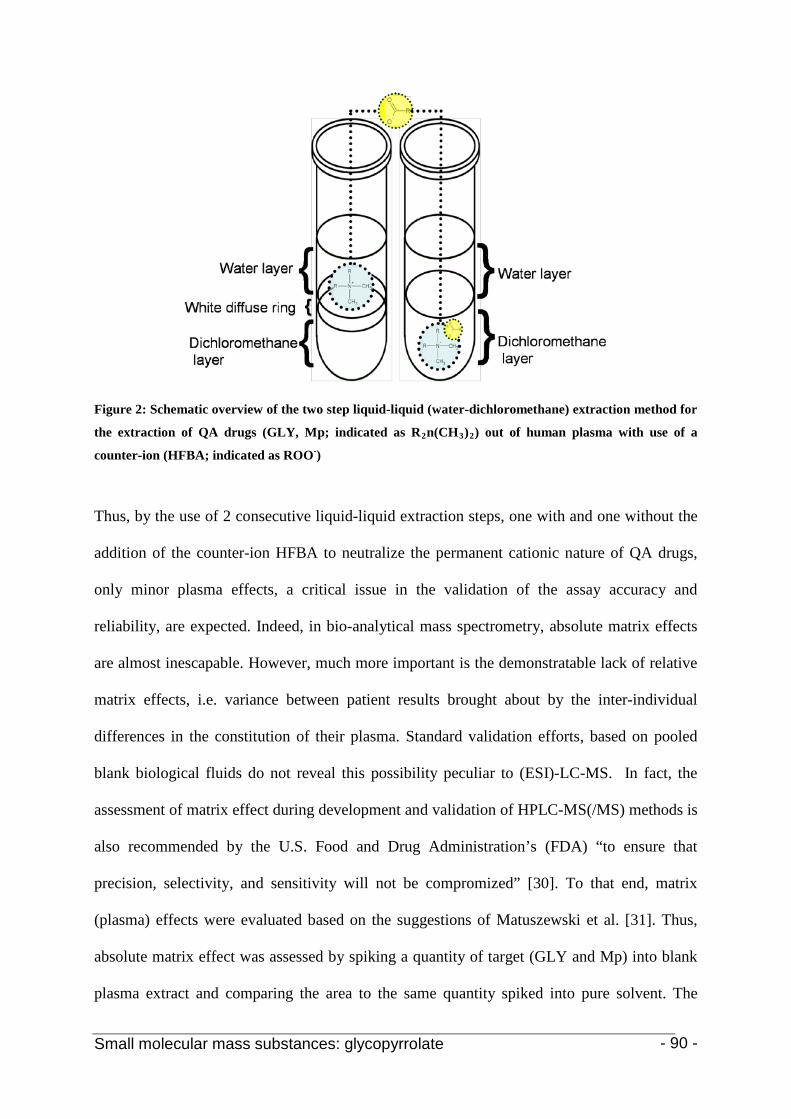
Small molecular mass substances: glycopyrrolate - 90 -
Figure 2: Schematic overview of the two step liquid-liquid (water-dichloromethane) extraction method for
the extraction of QA drugs (GLY, Mp; indicated as R2n(CH3)2) out of human plasma with use of a
counter-ion (HFBA; indicated as ROO-
)
Thus, by the use of 2 consecutive liquid-liquid extraction steps, one with and one without the
addition of the counter-ion HFBA to neutralize the permanent cationic nature of QA drugs,
only minor plasma effects, a critical issue in the validation of the assay accuracy and
reliability, are expected. Indeed, in bio-analytical mass spectrometry, absolute matrix effects
are almost inescapable. However, much more important is the demonstratable lack of relative
matrix effects, i.e. variance between patient results brought about by the inter-individual
differences in the constitution of their plasma. Standard validation efforts, based on pooled
blank biological fluids do not reveal this possibility peculiar to (ESI)-LC-MS. In fact, the
assessment of matrix effect during development and validation of HPLC-MS(/MS) methods is
also recommended by the U.S. Food and Drug Administration’s (FDA) “to ensure that
precision, selectivity, and sensitivity will not be compromized” [30]. To that end, matrix
(plasma) effects were evaluated based on the suggestions of Matuszewski et al. [31]. Thus,
absolute matrix effect was assessed by spiking a quantity of target (GLY and Mp) into blank
plasma extract and comparing the area to the same quantity spiked into pure solvent. The

Small molecular mass substances: glycopyrrolate - 91 -
same solvent composition (30/70 (v/v) eluent A/ eluent B) as during the isocratic
chromatographic separation step was used. This was done at all three of the QC concentration
levels (0.253 2.53and 25.3ng/mL) and in threefold. Moreover, the experiment was repeated
for four plasma lots, originating from four different individuals, allowing the evaluation of
relative matrix effects too. Using the aforementioned method, the matrix effect was 110.5 % ±
20.13 (mean ± sd; n=3) for QC1; 143.9 % ± 11.59 % for QC2 and 120.5 % ± 6.842 % for
QC3. As can be seen, some ionization enhancement (matrix effect > 100%) is present.
The assessment of the relative matrix effect was based on the variability of the peak area ratio
GLY/ Mp (n=3) spiked into blank extracts of 4 different plasma lots [31]. In doing so, the
relative matrix effect was 10.14% ± 3.339 (mean ± sd; n=3) for QC1; 5.470% ± 0.5846 for
QC2 and 10.89% ± 1.446 for QC3. This variability seems to be comparable or only slightly
higher to the precision of determination of standards injected directly in the mobile phase
(9.639% ± 0.7761 (mean ± sd; n=3); 5.132 % ± 1.426 and 6.715% ± 0.4908 respectively).
These data confirm that relative matrix effect has practically no effect on the quantitation of
GLY.
The extraction efficiency was equally determined for the three levels of quality control
samples, based on the recommendations by Matuszewski et al. as the concentration ratio of
spiked plasma extract to blank plasma extract fortified with the same amount of compound
[31]. In doing so, absolute extraction recovery was 41.77% ± 2.218 (mean ± sd; n=3), 45.33
% ± 5.553 and 42.08% ± 4.274 for QC1, QC2 and QC3. The latter extraction recoveries seem
to be low. However, taking into account that approximately half of the water layer is
discarded during the first liquid-liquid extraction step, potential extraction efficiency could be

Small molecular mass substances: glycopyrrolate - 92 -
up to 80 %. This, however, was not favoured in order to increase process reproducibility and
for ease of handling.
Process efficiency, describing both plasma effect and extraction efficiency combined, was
calculated as the concentration ratio of spiked plasma extract to the same quantity spiked into
pure eluent. For the 3 QC levels, process efficiency was respectively 45.17% ± 5.739 (mean
± sd; n=3); 64.02% ± 4.501 and 49.21 ± 1.997. Evidently, throwing away nearly half of the
water layer during the first extraction step again affects these numbers.
3.2 Chromatographic performance
The chromatographic separation step takes 10 minutes under isocratic conditions, i.e. 70 % of
eluent B. Different isocratic eluent compositions were evaluated. 30:70 of 15mM HFBA in 20
mM ammonium formate buffer (pH=3.30): methanol was finally preferred as eluent
composition based on retention time behaviour. A minimal retention time (Tr) of minimal 5
minutes was aimed at, allowing sufficient chromatographic separation of potentially co-
extracted substances for one thing and a fast sample turnover time for another. In doing so, Tr
was 6.817 min ± 0.1401 min (mean ± sd; n=36) min. for GLY and 6.018 min ± 0.1521 min
(mean ± sd; n=36) min for the IS Mp. Figure 3 shows a typical mass chromatogram of GLY
and Mp.

Small molecular mass substances: glycopyrrolate - 93 -
Figure 3: typical mass chromatograms of Mp ([A] m/z 340.3 ->130.2) and GLY ([B] m/z 318.4 ->116.2) at
the QC2 concentration level. Tr was 6.817 ± 0.1401 (mean ± sd; n=36) min. for GLY and 6.018 ± 0.1521
(mean ± sd; n=36) min for the IS Mp.
3.3 Calibration and method validation
For calibration purposes, the analyte to IS peak area ratio was plotted against analyte
concentration and weighted regression analysis was applied to calculate the calibration
curves. By doing so, data heteroscedasticity is counteracted and a higher weight is allocated to
the lower concentrations in the calibration curve, leading to an improved quantitation of the
lower concentrations. A weighting factor 1/X was chosen, based on the analysis of residuals
and accuracy of quality control samples. Quadratic calibration curves (eight calibration points,
one zero sample) gave the best fit based on statistical regression analysis comparison
(Statgraphics®, Manugistics, Inc., Rockville, MD), the analysis of residuals (i.e. lowest
absolute sum) and the acceptance criteria of the concomitant quality control samples
calculated according to the different fits applied to a particular calibration set. The advent of

Small molecular mass substances: glycopyrrolate - 94 -
powerful automated quantitation software tools, e.g. Quanlynx®, makes quadratic calibrations
nearly as easy in use as linear ones, provided that one accepts the statistically enforced
requirement to use a somewhat larger number of points in the calibration exercise (8
calibrators are used instead of a minimal of 6 required for linear calibration curves).
Nowadays in LC-MS(/MS), especially with electrospray ionization (and in the field of TOF
analyzers), linear calibration curves with a dynamic range exceeding 2 decades are hard to
find. We have often seen that electrospray ionization does not generates analyte ions a priori
by a linear process, especially not over a larger concentration area. The latter is especially true
when analyzing biological extracts where extract impurity affects the ionization process.
Thus, forcing a linear function through, in essence, curvilinear data rather introduces accuracy
errors [32]. Moreover, quadratic calibration curves clearly provided an extended measurement
interval, in our case from 0.101 to 101 ng/mL. Indeed, a linear calibration correlation was
only observed with the lower 6 calibrators included. At higher concentrations, the
effectiveness of the electrospray ionization process begins to deviate from an absolute linear
process (see Figure 4).
Figure 4: curvilinear calibration function of GLY, ranging from 0.101 to 101 ng/mL. When the 2 highest
calibrators (100.9 ng/mL and 50.45 ng/mL) are not included in the concentration response curve, the
latter shifts to a more linear function.
Small molecular mass substances: glycopyrrolate - 95 -
Each calibration curve was acquired in triplicate allowing validation of the calibration curves
based upon the Food and Drug Administration bioanalytical method validation guidance
protocol [18]. In this context, precision, accuracy, limit of detection (LOD), lower and upper
limit of quantitation (LLOQ, resp. ULOQ) and selectivity were also determined. To that end,
calibration curves were run on 6 different days. The concurrently analyzed (different days,
n=6), quality control samples were also used to calculate precision and accuracy of the
method. Using these samples, accuracy, as percentage error (100 + [concentration (measured-
added)/added] x100), was assessed.
The mean values (±SD, n=6) of the quadratic equation coefficients were: y = -2.210 * 10-4
(±3.926 * 10-5)*x2 + 5.847 * 10-2 (±5.274 * 10-3)*x + 4.081 * 10-3 (±4.816 * 10-4). The mean
coefficients of determination (R2) was 0.9995 (n = 6, RSD% 0.02160). ANOVA analysis
always revealed a statistically significant calibration relationship at the 99% confidence level.
The 95% confidence interval for the intercept always included zero, statistically indicating
that the calibration curve passes through zero. The lower limit of quantitation (LLOQ) was
established at the level of the lowest calibrator, i.e. 0.101 ng/mL, provided that an acceptable
level of precision and accuracy is achieved. At this concentration, a signal to noise ratio of
5.2, precision (RSD%, n=6) of 17.95% and accuracy (n=6) of 88.93% was noted. These data
are within the generally accepted validation criteria limits (precision < 20% and accuracy
between 80 and 120 %). Accordingly, the ULOQ was established at the highest calibrator,
being 101 ng/mL. The, less informative, limit of detection (LOD) was defined at a signal to
noise ratio equal to 3 and approximated from the lowest calibrator. In doing so, an LOD for
GLY of nearly 5.00 * 10-2
ng/mL is achieved.
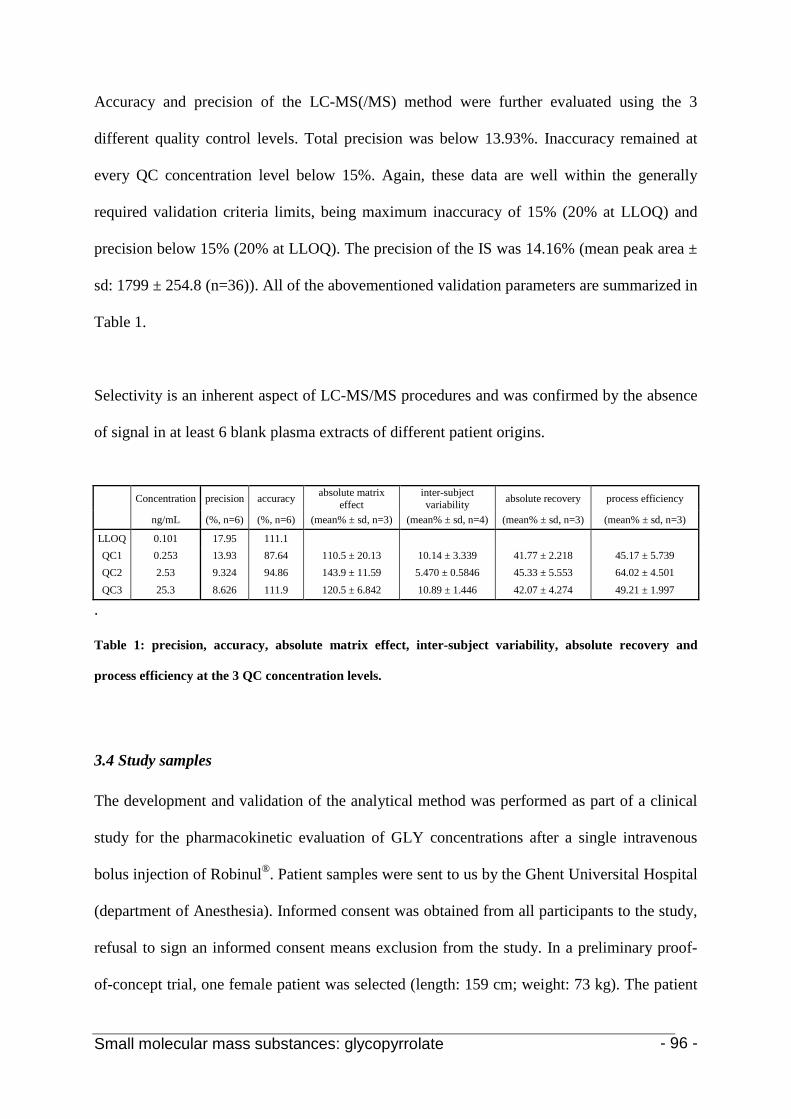
Small molecular mass substances: glycopyrrolate - 96 -
Accuracy and precision of the LC-MS(/MS) method were further evaluated using the 3
different quality control levels. Total precision was below 13.93%. Inaccuracy remained at
every QC concentration level below 15%. Again, these data are well within the generally
required validation criteria limits, being maximum inaccuracy of 15% (20% at LLOQ) and
precision below 15% (20% at LLOQ). The precision of the IS was 14.16% (mean peak area ±
sd: 1799 ± 254.8 (n=36)). All of the abovementioned validation parameters are summarized in
Table 1.
Selectivity is an inherent aspect of LC-MS/MS procedures and was confirmed by the absence
of signal in at least 6 blank plasma extracts of different patient origins.
.
Table 1: precision, accuracy, absolute matrix effect, inter-subject variability, absolute recovery and
process efficiency at the 3 QC concentration levels.
3.4 Study samples
The development and validation of the analytical method was performed as part of a clinical
study for the pharmacokinetic evaluation of GLY concentrations after a single intravenous
bolus injection of Robinul®
. Patient samples were sent to us by the Ghent Universital Hospital
(department of Anesthesia). Informed consent was obtained from all participants to the study,
refusal to sign an informed consent means exclusion from the study. In a preliminary proof-
of-concept trial, one female patient was selected (length: 159 cm; weight: 73 kg). The patient
Concentration precision accuracy absolute matrix effect
inter-subject variability absolute recovery process efficiency
ng/mL (%, n=6) (%, n=6) (mean% ± sd, n=3) (mean% ± sd, n=4) (mean% ± sd, n=3) (mean% ± sd, n=3)
LLOQ 0.101 17.95 111.1 QC1 0.253 13.93 87.64 110.5 ± 20.13 10.14 ± 3.339 41.77 ± 2.218 45.17 ± 5.739 QC2 2.53 9.324 94.86 143.9 ± 11.59 5.470 ± 0.5846 45.33 ± 5.553 64.02 ± 4.501 QC3 25.3 8.626 111.9 120.5 ± 6.842 10.89 ± 1.446 42.07 ± 4.274 49.21 ± 1.997

Small molecular mass substances: glycopyrrolate - 97 -
has been treated pre-operatively with tamoxifen for 7 days. Before the operation, one bolus
injection of Robinul®, containing 0.4 mg GLY, has been given and a plasma sample was
taken (T0). Following, a second and third sample were taken after 5 and 10 minutes (T5 and
T10) respectively. Al the samples were collected through an arterial line and measured using
the aforesaid method. The study samples were run in between 2 calibration curves, with the
required quality control samples in between. In doing so, concentration of GLY was 12.91
and 4.926 ng/mL for T5 and T10 respectively. For T0, no GLY concentration was detected.
The actual study will allow, among other clinical study objectives, full evaluation of the
pharmacokinetic characteristics of GLY after a single bolus injection with Robinul®
based on
an extended number of study patients. This study phase is in a preliminary stage.
A fully validated LC-MS(/MS) method was developed for the determination of GLY in
human plasma. Method evaluation was performed in accordance to the widely accepted
international validation standards as proposed by the US FDA. To obtain a reliable LC-MS
procedure, adequate sample clean-up proved necessary. This was achieved by a simple and
relatively fast two step liquid-liquid extraction procedure, one with and one without the use of
the counter-ion HFBA to neutralize the permanently positive charge state of QA drugs. In
doing so, during validation relative and absolute matrix effects were found of insignificant
influence on the quantitation procedure. Other mandatory validation results were also in
concordance with internationally accepted performance criteria. The same counter-ion was
also used during the chromatographic separation step using a standard C18 phase. The
isocratic solvent LC-MS(/MS) method takes only 10 minutes allowing the quantitation of
GLY over a concentration range of 3 decades with a fast sample turnover time.
4. Conclusion

Small molecular mass substances: glycopyrrolate - 98 -
This work was supported by grant B/06859-BOF06/24j/025 (Bijzonder OnderzoeksFonds of
the Ghent University) and grant G.0320.0 (FWO-Vlaanderen).
5. Acknowledgements
1. A. Clifford, C.A. Bernstein, J.H. Waters, M.C. Torjman, and D. Ritter, J. Clin. Anesth., 1996 (8): p. 515
6. References
2. L. Manchikanti, and J.R. Roush, Anesth Analg, 1984 (63): p.40 3. DM. Dewan, A.S. Wheeler, F.M. James, H.M. Floyd, and L. Rhyne, Can Anaesth Soc J.,
1982 (29): p.27. 4. R.K. Mirakhur, J. Reid, and J. Elliott, Anaesthesia, 1979 (34): p.453 5. T. Ali-Melkkila, T. Kaila, and J. Kanto, Acta Anaesthesiol Scand, 1989 (33): p.513 6. J. Penttilä, A. Helminen, K. Luomala, and H. Scheinin, Eur J Clin Pharmacol, 2001 (57):
p.153 7. L.C. Matassa, D. Woodard, R.K. Leavitt, P. Firby, and P. Baumier, J. Chromatgr., 1992
(573): p.43 8. R. Leavitt, P. Firby, W. Farmer,and P. Paterson, Proc. 44th
9. F.P.W. Tang, G.N. Leung, and T.S.M. Wan, Electrophoresis 2001 (22): p.2201
AORC, May 1991, Cincinnatti, OH.
10. A.M. Duffield, P.J. Reilly, D. Nelson, H. Dama, and C.J. Suann, Proc. 44th
11. R. Mui, L. Downey, D.E. Auer, and R. Houghton, Proc. 11
AORC, May 1991, Cincinnatti, OH.
th
12. R. Castro, E. Moyano, and M.T. Galceran, J Chromatogr. A, 1999 (830): p.145
Int. Conf. Racing Anal. Vet, 1996, Queensland, p. 448-193
13. M.C. Carneiro, L. Puignou, and M.T. Galceran. J. Chromatogr. A, 1994 (66914. M.T. Galceran, M.C. Carneiro, M. Diez, and L. Puignou. J. Chromatogr. A, 1997 (
): p. 217 782
15. D. Kaniansky, F. Ivnyi, and F.I. Onuska. Anal. Chem., 1994 (
): p. 289
6616. D. Barceló, G. Durand, and R.J. Vreeken. J. Chromatogr., 1993 (
): p. 1817 647
17. T. Itagaki, S.J. Lai, and S.R. Binder, J. Liq. Chromatogr. Rel. Technol., 1997 (): p. 271
2018. R. Kesari, M. Rai, and V.K. Gupta. Spectrophotometric J. Assoc. Off. Anal. Chem., 1997
(
): p. 3339
8019. C. Fuke, K. Ameno, S. Ameno, T. Kiriu, T. Shinohara, K. Sog, I. Ijirin, J. Anal. Toxicol.,
1992 (
): p. 388
1620. G.J. Moody, R.K. Owusu, and J.D. Thomas, Anal. Lett., 1988 (
): p.214 21
21. K. Watabe, K. Okada, and T. Katsu. J. Toxicol. Environ. Health, 1992 (): p.1653
3822. K. Ameno, C. Fuke, S. Ameno, H. KInoshita, and I. Ijiri, J. Liq. Chromatogr., 1995 (
), p.142 18
23. T.M. Chichila and S.M. Walters, J. Assoc. Off. Anal. Chem., 1991 (
): p.2115
7424. B.L. Worobey. J. Assoc. Off. Anal. Chem., 1993 (
): p.961 76
25. J. Hajslová, P. Cuhra, T. Davídek, and K. Davídek, J. Chromatogr., 1989 (): p.881
47926. R.J. Vreeken, W.D. Vandongen, R.T. Ghijsen, G.J. Dejong, H. Lingeman, U.A.T.
Brinkman, R.G.J. Vanleuken, G.T.C. Kwakkenbos, and R.S. Deelder, Biol. Mass Spectrom., 1992 (
): p.243
21): p.305
Small molecular mass substances: glycopyrrolate - 99 -
27. G.R. Murray, T.N. Calvey, N.E. Williams, and K. Chan, J. Chromatogr.,1984 (308): p.143
28. M. Ariffin, and R.A. Anderson, J. Chromatogr. B, 2006 (842): p.91 29. Y. Pico, G. Font, J.C. Moltó, and J. Mañes, J. Chromatogr. A, 2000 (885): p.251 30. Guidance for Industry. Bioanalytical Method Validation. U.S. Department of Health and
Human Services, Food and Drug Administration. May 2001. 31. B.K. Matuszewski, M.L. Constanzer, and C.M. Chavez-Eng, Anal Chem., 2003 (75):
p.3019 32. M.L. Storme, F.H. Jansen, W. Goeteyn, and J.F. Van Bocxlaer, Rapid. Commun. Mass.
Spectrom. 2006 (19): p.2947


Larger molecular mass substances - 101 -
Larger Molecular Mass Substances:
a proof of concept study on cystatin C

Larger molecular mass substances
- 102 -

Larger molecular mass substances: general concept - 103 -
Chapter 1
General concept
Larger molecular mass substances: general concept - 104 -
It is in the scope of the following chapters to develop a widely applicable mass spectrometric tool for the
absolute quantitation of proteins. This, not to replace already existing immunological techniques nowadays
commercially available, but rather as a standard technique, applicable with minor modifications on a broad
range of proteins, allowing e.g. the evaluation of these immunoassays. In the most favourable state of affairs, an
alternative mass spectrometric technique could be used to standardize the results obtained by different
immunoassays where the result can differ when different antibodies, calibrators, detection techniques are used
[1].
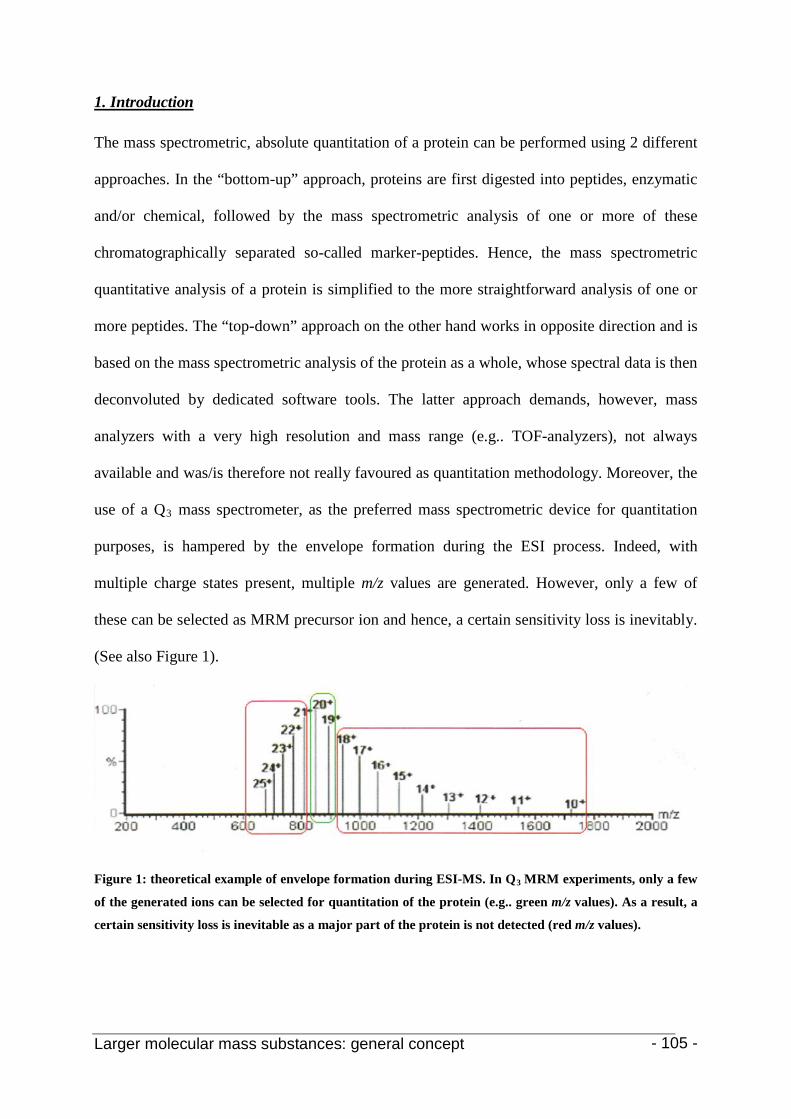
Larger molecular mass substances: general concept - 105 -
The mass spectrometric, absolute quantitation of a protein can be performed using 2 different
approaches. In the “bottom-up” approach, proteins are first digested into peptides, enzymatic
and/or chemical, followed by the mass spectrometric analysis of one or more of these
chromatographically separated so-called marker-peptides. Hence, the mass spectrometric
quantitative analysis of a protein is simplified to the more straightforward analysis of one or
more peptides. The “top-down” approach on the other hand works in opposite direction and is
based on the mass spectrometric analysis of the protein as a whole, whose spectral data is then
deconvoluted by dedicated software tools. The latter approach demands, however, mass
analyzers with a very high resolution and mass range (e.g.. TOF-analyzers), not always
available and was/is therefore not really favoured as quantitation methodology. Moreover, the
use of a Q
1. Introduction
3 mass spectrometer, as the preferred mass spectrometric device for quantitation
purposes, is hampered by the envelope formation during the ESI process. Indeed, with
multiple charge states present, multiple m/z values are generated. However, only a few of
these can be selected as MRM precursor ion and hence, a certain sensitivity loss is inevitably.
(See also Figure 1).
Figure 1: theoretical example of envelope formation during ESI-MS. In Q3
MRM experiments, only a few
of the generated ions can be selected for quantitation of the protein (e.g.. green m/z values). As a result, a
certain sensitivity loss is inevitable as a major part of the protein is not detected (red m/z values).
Larger molecular mass substances: general concept - 106 -
Essential in the “bottom-up” methodology is a reproducible digestion method and an adequate
IS. The main point pertaining to that IS is that it should be not only capable of compensating
for analytical variations (e.g.. injection differences, ME, etc.) but especially for differences
during sample treatment, including the digestion step(s). While the performance of quasi all
quantitation methods using LS-MS(/MS) is highly dependent on adequate internal
standardization, the latter is especially true for proteins.
2.1 Why cystatin C?
2. Selection of a model protein
Cystatin C was chosen as a model protein for evaluation of the marker peptide (bottom-up
quantitation) methodology for a number of reasons. First of all because of its structure.
Cystatin C is a non-glycosylated protein of a medium size. Consequently, it represents a
model of intermediate difficulty: although being a real protein in terms of its size, it is not too
big in size. At the other hand, it is not exactly known in what way glycosylation of a protein
might impact on the quantitative nature of the proteolysis step. It was considered wise to
evaluate the quantitative aspects of proteolysis without the potential confounding influence of
glycosylation first. Finally, there was also the advantage that, even though we wanted to use
cystatin C as a model, this model also has a clinical significance. The latter is based on the
fact that cystatin C is expected, in the near future, to act as a measurement alternative of
kidney function. Until now, kidney function is expressed by the glomerular filtration rate
(GFR) based on the serum creatinine level. As such, the GFR describes the volume of urine
formed per time unit (mL/min) by the totality of both glumerular capillaries. Different
equations have been proposed of which the Cockcroft-Gault and the MDRD (Modification of
Diet in Renal Diseases) formula are the most commonly used for the estimation of adult GFR
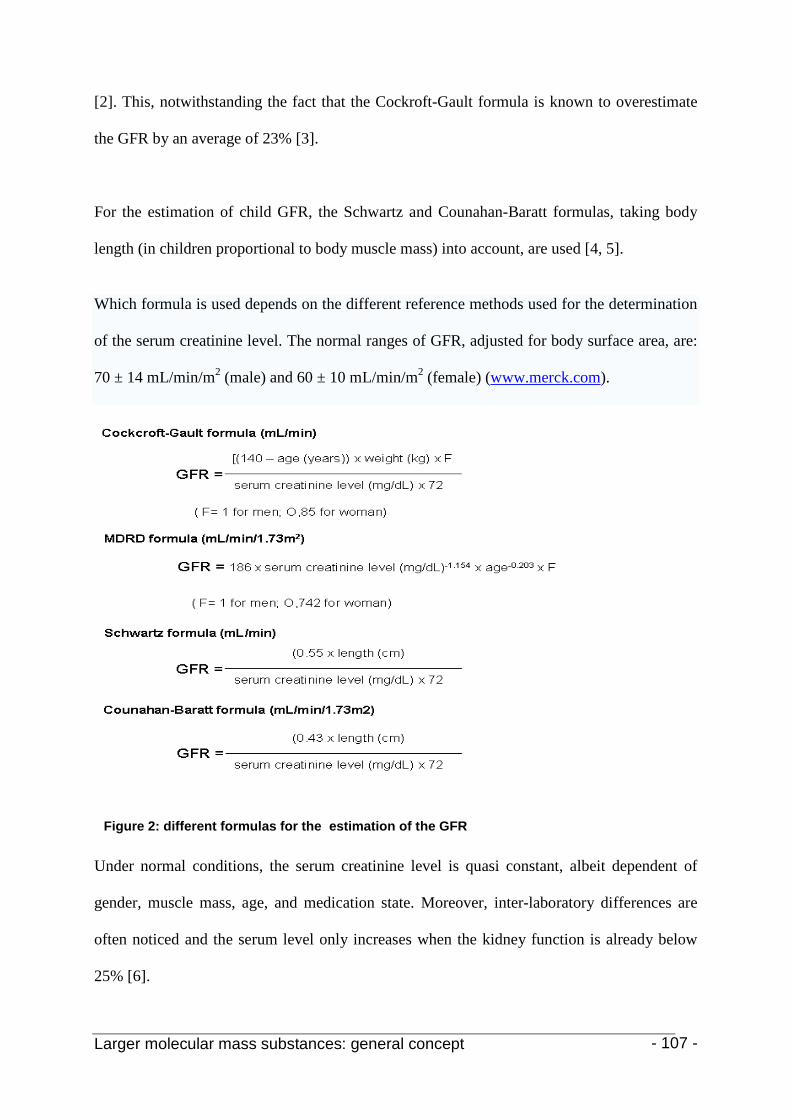
Larger molecular mass substances: general concept - 107 -
[2]. This, notwithstanding the fact that the Cockroft-Gault formula is known to overestimate
the GFR by an average of 23% [3].
For the estimation of child GFR, the Schwartz and Counahan-Baratt formulas, taking body
length (in children proportional to body muscle mass) into account, are used [4, 5].
Which formula is used depends on the different reference methods used for the determination
of the serum creatinine level. The normal ranges of GFR, adjusted for body surface area, are:
70 ± 14 mL/min/m2 (male) and 60 ± 10 mL/min/m2 (female) (www.merck.com).
Under normal conditions, the serum creatinine level is quasi constant, albeit dependent of
gender, muscle mass, age, and medication state. Moreover, inter-laboratory differences are
often noticed and the serum level only increases when the kidney function is already below
25% [6].
Figure 2: different formulas for the estimation of the GFR
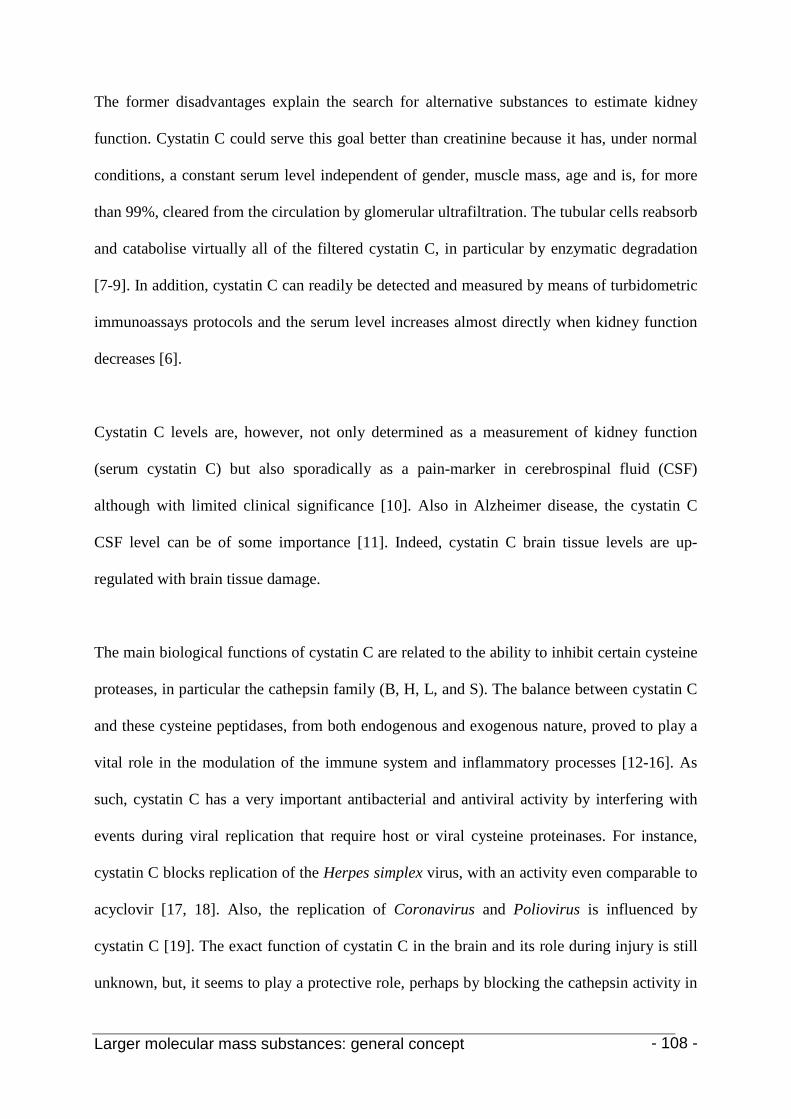
Larger molecular mass substances: general concept - 108 -
The former disadvantages explain the search for alternative substances to estimate kidney
function. Cystatin C could serve this goal better than creatinine because it has, under normal
conditions, a constant serum level independent of gender, muscle mass, age and is, for more
than 99%, cleared from the circulation by glomerular ultrafiltration. The tubular cells reabsorb
and catabolise virtually all of the filtered cystatin C, in particular by enzymatic degradation
[7-9]. In addition, cystatin C can readily be detected and measured by means of turbidometric
immunoassays protocols and the serum level increases almost directly when kidney function
decreases [6].
Cystatin C levels are, however, not only determined as a measurement of kidney function
(serum cystatin C) but also sporadically as a pain-marker in cerebrospinal fluid (CSF)
although with limited clinical significance [10]. Also in Alzheimer disease, the cystatin C
CSF level can be of some importance [11]. Indeed, cystatin C brain tissue levels are up-
regulated with brain tissue damage.
The main biological functions of cystatin C are related to the ability to inhibit certain cysteine
proteases, in particular the cathepsin family (B, H, L, and S). The balance between cystatin C
and these cysteine peptidases, from both endogenous and exogenous nature, proved to play a
vital role in the modulation of the immune system and inflammatory processes [12-16]. As
such, cystatin C has a very important antibacterial and antiviral activity by interfering with
events during viral replication that require host or viral cysteine proteinases. For instance,
cystatin C blocks replication of the Herpes simplex virus, with an activity even comparable to
acyclovir [17, 18]. Also, the replication of Coronavirus and Poliovirus is influenced by
cystatin C [19]. The exact function of cystatin C in the brain and its role during injury is still
unknown, but, it seems to play a protective role, perhaps by blocking the cathepsin activity in
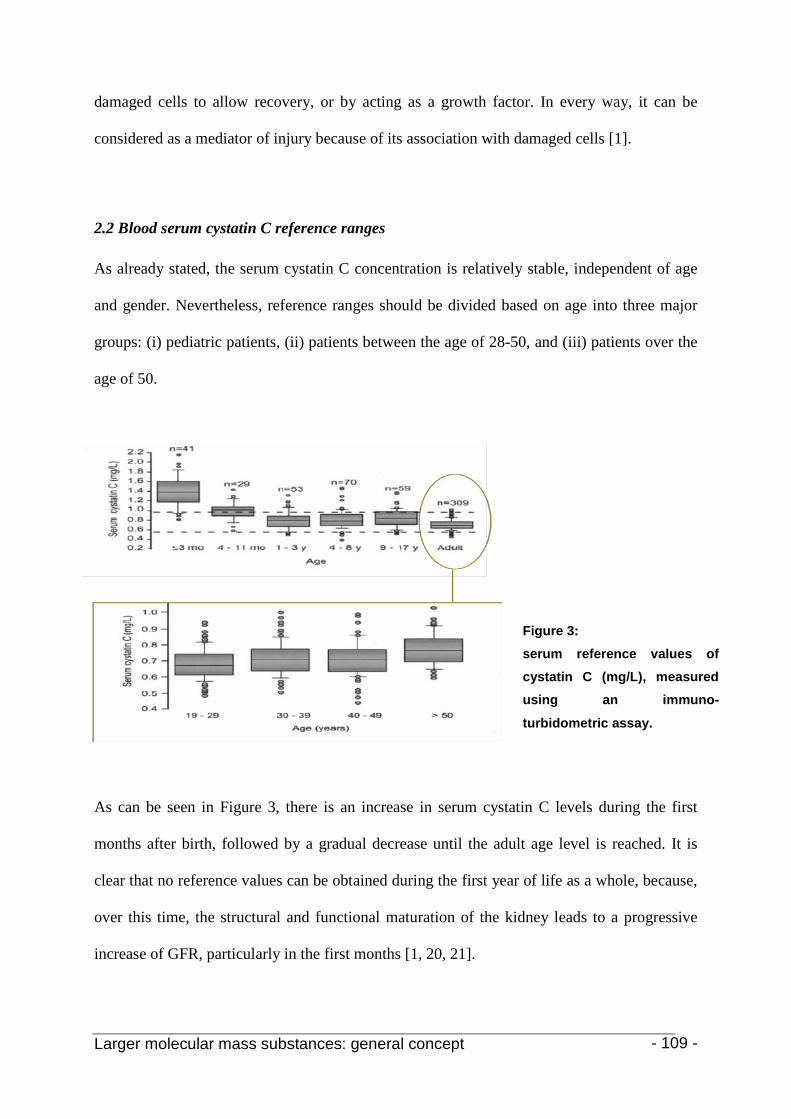
Larger molecular mass substances: general concept - 109 -
damaged cells to allow recovery, or by acting as a growth factor. In every way, it can be
considered as a mediator of injury because of its association with damaged cells [1].
2.2 Blood serum cystatin C reference ranges
As already stated, the serum cystatin C concentration is relatively stable, independent of age
and gender. Nevertheless, reference ranges should be divided based on age into three major
groups: (i) pediatric patients, (ii) patients between the age of 28-50, and (iii) patients over the
age of 50.
As can be seen in Figure 3, there is an increase in serum cystatin C levels during the first
months after birth, followed by a gradual decrease until the adult age level is reached. It is
clear that no reference values can be obtained during the first year of life as a whole, because,
over this time, the structural and functional maturation of the kidney leads to a progressive
increase of GFR, particularly in the first months [1, 20, 21].
Figure 3:
serum reference values of
cystatin C (mg/L), measured
using an immuno-
turbidometric assay.
Larger molecular mass substances: general concept - 110 -
For adults, the serum cystatin C concentration is constant until the age of 50, afterwards an
increase is noticed. At every age, no differences between sexes are found. In general, an all-
over reference range between 0.5 and 1.8 mg/L (µg/mL) is proposed by Finney et al.
however, after the age of 50-60 years, more precise age-based reference ranges should be
used because serum cystatin C levels gradually increase until the age of 90 years and further
[20, 21].
2.3 Cystatin C structure
Cystatin C, previously also named either γ-trace or post-γ-globulin, is part of the cystatin
super family, a name proposed by Barett et al. in 1981. The name cystatin refers hereby to the
ability to inhibit certain cysteine proteinases (cfr. supra) [22]. The first cysteine proteinase
inhibitors described were obtained from chicken egg-white and were shown to inhibit ficin,
papain, and cathepsin B and C [23, 24].
Nowadays, the cystatin super family is divided into four main cystatin families, distinguished
based on their location, size, and the complexity of the peptide chain. Based on the criterion
of sequence similarity, proteins that share around 50% level of similarity with other proteins
are considered to belong to the same family [25, 26].
As such, type 1 cystatins, also called stefins, are mainly located intracellular and are not
synthesized as pre-proteins with signal peptides. They are generally considered as
cytoplasmatic proteins and their members, for instance human cystatin A, play a key role in
the human defence system [27].
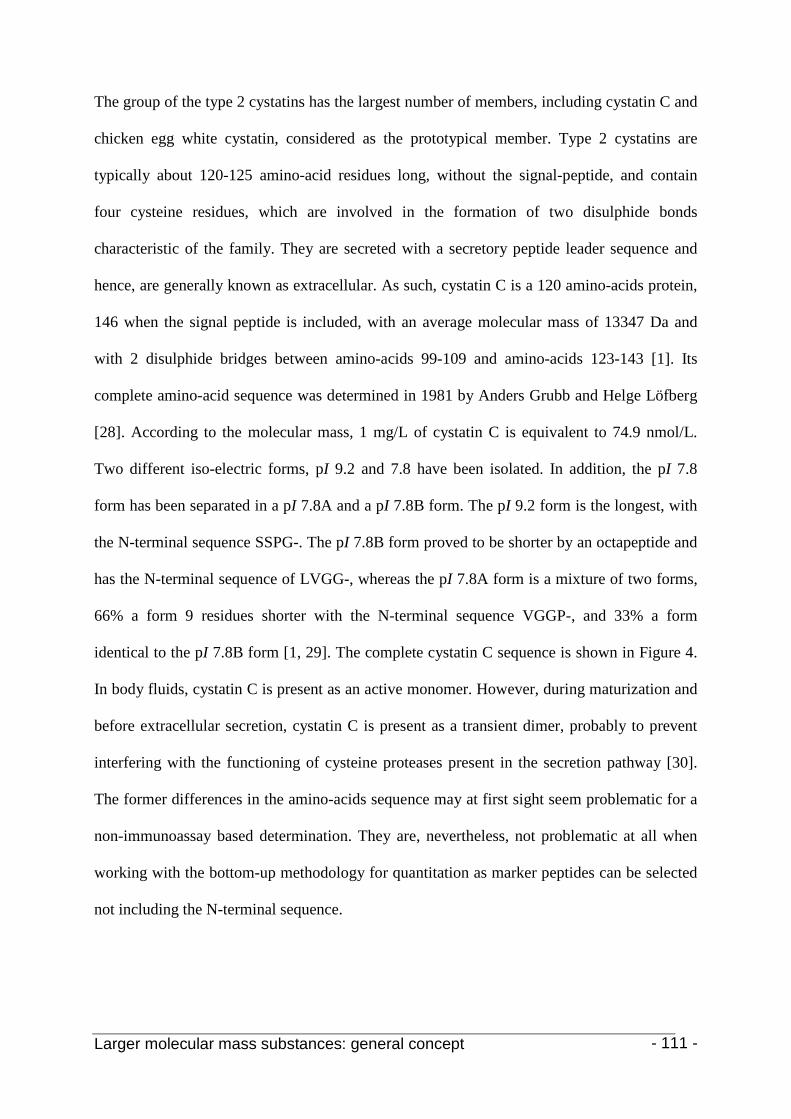
Larger molecular mass substances: general concept - 111 -
The group of the type 2 cystatins has the largest number of members, including cystatin C and
chicken egg white cystatin, considered as the prototypical member. Type 2 cystatins are
typically about 120-125 amino-acid residues long, without the signal-peptide, and contain
four cysteine residues, which are involved in the formation of two disulphide bonds
characteristic of the family. They are secreted with a secretory peptide leader sequence and
hence, are generally known as extracellular. As such, cystatin C is a 120 amino-acids protein,
146 when the signal peptide is included, with an average molecular mass of 13347 Da and
with 2 disulphide bridges between amino-acids 99-109 and amino-acids 123-143 [1]. Its
complete amino-acid sequence was determined in 1981 by Anders Grubb and Helge Löfberg
[28]. According to the molecular mass, 1 mg/L of cystatin C is equivalent to 74.9 nmol/L.
Two different iso-electric forms, pI 9.2 and 7.8 have been isolated. In addition, the pI 7.8
form has been separated in a pI 7.8A and a pI 7.8B form. The pI 9.2 form is the longest, with
the N-terminal sequence SSPG-. The pI 7.8B form proved to be shorter by an octapeptide and
has the N-terminal sequence of LVGG-, whereas the pI 7.8A form is a mixture of two forms,
66% a form 9 residues shorter with the N-terminal sequence VGGP-, and 33% a form
identical to the pI 7.8B form [1, 29]. The complete cystatin C sequence is shown in Figure 4.
In body fluids, cystatin C is present as an active monomer. However, during maturization and
before extracellular secretion, cystatin C is present as a transient dimer, probably to prevent
interfering with the functioning of cysteine proteases present in the secretion pathway [30].
The former differences in the amino-acids sequence may at first sight seem problematic for a
non-immunoassay based determination. They are, nevertheless, not problematic at all when
working with the bottom-up methodology for quantitation as marker peptides can be selected
not including the N-terminal sequence.
Larger molecular mass substances: general concept - 112 -
Members of the family 3 cystatins, mainly intravascular proteins, are also known as
kininogens. They represent the most complex members of the cystatin super family and
contain three cystatin-like domains, each with two disulphide bonds at positions homologous
to those in type 2 cystatins [31].
Lastly, type 4 cystatins, recently named as fetuins, have been identified as major proteins
during foetal life, primarily in blood and brain and are considered as key proteins in several
metabolic pathways, including the regulation of osteogenesis and bone resorption. They
contain two type 2 cystatin-like domains and are, together with some type 3 cystatins, the only
proteins in the cystatin super family with known glycosylations [32, 33].
The ideal IS is an IS chromatographically co-eluting with the analyte. In the case of peptides
from a protein digest, this can most easily be achieved by use of isotopically labelled internal
standards. These change the mass of the peptide but not its chemical behaviour [34].
Unfortunately, they need to be custom-made and hence, their cost is very high, depending on
the length of the peptide. Moreover, based on the fact that the actual analyte is a protein and
the IS is a peptide, severe quantitation errors may result due to the selection of unsuitable
reference peptides and/or imperfect protein proteolysis [35]. In literature, the use of synthetic
peptides as IS for the absolute quantitation of proteins is sometimes described by the acronym
AQUA (Absolute QUAntitation) [36].
3. Selection of an adequate internal standard
Nowadays, a broad range of differential techniques have been optimized for the production of
(isotopically) labelled IS peptides, thus co-eluting, during digestion, e.g.. ICAT®, iTRAQ®,
etc., or even proteins (SILAC). All of them are, however, designed for differential
Larger molecular mass substances: general concept - 113 -
quantitation of two or more subsets of proteins, e.g.. healthy versus diseased persons, based
on the labelling of certain amino-acid side chains (cfr. supra). Nevertheless, they can be
adapted for use in absolute quantitation experiments where the samples themselves can be
seen as one protein subset. The other subset is then formed by a fixed amount of the same
protein acting as IS. After differential labelling, the two subsets are mixed together, digested
and mass spectrometrically detected using the fixed mass difference between the two subsets
(sample and IS). The latter techniques are widely applicable in proteomic research using
nano-LC-MS but are of less importance when working with greater sample volumes.
Moreover, the 2 (or more subsets), as is the case for ICAT® and iTRAQ®
derivatized peptides
respectively, are individually digested and mixed afterwards, thus also not ideal for
overcoming digestion irreproducibility’s.
3.1 Labelling techniques
3.1.1 Stable isotope labelling by amino-acids in culture (SILAC)
The name SILAC was given by Ong et al. [37] but refers actually to a method optimized by
Oda et al. in the field of bacterial proteomics [38]. In the metabolic labelling methodology,
cells are cultured in nutrients highly enriched with stable isotopes which are then incorporated
into the cellular proteins during their growth. The method is especially useful for labelling of
complete cell lines, rather than for only one desired target compound. A great strength of the
method is that the proteins can be put together before digestions and thus can compensate for
proteolysis’ differences [34].
Larger molecular mass substances: general concept - 114 -
3.1.2 Proteolytic labelling with 18
The method was optimized by Fenselau et al. and allows the introduction of two atoms of
O isotopes
18O
into the carboxylic acid group during proteolysis with members of the serine protease family
such as trypsin. One during the digestions itself and one by 16O/18O exchange in the H218O
digestion medium. As such the analyte can be digested in 16O medium and the IS in 18
O
medium or vice versa. The greatest advantage of the technique is that practical every peptide
is labelled during the digestion and thus, an istopically labelled IS can be generated for every
selected marker-peptide. Opposite, the major disadvantage is that the analyte protein and the
IS are separately digested [34, 39, 40]. Another disadvantage is a lack of reproducibility in the
incorporation process.
3.1.3 Isotope incorporation by chemical derivatization
Many strategies are now commercially available to introduce isotopes by chemical reactions
described by acronyms like ICAT® (isotope coded affinity tag), GIST (global internal
standard technology), iTRAQ®
(isobaric tags for relative and absolute quantitation), etc. [34,
41, 42]. Most of these reagents are patented, only available commercially, and hence very
expensive, especially for larger sample amounts, as compared to the small amounts of
proteomics derived protein for which they have been developed. Moreover, being a
proteomics derived invention, the degree of quantitative nature of the process is often inferior
to what is needed for absolute quantitation purposes.
There are number of criteria on selecting a chemical labelling strategy such as cost, ease and
speed of introduction of the isotope(s), the effect on chromatographic separation, time-point
of incorporation, mass difference between the labelled and unlabelled peptides, etc. Their
importance will, however, vary according to the analytical objective. Moreover, the chemical

Larger molecular mass substances: general concept - 115 -
process should go to completion without introducing chemical contamination and the
incorporation should be achieved for nearly 100% [34].
3.2 A protein analogue as internal standard
Taking all of the pro’s and con’s of labelling into consideration, we chose to perform internal
standardization in a different way. In our view the easiest way was to use a homologue
sequence protein, commercially available, as IS. In doing so, nearly co-eluting internal
standard peptides (ISP) could be generated for every selected marker peptide, generated by
either enzymatic cleavage using trypsin or chemical proteolysis using cyanogen bromide
(CNBr), with a cost negligible in comparison with labelled IS. Moreover, the analyte protein
and its IS can be digested simultaneously under exactly the same reaction conditions. Such a
protein IS can be added to the sample prior to the proteolysis, and even the eventual extraction
step, and is thus (theoretically) capable of counterbalancing the majority of the sample
treatment induced variability.
3.2.1 Chicken egg white cystatin
Chicken egg white cystatin consists of a chain of 140 amino-acids with 2 disulphide bridges
between amino-acids 94-104 and between amino-acids 118-139. As such, the size of the IS is
comparable with cystatin C. Moreover, with both belonging to the type 2 cystatins, also their
higher conformation is very similar. Both consist of a five-stranded anti-parallel β-sheet
wrapping around a long α1-helix that is almost perpendicular to the general β-strands
direction and share about 44 % sequence coverage [1]. In addition, also the number of
disulphide bridges and their relative position among the amino-acids sequence is a good
representation of cystatin C. As already stated, the use of a whole protein as internal standard,
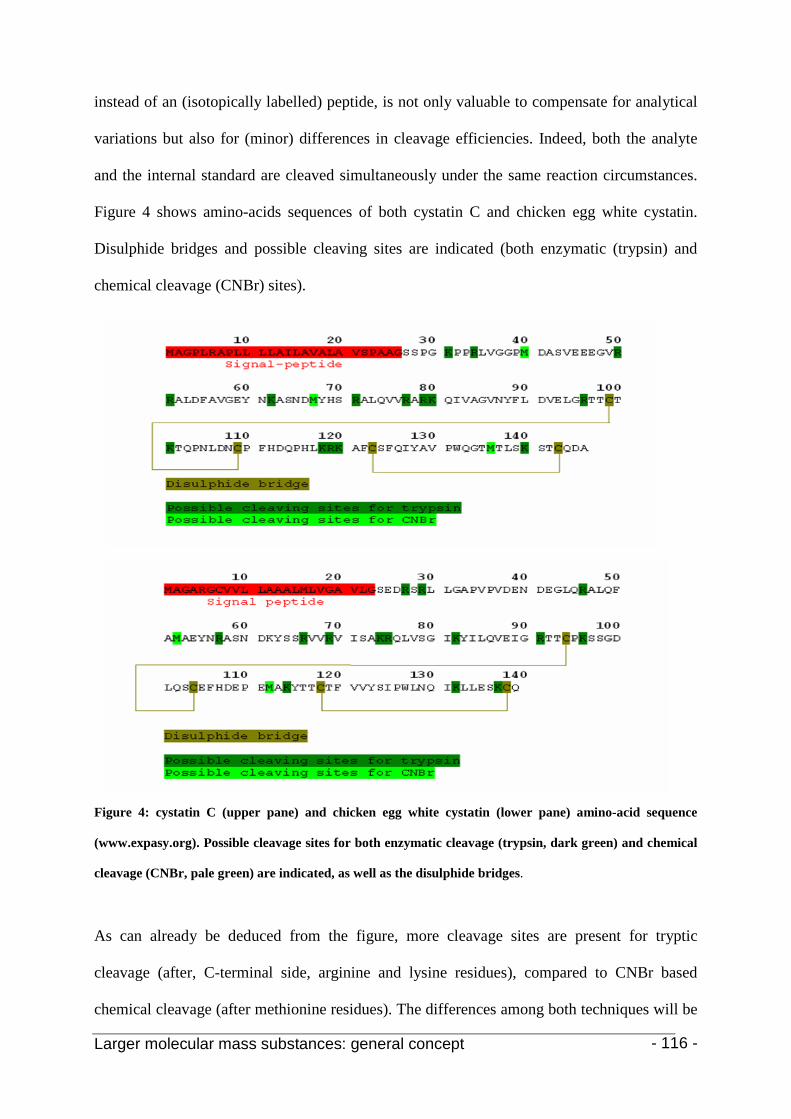
Larger molecular mass substances: general concept - 116 -
instead of an (isotopically labelled) peptide, is not only valuable to compensate for analytical
variations but also for (minor) differences in cleavage efficiencies. Indeed, both the analyte
and the internal standard are cleaved simultaneously under the same reaction circumstances.
Figure 4 shows amino-acids sequences of both cystatin C and chicken egg white cystatin.
Disulphide bridges and possible cleaving sites are indicated (both enzymatic (trypsin) and
chemical cleavage (CNBr) sites).
Figure 4: cystatin C (upper pane) and chicken egg white cystatin (lower pane) amino-acid sequence
(www.expasy.org). Possible cleavage sites for both enzymatic cleavage (trypsin, dark green) and chemical
cleavage (CNBr, pale green) are indicated, as well as the disulphide bridges.
As can already be deduced from the figure, more cleavage sites are present for tryptic
cleavage (after, C-terminal side, arginine and lysine residues), compared to CNBr based
chemical cleavage (after methionine residues). The differences among both techniques will be

Larger molecular mass substances: general concept - 117 -
clearly described in the following sections, as is the selection of the different marker peptides
and their ISP’s. In general, for every selected peptide, a co-eluting ISP, or at least an ISP in a
close time-window, could be selected out of the peptide subset of proteolyzed chicken egg
white cystatin.
1. M. Mussap and M. Plebani, Crit Rev Clin Lab Sci , 2004 (41): p.467
4. References
2. D.W. Cockroft, and M.H. Gault, Nephron, 1976 (16): p. 31 3. A.S. Levey, J.P. Bosch, J.B. Lewis, T. Greene, N. Rogers, and D. Roth, Ann Intern Med,
1999 (130): p.461 4. G.J. Schwartz, G.B. Haycock, C.M.J. Edelman, and A. Spitzer, Pediatrics, 1976 (58):
p.259 5. R. Counahan, C. Chantler, S. Ghazali, B. Kirkwood, F. Rose, and T.M. Baratt, Arch Dis
Child, 1976 (51): p.875 6. A.L. Gerbes, V. Gülberg, M. Bilzer, and M. Vogeser, Gut., 2002 (50): p.106 7. N. Thielemans, R. Lauwerys, and A. Bernard, Nephron, 1994 (66): p.453 8. H. Thakker, P.A. Lowe, C.P. Price, and D.J. Newman, Kidney Int, 1998 (54): p.1197 9. B. Jacobsson, H. Lignelid, and U.S. Bergerheim, Histopathology,1995 (26): p.559 10. A.J. Mannes, B.M. Martin, H.Y.T. Yang, J.M. Keller, S. Lewin, R. Gaiser, and M.J.
Ladarola, Pain, 2003 (102): p.251 11. F. Dubas, Presse Med, 1994 (23): p.948 12. J. Leung-Tack, C. Tavera, M.C. Gensac, J. Martinez, and A. Collé, Exp Cell Res, 1990
(188): p.16 13. A.H. Warfel, C. Cardozo, O.H. Yoo, and D. Zucker-Franklin, J. Leukoc Biol, 1991 (49):
p.41 14. K. Takeyabu, T. Betsuyaku, M. Nishimura, A. Yoshioka, M. Tanino, K. Miyamoto, and
Y. Kawakami, Eur Respir J, 1998 (12): p.1033 15. V. Stoka, M. Nycander, B. Lenarcic, C. Labriola, J.J.J Cazzulo, I. Bjork, and V. Turk,
FEBS Lett, 1995 (370): p.101 16. A.H. Warfel, D. Zucker-Franklin, B. Frangione, and J. Ghiso, J. Exp Med, 1987 (166):
p.1912 17. L. Bjorck, A. Grubb, and L. Kjellen, J Virol, 1990 (64): p.941 18. L. Björk, Mol Microbiol, 1990 (4): p.1439 19. Y. Naito, M. Sasaki, T. Umemoto, I. Namikawa, K. Sakae, Y. Ishihara, S. Isomura, and I.
Suzuki, Comp Biochem Physiol CPharmacol Toxicil Endocrinol, 1995 (110): p.71 20. H. Finney, D.J. Newman, H. Thakkar, J. Fell, and C.J. Price, Arch Dis Child, 2000 (82):
p.71 21. Finney, D.J. Newman, and C.J. Price, Ann Clin Biochem, 2000 (37): p.49 22. A.J. Barrett, Methods Enzymol, 1981 (80): p.771 23. L.C. Sen, and J.R. Whitaker, Arch Biochem Biophys, 1973 (158): p. 623 24. H. Keilova, and V. Tomasek, Biochem Biophys Acta, 1974 (334): p.179 25. A.J. Barrett, Biomed Biochim Acta, 1986 (45): p.1363 26. N.D. Rawlings, and A.J. Barrett, J Mol Evol, 1990 (30): p.60
Larger molecular mass substances: general concept - 118 -
27. H.B. Björklund, T.R. Johansson, and A. Rinne, Mutat Res, 1997 (71): p.5658 28. A.Grubb, and H. Löfberg, Proc Natl Acad Sci USA, 1982 (79): p.3024 29. T. Popovic, J. Brzin, A. Ritonja, and V. Turk, Biol. Chem., 1990 (371): p.575 30. G.S. Merz, E. Benedikz, V. Schwenk, T.E. Johansen, L.K. Vogel, J.I. Rushbrook, H.M.
Wisniewski, J Cell Physiol, 1997 (173): p.423 31. W. Müller-Esterl, H. Fritz, J. Kellerman, F. Lottspeich, W. Machleidt, and V. Turk, FEBS
Lett, 1985 (191) : p.221 32. B. Deneke, S. Gräber, C. Schäfer, A. Hells, M. Wöltje, W. Jahnen-Dechent, Biochem J,
2003 (376): p.135 33. L.A. James, D.J. Ogilvie, K. Yamakawa, Y. Nakamura, C.J. Stirling, and R. Anand,
genomics, 1996 (32): p.425 34. C. Fenselau, J. Chromatogr. B, 2007 (855): p.14 35. M. Bronstrup, Expert Rev. Proteomics, 2004 (4): p.503 36. O. Stemmann, H. Zou, S.A. Gerber, S.P. Gygi, M.W. Krischner, Cell, 2001 (107): p.715 37. S.E. Ong, B. Blagoev, I. Kratchmarove, D.G. Kristensen, H. Steen, A. Pandey, and M.
Mann, Mol. Prot., 2002 (1): p.376 38. Y. Oda, K. Huang, F.R. Cross, D. Cowburn, and B.T. Chait, Proc. Natl. Acad. Sci. USA.,
1999 (96): p.6591 39. X. Yao, A. Freas, J. Ramiraz, P. Demirev, and C. Fenselau, Anal. Chem., 2001 (74):
p.2529 40. X. Yao, C. Afonso, and C. Fenselau, J. Proteome Res., 2003 (2): p.147 41. S.P. Gygi, B. Rist, S.A. Gerber, F. Turecek, M.H. Gelb, and R. Aebersold, Nat.
Biotechnol., 1999 (17): p.994 42. A. Chakraborty, and F.E. Regnier, J. Chromatogr. A, 2002 (949): p.173
Larger molecular mass substances: in-solution tryptic digest protocol 119
Chapter 2
Optimization of an in-solution tryptic digest protocol
Partly published as:
The use of tryptic marker-peptides for the quantitative analysis of Cystatin C
M. L. Storme, B. A. Sinnaeve, and J. F. Van Bocxlaer
(Journal of Separation Science, 2005 (28 (14)): p.1759)
Larger molecular mass substances: in-solution tryptic digest protocol 120
In this chapter, the use of marker peptides, measured by liquid chromatography tandem mass spectrometry (LC-
MS(/MS)), is investigated for the quantitative analysis of proteins. Cystatin C is hereby chosen as a model-
protein. It not only functions as a proof of concept protein but the growing interest in cystatin C as a new marker
of kidney failure might provide a practical application at the same time. The use of trypsin based proteolysis, to
obtain so-called marker peptides, simplifies the quantitation of a protein to the quantitation of a single or a
number of peptides. Reproducibility of the trypsin proteolysis procedure is vital and has been investigated. In
doing so, a number of the marker peptides obtained are selected for LC-MS(/MS) analysis based on their
relative abundance and aiming for maximum dispersal throughout the cystatin C sequence. They are completely
separated by high pressure liquid chromatography (HPLC) and linear calibration curves can be obtained for
cystatin C ranging over 2 orders of magnitude. Calibration experiments have been performed on a triple
quadrupole mass spectrometer by Single Ion Monitoring (maximum sensitivity) as well as by Multiple Reaction
Monitoring (maximum specificity).
Larger molecular mass substances: in-solution tryptic digest protocol - 121 -
The use of mass spectrometry in protein identification and relative quantitation is nowadays
widely practiced in proteomics applications [1]. However, absolute quantitation of proteins
becomes more and more important, in particular due to the growing amount of so called
protein medicines (e.g. erythropoietin and human growth hormone). Also, the markedly
increasing searches for new (protein) biomarkers will inevitably demand their quantitation in
the future [2].
1. Introduction
Until now, the primary tool for the absolute quantitation of a biomarker in biological matrices
is the immunoassay [3]. Although immunoassays are inexpensive tools for acquiring
quantitative data, there are some serious drawbacks. For instance, a certain lack of specificity,
due to cross reactivity, is often noticed. Also, inter-laboratory comparison of absolute values,
despite recent uniformization efforts, is not self-evident [3].
To overcome some of these problems, mass spectrometry (MS) is one of the most promising
analytical techniques. Nevertheless, absolute quantitation of a given protein by liquid
chromatography (tandem) mass spectrometry (LC-MS(/MS)) is currently not widely spread.
This in contradiction to the use of mass spectrometry for the quantitation of small to medium
size organic compounds (< 2 kDa), where the use of LC-MS(/MS) has a long history [3-5].
LC-MS based approaches for whole protein quantitation are hampered by awkward LC
separation, often incompatible with MS as well as complicated mass spectrometry e.g. spectra
dominated by a multiple charge envelope.
For protein identification, e.g. in bottom-up proteomics, mass spectrometry is performed on
proteolytic peptides. In such a set-up, a given protein is proteolyzed, typically with trypsin,

Larger molecular mass substances: in-solution tryptic digest protocol - 122 -
followed by liquid chromatographic (LC) separation of the proteolytic peptides produced. The
development of ‘soft’ ionization techniques such as electrospray ionization (ESI), were
essential to combine the separation power of liquid chromatography with the sensitivity and
information rich data of mass spectrometry. Based on this principle, a highly sensitive and
high-throughput analytical platform for the quantitation of proteins can be developed [6]. The
peptides generated from the protein can be used as marker peptides. Analyzing these peptides
instead of the total protein simplifies the quantitation of a protein to the quantitation of a
single or a number of peptides [7]. The idea of combining proteolysis with LC-MS for
absolute quantitation was first reported by Barr and co-workers [3, 8]. In 2003, Zhang et al.
described a quantitation tool for human glutathione S-transferase, using trypsin digestion and
LC-MS(/MS). Out of the total set of tryptic peptides produced, the four most abundant were
used in a quantitative LC-MS(/MS) analysis procedure.
In this article, we describe the development of a quantitation tool based on marker peptides
for cystatin C. Cystatin C, a 146 amino-acids protein of 13 kDa with 2 disulphide bridges
between amino-acid 99-109 and amino-acid 123-143 is chosen as a model-protein. Moreover,
the increasing interest of cystatin C as an early and new marker of kidney dysfunction,
superior to plasma creatinine, [9-12] makes it an interesting choice from a clinical point of
view. Until now, plasma creatinine is mostly used to estimate the glomerular filtration rate
(GFR). However, a wide reference range is found due to alterations in age, muscle mass and
sex [8]. Cystatin C concentrations are not influenced by these parameters and can be
measured as well in serum as in urine, a much simpler matrix for direct analytical
determination [11]. In addition, the presence of cystatin C in cerebrospinal fluid (CSF) as a
possible pain marker only endorses our interest [13]. So far, cystatin C is routinely measured
using immunoassay methods. Similar to many other analyte measurement methods in clinical
Larger molecular mass substances: in-solution tryptic digest protocol - 123 -
chemistry, a quantitative procedure providing higher reliability can be of great value in terms
of immunoassay method validation. An LC-MS(/MS) based procedure provides this
opportunity. We report here on the development and optimization of the vital steps of the
proposed set-up.
2.1 Proteolytic digestion
2. Experimental
Cystatin C (lyophilised powder, Scipac, Sittingbourne, UK) is trypsinized using Promega
Sequencing Grade Modified Trypsin (20µg lyophilised powder per vial, Leiden, The
Netherlands). 55µL of the protein stock-solution (1mg/mL in 50 mM tris-HCl /1 mM CaCl2)
is denatured for one hour at 65°C using 145 µL of a solution of 50mM Tris-HCl/ 6M urea/
10% beta mercapto-ethanol (betaME). After diluting with 50 mM tris-HCl /1 mM CaCl2
(600µl, to a total volume of 800µL) to lower the urea concentration below 2M, iodoacetamide
is added to a final concentration of 20 mM (80µL of a 200mM stock-solution). Finally, to
start the trypsinization process, trypsin is added (50µL) as a 1µg/10µL solution (in 50mM
acetic acid as resuspension buffer, pH 7.8) to a protease:protein ratio between 1:10 and 1:50.
Prior to the overnight proteolysis, the pH is checked to be between 7 and 9. If necessary,
trypsinized samples can be frozen (-80°C) for storage. All chemical agents were purchased at
Sigma (Bornem, Belgium). High purity water was produced using a Synergy 185 system
(Millipore Corporation, Bedford, MA),
2.2 Liquid chromatography
Out of the peptides obtained, three peptides, selected as marker peptides are
chromatographically separated using a Waters Alliance 2695 HPLC (Waters, Manchester,
Larger molecular mass substances: in-solution tryptic digest protocol - 124 -
UK), equipped with a YMC Pack ODS-AQTM 2.1 x 150mm, 5 µm C18
microbore column
(YMC, Schermbeck, Germany) and eluted at a flow rate of 0.2 mL/min. Using 0.1% FA in
water as eluent A, and 0.1 % FA in methanol or AcN as eluent B, the LC-gradient was
optimized. All eluents are filtered over a 0.45 µm membrane prior to use.
2.3 Mass spectrometry
The HPLC system is interfaced either to a Micromass Q-TOF hybrid mass spectrometer or a
Micromass Ultima Triple Quadrupole system (Micromass-Waters, Manchester, UK), both
equipped with an orthogonal electrospray source (Z-spray®
) operated in the positive ion
mode. By virtue of its high "full scan" sensitivity, the Q-TOF is used for the ultimate
confirmation in practical conditions of the initial theoretical selection of the marker peptide
subset. Moreover, it is used for evaluation of the fragmentation spectra, in order to select the
most suitable product ions to be used for quantitation in the MRM mode. MRM is performed
on a triple quadrupole system which in this operational mode, provides enhanced sensitivity
compared to the Q-TOF.
Nitrogen was used both as nebulizer and drying gas and argon served as collision gas. A
standard 120µm capillary is used in the electrospray interface. The source was operated at 145
°C and the desolvation temperature was 395 °C. All spectra were collected in the continuum
mode.
2.4 Calibrators
Calibrators were prepared by serial ½ dilutions, using high purity water, of the cystatin C
stock standard (100 * 101 µg/mL; equivalent to 74.92 x 10³ pmol/mL (calculated average Mm
cystatin: 13.347 kDa)) to the following concentrations: 500 (37.46 x 10³ pmol/mL, 250 (14.98
Larger molecular mass substances: in-solution tryptic digest protocol - 125 -
x 103 pmol/mL), 125 (7.499 x 10³ pmol/mL), 62.5 (3.745 x 10³ pmol/mL), 31.3 (1.875 x 10³
pmol/mL), 15.6 (0.9374 x 10³ pmol/mL, 7.8 (0.4687 x 10³ pmol/mL, and 3.9 µg/mL (0.2343
x 103
pmol/mL).
In our marker peptide approach, developing a reproducible, in solution trypsin digest
procedure is a first vital step. To that end, 4 different denaturing procedures were evaluated.
Denaturing entails reduction of eventual intrachain disulphide linkages and unfolding of the
protein thus promoting proteolysis. Reducing agents and reaction temperature/time were
optimized. As reducing agents, 5mM Dithiothreitol (DTT) versus 10% betaME in denaturing
buffer of 50 mM Tris-HCl/ 6M urea, were evaluated. Urea is a chaotropic agent which
unfolds the protein. Both DTT and betaME were tested for 1 hour at 65°C versus 20 min at
95°C. When denaturing for 1 hour at 65°C the best results were obtained, and there is another
5 to 8-fold increase of the peptide peak areas when using betaME instead of DTT (See Figure
1A). The denatured protein is then further diluted in 50 mM tris-HCl /1 mM CaCl
3. Results and discussion
2
, to achieve
a urea concentration below 2M, in essence to prevent self destruction of trypsin. Addition of
iodoacetamide to block free SH-groups is essential for good protein sequence coverage. In
this way, re-uniting of two adjacent SH-groups is prevented. A 20 minutes reaction time at
room temperature, under gentle shaking and in total darkness, due to the light-sensitivity of
iodoacetamide, provides good acetylation efficiency. After checking the pH, the trypsinization
process is then started by adding trypsin to a final protease:protein ratio between 1:10 and
1:50. Different ratios, 1:10; 1:20 and 1:50 were tested but did not affect the sequence
coverage. Optimization of the trypsin proteolysis procedure yielded 100% sequence coverage
(only peptides of minimum 6 amino-acid residues are taken into account).
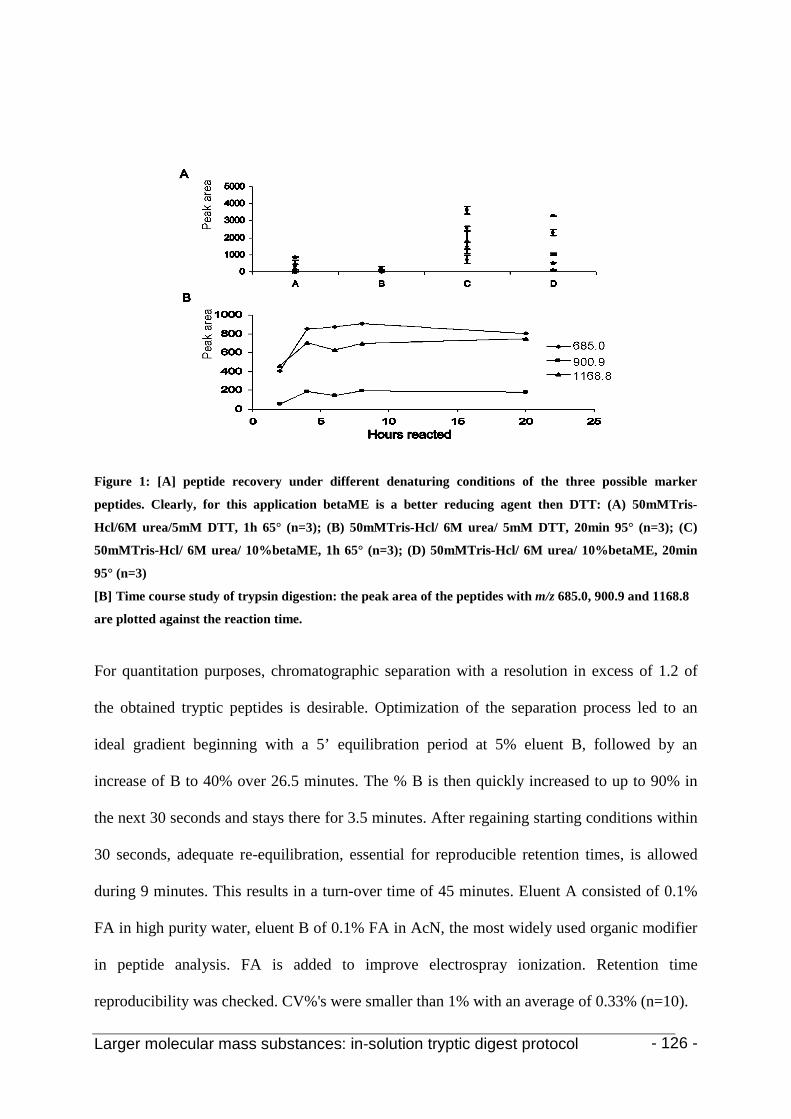
Larger molecular mass substances: in-solution tryptic digest protocol - 126 -
Figure 1: [A] peptide recovery under different denaturing conditions of the three possible marker
peptides. Clearly, for this application betaME is a better reducing agent then DTT: (A) 50mMTris-
Hcl/6M urea/5mM DTT, 1h 65° (n=3); (B) 50mMTris-Hcl/ 6M urea/ 5mM DTT, 20min 95° (n=3); (C)
50mMTris-Hcl/ 6M urea/ 10%betaME, 1h 65° (n=3); (D) 50mMTris-Hcl/ 6M urea/ 10%betaME, 20min
95° (n=3)
[B] Time course study of trypsin digestion: the peak area of the peptides with m/z 685.0, 900.9 and 1168.8
are plotted against the reaction time.
For quantitation purposes, chromatographic separation with a resolution in excess of 1.2 of
the obtained tryptic peptides is desirable. Optimization of the separation process led to an
ideal gradient beginning with a 5’ equilibration period at 5% eluent B, followed by an
increase of B to 40% over 26.5 minutes. The % B is then quickly increased to up to 90% in
the next 30 seconds and stays there for 3.5 minutes. After regaining starting conditions within
30 seconds, adequate re-equilibration, essential for reproducible retention times, is allowed
during 9 minutes. This results in a turn-over time of 45 minutes. Eluent A consisted of 0.1%
FA in high purity water, eluent B of 0.1% FA in AcN, the most widely used organic modifier
in peptide analysis. FA is added to improve electrospray ionization. Retention time
reproducibility was checked. CV%'s were smaller than 1% with an average of 0.33% (n=10).

Larger molecular mass substances: in-solution tryptic digest protocol - 127 -
The use of methanol as an alternative for AcN in eluent B was tested. An average 2 to 3-fold
increase in sensitivity was noticed. Likewise, Giorgianni et al. noticed a 4-fold increase in
sensitivity by exchanging AcN for methanol for the analysis of tryptic peptides from 2-DGE-
bands with nanoLC-MS(/MS) [14]. Because methanol is a weaker solvent than AcN, in terms
of reversed phase elution strength on a C18-phase, higher percentages of eluent B are needed.
This in turn leads to better electrospray ionization efficiency as higher organic percentages
decrease droplet surface tension in the electrospray process. The higher volatility of methanol
reinforces this effect by simplifying eluent evaporation during electrospray ionization.
However, the use of methanol dramatically intensifies tailing effects. To minimize these
tailing effects, addition of TFA to eluent B was investigated. Unfortunately, sensitivity
dramatically decreased, presumably caused by ion suppression in the atmospheric ionization
source.
While a 100% sequence coverage is obtained, only a few peptides are necessary as marker
peptides. The four most abundant peptides, the singly charged peptide with m/z 685.0 and the
doubly charged peptides with m/z 897.5, 900.9, and 1168.8, were chosen as possible
candidates. To allow a selection of marker peptides to represent the full Cystatin C protein as
adequately as possible, marker peptides are chosen from the beginning, the middle and the
end part of the protein. Consequently, peptides with m/z 685.0, 900.9 and 1168.8 are selected.
Figure 2 shows the Cystatin C amino-acid sequence and the individual peptide data. For the
middle part, the peptide with m/z 685.0 is selected instead of the one with m/z 897.5, which
tends to stick onto the column. The latter is a recurring problem when dealing with peptides.

Larger molecular mass substances: in-solution tryptic digest protocol - 128 -
The chosen marker peptides with m/z 685.0, 900.9 and 1168.8 have been quantitatively
analyzed as well in SIR as in MRM mode as a preliminary evaluation of the reproducibility
and linearity of the proteolysis step. In the SIR mode, calibration curves were prepared from
3.9 to 1000 µg/mL Cystatin C. Each standard (3.9, 7.8, 15.6, 31.3, 62.5, 125, 250, 500, and
1000 µg/mL), was trypsinized individually using the same trypsin:cystatin C ratio. 50 µL
were injected and analysed in SIR without internal standardization. SIR was performed from
12 to 16 min. for peptide m/z 685.0, from 17.5 to 20.5 min. for peptide m/z 900.9 and from
27.5 to 31 min. for peptide m/z 1168.8. By doing so, three totally separated acquisition time
intervals are obtained, allowing maximum MS sensitivity. Peptide m/z 900.9 (amino terminal
end of the protein) gave the best linearity (R2=0.9926) for the given concentration range.
Unfortunately, not every calibration attempt resulted in the same degree of linearity. The
former already indicates that the proteolysis step as optimised, can act as a linearly
concentration dependent process, but reproducibility is rather poor, probably caused by
insufficient trypsinization of some standards.
SSPGK(//)PPR//LVGGPMDASVEEEGVR//R//ALDFAVGEYNK//ASNDMYHSR//ALQVVR//AR//K/
/QIVAGVNYFLDVELGR//TTCTK//TQPNLDNCPFHDQPHLK//R//K//AFCSFQIYAVPWQGTMTLS
K//STCQDA
peptides selected as marker peptides:
LVGGPMDASVEEEGVR: m/z = 901 (doubly charged)
ALQVVR: m/z = 685 (singly charged)
AFCSFQIYAVPWQGTMTLSK: m/z 1168 (doubly charged, +IAA)
Figure 2:
Cystatin C sequence (without signal peptides sequence), all possible tryptic fragments are
detected. (only peptides with minimum 6 amino-acids are taken into account). Tryptic
peptides are separated by //, peptides in bold are detected.
Larger molecular mass substances: in-solution tryptic digest protocol - 129 -
Absolute quantitative work is, however, dependent on the use of adequate internal
standardization. The ideal situation is an isotopically labelled internal standard for each
peptide. These are, however, not commercially available and will need customized synthesis.
At present, the linearity investigation of our approach has been repeated with [Glu1
]-
fibrinopeptide B (glufib) as a surrogate internal standard. In this part of the work, Glufib was
chosen as an easily commercially available peptide with an m/z of 785.8 (doubly charged),
intermediate between the m/z 685.0 and 1168.8 selected marker peptides. It can compensate
for small variations in the LC-MS measurement part of the analysis. The chosen internal
standard is, however, not capable of compensating for differences created during the
trypsinization process itself and is therefore suboptimal. Future experiments (see following
chapters) will be oriented to the search for a more dedicated internal standard. In this
digestion efficiency study, such an internal standard, capable of counteracting digestion
anomalies, would bias the desired information regarding the reproducibility of the in solution
tryptinization process.
To increase the specificity, the experiments were also conducted in the MRM mode.
However, gaining specificity by MRM in essence means an enhanced signal-to-noise ratio
albeit that absolute signal intensity decreases. The latter, unfortunately, is especially true
when dealing with peptides. Indeed, peptides can fragment at nearly every peptide bond,
hereby dispersing the initial precursor ion signal over many product ions. On following one or
two of such precursor-product transitions in MRM, the decrease in compound signal seriously
affects the signal-to-noise ratio, sometimes more than the decrease in noise can compensate
for. In our case, this meant that linear calibration curves could only be measured from 7.8
µg/mL cystatin C upwards. This, however, is a 10-fold higher than physiological cystatin C
plasma concentration and thus, during sample preparation, a pre-concentration step will be

Larger molecular mass substances: in-solution tryptic digest protocol - 130 -
inevitable. In addition, future experiments (see chapter 3) will be necessary to investigate
procedures to compensate for the dilution effect inherent to the in-solution digestion protocol.
Indeed, when starting with 50 µL of cystatin C standard, at the end of the protocol, the
standard solution is almost 20-fold diluted to 930 µL. All calibrators were analyzed in
triplicate and CV% was below 20%, except for the protein standard of 3.9 µg/mL. By analogy
with the SIR mode, the chromatogram was divided into 3 separate time-dependent MRM
functions for the peptides (min. 12-16: m/z 685.0 to 313.1 and 412.1 (CE 38eV), min. 17.5-
20.5: m/z 900.9 to 343.9 and 566.5 (CE 38eV); min. 27.5-31.0: m/z 1168.8 to 1148.5 and
1482.1(CE 38eV)) and a 4th for the internal standard glufib (min. 20.5-24.5: m/z 785.8 to
480.4 and 684.3 (CE 25eV)). Figure 3 reveals the different MRM transition time sections. For
each, the corresponding MS/MS spectrum is shown. All peptides are CID fragmented using
argon gas with a collision energy of 38 for the tryptic peptides and 25 for glufib. Peptide m/z
900.9 again showed the best linearity (R2= 0.994, n=3) in calibration (See Figure 4).

Larger molecular mass substances: in-solution tryptic digest protocol - 131 -
Figure 3: Reconstructed chromatogram from the four time-dependent MRM transitions for the 3 selected
marker peptides and the internal standard glufib. For each transition, the corresponding MS/MS
spectrum is given: (A) MRM of m/z 685.0 to 313.1 and 412.1; (B) MRM of m/z 900.9 to 343.9 and 566.5;
(C) MRM of m/z 785.8 to 480.4 and 684.3; (D) MRM of m/z 1168.8 to 1148.5 and 1482.1
These experiments show the quantitative potential of the approach. Nevertheless, it can also
be seen that the trypsinization process itself tends to perform better with higher protein
concentrations. Moreover, as was the case with the calibration curves obtained by using SIR,
some individual calibration points sometimes had to be excluded from the study due to
probably insufficient proteolysis. Figure 4 shows a calibration function example from 7.8 to
1000 µg/mL for each of the three marker peptides.
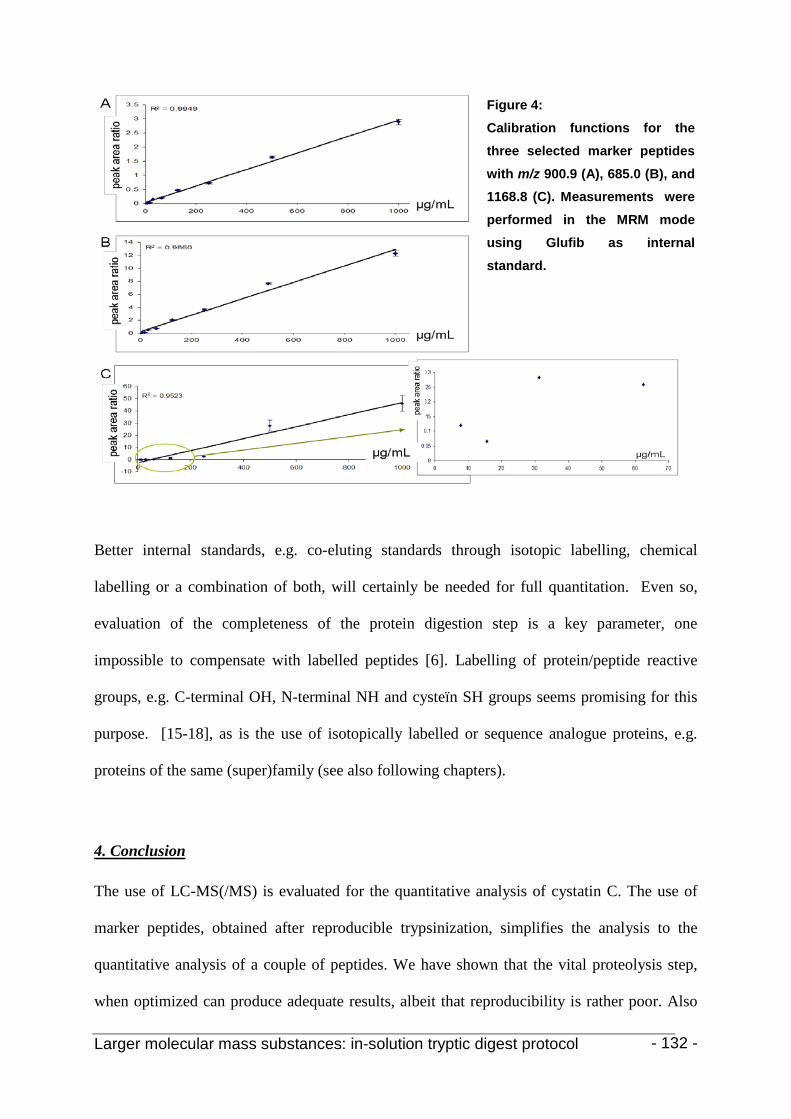
Larger molecular mass substances: in-solution tryptic digest protocol - 132 -
Better internal standards, e.g. co-eluting standards through isotopic labelling, chemical
labelling or a combination of both, will certainly be needed for full quantitation. Even so,
evaluation of the completeness of the protein digestion step is a key parameter, one
impossible to compensate with labelled peptides [6]. Labelling of protein/peptide reactive
groups, e.g. C-terminal OH, N-terminal NH and cysteïn SH groups seems promising for this
purpose. [15-18], as is the use of isotopically labelled or sequence analogue proteins, e.g.
proteins of the same (super)family (see also following chapters).
The use of LC-MS(/MS) is evaluated for the quantitative analysis of cystatin C. The use of
marker peptides, obtained after reproducible trypsinization, simplifies the analysis to the
quantitative analysis of a couple of peptides. We have shown that the vital proteolysis step,
when optimized can produce adequate results, albeit that reproducibility is rather poor. Also
4. Conclusion
Figure 4:
Calibration functions for the
three selected marker peptides
with m/z 900.9 (A), 685.0 (B), and 1168.8 (C). Measurements were
performed in the MRM mode
using Glufib as internal
standard.
Larger molecular mass substances: in-solution tryptic digest protocol - 133 -
sensitivity needs to be further improved. The particular LC-MS(/MS) approach for the
absolute quantitation of proteins could, in the future when further optimized, provide a
valuable alternative to immunoassays and is theoretically applicable to every protein. Of
course, these proteins will ultimately have to be measured in a biological matrix, thus
entailing sample preparation steps. These extraction procedures can, however, involve a pre-
concentration step and hence, provide enhanced sensitivity.
This work was supported by grant GOA99-120501-99 (Bijzonder OnderZoeksFonds) of the
Ghent University and grant G.0320.02 (FWO-Vlaanderen). M. Storme. acknowledges his
position with the Bijzonder OnderzoeksFonds of the Ghent University (grant 011/044/04).
Special thanks to Ing. Sofie Vandecasteele and Wim Goeteyn for their practical assistance.
5. Acknowledgements
1. D.R. Goodlett, A. Keller, J.D. Watts, et R. Newitt, E. Yi, S. Purvine, J. Eng, P. von Haller, R. Aebersold, and E. Kolker, Rapid Commun. Mass Spectrom., 2001 (15): p.1214
6. References
2. M. Heller, H. Mattou, C. Menzel, and X. Yao, J Am Soc Spectrom, 2003 (14): p.704 3. D.R. Barnidge, M.K. Goodmanson, G.G. Klee, and D. Muddiman, J Proteome Res, 2004
(3): p.644 4. R. Kostiainen, T. Kotiaho, T. Kuuranne, and S. Auriola, J. Mass Spectrom., 2003 (38):
p.357 5. M. Bantscheff, B. Dumpelfeld, and B. Kuster, J. Mass Spectrom., 2004 (18): p.869 6. Y.H. Lee, H. Han, S.B. Chang, and S.W. Lee, Rapid Commun. Mass Spectrom., 2004
(18): p.3019 7. F.G. Zhang, M.J. Bartels, and W.T. Stott, Rapid Commun. Mass Spectrom., 2004 (18): p.
491 8. J.R. Barr, V.L. Maggio, D.G. Patterson, G.R. Cooper, L.O. Henderson, W.E. Turner, S.J.
Smith, W.H. Hannon, L.L. Needham, and E.J. Sampson , Clin. Chem., 1996 (42): p.1676 9. F.J. Hoek, F.A.W. Kemperman, and R.T. Krediet, Nephrol Dial Transplant, 2003 (18):
p.2024 10. J. Mares, D. Stejskal, J. Vavrouskova, K. Urbanek, R. Herzig, and P. Hlustik, Biomed
Papers, 2003 (147): p.177 11. 12.
A.L. Gerbes, V. Gülberg, M. Bilzer, and M. Vogeser, Gut, 2002 (50): p.106 K. Uchida, and A. Gotoh, Clin Chim Acta, 2002 (323): p.121
Larger molecular mass substances: in-solution tryptic digest protocol - 134 -
13. A.J. Mannes, B.M. Martin, H.Y.T. Yang, J.M. Keller, S. Lewin, R.R. Gaiser, and M.J. Ladarola , Pain, 2003 (102) : p.251
14. F. Giorgianni, A. Cappiello, S. Baranova-Giorgianni, P. Palma, H. Trufelli, and D.M. Desiderio, Anal. Chem., 2004 (73): p.7028
15. A. Chakraborty, and F.E. Regnier, J. Chromatogr. A, 2002 (949): p.173 16. M. Shen, L. Guo, and A. Wallace., Mol Cell Proteomics, 2003, (2): p.315 17. R. Sebastiano, A. Citterio, M. Lapadula, and P.G. Righetti, Rapid Commun. Mass
Spectrom., 2003 (17): p.2380 18. M. Munchbach, M. Quadroni, G Miotto, and P James, Anal. Chem., 2000 (72): p.4047
Larger molecular mass substances: Multiple (trapping) large volume injection - 135 -
Chapter 3
Multiple (trapping) large volume injection
Submitted for publication as:
The applicability of “multiple (trapping) large volume injection” as a sensitivity alternative in liquid
chromatography electrospray (tandem) mass spectrometry: proteins and their peptide lysates.
M.L. Storme, R.S. t’ Kindt, and J.F. Van Bocxlaer.
(Journal of Separation Science)
Larger molecular mass substances: Multiple (trapping) large volume injection - 136 -
Sensitivity is an important requisite in bio-analytical liquid chromatography electrospray-ionization mass
spectrometry and an increasing degree of miniaturization is generally chosen for. Sometimes, such as in
proteomics, the required detection sensitivity presents itself concurrent with small available volumes of a
precious sample. There are, however, also instances where a larger volume of a diluted sample is available and
sensitivity is equally important. For instance, many in-solution trypsinization protocols (see also chapter 2),
used in so-called “bottom-up” protein analysis, where a given protein is first proteolyzed into its peptides,
inevitably generate a high degree of sample dilution. For the latter case, a ‘multiple (trapping) large volume
injection’ approach was developed. By this way, a minimally 10-fold gain in sensitivity could be achieved. The
system involves the use of an automated 10-port switching valve in combination with a 1 mm i.d. trapping/guard
column and a 1 mm i.d. x 150 mm analytical column. The optimized multiple injection/loading procedure allows
quantitative measurements of peptides and protein lysates. Linear calibration curves (R2 ≥ 0.988) over a
minimum of 2 orders of magnitude were generated for a broad range of peptide and protein standards with
sensitivities equal, or even exceeding, those generally achieved only through increasing miniaturization.
Larger molecular mass substances: Multiple (trapping) large volume injection - 137 -
These days, liquid chromatography (tandem) mass spectrometry (LC-MS(/MS)) has become
the preferred analytical tool in the field of bio-analysis. However, for the absolute quantitation
of proteins as a whole, the use of LC-MS(/MS), hampered by e.g. charge state envelope
formation, has so far been avoided. Historically, absolute quantitation of proteins has
predominantly been done using immunoassays or electrophoresis [1]. This is in contrast to the
absolute quantitation of peptides where LC-MS(/MS) already largely proved its applicability,
driven by the need to identify, characterize, and quantify, mostly protein derived, peptides at
ever increasing sensitivity in ever more complex samples [2, 3]. Until now, the number of
papers describing the use of LC-MS for the characterization and quantitation of peptides is
almost countless [1]. The latter is also true for the relative quantitation of proteins using
various labelling techniques like among others Isotopically Coded Affinity Tags (ICAT)
1. Introduction
®,
iTRAQ®
, etc. As a logic extension of the former, the absolute quantitative analysis of proteins
with LC-MS(/MS) using, e.g. trypsin based, proteolysis in order to obtain specific marker
peptides, was explored. Because even a single peptide is sufficient as a stoichiometric
representative of the protein from which it is cleaved, the quantitation of a given protein can
be demoted into the more straightforward analysis of one or more of its proteolytic peptides
[4-6]. Regrettably, in-solution trypsinization inevitably involves a minimally 10-fold dilution
of the sample to lower the concentration of the necessary denaturing agents (cfr. Infra). As a
result, sensitivity becomes an even greater challenge, especially taken into account the fact
that most potential protein biomarkers are already low abundant proteins (≤ 1µg/mL).
With sensitivity being an important requisite, miniaturization becomes indispensable [7].
Indeed, the development in the late 1980’s of columns with smaller internal diameters, thus
decreased column flow, opened the way to increased sensitivity. Theoretically, diminishing

Larger molecular mass substances: Multiple (trapping) large volume injection - 138 -
the column diameter in LC(-MS), provides a quadratic improvement in sensitivity [3]. This
gain in sensitivity can, however, only be transformed in an overall analytical sensitivity gain
when the absolute amount of analyte injected onto the column remains the same. Sadly, as
predicted from chromatographic theory, diminishing the column internal diameter has its
repercussions on the maximum allowed injection volume of the column. In order to inject
acceptable volumes on small-internal diameters columns, one is forced to make use of e.g. a
column switching/trapping column set-up. The latter is mostly done for nano-LC applications,
since only a few nanoliters can theoretically be injected on a nano-LC column [4]. The use of
a column-switching valve is, for nano-LC applications, not only profitable to inject a larger
amount of sample but also to avoid a prohibitively long injection-cycle time since a higher
flow-rate can be used during injection (loading) compared to the actual (nano-)LC-run. As an
extra advantage, desalting and a certain level of sample clean-up is achieved at the same time.
Utmost LC miniaturization, nevertheless, brings along many drawbacks too. Certainly in the
field of quantitative analyses, capillary or even nano-LC, is still not self-evident [3].
Robustness, instrumental and analytical, is poor and present day validation criteria for a
quantitative bio-analytical method are out of reach [8]. Therefore, when the limitation on the
sample volume is less stringent, such as with the dilution effect of the in-solution
trypsinization, columns with higher loading capacity may still be preferable. In order to
balance sensitivity with robustness we investigated a combination of moderately miniaturized
chromatography and large volume injection in a column switching/trapping setup. Large
volume injections procedures have already proven to be very adequate to raise the sensitivity-
limits of a given system in gas chromatography [9, 10] and gain more and more interest in
liquid chromatography too. As such, the combination of large volume injection and LC-(MS)
has already been demonstrated for environmental purposes being the determination of
Larger molecular mass substances: Multiple (trapping) large volume injection - 139 -
pesticides in vegetables by Hogenboom et al. In doing so, 900 µL of vegetable organic
solvent extract was directly loaded onto a 5 x 4.6 mm LC-column using a high volume loop
[11]. Unfortunately, in miniaturized LC, a single large volume injection setup in itself is
limited in concentrating potential because of the lowered flow rate (and thus high loading
time) and high risk of clogging of the column front frit. Moreover, large volume injection of
more complex matrix extracts directly into the LC-MS(/MS) system may induce severe
matrix signal suppression and hence, result in peak broadening and degrading
chromatographic separation [8].
As a normal column switching setup in itself is not sufficient, a ‘multiple-trapping-injection’
procedure was developed. In this way, 450 µL of lysate could be loaded on a pre-column and
eluted onto a 1mm i.d. microLC-MS/MS set-up. By using high injection volumes to gain
sensitivity, on-line re-concentration and sample clean-up can easily be obtained without
cumbersome off-line intervention as is often the case using solid phase extraction (SPE). SPE
requires a fairly time consuming method development and demands human intervention
throughout the entire process, even with the help of dedicated equipment [9].
The optimized ‘multiple (trapping) large volume’ injection approach was tested on different
commercially available peptide-standards, including peptides obtained after tryptic digestion.
Additionally, the method was tested on Cystatin C marker peptides, obtained after in-solution
trypsinization according to a previously published method (see Chapter 2). Cystatin C is a 146
amino-acid protein of 13 kDa with 2 disulphide bridges between amino-acids 99-109 and
amino-acids 123-143 and was chosen as a model-protein [12].
Larger molecular mass substances: Multiple (trapping) large volume injection - 140 -
2.1 Peptide standards
2. Experimental
2.1.1 [Glu1
Glufib is an easily commercially available peptide with an m/z of 785.8 (doubly charged),
purchased at Sigma (Bornem, Belgium). A stock-standard of approximately 1 pmol/mL was
further diluted using eluent A to the following concentrations: S1: 200 pmol/mL; S2: 40.0
pmol/mL; QC
]-fibrinopeptide B (glufib)
1: 10.0 pmol/mL; S3: 8.00 pmol/mL; S4: 1.60 pmol/mL; QC2
: 1.00 pmol/mL;
S5: 0.300 pmol/mL.
2.1.2 MassPREP peptides
MassPREP peptides (Waters, Manchester, UK) are generated after tryptic digestion of bovine
haemoglobin. According to the manufacturer, these peptides were (pre)prepared by digestion
of approximately one nmole of protein. For HPLC purposes, the peptide standard, as
lyophilized powder, was dissolved in 100 µL of eluent A (0.1 % of FA in water) to a
concentration of 10.0 x 10³ pmoL/mL as suggested by Waters. This stock solution was further
dissolved using eluent A to the following concentrations: S1: 100 pmol/mL; S2: 50,0
pmol/mL; QC1: 25.0 pmol/mL; S3: 10.0 pmol/mL; S4: 5.00 pmol/mL; QC2
: 2.50 pmol/mL;
S5: 1.00 pmol/mL; S6; 0.500 pmol/mL.
2.1.3 Cystatin C and chicken egg white cystatin
1000 µg of lyophilized powder, (Scipac, Sittingbourne, UK), was dissolved in 0.1 M sodium
acetate buffer pH 4.5 to obtain a stock solution of 74.92 x 10³ pmoL/mL (1000 µg/mL,

Larger molecular mass substances: Multiple (trapping) large volume injection - 141 -
calculated average Mm of cystatin C = 13.347 kDa) and further diluted into the following
concentrations: S1: 74.92 x 10² pmol/mL (100 µg/mL); QC1: 37.46 x 10² pmol/mL (50.0
µg/mL); S2: 18.73 x 10² pmol/mL (25.0 µg/mL); S3: 749.2 pmol/mL (10.0 µg/mL); QC2
:
374.6 pmol/mL (5.00 µg/mL); S4: 187.3 pmol/mL (2.50 µg/mL); S5: 74.92 pmol/mL (1.00
µg/mL). Physiological plasma concentrations (humans) are expected to lie within this
concentration range. Marker peptides were generated using Promega Sequencing Grade
Modified Trypsin (lyophilised powder, Leiden, The Netherlands) according to an earlier
published method [12]. To that end, cystatin C is denatured for one hour at 65°C using a
solution of 8M guanidine.HCl, buffered to pH 8 (purchased as 100 mL pre-buffered solution
at Sigma, Bornem, Belgium). 50mM Tris-HCl / 6M urea / 10% beta mercapto ethanol
(betaME), also buffered to pH 8, can be alternatively chosen as denaturing buffer.
Iodoacetamide (IA) is added as alkylating agent. To start the trypsinization process, trypsin is
added to a protease:protein ratio between 1:10 and 1:50. Prior to the overnight proteolysis, the
pH is verified to lie between 7 and 9. If necessary, trypsinized samples can be frozen (-80°C)
for storage without loss of peptides.
Chicken egg white cystatin (lyophilized powder, Sigma, Bornem, Belgium) was likewise
dissolved in 0.1 M sodium acetate buffer pH 4.5 to obtain a stock solution of 1000 µg/mL and
further diluted to a concentration of 50.0 µg/mL using Millipore high purity water. Marker
peptides of chicken egg white cystatin, slightly dissimilar to human cystatin C in amino-acid
sequence, are investigated as internal standard in the case of a quantitative analysis of cystatin
C. These marker peptides were generated following the above procedure.
All chemical agents used were purchased at Sigma (Bornem, Belgium). High purity water was
produced using a Synergy 185 system (Millipore Corporation, Bedford, MA).

Larger molecular mass substances: Multiple (trapping) large volume injection - 142 -
2.2 Liquid chromatography
Liquid chromatography was performed using a Waters-Micromass CapLC (Manchester, UK)
system, equipped with a Waters Stream Select 10-port valve module and 50 µL injection loop.
The analytical column consisted of a YMC ODS-AQ® 1.0 x 150 mm, 3 µm C18 microbore
HPLC column (YMC, Schermbeck, Germany). The multiple trapping was enabled on a C18
Pepmap®, 1.0 x 5 mm, 5 µm, 100Å precolumn (LC Packings, Dionex Corporation,
Sunnyvale, CA, USA). The binary mobile phase consisted of an eluent A, aqueous with 0.1 %
FA and an eluent B, (AcN with 0.1 % FA. In the trapping phase, an eluent C, which consisted
of a H2
1
O/AcN (95/5) mixture with 0.1% FA added, was used. All eluents were filtered over a
0.45 µm membrane filter prior to use. The flow-rate used was 40 µL/min and gradient elution
5 40 40 55 1 5 40 40 53.6 2 95 40 10 53.5 2 95 40 10 47 2 60 40 10 46.5 2 5 40 10 21.5 2 5 40 10 20.1 1 5 40 40 20 1 5 40 40 18 10 1 5 40 40 16 9 1 5 40 40 14 8 1 5 40 40 12 7 1 5 40 40 10 6 1 5 40 40 8 5 1 5 40 40 6 4 1 5 40 40 4 3 1 5 40 40 2 2 1 5 40 40 0 1
(µl/min) (µl/min
(min)
stream
%
flow auxiliary
time # of
injections
gradient
0102030405060708090
100
0 20 40 60
% eluent B auxiliary flow
Figure 1: Overview of the timed events for the binary (gradient) pump, auxiliary pump and
stream select 10-port valve.

Larger molecular mass substances: Multiple (trapping) large volume injection - 143 -
was applied. An overview of the chromatographic conditions and timed events is given in
Figure 1.
2.3 Mass spectrometry
precursor ion (m/z) product ion(s) (m/z) coll (eV) start time (min) end time (min)
[Glu1 785.8 ]-fibrinopeptide B 480.4 25 22 27
684.6 25 22 27
MassPREP
peptide 1 765.3 908.5 32 14 20
1037.5 32 14 20
1108.4 32 14 20
1179.6 32 14 20
peptide 2 640.4 736.0 22 14 20
834.3 22 14 20
948.0 22 14 20
1132.5 22 14 20
cystatin C
marker peptide 1 900.9 343.9 38 10 15
marker peptide 2 1168.8 1148.5 38 15 20
chicken egg white cystatine
marker peptide 1 689.4 947.0 15 10 15
1461.5 15 10 15
marker peptide 2 1089.3 (1118.3) 899.0 25 15 20
1261.0 25 15 20
The capillary HPLC system was interfaced with a Micromass Ultima Triple Quadrupole mass
spectrometer (Micromass-Waters, Manchester, UK), equipped with an orthogonal
electrospray source (Z-spray®) operated in the positive ion mode. Time dependent Multiple
Reaction Monitoring (MRM) transitions were used for quantitation of the different peptides.
Nitrogen was used both as nebulizer and drying gas and argon served as collision gas. A
narrow 65 µm capillary was used within the electrospray interface. The ionization source was
operated at 80°C and the desolvation temperature was 120°C. All spectra were collected in
Table 1: MRM conditions for the different (marker-) peptides.
Larger molecular mass substances: Multiple (trapping) large volume injection - 144 -
the continuum mode. An overview of the MRM transitions used is given in Table 1. Each
experiment was performed at least in triplicate.
By virtue of the high "full scan" sensitivity of a QTof mass spectrometer, a Micromass QTof-
1 hybrid mass spectrometer, (Micromass-Waters, Manchester, UK), was used for the selection
of the marker peptide subset out of the protein lysate. The QTof-1 was operated using the
same operational conditions, except that full scan product ion acquisition was used with a Tof
accumulation time of 1 second. Moreover, QTof full scan spectra were used for evaluation of
the product ion spectra, in order to select the most suitable product ions to be used for
detection and quantitation in the MRM mode.
3.1 Optimization of the chromatographic conditions
3. Results and discussion
For the absolute quantitation of proteins as a whole, LC-ESI-MS(/MS), is not yet self-evident.
The formation of different charge states during the electrospray ionization process decreases
the sensitivity. Indeed, the protein ions produced are spread out over the charge state envelope
and consequently only a minor portion of the protein ions produced can be selected in MRM
experiments. The so-called “bottom–up” approach, where proteins are first cleaved by
specific endo-peptidases (typically trypsin) followed by MS(/MS) analysis on the peptide
level, provides a worthwhile alternative [13]. In this approach, reproducible cleavage of the
protein in its corresponding tryptic peptides is a first essential step. Unfortunately, in-solution
trypsinization demands protein denaturing in advance. This inevitably involves a subsequent
minimal 10-fold dilution of the sample to lower the concentration of the
chaotropes/surfactants used, before trypsin can be put to work. As a result, the protein/peptide
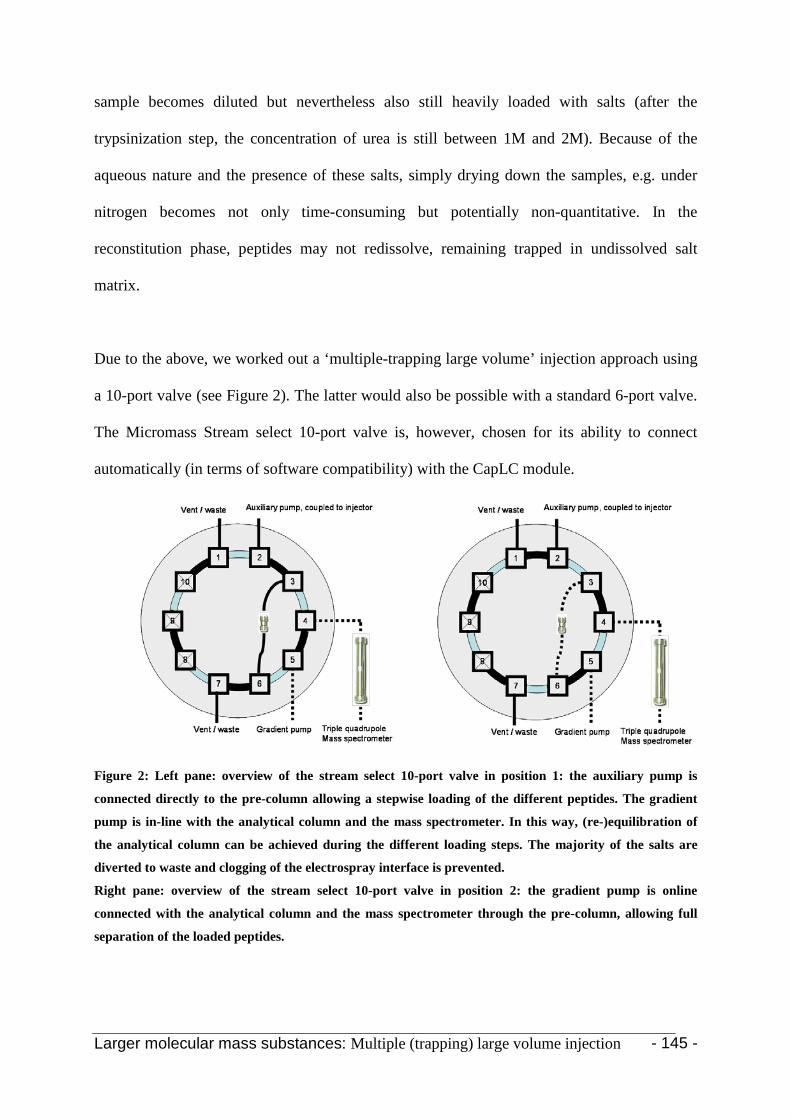
Larger molecular mass substances: Multiple (trapping) large volume injection - 145 -
sample becomes diluted but nevertheless also still heavily loaded with salts (after the
trypsinization step, the concentration of urea is still between 1M and 2M). Because of the
aqueous nature and the presence of these salts, simply drying down the samples, e.g. under
nitrogen becomes not only time-consuming but potentially non-quantitative. In the
reconstitution phase, peptides may not redissolve, remaining trapped in undissolved salt
matrix.
Due to the above, we worked out a ‘multiple-trapping large volume’ injection approach using
a 10-port valve (see Figure 2). The latter would also be possible with a standard 6-port valve.
The Micromass Stream select 10-port valve is, however, chosen for its ability to connect
automatically (in terms of software compatibility) with the CapLC module.
Figure 2: Left pane: overview of the stream select 10-port valve in position 1: the auxiliary pump is
connected directly to the pre-column allowing a stepwise loading of the different peptides. The gradient
pump is in-line with the analytical column and the mass spectrometer. In this way, (re-)equilibration of
the analytical column can be achieved during the different loading steps. The majority of the salts are
diverted to waste and clogging of the electrospray interface is prevented.
Right pane: overview of the stream select 10-port valve in position 2: the gradient pump is online
connected with the analytical column and the mass spectrometer through the pre-column, allowing full
separation of the loaded peptides.
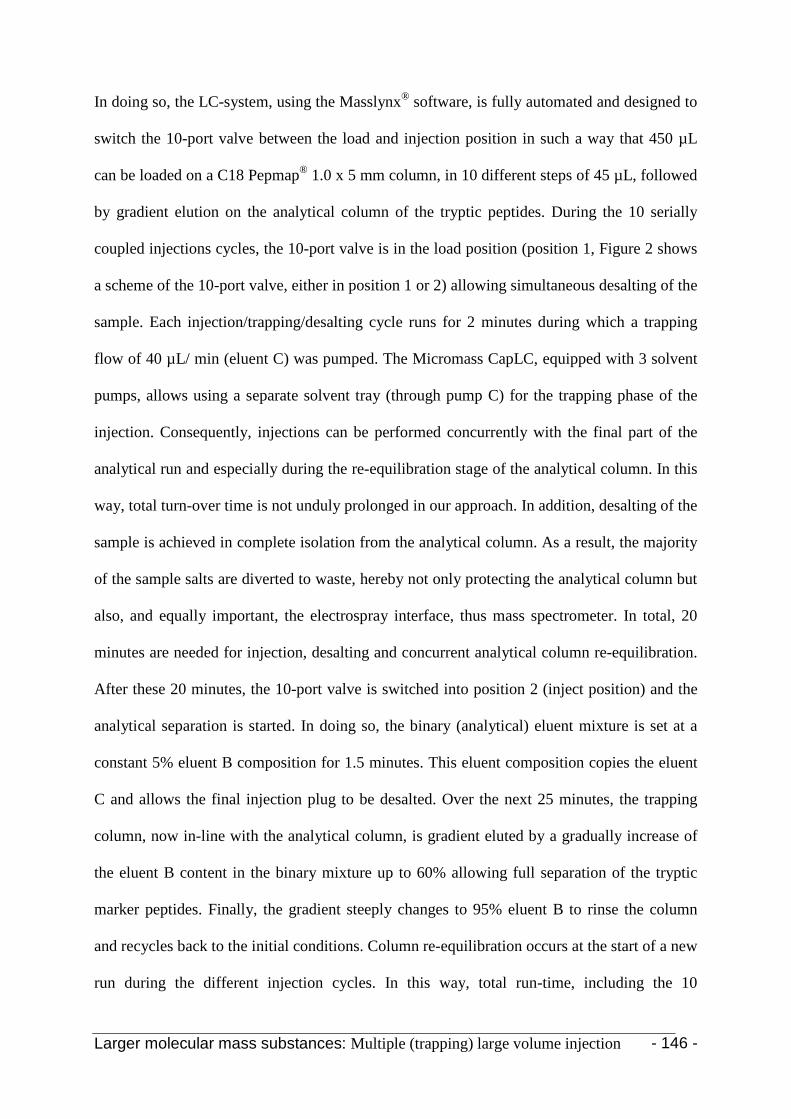
Larger molecular mass substances: Multiple (trapping) large volume injection - 146 -
In doing so, the LC-system, using the Masslynx® software, is fully automated and designed to
switch the 10-port valve between the load and injection position in such a way that 450 µL
can be loaded on a C18 Pepmap® 1.0 x 5 mm column, in 10 different steps of 45 µL, followed
by gradient elution on the analytical column of the tryptic peptides. During the 10 serially
coupled injections cycles, the 10-port valve is in the load position (position 1, Figure 2 shows
a scheme of the 10-port valve, either in position 1 or 2) allowing simultaneous desalting of the
sample. Each injection/trapping/desalting cycle runs for 2 minutes during which a trapping
flow of 40 µL/ min (eluent C) was pumped. The Micromass CapLC, equipped with 3 solvent
pumps, allows using a separate solvent tray (through pump C) for the trapping phase of the
injection. Consequently, injections can be performed concurrently with the final part of the
analytical run and especially during the re-equilibration stage of the analytical column. In this
way, total turn-over time is not unduly prolonged in our approach. In addition, desalting of the
sample is achieved in complete isolation from the analytical column. As a result, the majority
of the sample salts are diverted to waste, hereby not only protecting the analytical column but
also, and equally important, the electrospray interface, thus mass spectrometer. In total, 20
minutes are needed for injection, desalting and concurrent analytical column re-equilibration.
After these 20 minutes, the 10-port valve is switched into position 2 (inject position) and the
analytical separation is started. In doing so, the binary (analytical) eluent mixture is set at a
constant 5% eluent B composition for 1.5 minutes. This eluent composition copies the eluent
C and allows the final injection plug to be desalted. Over the next 25 minutes, the trapping
column, now in-line with the analytical column, is gradient eluted by a gradually increase of
the eluent B content in the binary mixture up to 60% allowing full separation of the tryptic
marker peptides. Finally, the gradient steeply changes to 95% eluent B to rinse the column
and recycles back to the initial conditions. Column re-equilibration occurs at the start of a new
run during the different injection cycles. In this way, total run-time, including the 10

Larger molecular mass substances: Multiple (trapping) large volume injection - 147 -
successive injections and simultaneous re-equilibration, is 55 minutes. An overview of the
various timed events is given in Figure 1.
With exceedingly low analyte concentrations, the road to miniaturization is generally chosen,
while the choice is not always as well-considered. To provide enhanced overall analytical
sensitivity, the miniaturization should be applied to all aspects of the process except the
injection volume. Unfortunately, this is frequently not possible as the maximum allowed
injection volume also decreases with the column internal diameter. In other words, the gain in
sensitivity by reducing the column internal diameter is largely counterbalanced by a loss of
injection volume [3, 16]. Consequently, when sample-volume is not limited, far-advanced
miniaturization, e.g. down to the nano-scale is not the preferred option, also taking robustness
issues into consideration. It is better (and technologically more practical) to miniaturize down
to columns with intermediately small internal diameters, thus concurrently profiting from
some of the advantage of miniaturization and allowing higher injection volumes and
consequently more absolute amount of sample onto the column.
In our case, samples are highly diluted during the trypsinization step. Sample volume is not an
issue, sample concentration is. Taking all of the above into account, a “multiple trapping large
volume injection” step, in combination with micro-LC was preferred as an alternative to gain
sensitivity. Additionally, a trapping set-up protects the analytical column from the highly
saline environment of the sample. Experiments without the use of the Pepmap®
pre-column
resulted in clogging of the analytical column front-frit, even after only 10 injections.
Essential in the given methodology is the number of sequential injections, trapping, desalting
steps, thus amount of sample which can potentially be loaded on the Pepmap® pre-column

Larger molecular mass substances: Multiple (trapping) large volume injection - 148 -
without significant analyte break-through. This was investigated as follows: for the two most
abundant proteolytic peptides of cystatin C (m/z 900.9 and m/z 1168.8), the peak area (from
MRM traces as described above), was measured starting from 1 injection (45µL) up to 10
successive injections (450µL) and plotted, together with the expected value, against injection
volume. The expected value was calculated out of the mean peak area for analysis after 5
injections/trappings, being the midpoint of the tested injection range. This value was divided
by 5 and multiplied by the number of successive injections. In contrast to the former chapter,
only the marker-peptides with m/z 900.9 and 1168.8 are taken into consideration. The marker-
peptide with m/z 685.0 is from this point on excluded out of the experiments because it only
consists of 6 amino-acids residues (ALQVRR) and hence, the given peptide on itself is not of
great value as a representative of cystatin C. All samples were measured in quadruplicate.
The plot (see Figure 3) indicates first, that there is a good linear correlation (R2
of 0.9815 and
0.9853, respectively) between the number of injections and the peak area, and second, that
there is concordance (no difference in slope) between the measured and expected peak areas.
Bivariate correlation analysis confirmed a correlation at the 0.01 level between the measured
peak areas and the expected peak areas for both peptides (Pearson Correlation of 0.991 and
0.993). The mean deviation, measured as (mean value-expected value)/expected value, was
maximally -18.19% for the peptide with m/z 900.9 and 11.30% for the peptide with m/z
1168.8.
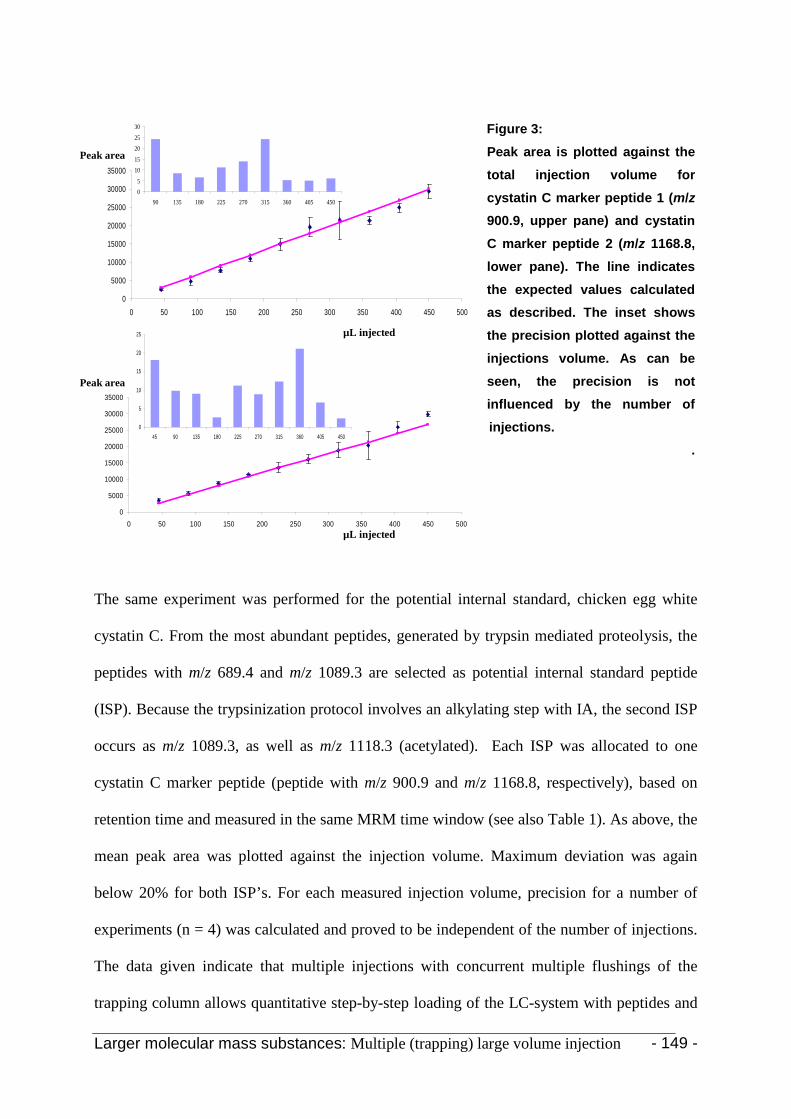
Larger molecular mass substances: Multiple (trapping) large volume injection - 149 -
The same experiment was performed for the potential internal standard, chicken egg white
cystatin C. From the most abundant peptides, generated by trypsin mediated proteolysis, the
peptides with m/z 689.4 and m/z 1089.3 are selected as potential internal standard peptide
(ISP). Because the trypsinization protocol involves an alkylating step with IA, the second ISP
occurs as m/z 1089.3, as well as m/z 1118.3 (acetylated). Each ISP was allocated to one
cystatin C marker peptide (peptide with m/z 900.9 and m/z 1168.8, respectively), based on
retention time and measured in the same MRM time window (see also Table 1). As above, the
mean peak area was plotted against the injection volume. Maximum deviation was again
below 20% for both ISP’s. For each measured injection volume, precision for a number of
experiments (n = 4) was calculated and proved to be independent of the number of injections.
The data given indicate that multiple injections with concurrent multiple flushings of the
trapping column allows quantitative step-by-step loading of the LC-system with peptides and
0
5000
10000
15000
20000
25000
30000
35000
0 50 100 150 200 250 300 350 400 450 500
05
1015
2025
30
90 135 180 225 270 315 360 405 450
0
5000
10000
15000
20000
25000
30000
35000
0 50 100 150 200 250 300 350 400 450 500
0
5
10
15
20
25
45 90 135 180 225 270 315 360 405 450
µL injected
µL injected
Figure 3:
Peak area is plotted against the
total injection volume for
cystatin C marker peptide 1 (m/z 900.9, upper pane) and cystatin
C marker peptide 2 (m/z 1168.8,
lower pane). The line indicates
the expected values calculated as described. The inset shows
the precision plotted against the
injections volume. As can be
seen, the precision is not influenced by the number of
injections.
.
Peak area
Peak area
Larger molecular mass substances: Multiple (trapping) large volume injection - 150 -
can provide a valuable alternative to further miniaturization. All of the former experiments
were performed at the upper QC concentration level.
AUC AUC
TIME (7-15min) TIME (14-23min)
450 µL45 µL
901.0 343.8
450 µL45µL
1168.5 1148.5
Peak area Peak area
TIME ( 7-17 min)
-TIME (14-22 min)
-
450 µL
45 µL
900.9 343.9
450 µL
45 µL
1168.8 1148.5
AUC AUC
TIME (7-15min) TIME (14-23min)
450 µL45 µL
901.0 343.8
450 µL45µL
1168.5 1148.5
Peak area Peak area
TIME ( 7-17 min)
-TIME (14-22 min)
-
450 µL
45 µL
900.9 343.9
450 µL
45 µL
1168.8 1148.5
AUC AUC
TIME (7-15min) TIME (14-23min)
450 µL45 µL
901.0 343.8
450 µL45µL
1168.5 1148.5
Peak area Peak area
TIME ( 7-17 min)
-TIME (14-22 min)
-
450 µL
45 µL
900.9 343.9
450 µL
45 µL
1168.8 1148.5
Figure 4: Upper pane: chromatogram of the cystatin C tryptic marker peptides with m/z 900.9 (left side)
and 1168.8 (right side) after 45 µL and 450 µL of injection volume. Time axis has been shifted to show
both peaks.
Middle pane: mean retention (n=30) time after 1 to 10 injections cycles of 45 µL.
Lower pane: mean peak width (n=30) time after 1 to 10 injections cycles of 45 µL.
Larger molecular mass substances: Multiple (trapping) large volume injection - 151 -
Whenever trying to inject large volumes, using whatever approach, peak broadening is an
issue to be monitored [15]. Therefore, peak width was determined for the cystatin C peptides
at half peak height and found to be independent of the number of consecutive injections, and
thus injection volume (see Figure 4). Total peak width was 0.1180 min. ± 0.0153 (mean peak
width ± sd, n=30) for the peptide with m/z 900.9 and 0.1090 min. ± 0.0101 for peptide with
m/z 1168.8. Also the retention time proved to be independent of the injection volume (see also
Figure 4).
3.2 Peptide standards
3.2.1 Glufib-peptide standards
In a following step, the practicability of the optimized injection method in the framework of
quantitative bio-analysis was tested. To that end, calibration curves were generated for
peptide standards. In a first instance, [Glu1]-fibrinopeptide B standard peptide and MassPREP
peptide standards were chosen over trypsin proteolysis generated peptides. In this way,
potential deviations in peptide concentration due to differences in trypsinization efficiency are
avoided and the injection procedure as such can be evaluated. For the glufib peptide calibrator
dilutions (see materials and methods), linear calibration curves, concentration versus peak
area as measured in MRM on the triple quadrupole mass spectrometer (see Table 1), were
obtained with coefficients of determination all exceeding 0.9991 (n=3). For the quality control
samples we ran simultaneously, maximum deviation from the nominal concentration
(accuracy) was -19.02% for the lower QC and 5.312% for the upper QC. Mean retention time
(Tr) was 18.31 min ± 1.075 min ((mean Tr
± sd, n=30)).
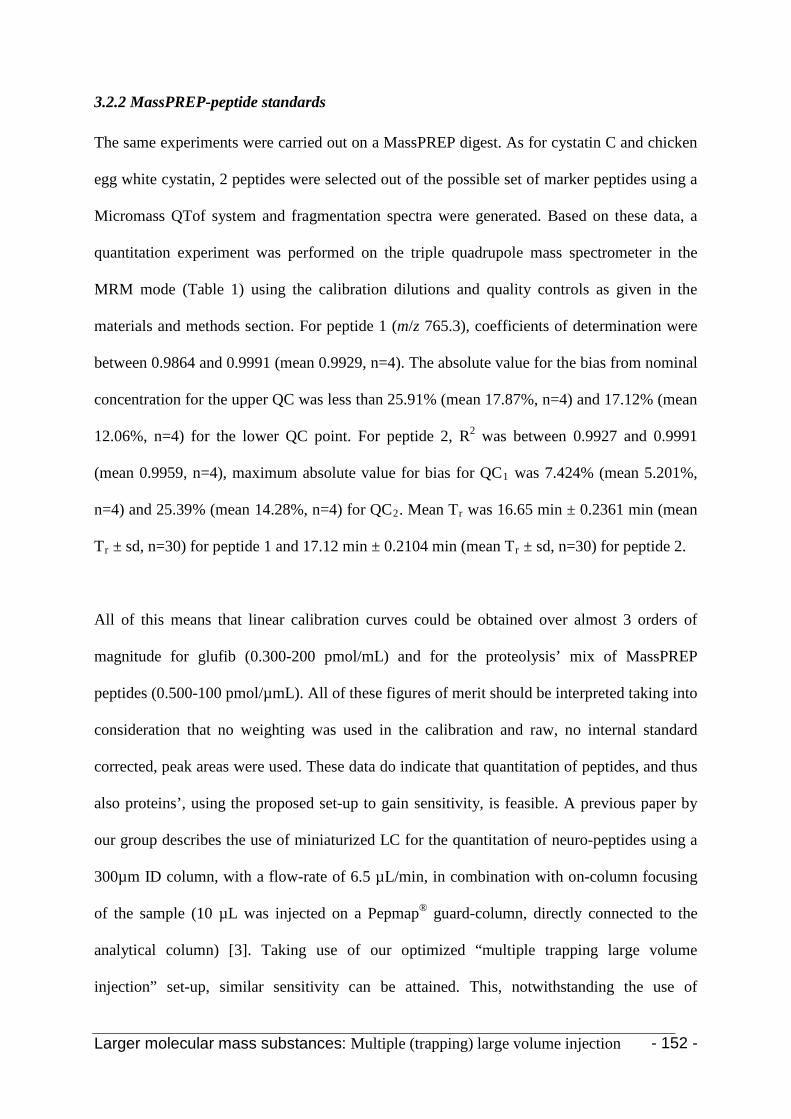
Larger molecular mass substances: Multiple (trapping) large volume injection - 152 -
3.2.2 MassPREP-peptide standards
The same experiments were carried out on a MassPREP digest. As for cystatin C and chicken
egg white cystatin, 2 peptides were selected out of the possible set of marker peptides using a
Micromass QTof system and fragmentation spectra were generated. Based on these data, a
quantitation experiment was performed on the triple quadrupole mass spectrometer in the
MRM mode (Table 1) using the calibration dilutions and quality controls as given in the
materials and methods section. For peptide 1 (m/z 765.3), coefficients of determination were
between 0.9864 and 0.9991 (mean 0.9929, n=4). The absolute value for the bias from nominal
concentration for the upper QC was less than 25.91% (mean 17.87%, n=4) and 17.12% (mean
12.06%, n=4) for the lower QC point. For peptide 2, R2 was between 0.9927 and 0.9991
(mean 0.9959, n=4), maximum absolute value for bias for QC1 was 7.424% (mean 5.201%,
n=4) and 25.39% (mean 14.28%, n=4) for QC2. Mean Tr was 16.65 min ± 0.2361 min (mean
Tr ± sd, n=30) for peptide 1 and 17.12 min ± 0.2104 min (mean Tr
± sd, n=30) for peptide 2.
All of this means that linear calibration curves could be obtained over almost 3 orders of
magnitude for glufib (0.300-200 pmol/mL) and for the proteolysis’ mix of MassPREP
peptides (0.500-100 pmol/µmL). All of these figures of merit should be interpreted taking into
consideration that no weighting was used in the calibration and raw, no internal standard
corrected, peak areas were used. These data do indicate that quantitation of peptides, and thus
also proteins’, using the proposed set-up to gain sensitivity, is feasible. A previous paper by
our group describes the use of miniaturized LC for the quantitation of neuro-peptides using a
300µm ID column, with a flow-rate of 6.5 µL/min, in combination with on-column focusing
of the sample (10 µL was injected on a Pepmap® guard-column, directly connected to the
analytical column) [3]. Taking use of our optimized “multiple trapping large volume
injection” set-up, similar sensitivity can be attained. This, notwithstanding the use of
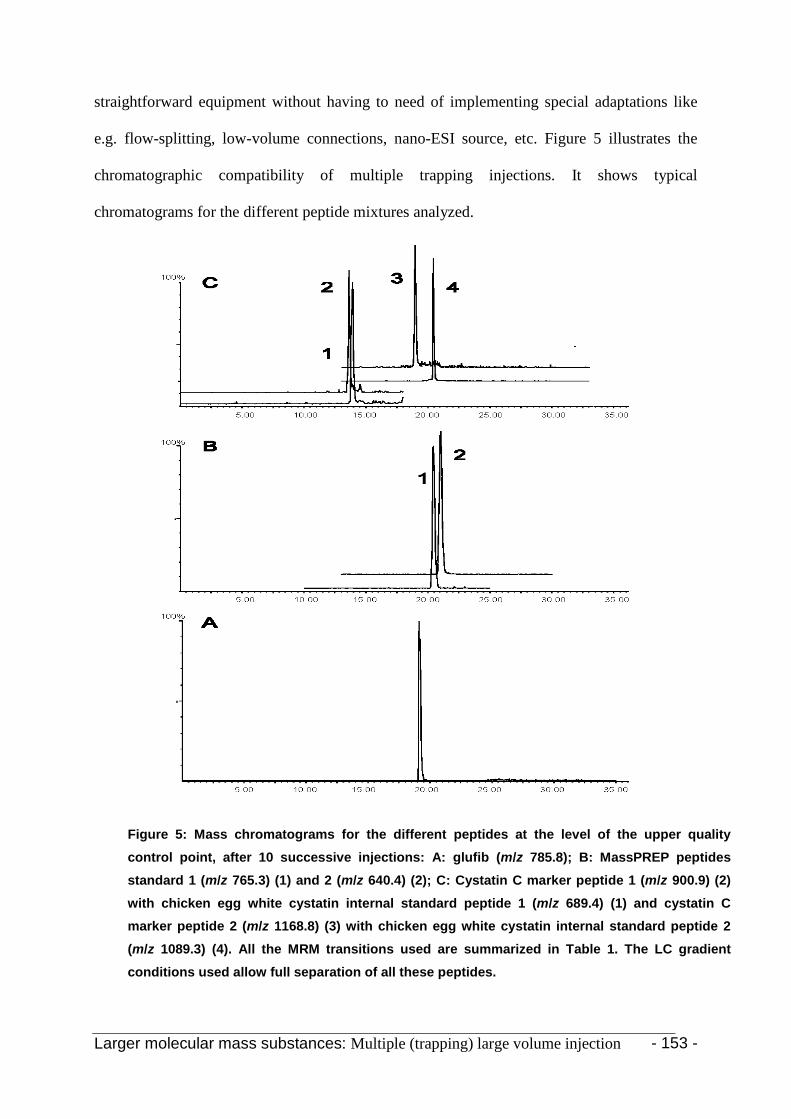
Larger molecular mass substances: Multiple (trapping) large volume injection - 153 -
straightforward equipment without having to need of implementing special adaptations like
e.g. flow-splitting, low-volume connections, nano-ESI source, etc. Figure 5 illustrates the
chromatographic compatibility of multiple trapping injections. It shows typical
chromatograms for the different peptide mixtures analyzed.
Figure 5: Mass chromatograms for the different peptides at the level of the upper quality
control point, after 10 successive injections: A: glufib (m/z 785.8); B: MassPREP peptides
standard 1 (m/z 765.3) (1) and 2 (m/z 640.4) (2); C: Cystatin C marker peptide 1 (m/z 900.9) (2)
with chicken egg white cystatin internal standard peptide 1 (m/z 689.4) (1) and cystatin C marker peptide 2 (m/z 1168.8) (3) with chicken egg white cystatin internal standard peptide 2
(m/z 1089.3) (4). All the MRM transitions used are summarized in Table 1. The LC gradient
conditions used allow full separation of all these peptides.
Larger molecular mass substances: Multiple (trapping) large volume injection - 154 -
3.2.3 Cystatin C and chicken egg white -peptide standards
So far, we only occasionally succeed in generating a satisfactory linear calibration curve (e.g.
R2 =0.9961) for cystatin C marker peptides obtained after tryptic proteolysis of the individual
standard solutions, probably due to substantial efficiency differences between different
enzyme subsets. Thus repeatability is so far rather unacceptable. Also, residuals for the lower
standards and bias for the lower QC sample are too high (≥ 30%). Nevertheless, when an
aliquot of the cystatin C stock-solution (1000 µg/mL) is proteolyzed first and subsequently,
post-proteolysis, diluted into the different calibrators and analyzed, linear calibration curves
can be obtained from 74.92 pmol/mL (equivalent to cystatin C concentration of 1 µg/mL) up
to 74.92 x 10³ pmol/µL (equivalent to cystatin C concentration of 1000 µg/mL) for both
marker peptides (mean ± sd; n=4; m/z 900.9: R2 = 0.9905 ± 0.006285; m/z 1168.8: R2
=
0.9924 ± 0.003092). Human patient blood samples all have expected cystatin C levels within
this range. Maximum deviation was -23.91% (peptide 1, m/z 900.9) and -22.81% (peptide 2,
m/z 1168.8) for the lower QC; 12.20% and 16.94% for the upper QC.
Mean Tr was respectively 13.85 ± 0.9389 and 17.71 min ± 0.9254 min (mean Tr ± sd, n=30)
time after 1 to 10 injections cycles of 45 µL. The lowest calibrator, 74.92 pmol/mL, is,
however, almost 2 orders of magnitude higher than the lowest calibrator diluted from the
MassPREP peptide standard. This is, in our opinion, mainly due to insufficient trypsinization
efficiency. It is clear that the reproducibility and efficiency of the in-solution trypsinization
step is not yet satisfactory, especially when working with lower concentrations. Indeed,
Strader et al. confirms that in solution trypsinization [16] of low concentrated proteins
(≤10.00 µg/mL) is insufficient. This is confirmed by the occasionally high deviation for the
lower calibrators when intact cystatin C protein calibration dilutions, individually trypsinized,
are analyzed. The applied in-solution trypsinization protocol uses a combination of thermal
Larger molecular mass substances: Multiple (trapping) large volume injection - 155 -
degradation and chaotropes or surfactants to ameliorate the enzymatic digestion rate. Their
use remains, however, ambiguous. If not diluted properly prior to the digestion step, high
concentrations of chaotropes/surfactants are incompatible with proteases and dilution of the
sample is absolutely mandatory. Unfortunately, this dilution has not only a negative impact on
sensitivity but possibly also brings about an even worse digestion efficiency because of the
resulting low protein concentration in the mixture. Addition of organic solvents like methanol
or AcN to the proteolysis buffers, to improve the reproducibility and efficiency of the
enzymatic digestion step, was also tested. With trypsin itself being resistant to unfolding in
organic solvents, the latter can assist in the enzymatic digestion by unfolding and solubilizing
the analyte proteins without demanding a further dilution, and thus lowered absolute protein
concentration, of the sample. Also, with increasing amounts of organic modifiers in the
digestion media, salt concentrations, negatively interfering with the electrospray ionization
interface, can be decreased proportionally. Unfortunately, no real improvement in digestion
efficiency could be noticed and reproducibility of the trypsinization process even worsened
(see chapter 4 for full evaluation of these results). Within the framework of the quantitative
analysis of proteins using marker peptides, the proteolysis step clearly remains a delicate
matter. It is in our opinion that further investigation is needed to alleviate some of these
problems and alternative methods, like e.g. the use of chemical based proteolysis need to be
explored. Table 2 gives an overview of the evaluation criteria for the different peptide
standards used.
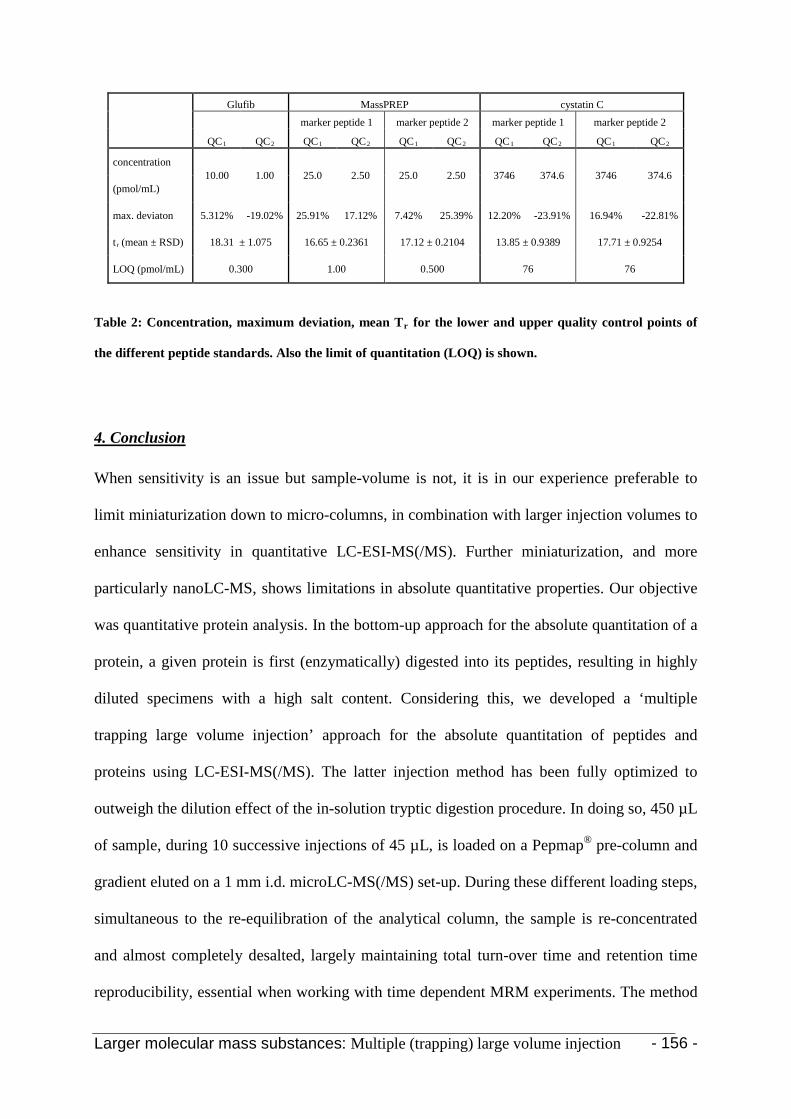
Larger molecular mass substances: Multiple (trapping) large volume injection - 156 -
Glufib MassPREP cystatin C
marker peptide 1 marker peptide 2 marker peptide 1 marker peptide 2
QC QC1 QC2 QC1 QC2 QC1 QC2 QC1 QC2 QC1
concentration
2
10.00 1.00 25.0 2.50 25.0 2.50 3746 374.6 3746 374.6 (pmol/mL)
max. deviaton 5.312% -19.02% 25.91% 17.12% 7.42% 25.39% 12.20% -23.91% 16.94% -22.81%
tr 18.31 ± 1.075 (mean ± RSD) 16.65 ± 0.2361 17.12 ± 0.2104 13.85 ± 0.9389 17.71 ± 0.9254
LOQ (pmol/mL) 0.300 1.00 0.500 76 76
Table 2: Concentration, maximum deviation, mean Tr
for the lower and upper quality control points of
the different peptide standards. Also the limit of quantitation (LOQ) is shown.
When sensitivity is an issue but sample-volume is not, it is in our experience preferable to
limit miniaturization down to micro-columns, in combination with larger injection volumes to
enhance sensitivity in quantitative LC-ESI-MS(/MS). Further miniaturization, and more
particularly nanoLC-MS, shows limitations in absolute quantitative properties. Our objective
was quantitative protein analysis. In the bottom-up approach for the absolute quantitation of a
protein, a given protein is first (enzymatically) digested into its peptides, resulting in highly
diluted specimens with a high salt content. Considering this, we developed a ‘multiple
trapping large volume injection’ approach for the absolute quantitation of peptides and
proteins using LC-ESI-MS(/MS). The latter injection method has been fully optimized to
outweigh the dilution effect of the in-solution tryptic digestion procedure. In doing so, 450 µL
of sample, during 10 successive injections of 45 µL, is loaded on a Pepmap
4. Conclusion
® pre-column and
gradient eluted on a 1 mm i.d. microLC-MS(/MS) set-up. During these different loading steps,
simultaneous to the re-equilibration of the analytical column, the sample is re-concentrated
and almost completely desalted, largely maintaining total turn-over time and retention time
reproducibility, essential when working with time dependent MRM experiments. The method

Larger molecular mass substances: Multiple (trapping) large volume injection - 157 -
as such proved to be adequate in terms of analytical variability. However, when dealing with
individually trypsinized peptide standards, variability is too high, probably caused by
insufficient and/or irreproducible trypsinization at lower protein concentrations. In the future,
digestion methods alternative to in solution trypsinization, e.g. chemical proteolysis and/or the
use of more standardized enzyme reactors, needs to be explored
This work was supported by grant B/06859-BOF06/24j/025 (Bijzonder OnderzoeksFonds of
the Ghent University) and grant G.0320.0 (FWO-Vlaanderen). The authors would also like to
thank Wim Goeteyn and Ir. Sofie Vandecasteele for their practical assistance during the
experiments.
5 Acknowledgements
1. J. Lill, Mass Spec. Rev., 2003 (22): p.182
6. References
2. B. Domon, and R. Aebersold, Science (special issue: tools for biochemistry), 2006 (312): p.212
3. B. Sinnaeve, and J. Van Bocxlaer, J. Chromatogr. A, 2004 (1058 (1-2)): p.113 4. Y. Ishihama, J. Chromatogr. A, 2005 (1067): p.73 5. L. Anderson, and C.L. Hunter, Mol. Cell. Proteomics, 2005 (5 ): p.573 6. V.H. Wysocki, K.A. Resing, Q. Zhang, and Cheng G., Methods, 2005 (35): p.211 7. B.A. Sinnaeve, M.L. Storme and Van J.F. Bocxlaer, J. Sep. Sci., 2005 (28): p.1779 8. Y. Saito, K. Jinno, and T. Greibrokk, J. Sep. Sci., 2004 (27): p.1379 9. M. Li, Y. Alnouti, R. Leverence, H. Bi, and A.I. Gusev, J. Chromatogr. B, 2005, (825):
p.152 10. S. De Koning, M. Kurano, H. Janssen, and U.H.Th. Brinkman, J. Chromatogr. A, 2004
(1023): p.165 11. A.C. Hogenboom, M.P. Hofman, S.J. Kok, W.M.A. Niessen, and U.A.Th. Brinkman, J.
Chromatogr. A, 2000 (892): p.379 12. M.L. Storme, B.A. Sinnaeve, and J.F. Van Bocxlaer, J. Sep. Sci., 2005, (28(14)): p.1759 13. T. Fröhlich, and G.J. Arnold, J. Neural. Transm., 2006 (113): p.973 14. M. Kranendijk, J.C.M. Waterval, G.W. Somsen and de Jong G.J., J. Sep. Sci., 2005 (28
(14)): p.1796 15. V. Hinshow, LCGC Asia Pacific, 2004 (7): p.21 16. M.B. Strader, D.L. Tabb, W.J. Hervey, C. Pan, and G.B. Hurst, Anal. Chem., 2006 (78):
p.125

Larger molecular mass substances: Multiple (trapping) large volume injection
158

Larger molecular mass substances: Chemical (CNBr) proteolysis 159
Chapter 4
The investigation of chemical (CNBr) proteolysis
as an alternative to enzymatic (tryptic) digestion
Prepared for publication as:
The combination of chemical proteolysis and a protein related analogue internal standard as a tool for the
absolute quantitation of proteins.
M.L. Storme, R.S. t’ Kindt, and J.F. Van Bocxlaer.
Larger molecular mass substances: Chemical (CNBr) proteolysis 160
Nowadays, the use of marker-peptides is a well-known methodology for the absolute quantitation of proteins by
means of LC-MS(/MS). Essential in such a set-up is the efficiency and reproducibility of the proteolysis step. In
this chapter, the use of chemical proteolysis using cyanogen bromide (CNBr), to generate these marker-peptides,
was investigated under different cleavage conditions and compared to more commonly used enzymatic digestion
protocols. As expected, CNBr produces less but larger marker-peptides due to the lower natural occurrence of
methionine compared to arginine and lysine. In addition, contrary to in solution trypsinization, CNBr-
proteolysis does not require a dilution of the protein solution prior to the digestion and thus, lower protein
concentrations can be measured under the same LC-MS(/MS) conditions. Also, the use of a protein related
internal standard (IS) was tested to outweigh digestion efficiency differences. As such, overall reproducibility of
the chemical proteolysis decreases from 40.76% ± 10.21 (mean ± sd, n=7) to 15.41% ± 4.853 and calibration
curves could be obtained from 1.00 up to 100 µg/mL. These concentrations are equal to the ones in the former
chapter, using tryptic digests, albeit that independently digested calibrators were used. This, contrary to the
previous described enzymatic approach in which trypsin fails to digest effectively at lower protein
concentrations (<10µg/mL). Again, all experiments were performed using cystatin C as a proof-of-concept
protein and chicken egg-white cystatin as internal standard.
Larger molecular mass substances: Chemical (CNBr) proteolysis 161
In most bottom-up proteomics experiments, peptides are generated using enzymatic digestion
of the selected protein(s), mainly based on trypsin. In such a set-up, a protein is first
proteolyzed into its corresponding peptides followed by quantitation (mostly relative, between
for instance healthy and diseased state) using e.g. ICAT
1. Introduction
®, iTRAQ®
, etc, of the latter peptides
using LC-MS(/MS) [1].
Expanding the basic tools used in semi-quantitative proteomic experiments like e.g. tryptic
digestion, to an absolute quantitative level, nowadays more and more important in routine
clinical research, for instance due to the growing amount of protein biomarkers for diseases
and treatment efficacy [2], frequently resulted in suboptimal results caused by reproducibility
and efficiency problems of the enzymatic digestion step. This proves especially so when
working with medium to low abundant proteins ( ≤ 1 0 µg/mL). Indeed, Strader et al. confirm
insufficient trypsinization of medium to low abundant proteins because the reaction rate of the
enzymatic digestion is proportional to the concentration [3]. Furthermore, most exo-
peptidases have a Km-value in the range from 5 to 50 mM, which means they are operating at
50% of maximum velocity when a protein concentration of 5 to 50 nmol/µL is used [4, 5].
Thus, with concentrations below 5 to 50 nmol/µL, as is the case with the majority of protein
biomarkers, the proteolytic activity toward the substrate will be minimal, while autolysis rates
will be relatively high [5]. Additionally, proteolytic enzymes require effective denaturing of
the protein in advance. This can only be achieved by the use of organic solvents, heat,
chaotropes, or surfactants to render more of the protein’s structure accessible to the
proteolytic enzyme [6-9]. In many cases, thermal denaturizing results in sample loss due to
precipitation because many proteins are susceptible to aggregation when treated with heat.
Chaotropes and surfactants on the other hand are very effective but their use is ambiguous. At
Larger molecular mass substances: Chemical (CNBr) proteolysis 162
high concentrations, surfactants and chaotropes also inactivate proteases. Therefore, dilution
of the sample to lower their concentration is required [10]. However, dilution can result in
protein refolding and lowers the substrate concentration (thus reduced proteolytic efficiency).
Addition of organic solvents like methanol or AcN can overcome these problems by
unfolding and solubilizing proteins [11, 12] without interfering with the proteolytic activity of
trypsin. Indeed, trypsin itself is resistant to unfolding in organic solvents and further dilution
of the sample to lower the concentration of the used chaotropes/ surfactants is thus of lower
importance [13]. Several different reaction media using organic solvents were tested and their
use will be discussed in the results and discussion section.
As an alternative to enzymatic methods, various chemically based cleaving methods, in
essence independent of protein concentration, have been described in the past [14]. Only a
handful of these methods yield relatively predictable cleavage products and have been applied
in practice. However, these chemicals may succeed where enzymes fail, or may provide more
specific cleavage options when only non-specific endo-proteases can be used [15]. During the
last decades, only chemical cleavage of proteins based on cyanogenbromide (CNBr)
hydrolysis has become a common alternative to tryptic digestion [16, 17]. Some well known
advantages are ease of application, high reproducibility and high selectivity to methionine
residues. Also, in-situ cleavage of proteins onto a wide range of membrane filters is possible
[18]. In general, CNBr based proteolysis is performed with a large excess of CNBr in acid
conditions during 12 to 24h. CNBr hydrolyses peptide bonds C-terminal to methionine
residues. The efficiency of this bond cleavage exceeds 90% except in situations where a
serine or threonine residue follows methionine in the amino-acids sequence. Indeed, when
methionine is followed by serine or threonine, the same iminolactone is formed as is normally
the case (cfr. infra). However, by the presence of a hydroxyl in the adjacent amino-acid, as is

Larger molecular mass substances: Chemical (CNBr) proteolysis 163
also the case in Figure 1, this group can also react with the imine. Homoserine is also formed
but without peptide bond cleavage [16, 19-21].
Figure 1: reaction scheme of CNBr based proteolysis. Under acidic (cleavage) conditions, the formation of
a homoserine lactone is favoured, while under basic (non-cleavage) conditions, the formation of the
homoserine is favoured.
As shown in Figure 1, the electrons on the carbon atom of the CNBr are pulled towards the
more electronegative bromine. The partially positive carbon is then attacked by the
nucleophilic sulphur of the methionine group. The same reaction is not favoured by other
sulphur containing amino-acids, like cysteine. Indeed, if a cysteine sulphur would attack
CNBr, the resulting free Br- ion would deprotonate the cyanide adduct formed, making the
sulphur uncharged and thus the beta-carbon of the cysteine not electrophilic. The cyanide
nitrogen is then a stronger electrophile than the thiocyanide nitrogen. In the presence of water,
Larger molecular mass substances: Chemical (CNBr) proteolysis 164
this would yield cyanic acid and the original cysteine. In the case of methionine, the latter is
not possible through the presence of the alpha methyl group. The nucleophilic attack is then
followed by the formation of a five-membered ring, although the formation of a six-
membered ring is theoretically also possible. However, this would entail the formation of a
double bond into the ring between the nitrogen and the carbon. The resulting rigid ring
structure would destabilize the molecule as is not the case in a five-membered ring with the
double bond outside the ring structure (iminolactone). Under acidic conditions, and in the
presence of water, the iminolactone undergoes a Shiff base hydrolysis and the actual
proteolysis takes place. In doing so, a homoserine lactone peptide is formed at the C-terminal
end and an N-terminal peptide at the other [16, 19]. The activity of CNBr is unusual in the
way it proteolysis at the C-terminal side of methionine, opposed to enzymatic digestion with
cleaves at the N-terminal side of a given amino-acid (matrixscience.com).
Thus, the newly formed peptides have a homoserine lactone (∆M ass=-48 Da), which can in
their turn undergo further hydrolysis to form homoserine –NH-CH-(CH2- CH2
-OH)-COOH
(∆Mass=-30 Da) at the C-termini. Acidic conditions favour the formation of homoserine
lactone, whereas under basic conditions the free acid (homoserine) is formed [17, 22-25].
Acid conditions are obtained by reaction media of 60 to 80% FA or TFA.
In the past, FA was mostly selected as reaction agent because of its ability to solubilize most
proteins. Also, other highly acidic solutions like 0.1N HCl were used but are now rather rare
because of the possible oxidation of methionine to methionine sulfoxide. In FA, this side
reaction is less common because FA is also a known reducing agent. Thus oxidation reactions
are not favoured [19]. A major drawback of the use of FA, however, is the formation of
hydroxyl-amino-acids, including the newly formed homoserines. Itakura et al. were the first
Larger molecular mass substances: Chemical (CNBr) proteolysis 165
to describe CNBr cleavage of peptide bonds with trifluoroacetic acid en found the latter to be
superior to FA with a higher yield of cleaved methionine-serine and methionine-threonine
bonds [26]. In this paper, both formic and trifluororacetic acid were tested, with and without
the presence of water. In 2005, a new protocol was optimized by Samyn et al. [22] for the C-
terminal analysis of proteins based on CnBr cleavage. Nevertheless, until now, CNBr-based
cleavage is virtually exclusively used in structural bottom-up proteomic experiments like the
analysis of post-translational modifications or amino-acid sequence elucidation [4, 22].
The scope of this chapter is to explore the possibilities of using CNBr based proteolysis for
the absolute quantitation of proteins based on marker-peptides. Of high importance in such a
set-up is the reproducibility of the proteolysis step, which is, as described in the former
chapter, often erroneous with enzymatic digestion. Against this, the often stated independent
nature of chemical (CNBr) protein hydrolysis to protein concentration is expected to generate
more reliable results in comparison with enzymatic methods like e.g. trypsinization. Other
chemical digestion methods like cysteine cleavage by 2-nitro-5-thiocyano-benzoic acid,
tryptophan cleavage by BNPS-skatole (2-(2-nitrophenylsulfenyl)-3-methyl-3-
bromoindolenine), the cleavage of asparagine-glycine bonds by hydroxylamine or acid
cleavage of asparagine-proline bonds are not considered valuable in quantitative experiments
because of the scarcity of the possible reaction sites and/or to many side reactions [5].
For all the experiments, cystatin C was, as before, chosen as a model protein.
Larger molecular mass substances: Chemical (CNBr) proteolysis 166
2.1 Proteins
2. Experimental
Cystatin C, lyophilized powder, (Scipac, Sittingbourne, UK), reconstituted in 0.1 M sodium
acetate buffer pH 4.5 to obtain a stock solution of 1000 µg/mL and further diluted using
milliQ high purity water into the following concentrations: S1: 100 µg/mL (equivalent to
74.92 x 10² pmol/mL); QC1: 50.0 µg/mL (37.46 x 10² pmol/mL); S2: 25.0 µg/mL (18.73 x
102 pmol/mL); S3: 10.0 µg/mL (749.2 pmol/mL); QC2
Chicken egg white cystatin, lyophilized powder, (Sigma, Bornem, Belgium) dissolved in the
same 0.1 M sodium acetate buffer pH 4.5 to obtain a stock solution of 1000 µg/mL and
further diluted to a concentration of 50 µg/mL (average molecular weight 13.148 Da; 38.03 x
10
: 5.00 µg/mL (374.6 pmol/mL); S4:
2.50 µg/mL (187.3 pmol/mL); S5: 1.00 µg/mL (74.92 pmol/mL). Physiological plasma
concentrations (humans) are expected to lie within this concentration range.
2
pmol/mL) using MilliQ high purity water. Marker peptides of chicken egg white cystatin,
slightly dissimilar to human cystatin C in amino-acid sequence, acted as internal standard.
These marker peptides were generated following the above procedures.
2.2 Chemicals
All chemical agents used were purchased at Sigma (Bornem, Belgium). High purity water was
produced using a Synergy 185 system (Millipore Corporation, Bedford, MA).
2.3 Proteolysis protocols
2.3.1 Enzymatic proteolysis

Larger molecular mass substances: Chemical (CNBr) proteolysis 167
Tryptic marker peptides were generated using Promega Sequencing Grade Modified Trypsin
(lyophilized powder, Leiden, The Netherlands) according to the method validated in chapter
1. To that end, cystatin C is denatured for one hour at 65°C using a solution of 8M guanidine.
HCl, buffered to pH 8 (purchased as 100 mL pre-buffered solution at Sigma, Bornem,
Belgium). 50mM Tris-HCl / 6M urea (whith 10% betaME), also buffered to pH 8, can be
alternatively chosen as denaturing buffer. Iodoacetamide (IA) is added as alkylating agent. To
start the trypsinization process, trypsin is added to a protease:protein ratio between 1:10 and
1:50. Prior to the overnight proteolysis (room temperature), the pH is verified to lie between 7
and 9. Other digestion media using organic solvents were also tested. According to Strader et
al., the addition of organic solvents facilitates enzymatic digestion [3]. This effect is of the
utmost importance at lower protein concentrations. The following reaction media were tested
and compared to 8M guanidine.HCl pH 8 (medium Tr I); 66mM NH4HCO3 (medium Tr II);
AcN:66mM NH4HCO3 60:40 (medium Tr III); AcN:66mM NH4HCO3 80:20 (medium Tr
IV); methanol:66mM NH4HCO3 60:40 medium Tr V); methanol:66mM NH4HCO3
80:20
(medium Tr VI); 100% AcN (medium Tr VII); and 100% MeOH (medium Tr VIII). To each
medium, 10% betaME was added.
2.3.2 Chemical proteolysis
Using CNBr, marker peptides were generated overnight at 4°C. To that end, 50 µL of protein
solution was mixed with 500 µL of reaction medium. The following reaction media were
tested: CNBr 5M in AcN:TFA 40:60 (medium CN I); H2O:CNBr 5M in AcN:TFA (TFA)
20:20:60 (medium CN II); CNBr 5M in AcN:TFA 30:70 (medium CN III); H2O:CNBr 5M in
AcN:TFA 15:15:70 (medium CN IV); CNBr 5M in AcN:formic acid (FA) 30:70 (medium
CN V); H2O:CNBr 5M in AcN:FA 15:15:70 (medium CN VI). All reaction media were
produced in-situ immediately prior to their use. The resulting peptide mixture was dried under
Larger molecular mass substances: Chemical (CNBr) proteolysis 168
a stream of nitrogen and redissolved in 100 µL of mobile phase (eluent A). Care should be
taken when working with TFA, FA and CNBr, all being very corrosive and toxic. These
reagents should only be used under a fume hood, wearing adequate protective clothing.
2.4 Liquid chromatography
Liquid chromatography was performed on an YMC ODS-AQTM
1 x 150 mm, 3 µm (C18)
micro-column using an Agilent HP 1100 series HPLC (Palo Alto, CA, USA) system equipped
with a membrane degasser, binary gradient pump, column oven (20°C) and autosampler. The
system was set to pump at 40 µl/min in the micro-flow-mode. In doing so, an active splitter
device, inherent to the system, is used, capable of selecting different splitting ratios. A low
solvent consumption splitting ratio of 1 to 4 was used for economical reasons. The binary
mobile phase consisted of an eluent A, aqueous with 0.1 % FA, and an eluent B of 0.1 % FA
in AcN. All eluents were filtered over a 0.45 µm membrane filter prior to use. Gradient
elution was applied, after an initial equilibration phase of 5 min at 5 % B, from 5 to 60 % B
over the next 26.5 min followed by a steep rise to 95 % B. The column is then kept at these
conditions for 3.5 min. Further on, the gradient returns to its initial conditions during 1 min
and re-equilibration occurs during 9 min. Asso, total run time is 45 min with an initial
pressure of approximately 70 bar. The injection volume was 20 µL.
2.5 Mass spectrometry
The HPLC system was directly interfaced with a Micromass Ultima Triple Quadrupole mass
spectrometer (Micromass-Waters, Manchester, UK), equipped with an orthogonal
electrospray source (Z-spray®) operated in the positive ion mode. Time dependent Multiple
Reaction Monitoring (MRM) transitions were used for quantitation of the different peptides.
Larger molecular mass substances: Chemical (CNBr) proteolysis 169
Nitrogen was used both as nebulizer and drying gas and argon served as collision gas. A
narrow 65 µm capillary was used in the electrospray interface. The ionization source was
operated at 80°C and the desolvation temperature was 120°C. All spectra were collected in
the continuum mode. For each selected marker peptide of cystatin C, either produced by
tryptic digestion or chemical digestion, a specific MRM function was optimized. Each
experiment was at least performed in triplicate. At masses above 2000 Da, quadrupole mass
spectrometers typically gradually loose sensitivity. As a consequence, if possible, m/z values
exceeding 2000 Da were excluded as possible marker peptides.
By virtue of the high "full scan" sensitivity of a QTof mass spectrometer, a Micromass QTof-
1 hybrid mass spectrometer, (Micromass-Waters, Manchester, UK), was used for the selection
of the tryptic marker peptide subset out of the protein lysate. The QTof-1 was operated using
the same operational conditions, except that full product ion scanning was used with a Tof
accumulation time of 1 second. Moreover, QTof full scan spectra were used for evaluation of
the product ion spectra, in order to select the most suitable product ions to be used for
detection and quantitation in the MRM mode. All the MS(/MS) transitions used and their
corresponding tuning parameters are summarized in Table 3.
3.1 Selection of the internal standard
3. Results and discussion
In the field of quantitative protein analysis, so called isotope (stable) dilution mass
spectrometry (IDMS) experiments with isotopically labelled internal standards are most likely
to be found. These methods take use of the fact that pairs of chemically identical peptides of
different isotope composition can be differentiated in a mass spectrometer owing to their mass

Larger molecular mass substances: Chemical (CNBr) proteolysis 170
difference, and the ratio of signal intensities for such peptide pairs accurately indicates the
abundance ratio of the analyte [24]. However, the fact that at the start of the experiment the
analyte is a protein and the internal standard is a peptide, severe quantitation errors may result
due to the selection of unsuitable reference peptides and/or, but far more important, imperfect
protein proteolysis [27]. Moreover, for the analysis of e.g. plasma proteins, peptidic internal
standards can not correct for analyte losses during sample pre-treatment. Above this, limited
availability and high costs, an isotopically labelled internal standard needs to be purpose-
synthesized, have hampered the widespread application of isotopically labelled internal
standards [28]. Contrary to this approach, we evaluated the use of a cystatin C analogue,
chicken egg white cystatin, as an alternative. Chicken egg white cystatin consists of a chain of
140 amino-acid residues, with 2 disulphide bridges between amino-acids 94-104 and between
amino-acids 118-139. In comparison with cystatin C, chicken egg white cystatine has almost
50% sequence similarity. Both the cystatin C and the chicken egg white cystatin amino-acid
sequence, with possible cleaving sites are shown in Figure 4 of chapter 1. Cleavage sites are
obviously important because the use of a whole protein as internal standard, instead of an
(isotopically labelled) peptide, allows compensating for minor differences in cleavage
efficiencies. Indeed, both the analyte and the internal standard are cleaved simultaneously
under the same reaction conditions.
3.2 Selection of the marker-peptides
Tryptic and CNBr peptides were generated starting from previously optimized procedures [4,
22, 29]. According to the Swiss-Prot database (November 2006), many more cleaving sites
are expected for trypsin compared to CNBr. Indeed, in all of the amino-acids sequences in the
database, arginine and lysine are far more present then methionine residues, respectively
5.40% and 5.92% in contrast to 2.38%. Consequently, not only fewer but also larger peptides

Larger molecular mass substances: Chemical (CNBr) proteolysis 171
are generated by CNBr. The latter now permits that only one peptide is sufficient as an
unambiguous stoechiometric representative of the protein. Indeed, according to Mascot, a
powerful search engine that uses mass spectrometric data (mass fingerprint) to identify
proteins from primary sequence databases (www.matrixscience.org), it are the higher
experimental peptide mass values which provide greatest discrimination in a mass fingerprint.
Thus, the higher the mass of the peptide, the more distinctive features it has. The latter is also
confirmed by Samyn et al. who use only the C-terminal peptide amino-acid sequence,
obtained after CNBr chemical cleavage of the protein, together with the molecular mass of the
CNBr fragments to unambiguously characterize the protein. The effectiveness of the approach
was hereby confirmed and tested on 2D-PAGE proteins separated from S. oneidensis [22].
When working with chemical instead of enzymatic cleavage, sterical hindrance has almost no
influence on the reaction and marker peptides can often be generated without the necessity to
denature the protein in advance, especially when no disulphide bridges are present. In doing
so, less chemical substances can interfere with the mass spectrometric detection.
Consequently, the peptide mixtures formed are less complex, also because fewer peptides are
generated.
Only when a given cleavage site is positioned in between the amino-acid loop formed by a
disulphide bridge, denaturing and alkylation is mandatory to disconnect the formed peptides
from each other. For cystatin C, the chosen model protein, samples were not reduced and
alkylated prior to the chemical digestion, despite the presence of 2 disulphide bridges between
amino-acids 99-109 and 123-143. As a consequence, potential individual marker peptides stay
connected and are lost for our intended quantitative purpose. For cystatin C, potential CNBr
marker peptides between amino-acid 68 and 136 with m/z 7996 [M+H] and between amino-
Larger molecular mass substances: Chemical (CNBr) proteolysis 172
acid 137 and 146 with m/z 1053 [M+H] will not be disconnected from each other as they are
linked by the 123-143 disulphide bond. This results in a larger peptide of 79 amino-acid
residues. The latter can no longer be taken into consideration as a potential marker peptide
candidate as it is susceptible to the same effects, e.g. envelope formation during the
electrospray ionization process, as the cystatin C protein itself. Hence, the use of such a
marker peptides is of no value to facilitate the mass spectrometric analysis. If only this long
kind of marker peptides can be generated, it is better to analyze the protein as a whole.
Nevertheless, we chose to work this way because a representative marker peptide (from the
first part of the protein) is obtained anyhow and it allows us to reduce the complication,
dilution and variability of the procedure introduced by alkylation and reduction steps.
For the selected internal standard, chicken egg white cystatin C, on the other hand, no
possible CNBr cleaving sites lie in between a disulphide bridge. Thus, no potential marker
peptides will be lost. All potential marker peptides after tryptic- and CNBr based proteolysis
are summarized in Table 1 for cystatin C and Table 2 for chicken egg white cystatin. For the
enzymatic cleavage, also peptides composed of 2 tryptic fragments, thus allowing 1 missed
cleavage, are taken into account. Theoretical masses of the peptides fragments and
corresponding m/z values, ranging from [M+H]+ until [M+3H]3+, are calculated using the
Masslynx Biolynx®
software tool and PeptideCutter/PeptideMass. Both are proteomics and
sequence analysis tools of the ExPASy (Expert Protein Analysis System) proteomics server
(www.expasy.org). Cleavage sites with low cleavage probability are not taken into
consideration as possible cleavage position. As such, for trypsin, cleavage sites followed by a
proline residue are neglected as are CNBr cleavage sites followed by a serine or threonine
residue.

Larger molecular mass substances: Chemical (CNBr) proteolysis 173
Name Sequence Theoretical mass [M+H] [M+2H]+ [M+3H]2+
M1
3+
SSPGKPPRLVGGPM 1379.7 1380.7 690.8 460.9 M2 DASVEEEGVRRALDFAVGEYNKASNDM 2973.2 2974.2 1487.6 992.1
M3 YHSRALQVVRARKQIVAGVNYFLDVELGRTTCTKTQP NLDNCPFHDQPHLKRKAFCSFQIYAVPWQGTM 7995.2 7996.3 3998.6 2666.1
M4 TLSKSTCQDA 1053.2 1054.2 527.6 352.1
T1 SSPGKPPR 824.9 825.9 413.5 276.0 T2 LVGGPMDASVEEEGVR 1644.8 1645.8 823.4 549.3 T3 R 174.1 175.1 88.1 59.1 T4 ALDFAVGEYNK 1226.4 1227.4 614.2 409.8 T5 ASNDMYHSR 1080.2 1081.2 541.1 361.1 T6 ALQVVR 684.8 685.9 343.4 229.3 T7 AR 245.2 246.2 123.6 82.7 T8 K 146.1 147.1 74.1 49.7 T9 QIVAGVNYFLDVELGR 1793.1 1794.1 897.5 598.7
T10 TTCTK 552.7 553.7 277.3 185.2 T11 TQPNLDNCPFHDQPHLK 2004.2 2005.2 1003.1 669.1 T12 R 174.1 175.1 88.1 59.1 T13 K 146.1 147.1 74.1 49.7 T14 AFCSFQIYAVPWQGTMTLSK 2278.7 2279.7 1140.4 760.6 T15 STCQDA 623.6 624.7 312.8 208.9
T1-2 SSPGKPPRLVGGPMDASVEE EGVR 2451.7 2452.8 1226.9 818.3 T2-3 LVGGPMDASVEEEGVRR 1801.0 1802.0 901.5 601.4 T3-4 RALDFAVGEYNK 1382.5 1383.6 692.3 461.9 T4-5 ALDFAVGEYNKASNDMYHSR 2288.5 2289.5 1145.3 763.8 T5-6 ASNDMYHSRALQVVR 1747.0 1748.0 874.5 583.3 T6-7 ALQVVRAR 912.1 913.1 457.1 305.0 T7-8 ARK 373.5 374.5 187.7 125.5 T8-9 KQIVAGVNYFLDVELGR 1921.2 1922.2 961.6 641.4
T9-10 QIVAGVNYFLDVELGRTTCT K 2327.7 2328.7 1164.9 776.9 T10-11 TTCTKTQPNLDNCPFHDQPH LK 2538.9 2539.9 1270.4 847.3 T11-12 TQPNLDNCPFHDQPHLKR 2160.4 2161.4 1081.2 721.1 T12-13 RK 302.4 303.4 152.2 101.8 T13-14 KAFCSFQIYAVPWQGTMTLSK 2406.9 2407.9 1204.4 803.3 T14-15 AFCSFQIYAVPWQGTMTLSK STCQDA 2884.3 2885.3 1443.2 962.4
Table 1: possible marker peptides after cleavage with CNBr (M1-M4) and trypsin (T1-T15) of cystatin C.
For each peptide, the corresponding theoretical mass en m/z values are given. As for the tryptic fragments,
one missed cleavage is allowed (K/R-P and M-S/T cleavage sites are not taken into consideration).
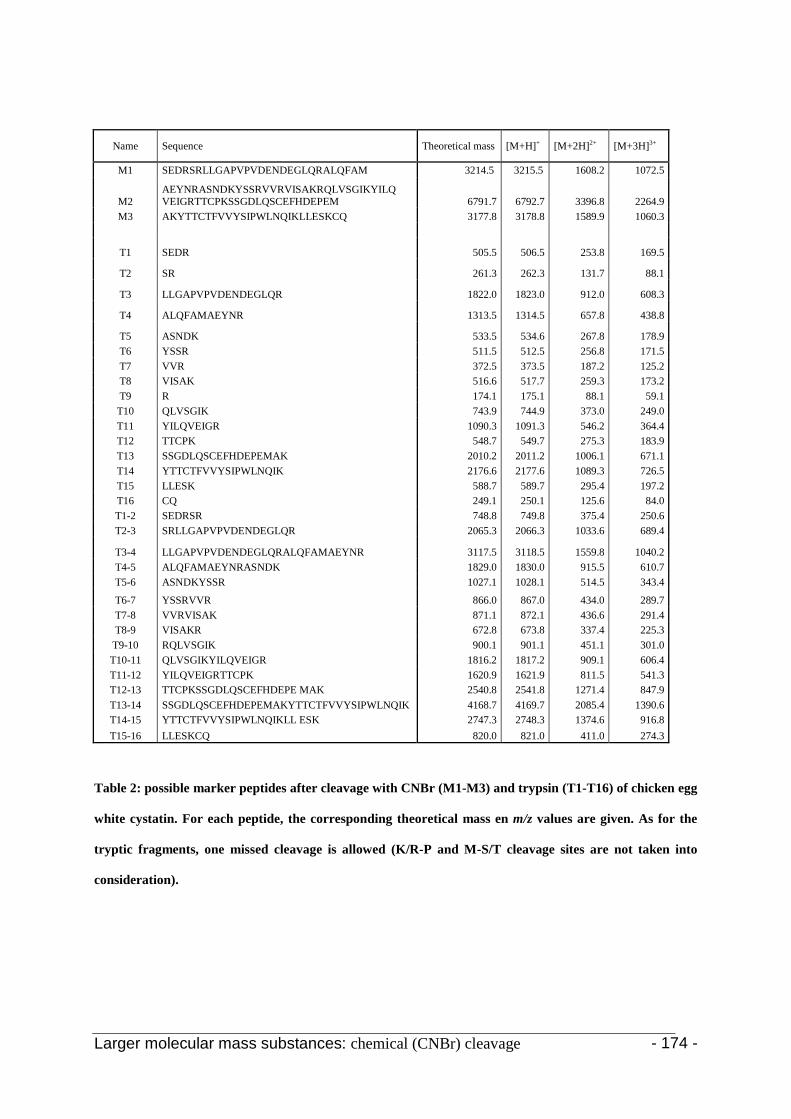
Larger molecular mass substances: chemical (CNBr) cleavage - 174 -
Name Sequence Theoretical mass [M+H] [M+2H]+ [M+3H]2+
M1
3+
SEDRSRLLGAPVPVDENDEGLQRALQFAM 3214.5 3215.5 1608.2 1072.5
M2 AEYNRASNDKYSSRVVRVISAKRQLVSGIKYILQ VEIGRTTCPKSSGDLQSCEFHDEPEM 6791.7 6792.7 3396.8 2264.9
M3 AKYTTCTFVVYSIPWLNQIKLLESKCQ 3177.8 3178.8 1589.9 1060.3
T1 SEDR 505.5 506.5 253.8 169.5
T2 SR 261.3 262.3 131.7 88.1
T3 LLGAPVPVDENDEGLQR 1822.0 1823.0 912.0 608.3
T4 ALQFAMAEYNR 1313.5 1314.5 657.8 438.8
T5 ASNDK 533.5 534.6 267.8 178.9 T6 YSSR 511.5 512.5 256.8 171.5 T7 VVR 372.5 373.5 187.2 125.2 T8 VISAK 516.6 517.7 259.3 173.2 T9 R 174.1 175.1 88.1 59.1
T10 QLVSGIK 743.9 744.9 373.0 249.0 T11 YILQVEIGR 1090.3 1091.3 546.2 364.4 T12 TTCPK 548.7 549.7 275.3 183.9 T13 SSGDLQSCEFHDEPEMAK 2010.2 2011.2 1006.1 671.1 T14 YTTCTFVVYSIPWLNQIK 2176.6 2177.6 1089.3 726.5 T15 LLESK 588.7 589.7 295.4 197.2 T16 CQ 249.1 250.1 125.6 84.0 T1-2 SEDRSR 748.8 749.8 375.4 250.6 T2-3 SRLLGAPVPVDENDEGLQR 2065.3 2066.3 1033.6 689.4
T3-4 LLGAPVPVDENDEGLQRALQFAMAEYNR 3117.5 3118.5 1559.8 1040.2 T4-5 ALQFAMAEYNRASNDK 1829.0 1830.0 915.5 610.7 T5-6 ASNDKYSSR 1027.1 1028.1 514.5 343.4
T6-7 YSSRVVR 866.0 867.0 434.0 289.7 T7-8 VVRVISAK 871.1 872.1 436.6 291.4 T8-9 VISAKR 672.8 673.8 337.4 225.3
T9-10 RQLVSGIK 900.1 901.1 451.1 301.0 T10-11 QLVSGIKYILQVEIGR 1816.2 1817.2 909.1 606.4 T11-12 YILQVEIGRTTCPK 1620.9 1621.9 811.5 541.3 T12-13 TTCPKSSGDLQSCEFHDEPE MAK 2540.8 2541.8 1271.4 847.9 T13-14 SSGDLQSCEFHDEPEMAKYTTCTFVVYSIPWLNQIK 4168.7 4169.7 2085.4 1390.6 T14-15 YTTCTFVVYSIPWLNQIKLL ESK 2747.3 2748.3 1374.6 916.8 T15-16 LLESKCQ 820.0 821.0 411.0 274.3
Table 2: possible marker peptides after cleavage with CNBr (M1-M3) and trypsin (T1-T16) of chicken egg
white cystatin. For each peptide, the corresponding theoretical mass en m/z values are given. As for the
tryptic fragments, one missed cleavage is allowed (K/R-P and M-S/T cleavage sites are not taken into
consideration).
Larger molecular mass substances: chemical (CNBr) cleavage - 175 -
3.3 Enzymatic digestion
With enzymatic cleavage, many more cleavage sites are present and thus more, but also
shorter peptides (cfr. supra) will be formed. Some of these cleavage sites lie in between the
loop formed by a disulphide bridge and, as a consequence, sterical hindrance can interfere
with the enzymatic reaction. Thus, denaturing of the protein and reducing of the disulphide
bonds to allow the digestion enzyme (trypsin) to reach the cleavage positions is absolutely
necessary. Most common in these cases is the use of chaotropes like e.g. urea in combination
with DTT or betaME to reduce the disulphide bridges. Following, iodoacetamide is added to
block the free SH-groups, in this way preventing the reformation of the disulphide bridges.
However, with trypsin being a protein in itself, lowering the concentration of the chaotrope
used after the denaturing and alkylating step is absolutely mandatory. It follows that the
sample becomes more and more diluted. In total, a minimal 10-fold dilution of the analyte is
easily obtained. Evaporation under nitrogen, for instance, to regain or even increase the initial
concentration is very time-consuming due to the aqueous characteristics of the media used.
Desalting using specific desalting pipette tips like SpinTip®
, another frequently applied
methodology to (re)gain sensitivity, is only possible for small volumes and thereby not
favourable. Ultracentrifugation devices to isolate the peptides formed could eventually solve
these drawbacks (see later).
Different cleaving procedures were investigated and compared. All the different reaction
media are described in the material and method section. In this optimization part, we opted to
work at a somewhat higher concentration, being 100 µg/mL. In this way, our sensitivity was
adequate enough to evaluate the results obtained with enzymatic proteolysis without the need
to introduce an extra re-concentration step. As such, comparison between CNBr based
proteolysis and enzymatic proteolysis in terms of the digestion method is not biased by the
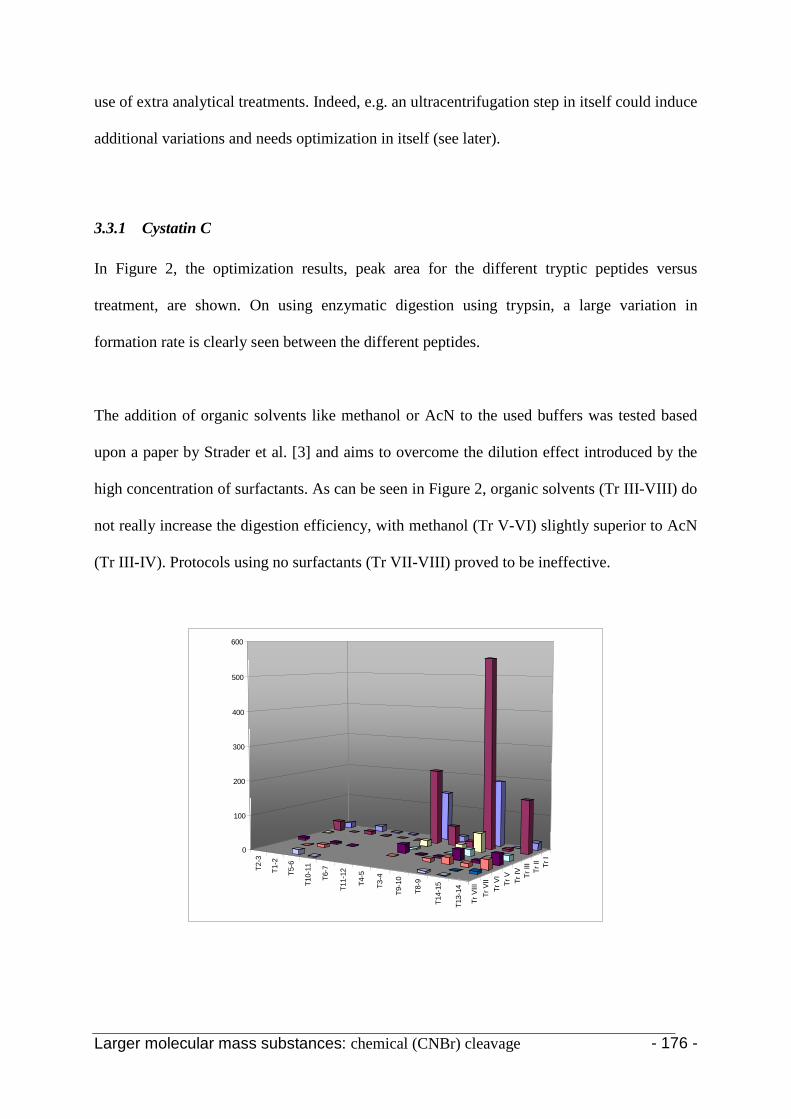
Larger molecular mass substances: chemical (CNBr) cleavage - 176 -
use of extra analytical treatments. Indeed, e.g. an ultracentrifugation step in itself could induce
additional variations and needs optimization in itself (see later).
3.3.1 Cystatin C
In Figure 2, the optimization results, peak area for the different tryptic peptides versus
treatment, are shown. On using enzymatic digestion using trypsin, a large variation in
formation rate is clearly seen between the different peptides.
The addition of organic solvents like methanol or AcN to the used buffers was tested based
upon a paper by Strader et al. [3] and aims to overcome the dilution effect introduced by the
high concentration of surfactants. As can be seen in Figure 2, organic solvents (Tr III-VIII) do
not really increase the digestion efficiency, with methanol (Tr V-VI) slightly superior to AcN
(Tr III-IV). Protocols using no surfactants (Tr VII-VIII) proved to be ineffective.
T2-3
T1-2
T5-6
T10-
11
T6-7
T11-
12
T4-5
T3-4
T9-1
0
T8-9
T14-
15
T13-
14
Tr I
Tr II
Tr II
ITr
IVTr
VTr
VI
Tr V
IITr
VIII
0
100
200
300
400
500
600
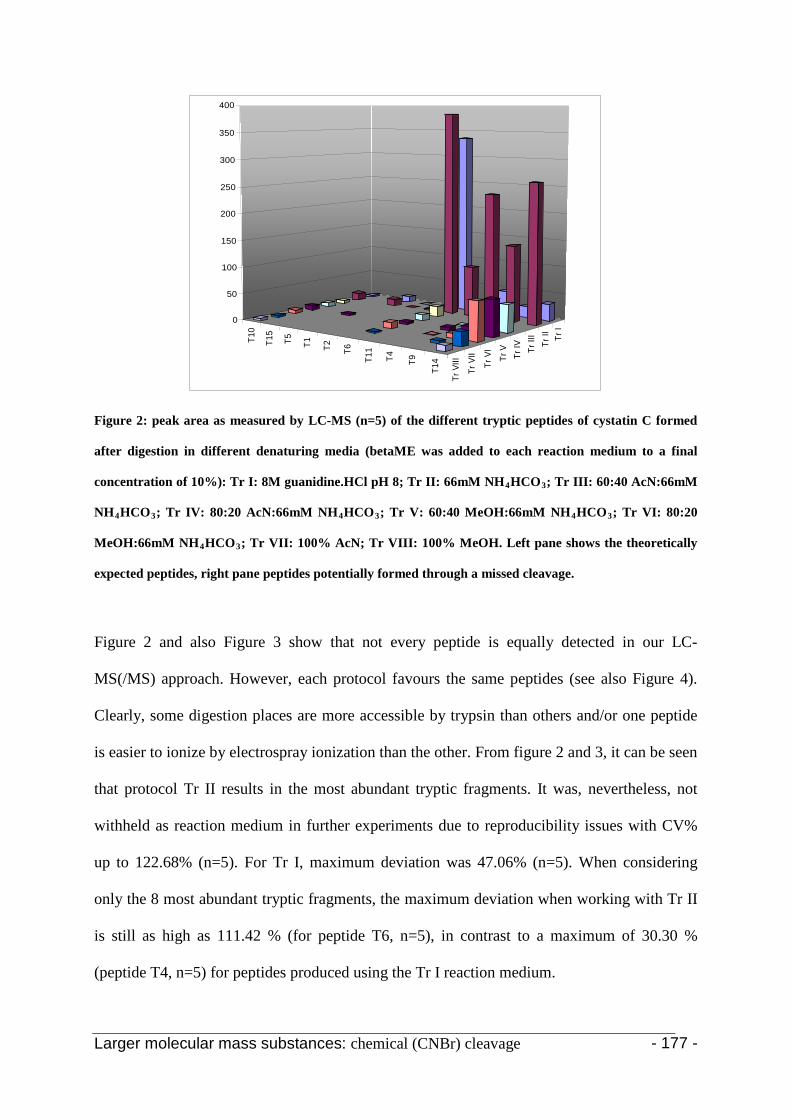
Larger molecular mass substances: chemical (CNBr) cleavage - 177 -
T10
T15
T5 T1 T2 T6
T11
T4 T9
T14
Tr I
Tr II
Tr II
ITr
IVTr
V
Tr V
I
Tr V
II
Tr V
III
0
50
100
150
200
250
300
350
400
Figure 2: peak area as measured by LC-MS (n=5) of the different tryptic peptides of cystatin C formed
after digestion in different denaturing media (betaME was added to each reaction medium to a final
concentration of 10%): Tr I: 8M guanidine.HCl pH 8; Tr II: 66mM NH4HCO3; Tr III: 60:40 AcN:66mM
NH4HCO3; Tr IV: 80:20 AcN:66mM NH4HCO3; Tr V: 60:40 MeOH:66mM NH4HCO3; Tr VI: 80:20
MeOH:66mM NH4HCO3
; Tr VII: 100% AcN; Tr VIII: 100% MeOH. Left pane shows the theoretically
expected peptides, right pane peptides potentially formed through a missed cleavage.
Figure 2 and also Figure 3 show that not every peptide is equally detected in our LC-
MS(/MS) approach. However, each protocol favours the same peptides (see also Figure 4).
Clearly, some digestion places are more accessible by trypsin than others and/or one peptide
is easier to ionize by electrospray ionization than the other. From figure 2 and 3, it can be seen
that protocol Tr II results in the most abundant tryptic fragments. It was, nevertheless, not
withheld as reaction medium in further experiments due to reproducibility issues with CV%
up to 122.68% (n=5). For Tr I, maximum deviation was 47.06% (n=5). When considering
only the 8 most abundant tryptic fragments, the maximum deviation when working with Tr II
is still as high as 111.42 % (for peptide T6, n=5), in contrast to a maximum of 30.30 %
(peptide T4, n=5) for peptides produced using the Tr I reaction medium.
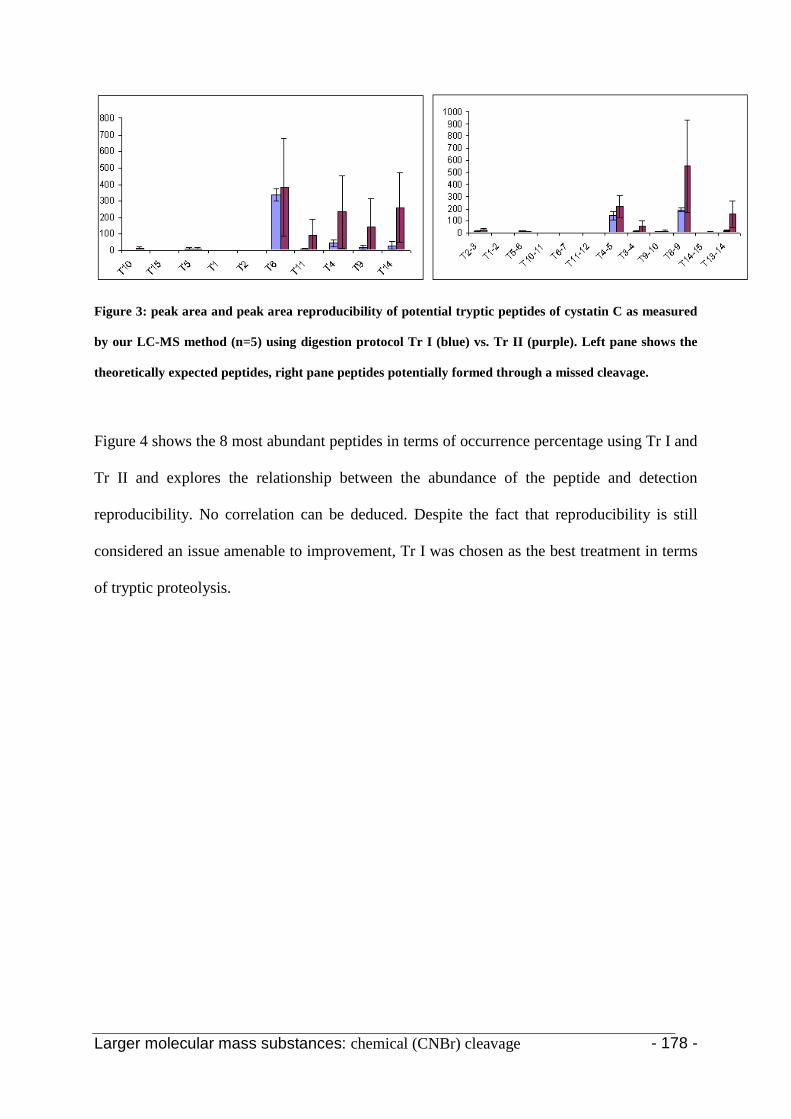
Larger molecular mass substances: chemical (CNBr) cleavage - 178 -
Figure 3: peak area and peak area reproducibility of potential tryptic peptides of cystatin C as measured
by our LC-MS method (n=5) using digestion protocol Tr I (blue) vs. Tr II (purple). Left pane shows the
theoretically expected peptides, right pane peptides potentially formed through a missed cleavage.
Figure 4 shows the 8 most abundant peptides in terms of occurrence percentage using Tr I and
Tr II and explores the relationship between the abundance of the peptide and detection
reproducibility. No correlation can be deduced. Despite the fact that reproducibility is still
considered an issue amenable to improvement, Tr I was chosen as the best treatment in terms
of tryptic proteolysis.

Larger molecular mass substances: chemical (CNBr) cleavage - 179 -
Figure 4: upper pane: formation and/ or detection of the eight most abundant peptides using Tr I (8M
guanidine.HCl pH 8) and Tr II (66mM NH4HCO3)
lower pane: relation between reproducibility and the occurrence percentage of the detected peptides
(n=5).
in terms of occurrence percentage;
As already described in the former chapters, 2 peptides were selected as effective marker-
peptides based on their chromatographic behaviour and position in the cystatin C sequence
aiming for maximal dispersal throughout the amino-acid sequence and full chromatographic
separation. In view of the above, T14 (m/z 1168.8 (+IAA); doubly charged) and T2-3 (m/z
900.9; doubly charged) were selected as marker peptide.
The above data already indicate that the trypsinization process in itself lacks sufficient
reproducibility for the absolute quantitation of proteins. Consequently, adequate internal
standardization, able to compensate for fluctuations in digestion rate efficiency, is mandatory.

Larger molecular mass substances: chemical (CNBr) cleavage - 180 -
3.3.2 Chicken egg white cystatin
Out of the marker peptide subset of chicken egg white cystatin, two peptides were selected as
internal standard peptide (ISP). On doing so, each marker peptide of cystatin C is correlated to
one ISP. The latter are selected based on retention time characteristics. As such, ISP’s as close
as possible to the retention time of the selected marker peptides of cystatin C were aimed for,
ideally co-eluting.
cystatin C chicken egg white cystatin
trypsin CNBr trypsin CNBr
T2-3 T14 M2 T2-3 T14 M3
precursor ion m/z (Da) 900.9 1168.5 976.4 689.4 1089.3 (1118.3) 1060.0
product ion(s) m/z (Da) 343.9 1148.5 976.4 947.0 899.0 1060.0
765.0 1461.5 1261.0 1408.5
CE eV 38.0 38.0 25.0 15.0 25.0 30.0
30.0 15.0 25.0 30.0
Dwell time S 1.0 1.0 0.8 0.5 0.5 0.8
0.5 0.5 0.5 0.5
Table 3: overview of the different MRM transitions used and corresponding mass spectrometric
conditions.
In view of the above, peptides with 689.4 (T2-3, triply charged) and 1089.3 (T14, doubly
charged) were chosen as ISP for the cystatin C marker 900.9 (T2-3, doubly charged) and
1168.8 (T14, doubly charged) respectively and are, in addition, equally positioned in the
amino-acids sequence as their corresponding cystatin C marker peptides. Time dependent
MRM transitions were used during the mass spectrometric detection. All the transitions used
are summarized in Table 3. Compared to the previous work, only one precursor-product ion
transition was monitored for cystatin C, in an effort to enhance sensitivity.
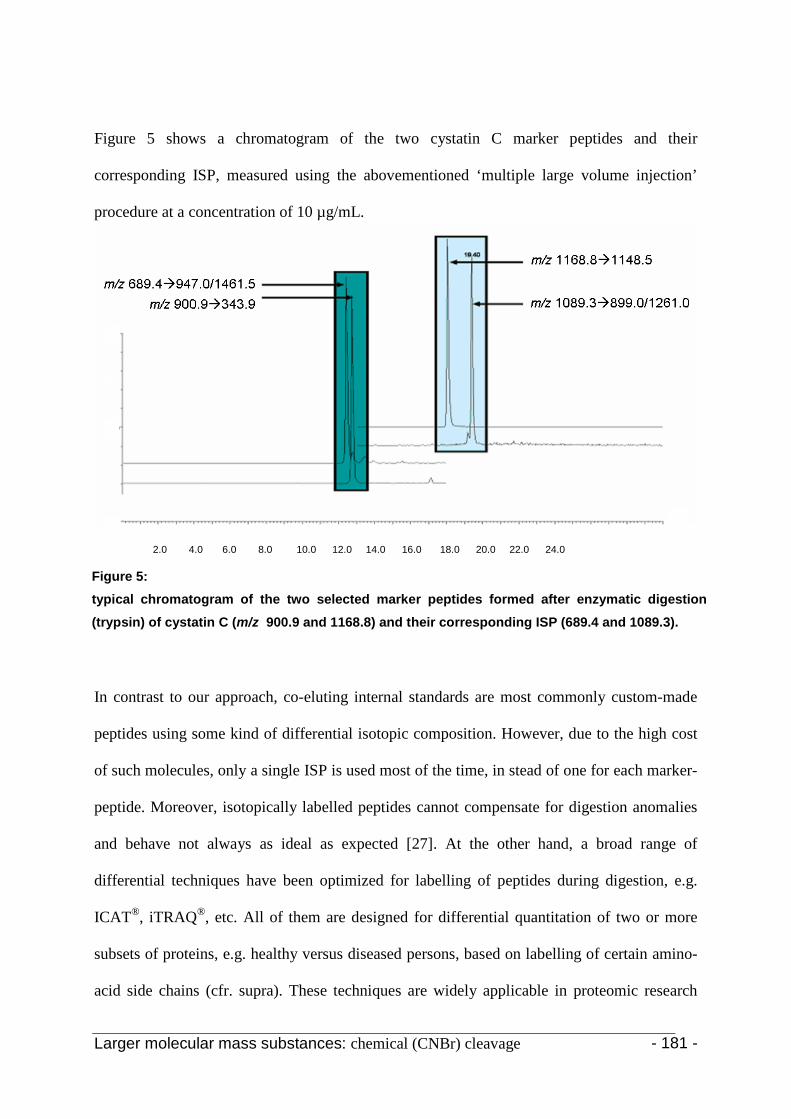
Larger molecular mass substances: chemical (CNBr) cleavage - 181 -
Figure 5 shows a chromatogram of the two cystatin C marker peptides and their
corresponding ISP, measured using the abovementioned ‘multiple large volume injection’
procedure at a concentration of 10 µg/mL.
In contrast to our approach, co-eluting internal standards are most commonly custom-made
peptides using some kind of differential isotopic composition. However, due to the high cost
of such molecules, only a single ISP is used most of the time, in stead of one for each marker-
peptide. Moreover, isotopically labelled peptides cannot compensate for digestion anomalies
and behave not always as ideal as expected [27]. At the other hand, a broad range of
differential techniques have been optimized for labelling of peptides during digestion, e.g.
ICAT®, iTRAQ®
2.0
, etc. All of them are designed for differential quantitation of two or more
subsets of proteins, e.g. healthy versus diseased persons, based on labelling of certain amino-
acid side chains (cfr. supra). These techniques are widely applicable in proteomic research
4.0 6.0 8.0 10.0 12.0 14.0 16.0 18.0 20.0 22.0 24.0
100%
Figure 5: typical chromatogram of the two selected marker peptides formed after enzymatic digestion
(trypsin) of cystatin C (m/z 900.9 and 1168.8) and their corresponding ISP (689.4 and 1089.3).
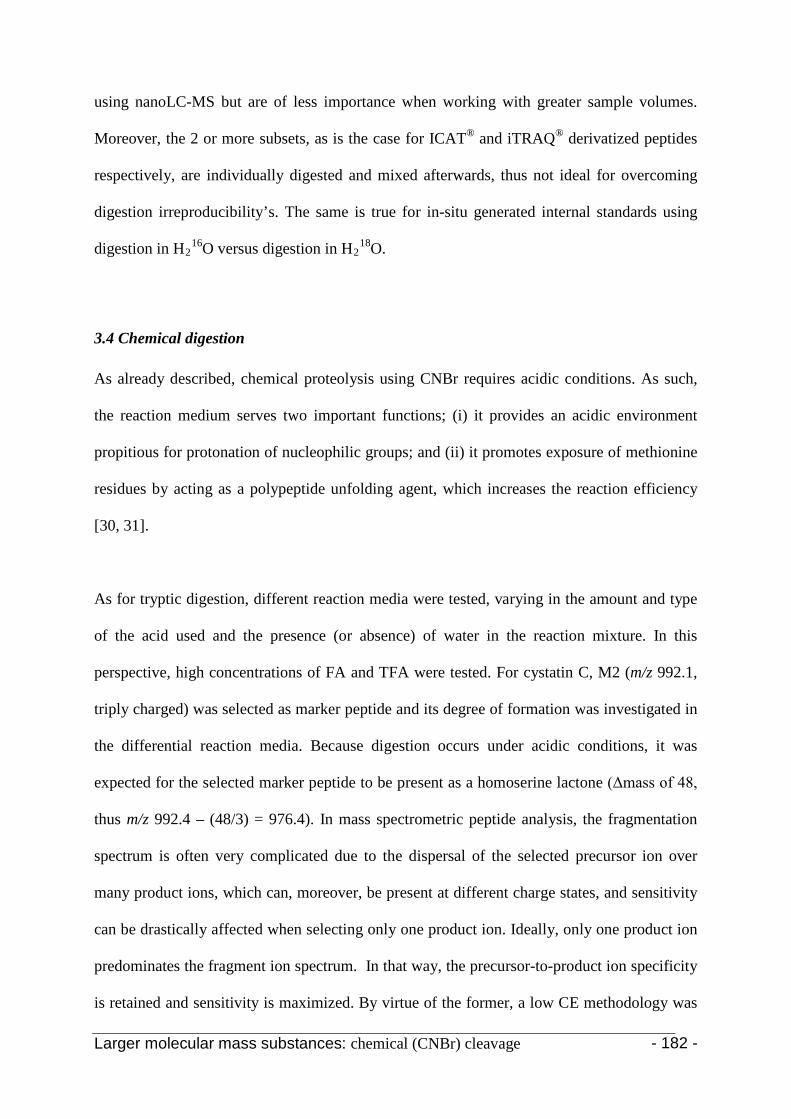
Larger molecular mass substances: chemical (CNBr) cleavage - 182 -
using nanoLC-MS but are of less importance when working with greater sample volumes.
Moreover, the 2 or more subsets, as is the case for ICAT® and iTRAQ® derivatized peptides
respectively, are individually digested and mixed afterwards, thus not ideal for overcoming
digestion irreproducibility’s. The same is true for in-situ generated internal standards using
digestion in H216O versus digestion in H2
18
O.
3.4 Chemical digestion
As already described, chemical proteolysis using CNBr requires acidic conditions. As such,
the reaction medium serves two important functions; (i) it provides an acidic environment
propitious for protonation of nucleophilic groups; and (ii) it promotes exposure of methionine
residues by acting as a polypeptide unfolding agent, which increases the reaction efficiency
[30, 31].
As for tryptic digestion, different reaction media were tested, varying in the amount and type
of the acid used and the presence (or absence) of water in the reaction mixture. In this
perspective, high concentrations of FA and TFA were tested. For cystatin C, M2 (m/z 992.1,
triply charged) was selected as marker peptide and its degree of formation was investigated in
the differential reaction media. Because digestion occurs under acidic conditions, it was
expected for the selected marker peptide to be present as a homoserine lactone (Δmass of 48,
thus m/z 992.4 – (48/3) = 976.4). In mass spectrometric peptide analysis, the fragmentation
spectrum is often very complicated due to the dispersal of the selected precursor ion over
many product ions, which can, moreover, be present at different charge states, and sensitivity
can be drastically affected when selecting only one product ion. Ideally, only one product ion
predominates the fragment ion spectrum. In that way, the precursor-to-product ion specificity
is retained and sensitivity is maximized. By virtue of the former, a low CE methodology was

Larger molecular mass substances: chemical (CNBr) cleavage - 183 -
optimized which resulted in fewer fragments formed with the precursor ion still substantially
present. As such, collision induced fragmentation was investigated using consecutive LC-
MS/(MS) runs at different collision energies (CE 25-50 in steps of 5). For every CE level, two
product ion scans of m/z 976.4 were obtained, a first over the mass range 250-1000 Da, and a
second from 1000 to 1750 Da. These experiments were performed on a Micromass Ultima Q3
at a scan time of 2s. Scanning mass spectrometers are slow in producing a full spectrum. That
is the reason why we have split the scan range in two, using two separate acquisitions. Figure
6 shows an example of a product ion spectrum for the cystatin C marker peptide with m/z
976.4.
The same methodology was applied when optimizing the MS(/MS) conditions for the chicken
egg white cystatin ISP. In this case, peptide M3 with m/z 1060.0 (triply charged) was selected.
This peptide is, however, not present as a homoserine lactone. Indeed, the homoserine lactone
is formed, during digestion, at the N-terminal side of the cleaved peptide-bond (from the
methionine amino-acid). With M3 being the outermost C-terminal peptide of chicken egg
white cystatin, the homoserine lactone is formed at the M2 peptide (see also Figure 1). All
the MRM transitions of the selected marker peptides of cystatin C and chicken egg white
cystatin are summarized in Table 3 for both tryptic and CNBr based proteolysis.
Figure 6:
MS/MS spectrum of the M2 CNBr fragment (m/z 976.4) of cystatin C
at CE 25 and 30. Based on these
spectra, the following MRM
transitions were used for quantitation: 976.4 976.4 (CE25);
976.4765.0 (CE30)
Larger molecular mass substances: chemical (CNBr) cleavage - 184 -
0
1000
2000
3000
4000
5000
1µg/mL 2.5µg/mL 5µg/mL 10µg/mL 25µg/mL 50µg/mL 100µg/mL
peak area ( x 1000)
mean CN IImean CN IVmean CN VI
Figure 7: mean (n=4) peak area (976.4976.4 (CE=25)/765.0 (CE=30) of the selected cystatin C marker
peptide after proteolysis in the following reaction media: H2O:CNBr 5M in AcN:TFA 20:20:60 (medium
CN II); H2O:CNBr 5M in AcN:TFA 15:15:70 (medium CN IV); H2
O:CNBr 5M in AcN:FA 15:15:70
(medium CN VI).
Figure 7 shows the peak areas obtained after MRM LC-MS/MS analysis (tic) of the selected,
CNBr generated cystatin C marker peptides at the following starting cystatin C
concentrations: 1.00 µg/mL; 2.50 µg/mL; 5.00 µg/mL; 10.0 µg/mL; 25.0 µg/mL; 50.0 µg/mL
and 100 µg/mL. The data are given for three of the tested chemical cleavage conditions: CN
II, IV, and VI. The results of the digestion in reaction media CN I, III, and V are not included
in Figure 7. No measurable signal was obtained using these reaction conditions. All of these
reaction conditions have no extra water added to the medium. The presence of water in the
reaction mixture clearly proved to be essential for digestion. This could be expected as the
reaction requires water to attack the iminolactone (see Figure 1). Kaiser and Metzka [16] too
investigated the necessity of water in the reaction medium, with special focus on the
methionine-serine and methionine-threonine sequences. They found, in accordance to our
findings, better cleavage yields under conditions where a higher water concentration is
Larger molecular mass substances: chemical (CNBr) cleavage - 185 -
present. In addition, contrary to earlier reports [30], they concluded that the acidic strength of
the reaction medium does not play a significant role in the CNBr cleavage efficiency.
From Figure 7 it is also clear that the digestion rate increases substantially with the use of FA
(reaction medium CN VI) instead of trifluoroacetic acid (reaction media CN II and IV). Until
now, there is no conclusive evidence why. Possibly, some minor sterical hindrance is possible
with the somewhat larger TFA, in comparison to FA. The fact that no denaturing of the
protein is applied prior to the digestion may (partly) cause/enhance this effect. These findings
are confirmed by Rodriguez et al. who also found that efficient CNBr cleavage is drastically
compromised when 70% TFA is used in the reaction [30]. As usual, the experiment was
performed in quadruplicate. These results are of particular interest, given the widespread
usage of 70% TFA as the medium of choice for CNBr cleavage of proteins [30-34]. Also
Samyn et al., who developed a CNBr based cleavage method for protein characterisation,
propose the use of TFA in the reaction medium [4, 22, 30]. This is, in contrast to our
experimental data. Moreover, earlier reports have already shown that CNBr cleavage tends to
be slower in 70% TFA compared to 70% FA [19], although, until now, no explanation has
been proposed to account for such behaviour. One may speculate, however, based also on the
findings by Rodriguez et al., that different rates of cleavage may originate from a larger
degree of exposure of methionine side chains in FA relative to TFA, as can be expected from
the superior solubilizing properties of the former [30].
Based on the abovementioned results, all further experiments were executed using a reaction
medium of H2
O:CNBr 5M in AcN:FA 15:15:70.

Larger molecular mass substances: chemical (CNBr) cleavage - 186 -
In a next experiment, the assumption that chemical cleavage, in opposite to in-solution
trypsinization, produces peptides in a more reproducible and quantitative way was evaluated.
As such, 6 different calibration curves were generated over 2 orders of magnitude (1.00
µg/mL until 100 µg/mL) using the same standard solutions as above. Chicken egg white
cystatin acted as internal standard and was proteolyzed simultaneously with the calibrators. In
doing so, 25 µL of standard solution, 25 µL of IS solution (50.0 µg/mL) and 500 µL of
digestion medium were mixed together by gentle shaking and allowed to react for overnight
digestion at 4°C as described earlier.
As can be seen in Figure 8, there is clearly a linear correlation (R2
of 0.9950) between the
calibrator concentration and the response, as cystatin C to IS peak area ratio. In contrast, the
trypsinization process proved to be inadequate, in terms of repeatability, to generate
calibration curves over the same concentration range (see chapter 3).
A direct comparison between both chemical and enzymatic proteolysis is not entirely
possible. Indeed, different peptides are produced by the different approaches and thus,
differences in responses are biased by e.g. differences in ionization efficiency. Nevertheless,
when we compare (data not shown) the individually, chemically proteolyzed peptides with the
same peptide concentrations, diluted out of trypsinized cystatin C stock solution (1000
µg/mL), thus not individually proteolyzed, one can notice that the absolute values of the peak
areas are significantly higher with chemically based proteolysis. This confirms that the CNBr
based protocols generates peptides in a more efficient way.
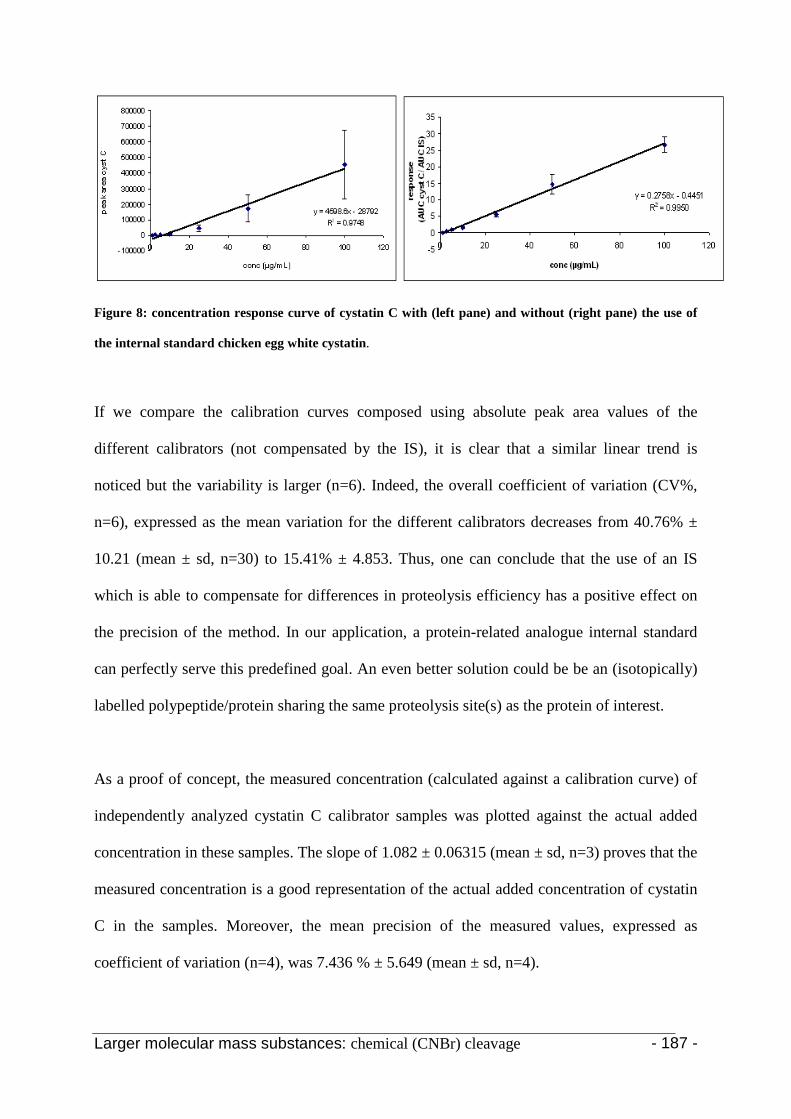
Larger molecular mass substances: chemical (CNBr) cleavage - 187 -
Figure 8: concentration response curve of cystatin C with (left pane) and without (right pane) the use of
the internal standard chicken egg white cystatin.
If we compare the calibration curves composed using absolute peak area values of the
different calibrators (not compensated by the IS), it is clear that a similar linear trend is
noticed but the variability is larger (n=6). Indeed, the overall coefficient of variation (CV%,
n=6), expressed as the mean variation for the different calibrators decreases from 40.76% ±
10.21 (mean ± sd, n=30) to 15.41% ± 4.853. Thus, one can conclude that the use of an IS
which is able to compensate for differences in proteolysis efficiency has a positive effect on
the precision of the method. In our application, a protein-related analogue internal standard
can perfectly serve this predefined goal. An even better solution could be be an (isotopically)
labelled polypeptide/protein sharing the same proteolysis site(s) as the protein of interest.
As a proof of concept, the measured concentration (calculated against a calibration curve) of
independently analyzed cystatin C calibrator samples was plotted against the actual added
concentration in these samples. The slope of 1.082 ± 0.06315 (mean ± sd, n=3) proves that the
measured concentration is a good representation of the actual added concentration of cystatin
C in the samples. Moreover, the mean precision of the measured values, expressed as
coefficient of variation (n=4), was 7.436 % ± 5.649 (mean ± sd, n=4).

Larger molecular mass substances: chemical (CNBr) cleavage - 188 -
y = 1.082xR2 = 0.998
0
20
40
60
80
100
120
140
0 20 40 60 80 100 120
added conc (µg/mL)
mea
sure
d co
nc (µ
g/m
L)
Figure 9: relationship between the added concentration of the calibrators and the measured concentration
(n=4). The slope of 1.0488 proves that the measured concentration is a good representation of the actual
concentration of cystatin C in the calibrators.
Thus, chemical proteolysis in combination with the use of a protein internal standard, able to
compensate for proteolysis efficiency variability, can be used to generate calibration curves
over at least two orders of magnitude, allowing the absolute quantitation of a given protein.
Chemical proteolysis in combination with a protein related internal standard (chicken egg
white cystatin) was tested for the LC-MS(/MS) based absolute quantitation of the test-
compound cystatin C by means of marker-peptide(s). In doing so, CNBr proved to be superior
to trypsinization in terms of reproducibility (overall reproducibility of 15.41%) and
effectiveness of the digestion. Indeed, calibration curves (R
4. Conclusion
2 = 0.9950) could be generated
over 2 orders of magnitude (1.00 to 100 µg/mL) using the chemically produced marker
peptide with m/z 976.4. With tryptic marker-peptides, similar calibration curves are hard to
Larger molecular mass substances: chemical (CNBr) cleavage - 189 -
obtain (see chapter 4), possibly caused by insufficient trypsin performance at lower protein
concentrations (<10 µg/mL).
In further experiments (see chapter 5), the optimized chemical digestion protocol will be
applied on plasma samples and the analytical challenge moves towards the selective
separation of cystatin C from the bulk of other plasma proteins.
This work was supported by grant B/06859-BOF06/24j/025 (Bijzonder OnderzoeksFonds of
the Ghent University) and grant G.0320.0 (FWO-Vlaanderen). The authors would also like to
thank Wim Goeteyn and Ir. Sofie Vandecasteele for their practical assistance during the
experiments.
5. Acknowledgements
1. S.
6. References
Pütz , J. Reinders , Y. Reinders , and A. Sickmann, Expert Rev. Proteomics, 2005 (3): p.381
2. C. Fenselau, 3.
J. Chromatogr. B, Analyt. Techno.l Biomed. Life Sci., 2007 (855(1)): p.14
4.
M.B. Strader, D.L. Tabb, W.J. Hervey, C. Pan, and G.B. Hurst, Anal. Chem., 2006 (78): p.125
5. B. Samyn, K. Sergeant, and J. Van Beeumen, Nat. Protoc., 2006 (1): p.317
6. Z.Y. Park, and D.H. Russel, Anal. Chem., 2000 (72): p.2667 M. Quadroni, and M. James, Electrophoresis, 1999 (20): p.664
7. W.K. Russel, Z.Y. Park, and D.H. Russel, Anal. Chem., 2001 (73): p.2682 8. S. Eksstrom, P. Onnerfjord, J. Nilsson, M. Bengtsson, T. Laurell, and G. Marko-Varga,
Anal. Chem., 2000 (72): p.286 9. A. Doucette, D. Craft, and L. Li, Anal. Chem., 2000 (72): p.3355 10. R. Riviere, M. Fleming, C. Elicone, P. Tempst, and J.J. Villafranca, Techniques in
Protein Chemistry II, 1991, Academic Press 11. K. Griebenow, and A.M. Kilbanov, J. Am. Chem. Soc., 1996 (118): p.11695 12. K.G. Welinder, Anal. Biochem., 1998 (174): p.54 13. L. Simon, K. Laszlo, A. Vertesi, K. Bagi, and B. Szajani, J. Mol. Catal. B, Enzymol, 1998
(4): p.41 14. L.K. Ramachandran, and B. Witkop, ibid., 1967 (11): p.283 15. K.F. Medzihradsky, Meth. Enzymol., 2005 (405): p.50
Larger molecular mass substances: chemical (CNBr) cleavage - 190 -
16. R. Kaiser, and L. Metzka, Anal. Biochem., 1999 (206): p.1 17. E. Gross, and B. Witkop, Biocemistry, 1967 (6): p.745 18. S.S. Huang, and J.S. Huang, MPSA Short Communications, 1991: p.450 19. W.A. Schroder, J.B. Shelton, and J.R. Shelton, Arch. Biochem; Biophys., 1969 (130):
p.551 20. K. Narita, and K. Titani, J. Biochem., 1968 (63): p.226 21. B.A. Cunningham, P.D. Gottlieb, W.H. Konigsberg, and G.M. Edelman, Biochemistry,
1968 (7): p.1983 22. B. Samyn, K. Sergeant, P. Castanheira, C. Faro, and J. Van Beeumen, Nat. Methods, 2005
(2): p.193 23. K. Hardeman, B. Samyn, J. Van Der Eycken, and J. Van Beeumen, Protein Sci., 1998 (7):
p.1593 24. R. Aebersold, and M. Mann, Nature, 2003 (422): p.198 25. C.M. Murphy, and C. Fenselau, Anal. Chem., 1995 (67): p.1644 26. K. Itakura, T. Hierose, R. Crea, A.D. Riggs, H.L. Heynacker, F. Bolivary, and H.W.
Boyer, Science, 1977 (198): p.1056 27. M. Bronstrup, Exp. Rev. Proteomics, 2004 (1(4)): p.503 28. R. Naxing Xy, L. Fan, M.J. Rieser, and T.A. El-Shourbagy, J. Pharm. Biomed. Anal.,
2007 (44): p.342 29. M.L. Storme, B.A. Sinnaeve, and J.F. Van Bocxlaer, J. Sep. Sci., 2005 (28(14)): p.175 30. J.C. Rodriguez, L. Wong, and P.A. Jennings, Protein Expr. Purif., 2002 (28): p.224 31. T.F. Spande, B. Witkop, Y. Degani, and A. Patchornik, Adv. Protein Chem., 1970 (24):
p.97 32. J.R. Morrison, N.H. Fidge, and B. Grego, Anal. Biochem., 1990 (186): p.145 33. D.R. Goodlett, F.B. Armstrong, R.J. Creech, and R.B. Vanbreemen, Anal. Biochem., 1990
(186): p.116 34. X.Y. Zhang, L. Dillen, K. Vanhoutte, W. Vandongen, E. Esmans, and M. Claeys, Anal.
Biochem., 1996 (68): p.3422

Larger molecular mass substances: application on plasma samples - 191 -
Chapter 5
The application of chemical proteolysis
on plasma samples
Larger molecular mass substances: application on plasma samples - 192 -
In this chapter, the development of a generic procedure to separate low and medium abundant proteins from the
higher abundant ones is described. In that respect, we opted to investigate the use of two successive molecular
mass cut-off ultrafiltration steps, assuming that such an approach is largely generic in nature. In the first
ultrafiltration step, the selective removal of albumin, immunoglobulins and other high abundant proteins, which
are all characterized by a molecular mass exceeding 45 kDa and account for more then 80% of the plasma
proteome, is pursued, while in the next ultrafiltration step, the intended goal is the removal of other low
molecular mass plasma components. We, however, had to conclude that such a procedure lacks sufficient
absolute recovery (7.037 ± 0.4065 (%, mean ± sd, n=4) for QC1; 3.203 ± 0.1582 (%, mean ± sd, n=4) for QC2)
and suffers from major matrix effect, both absolute (173.9 ± 0.39.09 (%, mean ± sd, n=3) for QC1 and 249.9 ±
26.07 (%, mean ± sd, n=3) for QC2) and relative (34.76% (n=4)). Nevertheless, for our test compound cystatin
C, calibration curves could be generated covering the entire concentration range of human cystatin C plasma
samples (0.50 to 20.0 µg/mL) with coefficients of determination all exceeding 0.9908.

Larger molecular mass substances: application on plasma samples - 193 -
As a last phase in the experimental development of a general LC-MS(/MS) quantitation
method for proteins by means of marker-peptides, the applicability of the optimized chemical
based proteolysis methodology in human plasma samples was tested. As before, cystatin C
acted as model protein. As such, the separation of cystatin C from, at least, other plasma
proteins is indispensable. To fulfil this goal, the application of specific anti-human cystatin C
antibodies theoretically is the best option in terms of effectiveness and reproducibility. Apart
from the inherent costs, especially when working with larger amounts of plasma and aiming
for a routine application, the use of specific antibodies was considered far from compatible
with our initial intention of generating a widely applicable, generic quantitation tool. Indeed,
specific antibodies are only capable of (selective) extraction of the intended protein, or in
view of aspects of cross-reactivity, closely related structures. The opposite direction in
thinking, namely to remove the most abundant plasma proteins looks more promising
especially taking into account that the 22 most abundant proteins are responsible for
approximately 99% of the bulk mass of the total plasma proteome [1, 2]. Such extraction
procedures could be used for a broad range of proteins and the effort of optimization can thus
be spread over many more (eventually clinically related) applications. Indeed, many studies
suggest that low and medium molecular weight proteins/peptides (respectively, LAP and
MAP) in plasma, such as plasma hormones or small, secreted proteins, are often correlated
with pathological conditions and present opportunities for potential clinical utility as
therapeutic intervention or as diagnostic or prognostic biomarkers [3-8]. The technical
challenge in the analysis of these LAP and MAP is that the plasma proteome covers a very
broad concentration range, of which some proteins are so predominantly present, like albumin
and the immunoglobulins, that they mask the detection of the other proteins [2, 9]. During the
last decade(s), removal of these high abundance proteins out of plasma samples has become,
1. Introduction

Larger molecular mass substances: application on plasma samples - 194 -
albeit mostly for qualitative or semi-quantitative purposes, the method of choice to provide
enhanced sensitivity and achieving a broader proteome coverage. Different special
methodologies are nowadays available to serve the goal of high abundance protein depletion
[1]. For instance, Pieper et al. in 2003 reported an approach that is capable of removing 10
high abundance proteins (HAP) in a single step, based on immuno-affinity chromatography
[10]. Most recently, commercial efforts too have intensified the search for adequate depletion
procedures [1, 10-16]. For instance, the Genway supermix® system removes the 14 most
abundant proteins and, in a next step, 77 of the medium abundant proteins out of human
plasma based on immuno-affinity. (See Figure 1, www.genwaybio.com). Likewise, Agilent’s’
Multiple Affinity Removal columns and spin Cartridges (respectively known as MARC and
MARS) are capable of the simultaneous removal of the 6 most abundant proteins. These
antibody based depletion systems have been demonstrated to be highly efficient in removing
the specifically targeted proteins but are, unfortunately, typically developed for proteomic
applications using much smaller plasma volumes and questions still arise with regard to their
reproducibility and selectivity in the framework of absolute quantitative work [11-16]. In
particular there are two primary questions: whether these systems are capable of removing
their target proteins in a reproducible way, and whether there is any loss of non-targeted
proteins along with the high abundance proteins through non-selective binding and/or
physiological relevant association reactions [1]. Moreover, if these systems are applied to
applications demanding higher plasma volumes, as intended in our general methodology,
several depletion (spin-) columns will be required for one single sample and hence, not only
their ease of handling will be compromized but also the inherent costs will become
prohibitively high for routine work.

Larger molecular mass substances: application on plasma samples - 195 -
Other depletion formats based on either ion-exchange, metal chelating or dye-ligands, also
exist and have been commercially developed but are not protein specific and therefore of
lower value [3].
Organic solvent extraction to remove HAP is another option. In doing so, it has been shown
that two volumes of AcN added to plasma samples, eventually in the presence of low
concentrations of ion-pairing agents like formic or TFA to produce a denser precipitate,
efficiently precipitate HAP, while smaller proteins and peptides stay in solution [3]. These
findings were investigated and the experimental results will be discussed further on.
However, the main perspective of the work described in this chapter was to evaluate an
alternative approach to separate the HAP from the LAP based on ultrafiltration devices with
molecular weight cut-off membranes. These membranes should allow cystatin C, with an
average calculated molecular weight of 13.347 kDa (www.expasy.org, P01034), to be
separated from at least the 6 most abundant proteins, of which the molecular weight ranges
Figure 1: composition of the human plasma proteome. The 14 most abundant proteins make
up for 96% of the proteome (www.genwaybio.com).
Larger molecular mass substances: application on plasma samples - 196 -
from minimally 46.737 (transferrin) to over 600.000 kDA for immunoglobulin complexes.
Special consideration was dedicated to the known “albumin sponge” effect. This is correlated
to the capability of albumin, and other HAP, to bind peptides and proteins and hence, when
these HAP are precipitated or removed, these bound peptides/proteins will equally be
removed [11].
2. Experimental
All chemical agents used were purchased at Sigma (Bornem, Belgium). High purity water was
produced using a Synergy 185 system (Millipore Corporation, Bedford, MA).
2.1 Cystatin C
Lyophilized powder, (Scipac, Sittingbourne, UK), reconstituted in 0.1M sodium acetate buffer
pH 4.5 to obtain a stock solution of 1000 µg/mL which was used to prepare working solutions
of 10.0 µg/mL, either in milliQ high purity water containing 50 x 103 µg/mL HSA (human
serum albumin) or plasma. Calibrators and QC samples were prepared by appropriate
dilution of the stock solution to the following concentrations: S1: 0.5 µg/mL (37.46
pmol/mL); QC1: 1.00 µg/mL (74.92 pmol/mL); S2: 2.00 µg/mL (149.8 pmol/mL); S3: 4.00
µg/mL (299.7 pmol/mL); QC2: 5.00 µg/mL (374.6 pmol/mL); S4: 6.00 µg/mL (449.5
pmol/mL); S5: 8.00 (599.4 pmol/mL µg/mL); S6: 10.0 µg/mL (749.2 pmol/mL); S7 20.0
µg/mL (equivalent to 14.98 x 10²
pmol/mL). Physiological plasma concentrations (humans)
are expected to lie within this concentration range.
Larger molecular mass substances: application on plasma samples - 197 -
2.2 Chicken egg white cystatin
Chicken egg white cystatin (lyophilized powder, Sigma, Bornem, Belgium) was likewise
dissolved in 0.1M sodium acetate buffer pH 4.5 to obtain a stock solution of 1000 µg/mL. To
each cystatin C sample, chicken egg white cystatin from this stock solution was spiked to a
final concentration of 10.0 µg/mL (equivalent to 760.6 pmol/mL). Marker peptides of chicken
egg white cystatin acted as internal standard. All marker peptides were generated according to
the following procedures.
2.3 Chemical proteolysis
All the standards were chemically proteolyzed using CNBr according to the procedure as
described in chapter 4. In doing so, cystatin C and chicken egg white cystatin were on-
membrane proteolyzed, overnight at 4°C through the addition of 500 µL of 5M CNBr in
AcN:H2
O:FA 15:15:70. For each experiment, the reaction medium was in-situ produced,
prior to use. After the overnight digestion process, the resulting peptide solution was dried
under a nitrogen stream (TurboVap LV evaporator, Zymark) and redissolved in 100 µL of
mobile phase (eluent A). Care should be taken when working with FA and CNBr, both being
very corrosive and toxic. These reagents should only be used under a fume hood, wearing
adequate protective garments.
2.4 Liquid chromatography
Liquid chromatography was performed on an YMC ODS-AQTM 1 x 150 mm, 3 µm (C18)
micro-column using a Agilent HP 1100 series HPLC (Palo Alto, CA, USA) system equipped
with a membrane degasser, binary gradient pump, column oven (20°C) and autosampler. The
system was set to pump at 40 µl/min in the micro-flow mode. The binary mobile phase

Larger molecular mass substances: application on plasma samples - 198 -
consisted of an eluent A, aqueous with 0.1 % FA, and an eluent B of 0.1 % FA in AcN. All
eluents were filtered over a 45 µm membrane filter prior to use. Gradient elution was applied,
after an initial equilibration phase of 5 min at 5 % B, from 5 to 60 % B over the next 26.5 min
followed by a steep ascent to 95 % B. The column is then kept at these conditions for 3.5 min.
Further on, the gradient returns to its initial conditions during 1 min and re-equilibration
occurs during 9 min. As so, total run time is 45 min with an initial pressure of approximately
70 bar. Injection volume was set to 20 µL.
2.5 Mass spectrometry
The HPLC system was directly interfaced with a Micromass Ultima Triple Quadrupole mass
spectrometer (Micromass-Waters, Manchester, UK), equipped with an orthogonal
electrospray source (Z-spray®
) operated in the positive ion mode. Nitrogen was used both as
nebulizer and drying gas and argon served as collision gas. A standard 65 µm capillary was
used in the electrospray interface. The ionization source was operated at 80°C and the
desolvation temperature was 120°C. All spectra were collected in the continuum mode. Time
dependent Multiple Reaction Monitoring (MRM) transitions were used for the quantitation of
the different marker peptides (cystatin C: m/z 976.4 765.0, collision energy (CE) 30;
chicken egg white cystatin: m/z 1060.0 1408.5, CE 30). (see also chapter 4).
2.6 Ultracentrifugation
2.6.1 Centrisart devices
Centrisart (Sartorius, Goettingen, Germany) is a ready to use unit for small volume (min. 500
µL and max. 2500 µL) centrifugal ultrafiltration to separate proteins from low molecular mass
substances in biological samples. It features a unique design: ultrafiltration in the opposite
Larger molecular mass substances: application on plasma samples - 199 -
direction to the centrifugal force, which makes it different to other, similar devices. This
approach is so effective in preventing premature blockage of the filter that even whole blood
samples, without prior dilution, can be deproteinized. The devices itself are made of
polystyrene and are available in the following formats: cellulose triacetate (CTA) membrane:
5, 10, and 20 kDA; or polyethersulfone (PES) membrane: 100 and 300 kDa. See also Figure
2.
2.6.2 Vivaspin 2 concentrators
Vivaspin concentrators are disposable ultrafiltration devices for the concentration of
biological samples. They all have a patented vertical membrane design which minimises
membrane fouling and protein leakage. A special feature of the devices is the choice of
directly pipetting the concentrate from the filter or alternatively by reverse spinning of the
concentrator. The maximum volume which can be ultrafiltrated is 2 mL. Next to the original
polyethersulfone membranes (3, 5, 10, 30, 50, 100, 300 and 1000 kDa) which are
recommended with most solutions, Vivaspin 2 devices are additionally offered with
Regenerated Cellulose (RC; 5, 10, and 20 kDa), Cellulose Triacetate (CTA; 5, 10, and 20
kDa) and Hydrosart (HY; 2, 5, 10, and 30 kDa) membranes. CTA is particularly
recommended when high recovery of the filtrate solution is of primary importance.
Regenerated cellulose is sometimes more suitable for concentrating very dilute solutions and
large hydrophobic proteins. HY is a stabilised cellulose based membrane that has been
optimised for the biotechnological industry. The HY membrane is a stable polymer that
features a broad pH range. HY is also extremely hydrophilic, making it non-protein binding,
and has an extremely high flux. HY is available in 5kDa, 10kDa, and 30kDa molecular mass
cut-offs. Which membrane is optimal for a given application should experimentally be
determined.
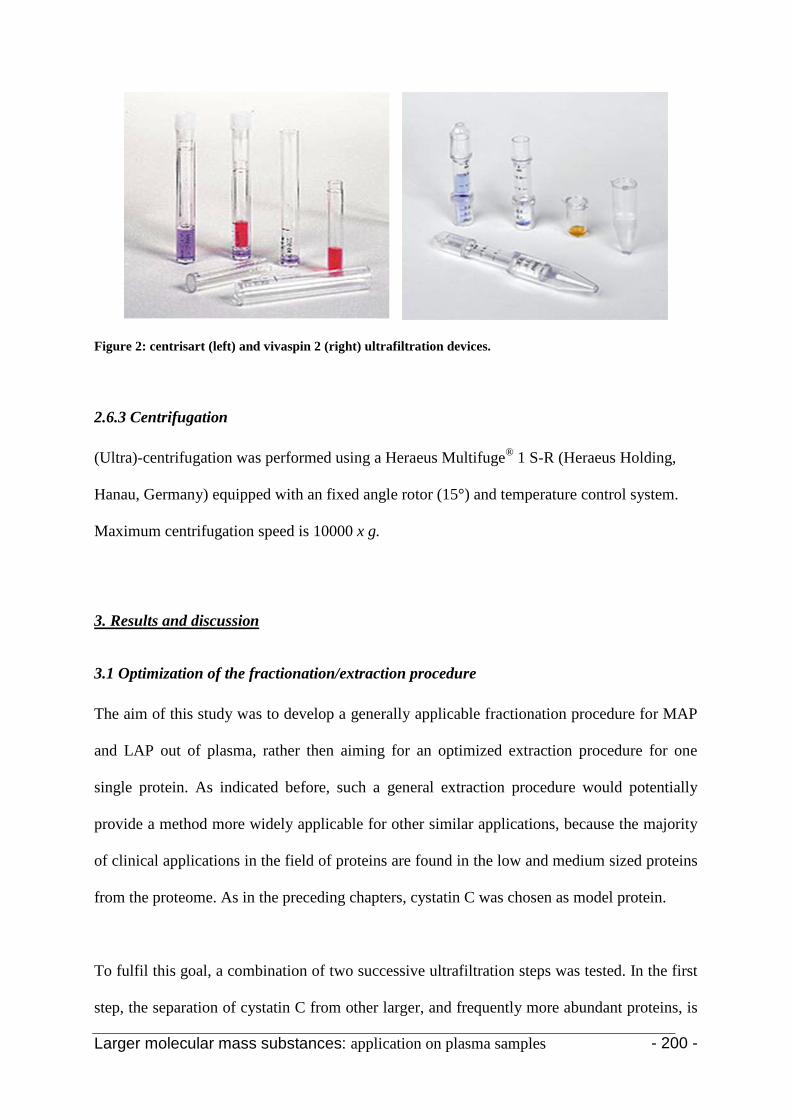
Larger molecular mass substances: application on plasma samples - 200 -
Figure 2: centrisart (left) and vivaspin 2 (right) ultrafiltration devices.
2.6.3 Centrifugation
(Ultra)-centrifugation was performed using a Heraeus Multifuge®
1 S-R (Heraeus Holding,
Hanau, Germany) equipped with an fixed angle rotor (15°) and temperature control system.
Maximum centrifugation speed is 10000 x g.
3.1 Optimization of the fractionation/extraction procedure
3. Results and discussion
The aim of this study was to develop a generally applicable fractionation procedure for MAP
and LAP out of plasma, rather then aiming for an optimized extraction procedure for one
single protein. As indicated before, such a general extraction procedure would potentially
provide a method more widely applicable for other similar applications, because the majority
of clinical applications in the field of proteins are found in the low and medium sized proteins
from the proteome. As in the preceding chapters, cystatin C was chosen as model protein.
To fulfil this goal, a combination of two successive ultrafiltration steps was tested. In the first
step, the separation of cystatin C from other larger, and frequently more abundant proteins, is
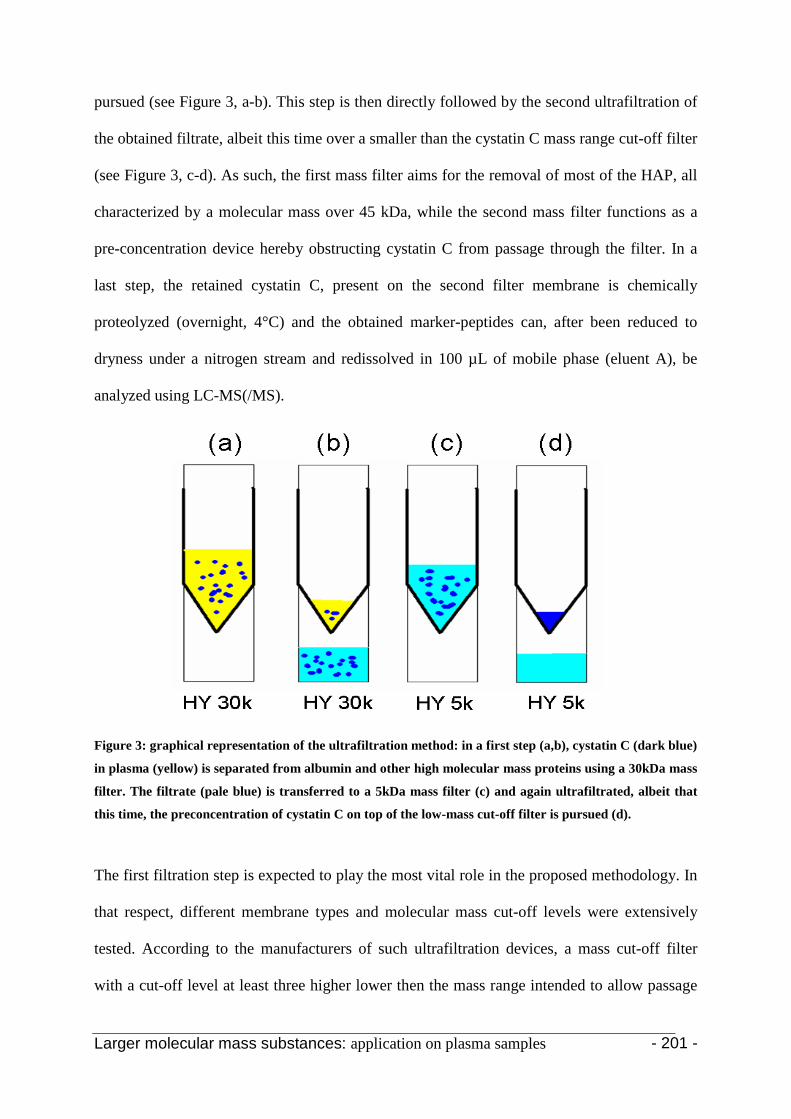
Larger molecular mass substances: application on plasma samples - 201 -
pursued (see Figure 3, a-b). This step is then directly followed by the second ultrafiltration of
the obtained filtrate, albeit this time over a smaller than the cystatin C mass range cut-off filter
(see Figure 3, c-d). As such, the first mass filter aims for the removal of most of the HAP, all
characterized by a molecular mass over 45 kDa, while the second mass filter functions as a
pre-concentration device hereby obstructing cystatin C from passage through the filter. In a
last step, the retained cystatin C, present on the second filter membrane is chemically
proteolyzed (overnight, 4°C) and the obtained marker-peptides can, after been reduced to
dryness under a nitrogen stream and redissolved in 100 µL of mobile phase (eluent A), be
analyzed using LC-MS(/MS).
Figure 3: graphical representation of the ultrafiltration method: in a first step (a,b), cystatin C (dark blue)
in plasma (yellow) is separated from albumin and other high molecular mass proteins using a 30kDa mass
filter. The filtrate (pale blue) is transferred to a 5kDa mass filter (c) and again ultrafiltrated, albeit that
this time, the preconcentration of cystatin C on top of the low-mass cut-off filter is pursued (d).
The first filtration step is expected to play the most vital role in the proposed methodology. In
that respect, different membrane types and molecular mass cut-off levels were extensively
tested. According to the manufacturers of such ultrafiltration devices, a mass cut-off filter
with a cut-off level at least three higher lower then the mass range intended to allow passage
Larger molecular mass substances: application on plasma samples - 202 -
through the membrane should be applied. Ideally, in the case of cystatin C, a mass cut-off
filter of approximately 45 kDa should be used. Unfortunately, the latter is not commercially
available. Therefore, the following types of filters were selected in a first set of experiments:
Vivaspin PES 50k and HY 30k, Centrisart CTA 20k and PES 100k. At first, the centrifugation
speed (2500, 5000, 7500, and 10000 (maximum) x g) was optimized based on completeness
of the centrifugation step within a timeframe intended to be shorter then 60 min. As a result,
45 min at 7500 x g (25°C) tuned out to be most suitable for further experiments. Using 10000
x g, an even shorter centrifugation time could be used. However, at such centrifugation
speeds, there is a larger risk of albumin, and also other HAP, breakthrough. This was first
shown by Georgiou et al. who reported that ultrafiltration failed to remove albumin at a
centrifugation speed exceeding 10000 x g. Tirumalai et al. postulated that at such high
centrifugal forces, the integrity of the membrane is likely to be compromized and hence, high
molecular mass components can pass through. As in our application, experiments were
performed on non-diluted plasma samples [5, 17].
For each experiment (n=4), 500 µL of a 10 µg/mL aqueous cystatin C solution was filtered
and 50 µL of the filtrate was chemically proteolyzed (overnight, 4°C) by the addition of 500
µL of CNBr solution according to the optimized procedure described in chapter 4. The
obtained marker-peptides were then dried down under a stream of nitrogen, redissolved in 100
µL of mobile phase (eluent A) and analyzed using LC-MS(/MS) as described before. The
Vivaspin 30k filter produced the best result in terms of efficacy of the filtration step (recovery
of cystatin C in the filtrate) and was chosen for in further experiments. Filters equipped with a
PES membrane, despite the use of a higher molecular mass cut-off level, resulted in an 8.8
times lowered cystatin C passage though the membrane (see also Figure 4). Probably, this is
caused by interactions between cystatin C and the membrane. Based on these results, a similar

Larger molecular mass substances: application on plasma samples - 203 -
Vivaspin 2 (HY 5k) was chosen as second mass filter. However, when the same amount of
cystatin C (500 µL of an aqueous 10.0 µg/mL solution) was put on this filter, no cystatin C
could be measured in the filtrate after ultrafiltration (45 min at 7500 x g). This indicates that
the majority of the cystatin C is withheld on top of the membrane.
Figure 4: cystatin C peak area of 50µL filtrate after ultracentrifugation of cystatin C (500µL, 10µg/mL)
standard solution through different membrane types.
Following, the two successive ultrafiltration steps were combined and plasma samples, spiked
with cystatin C (10 µg/mL), were analyzed. One subset was analyzed as such, while another
subset was first diluted with AcN to a final proportion of 20% (v/v, 500µL plasma + 125µL
AcN, followed by 10 min of gentle shaking using a rotatory mixer). Under these partly
denaturing conditions, it is known that protein-protein interactions between the lower
molecular mass proteins (e.g. cystatin C) and larger molecular mass carrier proteins like
albumin and IgG are effectively disrupted. If not destroyed prior to the analysis, these protein
complexes would be withdrawn during the ultrafiltration process and hence, the actual protein
concentration would be undervalued. As so, the experiments showed that the addition of 20%
of AcN to the plasma samples prior to the ultrafiltration procedure gave an 2.4 times increase
in the cystatin C recovery.
Larger molecular mass substances: application on plasma samples - 204 -
Caused by the higher density of plasma compared to water, the ultrafiltration time had to be
prolonged from 45 min (pure aqueous standards) to 60 min. Thus, in a first step, the samples
are ultrafiltrated (Vivaspin 2 HY 30k) for 60 min at 7500 x g (25°C) and the obtained filtrate
is transferred to the second mass filter (Vivaspin 2 HY 5k), and again ultrafiltrated for 45 min
at 7500 x g (25°C). The newly obtained filtrate is thrown away and 500 µL of CNBr solution
is added to the mass cut-off filter. Then, after overnight digestion (4°C), the mass filter is
backwise centrifuged at 2000 x g for 5 min. and the recovered peptide solution is dried under
a stream of nitrogen (TurboVap LV evaporator, Zymark) and redissolved in 100 µL of mobile
phase (eluent A). 20 µL is injected into the LC system. Again, these experiments, as the ones
described furtheron, were performed in quadruplicate.
Additionally, the use of organic solvents was tested as an alternative fractionation/extraction
procedure. This based on the capability of organic solvents to precipitate large molecular
mass proteins while smaller molecular mass proteins (up to 20kDa) stay in solutions.
Experiments in the past already showed that this can most effectively be performed using two
volumes of AcN for one volume of plasma [3, 19]. By doing so, the plasma:AcN mixtures
were each time cooled down using ice (10 min), followed by a centrifugation step (2000 x g,
4°C, 5min). The supernatant, containing the low and medium mass proteome was then
analyzed, after drying down under a stream of nitrogen, using the same analysis and
quantitation procedure as the ultrafiltration samples (chemical based proteolysis followed by
LC-MS(/MS) of the produced marker peptides). Unfortunately, using this procedure no
distinct separation boundary is obtained between the precipitate, composed out of the HAP,
and the L/MAP filtrate. This makes the procedure difficult to perform and prone to error of
irreproducibility’s. TFA, as additional acid protein precipitant, was tested to refine the
procedure so that a more compact precipitate is formed and the two phases can be more easily
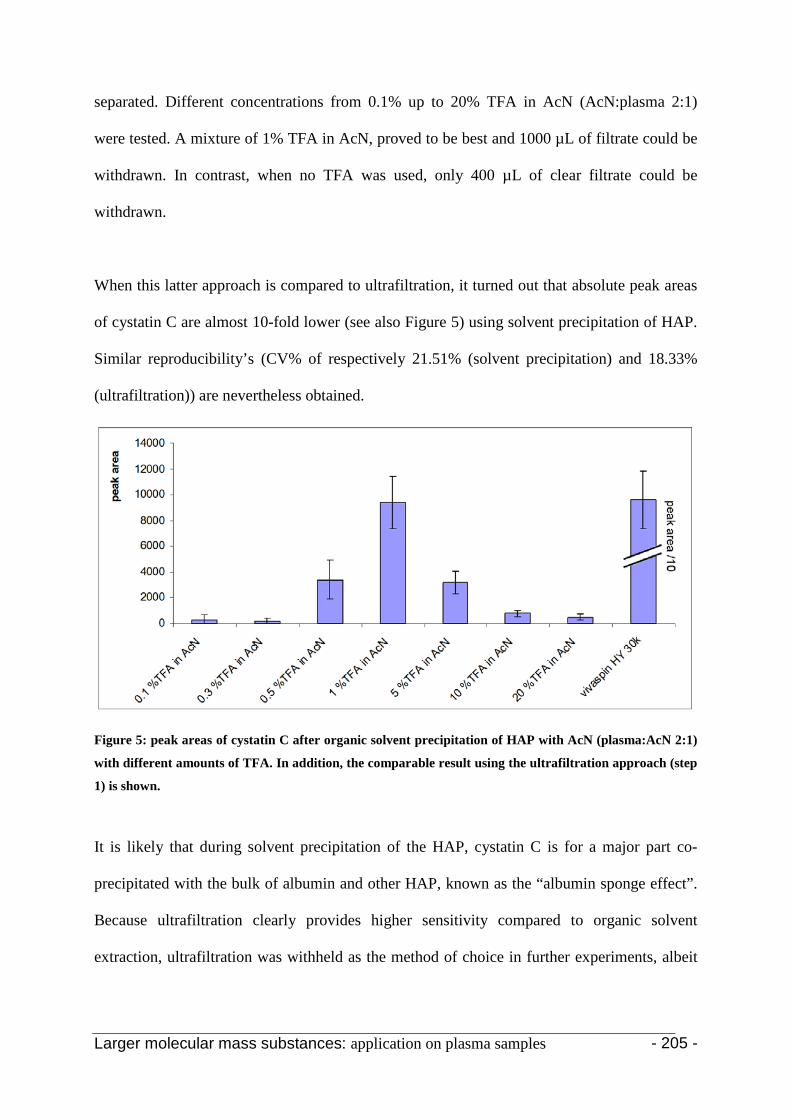
Larger molecular mass substances: application on plasma samples - 205 -
separated. Different concentrations from 0.1% up to 20% TFA in AcN (AcN:plasma 2:1)
were tested. A mixture of 1% TFA in AcN, proved to be best and 1000 µL of filtrate could be
withdrawn. In contrast, when no TFA was used, only 400 µL of clear filtrate could be
withdrawn.
When this latter approach is compared to ultrafiltration, it turned out that absolute peak areas
of cystatin C are almost 10-fold lower (see also Figure 5) using solvent precipitation of HAP.
Similar reproducibility’s (CV% of respectively 21.51% (solvent precipitation) and 18.33%
(ultrafiltration)) are nevertheless obtained.
Figure 5: peak areas of cystatin C after organic solvent precipitation of HAP with AcN (plasma:AcN 2:1)
with different amounts of TFA. In addition, the comparable result using the ultrafiltration approach (step
1) is shown.
It is likely that during solvent precipitation of the HAP, cystatin C is for a major part co-
precipitated with the bulk of albumin and other HAP, known as the “albumin sponge effect”.
Because ultrafiltration clearly provides higher sensitivity compared to organic solvent
extraction, ultrafiltration was withheld as the method of choice in further experiments, albeit
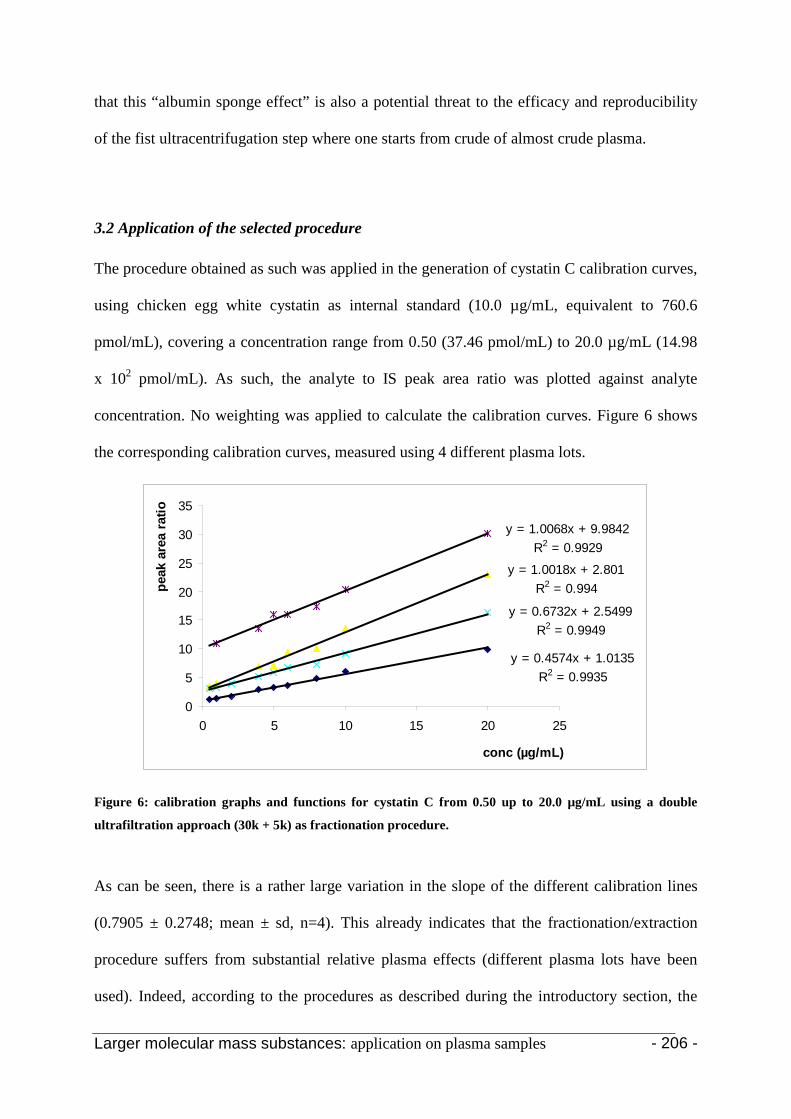
Larger molecular mass substances: application on plasma samples - 206 -
that this “albumin sponge effect” is also a potential threat to the efficacy and reproducibility
of the fist ultracentrifugation step where one starts from crude of almost crude plasma.
3.2 Application of the selected procedure
The procedure obtained as such was applied in the generation of cystatin C calibration curves,
using chicken egg white cystatin as internal standard (10.0 µg/mL, equivalent to 760.6
pmol/mL), covering a concentration range from 0.50 (37.46 pmol/mL) to 20.0 µg/mL (14.98
x 102
y = 1.0068x + 9.9842R2 = 0.9929
y = 1.0018x + 2.801R2 = 0.994
y = 0.6732x + 2.5499R2 = 0.9949
y = 0.4574x + 1.0135R2 = 0.9935
0
5
10
15
20
25
30
35
0 5 10 15 20 25
conc (µg/mL)
peak
are
a ra
tio
pmol/mL). As such, the analyte to IS peak area ratio was plotted against analyte
concentration. No weighting was applied to calculate the calibration curves. Figure 6 shows
the corresponding calibration curves, measured using 4 different plasma lots.
Figure 6: calibration graphs and functions for cystatin C from 0.50 up to 20.0 µg/mL using a double
ultrafiltration approach (30k + 5k) as fractionation procedure.
As can be seen, there is a rather large variation in the slope of the different calibration lines
(0.7905 ± 0.2748; mean ± sd, n=4). This already indicates that the fractionation/extraction
procedure suffers from substantial relative plasma effects (different plasma lots have been
used). Indeed, according to the procedures as described during the introductory section, the

Larger molecular mass substances: application on plasma samples - 207 -
difference in slope of calibration curves made in different plasma lots can be used as an
measure of relative matrix effect while the differences in intercept (4.011 ± 3.860; mean ± sd,
n=4) can (partly) be explained by different endogenous cystatin C concentrations in the
different plasma lots. Absolute plasma effect, absolute recovery and process efficiency were
determined according to the procedure described by Matuszewski et al. [20] at the two QC
concentration levels (QC1: 1.00 µg/mL; QC2
: 5.00 µg/mL) and are summarized in Table 1.
In doing so, absolute matrix effect was assessed by spiking a quantity of cystatin C into a
“blank” plasma extract (containing endogenous cystatin C) and comparing the peak areas to
the peak areas obtained for the same quantity spiked into solvent (eluent A, no endogenous
cystatin C); absolute recovery as the peak area ratio of spiked plasma extracts to blank plasma
extracts spiked to the same concentration; and process efficiency, describing both absolute
plasma effect and absolute recovery, was calculated as the peak area ratio of spiked plasma
extracts to the same quantity spiked into pure eluent. The endogenous cystatin C present in
the plasma extracts is subtracted from the cystatin C concentration measured in these spiked
plasma extracts and set to the average cystatin C peak area present in 20 “blank” plasma
samples (not spiked with cystatin C). This extraction evaluation study was repeated for four
different plasma lots, originating from different individuals, and analyzed in triplicate.
concentration absolute matrix effect absolute recovery process efficiency µg/mL (mean% ± sd; n=3) (mean% ± sd; n=3) (mean% ± sd; n=3)
QC1 1.00 173.9 ± 39.09 7.037 ± 0.4065 11.63 ± 0.8815 QC2 5.00 247.9 ± 26.07 3.203 ± 0.1582 7.588 ± 0.5603
Table1: absolute matrix effect, absolute recovery and process efficiency at the QC concentration levels of
the double ultrafiltration method.
As shown, also the absolute plasma effect is unacceptable high. However, when we redo the
same calculations taking into account the IS, spiked to the different plasma samples
simultaneously with cystatin C, and thus make use of the cystatin C to chicken egg white

Larger molecular mass substances: application on plasma samples - 208 -
cystatin peak area ratios instead of the cystatin C peak areas, the absolute matrix effect
decreases to 97.67 ± 3.951 (mean ± sd, n=3) for QC1 and 129.0 ± 5.219 or QC2
. Thus, the IS
is susceptible to the same ME and is as such largely capable of compensating for. This, in
addition to the capability to outweigh digestion differences as already described in chapter 4.
Hence, the addition of an IS is absolutely necessary when working with marker-peptides as a
measure of protein concentration. However, relative matrix effects, as shown by the
differences in slope of the different calibration curves, originating from inter-individual
matrix differences can not be compensated for when working with a suboptimal extraction
procedure.
Both absolute recovery and process efficiency are low and do absolutely not meet the
requirements as postulated by the US FDA bio-analytical method validation guidance
protocol. Also accuracy, as percentage error 100+[concentration(measured-
added)/added]x100; and selectivity were determined based upon these requirements. In doing
so, mean inaccuracy was 6.994% ± 3.396 (mean ± sd, n=30). Total precision was below
14.68%. These data are, despite the presence of severe absolute and relative plasma effects,
within the generally required validation criteria limits, being maximum inaccuracy of 15%
(20% at LLOQ) and precision below 15% (20% at LLOQ). The LLOQ was established at the
lowest calibrator concentration level, being 0.50 µg/mL. Figure 7 shows typical
chromatograms for cystatin C at the LLOQ, QC1 and QC2 concentration level. At the LLOQ
concentration, the signal to noise ratio was still 23.87 and the deviation from nominal
concentration was 24.64%. Mean absolute deviation, at every concentration level, was 7.349
± 6.314 (mean ± sd, n=30). Reproducibility of retention times was also monitored. Mean
retention time was 14.61 ± 0.1078 (min, mean ± sd; n=36) for cystatin C and 15.27 ± 0.1166
(min, mean ± sd; n=36) for the IS chicken egg white cystatin.

Larger molecular mass substances: application on plasma samples - 209 -
On using MRM as a detection technique, selectivity is an almost inherent aspect.
Nevertheless, considering the rudimentary nature of our extraction, the selectivity of the
MRM transition (m/z 976.4 765.0) used was also investigated. A blank trace can not be
obtained as cystatin C is an endogenous compound. Consequently, selectivity was monitored
by measuring the peak area ratio of endogenous cystatin C (blank plasma extracts) to chicken
egg white cystatin (added to the same concentration as used in the calibrators, 10.0 µg/mL)
for samples of different patient origin measured in between the calibration functions. For
every blank extract measured, the peak area ratio was below the intercept value of the
calibration function.
Using this general fractionation/extraction method, calibration curves for cystatin C could be
generated over a concentration range from 0.50 to 20.0 µg/mL with coefficients of
determination all exceeding 0.9908. Some preliminary validation data in terms of accuracy,
precision and selectivity are borderline acceptable. The results obtained do however also show
4. Conclusion
Figure 7: typical chromatogram at the
LLOQ, QC1 and QC2 concentration levels

Larger molecular mass substances: application on plasma samples - 210 -
that the approach lacks robustness. Certainly, the figures of merit regarding extraction
recovery and, in a way also matrix effect indicate a real chance of unacceptable variability in
the method. As a bio-analyst, and relating to the solidity of the results one expects in the field
of small molecule bio-analysis, one can not but conclude that this approach lacks analytical
reliability.
Taking into account all of the findings discussed above, the proposed ultrafiltration method
can in fact not meet overall with the validation criteria as postulated by the US FDA.
Problems especially arise with respect to matrix effect, both absolute and relative. Indeed, as
shown, absolute and relative matrix effect, estimated by the difference in slope between the
different calibration functions (0.7905 ± 0.2748; mean ± sd, n=4), are too high. Also the
absolute recovery of cystatin C is too low. The use of a protein analogue as internal standard
can partly overcome these shortcomings and its use is absolutely inescabale, as would also be
with the use of antibodies.
Based on the experimental observations and the results we have obtained, we have to
conclude that for absolute protein quantitation, sound results can only be achieved by the use
of a much more specific extraction procedure, really tailored to the protein under
investigation. In that respect, turning to specific antibodies for extraction purposes will
probably be the approach to follow when the idea of a generic method has to be abandoned
anyway. Thus, a general extraction procedure widely applicable to a broad range of plasma
proteins using ultrafiltration only is not feasible.
Larger molecular mass substances: application on plasma samples - 211 -
1. T. Liu, W.J. Qian, H.M. Mottaz, M.A. Gritsenko, A.D. Norbeck, R.J. Moore, S.O. Purvine, D.G. Camp, and R.D. Smith, Mol. Cell. Proteomics, 2006 (5(11)): p.2167
5. References
2. N.L. Anderson, and N.G. Anderson, Mol. Cell. Protemics, 2002 (1): p.845 3. J.L. Luque-Garcia, and T.A. Neubert, J. Chromatogr. A, 2007 (1153 (1-2)): p.259 4. E.F. Petricoin, A.M. Ardakani, B.A. Hitt, P.J. Levine, V.A. Fusaro, S.M. Steinberg, G.B.
Mills, C. Simone, D.A. Fishman, E.C. Kohn, and L.A. Liotta, Lancet, 2002 (359): p.572 5. R.S. Tirumalai, K.C. Chan, D.A. Prieto, H.J. Isaq, T.P. Conrads, and T.D. Veenstra, Mol.
Cell. Proteomics, 2003 (2): p.1096 6. Z. Zhang, R.C. Bast, Y. Yu, J. li, L.J. Sokol, A.J. Rai, J.M. Rosenzweig, B. Cameron,
Y.Y. Wang, X.Y. Meng, A. Berchuck, C. Van Haaften-Day, N.F. Hacker, H.W. De Bruyn, A.G. van der Zee, I.J. Jacobs, E.T. Fung, and D.W. Chan, Cancer Res., 2004 (64): p.5882
7. S. Mian, S. Ugurel, E. Parkinson, I. Schlenzka, I. Dryden, L. Lancashire, G. Ball, C. Creaser, R. Rees, and D. Schadendorf, J. Clin. Oncol., 2005 (23): p.5088
8. R. Terracciano, M. Gaspari, F. Testa, L. Pasque, P. Tagliaferri, M.M. Cheng, A.J. Nijdam, E.F. Petricoin, L.A. Liotta, G. Cuda, M. Ferrari, and S. Venuta, Proteomics, 2006 (6): p.3243
9. S. Qin, A.S. Ferdinand, J.P. Richie, M.P. O’Leary, S.C. Mok, and B.C. Liu, Proteomics, 2005 (5): p.3183
10. R. Pieper, Q. Su, C.L. Gatlin, S.T. Huang, NL.L. Anderson, and S. Steiner, Proteomics, 2003 (3): p.422
11. N. Zalotarjova, J. Martosella, G. Nicol, J. Bailey, B.E. Boyes, and W.C. Barett, Proteomics, 2005 (5): p.3304
12. L. Huang, G. Harvie, J.S. Feitelson, K. Grammatikoff, D.A. Herald, D.L. Allen, R. Amunngama, R.A. Hagler, M.R. Pisano, W.W. Zhang, and X. Fang, Proteomics, 2005 (5): p.3314
13. B.A. Chromy, A.D. Gonzales, J. Perkins, M.W. Choi, M.H. Corzett, B.C. Chang, C.H. Corzett, and S.L. McCutchen-Maloney, J. Proteome Res., 2004 (3): p.1120
14. L.A. Echan, H.Y. Tang, N. Ali-Khan, K. Lee, and D.W. Speicher, Proteomics, 2005 (5): p.3292
15. A.K. Yocum, K. Yu, T. Oe, and I.A. Blair, J. Proteome Res., 2005 (4): p.1722 16. J. Brand, T. Haslberger, W. Zolg, G. Pestlin, and S. Palme, Proteomics, 2006 (6): p.3236 17. H.M. Georgiou, G.E. Rice, and M.S. Baker, Proteomics, 2001 (1): p.1120 18. H. L. Huang, T. Stasyk, S. Morandell, M. Mogg.
19. O. Chertov, A. Biragyn, L.W. Kwak, J.T. Simpson, T. Boronina, V.M. Hoang, D.A. Prieto, T.P. Conrads, T.D. Veenstra and R.J. Fisher, Proteomics, 2004 (4): p.1195
, M. Schreiber, I. Feuerstein, C. W. Huck, G. Stecher, G. K. Bonn, L. A. Huber, Electrophoresis, 2005 (26(14)): p.2843
20. B.K. Matuszewski, M.L. Constanzer, and C.M. Chavez-Eng, Anal. Chem., 1998 (70): p.882

Larger molecular mass substances: application on plasma samples
- 212 -
Conclusion and future perspectives - 213 -
Conclusion and Future Perspectives
Conclusion and future perspectives - 214 -
In this work, the use of liquid chromatography coupled to mass spectrometry was used for the
quantitation of both low and high molecular mass compounds. Especially for low molecular
mass compounds, LC-MS(/MS) has over the last decades evolved from being a curiosity to
the main analytical technique in bio-analytical quantitative work, especially when compounds
need to be measured in complex matrices like e.g. plasma, based on the high levels of
specificity and sensitivity characteristic for modern mass spectrometers. As such, there are
many well described criteria and quality assurance guidelines of which the “Guidance for
Industry: Bio-analytical Method Validation” as postulated by the US FDA was used
throughout the work.
No matter how established LC-MS(/MS) based bio-analysis of small molecules has become, a
continuation of the principles and guidelines into the field of quantitative protein analysis
seems to lag behind. For larger molecular mass compounds like proteins, the main application
field of mass spectrometry is still within the qualitative proteomics area. One of the goals of
this work was exactly to start from absolute quantitative bio-analysis for small
pharmaceuticals and based on this experience move on, with adaptations where necessary,
from the principles used for small molecules to proteins. We hypothesized that this could only
be achieved by bringing the large protein molecules closer to the area of small molecules, i.e.
by “reducing” them to peptides.
Our work consequently commenced with the development and validation of two quantitative
methods in the field of small molecules, pyrimethamine and sulfamethoxypyrazine on the one
hand and glycopyrrolate on the other hand, both with their specific analytical difficulties. As
such, for the antimalarials pyrimethamine and sulfamethoxypyrazine, the main challenge was
to develop a procedure which allows the simultaneous quantitation of both compounds in one
Conclusion and future perspectives - 215 -
single run, preferably in a relatively short period of time, thus allowing high sample
throughput. This goal was not only hampered by the highly different chemical nature of both
compounds but especially by the major plasma concentration differences between both
analytes. With regard to the above, a LC-MS(/MS) method was developed with a turn-over
time of only 12.5 min, preceded by a relatively simple and fast liquid-liquid extraction
procedure developed in such a way that an optimal extraction efficiency for pyrimethamine,
having the lowest plasma concentration, was obtained. The latter yielded in an absolute
recovery of 69.43% ± 18.55 (mean ± sd, n=6) for pyrimethamine and only 0.4102% ± 0.1247
(mean ± sd, n+6) for sulfamethoxypyrazine. At first, that sulfamethoxypyrazine extraction
efficiency seems unacceptable low but, as a consequence, the high
sulfamethoxypyrazine/pyrimethamine plasma concentration ratio was lowered drastically in
the final extract. Both could now be measured simultaneously using the same MS(/MS)
parameters which would otherwise be impossible based on the limited linear dynamic range
of LC-MS. As such, for both compounds, calibration curves were achieved ranging from
0.00101 to 0.807 µg/mL for pyrimethamine and from 0.271 to 216 µg/mL for
sulfamethoxypyrazine. The method as such entirely met the validation criteria as suggested by
the FDA and was applied in a time-course study of patients treated with Co-arinate®
, a new
curative antimalaria-medicine based on the synergistic effect of both.
Also for the anti-cholinergic agent glycopyrrolate (Robinul®), a quantitative LC-MS(/MS)
tool was developed using mepenzolate as internal standard. For this component, the
permanent positive nature of glycopyrrolate, being a quaternary ammonium compound,
brought about substantial analytical difficulties. Indeed, the permanent cationic character of
the drug makes it highly water soluble and, hence, both extraction efficiency (aqueous nature
of plasma) and chromatographic behaviour using reversed phased LC are compromized. To

Conclusion and future perspectives - 216 -
overcome these drawbacks, the use of a counter-ion, HFBA, was introduced in the procedure
and used both during the extraction and the chromatographic separation step to neutralize the
positive charge. The as such developed isocratic LC-MS(/MS) method takes only 10 min. and
allows the quantitation of glycopyrrolate from 0.101 ng/mL up to 101 ng/mL. Indeed, the low
concentrations to be measured in plasma added another dimension to the task. Our method
coped with all these difficulties and could successfully be validated. All mandatory validation
results were in concordance with the internationally accepted performance criteria and the
method was implemented in a preliminary pharmacokinetic study of anaesthetized patients
treated with Robinul®
as anti-cholinergic agent.
In contrast to the relative ease in which LC-MS(/MS) can be applied to small molecular mass
compound’s quantitation methods, the use of LC-MS(/MS) for the absolute quantitation of
larger bio-molecules such as proteins is still not straightforward and was the next main
challenge of this work. To that end, a generic approach was aimed for, using marker-peptides.
In this so-called “bottom-up” approach, a given protein is first cleaved into peptides which are
then chromatographically separated and quantified using LC-MS. In a way, the often
problematic mass spectrometric quantitation of a protein is demoted into the more
straightforward analysis of a small peptide subset. One can even say that the analysis of a
large molecular mass compound is reduced to the one of “small molecular mass compounds”,
peptides, in which mass spectrometry has already proven its benefits. In this perspective, a
proof-of-concept study was performed using cystatin C as model protein and chicken egg
white cystatin, another member of the cystatin family with almost 50% amino-acids sequence
similarity, as internal standard. Cystatin C was chosen for a number of reasons, including its
size, lack of glycosylation and, eventually, its potential clinical significance.
Conclusion and future perspectives - 217 -
It soon became clear that the development of an adequate and reproducible digestion
procedure is the most critical step in this marker-peptide approach. Trypsin was the logical
choice as first possible proteolyzing agent to be investigated as, due to the booming discipline
of proteomics, it is worldwide the most applied and studied digestion method. As a logical
starting point, an in-solution trypsinization protocol was optimized with absolute quantitation,
thus reproducibility as a prerequisite. In that respect, before cleavage can occur, cystatin C, as
any other protein, has to be denatured. This not only entails unfolding of the protein but
especially reduction of eventual intrachain disulphide linkages. Inevitably these pre-treatment
steps must be followed by a dilution step to lower the concentration of the used chaotropes
like e.g. urea (<2M). Otherwise, trypsin itself would be susceptible to denaturizing and would
become useless. Unfortunately, at the end of the protocol, this means, despite optimizing
reagent volumes, that the sample becomes nearly 20-fold diluted. As such, not only sensitivity
became an issue to tackle, but also reproducibility and effectiveness of the digestion,
especially at lower protein concentrations (<10 µg/mL), readily demonstrated a rather poor
behaviour and demanded further investigation.
Consequently, in a following chapter, a procedure was developed to balance the inherent
dilution effect. As limited sample volume is in this particular situation not an issue, a
combination of large volume injection and limited chromatographic miniaturization (micro-
LC) was tested, in this way avoiding far-advanced miniaturization, often related with
reproducibility issues, to enhance the sensitivity. To fulfil this goal, a pre-column (Pepmap®,
1mm) was introduced independent of the analytical column (microbore, 1mm) using a 10-port
switching valve so that 450 µL of protein sample, by 10 successive loading steps of 45 µL,
can be loaded. Using this “multiple trapping large volume injection”, the sample becomes not
only re-concentrated but also nearly completely desalted. In addition, the method permits the

Conclusion and future perspectives - 218 -
analytical column to be re-equilibrated simultaneously with these successive loading steps so
that total turn-over time is largely maintained. The thus obtained procedure proved to be
adequate in terms of analytical variability and met the goals set to overcome the dilution
effect. However, the trypsinization process in itself still proved too error-prone and lacked
sufficient reproducibility.
To remediate these difficulties, chemical proteolysis using CNBr was investigated as an
alternative. Accordingly, CNBr (cleavage after a methionine residue) was found to produce
less but larger marker-peptides due to the lower natural occurrence of methionine compared to
arginine and lysine (trypsin cleavage sites). Also, chemical proteolysis agents like CNBr are
not influenced in activity by eventual denaturing media. In fact, denaturing of cystatin C even
showed to be not strictly necessary as CNBr cleavage activity does not suffer from sterical
hindrance caused by higher protein structures and hence, possible cleavage positions can
easily be reached in the presence of these structures. In the end, CNBr cleavage showed to be
superior for our purpose, compared to enzymatic digestion methods, on account of its ease of
handling, and especially higher degree of reproducibility, independent of protein
concentration. Overall reproducibility at every tested concentration level (1.00 to 100 µg/mL)
was 15.41% ± 4.853 (mean ± sd, n=6). This, using a protein analogue, chicken egg white
cystatin as IS, which is able to compensate not only for analytical variations (e.g. small
differences in injection volume) but especially for proteolysis’ differences.
In a last chapter, the ultimate goal of quantifying cystatin C in plasma samples was pursued,
using the above described combination of chemical proteolysis and a protein analogue as
internal standard. The determination of a single protein in a complex matrix such as plasma
containing an enormous amount of much more abundant proteins (albumin, immunoglobulins,
Conclusion and future perspectives - 219 -
etc.) is a daunting task. Obviously, at a first glance, using specific, e.g. immobilized cystatin
C antibodies seems most evident. Nevertheless, our initial work hypothesis of developing a
generic approach easily tailored to a wide range of plasma proteins, instead of having
dedicated ones, e.g. Elisa’s, for each (protein) analyte of interest, is hard to reconcile with an
antibody-based approach. In an effort to extend the generic nature of our basic concept, the
use of two successive molecular mass cut-off ultrafiltration steps was tested. In the first step
(using a 30kDA molecular mass filter), the selective removal of albumin, immunoglobulins
and other high abundant proteins, which are all characterized by a molecular mass exceeding
45kDA and account for more then 80% of the plasma proteome is aimed for, while in the next
ultrafiltration step (5KDA molecular mass filter), the intention is the removal of other low
molecular mass plasma components. On trying to perform a preliminary validation of this
approach, some performance characteristics turned out acceptable, calibration curves e.g.
could be established covering the entire concentration range of human cystatin C plasma
samples (0.500 to 20.0 µg/mL) with coefficients of determination all exceeding 0.9908.
Nevertheless, other performance characteristics were really marginal and from our experience
in developing and validating assays for small molecules, it was clearly felt that this way of
working would never end up into a routinely applicable and reliable procedure. We especially
found that such a procedure lacks sufficient absolute recovery and suffers from major matrix
effects, both absolute and relative. Most probably, the ideal of a generic sample clean-up part
within the overall procedure will have to be abandoned in favour of more targeted extractions.
In general, however, the proposed working hypothesis of using marker-peptides instead of the
whole protein for its absolute quantitation using LC-MS(/MS) proved to be feasible. We
clearly found that to control the process variability, adequate internal standardization which is
able to compensate for digestion differences too, is absolutely indispensable. Consequently,

Conclusion and future perspectives - 220 -
the use of a protein analogue as internal standard, in our application chicken egg white
cystatin, turned out very valuable. Nevertheless, such an analogue is not always available and
therefore, in future experiments, other internal standardization methods should additionally be
investigated. For example, the use of recombinant labelled proteins, obtained by growth in
labelled media, looks very promising and has endless applications. In terms of future research,
the use of immobilized enzyme-reactors also needs to be investigated to see whether it can
replace the proposed proteolysis methods, both chemical (CNBr) and enzymatic (trypsin),
with increased digestion efficiency and reproducibility.
However, the biggest challenge for future experiments will be the search for more
reproducible and effective extraction procedures. Looking back on our experimental results,
adequate extraction efficiencies are probably only possible with the use of targeted antibodies.
This is, unfortunately and as stated before, in contrast with the intended goal. The opposite
way of thinking, where antibodies are used for the selective removal of the most abundant
(plasma)proteins might provide a compromise solution. Such systems already commercially
exist, albeit for much smaller sample volumes such as encountered in qualitative or
differentially quantitative proteomics settings. Questions remain to be answered with respect
to their specificity, the amount of analyte protein that will be co-precipitated (“albumin
sponge effect”), and their overall quantitative nature. It is in our believe that in the (near?)
future, investigators will defeat much of the stated drawbacks and answer the remaining
questions and hence, the use of LC-MS(/MS) for the absolute quantitation of proteins will
gather more and more believers. As if to underline this statement, recently, the English HFL
company has developed the BioMSTM service for protein quantitation based on marker-
peptides produced by enzymatic digestion in combination with a synthetic labelled peptide as
IS. It proves there is even commercial future in the approach. Very little can be found on the
Conclusion and future perspectives - 221 -
BioMSTM service performance. However, despite the scarcity of data in their application
sheet, we, being all to well aware of the pitfalls encountered in our own cystatin C
application, do see some of the same question marks with respect to reproducibility and
effectiveness of the digestion step at lower protein concentrations. We also feel that using a
labelled peptide as IS presents a true performance risk. Nevertheless, being one of the first
commercial efforts, this proves that the method of using marker-peptides for protein
quantitation using LC-MS(/MS) is, or will become, a worthy alternative for immunochemistry
based procedures. We hope that our work will turn out to be a small but valuable addition to
this development.

Conclusion and future perspectives
- 222 -
Conclusie and toekomstperspectieven - 223 -
Conclusie en toekomstperspectieven
Conclusie and toekomstperspectieven - 224 -
De combinatie van vloeistofchromatografie en massaspectrometrie voor de absolute
kwantificatie van componenten in biologische matrices was het centrale thema in dit
doctoraatswerk. Zeker voor deze componenten met een eerder lage moleculaire massa heeft
de combinatie van vloeistofchromatografie en massaspectrometrie de laatste decennia een
enorme evolutie ondergaan van eerder curiosum tot de meest gebruikte techniek voor bio-
analytische toepassingen, in het bijzonder wanneer deze dienen geanalyseerd te worden in
zeer complexe matrices als bijvoorbeeld plasma. Dit ondermeer door de hoge graad van
specificiteit en gevoeligheid die zo typisch is voor moderne massaspectrometers. Door het
wijdverspreide gebruik van deze technieken zijn er doorheen de laatste jaren dan ook
verscheidene criteria en richtlijnen opgesteld wat betreft de kwaliteitscontrole en validatie van
analytische methoden gebruik makend van vloeistofchromatografie-massaspectrometrie. Een
van hen, de “Guidance for industry: Bio-analytical Method Validation”, opgesteld door de
FDA (Food and Drug Administration, VS) was hierbij gebruikt als centrale leidraad doorheen
dit werk.
In tegenstelling tot het algemeen aanvaard gebruik van vloeistofchromatografie-
massaspectrometrie als standaard techniek voor de kwantificatie van componenten met een
lage moleculaire massa staat het gebruik van deze technieken voor de absolute kwantificatie
van componenten met een hogere moleculaire massa nog steeds in zijn kinderschoenen. Voor
dit soort van componenten, bijvoorbeeld proteïnen, is hun gebruik in hoofdzaak nog steeds
beperkt tot meer kwalitatieve toepassingen zoals in de proteomics wereld. Een van de
voornaamste doelen van dit werk was dan ook, uitgaande van de expertise opgebouwd voor
kleinere moleculen, de bruikbaarheid van deze technieken te onderzoeken voor de
kwantificatie van grotere moleculen en gingen hierbij uit van de premisse dat de meest
Conclusie and toekomstperspectieven - 225 -
efficiënte manier om dit te verwezenlijken is door deze grote moleculen (proteïnen) als het
ware te herleiden tot kleinere moleculen (peptiden).
Logischerwijs begon ons werk dan ook met de ontwikkeling en validatie van kwantificatie
methoden voor eerder kleine moleculen. Zo werden ondermeer methoden ontwikkeld voor de
kwantificatie van pyrimethamine/sulfamethoxypyrazine en glycopyrrolaat, beide in plasma,
elk met hun specifieke analytische uitdagingen. Voor de combinatie
pyrimethamine/sulfamethoxypyrazine, geneesmiddelen gebruikt in de strijd tegen malaria,
was de simultane kwantificatie van beide hierbij als doel vooropgesteld en dit bij voorkeur in
een relatief kort tijdsbestek en in één enkele chromatografische run. Het verwezenlijken van
dit doel werd hierbij niet alleen bemoeilijkt door het erg verschillend chemisch karakter van
beide moleculen maar voornamelijk door de sterk verschillende plasmaconcentraties van
beide. Niettegenstaande werd een methode ontwikkeld met een analysetijd van slechts 12.5
minuten, voorafgegaan door een relatief eenvoudige en snelle vloeistofvloeistof extractie. Een
optimaal extractie rendement (69.43% ± 18.55 (gemiddelde ± sd, n=6)) voor pyrimethamine
(laagst geconcentreerde component) werd hierbij vooropgesteld. Dit resulteerde echter ook in
een extractierendement van slechts 0.4102% ± 0.1247 (gemiddelde ± sd, n=6) voor
sulfamethoxypyrazine. Op het eerste zicht lijkt dit absoluut onaanvaardbaar maar juist op deze
manier werd de hele hoge pyrimethamine/sulfamethoxypyrazine plasmaconcentratie ratio
drastisch verlaagd en konden beide gemeten worden gebruik makend van dezelfde
massaspectrometrische parameters; dit, ondanks het beperkt lineair dynamisch bereik van de
techniek. Voor beide konden dan ook ijkcurves opgesteld worden binnen een
concentratiegebied van 0.00101 tot 0.807 µg/ml voor pyrimethamine en van 0.271 tot 216
µg/ml voor sulfamethoxypyrazine. De methode werd volledig getoetst en conform gevonden
aan de validatie criteria en richtlijnen als vooropgesteld door de FDA en werd dan ook

Conclusie and toekomstperspectieven - 226 -
toegepast in een farmacokinetische studie voor patiënten behandelt met Co-arinate®
, een
curatief antimalariamiddel gebaseerd op het synergistisch effect van beide componenten.
Ook voor het anti-cholinergisch middel glycopyrrolaat (Robinul®) werd een kwantitatieve
methode ontwikkeld gebruik makend van vloeistofchromatografie-massaspectrometrie. Als
kwaternair ammonium ion was het permanente positieve karakter van glycopyrrolaat het
grootste struikelblok. Hierdoor is de molecule immers extreem wateroplosbaar, wat zowel de
extractie als de chromatografische stap (omgekeerde fase) sterk bemoeilijkt. Er werd dan ook
geopteerd om een tegenion, HFBA, te introduceren in de methode om het permanente
positieve karakter te neutraliseren en dit tijdens zowel de extractie als de chromatografische
stap. De uiteindelijke isocratische methode, gebruik makend van mepenzolaat als interne
standaard, neemt slechts 10 minuten in beslag en laat de kwantificatie toe van glycopyrrolaat
binnen een concentratiegebied van 0.101 tot 101 ng/ml. Ook deze methode werd volledig
conform gevonden aan de kwaliteitsvereisten van de FDA en werd aangewend in een
preliminaire farmacokinetische studie van geanesthatiseerde patiënten behandelt met
Robinul®
.
De relatieve eenvoudigheid en optimalisatiesnelheid waarmee vloeistofchromatografie-
massaspectrometrie kon toegepast worden voor de absolute kwantificatie van deze
componenten met een lage moleculaire massa staat in schril contrast met de toepasbaarheid
van deze technieken voor de kwantificatie van grotere moleculen als proteïnen. Dit was dan
ook de volgende en grootste uitdaging van dit werk.
De ontwikkeling van een algemene methode, toepasbaar op om het even welk proteïne, mits
kleine aanpassingen, werd hierbij vooropgesteld gebruik makend van merkerpeptiden. In deze
Conclusie and toekomstperspectieven - 227 -
zogenaamde “bottom-up” aanpak wordt een proteïne eerst geknipt tot peptiden die vervolgens
chromatografisch gescheiden worden en massaspectrometrisch (kwantitatief) bepaald. De
anders zo moeilijke massaspectrometrische kwantificatie van een proteïne wordt hierbij
herleid tot de kwantificatie van één of enkele peptiden, merkerpeptiden genaamd, of anders
gezegd, de kwantificatie van componenten met een hoge moleculaire massa wordt herleid tot
deze met een lagere moleculaire massa, een toepassingsgebied waarin
vloeistofchromatografie en massaspectrometrie reeds lang hun nut bewezen hebben. Cystatine
C werd uitgekozen als modelproteïne om de toepasbaarheid en bruikbaarheid van deze
benaderingswijze te testen ondermeer omwille van zijn intermediaire grootte, gebrek aan
glycosilaties en potentieel klinisch nut. Als interne standaard werd geopteerd voor
kippeneiwit cystatine, een proteïne behorend tot dezelfde cystatine familie.
Reeds van bij de start werd het snel duidelijk dat de juiste digestie methode, om het proteïne
te herleiden tot verschillende peptiden, de meest kritische stap is in deze methodologie.
Verschillende enzymatische methoden zijn doorheen de jaren ontwikkeld om dit te realiseren.
Trypsinisatie is hiervan de meest bestudeerde en gebruikte digestiemethode, ondermeer
binnen de proteomics wereld. Logischerwijze werd de ontwikkeling van een adequate
trypsinatie methode voor het knippen van proteïnen in oplossing dan ook gezien als de eerste
stap die moest genomen worden. Alvorens het proteïne kan getrypsiniseerd worden dient het
echter eerst gedenatureerd te worden, zodat de verschillende knipplaatsen door het enzym
kunnen bereikt worden gebruik makend van specifieke chaotrope agentia zoals bijvoorbeeld
ureum. Daar het enzym echter zelf ook een proteïne is, en dus vatbaar voor het verlies van
zijn hogere structuren door deze moleculen, moeten deze agentia voldoende verdund worden
alvorens het enzym wordt toegevoegd. Onvermijdelijk raakt het proteïnestaal zo meer en meer
verdund. Zelfs indien de reactiereagentia tot een strikt minimum beperkt worden, is aan het

Conclusie and toekomstperspectieven - 228 -
einde van het protocol het proteïne-staal bijna 20-maal verdund, wat de gevoeligheid ernstig
compromitteert. Bovendien werd ook de reproduceerbaarheid van de digestie, in het bijzonder
bij lagere proteïneconcentraties, als problematisch ervaren.
In een volgend hoofdstuk werd dan ook gepoogd om dit inherente verdunningseffect te
compenseren. Staalvolume is in deze, door de hoge dilutie-factor, geen probleem en een
combinatie van een groot injectievolume en beperkte chromatografische miniaturisatie werd
(microbore, 1mm) vooropgesteld. Verdere miniaturisatie naar het nano-niveau, vaak gepaard
gaande met reproduceerbaarheidproblemen, kon zo vermeden worden. Een prekolom en een
analytische kolom werden hiervoor onafhankelijk van elkaar gekoppeld gebruik makend van
een 10-wegskraan. 450 µL proteïnestaal, in 10 opeenvolgende stappen van 45µL, kon zo
geladen worden op de prekolom, simultaan ontzout worden en vervolgens geïnjecteerd
worden op de analytische kolom. Bovendien is gedurende deze opeenvolgende
beladingsstappen een simultane reëquilibratie van de analytische kolom mogelijk waardoor de
totale analyse tijd nauwelijks verlengd wordt. De methode op zich bleek geschikt om het
verdunningseffect te compenseren zonder al teveel bijkomende analytische variabiliteit te
introduceren maar de digestie stap zelf, gebruik makend van trypsine, bleek nog steeds te
onreproduceerbaar bij lagere proteïneconcentraties.
Om deze steeds terugkerende reproduceerbaarheidproblemen het hoofd te bieden werd dan
ook gezocht naar alternatieven onder de vorm van chemische digestie. Dit omdat chemische
digestie, waarbij gebruik gemaakt werd van CNBr dat selectief knipt achter methionine
residuen, per definitie niet onderhevig is aan mogelijke afbraak door denaturerende agentia of
verminderde activiteit vertoont bij lagere proteïneconcentraties. Bovendien worden minder
maar grotere merkerpeptiden gevormd door het lager aantal methionine-residuen in humane
Conclusie and toekomstperspectieven - 229 -
proteinen ten opzichte van lysine en arginine (trypsinisatieplaatsen). Omdat CNBr in zijn
activiteit, in tegenstelling tot enzymen, niet gehinderd wordt door de hogere
proteïnestructuren bleek denaturatie van cystatine C zelf niet noodzakelijk, wat toch een
zekere vereenvoudiging en tijdswinst van de procedure met zich meebrengt. CNBr bewees
dan ook superieur te zijn in vergelijking tot trypsine voor het produceren van cystatine C
merkerpeptiden, ondermeer steunend op de meer eenvoudige werkwijze (geen denaturatie,
verdunning, etc.) en de hogere graad van reproduceerbaarheid. In combinatie met het gebruik
van een cystatine C analoog eiwit als interne standaard, namelijk kippeneiwit cystatine, dat
zowel analytische variaties als digestieverschillen kan compenseren, was de totale
reproduceerbaarheid over het gehele concentratiegebied (1.00 tot 100 µg/ml) 15.41% ± 4.853
(gemiddelde ± sd, n=6).
In een laatste hoofdstuk tenslotte werd de hierboven beschreven methodologie getest voor het
bepalen van cystatine C in plasmastalen. Het bepalen van één enkel proteïne in een complexe
matrix als plasma waar een overweldigende hoeveelheid van meer abundante eiwitten
aanwezig is, zoals albumine en de immunoglobulinen, was misschien wel de grootste
uitdaging van dit werk. Het gebruik van specifieke anti-cystatine C antilichamen lijkt hierbij
de enige logische keuze, was het niet dat hun gebruik indruist tegen het initiële idee van een
methode te ontwikkelen die universeel bruikbaar is, mits enkele kleinere aanpassingen, voor
om het even welk eiwit. Daarom werd geopteerd om, gebruik makend van twee
opeenvolgende ultrafiltratie stappen, een algemene extractie/fragmentatie methode te
ontwikkelen om zo cystatine C te scheiden van de meer abundante plasmaproteïnen. Hiervoor
werd in een eerste stap, gebruik makend van een 30 kDa moleculaire massafilter, de
selectieve verwijdering van deze meer abundante eiwitten beoogd. Deze zijn verantwoordelijk
voor meer dan 80% van de bulk massa van het plasma proteoom en worden allemaal

Conclusie and toekomstperspectieven - 230 -
gekenmerkt door een moleculaire massa groter dan 45kDa. In een volgende ultrafiltratie stap,
nu gebruik makend van een 5 kDA moleculaire massafilter, werd de verwijdering van laag
moleculaire massa plasma componenten dan beoogd. Deze vooropgestelde
extractie/fragmentatie methode werd, naar analogie met de methodes ontwikkeld voor
kleinere moleculen, getoetst aan de validatiecriteria zoals beschreven door de FDA maar deze
konden, op enkele criteria na, niet bereikt worden. Niettegenstaande deze eerder ondermaatse
validatieparameters konden toch ijklijnen opgesteld worden binnen het fysiologische
concentratiegebied van cystatine C (0.5 tot 20.0 µg/ml), allen met variatiecoëfficiënten hoger
dan 0.9908. Vanuit onze expertise opgebouwd voor de validatie van essays voor kleinere
moleculen voelen we echter instinctief aan dat een extractie/fragmentatie procedure zoals
hierboven beschreven nooit zal uitmonden in een routinematig gebruik van de methode met
een voldoende hoge graad van betrouwbaarheid. In het bijzonder konden we aantonen dat zo
een algemene benaderingswijze te onderhevig is aan matrix effecten, zowel absoluut als
relatief. Naar ons aanvoelen zal het initiële idee van een algemene extractiemethode dan ook
moeten opgegeven en vervangen worden door meer specifieke methoden.
Onafgezien van de extractie/fragmentatie methode konden we via dit onderzoek wel aantonen
dat de vooropgestelde methodologie, namelijk het gebruik van merkerpeptiden in plaats van
het volledige proteïne voor zijn kwantificatie, gebruik makende van vloeistofchromatografie-
massaspectrometrie een werkbare methodologie is. Het gebruik van een interne standaard die,
naast de analytische variabiliteit, ook kan compenseren voor digestieverschillen blijkt hierbij
absoluut noodzakelijk. Het gebruik van een proteïnen analoog, in ons specifiek geval
kippeneiwit cystatine, als interne standaard in plaats van het meer algemeen gebruikt principe
van een gelabeld peptide bleek dan ook de juiste keuze. Zo een analoog is echter niet voor om
het even welke eiwit commercieel beschikbaar en dus dienen in volgende experimenten ook

Conclusie and toekomstperspectieven - 231 -
andere alternatieven onderzocht te worden, zoals bijvoorbeeld het gebruik van recombinante
gelabelde proteïnen, geproduceerd gebruik makend van gelabelde groeimedia. Naar de
toekomst toe dienen ook alternatieve digestiemethoden verder onderzocht te worden die nog
een hogere reproduceerbaarheid en digestie-efficiëntie kunnen verzekeren.
De grootste uitdaging zal echter blijven liggen in de zoektocht naar meer reproduceerbare,
selectieve en efficiënte extractiemethoden. Terugkijkend op onze experimenten is het onze
overtuiging dat dit allicht enkel mogelijk zal zijn gebruik makend van specifieke
antilichamen, ook al betekent dit dat het initiële doel van een algemene methode dient
verlaten te worden. De omgekeerde redenering waarbij de meest abundante eiwitten
verwijderd worden gebruik makend van specifieke antilichamen zou een mooi compromis
kunnen bieden. Zulke systemen zijn ondertussen commercieel beschikbaar maar zijn tot nu
toe enkel bruikbaar voor veel kleinere staalvolumes zoals ondermeer in kwalitatieve of
relatief kwantitatieve proteomics toepassingen het geval is. Bovendien zijn er nog vele vragen
onbeantwoord naar de specificiteit toe van dergelijke systemen en is de hoeveelheid eiwit dat
(ongewild) mee verwijderd wordt (“albumine spons effect”) een onzekere factor.
Niettegenstaande de enorme uitdagingen die er nog resten zijn we ervan overtuigd dat in de
(nabije?) toekomst onderzoekers deze het hoofd zullen bieden en dat het gebruik van
merkerpeptiden voor de absolute kwantificatie van eiwitten gebruik makend van
vloeistofchromatografie-massaspectrometrie meer en meer toepassingen zal kennen. Ook de
eerste commerciële toepassingen zijn reeds voor handen en bevestigen de toenemende
populariteit van merkerpeptiden. Zo heeft de Engelse firma HFL recent de BioMSTM service
ontwikkeld voor de absolute kwantificatie van proteïnen gebruik makende van
merkerpeptiden geproduceerd na enzymatische digestie in combinatie met een gelabeld
peptide als interne standaard. Tot op heden is weinig geweten over de kwaliteit van de
Conclusie and toekomstperspectieven - 232 -
BioMSTM service. Een meer nauwlettend onderzoek van hun applicatie sheet bevestigt echter
dezelfde moeilijkheden en beperkingen (reproduceerbaarheid en efficiëntie van de digestie
stap bij lagere proteïneconcentraties) als deze die aan het licht kwamen in ons eigen
onderzoek. Bovendien kunnen we niet anders, vanuit ons opgebouwde ervaring, dan enig
scepticisme te vrijwaren voor het gebruik van gelabelde peptiden als interne standaard. Als
één van de eerste commerciële inspanningen bevestigt de BioMSTM service wel de groeiende
interesse en het groeiende geloof in het gebruik van merkerpeptiden voor de absolute
kwantificatie van proteïnen gebruik makend van vloeistofchromatografie-massaspectrometrie.
We hopen dan ook dat dit werk een kleine bijdrage kan leveren in de verdere uitbouw van de
methodologie.

CURRICULUM VITAE
Personal
Name STORME Michael Luc Marita Born November 9th
Nationality Belgian , 1979, Ghent
Address Gaversesteenweg 869, 9820 Merelbeke (Melsen)
Time Frame:
1991-1997: humaniora (Grieks-Wetenschappen), Sint-Lievenscollege te Gent
1997-2003: Pharmaceutical Sciences (University Ghent)
2003-2007: PhD. Student, Laboratory of Medical Biochemistry and Clinical Analysis,
Prof. Dr. Apr. J. Van Bocxlaer (BOF-project, Projectnr. 01J02506)
Scientific curriculum
ATTENDED SYMPOSIA:
• Technology seminar Waters: “Total solutions with innovative HPLC- and MS (/MS) techniques”, Zemst, September 29
2003
th
• Thermo workshop: “Introduction of the new linear ion trap”, Neder-over-Heembeek,
October 9
, Belgium.
th
, Belgium
• Bruker Daltonics mass spectrometry seminar, Leuven, May 5
2004 th
• Waters-Micromass seminar, Clinical Mass Spectrometry: A Continuously Expanding
Application Field, Veldhoven, September 30
, Belgium
th
• Fabian annual meeting, “Bio-analysis and Biotechnology”, Ghent, November 5
, the Netherlands th,
Belgium
2005

• Waters European forum on quantitative proteomics and metabonomics, Brecht, April
19th
• Waters-Micromass seminar, Purification and extraction of peptides and proteins,
Ghent, September 20
, Belgium
th, Belgium
• Waters-Micromass Qtof user Meetings, Antwerp, March 23
2006
rd and 24th
, Belgium
ATTENDED INTERNATIONAL CONGRESSES:
• NVMS spring meeting 2004, jointly organized by the Dutch Society for Mass
Spectrometry (NVMS) and the Belgian society for Mass Spectrometry (BSMS),
Tilburg, April 21
2004
st, the Netherlands
• NVMS spring meeting 2005, jointly organized by the Dutch Society for Mass
Spectrometry (NVMS) and the Belgian society for Mass Spectrometry (BSMS),
Haarlem, April 29
2005
th
, the Netherlands
• 29
2006
th ISCC (International Symposium on Capillary Chromatography), Riva del Garda,
May 29th – June 2nd
,Italy
• BSMS (Belgian Society for Mass Spectrometry) annual meeting, Leuven, February
16
2007
th
• 31
, Belgium st
• 7
International Symposium on high Performance Liquid Phase Separations and
related techniques, HPLC 2007, Ghent, June 17-21, Belgium th FABIAN symposium, November 6th
, Beerse, Belgium
ABSTRACTS

2004
• Fabian annual meeting, Ghent, November 5th, Belgium:
M. Storme
, D. Deforce and J. Van Bocxlaer. Optimization of an in solution tryptic
digest protocol for use in quantitative LC/MS of proteins
2005
• NVMS spring meeting 2005, Haarlem, April 29th
o
, the Netherlands:
M. Storme
o B. Sinnaeve,
, B. Sinnaeve and J. Van Bocxlaer. The use of marker peptides for
the quantitation of proteins
M. Storme
and J. Van Bocxlaer. Capillary liquid chromatography
and tandem mass spectrometry for the quantification of encephalins in
cerebrospinal fluid
2006
• 29th ISCC, Riva del Garda, May 29th – June 2nd, Italy:
M. Storme
and J. Van Bocxlaer. Multi-trapping injection microLC-MS/MS for
quantitative analysis of proteins based on tryptic marker peptides
• BSMS annual meeting, Leuven, February 16
2007 th
o
, Belgium:
M. Storme
o R. t’Kindt,
, R. t’Kindt and J. Van Bocxlaer. Evaluation of chemical digestion
of proteins: an alternative to tryptic digestion in terms of reproducibility and
efficiency.
M. Storme
• HPLC 2007, Ghent, June 17-21, Belgium:
and J. Van Bocxlaer. Determination of cholesterol and
cholesterol esters in Xenopus leaves embryo’s through direct flow injection
electrospray ionisation mass spectrometry.
M. Storme
• Fabian annual meeting, Beerse, November 6
and J. Van Bocxlaer. The use of acetonitrile for the extraction of low-
molecular weight proteins: a worthy alternative for ultrafiltration? th
Quantitative determination of glycopyrrolate in human plasma by liquid
chromatography – electrospray ionization mass spectrometry.
, Belgium:
R. t’Kindt, M. Storme
, W. Goeteyn, J. Van Bocxlaer
POSTER-PRESENTATIONS :
2004
• Fabian annual meeting, Ghent, November 5th, Belgium:
M. Storme
, D. Deforce and J. Van Bocxlaer. Optimization of an in solution tryptic
digest protocol for use in quantitative LC/MS of proteins.
2005
• NVMS spring meeting 2005, Haarlem, April 29, the Netherlands:
o M. Storme
o B. Sinnaeve,
, B. Sinnaeve and J. Van Bocxlaer. The use of marker peptides for
the quantitation of proteins.
M. Storme
and J. Van Bocxlaer. Capillary liquid chromatography
and tandem mass spectrometry for the quantification of encephalins in
cerebrospinal fluid.
2006
• 29th ISCC, Riva del Garda, May 29th – June 2nd, Italy :
M. Storme
and J. Van Bocxlaer. Multi-trapping injection microLC-MS/MS for
quantitative analysis of proteins based on tryptic marker peptides.
2007
• BSMS annual meeting, Leuven, February 16th
o
, Belgium:
M. Storme
o R. t’Kindt,
, R. t’Kindt and J. Van Bocxlaer. Evaluation of chemical digestion
of proteins: an alternative to tryptic digestion in terms of reproducibility and
efficiency.
M. Storme
• HPLC 2007, Ghent, June 17-21, Belgium:
and J. Van Bocxlaer. Determination of cholesterol and
cholesterol esters in Xenopus leaves embryo’s through direct flow injection
electrospray ionisation mass spectrometry.
M. Storme
• Fabian annual meeting, Beerse, November 6
and J. Van Bocxlaer. The use of acetonitrile for the extraction of low-
molecular weight proteins: a worthy alternative for ultrafiltration? th
Quantitative determination of glycopyrrolate in human plasma by liquid
chromatography – electrospray ionization mass spectrometry.
, Belgium:
R. t’Kindt, M. Storme
, W. Goeteyn, J. Van Bocxlaer
TRAINING
• Symposium Bioveiligheid ‘Laboratoriuminperkingsmaatregelen en omgaan met
pathogenen’
Faculty of Pharmaceutical Sciences, University of Ghent, January 9th
• Dionex bio-chromatography workshop.
, 2004, Belgium
BME-CTL, Ghent, November 26th
, 2004, Belgium.
PUBLICATIONS
• M.L. Storme, B.A. Sinnaeve, J.F. Van Bocxlaer. The use of tryptic marker-peptides
for the quantitative analysis of cystatin C.

JOURNAL OF SEPARATION SCIENCE 28 (14): 1759-1763 SEP 2005
• B.A. Sinnaeve, M.L. Storme
JOURNAL OF SEPARATION SCIENCE 28 (14): 1779-1784, 2005
, J.F. Van Bocxlaer. Capillary liquid chromatography and
tandem mass spectrometry for the quantification of encephalins in cerebrospinal fluid.
• M.L. Storme
RAPID COMMUNICATIONS IN MASS SPECTROMETRY 20 (19): 2947-2953,
2006
, F.H. Jansen, W. Goeteyn, and J.F. Van Bocxlaer: Simultaneous
quantitative analysis of the antimalarials pyrimethamine and sulfamethoxypyrazine in
plasma samples using Liquid Chromatography Tandem Mass Spectrometry.
• K. Huvaere, M.L. Andersen, M.L. Storme
• R. t’Kindt,
, J.F. Van Bocxlaer, L.H. Skibsted and D.
De Keukeleire: Flavin-induced photodecomposition of sulphur-containing amino acids
is decisive in the formation of beer lightstruck flavor. PHOTOCHEMICAL &
PHOTOBIOLOGICAL SCIENCES 5 (10): 961-969, 2006
M. Storme
JOURNAL OF SEPARATION SCIENCE (31): 1609-1614, 2008
, D. Deforce and J. Van Bocxlaer: Evaluation of hydrophilic
interaction chromatography versus reversed phase chromatography in a plant
metabolomics perspective.
• M.L. Storme
JOURNAL OF CHROMATOGRAPHY B, accepted for publication 2008
, R.S. t’Kindt, W. Goeteyn, and J.F. Van Bocxlaer: Quantitative
determination of glycopyrrolate in human plasma by liquid chromatography –
electrospray ionization mass spectrometry: the use of the same volatile ion-pairing
agent during both liquid-liquid extraction and liquid chromatography.
SUBMITTED PUBLICATIONS
• The applicability of “multiple (trapping) large volume injection” as a sensitivity
alternative in liquid chromatography electrospray (tandem) mass spectrometry:
proteins and their peptide lysates.
M.L. Storme
(JOURNAL OF SEPARATION SCIENCE)
, R.S. t’ Kindt, and J.F. Van Bocxlaer.
• LC-MS metabolic profiling of Arabidopsis thaliana plant leaves and cell cultures,
optimization of pre-LC-MS procedure parameters.
(JOURNAL OF CHROMATOGRAPHY B)
• Het gebruik van massaspectrometrische technieken in microbiologie (The use of mass
spectrometric techniques for microbiologic purposes); C. Capelle, 2
THESIS SUPPORT
de
• Detectiemethoden voor EPO in urine (Detection methods for EPO in urine); C.
Vandaele, 2
proef
farmaceutische wetenschappen
de
• Optimalisatie van extractiemethoden voor cystatine C uit humaan plasma: ultrafiltratie
vs proteïnenprecipitatie (Optimalization of an adequate extraction procedure for
cystatin C in human plasma: ultrafiltration versus protein precipitation); S. Bekaert
(experimenteel onderzoek), 2
proef farmaceutische wetenschappen,
de
proef farmaceutische wetenschappen


![18F]FLUORO-N,N-DIMETHYLAMINOETHANOL AS …lib.ugent.be/fulltxt/RUG01/001/790/044/RUG01-001790044_2012_0001... · universiteit gent faculteit farmaceutische wetenschappen vakgroep](https://static.fdocuments.in/doc/165x107/5af4e91e7f8b9a190c8da930/18ffluoro-nn-dimethylaminoethanol-as-libugentbefulltxtrug01001790044rug01-00179004420120001universiteit.jpg)