Aiming for Zero Waste - Montgomery County, MD
98
i Aiming for Zero Waste Montgomery County Maryland Baseline Review and Current State Assessment Technical Memorandum #1 December 2018 Prepared for the Department of Environmental Protection Montgomery County, Maryland
Transcript of Aiming for Zero Waste - Montgomery County, MD

i
Aiming for
Zero Waste Montgomery County Maryland
Baseline Review and Current State Assessment
Technical Memorandum #1
December 2018
Prepared for the Department of Environmental Protection
Montgomery County, Maryland
i
Table of Contents 1 Introduction ......................................................................................................................... 1
2 Waste Composition Studies ................................................................................................ 1
2.1 2012-2013 Waste Composition Study .......................................................................... 2
2.2 2016-2017 Waste Composition Study .......................................................................... 4
2.3 Trends in Waste Composition ...................................................................................... 6
3 County Waste Management Services ................................................................................. 7
3.1 Solid Waste Services ................................................................................................... 7
3.1.1 Relevant Regulations ...........................................................................................13
3.1.2 Trash ...................................................................................................................18
3.1.3 Recycling .............................................................................................................22
3.1.4 Leaf and Yard Trim ..............................................................................................22
3.1.5 Bulk Trash ...........................................................................................................23
3.1.6 Scrap Metal .........................................................................................................24
3.1.7 Drop-off ................................................................................................................24
3.2 Tons of Materials Managed .........................................................................................24
3.3 Tons Managed by Service Area ..................................................................................26
3.4 Waste Generation Rates .............................................................................................27
3.5 Community Engagement.............................................................................................27
3.6 Green Procurement ....................................................................................................29
3.7 Material Bans ..............................................................................................................29
4 County-Owned Waste Management Facilities ....................................................................30
4.1 Materials Recovery Facility .........................................................................................32
4.2 Shady Grove Processing Facility and Transfer Station ...............................................33
4.2.1 Drop-off Areas at the Transfer Station .................................................................34
4.3 Resource Recovery Facility ........................................................................................36
4.4 Montgomery County Yard Trim Composting Facility ...................................................38
4.5 Land Reserved for Potential In-County Waste Landfill ................................................38
4.6 Closed Landfills ..........................................................................................................39
4.7 Poolesville Beauty Spot ..............................................................................................39
5 Private and Public Facilities that Accept County-Generated Materials ...............................40
5.1 C&D Recovery ............................................................................................................40
5.2 Landfills ......................................................................................................................41
5.3 Material Recovery Facilities (MRFs) ...........................................................................45
ii
5.4 Facilities accepting Construction and Demolition Materials .........................................48
5.5 Compost/Organics Facilities .......................................................................................52
6 Funding & Financial Information .........................................................................................57
7 Contract Review.................................................................................................................65
7.1 Private Service Providers ............................................................................................65
7.2 Service Agreements ....................................................................................................65
7.3 Educational Programs .................................................................................................66
8 Projections .........................................................................................................................67
8.1 Population Projections ................................................................................................67
8.2 Commercial Sector Growth .........................................................................................68
8.3 Waste Generation and Recycling Rates ......................................................................69
9 Summary ...........................................................................................................................73
10 References .....................................................................................................................76
Figures Figure 3-1: Materials Flow Diagram ........................................................................................... 9
Figure 3-2: Sub-district A and B Collection Districts ..................................................................10
Figure 3-3: Solid Waste Curbside Collection Service Areas ......................................................11
Figure 3-4: Map of Leaf Collection District .................................................................................23
Figure 4-1: Montgomery County Solid Waste Facilities .............................................................32
Figure 4-2: Site Plan of Shady Grove Transfer Station and Processing Facility.........................36
Figure 8-1: Annual Recycling/Diversion Rates in Montgomery County ......................................73
Tables Table 2-1: Summary of 2012-2013 Waste Composition by Sector and Overall .......................... 3
Table 2-2: Percent of Potential Compostable Material in Total Waste Stream (2012-2013 Waste Composition) by Sector and Overall ........................................................................................... 3
Table 2-3: Summary of 2016-2017 Waste Composition by Sector and Overall (Adjusted) (Percentage of the Waste Stream by Weight) ............................................................................ 5
Table 2-4: Percent Compostable Material in Total Waste Stream (2016-2017 Waste Composition) by Sector and Overall ........................................................................................... 5
Table 2-5: Comparison of Waste Composition Studies .............................................................. 6
Table 2-6: Comparison of Compostable Portion of Waste Composition Studies ......................... 6
Table 3-1: County Collection Services Provided ........................................................................12
Table 3-2: Number of Routes per Week by District (2018) ........................................................12
Table 3-3: Federal Laws and Regulations Governing Solid Waste Management ......................13
iii
Table 3-4: State Laws and Regulations Governing Solid Waste Management ..........................14
Table 3-5: County Solid Waste Regulations/ County Code .......................................................17
Table 3-6: Materials Management in Incorporated Cities and Municipalities .............................20
Table 3-7: Tons of Materials Generated in Montgomery County (CY 2017) ..............................25
Table 3-8: Number of Households Served and Tons Managed by District (CY17) ....................26
Table 3-9: Breakdown of Waste Generated in Montgomery County by Sector (CY 2017) .........27
Table 3-10: Residential and Non-Residential Waste Generation Rates (CY2017) .....................27
Table 4-1: Description of County Owned Facilities and Types of Materials Managed ................31
Table 5-1: Tons of Construction and Demolition Debris Recycled and Disposed (CY 2017) .....40
Table 5-2: Private Disposal and Recycling Facilities Used by Private Haulers for C&D Materials (2017) .......................................................................................................................................41
Table 5-3: Landfills within 200 miles of Montgomery County .....................................................43
Table 5-4: MRFs within 200 miles of Montgomery County ........................................................45
Table 5-5: C&D Facilities within 200 miles of Montgomery County ............................................48
Table 5-6: Feedstock Types and Facility Tiers ..........................................................................52
Table 5-7: Composting Facilities in Maryland and Virginia ........................................................53
Table 6-1: Shady Grove Processing Facility and Transfer Station Tipping Fees (2018) ............57
Table 6-2: Solid Waste Charge Components and Annual Fees by Sector (FY19) .....................58
Table 6-3: Breakdown of Projected Solid Waste Costs and Revenue (FY18) ............................60
Table 6-4: Disposal and Collection Costs ($) (FY 2014-2018) ...................................................62
Table 7-1: Solid Waste Collection Contracts .............................................................................65
Table 7-2: Service Agreements .................................................................................................66
Table 7-3: Contracts for Educational Programs .........................................................................67
Table 8-1: Average Annual Population Growth (2018 to 2030) ..................................................68
Table 8-2: Average Annual Growth of At-Place Employment (2017-2030) ................................69
Table 8-3: Tons of MRA Recyclables Generated in Montgomery County (CY 2017) .................71
Table 8-4: Recycling and Diversion Rates for Montgomery County (CY 2017) ..........................72
Appendices
Appendix A: Glossary of Terms
Appendix B: Flow diagram of Facilities Managing County waste
iv
Report Prepared By:
Annette Scotto Solid Waste Coordinator
Andrea Ramirez Solid Waste Engineer
Christine Roarke Project Manager
Report Reviewed By:
John Carlton Solid Waste Program Lead

v
Acronyms and Abbreviations
APC Air Pollution Control
BTU British Thermal Unit
CEMS Continuous Emissions Monitoring System
CMW County Managed Waste
COMAR Code of Maryland Regulations
CY Calendar Year
C&D Construction and Demolition Debris
DEP Department of Environmental Protection
DSWS Division of Solid Waste Services
FSC Forest Stewardship Council
FY Fiscal Year
HCl Hydrogen Chloride
HH Household
HHW Household Hazardous Waste
lb Pound
LF Landfill
LFGE Landfill Gas to Energy
MCDOT Montgomery County Department of Transportation
MDE Maryland Department of the Environment
MES Maryland Environmental Services
MF Multi-family
M-NCPPC Maryland-National Park and Planning Commission
MRA Maryland Recycling Act
MRF Material Recovery Facility
MSW Municipal Solid Waste
MW Megawatt
NMWDA Northeast Maryland Waste Disposal Authority
NOx Nitrogen Oxides
OCC Old Corrugated Cardboard
OSHA Occupational Safety and Health Act
PJM Regional Electric Grid
PUF Public Unloading Facility
RRF Resource Recovery Facility
SCS SCS Engineers
SLF Sanitary Landfill
vi
SO2 Sulfur Dioxide
SORRT Smart Organizations Reduce and Recycle Tons
TS Transfer Station
TRRAC Think Reduce and Recycle at Apartments and Condominiums
VPP Voluntary Protection Program
WRF Waste Recovery Facility
vii
Glossary of Terms Used in this Report
The following presents a glossary of terms used in the Aiming for Zero Waste Plan that are not defined within Chapter 48 of the Montgomery County Code or COMAR. Additional terms, consistent with definitions contained in Chapter 48 of the Montgomery County Code and COMAR can be found in Appendix A.
Aiming for Zero Waste Plan – a master planning study conducted by HDR Engineering, Inc., an on-call consultant of the Northeast Maryland Waste Disposal Authority, on behalf of Montgomery County, Maryland. The plan will guide the future of responsible solid waste management in the County.
Ash - the solid byproducts of combustion, which are collected from grates or hearths in a furnace where combustion takes place and from filters or separators that process combustion gasses.
Back-End Scrap Metal - ferrous and non-ferrous metal recovered once materials have been incinerated. Back-End Scrap Metal counts towards the MRA rate since it is recycled.
Base Systems Benefit Charge – charges levied by the County to cover the costs of developing and maintaining the basic programs and facilities necessary to fulfill the County's obligation to manage all solid waste generated within the County.
Beneficial Use - the process of turning what would become waste into a valuable commodity. Materials may be reused to substitute a raw material or be used as a fuel.
Biosolids - the primarily organic solid or semi-solid by-product of wastewater treatment processes; synonymous with “sludge” as used in COMAR.
Bypass Waste - waste received by the County which is processible at the RRF but is not processed at the RRF and instead sent by the County to its out-of-County landfill.
Bulk Trash – large items that do not fit in a container, set out at the curb for separate collection by appointment. Usually consist of items such as furniture, appliances, mattresses etc.
Collection Contractor - a private company under contract with the County to provide solid waste collection services for dwelling units with less than 7 units within the Solid Waste Collection Districts.
Collector - any person who contracts to collect and provide services for collection and/or transporting the solid waste of others to its disposal site.
Commingled Materials – recyclable materials collected in the County-provided blue recycling bin including aluminum foil products, cans, glass bottles and jars, plastic bottles, containers, tubs and lids.
Combustible – the ability to catch fire and burn easily.
Composting - the biological decomposition of organic material such as food waste into a stable, humus-like product, is a first step in the recycling of food waste.
Compostable Material – non-recyclable paper, food waste, yard waste (grass, leaves, brush/ pruning).
viii
COMAR – Code of Maryland Regulations.
Construction and Demolition (C&D) Debris - solid waste from construction, demolition and renovation projects that produce debris including wood, wood products such as fiberboard and particleboard, cardboard, sheetrock and other drywall, plaster, fiberglass, plastic, glass, stone, steel and other metals, asphalt, concrete, brick and mortar, rock, dirt, rubble, tree stumps, logs and large tree limbs.
County - Montgomery County, Maryland.
County Solid Waste Facilities - all sanitary landfills, refuse transfer facilities, materials recovery facilities, compost production facilities, resource recovery facilities and related facilities wholly operated by, or on behalf, of the County.
Department - the Department of Environmental Protection.
Diversion Rate – represents the amount of solid waste diverted from disposal for most jurisidictions. In the case of Montgomery County, this represents the recycling rate plus credits earned for source reduction.
Dwelling Unit - a building or part thereof arranged or designed for occupancy by not more than one family for living purposes and having cooking facilities.
Ferrous Metal – metal items containing iron, such as food cans.
Front-End Scrap Metal - ferrous or non-ferrous materials recovered from the waste stream in a refuse disposal system prior to incineration. Front-end scrap counts towards the MRA rate and should be included in the “Other” section of the “Metals” category. Generator - the owner or occupant of any dwelling unit where solid waste is generated, and the owner or occupant of any other business, entity or institution at, from, or by which solid waste is generated.
Hauler - any person operating a commercial business or engaged in any enterprise regularly generating solid waste which requires collecting and hauling to an approved point of disposal, when such collecting and hauling is done by the person generating such material in his own vehicles or in vehicles leased for the purpose, in lieu of having a licensed collector perform this service.
Hazardous Waste - Includes listed wastes, and characterized wastes that have one of the following properties: ignitability, corrosivity, reactivity, or toxicity.
Incremental Systems Benefit Charge – charges levied by the County to generating sectors for services not equally available or provided to all sector equally.
Inorganic Material – as defined in the County’s waste composition study, Includes concrete/brick/rock, sheet rock, latex paints, fluorescent lamps, electronics, and miscellaneous inorganic materials.
Integrated Solid Waste Management System - the County's system of managing solid waste as that system is revised from time to time in the County's Comprehensive Solid Waste Management Plan. The system may include all aspects of solid waste management and handling, including any waste reduction program, recycling program or facility, disposal program or facility, and any other program related to the collection, management and disposal of solid waste.
ix
Intermodal - refers to large standardized containers, designed and built to be used across different modes of transport – from rail, to truck to ship. Montgomery County uses intermodal containers to transport materials by rail from Shady Grove Transfer station to other facilities.
Landfill - an engineered facility for disposing of solid wastes on land by spreading, compacting and covering the wastes.
Leachate - liquid that has percolated through a landfill.
Maryland Department of the Environment (MDE) - in 1987, the Maryland Department of the Environment was created to protect and preserve the state's air, water and land resources and safeguard the environmental health of Maryland's citizens.
Maryland Recycling Act (MRA) - in 1988, the Maryland Recycling Act (MRA) authorized MDE to reduce the disposal of solid waste in Maryland through management, education and regulation. The MRA requires that:
• Each of Maryland’s jurisdictions develop and implement recycling programs. Jurisdictions with populations greater than 150,000 are required to recycle 35% of their waste and jurisdictions with populations less than 150,000 are required to recycle 20% of their waste. State agencies must implement a recycling plan with a 30% recycling rate mandate. (2012)
• If a jurisdiction fails to meet the specified reductions, State and local authorities can prohibit the issuance of building permits for all new construction.
• Each jurisdiction selects materials to be recycled and the manner in which materials are to be separated and processed.
• State agencies participate in recycling programs. • Newsprint and telephone directories distributed in the State have a recycled content, by
weight, of 30% in 2001, increasing to 40% by 2005.
MRA Recycling – Maryland Recycling Act (MRA) materials are acceptable recyclable materials found under the Maryland Recycling Act. These materials can be reported as recyclable and counted toward the County’s recycling rate. These materials generally include aluminum, glass, paper, and plastic. MRA Waste and Non-MRA Waste – the list of materials that can be counted as a MRA material or not is constantly evolving. Every year MD counties have to get from MDE the latest guidelines prior to completing the MRA Tonnage Reporting Survey. Materials Recovery Facility - a facility for separating recyclables from mixed waste or for separating commingled recyclables.
Multi-family Dwellings – buildings comprised of seven or more dwelling units.
Municipal Solid Waste - solid waste generated at residences, commercial establishments and institutions; excludes land clearing, construction and demolition debris.
Municipalities – incorporated cities, towns, villages and municipalities located within Montgomery County that enact their own laws and may provide their own waste management services.
Northeast Maryland Waste Disposal Authority (NMWDA) - the NMWDA is a multi-county agency that provides support for the waste management systems for the eight participating jurisdictions in the state. The goal of the NMWDA is to minimize waste disposal costs.

x
Non-ferrous Metal – metals that do not contain iron, such as aluminum beverage cans.
Non-processible Waste - a waste material which cannot be processed at the County's Resource Recovery Facility because of its size, bulkiness, composition or regulatory restrictions.
Non-Recyclable Paper - all paper products that are not accepted in the County’s recycling program, including all tissues, paper towels, and napkins, carbon paper, and other non-recyclable papers.
PJM or PJM Regional Electric Grid - a regional transmission organization (RTO) that coordinates the movement of wholesale electricity in Maryland and all or parts of 12 other states and the District of Columbia. Processible Waste – waste that enters the County’s waste system and is deemed acceptable for processing at the Resource Recovery Facility.
Recyclables - materials that can be readily separated from a waste stream and reused in their present form or can be converted into raw materials from which new products can be made.
Recycling – recyclable materials (paper, paper packaging, glass, metal, plastics) that are collected and processed at a Materials Recovery Facility. They may be either collected together (single-stream) or dual-stream (paper products collected separately from commingled containers).
Recycling Rate – the recycling rate is calculated by adding the tons of MRA recycling and credits for the resource recovery facility (i.e. the numerator) and dividing by the tons of MRA recycling tonnage and MRA waste (i.e. the denominator).
Recycling Services – County- provided weekly curbside collection of blue bins, paper carts, scrap metal and yard trim.
Recycling Center – the County’s Material Recovery Facility.
Refuse Collection Charge – charges levied to households in the County that receive trash collection by County-contracted collectors.
Resource Recovery Facility – a facility that processes solid waste by combustion to produce valuable resources such as steam to create electricity. Metals are also recovered from this process to be further recycled. Scrap Metal – metal items collected at the curb or dropped off at the County’s transfer station.
Single-family Dwellings – buildings comprised of one to six dwellings.
Solid Waste Charge – the overall charges levied by the County for waste management services. Includes the base systems benefit charge, incremental systems benefit charge, refuse collection charge, and disposal fees. May also include leaf vacuuming charges for residents living within the leaf vacuuming collection district.
Solid Waste Collection Districts - special service districts established from time to time, consisting of certain areas of the County as defined on maps in the office of the Director, in which solid waste is collected by the County or its contractor.
Solid Waste Management District - a special service district consisting of all of Montgomery County.
xi
Solid Waste Management Service - any service provided by or on behalf of the County to plan, implement, or administer any part of an integrated solid waste management system.
Source Reduction Credit – Maryland created a source reduction credit system to help the State meet its annual waste diversion goal. Depending on the type of source reduction activities conducted, a credit of up to 5% can be added to the recycling rate. Examples of source reduction activities include running demonstration sites, outreach and education, and food composting.
Source Separated Organics – organic materials separated by the generator and placed out for collection. Depending on the jurisdiction, this can include meat, dairy, vegetative food waste, paper and paper products (e.g. napkins, tea bags, pizza boxes), some yard trim, diapers, pet waste, sanitary products.
Sub-district – the County is divided into Sub-district A and Sub-district B.
Sustainable Materials Management – a systemic approach to using and reusing materials more productively over their entire lifecycles. By examining how materials are used throughout their lifecycle – from materials extraction to end-of-life management, this approach seeks to:
• Use materials in the most productive way with an emphasis on using less
• Reduce toxic chemicals and environmental impacts throughout the material lifecycle
• Assure there are sufficient resources to meet today’s needs and those of the future.
This approach means a product could be redesigned so it is manufactured using different, fewer, less toxic, and more durable materials. It could also be designed so that it can be readily disassembled for reuse or recycling of its parts at the end of its useful life.
Systems Benefit Charge - an annual service charge reflecting all or a portion of the cost to the County of providing base and incremental solid waste management services (County Code Chapter 48).
Transfer Station - a facility designed to reduce collection and/or transportation costs by the consolidation of solid wastes before transport to a site for final disposal.
Trash – solid waste that is not considered recyclable. Trash may be sent to be disposed of in a landfill or at the RRF.
Waste – materials collected from residences and businesses generally consisting of trash, recyclables, food scraps, yard trim, source separated organics, scrap metal, electronics, household hazardous waste and bulk trash.
Yard Trim - vegetative materials generated through the normal maintenance of yards, lawns, gardens or other landscaped areas including grass, leaves and brush; excludes soils, tree stumps, logs, large tree limbs, rock and other land clearing debris.
Zero Waste - there is no universally accepted definition of Zero Waste and the concept of Zero Waste is still evolving. However, the concept of Zero Waste is modeled on the biogeochemical and nutrient cycles found in nature, in which elements are continuously cycled in various forms between different compartments of the environment. Likewise, Zero Waste takes a cyclical approach to the vast flow of resources and products manufactured and utilized by human society. This cyclical, whole system approach seeks to minimize the extraction of resources form the earth by minimizing waste, reducing consumption, maximizing recycling, and developing products that are made to be reused, repaired, or recycled back into nature or the marketplace. Zero Waste

xii
requires changing the perspective from thinking of discarded materials as wastes to thinking of them as resources with functional value. Many professionals in the field believe that getting to Zero Waste does not mean achieving absolute zero.

1
1
1 Introduction HDR has been retained by the Northeast Maryland Waste Disposal Authority (NMWDA) to assist the Montgomery County (County) Department of Environmental Protection (DEP), Division of Solid Waste Services (DSWS) with developing the “Aiming for Zero Waste Plan” (the Plan)1. There are three key objectives for the project:
• Develop a clear and realistic future vision of the County’s solid waste and recycling program and operations with the goal of maximizing waste reduction, reuse/repair, recycling, and sustainable management of materials;
• Develop actionable strategies (with projected costs, timelines, and outcomes) to achieve this goal; and,
• Identify impacts on existing solid waste management programs, facilities and operations, including new investments, initiatives, changes in methods of operations, and retiring or replacement of existing facilities.
This Baseline Review and Current State Assessment is the first of a series of reports developed in support of the project. The purpose of this report is to create a comprehensive description of the County’s existing integrated solid waste management system. This will be used as a baseline, the foundation for the Plan to achieve the key objectives stated above. To prepare this Baseline Review and Current State Assessment, HDR has utilized information available from the County and prior reports related to its solid waste and recycling programs, information available on the internet and direct contact with companies/businesses. The result is a detailed and concise overview of the current system, from which future system changes can be evaluated and their potential impact assessed.
2 Waste Composition Studies Establishing the baseline for the Plan includes evaluating the composition of disposed materials (waste) generated in Montgomery County. Waste composition studies provide information on the County’s waste management system that can be used, in conjunction with other key data, to develop a comprehensive picture of the County’s waste management system for use in future projections and program analyses.
The County commissions waste composition studies every four years for the disposed material that is received at the Shady Grove Processing Facility and Transfer Station. The two most recent waste composition studies for the County
1 In this document the following names are used interchangeably: Solid Waste Master Plan, Aiming for
Zero Waste Plan and Plan.
2
2
were performed by SCS Engineers (SCS) in 2012-20132 and 2016-2017. Both studies were performed at the Shady Grove Processing Facility and Transfer Station, spanned four seasons, and included 300 samples. Both studies sorted the samples into 64 different material categories, which varied slightly between studies. However, the major material component groups remained the same: paper, plastic, organics, yard waste, wood, ferrous metal, non-ferrous metal, glass, inorganic, and household hazardous waste (HHW). The composition study results provide information on the waste received at the Shady Grove Processing Facility and Transfer Station but is not intended to provide data on waste generation or recycled materials. The results of both studies are summarized and compared below.
2.1 2012-2013 Waste Composition Study The results of the 2012-2013 waste composition study were statistically analyzed and presented in the report, “Montgomery County Waste Composition Study Summary of Results” (SCS Engineers, July 2013). The report provides more detail on the sampling and statistical methods used to determine the results. There were 300 total waste samples collected; 75 samples were collected each season of the year. The waste composition study was reported separately for non-residential (120 samples), single-family (141 samples), and multi-family residential (19 samples) waste. Single-family waste was further divided according to its origin: Sub-district A (60 samples), Sub-district B (31 samples), or Municipal (50 samples). See Section 3.1 for more information on sub-districts. The results were compiled into an overall weighted average waste composition by weighting the results according the actual ratios of waste disposed at the County’s Transfer Station during 2012. The weight ratios were 12.59 percent for Sub-district A, 17.13 percent for Sub-district B, 5.42 percent for municipal, 13.56 percent for multi-family, and 51.31 percent for non-residential waste.
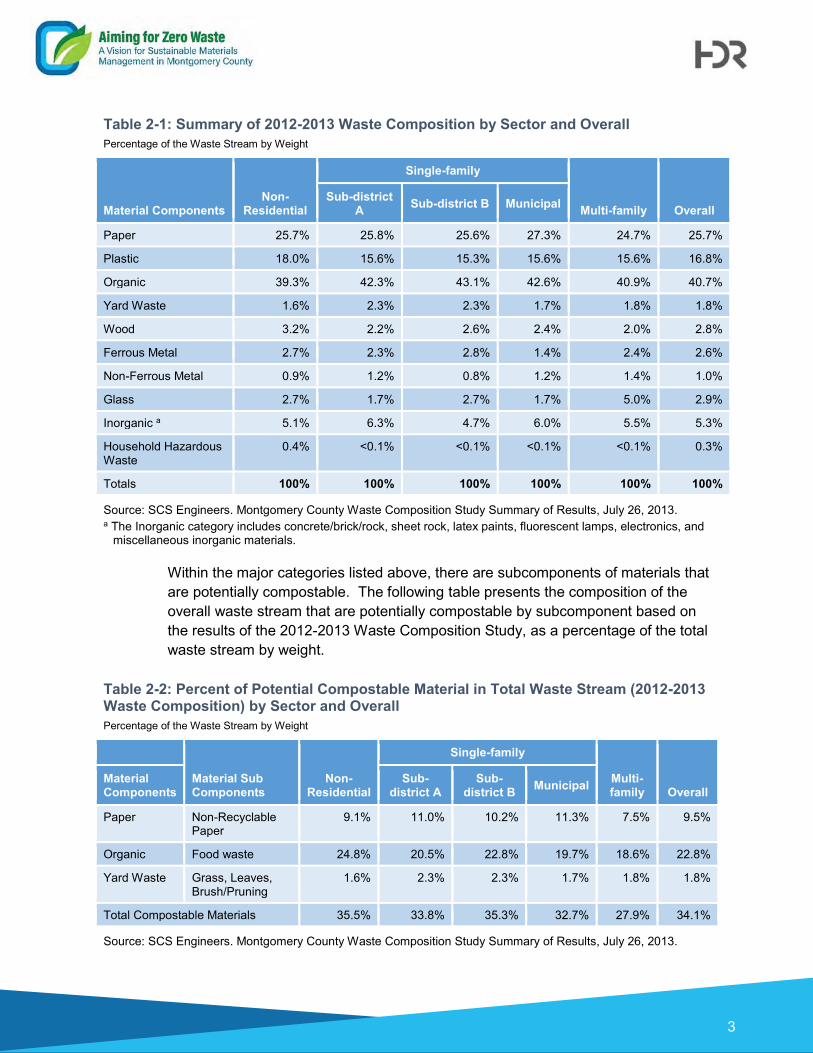
A summary of results divided into the 10 major material component groups is shown in Table 2-1. The waste composition according to major material categories did not vary much across the sectors and sub-districts, except for HHW, which was 0.4 percent of commercial waste but negligible in the residential waste streams. The waste stream was sorted into 64 subcomponents. The three largest subcomponents by weight in the overall waste stream were food waste (22.8 percent), non-recyclable paper (9.5 percent), and film plastic - other (7.9 percent).
2 2012 – 2013 composition-study.pdf
3
3
Table 2-1: Summary of 2012-2013 Waste Composition by Sector and Overall Percentage of the Waste Stream by Weight
Material Components
Non-Residential
Single-family
Multi-family
Overall
Sub-district A Sub-district B Municipal
Paper 25.7% 25.8% 25.6% 27.3% 24.7% 25.7%
Plastic 18.0% 15.6% 15.3% 15.6% 15.6% 16.8%
Organic 39.3% 42.3% 43.1% 42.6% 40.9% 40.7%
Yard Waste 1.6% 2.3% 2.3% 1.7% 1.8% 1.8%
Wood 3.2% 2.2% 2.6% 2.4% 2.0% 2.8%
Ferrous Metal 2.7% 2.3% 2.8% 1.4% 2.4% 2.6%
Non-Ferrous Metal 0.9% 1.2% 0.8% 1.2% 1.4% 1.0%
Glass 2.7% 1.7% 2.7% 1.7% 5.0% 2.9%
Inorganic a 5.1% 6.3% 4.7% 6.0% 5.5% 5.3%
Household Hazardous Waste
0.4% <0.1% <0.1% <0.1% <0.1% 0.3%
Totals 100% 100% 100% 100% 100% 100%
Source: SCS Engineers. Montgomery County Waste Composition Study Summary of Results, July 26, 2013. a The Inorganic category includes concrete/brick/rock, sheet rock, latex paints, fluorescent lamps, electronics, and
miscellaneous inorganic materials.
Within the major categories listed above, there are subcomponents of materials that are potentially compostable. The following table presents the composition of the overall waste stream that are potentially compostable by subcomponent based on the results of the 2012-2013 Waste Composition Study, as a percentage of the total waste stream by weight.
Table 2-2: Percent of Potential Compostable Material in Total Waste Stream (2012-2013 Waste Composition) by Sector and Overall Percentage of the Waste Stream by Weight
Material Sub Components
Non-Residential
Single-family
Multi-family
Overall
Material Components
Sub-district A
Sub-district B Municipal
Paper Non-Recyclable Paper
9.1% 11.0% 10.2% 11.3% 7.5% 9.5%
Organic Food waste 24.8% 20.5% 22.8% 19.7% 18.6% 22.8%
Yard Waste Grass, Leaves, Brush/Pruning
1.6% 2.3% 2.3% 1.7% 1.8% 1.8%
Total Compostable Materials 35.5% 33.8% 35.3% 32.7% 27.9% 34.1%
Source: SCS Engineers. Montgomery County Waste Composition Study Summary of Results, July 26, 2013.
4
4
2.2 2016-2017 Waste Composition Study The results of the 2016-2017 waste composition study were statistically analyzed and presented in a summary letter from SCS to the DEP on January 29, 2018. The letter provides more detail on the methods used to determine central tendencies and confidence intervals, as the results for some categories did not follow a normal distribution. As with the previous study in 2012-2013, there were 300 total waste samples collected; 75 samples were collected each season of the year. The waste composition study was reported separately for commercial (120 samples), single-family (140 samples), and multi-family (40 samples) waste. Single-family waste was further divided according to its origin: Sub-district A (60 samples), Sub-district B (60 samples), or Municipal (20 samples). See Section 3.1 for more information on Sub-districts. The results were compiled into an overall weighted average waste composition by weighting the results according the actual ratios of waste disposed at the County’s Transfer Station. The weight ratios were 14.30 percent for Sub-district A, 21.81 percent for Sub-district B, 2.22 percent for municipal, 13.17 percent for multi-family, and 47.5 percent for commercial waste.
A summary of results of the major material component groups is shown below in Table 2-3. The waste composition according to major material categories did not vary much across the sectors and Sub-districts, with the exception of wood waste and inorganic waste. Wood waste was a notably larger portion of commercial waste compared to the residential categories and compared to the previous study. Conversely, inorganic waste was a notably smaller portion of commercial waste compared to the residential categories, which had higher percentages than in the previous study results. There were also 64 subcomponents sorted. The three largest subcomponents by weight in the overall waste stream were similar to the previous study. Food waste – vegetative was the largest subcomponent at 17 percent. Combined with the 3 percent for food waste – non-vegetative, food waste totals 20 percent, which is only slightly lower than the previous study. The next largest subcomponents by weight were non-recyclable paper and miscellaneous organics, both at 8.5 percent. Non-recyclable paper was similar to the previous study, only decreasing by one percent. Miscellaneous organics were up slightly from 7 percent previously. Film plastic – other, which was previously 7.9 percent and the third largest by weight, went down only 0.5 percent to 7.4 percent.

5
5
Table 2-3: Summary of 2016-2017 Waste Composition by Sector and Overall (Adjusted) (Percentage of the Waste Stream by Weight)
Material Components
Non-
Residential
Single-family
Multi-family
Overall Sub-district A Sub-district B Municipal
Paper 22.2% 21.8% 22.3% 25.7% 23.6% 22.4%
Plastic 16.8% 15.0% 15.7% 16.6% 16.0% 16.1%
Organic 41.3% 42.2% 40.6% 38.0% 38.5% 40.7%
Yard Waste 2.2% 3.3% 3.6% 2.2% 2.8% 2.7%
Wood 9.9% 6.1% 4.3% 2.6% 2.8% 7.0%
Ferrous Metal 2.3% 0.7% 0.9% 2.9% 2.9% 1.9%
Non-Ferrous Metal 0.7% 1.9% 0.4% 1.4% 1.4% 0.9%
Glass 1.3% 0.9% 3.5% 4.3% 2.7% 2.0%
Inorganica 3.2% 8.0% 8.6% 6.0% 9.0% 5.9%
Household Hazardous Waste <0.1% <0.1% <0.1% <0.1% <0.1% <0.1%
Totals 100.0% 100.0% 100.0% 100.0% 100.0% 100.0%
Source: SCS Engineers. Montgomery County Waste Composition Study, Overall Report. January 29, 2018. a The Inorganic category includes concrete/brick/rock, sheet rock, latex paints, fluorescent lamps, electronics, and
miscellaneous inorganic materials.
Within the major categories listed above, there are subcomponents of materials that are compostable. The following table presents the composition of the overall waste stream that is compostable by subcomponent based on the results of the 2016-2017 Waste Composition Study, as a percentage of the total waste stream by weight.
Table 2-4: Percent Compostable Material in Total Waste Stream (2016-2017 Waste Composition) by Sector and Overall Percentage of the Waste Stream by Weight
Material Components
Material Sub Components
Non-Residential
Single-family
Multi-family
Overall
Sub-district A
Sub-district B Municipal
Paper Non-Recyclable Paper
8.3% 7.9% 9.3% 8.0% 8.2% 8.5%
Organic Food waste 21.0% 21.1 18.2 19.1% 18.9% 20.0%
Yard Waste Grass, Leaves, Brush/Pruning 2.2% 3.3% 3.6% 2.2% 2.8% 2.7%
Total Compostable 31.5% 32.3% 31.1% 29.3% 29.9% 31.2%
Source: SCS Engineers. Montgomery County Waste Composition Study Summary of Results, July 26, 2013.
6
6
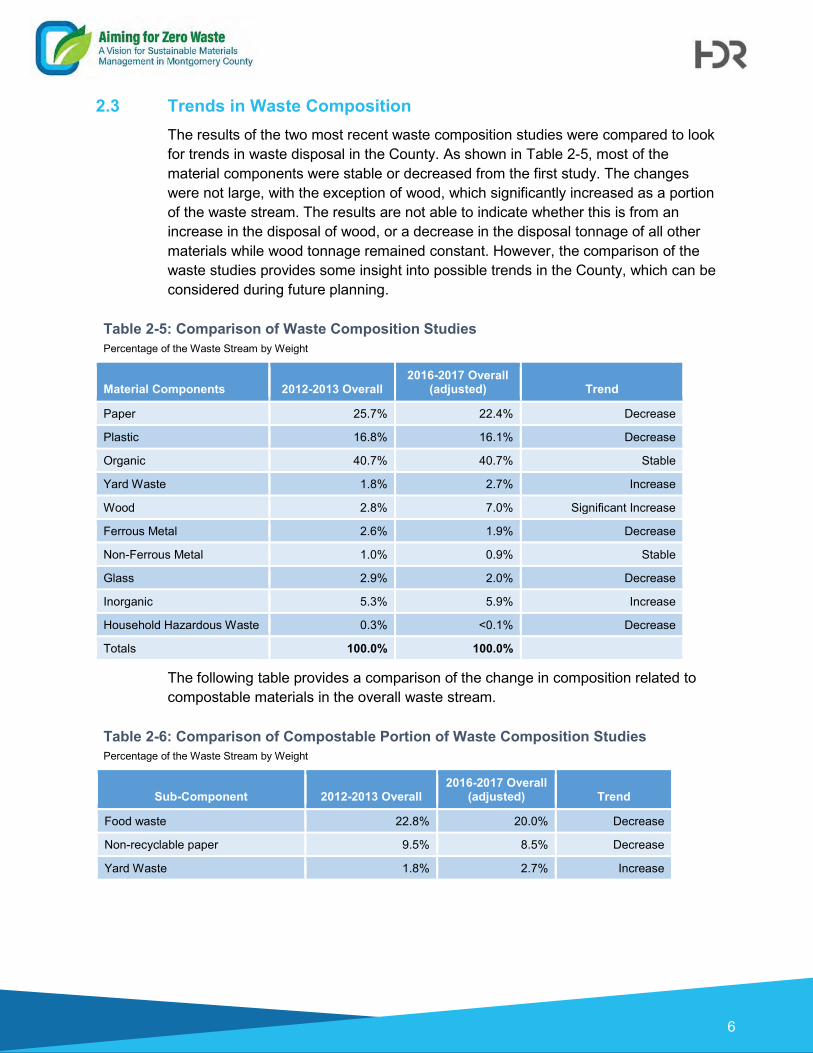
2.3 Trends in Waste Composition The results of the two most recent waste composition studies were compared to look for trends in waste disposal in the County. As shown in Table 2-5, most of the material components were stable or decreased from the first study. The changes were not large, with the exception of wood, which significantly increased as a portion of the waste stream. The results are not able to indicate whether this is from an increase in the disposal of wood, or a decrease in the disposal tonnage of all other materials while wood tonnage remained constant. However, the comparison of the waste studies provides some insight into possible trends in the County, which can be considered during future planning.
Table 2-5: Comparison of Waste Composition Studies Percentage of the Waste Stream by Weight
Material Components 2012-2013 Overall 2016-2017 Overall
(adjusted) Trend
Paper 25.7% 22.4% Decrease
Plastic 16.8% 16.1% Decrease
Organic 40.7% 40.7% Stable
Yard Waste 1.8% 2.7% Increase
Wood 2.8% 7.0% Significant Increase
Ferrous Metal 2.6% 1.9% Decrease
Non-Ferrous Metal 1.0% 0.9% Stable
Glass 2.9% 2.0% Decrease
Inorganic 5.3% 5.9% Increase
Household Hazardous Waste 0.3% <0.1% Decrease
Totals 100.0% 100.0%
The following table provides a comparison of the change in composition related to compostable materials in the overall waste stream.
Table 2-6: Comparison of Compostable Portion of Waste Composition Studies Percentage of the Waste Stream by Weight
Sub-Component 2012-2013 Overall 2016-2017 Overall
(adjusted) Trend
Food waste 22.8% 20.0% Decrease
Non-recyclable paper 9.5% 8.5% Decrease
Yard Waste 1.8% 2.7% Increase
7
7
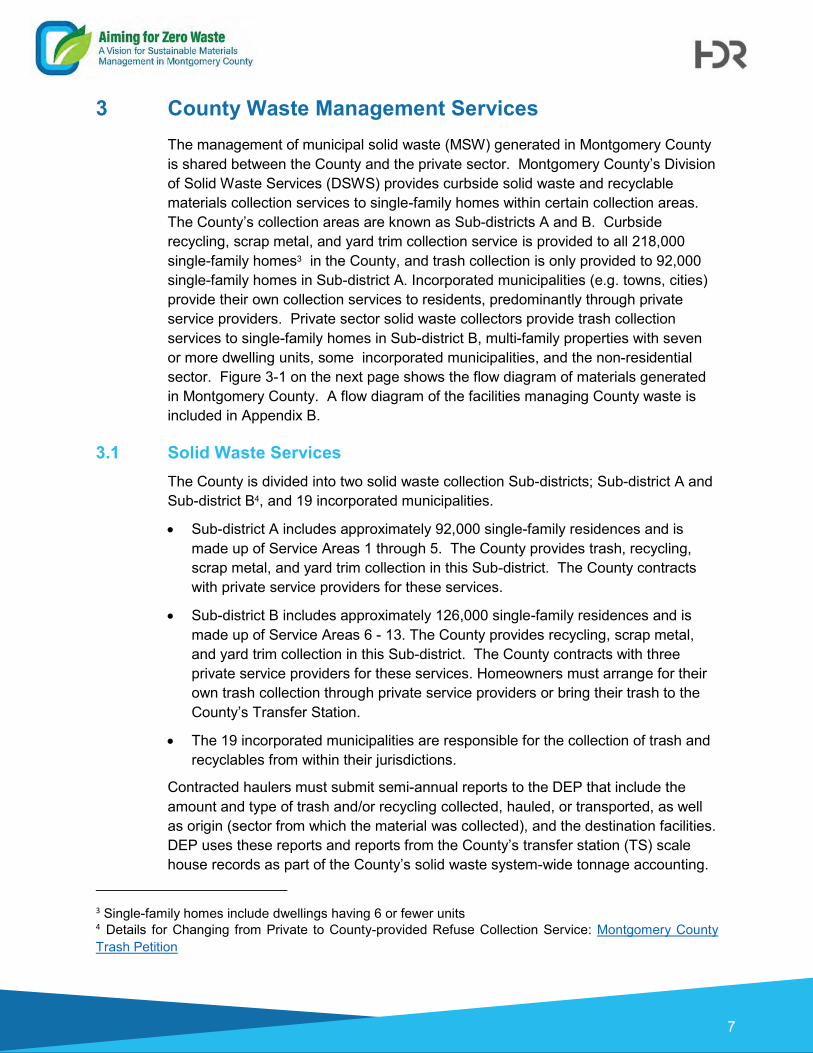
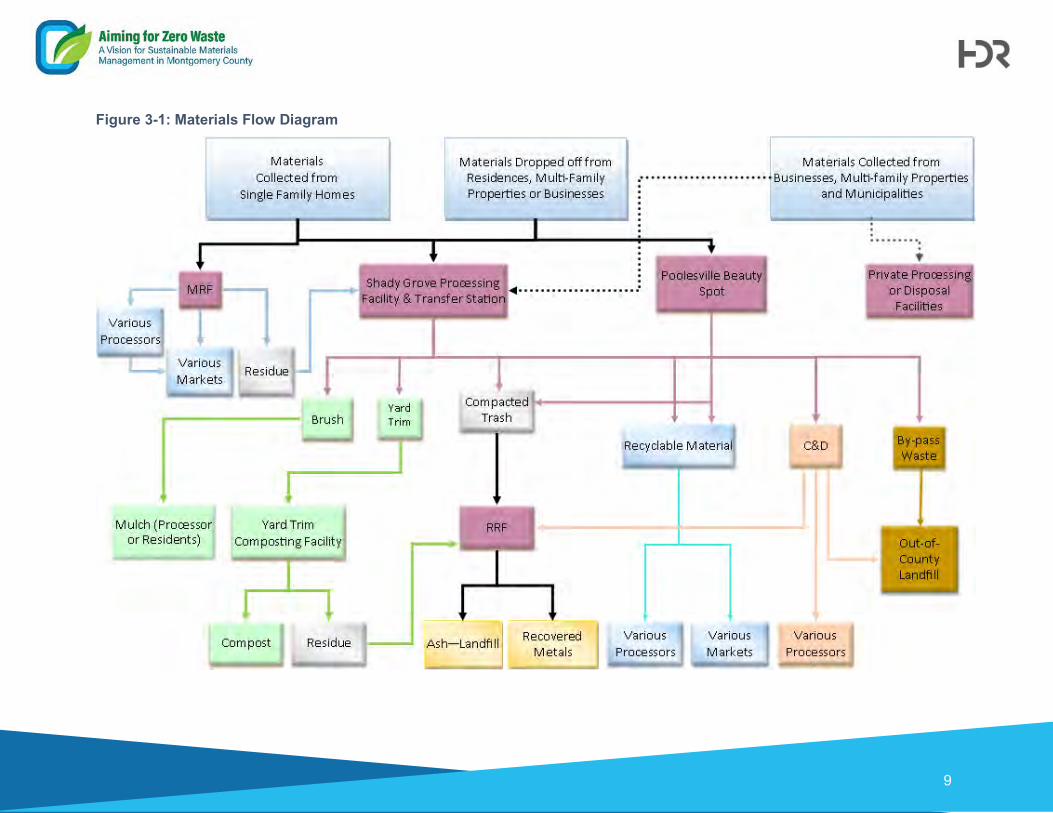
3 County Waste Management Services The management of municipal solid waste (MSW) generated in Montgomery County is shared between the County and the private sector. Montgomery County’s Division of Solid Waste Services (DSWS) provides curbside solid waste and recyclable materials collection services to single-family homes within certain collection areas. The County’s collection areas are known as Sub-districts A and B. Curbside recycling, scrap metal, and yard trim collection service is provided to all 218,000 single-family homes3 in the County, and trash collection is only provided to 92,000 single-family homes in Sub-district A. Incorporated municipalities (e.g. towns, cities) provide their own collection services to residents, predominantly through private service providers. Private sector solid waste collectors provide trash collection services to single-family homes in Sub-district B, multi-family properties with seven or more dwelling units, some incorporated municipalities, and the non-residential sector. Figure 3-1 on the next page shows the flow diagram of materials generated in Montgomery County. A flow diagram of the facilities managing County waste is included in Appendix B.
3.1 Solid Waste Services The County is divided into two solid waste collection Sub-districts; Sub-district A and Sub-district B4, and 19 incorporated municipalities.
• Sub-district A includes approximately 92,000 single-family residences and is made up of Service Areas 1 through 5. The County provides trash, recycling, scrap metal, and yard trim collection in this Sub-district. The County contracts with private service providers for these services.
• Sub-district B includes approximately 126,000 single-family residences and is made up of Service Areas 6 - 13. The County provides recycling, scrap metal, and yard trim collection in this Sub-district. The County contracts with three private service providers for these services. Homeowners must arrange for their own trash collection through private service providers or bring their trash to the County’s Transfer Station.
• The 19 incorporated municipalities are responsible for the collection of trash and recyclables from within their jurisdictions.
Contracted haulers must submit semi-annual reports to the DEP that include the amount and type of trash and/or recycling collected, hauled, or transported, as well as origin (sector from which the material was collected), and the destination facilities. DEP uses these reports and reports from the County’s transfer station (TS) scale house records as part of the County’s solid waste system-wide tonnage accounting.
3 Single-family homes include dwellings having 6 or fewer units 4 Details for Changing from Private to County-provided Refuse Collection Service: Montgomery County Trash Petition

8
8
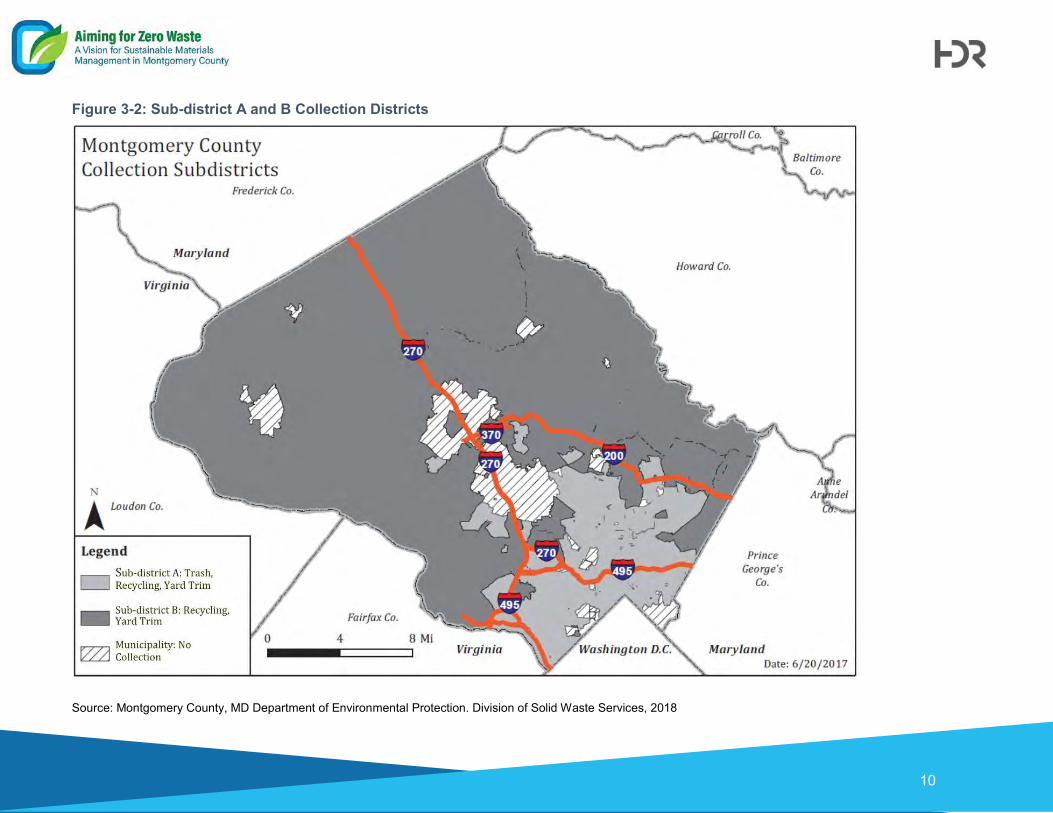
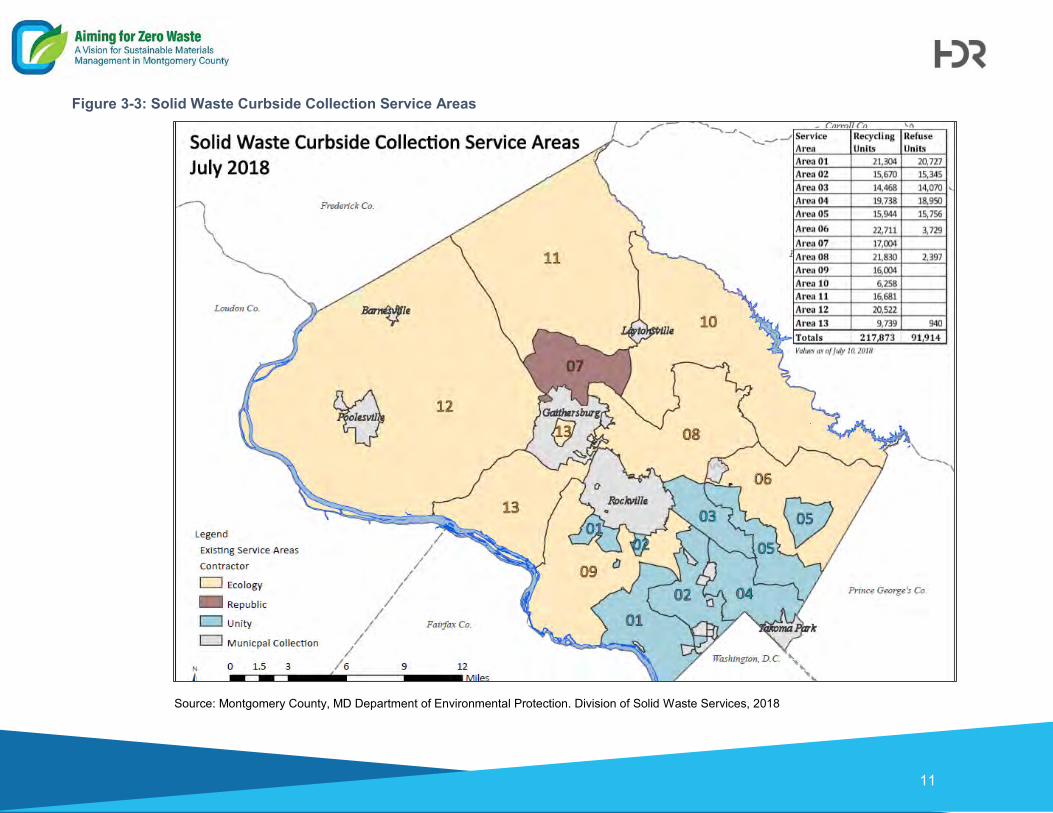
Figure 3-2 shows the boundaries of Sub-districts A and B while Figure 3-3 shows the County-provided services in each Sub-district along with the number of units receiving recycling or trash collection in each service area. Note that the County does not provide any waste collection services to incorporated municipalities.
9
9
9
Figure 3-1: Materials Flow Diagram
10
10
10
Figure 3-2: Sub-district A and B Collection Districts
Source: Montgomery County, MD Department of Environmental Protection. Division of Solid Waste Services, 2018
11
11
11
Figure 3-3: Solid Waste Curbside Collection Service Areas
Source: Montgomery County, MD Department of Environmental Protection. Division of Solid Waste Services, 2018

12
12
12
Table 3-1 below shows the services that are provided to all sectors. The County only provides collection services to single-family homes and townhomes, and dwellings having six or fewer units in Sub-districts A and B. Multi-family properties with seven or more dwelling units, municipalities, and non-residential properties are responsible to contract with their own haulers to provide services. Multi-family properties with seven or more units, incorporated municipalities, and non-residential properties may also use the Shady Grove TS drop-off areas to dispose of acceptable waste.
Table 3-1: County Collection Services Provided County Services
Provided Single-family
(6 or fewer units) Multi-family
(7 or more units) Incorporated Municipalities
Non-Residential
Trash Collection Sub-district A (weekly, once per week)
No County Service
No County Service
No County Service
Recycling Collection Sub-district A & B (weekly, once per week)
No County Service
No County Service
No County Service
Yard Trim Collection Sub-district A & B (weekly, year-round)
No County Service
non-recycled processible
waste delivered No
County Service
No County Service
Bulk Trash Collection
Sub-district A (5 scheduled pick ups
annually)
No County Service
No County Service
No County Service
Scrap Metal Collection
Sub-district A & B (scheduled pick up)
No County Service
No County Service
No County Service
Table 3-2 below presents the number of routes/week and routes/day by material for the various areas in the County by Contracted Hauler.
Table 3-2: Number of Routes per Week by District (2018) Routes/Week Average Routes/Day
District Contracted Hauler Trash Recycling Yard Trim Trash Recycling Yard Trim
Area 1 Unity Disposal & Recycling 29 30 15 5.8 6 3
Area 2 Unity Disposal & Recycling 20 20 10 4 4 2
Area 3 Unity Disposal & Recycling 20 20 10 4 4 2
Area 4 Unity Disposal & Recycling 25 25 15 5 5 3
Area 5 Unity Disposal & Recycling 20 20 10 4 4 2
Area 6 Ecology Services 4 25 10 0.8 5 2
Area 7 Republic Services 0 20 5 0 4 1
Area 8 Ecology Services 3 25 10 0.6 5 2

13
13
13
Routes/Week Average Routes/Day
District Contracted Hauler Trash Recycling Yard Trim Trash Recycling Yard Trim
Area 9 Ecology Services 0 20 10 0 4 2
Area 10 Ecology Services 0 7 5 0 1.4 1
Area 11 Ecology Services 0 15 5 0 3 1
Area 12 Ecology Services 0 20 5 0 4 1
Area 13 Ecology Services 1 13 5 0.2 2.6 1
TOTAL 122 260 115 24.4 52 23
Source: MSW Consultants, Information provided by Montgomery County (August 2018)
3.1.1 Relevant Regulations
Montgomery County’s solid waste management programs are governed by federal, state, and local regulations. Major federal laws and regulations can be seen in Table 3-3.
Table 3-3: Federal Laws and Regulations Governing Solid Waste Management
Federal Laws Primary Objective
Resource Conservation and Recovery Act (RCRA) Creates the framework for the proper management of hazardous and non-hazardous solid waste from “cradle-to-grave”. Promotes the recycling and reuse of recoverable material.
Comprehensive Environmental Response, Compensation and Liability Act (CERCLA) Superfund Law
Identification and remediation of waste disposal sites and assigns liability for contamination.
Clean Water Act Addresses the discharge of wastewater and runoff from solid waste management facilities into surface waters.
Clean Air Act Addresses and authorizes regulations for emissions from waste disposal facilities.
Safe Drinking Water Act Provides and establishes maximum contaminant levels for parameters in ground water.
Federal Emergency Management Act Prohibits siting of landfills within 100 year flood plain.
Asbestos Control- Asbestos Hazard Emergency Response Act Requires control with asbestos materials and requires
completion of a training program by those who do asbestos-related work with schools.
Endangered Species Act Prohibits construction or operation of facilities that would result in the “taking” of an endangered or threatened wildlife species, or in the destruction of their critical habitat.
14
14
14
Federal Laws Primary Objective
Mercury-Containing and Rechargeable Battery Act Requires the collection and recycling, or proper disposal, of used nickel cadmium batteries, small sealed lead-acid batteries, and certain other batteries.
Public Utilities Regulatory Policies Act (PURPA) Encourages co-generators and small power producers, such as municipal solid waste combustors, to supplement their existing electrical utility capacity. The Federal Energy Regulatory Commission is responsible for implementing regulations and setting limits on the power output of these facilities.
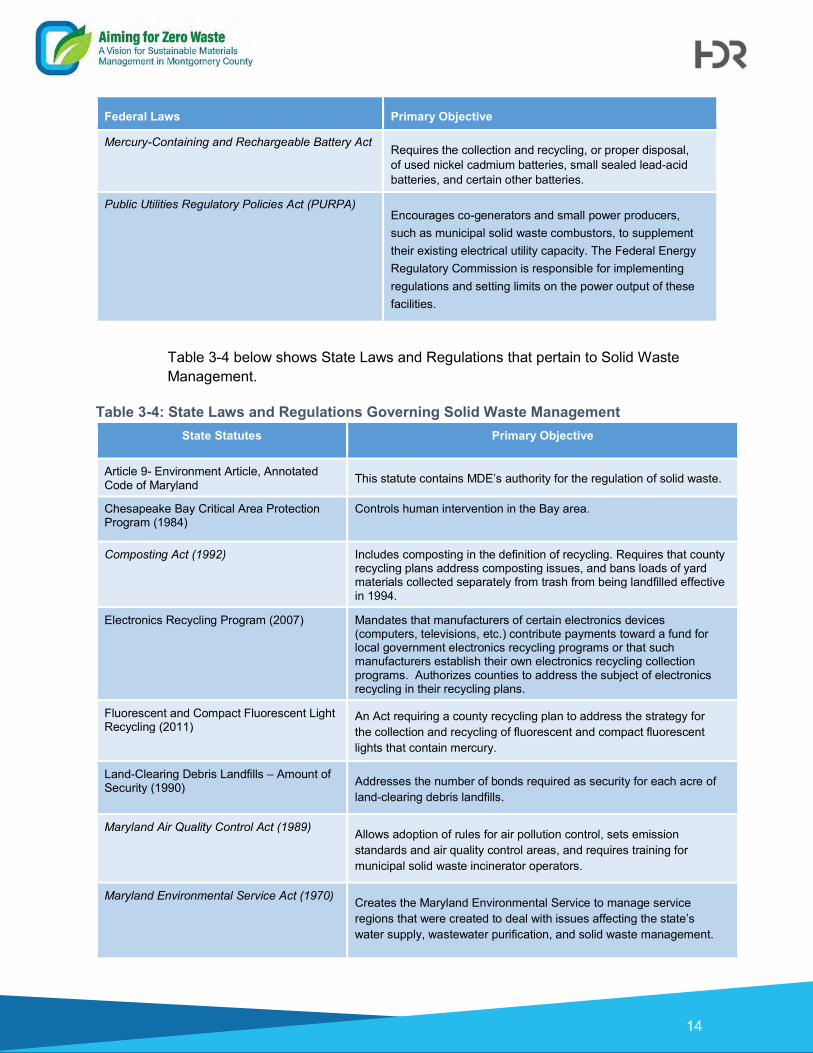
Table 3-4 below shows State Laws and Regulations that pertain to Solid Waste Management.
Table 3-4: State Laws and Regulations Governing Solid Waste Management State Statutes Primary Objective
Article 9- Environment Article, Annotated Code of Maryland This statute contains MDE’s authority for the regulation of solid waste.
Chesapeake Bay Critical Area Protection Program (1984)
Controls human intervention in the Bay area.
Composting Act (1992) Includes composting in the definition of recycling. Requires that county recycling plans address composting issues, and bans loads of yard materials collected separately from trash from being landfilled effective in 1994.
Electronics Recycling Program (2007) Mandates that manufacturers of certain electronics devices (computers, televisions, etc.) contribute payments toward a fund for local government electronics recycling programs or that such manufacturers establish their own electronics recycling collection programs. Authorizes counties to address the subject of electronics recycling in their recycling plans.
Fluorescent and Compact Fluorescent Light Recycling (2011)
An Act requiring a county recycling plan to address the strategy for the collection and recycling of fluorescent and compact fluorescent lights that contain mercury.
Land-Clearing Debris Landfills – Amount of Security (1990)
Addresses the number of bonds required as security for each acre of land-clearing debris landfills.
Maryland Air Quality Control Act (1989) Allows adoption of rules for air pollution control, sets emission
standards and air quality control areas, and requires training for municipal solid waste incinerator operators.
Maryland Environmental Service Act (1970)
Creates the Maryland Environmental Service to manage service regions that were created to deal with issues affecting the state’s water supply, wastewater purification, and solid waste management.

15
15
15
State Statutes Primary Objective
Maryland Landfill Financial Assurance Law (1997)
Sets forth financial assurance requirements for landfills in conformance with the requirements of federal regulations.
Maryland Landfill Siting Law (1994) Describes the requirements for public hearings regarding landfill
siting, and addresses permitting requirements and security requirements. Explains the requirements for submissions of plans and documents necessary to conduct a technical review and to approve proposed facilities.
Maryland Recycling Act (1988) Requires that by 1994 each jurisdiction with a population greater than
150,000 reduce its solid waste stream by at least 20% through recycling (15% for jurisdictions with lesser populations). The recycling rate calculation includes both residential and commercial waste and recycling tonnages. House Bill 929 (2012) amended the rates to 35% for Counties with a population greater than 150,000 or 20% for a county with less than 150,000. The law requires full implementation by December 31, 2015.
Maryland Senate Joint Resolution 6 (2000) Sets a voluntary statewide goal of 40% waste diversion by 2005, with a
credit of up to 5% for jurisdictions engaged in specified waste prevention activities. “Waste diversion” is defined as recycling rate plus waste prevention credit. Mandatory recycling rates established by the Maryland Recycling Act of 1988 remain in effect.
Maryland State Implementation Plan (SIP) (Ongoing)
Limits emissions from specific pollutant sources to prevent air quality from falling below National Ambient Air Quality Standards (NAAQS).
Maryland Nonpoint Source Pollution Control Laws (1990-1994)
Allows for the adoption of criteria and procedures by counties and soil conservation districts to implement soil erosion control programs and for counties and municipalities to implement storm water management programs.
Maryland Used Oil Recycling Act (1997) Requires MDE to develop programs to educate the public on oil
recycling and to designate used oil collection facilities. It also prohibits disposal of used oil into sewers, drainage systems, or natural waters.
Maryland Wastewater Treatment Law (1987) Requires permits prior to installing, altering, or extending a water supply system or refuse disposal system (including a landfill, waste transfer station, incinerator, or other waste processing facility)
Medical Waste Legislation (1988) Regulates identification, record keeping, treatment, transport and disposal of special medical wastes; infectious wastes are prohibited in solid waste landfills in the state.
16
16
16
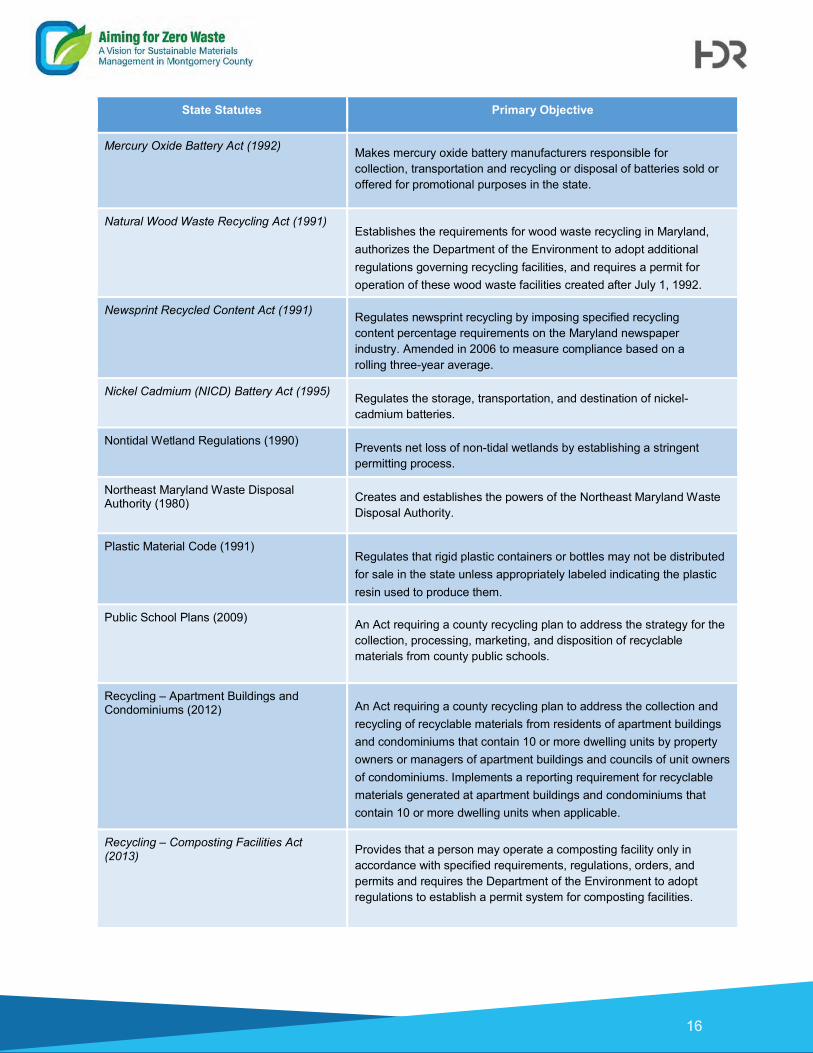
State Statutes Primary Objective
Mercury Oxide Battery Act (1992) Makes mercury oxide battery manufacturers responsible for collection, transportation and recycling or disposal of batteries sold or offered for promotional purposes in the state.
Natural Wood Waste Recycling Act (1991) Establishes the requirements for wood waste recycling in Maryland, authorizes the Department of the Environment to adopt additional regulations governing recycling facilities, and requires a permit for operation of these wood waste facilities created after July 1, 1992.
Newsprint Recycled Content Act (1991) Regulates newsprint recycling by imposing specified recycling
content percentage requirements on the Maryland newspaper industry. Amended in 2006 to measure compliance based on a rolling three-year average.
Nickel Cadmium (NICD) Battery Act (1995) Regulates the storage, transportation, and destination of nickel-cadmium batteries.
Nontidal Wetland Regulations (1990) Prevents net loss of non-tidal wetlands by establishing a stringent
permitting process.
Northeast Maryland Waste Disposal Authority (1980)
Creates and establishes the powers of the Northeast Maryland Waste Disposal Authority.
Plastic Material Code (1991) Regulates that rigid plastic containers or bottles may not be distributed
for sale in the state unless appropriately labeled indicating the plastic resin used to produce them.
Public School Plans (2009) An Act requiring a county recycling plan to address the strategy for the
collection, processing, marketing, and disposition of recyclable materials from county public schools.
Recycling – Apartment Buildings and Condominiums (2012)
An Act requiring a county recycling plan to address the collection and recycling of recyclable materials from residents of apartment buildings and condominiums that contain 10 or more dwelling units by property owners or managers of apartment buildings and councils of unit owners of condominiums. Implements a reporting requirement for recyclable materials generated at apartment buildings and condominiums that contain 10 or more dwelling units when applicable.
Recycling – Composting Facilities Act (2013)
Provides that a person may operate a composting facility only in accordance with specified requirements, regulations, orders, and permits and requires the Department of the Environment to adopt regulations to establish a permit system for composting facilities.

17
17
17
State Statutes Primary Objective
Recycling – Special Events (2014) An Act requiring a county recycling plan to address the collection and
recycling of recyclable materials from special events by October 1, 2015. Amended in 2017 to require a county government to provide a written statement before issuing a certain permit for a special event after October 1, 2017.
Scrap Tire Law (1992)
Prohibits the disposal of scrap tires in landfills after January 1, 1994, and creates a licensing system for the management of scrap tires. Establishes requirements for implementing a scrap tire recycling system, licensing haulers and collection facilities. Establishes the Tire Clean-Up and Recycling Fund.
Sludge Application (1993) Regulates land application procedures for sludge to maintain the public
health.
Telephone Directory Recycling Act (1991)
Requires telephone directory publishers to meet specified recycling content percentage requirements for telephone directories.
Waste Reduction and Resource Recovery Plan for Maryland (2017)
Creates a policy to minimize environmental impacts of materials management, conserve in-State disposal capacity, make optimal use of resources and create an environmentally and economically sustainable system of materials management.
Water and Sewage Plan Act (1983)
Requires the preparation and submission of solid waste management plans by counties and establishes the minimum requirements of such plans.
Yard Waste Act (1994)
Bans separately collected yard waste from disposal facilities after October 1994.
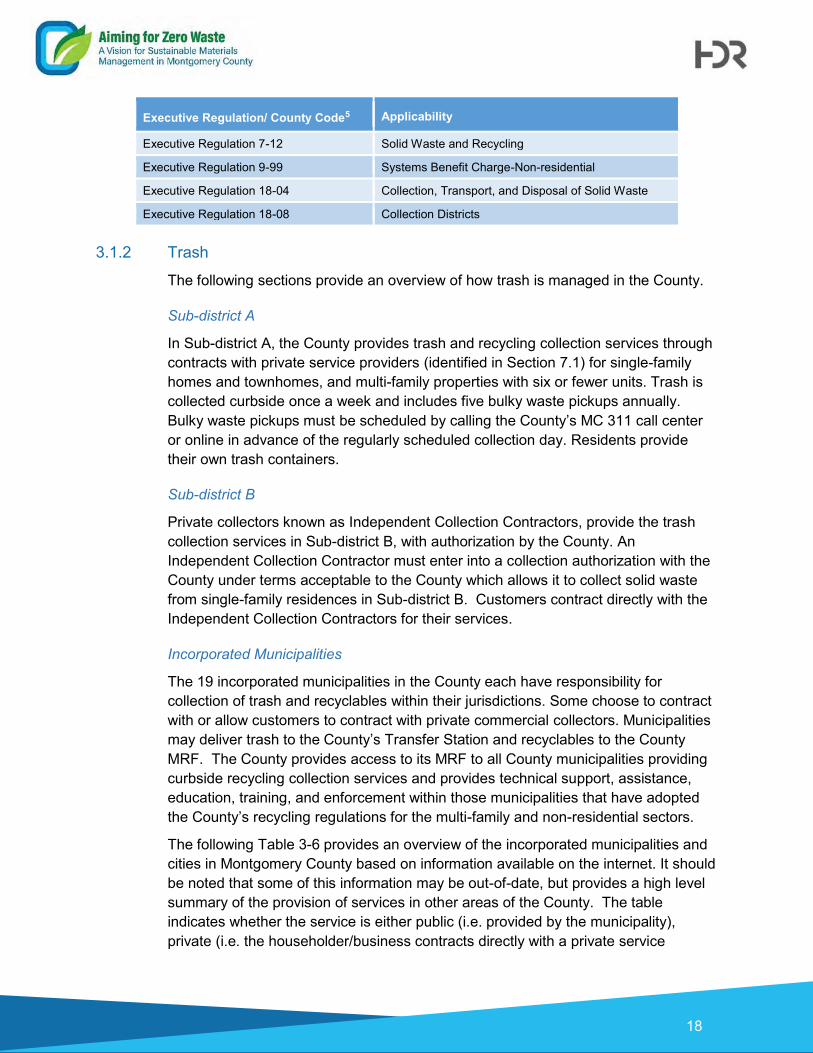
Table 3-5 below shows County Solid Waste Regulations that pertain to Solid Waste Management.
Table 3-5: County Solid Waste Regulations/ County Code
Executive Regulation/ County Code5 Applicability
County Code: Chapter 48 Solid Waste Regulations
County Code: 11B-56 Procurement of goods containing recycled materials
County Council Bill 28-16 Composting and Food Waste Diversion
Executive Regulation 1-15 Residential and Commercial Recycling
Executive Regulation 5-13AM Solid Waste Tonnage Reporting
Executive Regulation 6-99AM Expansion- Leaf Vacuuming Collection District
5 Montgomery County Executive Regulations
Montgomery County Code Chapter48-Solid-Wastes.pdf
18
18
18
Executive Regulation/ County Code5 Applicability
Executive Regulation 7-12 Solid Waste and Recycling
Executive Regulation 9-99 Systems Benefit Charge-Non-residential
Executive Regulation 18-04 Collection, Transport, and Disposal of Solid Waste
Executive Regulation 18-08 Collection Districts
3.1.2 Trash
The following sections provide an overview of how trash is managed in the County.
Sub-district A
In Sub-district A, the County provides trash and recycling collection services through contracts with private service providers (identified in Section 7.1) for single-family homes and townhomes, and multi-family properties with six or fewer units. Trash is collected curbside once a week and includes five bulky waste pickups annually. Bulky waste pickups must be scheduled by calling the County’s MC 311 call center or online in advance of the regularly scheduled collection day. Residents provide their own trash containers.
Sub-district B
Private collectors known as Independent Collection Contractors, provide the trash collection services in Sub-district B, with authorization by the County. An Independent Collection Contractor must enter into a collection authorization with the County under terms acceptable to the County which allows it to collect solid waste from single-family residences in Sub-district B. Customers contract directly with the Independent Collection Contractors for their services.
Incorporated Municipalities
The 19 incorporated municipalities in the County each have responsibility for collection of trash and recyclables within their jurisdictions. Some choose to contract with or allow customers to contract with private commercial collectors. Municipalities may deliver trash to the County’s Transfer Station and recyclables to the County MRF. The County provides access to its MRF to all County municipalities providing curbside recycling collection services and provides technical support, assistance, education, training, and enforcement within those municipalities that have adopted the County’s recycling regulations for the multi-family and non-residential sectors.
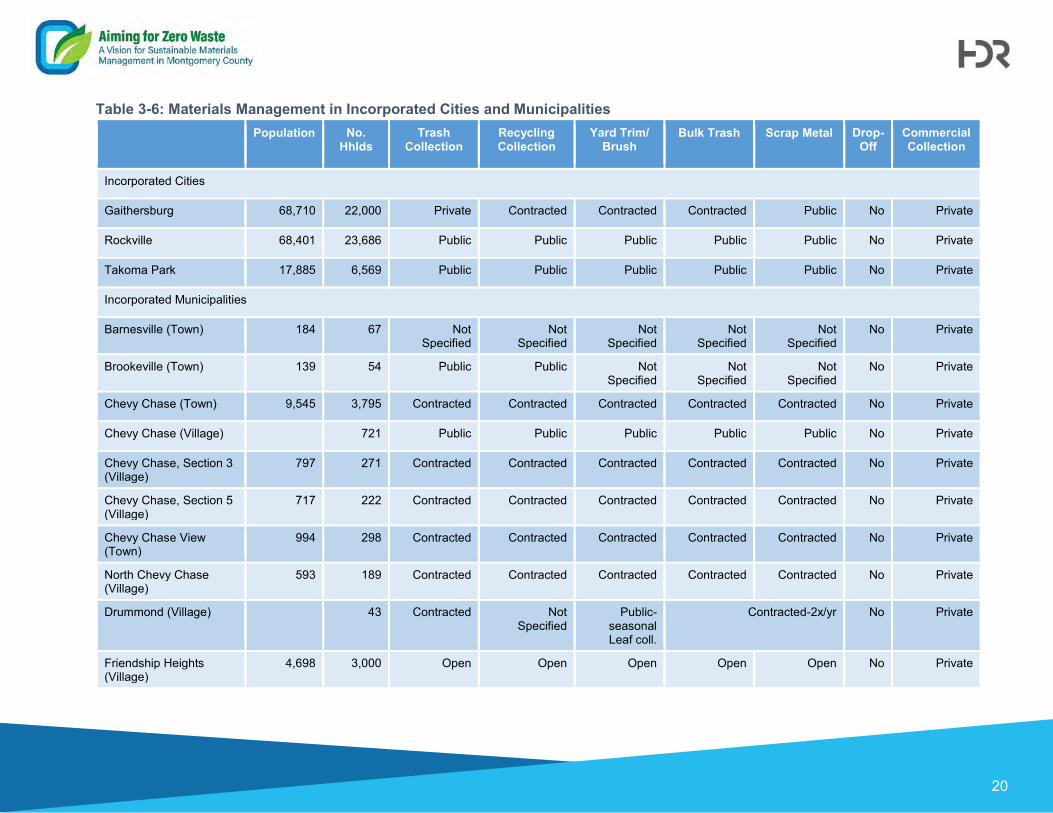
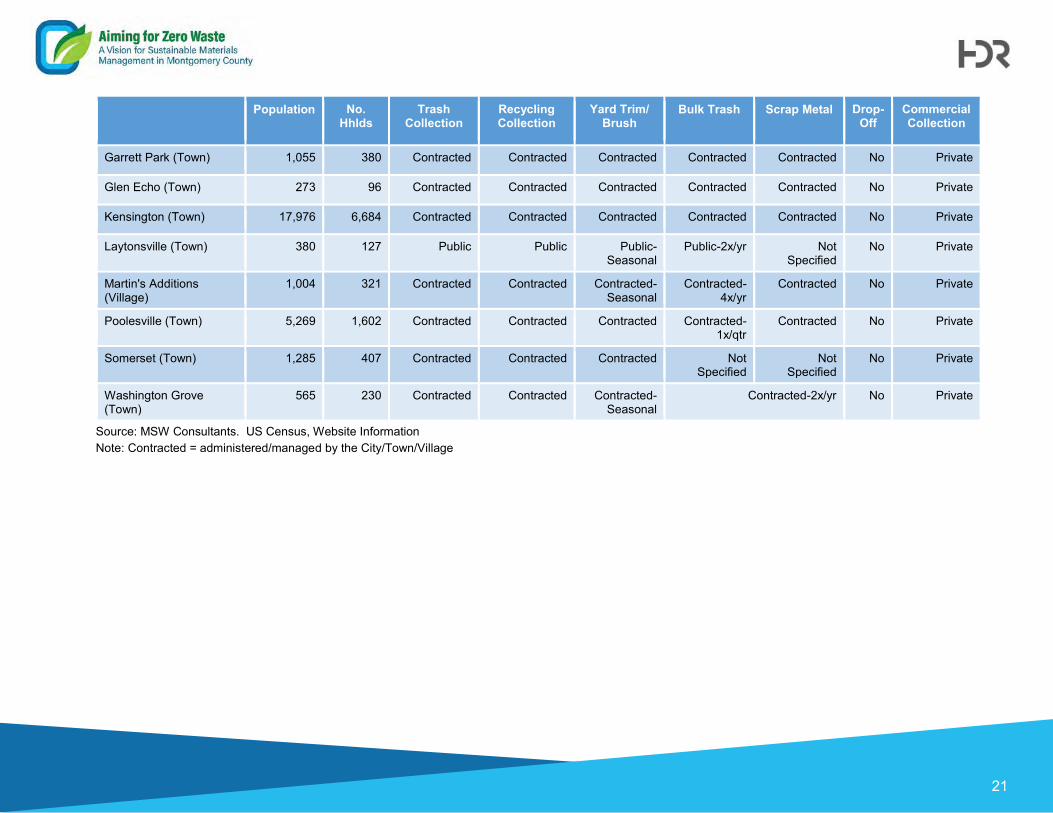
The following Table 3-6 provides an overview of the incorporated municipalities and cities in Montgomery County based on information available on the internet. It should be noted that some of this information may be out-of-date, but provides a high level summary of the provision of services in other areas of the County. The table indicates whether the service is either public (i.e. provided by the municipality), private (i.e. the householder/business contracts directly with a private service
19
19
19
provider for collection) or contracted (i.e. the municipality contracts with a private service provider to collect material).
Multi-family and Non-Residential
Residential properties with seven or more dwelling units are considered multi-family properties. Commercial, industrial, and institutional properties, including non-profit organizations, as well as government facilities at the federal, state and local levels, are categorized as non-residential properties. Trash collection and disposal for both multi-family and industrial properties are the responsibility of the property owners, who often contract with a licensed private collection company or self-haul waste to a waste acceptance facility.
20 20
Table 3-6: Materials Management in Incorporated Cities and Municipalities Population No.
Hhlds Trash
Collection Recycling Collection
Yard Trim/ Brush
Bulk Trash Scrap Metal Drop-Off
Commercial Collection
Incorporated Cities
Gaithersburg 68,710 22,000 Private Contracted Contracted Contracted Public No Private
Rockville 68,401 23,686 Public Public Public Public Public No Private
Takoma Park 17,885 6,569 Public Public Public Public Public No Private
Incorporated Municipalities
Barnesville (Town) 184 67 Not Specified
Not Specified
Not Specified
Not Specified
Not Specified
No Private
Brookeville (Town) 139 54 Public Public Not Specified
Not Specified
Not Specified
No Private
Chevy Chase (Town) 9,545 3,795 Contracted Contracted Contracted Contracted Contracted No Private
Chevy Chase (Village)
721 Public Public Public Public Public No Private
Chevy Chase, Section 3 (Village)
797 271 Contracted Contracted Contracted Contracted Contracted No Private
Chevy Chase, Section 5 (Village)
717 222 Contracted Contracted Contracted Contracted Contracted No Private
Chevy Chase View (Town)
994 298 Contracted Contracted Contracted Contracted Contracted No Private
North Chevy Chase (Village)
593 189 Contracted Contracted Contracted Contracted Contracted No Private
Drummond (Village)
43 Contracted Not Specified
Public-seasonal Leaf coll.
Contracted-2x/yr No Private
Friendship Heights (Village)
4,698 3,000 Open Open Open Open Open No Private
21 21
Population No. Hhlds
Trash Collection
Recycling Collection
Yard Trim/ Brush
Bulk Trash Scrap Metal Drop-Off
Commercial Collection
Garrett Park (Town) 1,055 380 Contracted Contracted Contracted Contracted Contracted No Private
Glen Echo (Town) 273 96 Contracted Contracted Contracted Contracted Contracted No Private
Kensington (Town) 17,976 6,684 Contracted Contracted Contracted Contracted Contracted No Private
Laytonsville (Town) 380 127 Public Public Public-Seasonal
Public-2x/yr Not Specified
No Private
Martin's Additions (Village)
1,004 321 Contracted Contracted Contracted-Seasonal
Contracted-4x/yr
Contracted No Private
Poolesville (Town) 5,269 1,602 Contracted Contracted Contracted Contracted-1x/qtr
Contracted No Private
Somerset (Town) 1,285 407 Contracted Contracted Contracted Not Specified
Not Specified
No Private
Washington Grove (Town)
565 230 Contracted Contracted Contracted-Seasonal
Contracted-2x/yr No Private
Source: MSW Consultants. US Census, Website Information Note: Contracted = administered/managed by the City/Town/Village
22
3.1.3 Recycling
The following sections provide an overview of how recycling6 is managed in the County.
Residential – Single-family
The County provides weekly curbside dual stream collection of recyclables for all single-family homes in both Sub-districts A and B through contracts with private service providers. Residents who receive curbside recycling collection from the County also receive scrap metal and yard trim collection. The County provides 22-gallon blue bins for aluminum products, cans, glass bottles and jars, and plastics bottles and containers. 64-gallon wheeled carts are provided for mixed paper and cardboard.
Multi-family and Non-Residential
Recycling collection for multi-family and non-residential properties may be accomplished via self-haul, or may be contracted directly between the owners and privately contracted County-licensed collectors. The same materials are mandated for recycling in the single-family residential recycling program, and the same materials are banned from trash as in the single-family residential program. Collectors are required to formally notify, either electronically or in writing, any generators that are placing unacceptable materials in the recycling collection. Collectors deliver recyclable material to private facilities both within and outside of the County. The County offers and provides recycling containers to multi-family residents, and to businesses at no additional cost.
3.1.4 Leaf and Yard Trim
All single-family residences in both Sub-districts are provided yard trim recycling collection once per week year-round, with a maximum of 45 pounds for each container set-out. Materials may not be set out in plastic bags. Residents can set out yard trimmings in labeled containers, or paper yard trim bags. Limbs that are not in labeled containers must be bundled.
Montgomery County Department of Transportation (MCDOT) provides seasonal (generally November through January) collection of leaves from within the Leaf Collection District, shown in Figure 3-4. Leaves are vacuumed from public rights-of-way and transported to the Montgomery County Yard Trim Composting Facility for composting. The County has developed a procedure that requires the support of not less than 80% of the households in the neighborhood/area before opting in or out of the Leaf Collection District.
The County also promotes grass cycling and backyard composting to further reduce the amount of yard trim requiring recycling collection. Compost bins for backyard
6 More information about the materials accepted in the County’s curbside collection program can be found
at: County Executive Regulation No. 1 – 15.
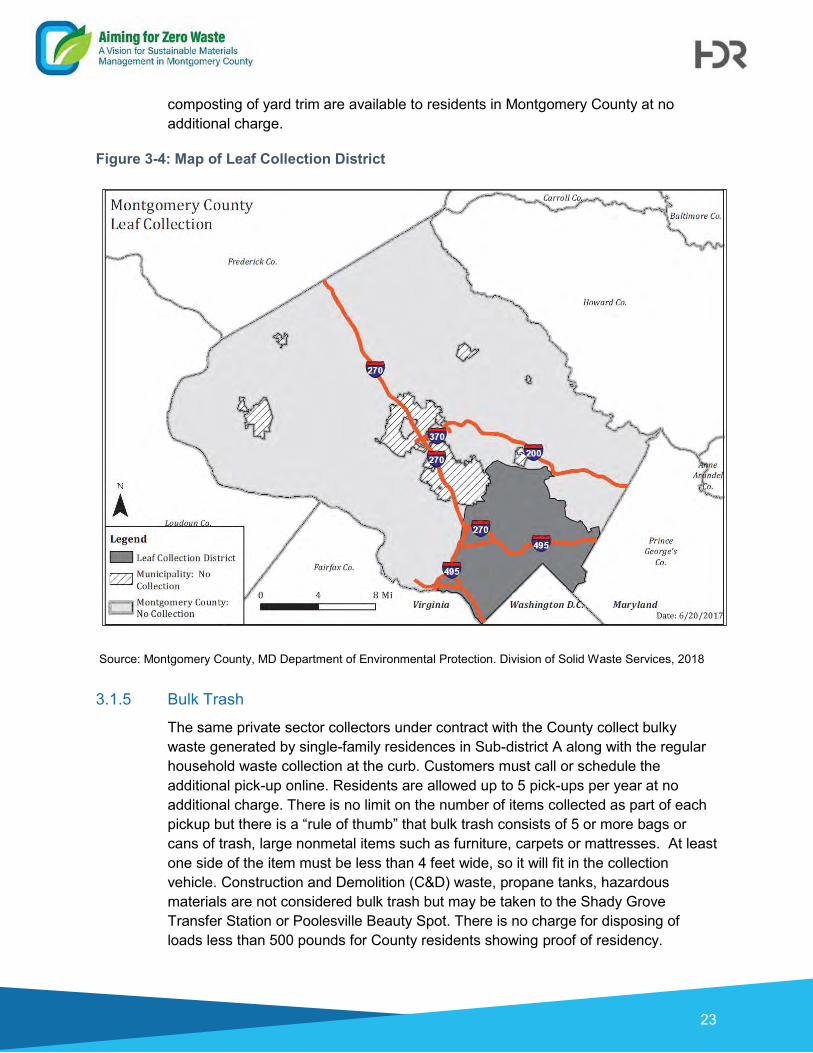
23
composting of yard trim are available to residents in Montgomery County at no additional charge.
Figure 3-4: Map of Leaf Collection District
Source: Montgomery County, MD Department of Environmental Protection. Division of Solid Waste Services, 2018
3.1.5 Bulk Trash
The same private sector collectors under contract with the County collect bulky waste generated by single-family residences in Sub-district A along with the regular household waste collection at the curb. Customers must call or schedule the additional pick-up online. Residents are allowed up to 5 pick-ups per year at no additional charge. There is no limit on the number of items collected as part of each pickup but there is a “rule of thumb” that bulk trash consists of 5 or more bags or cans of trash, large nonmetal items such as furniture, carpets or mattresses. At least one side of the item must be less than 4 feet wide, so it will fit in the collection vehicle. Construction and Demolition (C&D) waste, propane tanks, hazardous materials are not considered bulk trash but may be taken to the Shady Grove Transfer Station or Poolesville Beauty Spot. There is no charge for disposing of loads less than 500 pounds for County residents showing proof of residency.

24
Those residents living in Sub-district B or in incorporated municipalities must make their own arrangements for collection of bulk trash or take it to the Shady Grove Processing Facility and Transfer Station or the Poolesville Beauty Spot.
3.1.6 Scrap Metal
Residents that receive recycling collection from the County are also provided curbside scrap metal recycling collection. County-contracted collectors collect scrap metal generated by single-family residences in Sub-districts A and B during the weekly recycling collection route. Customers must call 311 or schedule the additional pickup online. There is no annual limit on scrap metal recycling requests. Scrap metal collected curbside must be too big to fit in a standard trash can or bag (since these items will be capture by the magnets at the RRF) and must be made of more than 50 percent metal. Scrap metal includes large household appliances, bicycles, lawnmowers, and more.
3.1.7 Drop-off
The County provides receptacles for self-hauled recyclables at the Shady Grove Processing Facility and Transfer Station. The Shady Grove Transfer Station only accepts waste that was generated in Montgomery County. Specific information on the Shady Grove Drop-off Center is discussed in Section 4.2.
DEP holds one-day confidential paper shredding and recycling and donation of reusable clothing and household items events at various locations in the Fall and Spring. For residents that cannot make the events, Clean Cut Shredding located in Rockville, MD, offers on-site document shredding for free. 7
3.2 Tons of Materials Managed In 2017, 1,378,396 tons of waste was generated in Montgomery, of which 1,103,051 tons were generated by the residential and commercial sectors (not including C&D waste). Table 3-7 presents a breakdown of the materials recycled, recovered and disposed by sector and indicates those materials that are considered recyclable under the Maryland Recycling Act8 and therefore count towards the recycling rate. See Appendix B for a description of how these materials are managed.
7 https://www.montgomerycountymd.gov/sws/programs/paper-shredding.html (accessed August 15, 2018)
8More information can be found: Maryland Recycling Act (MRA) Guidelines Survey 2017

25
Table 3-7: Tons of Materials Generated in Montgomery County (CY 2017) Material Category Tons
Total Waste Generated in the County (Residential, Commercial, C&D) 1,378,396
A C&D Waste (Recycled, Landfilled, Burned) 275,345
B Residential & Commercial Waste Recycling (counts toward recycling rate) 369,125
C Residential & Commercial Yard Trim (counts toward recycling rate) 84,489
D Residential & Commercial MSW Disposed (Burned, Landfilled) 649,437
E Total Residential and Commercial Waste Generated (not including C&D) 1,103,051
Recovered Materials
F Metal Recovered from RRF attributed to Residential/Commercial (counts toward recycling) 7,039
G Metal Recovered from RRF attributed to C&D (does not count toward recycling rate) 1,023
H Ash Recycled from RRF attributed to Residential/Commercial (counts toward recycling rate) 156,080
I Ash Recycled from RRF attributed to C&D (does not count toward recycling rate) 22,676
J Total Recycled (Recycling, Yard Trim, Metal, Ash) (B+C+F+H) 616,733
K Total Generated (E) 1,103,051
L Recycling Rate (J/K) 55.91%
Source: Montgomery County, MD Department of Environmental Protection. Division of Solid Waste Services,
September 2018
26
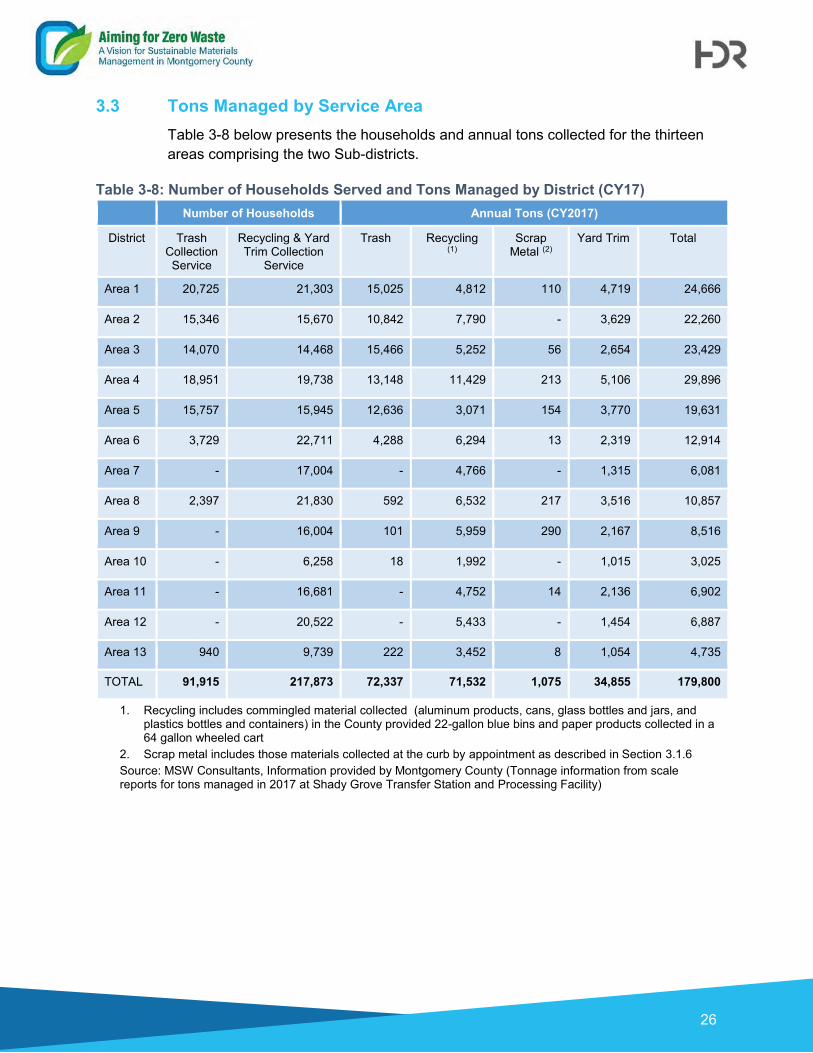
3.3 Tons Managed by Service Area Table 3-8 below presents the households and annual tons collected for the thirteen areas comprising the two Sub-districts.
Table 3-8: Number of Households Served and Tons Managed by District (CY17) Number of Households Annual Tons (CY2017)
District Trash Collection Service
Recycling & Yard Trim Collection
Service
Trash Recycling (1)
Scrap Metal (2)
Yard Trim Total
Area 1 20,725 21,303 15,025 4,812 110 4,719 24,666
Area 2 15,346 15,670 10,842 7,790 - 3,629 22,260
Area 3 14,070 14,468 15,466 5,252 56 2,654 23,429
Area 4 18,951 19,738 13,148 11,429 213 5,106 29,896
Area 5 15,757 15,945 12,636 3,071 154 3,770 19,631
Area 6 3,729 22,711 4,288 6,294 13 2,319 12,914
Area 7 - 17,004 - 4,766 - 1,315 6,081
Area 8 2,397 21,830 592 6,532 217 3,516 10,857
Area 9 - 16,004 101 5,959 290 2,167 8,516
Area 10 - 6,258 18 1,992 - 1,015 3,025
Area 11 - 16,681 - 4,752 14 2,136 6,902
Area 12 - 20,522 - 5,433 - 1,454 6,887
Area 13 940 9,739 222 3,452 8 1,054 4,735
TOTAL 91,915 217,873 72,337 71,532 1,075 34,855 179,800
1. Recycling includes commingled material collected (aluminum products, cans, glass bottles and jars, and plastics bottles and containers) in the County provided 22-gallon blue bins and paper products collected in a 64 gallon wheeled cart
2. Scrap metal includes those materials collected at the curb by appointment as described in Section 3.1.6 Source: MSW Consultants, Information provided by Montgomery County (Tonnage information from scale reports for tons managed in 2017 at Shady Grove Transfer Station and Processing Facility)

27
3.4 Waste Generation Rates The following table presents a breakdown of the waste generation by the three sectors in the County. Over 50 percent of waste in Montgomery County is generated by the non-residential sector (i.e. businesses) as presented in Table 3-9 below.
Table 3-9: Breakdown of Waste Generated in Montgomery County by Sector (CY 2017) Sector Percent of Total Waste Generated
Single-family 35.70%
Multi-family 9.49%
Non-Residential 54.81%
Source: Montgomery County, MD Department of Environmental Protection. Division of Solid Waste Services, Capture Model CY17
In 2017, generation rates ranged from 974 lbs/capita per year to 2,168 lbs/employee per year as presented in Table 3-10.
Table 3-10: Residential and Non-Residential Waste Generation Rates (CY2017) Residential Tons Population lbs/capita/day lbs/capita/year
508,738 1,043,750 2.67 974 Non-Residential Tons Employees lbs/employee/day lbs/employee/year
594,314 548,200 5.94 2,168 Source: Montgomery County, MD Department of Environmental Protection. Division of Solid Waste
Services, Capture Model CY17
3.5 Community Engagement Montgomery County has several outreach and educational programs to inform residents of single-family and multi-family properties, businesses, non-profit organizations, government facilities, and schools about proper management of solid waste including reducing waste, reusing items and materials, recycling, and buying recycled. The programs currently in place focus on single-family residential recycling, multi-family recycling, non-residential recycling, yard trim composting and grass cycling, waste reduction, reuse and donation programs, buying recycled items, and HHW reduction.
The following are examples of outreach and engagement activities conducted by the County or available to stakeholders:
• Tours of the County’s facilities: Shady Grove Processing Facility and Transfer Station, the Materials Recovery Facility (MRF), the Yard Trim Composting Facility, and the Resource Recovery Facility (RRF).
• Brochures, flyers, fact sheets, posters, and videos to provide information on specific programs in English and Spanish (some materials are also available in up to nine additional languages). Specialized handbooks and guides are distributed to single-family residents, multi-family properties and residents, and businesses to better understand current programs and disposal options.
28
• Video presentations are also available as an educational tool for single-family, multi-family, and commercial waste management.
• Electronic newsletters geared to community and civic leaders and residents, business owners, managers and employees, government facilities managers and employees, non-profit organizations, multi-family property managers, staff and residents.
• Solid Waste Services website (https://www.montgomerycountymd.gov/sws/)
• Social media – DSWS uses Twitter (@TalkingTrashMC), Facebook (MCRecycles), Flickr, YouTube and a blog. DEP utilizes Twitter (@MyGreenMC), Facebook (MyGreenMontgomery), Instagram (MyGreenMC), Pinterest, YouTube, Flickr and a blog.
• Compost bins and training sessions to promote grass cycling and composting.
• Seminars and workshops on reducing waste, reuse, recycling, buying recycled and composting are also available.
The County also has a number of programs in place to promote recycling including:
• The Recycling Volunteer Program which trains volunteer members to increase the knowledge and participation of residents on recycling, composting, waste reduction, and HHW programs. This educational outreach is performed by presentations given by volunteers at solid waste organizations, providing recycling and waste reduction information to residents, and staffing educational recycling booths at County events. In 2016, 1,179 volunteers were a part of the Recycling Volunteer Program.
• The Smart Organizations Reduce and Recycle Tons (SORRT) program which promotes and supports business recycling. The County provides technical support, educational materials, and guidance to advance waste reduction, reuse, recycling, and buying recycled efforts through direct support with owners, managers, employees, and customers of businesses, non-profit organizations, and government facilities.
• The Think Reduce and Recycling at Apartments and Condominiums (TRRAC) program which promotes and supports recycling in multi-family apartments and condominiums. The County provides technical support, educational materials, and guidance to advance waste reduction, reuse, recycling, and buying recycled efforts to building owners, managers, on-site staff, and residents.
• The Waste Reduction and Recycling Education in Public and Private Schools program which provides educational outreach to schools upon request on waste reduction, reuse, recycling, and buying recycled. Individual teachers may also request technical support in developing, reviewing, and updating instructional materials on waste reduction, reuse, recycling, and buying recycled.

29
3.6 Green Procurement The Office of Procurement and the DEP have taken some efforts to promote recycled material by County agencies. Montgomery County has implemented “green purchasing” which is the purchase of goods that minimize impacts on the environment. The County installed ENERGY STAR® printers and copiers and energy saving vending machines in all County facilities. The County also began using eco-friendly soaps and cleansers, and training staff to use environmentally-friendly cleaning techniques. The County also purchases paper that is 30 percent or higher post-consumer recycled paper. Most of the paper purchased is Forest Stewardship Council (FSC) certified which means the paper is harvested in an environmentally friendly manner. The County’s procurement regulations allow for a 10% pricing preference for materials with recycled content. The total dollar value of identified recycled products purchased during FY17 was $6,022,374 and included:
• $4,500,000 for asphalt and bituminous concrete; bituminous concrete may consist of 25% recycled material;
• $208,473 for recycled paper;
• $440,299 for recycled office supplies purchased through the County's LSBRP contract with Benjamin Office Supplies;
• $827,071 for plastic recycling bins/carts, and having a recycled content from 25% up to 50%; and
• $46,531 for record storage boxes having a recycled content from 10% up to 26%. 9
3.7 Material Bans Montgomery County enacted Council Bill 41-14 which places a ban on the use and sale of expanded polystyrene (#6-PS) products such as Styrofoam™ products, including foam containers, bowls, plates, trays, cartons, cups, egg cartons etc. and polystyrene loose fill packaging (e.g. packing peanuts). This legislation includes the following:
• Prohibits food service businesses from using expanded polystyrene (also known as foam or Styrofoam™) food service ware, effective January 1, 2016.
• Prohibits the sale of polystyrene loose fill packaging (also known as packing peanuts) and expanded polystyrene food service products, effective January 1, 2016.
9 FY 2017 Report “Procurement of Recycled Paper and other Recycled Materials” by the County’s Office
of Procurement – https://www.montgomerycountymd.gov/PRO/Resources/Files/Reports/FY17RecycleRpt.pdf Accessed 9/28/2018

30
• Requires all county agencies, contractors, and lessees using disposable food service ware to use compostable or recyclable food service ware by January 1, 2016.
• Requires all food service businesses selling or providing food or beverages in disposable food service ware to use compostable or recyclable disposable food service ware by January 1, 2017.
The legislation applies to:
• All food service businesses, including full-service restaurants, limited-service restaurants, fast food restaurants, cafes, delicatessens, coffee shops, supermarkets, grocery stores, vending trucks or carts, food trucks, businesses or institutional cafeterias located in Montgomery County, Maryland. The law also applies to not-for-profit organizations.
• All food service operated by or on behalf of Montgomery County departments and agencies, as well as other businesses selling or providing food or beverages within the County for consumption on or off the premises.
• All retailers in Montgomery County, Maryland.
4 County-Owned Waste Management Facilities Montgomery County owns several solid waste management facilities as shown in Figure 4-1. These include the Materials Recovery Facility (MRF), the Shady Grove Processing Facility and Transfer Station, the Resource Recovery Facility (RRF), the Montgomery County Yard Trim Composting Facility, land reserved for a potential processing/disposal facility (Site 2 Landfill), and the Poolesville Beauty Spot.
Table 4-1 shows the types of waste managed at County owned facilities.
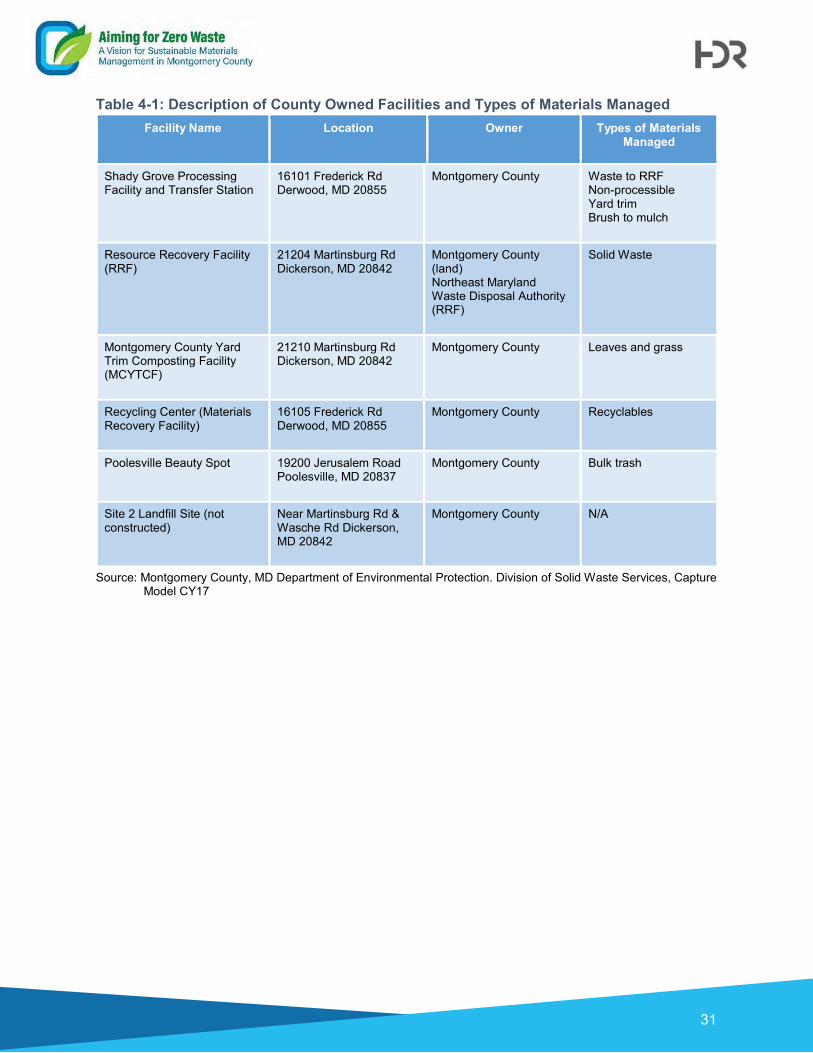
31
Table 4-1: Description of County Owned Facilities and Types of Materials Managed Facility Name Location Owner Types of Materials
Managed
Shady Grove Processing Facility and Transfer Station
16101 Frederick Rd Derwood, MD 20855
Montgomery County Waste to RRF Non-processible Yard trim Brush to mulch
Resource Recovery Facility (RRF)
21204 Martinsburg Rd Dickerson, MD 20842
Montgomery County (land) Northeast Maryland Waste Disposal Authority (RRF)
Solid Waste
Montgomery County Yard Trim Composting Facility (MCYTCF)
21210 Martinsburg Rd Dickerson, MD 20842
Montgomery County Leaves and grass
Recycling Center (Materials Recovery Facility)
16105 Frederick Rd Derwood, MD 20855
Montgomery County Recyclables
Poolesville Beauty Spot 19200 Jerusalem Road Poolesville, MD 20837
Montgomery County Bulk trash
Site 2 Landfill Site (not constructed)
Near Martinsburg Rd & Wasche Rd Dickerson, MD 20842
Montgomery County N/A
Source: Montgomery County, MD Department of Environmental Protection. Division of Solid Waste Services, Capture Model CY17
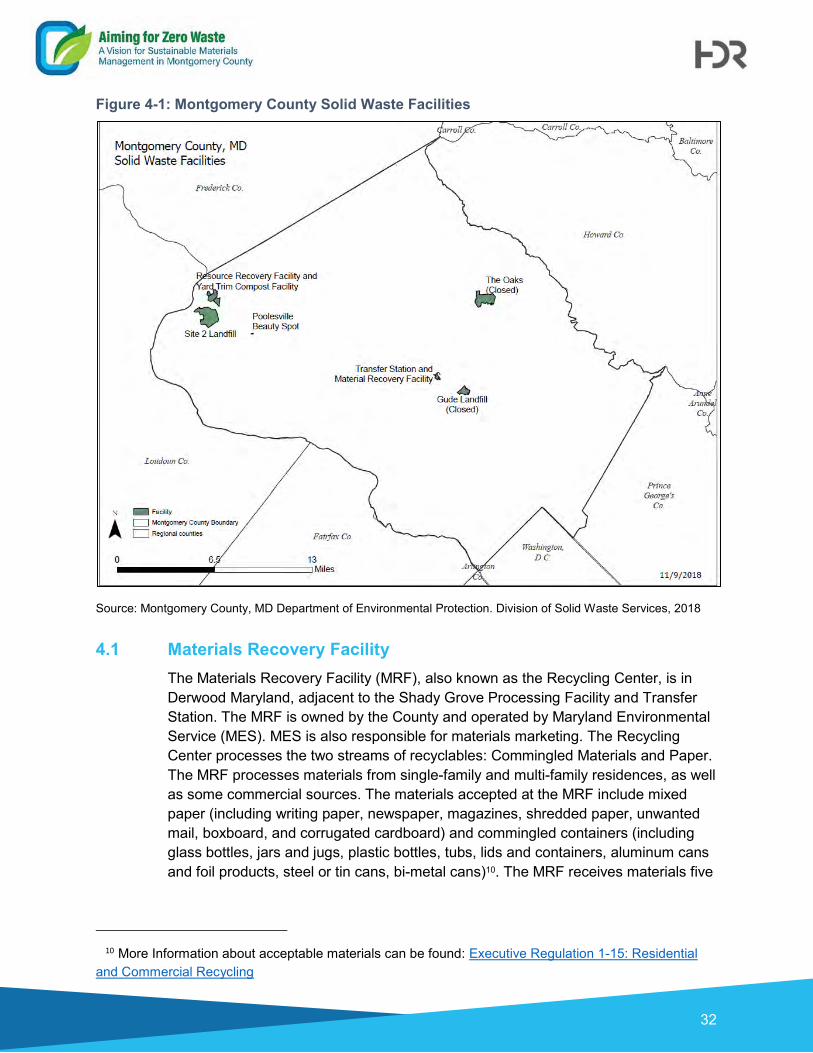
32
Figure 4-1: Montgomery County Solid Waste Facilities
Source: Montgomery County, MD Department of Environmental Protection. Division of Solid Waste Services, 2018
4.1 Materials Recovery Facility The Materials Recovery Facility (MRF), also known as the Recycling Center, is in Derwood Maryland, adjacent to the Shady Grove Processing Facility and Transfer Station. The MRF is owned by the County and operated by Maryland Environmental Service (MES). MES is also responsible for materials marketing. The Recycling Center processes the two streams of recyclables: Commingled Materials and Paper. The MRF processes materials from single-family and multi-family residences, as well as some commercial sources. The materials accepted at the MRF include mixed paper (including writing paper, newspaper, magazines, shredded paper, unwanted mail, boxboard, and corrugated cardboard) and commingled containers (including glass bottles, jars and jugs, plastic bottles, tubs, lids and containers, aluminum cans and foil products, steel or tin cans, bi-metal cans)10. The MRF receives materials five
10 More Information about acceptable materials can be found: Executive Regulation 1-15: Residential
and Commercial Recycling

33
days a week; sorting lines operate four or five days a week depending upon material volumes.
The original Recycling Center building, equipped to accept and process commingled materials only, was constructed in 1991, at a cost of approximately $9 million. The Recycling Center began processing commingled materials in August 1991. Approximately 80-90 tons of commingled material is processed per 8-hour shif. Mechanical and hand separation is used to sort the commingled containers which are baled for shipping. There are 59 employees and contractors working in the commingled area of the MRF daily. Materials are sorted during one shift per day, four to five days a week depending on the volume of materials received. These materials are then sold to various end markets to be remanufactured into new materials.
In May 2017, a separate paper processing area was built at a cost of approximately $3.3 million. The paper processing operations are capable of processing 25 tons of mixed paper and cardboard (OCC) per hour. The paper processing facility is operated by nine employees. The Paper Processing Facility operations include separating and baling mixed paper and cardboard (OCC) to sell into the market. The mixed paper is baled from load bunkers and shipped to paper mills to be made into new products. The market destinations of the end users may be domestic and/or international and vary over time, depending on recycling market conditions and circumstances.11
4.2 Shady Grove Processing Facility and Transfer Station The Shady Grove Processing Facility and Transfer Station is located at 16101 Frederick Road on a 45-acre parcel of land in Derwood, Maryland. It is located adjacent to the Recycling Center and receives trash and recyclables from permitted solid waste haulers and collectors as well as residents at the public drop-off area. The Transfer Station has been in operation since the spring of 1982. In 1995, a transportation system was set up to facilitate rail haul of processible (i.e. combustible) waste from the Transfer Station to the Resource Recovery Facility (RRF). In 2004, a fourth compactor was added. In 2008, the tipping floor area and building were expanded, improvements were made to the site roads, additional scales were installed, and an enclosed small vehicle drop-off center (Annex) was added adjoining the surge pit. Figure 4-2 shows an aerial view of the facility.
The Shady Grove Processing Facility and Transfer Station has a waste operating permit limit of 821,500 tons per year. On an annual basis, the Shady Grove Facility processes about 550,000 to 625,000 tons of processible (combustible) waste, 40,000 to 60,000 tons of non-processible waste, about 75,000 tons of yard trim, and about 8,000 tons of scrap metal, electronics, and other recyclables. In 2017, 668,243 tons of trash and recyclable material was received and processed at the facility. 12
11 Montgomery County, Recycling Center Update 2018 (pdf) 12 Montgomery County, Capture Model CY17
34
The Transfer Station utilizes two entrances, the Shady Grove truck entrance and the Route 355 Public Unloading Facility (PUF) Entrance. The Shady Grove truck entrance receives about 1,000 trucks (e.g. large collection vehicles carrying more than 500 pounds) per day and the PUF entrance receives about 1,000 to 2,000 smaller trucks (e.g., cube vans, pickup trucks that are carrying less than 500 pounds) per day. Radioactive waste detectors are located at several entrances to safeguard from unacceptable waste. These locations include the entrance to the tipping floor, the public unloading area, the inbound truck scales, and at the contractor’s dedicated scale.
The current public unloading area is available for residents to drop-off trash and recyclable materials in passenger vehicles. Residents dropping off less than 500 tons of materials can use the Route 355 Public Unloading Facility (PUF) Entrance at no charge. All materials accepted in the curbside collection program are accepted at the unloading center. If loads of trash and yard trim delivered exceed 500 pounds, the cost is $60 per ton and $46 per ton respectively. All materials that are delivered in open top roll-off boxes are charged $70 per ton.
The four solid waste compactors can compress up to 26 to 27-ton loads of solid waste, which are mechanically discharged into 40-foot intermodal containers. Containers of compacted waste are driven to the rail yard for shipment to the RRF. Processible waste can also be bypassed directly to other permitted disposal sites if necessary. Inspectors also routinely check waste loads for other types of unacceptable materials.
Non-processible waste received at the Transfer Station is transported to the Mountain View Reclamation Landfill near Greencastle, Pennsylvania.
4.2.1 Drop-off Areas at the Transfer Station
Shady Grove accepts a wide variety of materials which can be dropped-off by the residential and non-residential sector. The transfer station has locations for the drop-off of various materials to be properly disposed, recycled, and reused as outlined below and shown in Figure 4-2. Items that may be dropped off at the transfer station include household hazardous waste (HHW), electronics, building materials, textiles, bulky rigid plastics, scrap metal, bikes, and tires.
• The household hazardous waste drop off location is available to residents for proper disposal of home generated HHW. Small businesses may also use the drop off location through the ECOWISE program. Once per month, the ECOWISE Program allows Montgomery County businesses to drop-off up to 220 pounds of hazardous waste on a cost per pound basis.13
• The transfer station provides a drop off location for materials such as electronics, textiles, bulky rigid plastics, scrap metal, and tires to be properly recycled. Residents are limited to 15 electronic items per day, scrap metal that weighs less than 60 pounds, and five tires per year that are no larger than 33 inches in
13 Shady Grove Recycling- HHW
35
diameter. Textiles that are reusable as well as those that are not in a condition to be reused are collected.
• Residents may also drop off materials such as electronics, building materials, textiles, and bikes to be reused. These materials are collected by non-profit organizations under the Internal Revenue Code.
• Through the “Don’t Dump. Donate!” program14, materials such as appliances, bricks, cabinetry, doors, flooring, roofing, tools etc. that are in good, reusable condition can be brought to the Recycling Area as a donation. The County has a partnership with a non-profit firm for reuse of these materials. Materials that are not considered to be in a reusable condition are disposed of as trash, in the appropriate manner.15
• The Transfer Station also includes areas to drop-off yard trim (grass, leaves, and brush) for recycling. Residents who receive recycling collection services through the County are provided curbside collection of yard trim year-round; however, yard trim can also be dropped off at the facility by residents and landscapers. The majority of the yard trim (grass, leaves) is hauled to the County’s Yard Trim Composting Facility, located approximately 20 miles away, either by use of the rail haul system or transfer trailer. Brush is ground into mulch and provided at the County’s Mulch Preserve locations. Mulch is available to residents for no charge and sold to commercial mulch vendors.
14 Information about “Don’t Dump. Donate!” program: Don't Dump. Donate! Program - Reusable Building Material Recycling 15 Shady Grove Recycling- C&D Waste
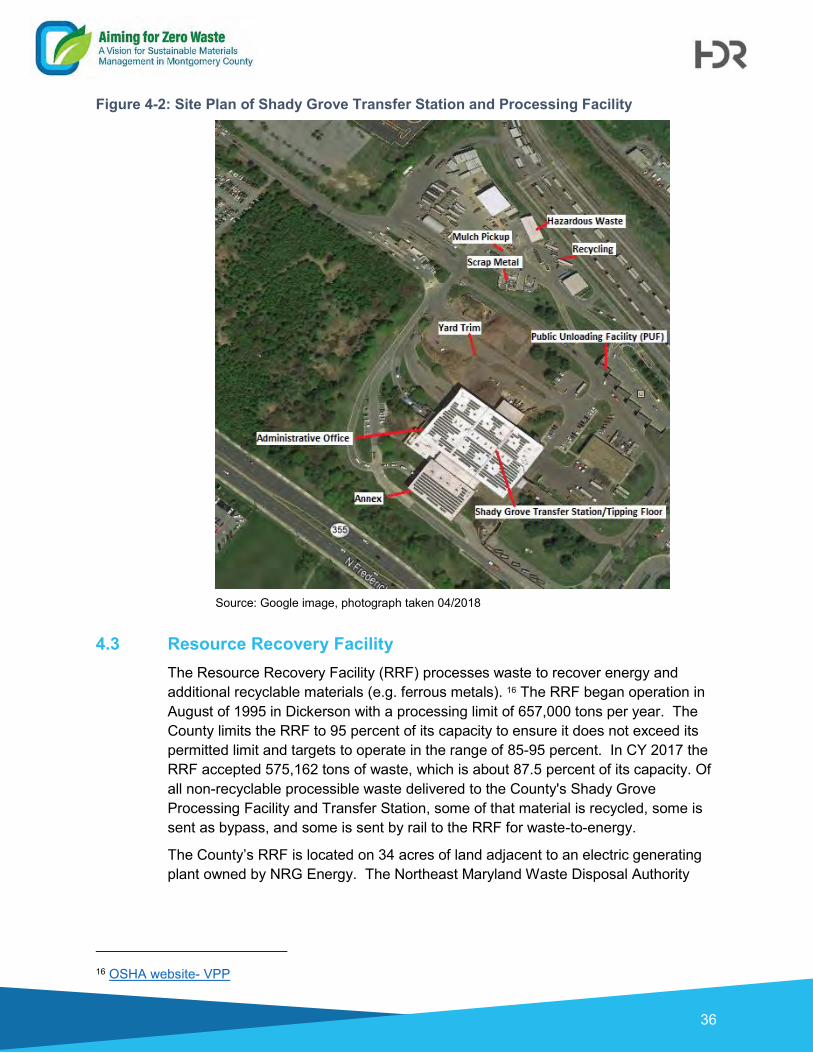
36
Figure 4-2: Site Plan of Shady Grove Transfer Station and Processing Facility
Source: Google image, photograph taken 04/2018
4.3 Resource Recovery Facility The Resource Recovery Facility (RRF) processes waste to recover energy and additional recyclable materials (e.g. ferrous metals). 16 The RRF began operation in August of 1995 in Dickerson with a processing limit of 657,000 tons per year. The County limits the RRF to 95 percent of its capacity to ensure it does not exceed its permitted limit and targets to operate in the range of 85-95 percent. In CY 2017 the RRF accepted 575,162 tons of waste, which is about 87.5 percent of its capacity. Of all non-recyclable processible waste delivered to the County's Shady Grove Processing Facility and Transfer Station, some of that material is recycled, some is sent as bypass, and some is sent by rail to the RRF for waste-to-energy.
The County’s RRF is located on 34 acres of land adjacent to an electric generating plant owned by NRG Energy. The Northeast Maryland Waste Disposal Authority
16 OSHA website- VPP
37
(NMWDA) markets all net energy and capacity into the PJM17 daily market and PJM Capacity market, respectively. The energy generated at the RRF is also certified as a renewable energy and the NMWDA markets the Renewable Energy Credits in the spot market. The design, construction, and transportation improvements were financed by NMWDA. Currently NMWDA owns the RRF on behalf of Montgomery County, and contracts operations to Covanta.
The original agreement between NMWDA and Covanta to operate the Transfer Station and the RRF started in April of 1993, with the RRF beginning operations in August of 1995 with an initial term until April of 2016. The agreement includes two automatic 5-year extensions, unless the County acts to not extend. The RRF is currently in the first 5-year extension which ends in April of 2021. The facility property is leased to the NMWDA by the County.
The RRF is made up of three boilers, each burning up to 600 tons per day based on a waste heating value of 5,500 BTU/lb. These boiler units produce high pressure and high temperature steam to generate electricity through the mass burn of waste. After the mass burn process, ferrous materials are recovered from the ash prior to shipping the ash off-site by rail. The ferrous material is sold into the recycling market and recycled. The ash is shipped by rail to the Old Dominion landfill in Virginia where it is processed to recover additional ferrous metals as well as non-ferrous metals for recycling, and aggregate materials. The aggregate materials are used within the lined area of the landfill for road base and as daily cover, which is counted as a beneficial reuse by the State of Virginia and Maryland.
The facility’s Title V Air Permit requires stack emissions monitoring to occur during all hours of operation. The Air Pollution Control (APC) system includes processes for removal of nitrogen oxides (NOx), acid gases (SO2 and HCl), mercury dioxins and particulate matter. The Continuous Emissions Monitoring Systems (CEMS) measures the emission levels of sulfur dioxide, nitrogen oxides, hydrogen chloride, temperature, opacity and carbon monoxide to ensure the APC system is operating correctly and that facility is adhering to its air permit. The CEMS data is shared on the County’s website at https://www.montgomerycountymd.gov/sws/facilities/rrf/cem.html. Additionally, the County has completed several studies that review the health effects of the emissions from the RRF. These studies have concluded that there are “no measurable influences on ambient air concentrations attributable to MCRRF source emissions.”18
17 PJM or PJM Regional Electric Grid - a regional transmission organization (RTO) that coordinates the
movement of wholesale electricity in Maryland and all or parts of 12 other states and the District of Columbia.
18 From “Fourth Operational Phase Ambient Air Monitoring Program, Winter 2013-2014 and 2014-2015” https://www.montgomerycountymd.gov/SWS/Resources/Files/rrf/ambient-air-report-1606/Ambient-Air-Report-1606.pdf (last accessed 8/24/2018)

38
This facility, along with many other Covanta operated facilities are in the Occupational Safety and Health Act (OSHA) Voluntary Protection Program (VPP) which promotes a safe and healthy work environment. 19
4.4 Montgomery County Yard Trim Composting Facility The Montgomery County Yard Trim Composting Facility is located in Dickerson, Maryland. The County has owned and operated this facility since 1983 when it was converted from a sewage sludge composting facility. The County contracts with the Maryland Environmental Service (MES) for operation of the facility. The facility is located on 118 acres of land adjacent to the RRF. When the facility first opened, initially only leaves were composted; however, in 1989, the County expanded its operations to compost both leaves and grass from single-family homes. The facility mainly manages materials generated by the single-family residential sector. Materials generated by multi-family and non-residential sectors are processed at both the County’s facility and private facilities located within and outside of the County. Privately operated composting facilities are discussed in Section 5.5.
The facility processes 77,000 tons of material per year (the maximum allowed as per the agreement with the Sugarloaf Citizens Association). The facility consists of a 49-acre asphalt pad, three stormwater management ponds, 80,000 square foot pavilion for drying and screening finished compost, a scale house, a maintenance and storage building, and a pump house for an onsite well. An open-air windrow operation is used for the composting of the leaves and grass using mobile turning and shredding equipment.
The facility sells a high quality compost called LeafgroTM. This compost is sold bagged and in bulk to landscapers and homeowners. LeafgroTM is sold in sustainable packaging made from sugarcane which is helping the County reduce its carbon footprint.20 In accordance with an agreement between the County and the Sugarloaf Citizens Association, the County may produce up to 650,000 bags of Leafgro.21
4.5 Land Reserved for Potential In-County Waste Landfill The County currently owns 820 acres of land in Dickerson, Maryland to act as a potential future in-County landfill as a contingency in the event economic conditions change or the law no longer allows out-of-County waste disposal. This location is along Wasche Road and is known as “Site 2”. The County continues to allow this site to be used for agriculture purposes until a landfill is needed. It is anticipated that the footprint of the landfill would consist of 125 acres. The County could commence construction of the landfill at any time in accordance with the terms and conditions of the Refuse Disposal Permit issued by MDE for the site.
19 Covanta- RRF Operating Data 20 Montgomery County- Composting Facility 21 Montgomery County- County's Carbon Footprint
39
4.6 Closed Landfills The County is responsible for post-closure care of two landfills: the Gude Landfill and the Oaks Landfill. The Gude Landfill is the oldest formal landfill in the County and is located at 600 East Gude Drive, in Rockville, Maryland.
The landfill received approximately 4.8 million tons of municipal solid waste from 1965 until the site was closed in 1982. The Gude Landfill has a waste disposal footprint of approximately 100 acres. The site’s infrastructure includes:
• Internal access roads
• Stormwater management/sediment control ponds
• Groundwater/gas monitoring wells
• A former power plant building
• An above ground horizontal landfill gas collection system with vertical extraction wells
• Two enclosed landfill gas ground flares with noise wall
• A 0.8-megawatt (MW) gas-to-energy facility (As of June 1, 2017, the facility was permanently shut down).
The County is also responsible for post-closure care of the Oaks Landfill located on a 545-acre tract near Laytonsville, MD. From 1982 to 1995, the Oaks Landfill managed the County’s MSW. From 1995 to 1997, RRF ash and non-processible waste was received until the commencement of a contract to export this waste to a private landfill in Virginia. The landfill was closed in 1997. The Oaks Landfill has a leachate pretreatment facility and a gas management facility that will continue to be operated throughout the 30-year post-closure maintenance period. A 2.4-megawatt (MW) landfill gas-to-energy facility started operation in mid-2009.
4.7 Poolesville Beauty Spot The Poolesville Beauty spot is a satellite drop-off facility for residents to dispose of bulky waste. Beauty Spots are intended to “beautify” neighborhoods by giving residents a location to drop-off large items that they would otherwise place on the street. The Poolesville Beauty Spot is located at 19200 Jerusalem Road in Poolesville, Maryland. It is only open on Saturdays from 7 am to 3 pm.22 Residents may drop-off up to 499 pounds of bulky waste for free. Some examples of bulky waste accepted at the Beauty Spot include furniture, rugs, and mattresses. The Beauty Spot does not accept commercial waste, residential household trash or recyclables, scrap metal, or yard trim. Covanta, the current contractor, transports the material for disposal at the Shady Grove Processing Facility and Transfer Station.
22 Montgomery County- Poolesville Beauty Spot
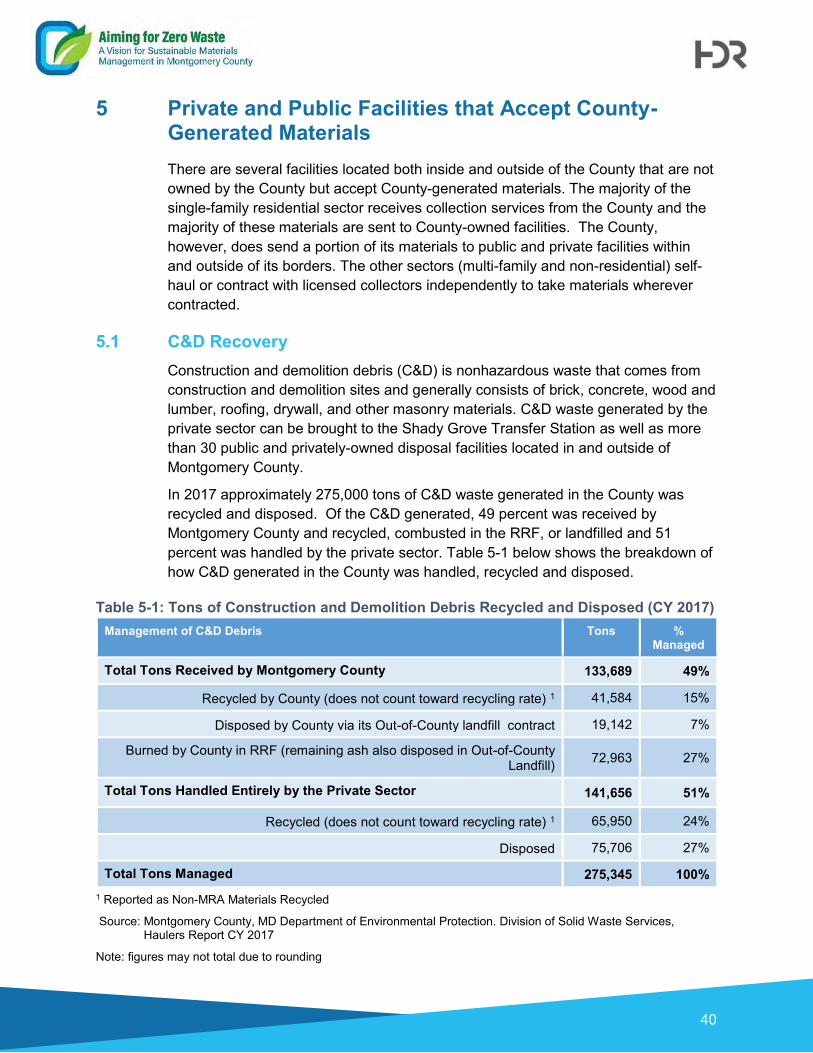
40
5 Private and Public Facilities that Accept County-Generated Materials There are several facilities located both inside and outside of the County that are not owned by the County but accept County-generated materials. The majority of the single-family residential sector receives collection services from the County and the majority of these materials are sent to County-owned facilities. The County, however, does send a portion of its materials to public and private facilities within and outside of its borders. The other sectors (multi-family and non-residential) self-haul or contract with licensed collectors independently to take materials wherever contracted.
5.1 C&D Recovery Construction and demolition debris (C&D) is nonhazardous waste that comes from construction and demolition sites and generally consists of brick, concrete, wood and lumber, roofing, drywall, and other masonry materials. C&D waste generated by the private sector can be brought to the Shady Grove Transfer Station as well as more than 30 public and privately-owned disposal facilities located in and outside of Montgomery County.
In 2017 approximately 275,000 tons of C&D waste generated in the County was recycled and disposed. Of the C&D generated, 49 percent was received by Montgomery County and recycled, combusted in the RRF, or landfilled and 51 percent was handled by the private sector. Table 5-1 below shows the breakdown of how C&D generated in the County was handled, recycled and disposed.
Table 5-1: Tons of Construction and Demolition Debris Recycled and Disposed (CY 2017) Management of C&D Debris Tons %
Managed
Total Tons Received by Montgomery County 133,689 49%
Recycled by County (does not count toward recycling rate) 1 41,584 15%
Disposed by County via its Out-of-County landfill contract 19,142 7%
Burned by County in RRF (remaining ash also disposed in Out-of-County Landfill) 72,963 27%
Total Tons Handled Entirely by the Private Sector 141,656 51%
Recycled (does not count toward recycling rate) 1 65,950 24%
Disposed 75,706 27%
Total Tons Managed 275,345 100% 1 Reported as Non-MRA Materials Recycled
Source: Montgomery County, MD Department of Environmental Protection. Division of Solid Waste Services, Haulers Report CY 2017
Note: figures may not total due to rounding

41
The two facilities that receive most of the County’s C&D waste include the Ritchie Land Rubble Landfill and C&D Recovery, LLC a private C&D processing facility. In 2017, these facilities managed 43 percent of the total C&D managed by the private sector. Table 5-2 below shows the private disposal and recycling facilities that accepted C&D waste from private haulers in Montgomery County along with the respective tonnages in 2017 from these haulers. This does not include C&D waste from Montgomery County.
Table 5-2: Private Disposal and Recycling Facilities Used by Private Haulers for C&D Materials (2017)
Facility Name Tons Managed
% of Total Disposed (Tons)
% Disposed
Recycled (Tons)
% Recycled
Ritchie Land Rubble LF 34,301 24% 26,505 77% 7,796 23%
C&D Recovery LLC 25,302 18% 16,725 66% 8,577 34%
Sun Recycling 14,630 10% 3,720 25% 10,910 75%
Honey Go Run 14,339 10% 14,339 100% - 0%
Comus Materials 12,811 9% - 0% 12,811 100%
The Recycle Center 11,790 8% - 0% 11,790 100%
Recycle One 4,919 3% 4,919 100% - 0%
Eyler Rubblefill 4,216 3% - 0% 4,216 100%
Ameriwaste 4,082 3% 3,261 80% 821 20%
DC Materials Inc. 3,844 3% - 0% 3,844 100%
Brandywine Sand & Gravel
1,498 1% 1,498 100% - 0%
Merrifield 935 1% 493 53% 441 47%
Other 25 Private Facilities
8,990 6% 4,246 47% 4,744 53%
Total C&D Managed by Private Sector
141,656 100% 75,706
65,950
Source: Montgomery County, MD Department of Environmental Protection. Division of Solid Waste Services, Haulers Report CY 2017
5.2 Landfills There are currently no active landfills located within the boundaries of the County. Section 4.5 in this report discusses the 820 acres that the County currently owns to use as a potential landfill site.
Table 5-3 below shows a list of landfills located within a 200-mile driving distance from the County that could accept Montgomery County waste. HDR conducted online research on public and private landfills within 200 driving miles from

42
Montgomery County23 with at least 50 years of capacity remaining and able to accept out-of-county waste. This radius represents an approximate 3-hour drive time. HDR followed up with a phone call to the facilities to ask about tipping fees if information was not available online. It should be noted that the fees represent gate rates only and would be subject to negotiation depending on the quantity of waste managed.
23 Note that the distance from Montgomery County represents the center point of Montgomery County as
determined by Google Maps, which is 11596 Game Preserve Road, Gaithersburg, MD 20878
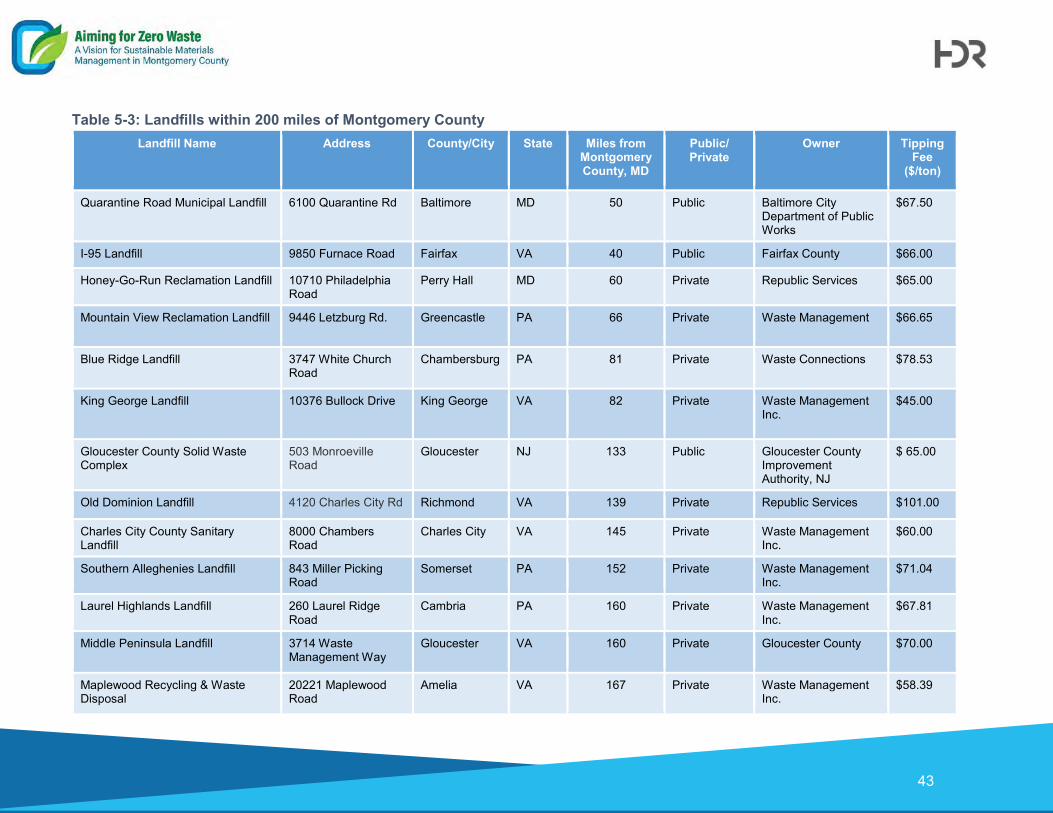
43
Table 5-3: Landfills within 200 miles of Montgomery County Landfill Name Address County/City State Miles from
Montgomery County, MD
Public/ Private
Owner Tipping Fee
($/ton)
Quarantine Road Municipal Landfill 6100 Quarantine Rd Baltimore MD 50 Public Baltimore City Department of Public Works
$67.50
I-95 Landfill 9850 Furnace Road Fairfax VA 40 Public Fairfax County $66.00
Honey-Go-Run Reclamation Landfill 10710 Philadelphia Road
Perry Hall MD 60 Private Republic Services $65.00
Mountain View Reclamation Landfill 9446 Letzburg Rd.
Greencastle PA 66 Private Waste Management $66.65
Blue Ridge Landfill 3747 White Church Road
Chambersburg PA 81 Private Waste Connections $78.53
King George Landfill 10376 Bullock Drive King George VA 82 Private Waste Management Inc.
$45.00
Gloucester County Solid Waste Complex
503 Monroeville Road
Gloucester NJ 133 Public Gloucester County Improvement Authority, NJ
$ 65.00
Old Dominion Landfill 4120 Charles City Rd Richmond VA 139 Private Republic Services $101.00
Charles City County Sanitary Landfill
8000 Chambers Road
Charles City VA 145 Private Waste Management Inc.
$60.00
Southern Alleghenies Landfill 843 Miller Picking Road
Somerset PA 152 Private Waste Management Inc.
$71.04
Laurel Highlands Landfill 260 Laurel Ridge Road
Cambria PA 160 Private Waste Management Inc.
$67.81
Middle Peninsula Landfill 3714 Waste Management Way
Gloucester VA 160 Private Gloucester County $70.00
Maplewood Recycling & Waste Disposal
20221 Maplewood Road
Amelia VA 167 Private Waste Management Inc.
$58.39
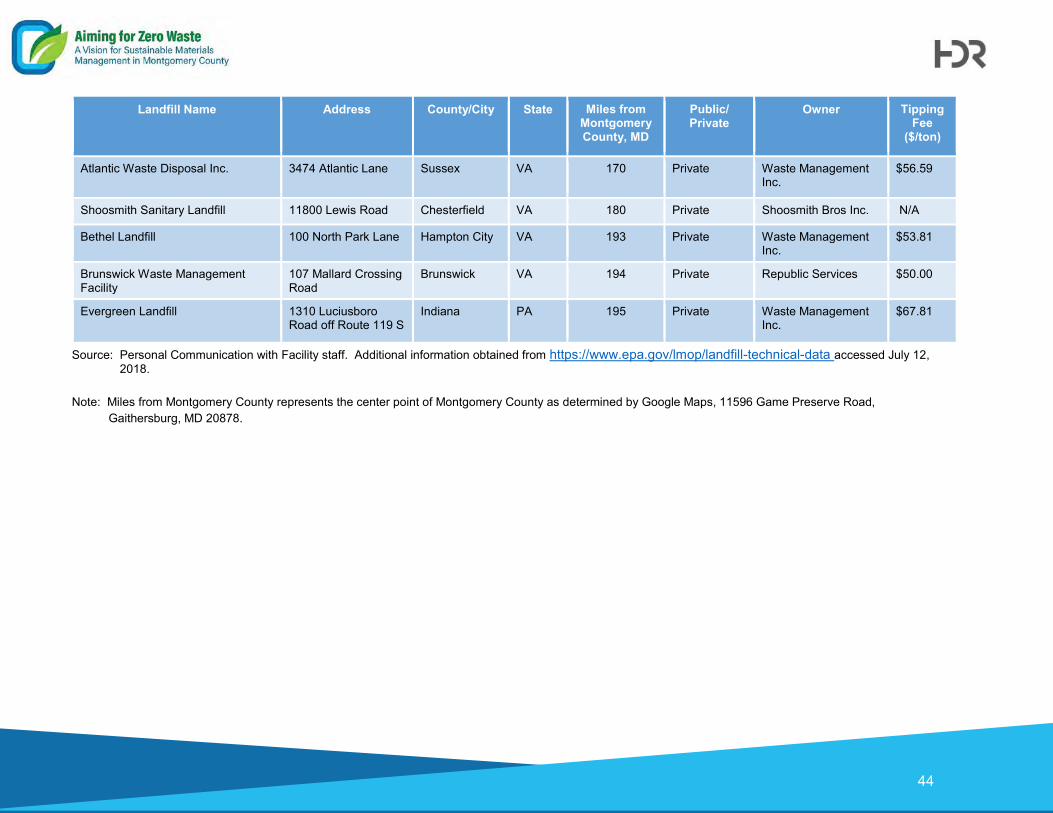
44
Landfill Name Address County/City State Miles from Montgomery County, MD
Public/ Private
Owner Tipping Fee
($/ton)
Atlantic Waste Disposal Inc. 3474 Atlantic Lane Sussex VA 170 Private Waste Management Inc.
$56.59
Shoosmith Sanitary Landfill 11800 Lewis Road Chesterfield VA 180 Private Shoosmith Bros Inc. N/A
Bethel Landfill 100 North Park Lane Hampton City VA 193 Private Waste Management Inc.
$53.81
Brunswick Waste Management Facility
107 Mallard Crossing Road
Brunswick VA 194 Private Republic Services $50.00
Evergreen Landfill 1310 Luciusboro Road off Route 119 S
Indiana PA 195 Private Waste Management Inc.
$67.81
Source: Personal Communication with Facility staff. Additional information obtained from https://www.epa.gov/lmop/landfill-technical-data accessed July 12, 2018.
Note: Miles from Montgomery County represents the center point of Montgomery County as determined by Google Maps, 11596 Game Preserve Road, Gaithersburg, MD 20878.
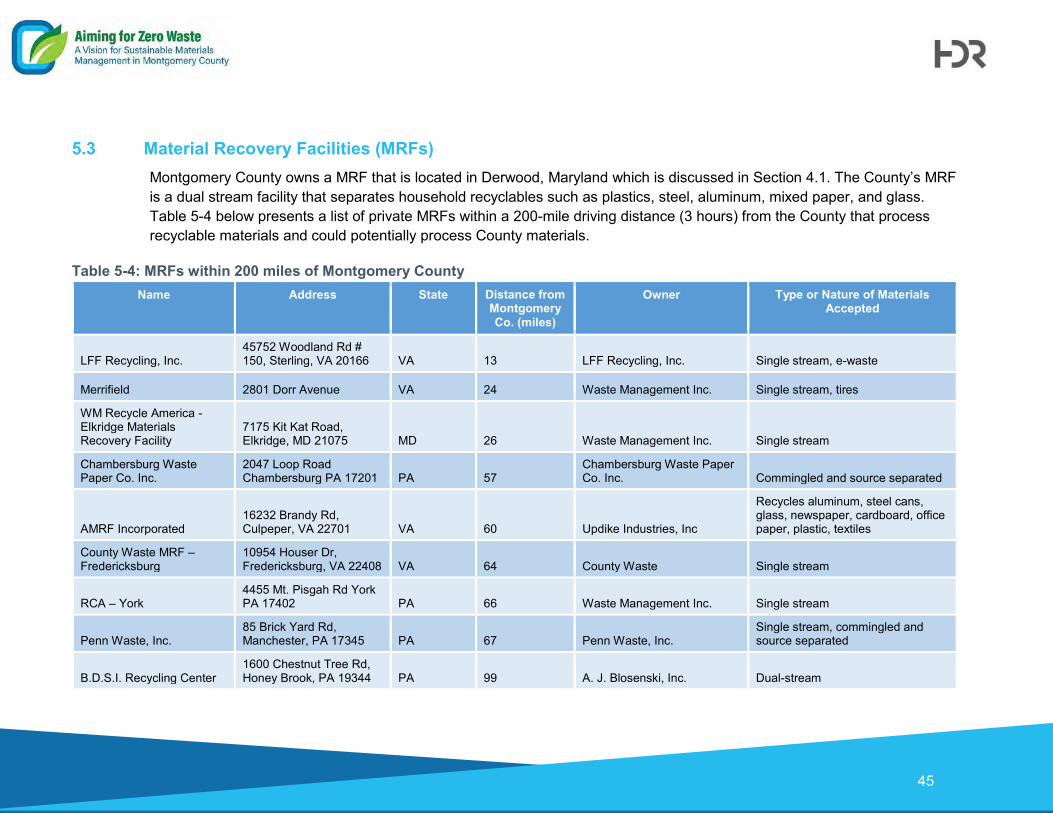
45
5.3 Material Recovery Facilities (MRFs) Montgomery County owns a MRF that is located in Derwood, Maryland which is discussed in Section 4.1. The County’s MRF is a dual stream facility that separates household recyclables such as plastics, steel, aluminum, mixed paper, and glass. Table 5-4 below presents a list of private MRFs within a 200-mile driving distance (3 hours) from the County that process recyclable materials and could potentially process County materials.
Table 5-4: MRFs within 200 miles of Montgomery County Name Address State Distance from
Montgomery Co. (miles)
Owner Type or Nature of Materials Accepted
LFF Recycling, Inc. 45752 Woodland Rd # 150, Sterling, VA 20166 VA 13 LFF Recycling, Inc. Single stream, e-waste
Merrifield 2801 Dorr Avenue VA 24 Waste Management Inc. Single stream, tires
WM Recycle America - Elkridge Materials Recovery Facility
7175 Kit Kat Road, Elkridge, MD 21075 MD 26 Waste Management Inc. Single stream
Chambersburg Waste Paper Co. Inc.
2047 Loop Road Chambersburg PA 17201 PA 57
Chambersburg Waste Paper Co. Inc. Commingled and source separated
AMRF Incorporated 16232 Brandy Rd, Culpeper, VA 22701 VA 60 Updike Industries, Inc
Recycles aluminum, steel cans, glass, newspaper, cardboard, office paper, plastic, textiles
County Waste MRF – Fredericksburg
10954 Houser Dr, Fredericksburg, VA 22408 VA 64 County Waste Single stream
RCA – York 4455 Mt. Pisgah Rd York PA 17402 PA 66 Waste Management Inc. Single stream
Penn Waste, Inc. 85 Brick Yard Rd, Manchester, PA 17345 PA 67 Penn Waste, Inc.
Single stream, commingled and source separated
B.D.S.I. Recycling Center 1600 Chestnut Tree Rd, Honey Brook, PA 19344 PA 99 A. J. Blosenski, Inc. Dual-stream

46
Name Address State Distance from Montgomery Co. (miles)
Owner Type or Nature of Materials Accepted
TotalRecycle, Inc 1270 Lincoln Rd. Birdsboro PA 19508 PA 108 JP Mascaro & Sons Single and dual stream
County Waste MRF - West Point
7825 Parham Landing Rd, West Point, VA 23181 VA 115 County Waste Single stream
Cougle’s Recycling Inc. 1000 S. 4th St. Hamburg PA 19526 PA 117 Cougle's Reccling, Inc Conversion to single stream
Allied Waste Recyclery 215 E. Dekalb Pike, King of Prussia PA 19406 PA 120 Republic Services Single stream
County Waste MRF – Richmond
12230 Deergrove Rd, Midlothian, VA 23112 VA 120 County Waste Single stream
Philadelphia Transcyclery Co.
3000 East Hedley St, Philadelphia, PA 19137 PA 120 Republic Services
Commingled with fiber source separated
ReCommunity Philadelphia 2904 Ellsworth St Philadelphia, PA 19146 PA 122 Republic Services Single stream
ReCommunity Upper Dublin
1030 Fitzwatertown Road, Willow Grove, PA 19090 PA 130 Republic Services
Commingled with fiber separated or single stream
Waste Management Philadelphia Recovery Facility
5201 Bleigh Ave Philadelphia PA 19136 PA 133 Waste Management Inc. Single stream
Republic Bucks Montgomery Recyclery
1510 Swamp Rd. Fountainville, PA 18923 PA 138 Republic Services
Newspaper, cardboard, aluminum cans, plastics 1 & 2
TFC Recycling 12206 Old Stage Road VA 141 TFC Recycling Single stream
J.P. Mascaro & Sons Wyoming Valley Division
871 E. Main St. Nanticoke, PA 18634 PA 157 J.P. Mascaro & Sons
Commingled glass, tin, aluminum, and plastics fiber separated
Northeast Cartage and Recycling Solutions
50 Breaker Rd., Hanover Township, PA 18704 PA 159
Northeast Cartage and Recycling Solutions, LLC Single stream and dual stream
Municipal Recovery 495 Stanton St. Wilkes-Barre, PA 18702 PA 160 Municipal Recovery, Inc
Single stream, commingled and source separated
County Waste MRF – Lynchburg
2410 Mayflower Dr, Lynchburg, VA 24501 VA 161 County Waste Single stream

47
Name Address State Distance from Montgomery Co. (miles)
Owner Type or Nature of Materials Accepted
Bay Disposal Inc. Norfolk MRF
687 Decker St Norfolk VA 23523 VA 169 Bay Disposal Single stream
TFC Recycling – Chesapeake
1958 Diamond Hill Rd, Chesapeake, VA 23324 VA 172 TFC Recycling Single stream
Waste Management (GREENSTAR)
4100 Grand Avenue Pittsburgh, PA 15225 PA 179 Waste Management Inc. Single stream
Source: MSW Consultants Research, 2018 Note: The center point of Montgomery County as determined by Google Maps, 11596 Game Preserve Road, Gaithersburg, MD
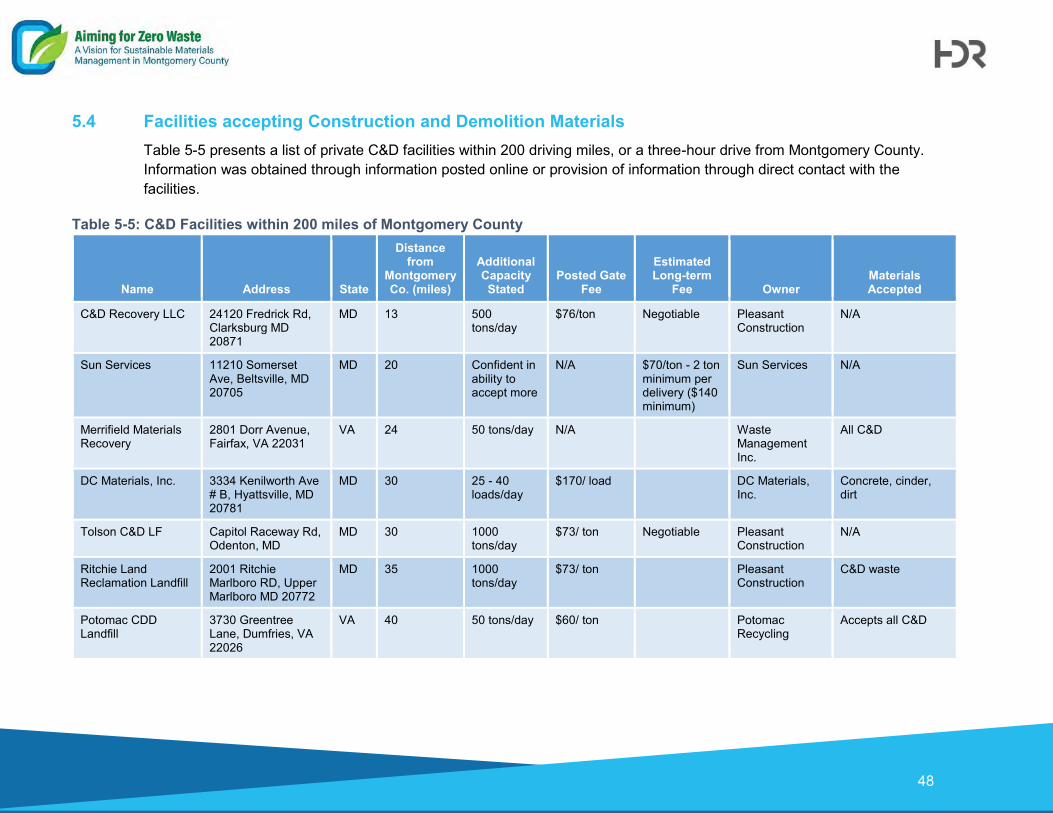
48
5.4 Facilities accepting Construction and Demolition Materials Table 5-5 presents a list of private C&D facilities within 200 driving miles, or a three-hour drive from Montgomery County. Information was obtained through information posted online or provision of information through direct contact with the facilities.
Table 5-5: C&D Facilities within 200 miles of Montgomery County
Name Address State
Distance from
Montgomery Co. (miles)
Additional Capacity Stated
Posted Gate Fee
Estimated Long-term
Fee Owner Materials Accepted
C&D Recovery LLC 24120 Fredrick Rd, Clarksburg MD 20871
MD 13 500 tons/day
$76/ton Negotiable Pleasant Construction
N/A
Sun Services 11210 Somerset Ave, Beltsville, MD 20705
MD 20 Confident in ability to accept more
N/A $70/ton - 2 ton minimum per delivery ($140 minimum)
Sun Services N/A
Merrifield Materials Recovery
2801 Dorr Avenue, Fairfax, VA 22031
VA 24 50 tons/day N/A Waste Management Inc.
All C&D
DC Materials, Inc. 3334 Kenilworth Ave # B, Hyattsville, MD 20781
MD 30 25 - 40 loads/day
$170/ load DC Materials, Inc.
Concrete, cinder, dirt
Tolson C&D LF Capitol Raceway Rd, Odenton, MD
MD 30 1000 tons/day
$73/ ton Negotiable Pleasant Construction
N/A
Ritchie Land Reclamation Landfill
2001 Ritchie Marlboro RD, Upper Marlboro MD 20772
MD 35 1000 tons/day
$73/ ton Pleasant Construction
C&D waste
Potomac CDD Landfill
3730 Greentree Lane, Dumfries, VA 22026
VA 40 50 tons/day $60/ ton Potomac Recycling
Accepts all C&D
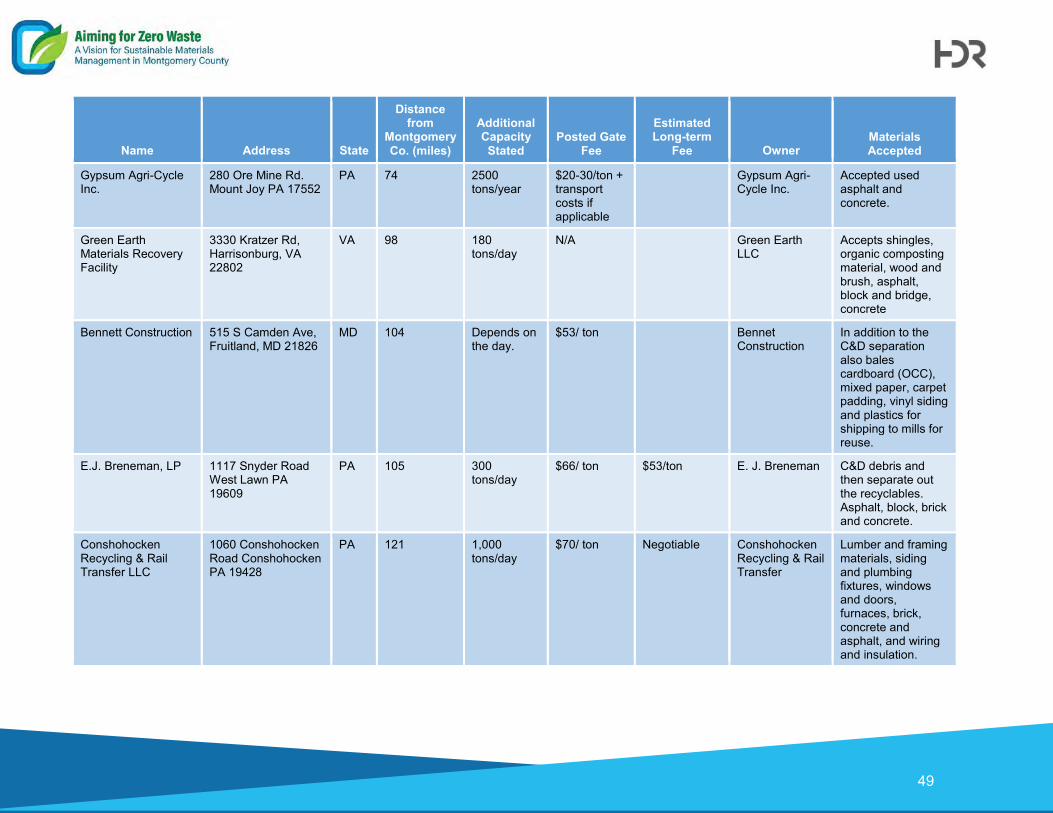
49
Name Address State
Distance from
Montgomery Co. (miles)
Additional Capacity Stated
Posted Gate Fee
Estimated Long-term
Fee Owner Materials Accepted
Gypsum Agri-Cycle Inc.
280 Ore Mine Rd. Mount Joy PA 17552
PA 74 2500 tons/year
$20-30/ton + transport costs if applicable
Gypsum Agri-Cycle Inc.
Accepted used asphalt and concrete.
Green Earth Materials Recovery Facility
3330 Kratzer Rd, Harrisonburg, VA 22802
VA 98 180 tons/day
N/A Green Earth LLC
Accepts shingles, organic composting material, wood and brush, asphalt, block and bridge, concrete
Bennett Construction 515 S Camden Ave, Fruitland, MD 21826
MD 104 Depends on the day.
$53/ ton Bennet Construction
In addition to the C&D separation also bales cardboard (OCC), mixed paper, carpet padding, vinyl siding and plastics for shipping to mills for reuse.
E.J. Breneman, LP 1117 Snyder Road West Lawn PA 19609
PA 105 300 tons/day
$66/ ton $53/ton E. J. Breneman C&D debris and then separate out the recyclables. Asphalt, block, brick and concrete.
Conshohocken Recycling & Rail Transfer LLC
1060 Conshohocken Road Conshohocken PA 19428
PA 121 1,000 tons/day
$70/ ton Negotiable Conshohocken Recycling & Rail Transfer
Lumber and framing materials, siding and plumbing fixtures, windows and doors, furnaces, brick, concrete and asphalt, and wiring and insulation.
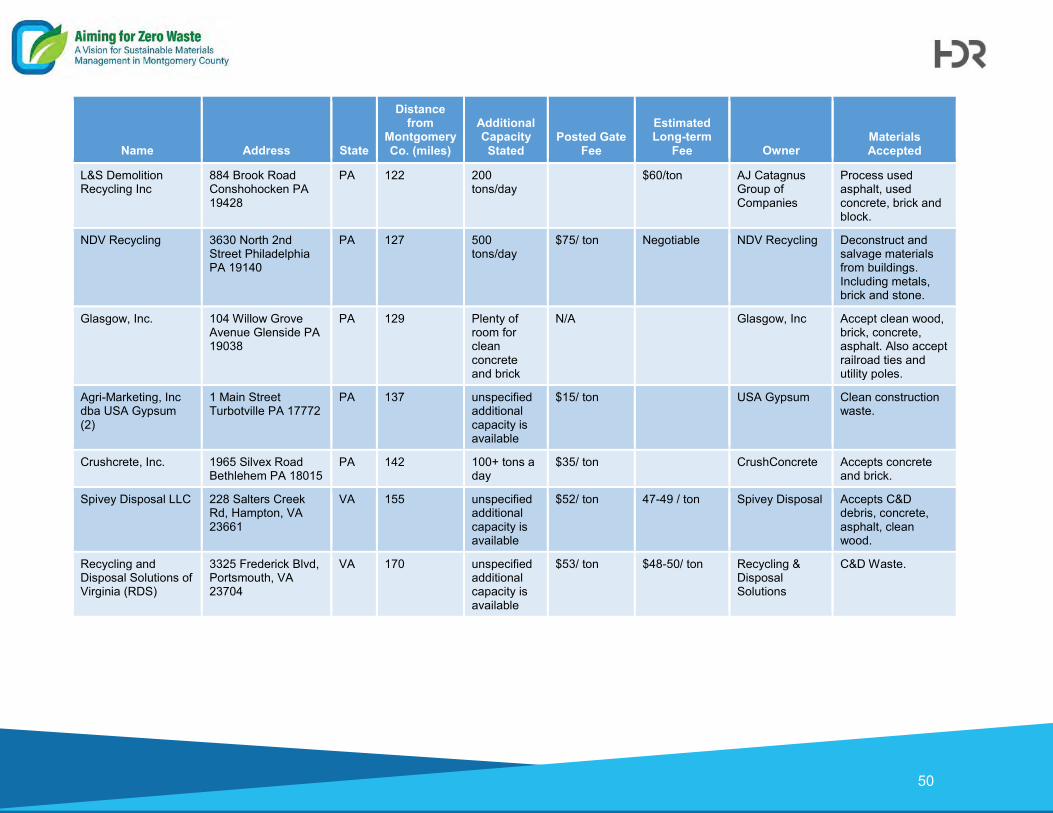
50
Name Address State
Distance from
Montgomery Co. (miles)
Additional Capacity Stated
Posted Gate Fee
Estimated Long-term
Fee Owner Materials Accepted
L&S Demolition Recycling Inc
884 Brook Road Conshohocken PA 19428
PA 122 200 tons/day
$60/ton AJ Catagnus Group of Companies
Process used asphalt, used concrete, brick and block.
NDV Recycling 3630 North 2nd Street Philadelphia PA 19140
PA 127 500 tons/day
$75/ ton Negotiable NDV Recycling Deconstruct and salvage materials from buildings. Including metals, brick and stone.
Glasgow, Inc. 104 Willow Grove Avenue Glenside PA 19038
PA 129 Plenty of room for clean concrete and brick
N/A Glasgow, Inc Accept clean wood, brick, concrete, asphalt. Also accept railroad ties and utility poles.
Agri-Marketing, Inc dba USA Gypsum (2)
1 Main Street Turbotville PA 17772
PA 137 unspecified additional capacity is available
$15/ ton USA Gypsum Clean construction waste.
Crushcrete, Inc. 1965 Silvex Road Bethlehem PA 18015
PA 142 100+ tons a day
$35/ ton CrushConcrete Accepts concrete and brick.
Spivey Disposal LLC 228 Salters Creek Rd, Hampton, VA 23661
VA 155 unspecified additional capacity is available
$52/ ton 47-49 / ton Spivey Disposal Accepts C&D debris, concrete, asphalt, clean wood.
Recycling and Disposal Solutions of Virginia (RDS)
3325 Frederick Blvd, Portsmouth, VA 23704
VA 170 unspecified additional capacity is available
$53/ ton $48-50/ ton Recycling & Disposal Solutions
C&D Waste.

51
Name Address State
Distance from
Montgomery Co. (miles)
Additional Capacity Stated
Posted Gate Fee
Estimated Long-term
Fee Owner Materials Accepted
Military Highway Recycling Center MRF
5304 W Military Hwy, Chesapeake, VA 23321
VA 170 can hold 1400 tons total; can accept 400 tons/day; 300 tons available
$50/ ton $40-45/ ton Military Highway Recycling
C&D Debris consisting of Wood, Shingles, Drywall, Plastic Buckets, Pallets, Flooring, Metals, Windows, Land Clearing Debris (tree shrubs), Sand, Pallets, Flooring, etc. Clean & Spacious Tipping Area. C&D $45.00/ton.
Centerville Turnpike CDD Landfill
1613 Centerville Turnpike, Virginia Beach, VA 23464
VA 174 unspecified additional capacity is available
$55/ ton Hampton Roads Recovery Center, LLC
C&D Landfill; sorting and diverting recoverable debris to local recyclers and by supporting debris stream landfilling of post-recycled C&D debris.
Source: MSW Consultants Research, 2018 Note: The center point of Montgomery County as determined by Google Maps, 11596 Game Preserve Road, Gaithersburg, MD 20878

52
5.5 Compost/Organics Facilities The County currently owns a composting facility that is discussed in Section 4.4 of this report. The majority of the leaf and yard trim generated by the single-family residential sector is sent to the County’s facility; however, the yard trim generated by multi-family and non-residential sector is sent to private composting facilities located within and outside the County. The County currently does not have an organics processing facility for food waste; therefore, any food waste collected is sent to private facilities.
The County has been conducting a food waste recycling program since November 2011 at the Executive Office Building cafeteria. From November 2011 through August 2018, 140 tons of food waste have been collected and composted. In 2016, the pilot program was expanded to the Council Office Building cafeteria and the Public Safety Headquarters Building.24 The material has been delivered by the contracted licensed collector to a succession of compost facilities since the beginning of the program, namely the Prince William County, Virginia Compost Facility, Recycled Green in Carroll County, Maryland, and now the Prince George’s County Composting Facility at Western Branch. Having consistent access to processing facilities with adequate capacity to compost the materials separated from waste for composting is critical to successful composting efforts and programs.
The following table provides a description of the type of feedstock types and facility tiers25 that are managed by the composting facilities presented in Table 5-7.
Table 5-6: Feedstock Types and Facility Tiers Feedstock Types
Type 1 • Yard
waste (e.g. leaves, grass)
Type 2 • Food scraps • Non‐ recyclable paper • Animal manure and bedding • Industrial food processing materials • Animal mortalities • Compostable products
Type 3 • Sewage
Sludge or Biosolids
• Used diapers • Mixed
municipal solid waste (MSW)
• Not covered under the CF permit or composting facility regulations
NWW • Tree and
other natural vegetative refuse
• Not covered under the CF permit or composting facility regulations
24 Montgomery County FY2016 Sustainable Government Operations Report 25 MDE, Permitting Guidance for Maryland Composting Facilities, June 2015.
https://mde.maryland.gov/programs/LAND/RecyclingandOperationsprogram/Documents/Permitting%20Guidance%20-%20Final%206.12.15.pdf . Accessed September 4, 2018

53
Facility Tiers
Tier 1 • Accepts
only Type 1 feedstocks
Tier 2
Small • Type 1 and Type 2
feedstocks • Produces ≤ 10,000
cubic yards of compost annually
Tier 2
Large • Type 1
and Type 2 feedstocks
• Produces > 10,000 cubic yards of compost per year
Tier 3 • Accepts Type
3 feedstocks (regardless of whether other feedstock types are also composted)
NWW Recycling Facility • Accepts
only natural wood waste
Permit Required
Tier I and II - General Composting Facility Permit (GCFP) (Unless subject to an exemption)
Tier III - Refuse Disposal Permit or Sewage Sludge Utilization Permit
NWW Recycling Facility Permit
Table 5-7 below provides a list of composting facilities located within 100 driving miles of Montgomery County. Several facilities listed below are small scale and unable to accept a substantial amount of the County’s available food waste, and some do not accept food waste generated from outside of their jurisdiction. Information was gathered through internet research or direct contact with the facility owner/operators.
Table 5-7: Composting Facilities in Maryland and Virginia County Composting
Facility Facility /
Feedstock Type
Feedstock Capacity (Tons per
year)
Ratio of Food
Waste/Yard Trim or Other
Able to take material from Montgomery
County
Permitting Status &
Operational Status
Maryland Facilities
Anne Arundel
Millersville Landfill and Resource Recovery Facility Composting Pad
Tier I - Yard Trimmings (YT)
35,000 N/A No In Operation - GCFP Issued 1/13/2017
Anne Arundel
Tolson & Associates LLC
Tier I - Yard Trimmings
25,000 N/A Yes Planned - GCFP Issued 2/20/2018
Anne Arundel
Veteran Compost - Lothian
Tier II Small - Food Waste (FW)/ Manure/ Wood Chips
20,000 40% FW, 60% YT
Yes Planned - GCFP Issued 3/29/2018
Baltimore Eastern Sanitary Landfill Solid Waste Management Facility
Tier I - Yard Trimmings
20,000 N/A No In Operation - Landfill Permit Modification Issued 11/30/2016
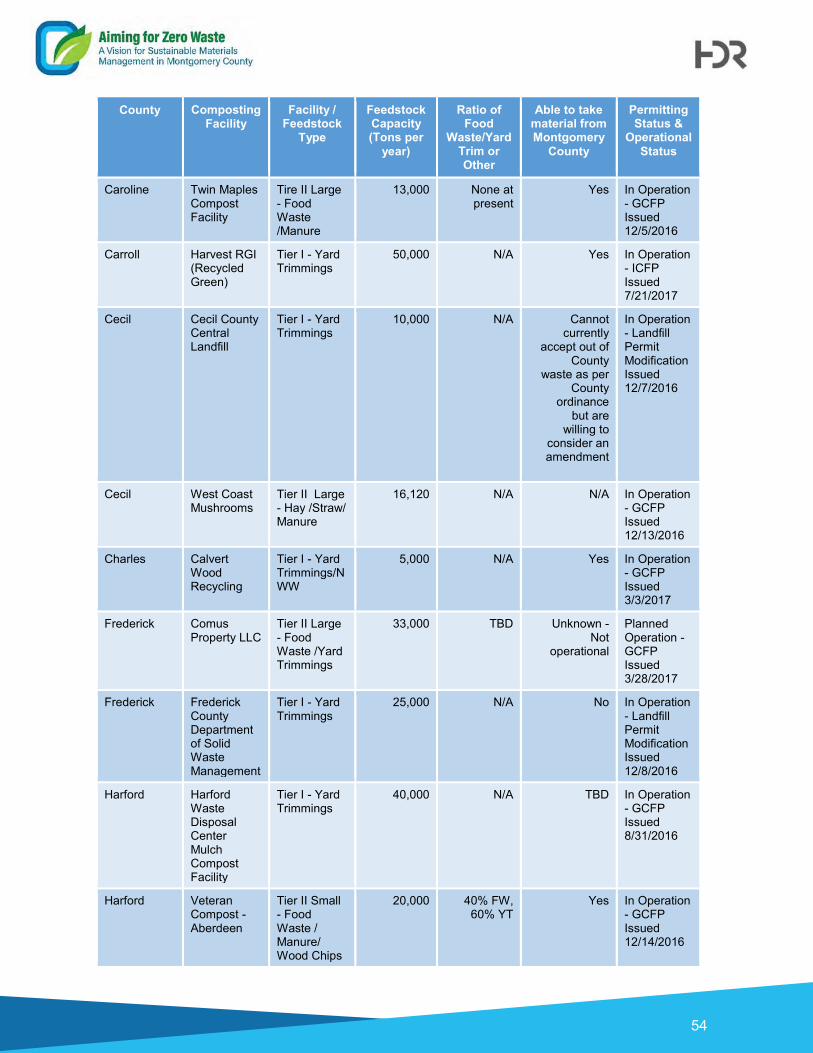
54
County Composting Facility
Facility / Feedstock
Type
Feedstock Capacity (Tons per
year)
Ratio of Food
Waste/Yard Trim or Other
Able to take material from Montgomery
County
Permitting Status &
Operational Status
Caroline Twin Maples Compost Facility
Tire II Large - Food Waste /Manure
13,000 None at present
Yes In Operation - GCFP Issued 12/5/2016
Carroll Harvest RGI (Recycled Green)
Tier I - Yard Trimmings
50,000 N/A Yes In Operation - ICFP Issued 7/21/2017
Cecil Cecil County Central Landfill
Tier I - Yard Trimmings
10,000 N/A Cannot currently
accept out of County
waste as per County
ordinance but are
willing to consider an amendment
In Operation - Landfill Permit Modification Issued 12/7/2016
Cecil West Coast Mushrooms
Tier II Large - Hay /Straw/ Manure
16,120 N/A N/A In Operation - GCFP Issued 12/13/2016
Charles Calvert Wood Recycling
Tier I - Yard Trimmings/NWW
5,000 N/A Yes In Operation - GCFP Issued 3/3/2017
Frederick Comus Property LLC
Tier II Large - Food Waste /Yard Trimmings
33,000 TBD
Unknown - Not
operational
Planned Operation - GCFP Issued 3/28/2017
Frederick Frederick County Department of Solid Waste Management
Tier I - Yard Trimmings
25,000 N/A No In Operation - Landfill Permit Modification Issued 12/8/2016
Harford Harford Waste Disposal Center Mulch Compost Facility
Tier I - Yard Trimmings
40,000 N/A TBD
In Operation - GCFP Issued 8/31/2016
Harford Veteran Compost - Aberdeen
Tier II Small - Food Waste / Manure/ Wood Chips
20,000 40% FW, 60% YT
Yes In Operation - GCFP Issued 12/14/2016

55
County Composting Facility
Facility / Feedstock
Type
Feedstock Capacity (Tons per
year)
Ratio of Food
Waste/Yard Trim or Other
Able to take material from Montgomery
County
Permitting Status &
Operational Status
Howard Composting Facility at Alpha Ridge Landfill
Tier II Large - Food Waste /Yard Trimmings/Manure
12,000 40% FW, 60% YT
No In Operation - GCFP Issued 10/5/2016
Howard Level Land Lisbon Mulch Yard
Tier I - Yard Trimmings
6,250 N/A No
In Operation - GCFP Issued 2/21/2017
Montgomery Montgomery County Yard Trim Composting Facility
Tier I - Yard Trimmings
77,000 N/A No In Operation - GCFP Issued 8/5/2016
Montgomery ACME Biomass Reduction, Inc.
Tier I - Yard Trimmings
19,000 N/A N/A In Operation - GCFP Issued 3/10/2017
Montgomery Aspen Nursery
Tier I - Yard Trimmings
1,250 N/A N/A In Operation - GCFP Issued 4/5/2017
Prince George's
Prince George's County Organics Composting Facility
Tier II Large - Food Scraps /Yard Trimmings
69,000 40% FW, 60% YT
Yes- 6,000 tpy
In Operation - GCFP Issued 10/5/2016
Prince George's
City of College Park
Tier I - Yard Trimmings
5,600 N/A No
In Operation - GCFP Issued 8/31/2016
Prince George's
Cedarville Holdings Composting Facility
Tier I - Yard Trimmings
26,250 N/A Unknown - Not
operational
Planned - GCFP Issued 11/8/2017
Washington 40 West Landfill
Tier I - Yard Trimmings
5,000 N/A No In Operation - Landfill Permit Modification Issued 11/30/2016
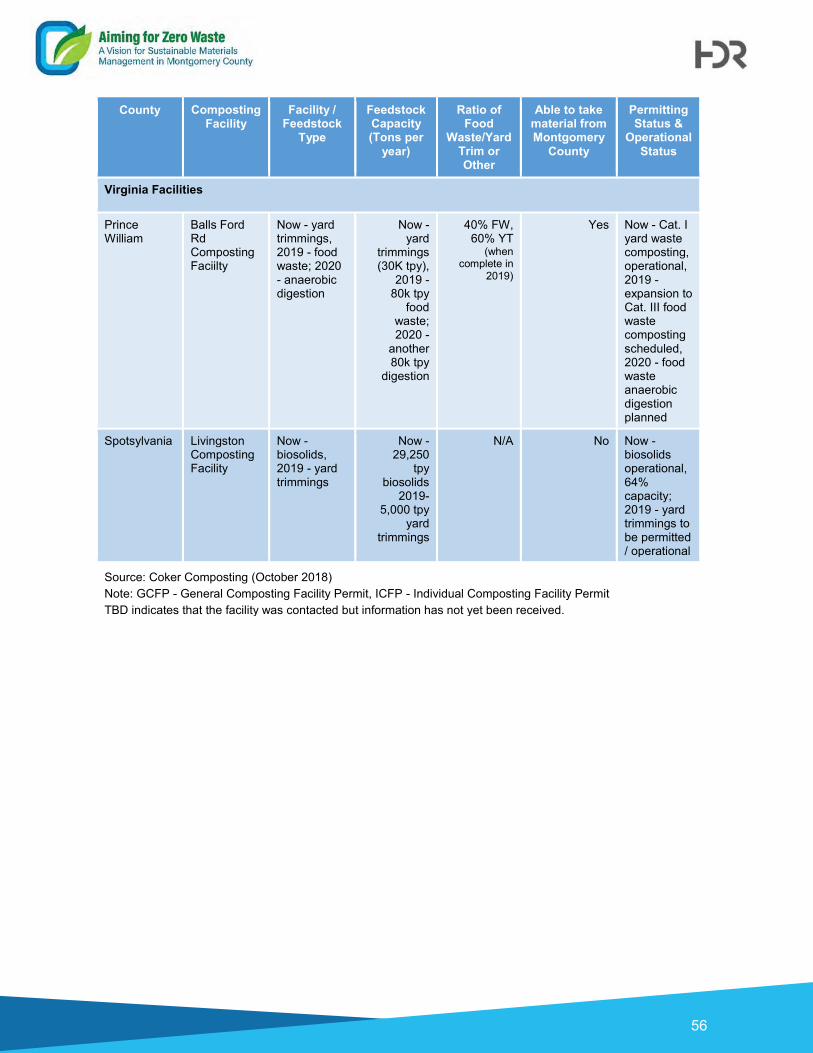
56
County Composting Facility
Facility / Feedstock
Type
Feedstock Capacity (Tons per
year)
Ratio of Food
Waste/Yard Trim or Other
Able to take material from Montgomery
County
Permitting Status &
Operational Status
Virginia Facilities
Prince William
Balls Ford Rd Composting Faciilty
Now - yard trimmings, 2019 - food waste; 2020 - anaerobic digestion
Now - yard
trimmings (30K tpy),
2019 - 80k tpy
food waste; 2020 -
another 80k tpy
digestion
40% FW, 60% YT
(when complete in
2019)
Yes Now - Cat. I yard waste composting, operational, 2019 - expansion to Cat. III food waste composting scheduled, 2020 - food waste anaerobic digestion planned
Spotsylvania Livingston Composting Facility
Now - biosolids, 2019 - yard trimmings
Now - 29,250
tpy biosolids
2019- 5,000 tpy
yard trimmings
N/A No Now - biosolids operational, 64% capacity; 2019 - yard trimmings to be permitted / operational
Source: Coker Composting (October 2018) Note: GCFP - General Composting Facility Permit, ICFP - Individual Composting Facility Permit TBD indicates that the facility was contacted but information has not yet been received.

57
6 Funding & Financial Information The County’s solid waste division has a budget of approximately $100 million per year. The Annual Operating Budget and the Approved Capital Improvements Program for the DEP are updated each year with basic cost information and fiscal data related to the solid waste program.
Under County law, the charges set by the County for solid waste services must equal expenses (i.e. revenue neutral). The solid waste system is funded from an independent, legislatively established Solid Waste Enterprise Fund, primarily funded by:
• Tipping fees,
• Systems benefit charges,
• Trash collection and leaf vacuuming charges, and
• Revenues and credits from the sale of landfill gas, recyclables, and compost.
Table 6-1 presents the 2018 tipping fees charged at the Shady Grove Processing Facility and Transfer Station.
Table 6-1: Shady Grove Processing Facility and Transfer Station Tipping Fees (2018) Material type Fee
Trash loads - under 500 pounds No charge
Trash loads - 500 pounds and over $60.00/ton
Materials delivered for disposal in open-top roll-off boxes - all amounts $70.00/ton
Yard trim - under 500 pounds No charge
Yard trim - 500 pounds and over $46.00/ton
Recyclables (except HHW from businesses) No charge
Source: https://www.montgomerycountymd.gov/sws/dropoff/fees.html Accessed August 9, 2018
The tipping fees are set to achieve full recovery of County solid waste system costs and are adjusted periodically as needed for cost recovery or to use as incentives to help control the flow of material to the Transfer Station and the RRF. The C&D tipping fee is always set higher than the MSW tipping fee. Tipping fees are charged at the Transfer Station, except for residential tipping fees (from non-municipal, single-family residences and multi-family dwellings in buildings comprised of six or fewer dwelling units), which are collected on the tax bill as “Disposal Fees.”
The Solid Waste Charge is paid by property owners in the County. This charge includes disposal fees, base system benefit charges, incremental systems benefit charges, trash collection charges, and leaf vacuuming charges. Table 6-2 below describes each component to the Solid Waste Charge for the Single-family, Multi-family (MF) and Non-residential properties for FY19.
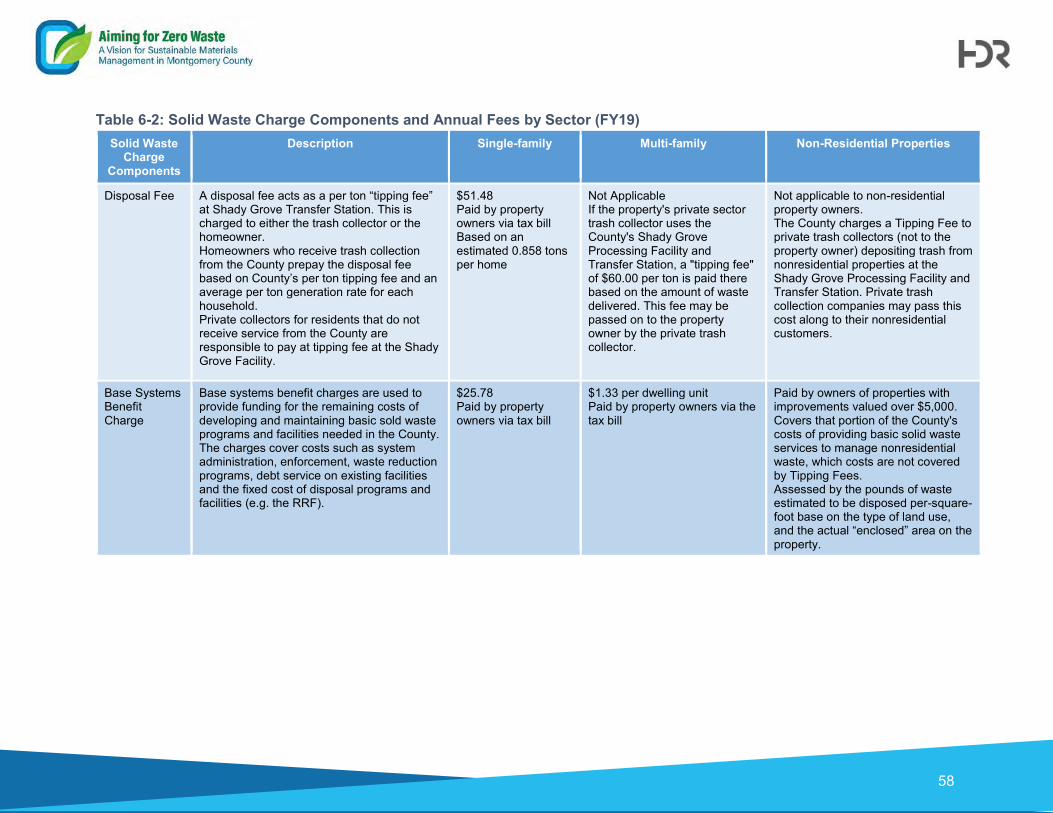
58
Table 6-2: Solid Waste Charge Components and Annual Fees by Sector (FY19) Solid Waste
Charge Components
Description Single-family Multi-family Non-Residential Properties
Disposal Fee A disposal fee acts as a per ton “tipping fee” at Shady Grove Transfer Station. This is charged to either the trash collector or the homeowner. Homeowners who receive trash collection from the County prepay the disposal fee based on County’s per ton tipping fee and an average per ton generation rate for each household. Private collectors for residents that do not receive service from the County are responsible to pay at tipping fee at the Shady Grove Facility.
$51.48 Paid by property owners via tax bill Based on an estimated 0.858 tons per home
Not Applicable If the property's private sector trash collector uses the County's Shady Grove Processing Facility and Transfer Station, a "tipping fee" of $60.00 per ton is paid there based on the amount of waste delivered. This fee may be passed on to the property owner by the private trash collector.
Not applicable to non-residential property owners. The County charges a Tipping Fee to private trash collectors (not to the property owner) depositing trash from nonresidential properties at the Shady Grove Processing Facility and Transfer Station. Private trash collection companies may pass this cost along to their nonresidential customers.
Base Systems Benefit Charge
Base systems benefit charges are used to provide funding for the remaining costs of developing and maintaining basic sold waste programs and facilities needed in the County. The charges cover costs such as system administration, enforcement, waste reduction programs, debt service on existing facilities and the fixed cost of disposal programs and facilities (e.g. the RRF).
$25.78 Paid by property owners via tax bill
$1.33 per dwelling unit Paid by property owners via the tax bill
Paid by owners of properties with improvements valued over $5,000. Covers that portion of the County's costs of providing basic solid waste services to manage nonresidential waste, which costs are not covered by Tipping Fees. Assessed by the pounds of waste estimated to be disposed per-square-foot base on the type of land use, and the actual “enclosed” area on the property.
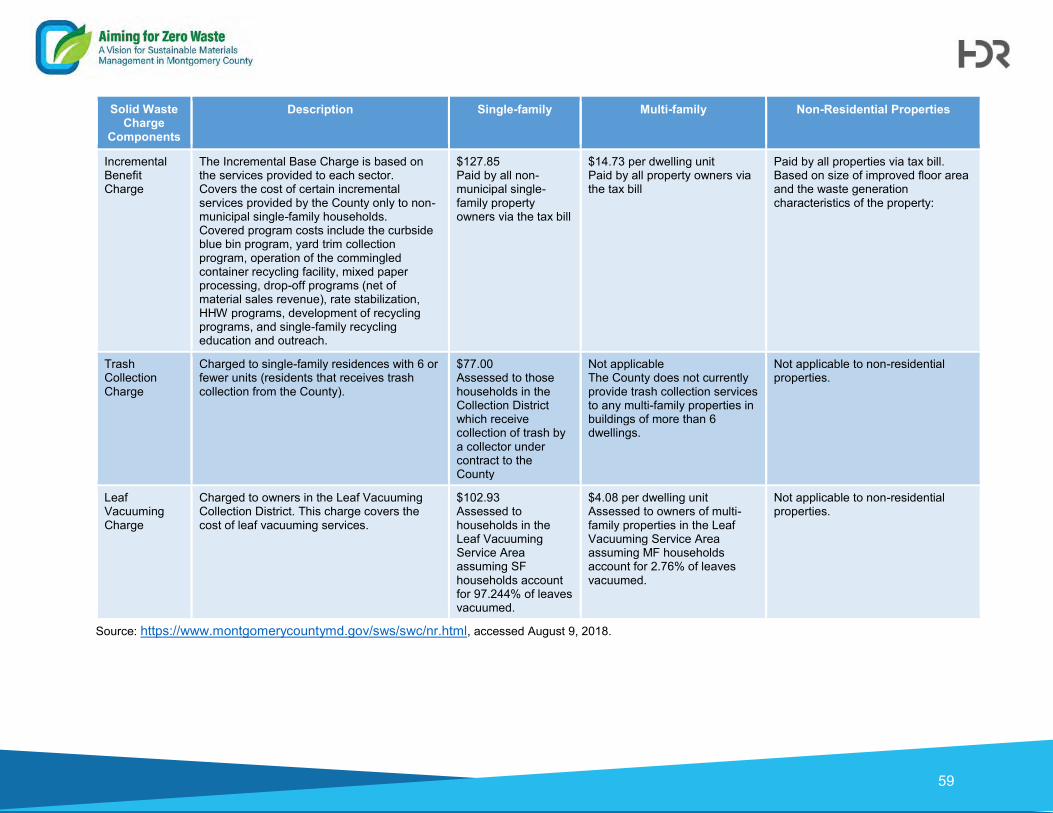
59
Solid Waste Charge
Components
Description Single-family Multi-family Non-Residential Properties
Incremental Benefit Charge
The Incremental Base Charge is based on the services provided to each sector. Covers the cost of certain incremental services provided by the County only to non-municipal single-family households. Covered program costs include the curbside blue bin program, yard trim collection program, operation of the commingled container recycling facility, mixed paper processing, drop-off programs (net of material sales revenue), rate stabilization, HHW programs, development of recycling programs, and single-family recycling education and outreach.
$127.85 Paid by all non-municipal single-family property owners via the tax bill
$14.73 per dwelling unit Paid by all property owners via the tax bill
Paid by all properties via tax bill. Based on size of improved floor area and the waste generation characteristics of the property:
Trash Collection Charge
Charged to single-family residences with 6 or fewer units (residents that receives trash collection from the County).
$77.00 Assessed to those households in the Collection District which receive collection of trash by a collector under contract to the County
Not applicable The County does not currently provide trash collection services to any multi-family properties in buildings of more than 6 dwellings.
Not applicable to non-residential properties.
Leaf Vacuuming Charge
Charged to owners in the Leaf Vacuuming Collection District. This charge covers the cost of leaf vacuuming services.
$102.93 Assessed to households in the Leaf Vacuuming Service Area assuming SF households account for 97.244% of leaves vacuumed.
$4.08 per dwelling unit Assessed to owners of multi-family properties in the Leaf Vacuuming Service Area assuming MF households account for 2.76% of leaves vacuumed.
Not applicable to non-residential properties.
Source: https://www.montgomerycountymd.gov/sws/swc/nr.html, accessed August 9, 2018.
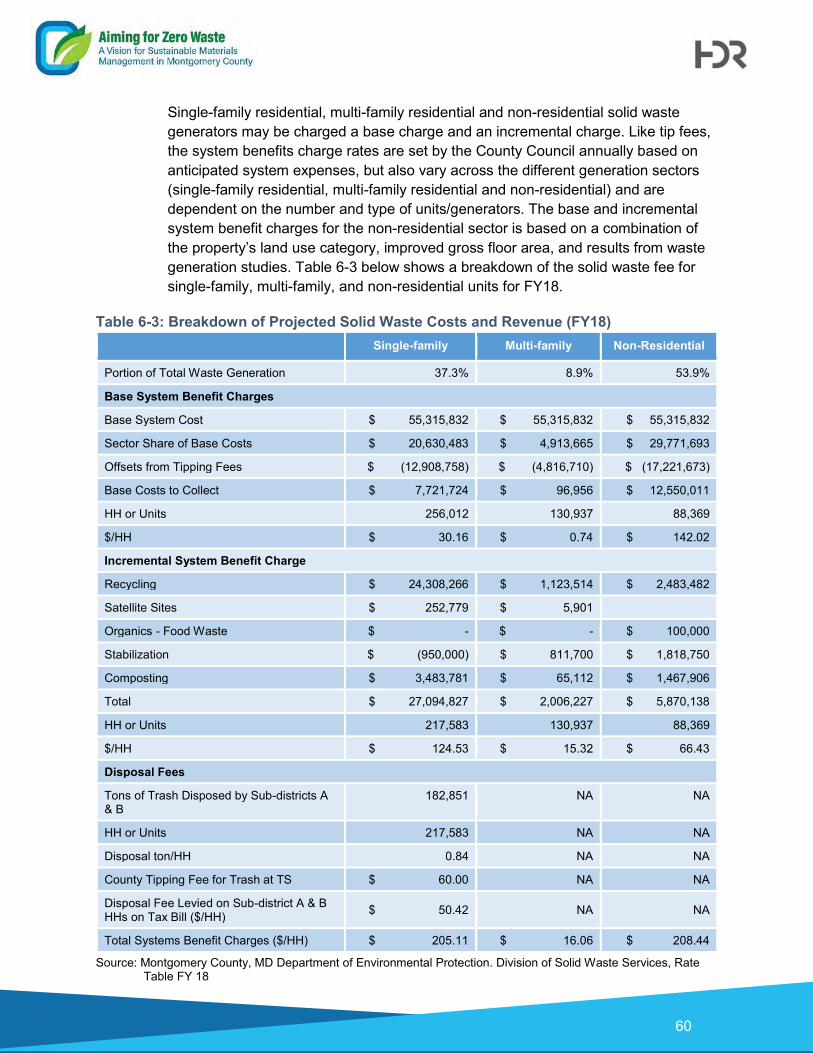
60
Single-family residential, multi-family residential and non-residential solid waste generators may be charged a base charge and an incremental charge. Like tip fees, the system benefits charge rates are set by the County Council annually based on anticipated system expenses, but also vary across the different generation sectors (single-family residential, multi-family residential and non-residential) and are dependent on the number and type of units/generators. The base and incremental system benefit charges for the non-residential sector is based on a combination of the property’s land use category, improved gross floor area, and results from waste generation studies. Table 6-3 below shows a breakdown of the solid waste fee for single-family, multi-family, and non-residential units for FY18.
Table 6-3: Breakdown of Projected Solid Waste Costs and Revenue (FY18)
Single-family Multi-family Non-Residential
Portion of Total Waste Generation 37.3% 8.9% 53.9%
Base System Benefit Charges
Base System Cost $ 55,315,832 $ 55,315,832 $ 55,315,832
Sector Share of Base Costs $ 20,630,483 $ 4,913,665 $ 29,771,693
Offsets from Tipping Fees $ (12,908,758) $ (4,816,710) $ (17,221,673)
Base Costs to Collect $ 7,721,724 $ 96,956 $ 12,550,011
HH or Units 256,012 130,937 88,369
$/HH $ 30.16 $ 0.74 $ 142.02
Incremental System Benefit Charge
Recycling $ 24,308,266 $ 1,123,514 $ 2,483,482
Satellite Sites $ 252,779 $ 5,901
Organics - Food Waste $ - $ - $ 100,000
Stabilization $ (950,000) $ 811,700 $ 1,818,750
Composting $ 3,483,781 $ 65,112 $ 1,467,906
Total $ 27,094,827 $ 2,006,227 $ 5,870,138
HH or Units 217,583 130,937 88,369
$/HH $ 124.53 $ 15.32 $ 66.43
Disposal Fees
Tons of Trash Disposed by Sub-districts A & B
182,851 NA NA
HH or Units 217,583 NA NA
Disposal ton/HH 0.84 NA NA
County Tipping Fee for Trash at TS $ 60.00 NA NA
Disposal Fee Levied on Sub-district A & B HHs on Tax Bill ($/HH) $ 50.42 NA NA
Total Systems Benefit Charges ($/HH) $ 205.11 $ 16.06 $ 208.44
Source: Montgomery County, MD Department of Environmental Protection. Division of Solid Waste Services, Rate Table FY 18
61
Trash collection is funded by a separate revenue stream of charges assessed to single-family residences in Sub-district A. Leaf Vacuuming is funded by a separate revenue stream of charges assessed to single-family and multi-family residences within the Leaf Recycling Service Area of the County.
The County solid waste program also generates a variety of revenues and credits for the Solid Waste Enterprise Fund, which offset the amount needed for systems benefit charges. Sources of revenue include the sale of electricity from closed landfills and the RRF, sale of recyclables from the MRF and recovered ferrous metals from the RRF, and the sale of compost and mulch products from the Yard Trim Composting Facility and the Shady Grove Processing Facility and Transfer Station. Additional revenues are generated from interest on reserves in the Solid Waste Enterprise Fund, and other miscellaneous sources.
The total disposal and collection costs for FY 2018 were $101,936,495. Table 6-4 below presents a detailed itemization of the costs included as part of collection and disposal.
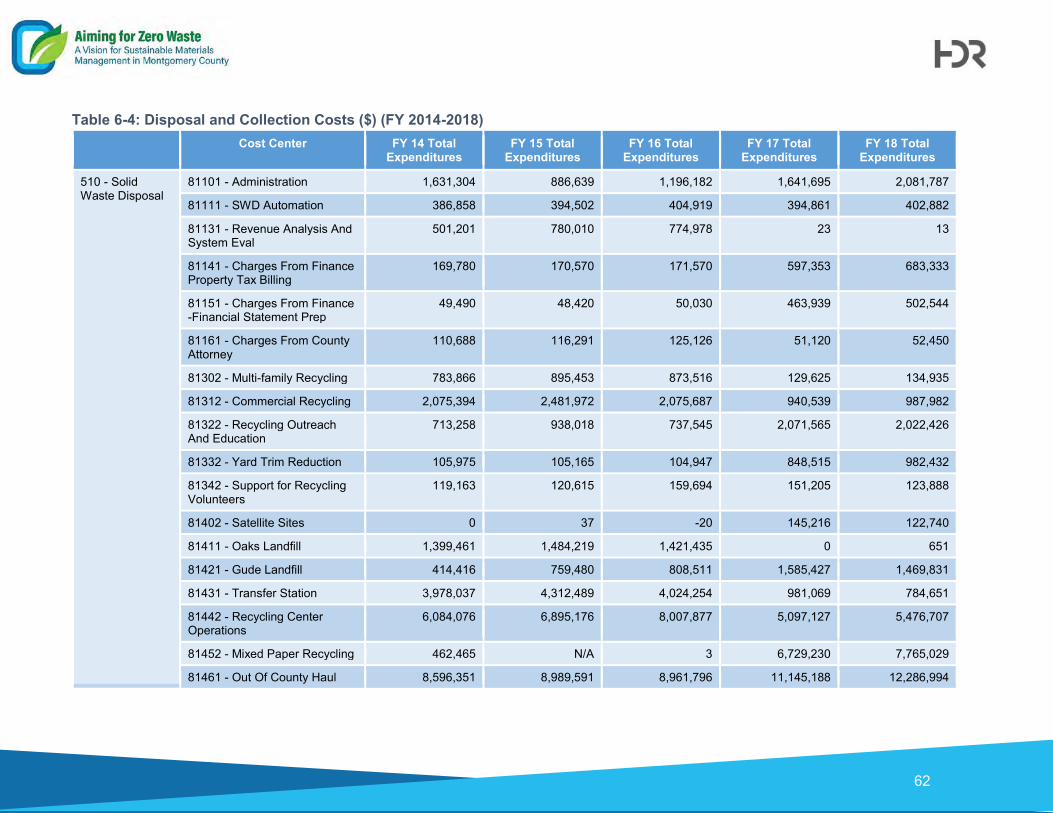
62
Table 6-4: Disposal and Collection Costs ($) (FY 2014-2018)
Cost Center FY 14 Total Expenditures
FY 15 Total Expenditures
FY 16 Total Expenditures
FY 17 Total Expenditures
FY 18 Total Expenditures
510 - Solid Waste Disposal
81101 - Administration 1,631,304 886,639 1,196,182 1,641,695 2,081,787
81111 - SWD Automation 386,858 394,502 404,919 394,861 402,882
81131 - Revenue Analysis And System Eval
501,201 780,010 774,978 23 13
81141 - Charges From Finance Property Tax Billing
169,780 170,570 171,570 597,353 683,333
81151 - Charges From Finance -Financial Statement Prep
49,490 48,420 50,030 463,939 502,544
81161 - Charges From County Attorney
110,688 116,291 125,126 51,120 52,450
81302 - Multi-family Recycling 783,866 895,453 873,516 129,625 134,935
81312 - Commercial Recycling 2,075,394 2,481,972 2,075,687 940,539 987,982
81322 - Recycling Outreach And Education
713,258 938,018 737,545 2,071,565 2,022,426
81332 - Yard Trim Reduction 105,975 105,165 104,947 848,515 982,432
81342 - Support for Recycling Volunteers
119,163 120,615 159,694 151,205 123,888
81402 - Satellite Sites 0 37 -20 145,216 122,740
81411 - Oaks Landfill 1,399,461 1,484,219 1,421,435 0 651
81421 - Gude Landfill 414,416 759,480 808,511 1,585,427 1,469,831
81431 - Transfer Station 3,978,037 4,312,489 4,024,254 981,069 784,651
81442 - Recycling Center Operations
6,084,076 6,895,176 8,007,877 5,097,127 5,476,707
81452 - Mixed Paper Recycling 462,465 N/A 3 6,729,230 7,765,029
81461 - Out Of County Haul 8,596,351 8,989,591 8,961,796 11,145,188 12,286,994
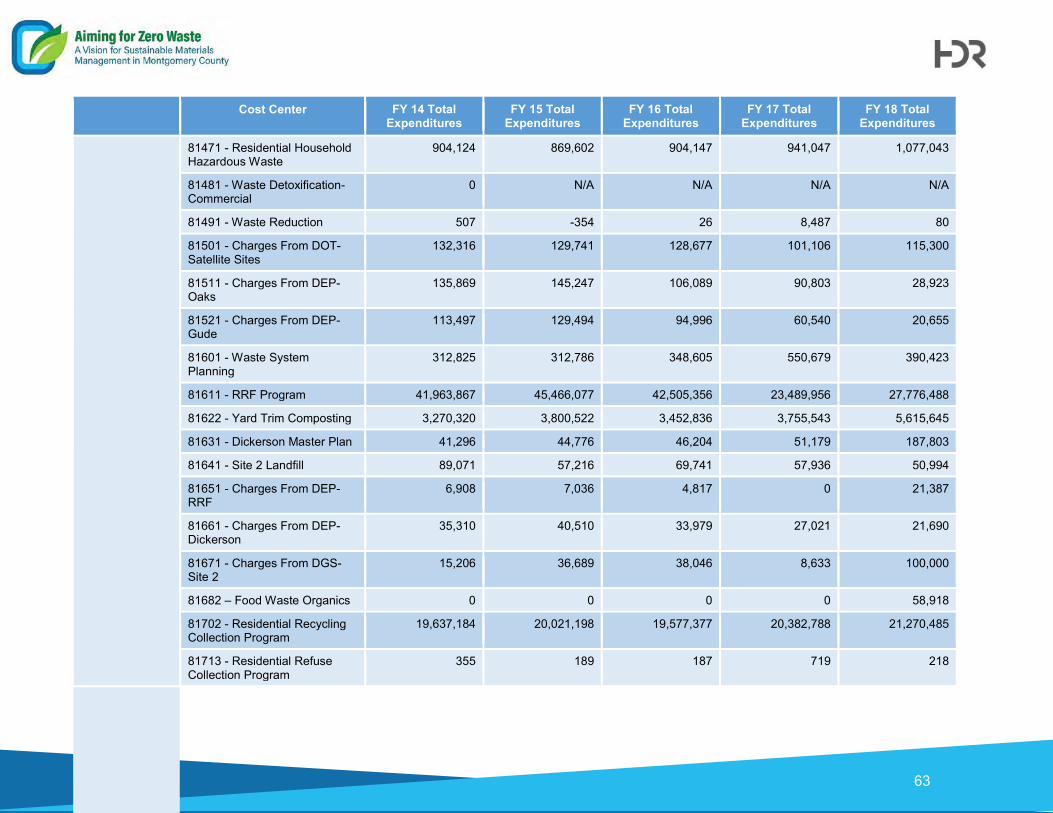
63
Cost Center FY 14 Total
Expenditures FY 15 Total
Expenditures FY 16 Total
Expenditures FY 17 Total
Expenditures FY 18 Total
Expenditures
81471 - Residential Household Hazardous Waste
904,124 869,602 904,147 941,047 1,077,043
81481 - Waste Detoxification-Commercial
0 N/A N/A N/A N/A
81491 - Waste Reduction 507 -354 26 8,487 80
81501 - Charges From DOT-Satellite Sites
132,316 129,741 128,677 101,106 115,300
81511 - Charges From DEP-Oaks
135,869 145,247 106,089 90,803 28,923
81521 - Charges From DEP-Gude
113,497 129,494 94,996 60,540 20,655
81601 - Waste System Planning
312,825 312,786 348,605 550,679 390,423
81611 - RRF Program 41,963,867 45,466,077 42,505,356 23,489,956 27,776,488
81622 - Yard Trim Composting 3,270,320 3,800,522 3,452,836 3,755,543 5,615,645
81631 - Dickerson Master Plan 41,296 44,776 46,204 51,179 187,803
81641 - Site 2 Landfill 89,071 57,216 69,741 57,936 50,994
81651 - Charges From DEP-RRF
6,908 7,036 4,817 0 21,387
81661 - Charges From DEP-Dickerson
35,310 40,510 33,979 27,021 21,690
81671 - Charges From DGS-Site 2
15,206 36,689 38,046 8,633 100,000
81682 – Food Waste Organics 0 0 0 0 58,918
81702 - Residential Recycling Collection Program
19,637,184 20,021,198 19,577,377 20,382,788 21,270,485
81713 - Residential Refuse Collection Program
355 189 187 719 218

64
Cost Center FY 14 Total
Expenditures FY 15 Total
Expenditures FY 16 Total
Expenditures FY 17 Total
Expenditures FY 18 Total
Expenditures
81721 - Charges From DEP-Enforcement
341,970 344,196 374,885 398,763 414,878
81731 - Charges From DHCA-Enforcement
572,783 698,859 713,560 656,779 775,986
81741 - Charges From Dot - Clean & Lien
7,140 9,418 8,802 9,175 6,278
81751 - Charges from PIO (MC311)
264,359 315,982 307,781 280,645 297,886
512 - Solid Waste Collection
81101 - Administration 225,015 165,222 151,080 288,649 263,810
81111 - SWD Automation 56,970 122,769 96,705 106,707 93,446
81141 - Charges From Finance Property Tax Billing
85,400 85,690 86,000 232,008 250,581
81151 - Charges From Finance -Financial Statement Prep
5,270 4,920 5,070 5,170 5,350
81161 - Charges From County Attorney
36,900 38,768 41,713 43,214 44,984
81713 - Residential Refuse Collection Program
5,451,759 5,561,508 5,461,488 5,894,155 7,153,678
81751 - Charges from PIO (MC311)
68,534 78,356 78,593 71,555 71,208
Grand Total 101,356,538 107,865,064 104,534,810 90,486,951 101,936,495
Source: Montgomery County, MD Department of Environmental Protection. Division of Solid Waste Services, Rate Table FY 18
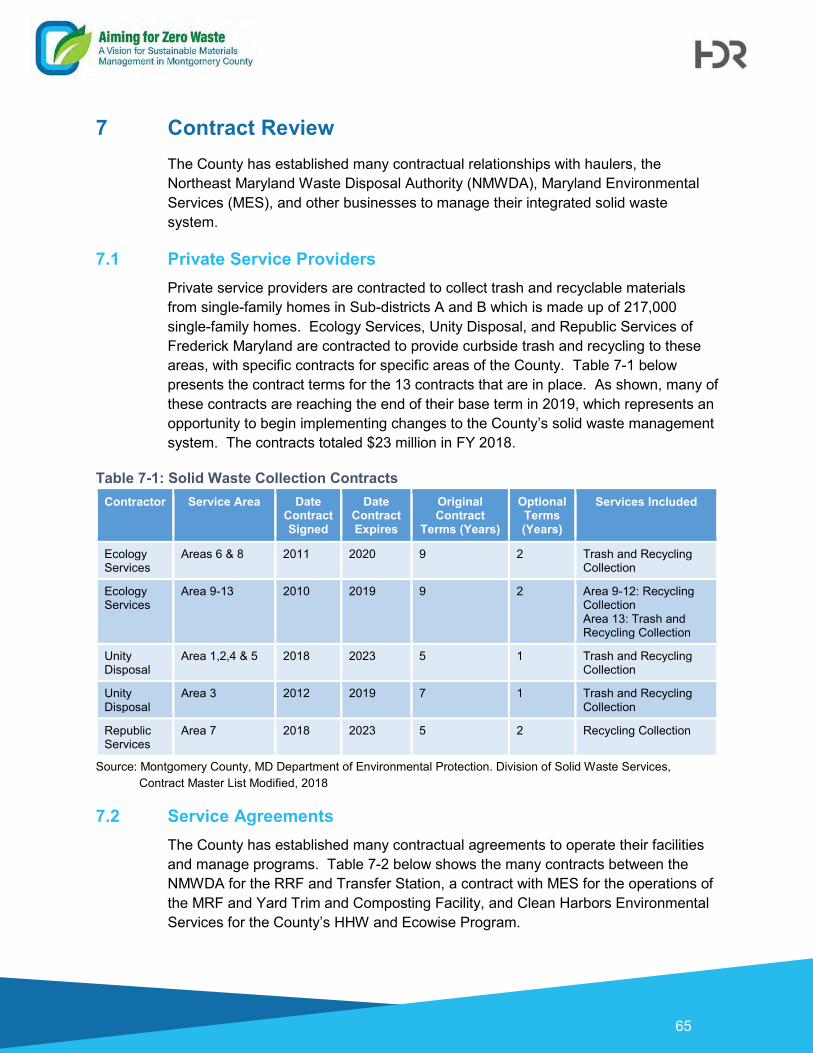
65
7 Contract Review The County has established many contractual relationships with haulers, the Northeast Maryland Waste Disposal Authority (NMWDA), Maryland Environmental Services (MES), and other businesses to manage their integrated solid waste system.
7.1 Private Service Providers Private service providers are contracted to collect trash and recyclable materials from single-family homes in Sub-districts A and B which is made up of 217,000 single-family homes. Ecology Services, Unity Disposal, and Republic Services of Frederick Maryland are contracted to provide curbside trash and recycling to these areas, with specific contracts for specific areas of the County. Table 7-1 below presents the contract terms for the 13 contracts that are in place. As shown, many of these contracts are reaching the end of their base term in 2019, which represents an opportunity to begin implementing changes to the County’s solid waste management system. The contracts totaled $23 million in FY 2018.
Table 7-1: Solid Waste Collection Contracts Contractor Service Area Date
Contract Signed
Date Contract Expires
Original Contract
Terms (Years)
Optional Terms (Years)
Services Included
Ecology Services
Areas 6 & 8 2011 2020 9 2 Trash and Recycling Collection
Ecology Services
Area 9-13 2010 2019 9 2 Area 9-12: Recycling Collection Area 13: Trash and Recycling Collection
Unity Disposal
Area 1,2,4 & 5 2018 2023 5 1 Trash and Recycling Collection
Unity Disposal
Area 3 2012 2019 7 1 Trash and Recycling Collection
Republic Services
Area 7 2018 2023 5 2 Recycling Collection
Source: Montgomery County, MD Department of Environmental Protection. Division of Solid Waste Services, Contract Master List Modified, 2018
7.2 Service Agreements The County has established many contractual agreements to operate their facilities and manage programs. Table 7-2 below shows the many contracts between the NMWDA for the RRF and Transfer Station, a contract with MES for the operations of the MRF and Yard Trim and Composting Facility, and Clean Harbors Environmental Services for the County’s HHW and Ecowise Program.

66
Table 7-2: Service Agreements Contractor Contract
Agreement Date
Contract Signed
Date Contract Expires
Original Contract
Term (Years)
Optional Terms (Years)
NMWDA Waste Disposal Agreement (RRF)
1990 2016 (extended to 2021)
23 (Retirement of Bonds)
automatically extends for an additional 5 years unless notice provided 180 days before end of first renewal
NMWDA Service Agreement (RRF)
1990 2016 (extended to 2021)
23 (Retirement of Bonds)
automatically extends for an additional 5 years unless notice provided 180 days before end of first renewal
NMWDA Intergovernmental Agreement
2007 2009 1.5 Extended to June 30, 2021
NMWDA Various agreements including Solar Power and Services (Sun Edison, LLC), LFGE, electronics and other task orders
As required
MES MRF and Yard Trim and Composting Facility Operations
2016 2019 3 3
Clean Harbors Environmental Services
HHW and Ecowise Program
2012 2015 3 2 plus one
Various contracts for maintenance and operation of landfills, general maintenance and repair, emergency debris management, textile recycling and supply of recycling carts and bins.
Various contracts for consulting, analytical, engineering and environmental studies.
Source: Montgomery County, MD Department of Environmental Protection. Division of Solid Waste Services, Contract Master List Modified, 2018
7.3 Educational Programs The County contracts with five competitively selected firms to assist in development of materials to support educational initiatives of the County’s Waste Reduction and Recycling Program. Table 7-3 below presents the current contracts and terms. The education and outreach services support efforts to keep single-family residents, multi-family residents and properties, as well as owners, managers, and employees of businesses, non-profit organizations, and government facilities informed about waste reduction, reuse, recycling, buying recycled, and relevant activities through mail, social media, press releases, educational events, awareness campaigns, and special promotions. Education is provided with the intent of instilling information that will affect behavior in a positive way, to further reduce waste, increase reuse, recycling and buying recycled in the County.
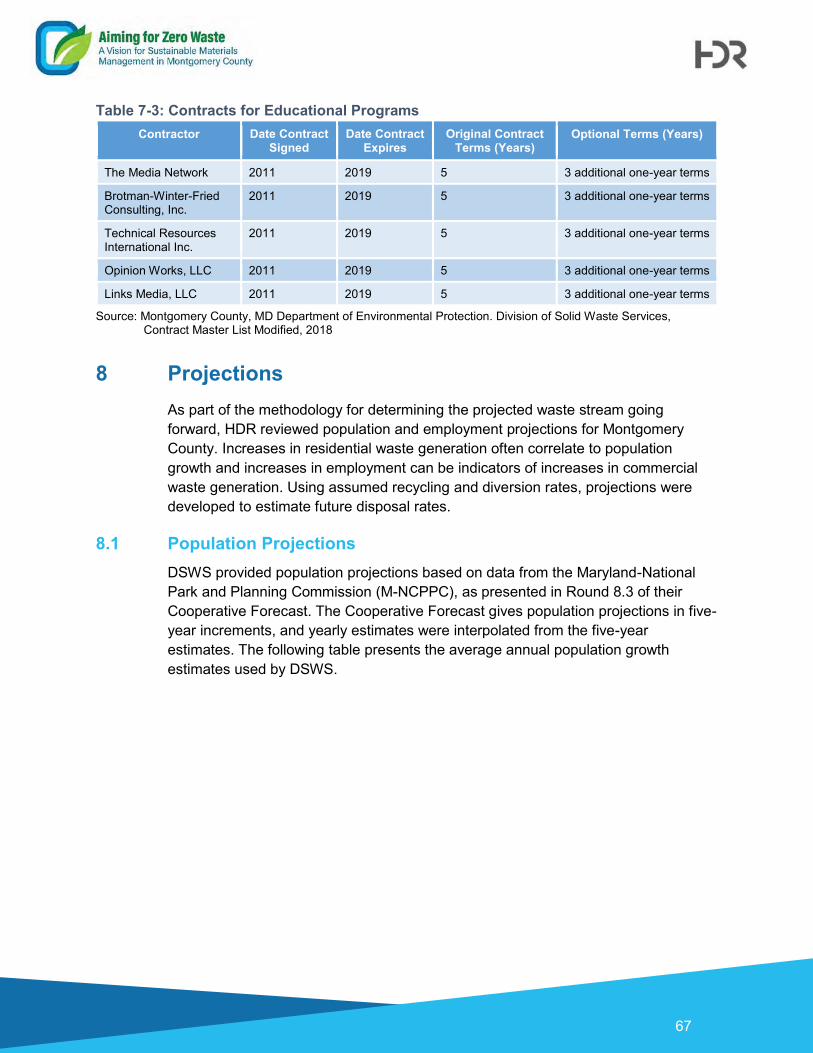
67
Table 7-3: Contracts for Educational Programs Contractor Date Contract
Signed Date Contract
Expires Original Contract
Terms (Years) Optional Terms (Years)
The Media Network 2011 2019 5 3 additional one-year terms
Brotman-Winter-Fried Consulting, Inc.
2011 2019 5 3 additional one-year terms
Technical Resources International Inc.
2011 2019 5 3 additional one-year terms
Opinion Works, LLC 2011 2019 5 3 additional one-year terms
Links Media, LLC 2011 2019 5 3 additional one-year terms
Source: Montgomery County, MD Department of Environmental Protection. Division of Solid Waste Services, Contract Master List Modified, 2018
8 Projections As part of the methodology for determining the projected waste stream going forward, HDR reviewed population and employment projections for Montgomery County. Increases in residential waste generation often correlate to population growth and increases in employment can be indicators of increases in commercial waste generation. Using assumed recycling and diversion rates, projections were developed to estimate future disposal rates.
8.1 Population Projections DSWS provided population projections based on data from the Maryland-National Park and Planning Commission (M-NCPPC), as presented in Round 8.3 of their Cooperative Forecast. The Cooperative Forecast gives population projections in five-year increments, and yearly estimates were interpolated from the five-year estimates. The following table presents the average annual population growth estimates used by DSWS.

68
Table 8-1: Average Annual Population Growth (2018 to 2030)
Calendar Year Estimated County Population*
2018 1,052,888
2019 1,062,214
2020 1,071,540
2021 1,080,062
2022 1,088,584
2023 1,097,106
2024 1,105,628
2025 1,114,150
2026 1,122,160
2027 1,130,170
2028 1,138,180
2029 1,146,190
2030 1,154,200
*Source: MNCPPC, Cooperative Forecast. Round 8.3, five-year increments. Used by DSWS.
8.2 Commercial Sector Growth DSWS provided employment projections, based on Round 8.3 of the Cooperative Forecast. Each round of the Cooperative Forecast has revised future growth projections to be less than the previous round estimated. Round 8.3 estimates an average growth of 1.03 percent per year from 2018 to 2030 (interpolating between the 5-year increments projected), resulting in a projected employment of 635,000 in the year 2030. The at-place employment projections from Cooperative Forecast Round 8.3 are shown in Table 8-2, based on an average annual growth.
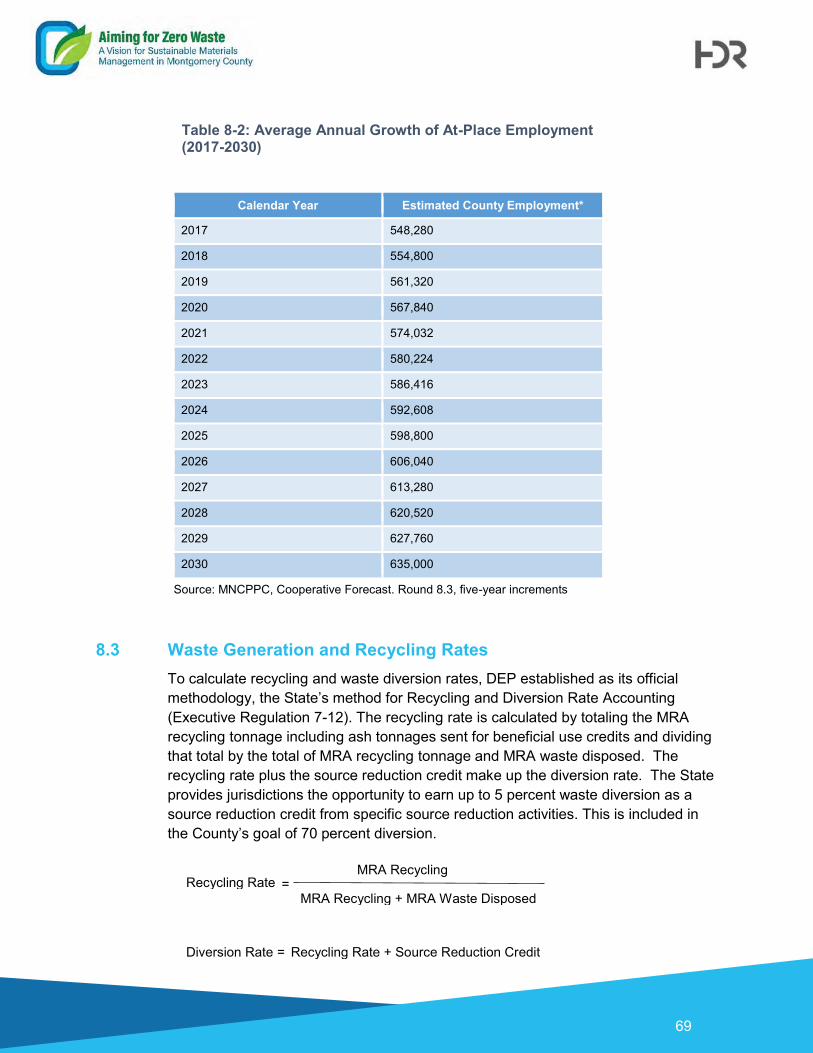
69
Table 8-2: Average Annual Growth of At-Place Employment (2017-2030)
Calendar Year Estimated County Employment*
2017 548,280
2018 554,800
2019 561,320
2020 567,840
2021 574,032
2022 580,224
2023 586,416
2024 592,608
2025 598,800
2026 606,040
2027 613,280
2028 620,520
2029 627,760
2030 635,000
Source: MNCPPC, Cooperative Forecast. Round 8.3, five-year increments
8.3 Waste Generation and Recycling Rates To calculate recycling and waste diversion rates, DEP established as its official methodology, the State’s method for Recycling and Diversion Rate Accounting (Executive Regulation 7-12). The recycling rate is calculated by totaling the MRA recycling tonnage including ash tonnages sent for beneficial use credits and dividing that total by the total of MRA recycling tonnage and MRA waste disposed. The recycling rate plus the source reduction credit make up the diversion rate. The State provides jurisdictions the opportunity to earn up to 5 percent waste diversion as a source reduction credit from specific source reduction activities. This is included in the County’s goal of 70 percent diversion.
= Recycling Rate MRA Recycling
MRA Recycling + MRA Waste Disposed
Recycling Rate + Source Reduction Credit Diversion Rate =
70
Montgomery County’s current recycling rate goal is 70% by 2020. In CY 2017, Montgomery County generated 616,732 tons of MRA recyclables. The residential sector was responsible for 285,236 tons and the commercial sector was responsible for 331,496 tons. Table 8-3 below shows a breakdown of the MRA materials generated in 2017.
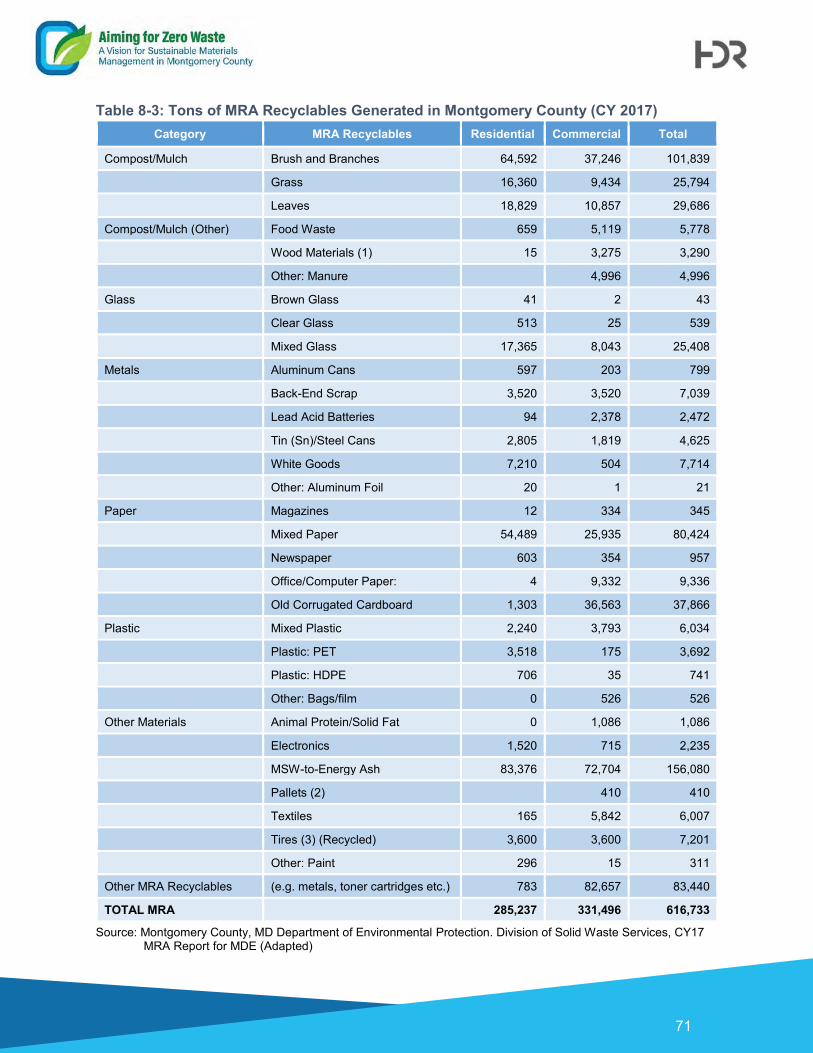
71
Table 8-3: Tons of MRA Recyclables Generated in Montgomery County (CY 2017) Category MRA Recyclables Residential Commercial Total
Compost/Mulch Brush and Branches 64,592 37,246 101,839
Grass 16,360 9,434 25,794
Leaves 18,829 10,857 29,686
Compost/Mulch (Other) Food Waste 659 5,119 5,778
Wood Materials (1) 15 3,275 3,290
Other: Manure 4,996 4,996
Glass Brown Glass 41 2 43
Clear Glass 513 25 539
Mixed Glass 17,365 8,043 25,408
Metals Aluminum Cans 597 203 799
Back-End Scrap 3,520 3,520 7,039
Lead Acid Batteries 94 2,378 2,472
Tin (Sn)/Steel Cans 2,805 1,819 4,625
White Goods 7,210 504 7,714
Other: Aluminum Foil 20 1 21
Paper Magazines 12 334 345
Mixed Paper 54,489 25,935 80,424
Newspaper 603 354 957
Office/Computer Paper: 4 9,332 9,336
Old Corrugated Cardboard 1,303 36,563 37,866
Plastic Mixed Plastic 2,240 3,793 6,034
Plastic: PET 3,518 175 3,692
Plastic: HDPE 706 35 741
Other: Bags/film 0 526 526
Other Materials Animal Protein/Solid Fat 0 1,086 1,086
Electronics 1,520 715 2,235
MSW-to-Energy Ash 83,376 72,704 156,080
Pallets (2) 410 410
Textiles 165 5,842 6,007
Tires (3) (Recycled) 3,600 3,600 7,201
Other: Paint 296 15 311
Other MRA Recyclables (e.g. metals, toner cartridges etc.) 783 82,657 83,440
TOTAL MRA 285,237 331,496 616,733
Source: Montgomery County, MD Department of Environmental Protection. Division of Solid Waste Services, CY17 MRA Report for MDE (Adapted)
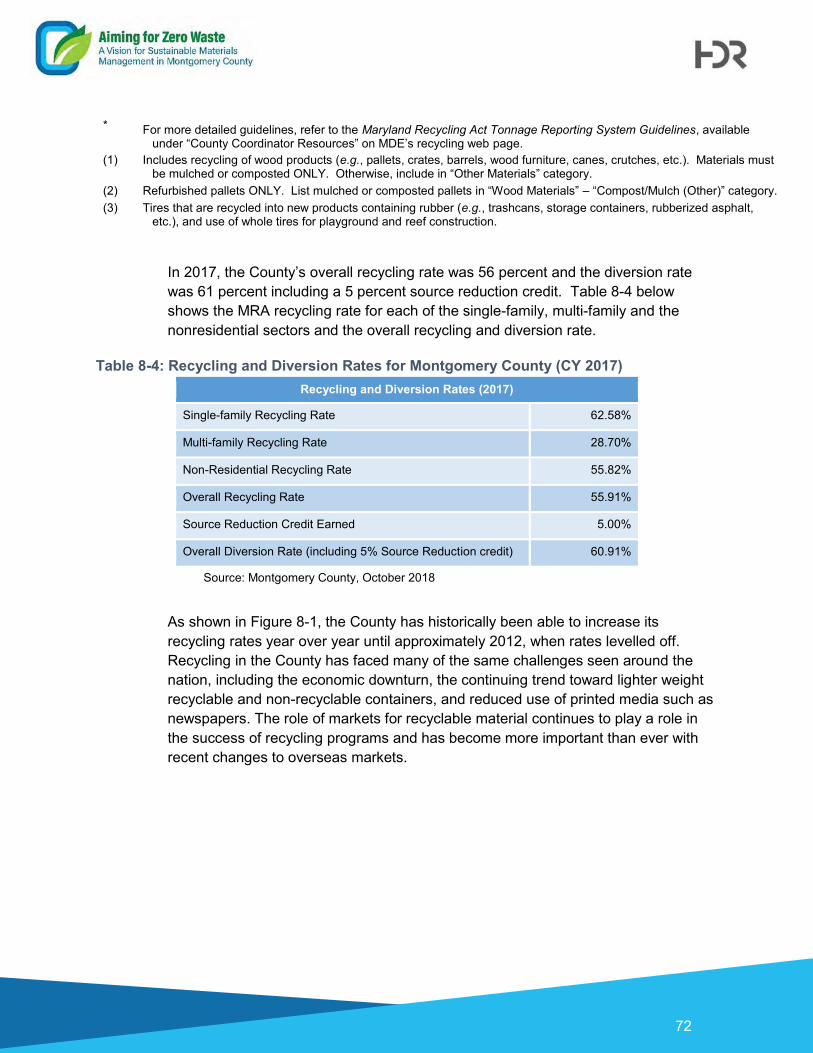
72
* For more detailed guidelines, refer to the Maryland Recycling Act Tonnage Reporting System Guidelines, available
under “County Coordinator Resources” on MDE’s recycling web page. (1) Includes recycling of wood products (e.g., pallets, crates, barrels, wood furniture, canes, crutches, etc.). Materials must
be mulched or composted ONLY. Otherwise, include in “Other Materials” category. (2) Refurbished pallets ONLY. List mulched or composted pallets in “Wood Materials” – “Compost/Mulch (Other)” category. (3) Tires that are recycled into new products containing rubber (e.g., trashcans, storage containers, rubberized asphalt,
etc.), and use of whole tires for playground and reef construction.
In 2017, the County’s overall recycling rate was 56 percent and the diversion rate was 61 percent including a 5 percent source reduction credit. Table 8-4 below shows the MRA recycling rate for each of the single-family, multi-family and the nonresidential sectors and the overall recycling and diversion rate.
Table 8-4: Recycling and Diversion Rates for Montgomery County (CY 2017) Recycling and Diversion Rates (2017)
Single-family Recycling Rate 62.58%
Multi-family Recycling Rate 28.70%
Non-Residential Recycling Rate 55.82%
Overall Recycling Rate 55.91%
Source Reduction Credit Earned 5.00%
Overall Diversion Rate (including 5% Source Reduction credit) 60.91%
Source: Montgomery County, October 2018
As shown in Figure 8-1, the County has historically been able to increase its recycling rates year over year until approximately 2012, when rates levelled off. Recycling in the County has faced many of the same challenges seen around the nation, including the economic downturn, the continuing trend toward lighter weight recyclable and non-recyclable containers, and reduced use of printed media such as newspapers. The role of markets for recyclable material continues to play a role in the success of recycling programs and has become more important than ever with recent changes to overseas markets.
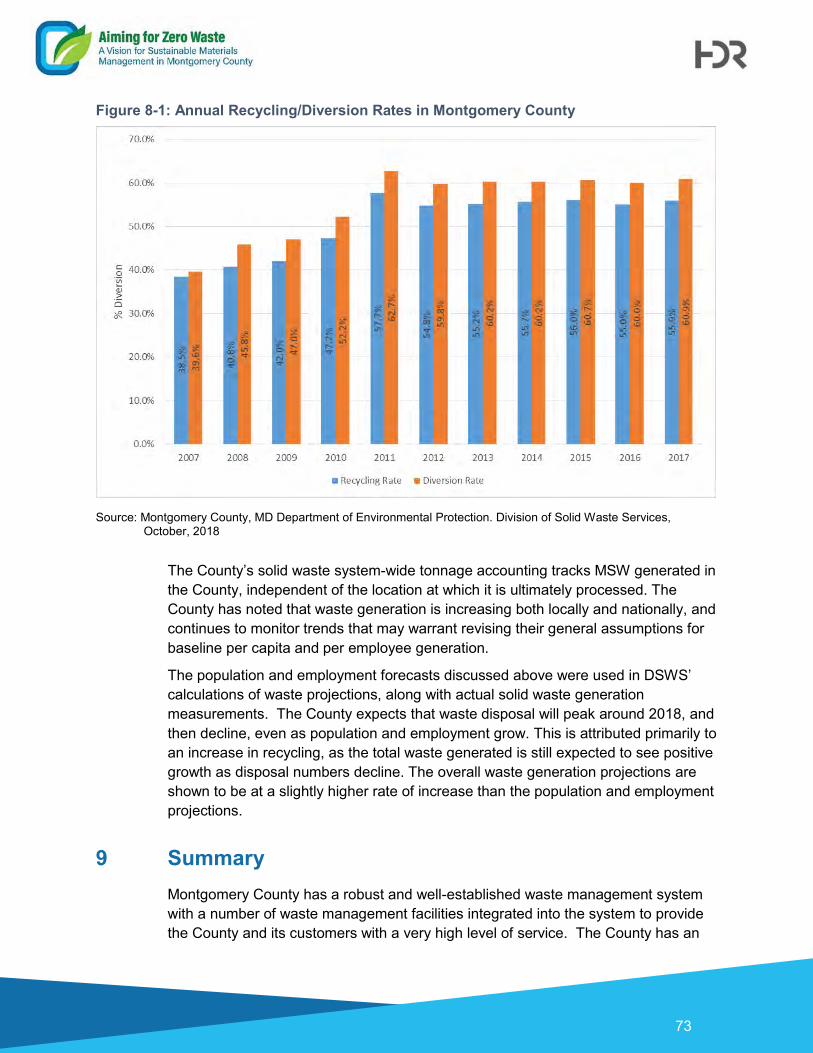
73
Figure 8-1: Annual Recycling/Diversion Rates in Montgomery County
Source: Montgomery County, MD Department of Environmental Protection. Division of Solid Waste Services, October, 2018
The County’s solid waste system-wide tonnage accounting tracks MSW generated in the County, independent of the location at which it is ultimately processed. The County has noted that waste generation is increasing both locally and nationally, and continues to monitor trends that may warrant revising their general assumptions for baseline per capita and per employee generation.
The population and employment forecasts discussed above were used in DSWS’ calculations of waste projections, along with actual solid waste generation measurements. The County expects that waste disposal will peak around 2018, and then decline, even as population and employment grow. This is attributed primarily to an increase in recycling, as the total waste generated is still expected to see positive growth as disposal numbers decline. The overall waste generation projections are shown to be at a slightly higher rate of increase than the population and employment projections.
9 Summary Montgomery County has a robust and well-established waste management system with a number of waste management facilities integrated into the system to provide the County and its customers with a very high level of service. The County has an
74
extensive suite of services and programs designed to reduce waste, and increase reuse, recycling, and buying recycled, supported by a comprehensive education, technical assistance, and enforcement program.
The County’s forward thinking sustainable materials management program has enabled gains in diversion rates. In 2016 with a MRA waste diversion rate of 60 percent, the County had the second highest diversion rate in Maryland, just 0.6 percent from the top-performing county (Prince George’s). Montgomery County will be benchmarked against five other communities in North America as part of Task 2.
The County has a goal of reducing waste and recycling 70 percent of all waste generated by 2020. While the County has attained a very respectable diversion rate of over 61 percent (2017), there is still a considerable gap. The 70 percent target was premised on the diversion of additional materials such as food scraps to allow the County to achieve higher diversion rates; however, issues such as a lack of processing capacity has hindered implementation of a food scraps program. The County has taken steps toward diversion of organics, with the development of a Strategic Plan to Advance Composting, Compost Use and Food Scrap Diversion (April 2018) as called for in Bill 28-16. Additional investigation on food scrap diversion will be conducted as part of Task 5.
A well-staffed, very effective education, technical assistance, and enforcement program has been developed that is not seen in many municipalities. A full range of education and technical materials have been developed for all aspects of the County’s programs and are available in a variety of forms (print, electronic, in-person visits, tours etc.).
The County has also taken the proactive step of developing regulations to guide their waste management program. Too often, effective ordinances or regulations are not in place to govern waste management programs.
The County does not provide the same level of service to all residents within the County, with those residents in Sub-District B having to contract for their own trash collection services. Additionally, incorporated municipalities in the County provide their own trash and recycling collection services. The County could look at harmonizing levels of service within the County, and aligning contracts to identify efficiencies in service provision, greater levels of control about services provided, encouraging diversion through County-provided services (e.g. provision of weekly trash collection instead of contracting for increased collection frequency), consistency in messaging about waste management, and County-provided collection containers to make it easier for participants. The County may also wish to examine certain policies such as the number of bulk trash pickups, guidelines for scrap metal pickup (e.g. requirement to be larger than a trash can), number of trash containers set out for collection, etc.
The County owns significant waste management infrastructure assets including a Material Recycling Facility (MRF), the Shady Grove Processing Facility and Transfer
75
Station, the Resource Recovery Facility, the Composting facility, closed landfills, and land designated for future landfill capacity. HDR will be conducting a detailed review of these facilities as part of Task 8 but as part of Task 1, staff conducted site visits of the County’s waste management infrastructure. Based on those visits and information provided to HDR by staff, the following preliminary observations are noted:
• Upgrades to the MRF, particularly for the commingled side, are required as the facility relies heavily on manual sorting of materials and the equipment is outdated and not replaceable.
• The Shady Grove Processing Facility and Transfer Station is a heavily used facility by both the public and commercial sector. The Transfer Station has very convenient hours, open seven days a week. The tipping floor is particularly busy and County staff have indicated some changes are planned to improve traffic flow. This facility collects a wide variety of divertible material, not typically seen at most transfer stations.
• Increasing residential density near the County’s waste management facilities may pose an issue with increased competition for rail line use (for the intermodal containers), and increases in traffic, odor and noise complaints.
• The County relies on some Out-of-County disposal capacity for some materials. It appears that there is good capacity for management of waste (e.g. MSW, recycling etc.) at out-of-County facilities if required. The County has already identified land for future waste processing/disposal as a contingency.
• While County staff have indicated there may be capacity at the Composting facility for management of some food waste, the restrictions on the capacity and material type that could be processed imposed by the community agreement means that a change in agreement would be required, and limiting the possibility for this site to be the main processing facility for a full-scale organics program. HDR will consider other options as an alternative or additional capacity.
In conclusion, the Montgomery County is operating a successful waste management program, evidenced by the current recycling rates. Future tasks in this study will look at options for improving and increasing waste reduction and recycling and how existing facilities can and will be utilized moving forward.

76
10 References Division of Solid Waste Services, Montgomery County, Maryland
2015 Comprehensive Solid Waste Management Plan for the Years 2012 through 2023.
Division of Solid Waste Services, Montgomery County, Maryland 2018 Interviews with and data provided by DSWS staff
Division of Solid Waste Services, Montgomery County, Maryland 2017 Haulers Reports
SCS Engineers 2013 Montgomery County Waste Composition Study Summary of Results
SCS Engineers 2018 Montgomery County Waste Composition Study, Overall Report
King County, WA 2017 Food Diversion Report
CalRecycle 2015 2014 Generator-Based Characterization of Commercial Sector Disposal and Diversion in California,
produced under contract by Cascadia Consulting Group CalRecycle
2016 State of Recycling in California Updated 2016 (DRRR-2016-1554)
Department of Legislative Services 2017 Solid Waste Management and Recycling in Maryland
Maryland Recycling Act (MRA) Guidelines Survey 2017
Montgomery County Code Chapter 48 – Solid Wastes
Montgomery County Executive Regulations
Montgomery County Don’t Dump. Donate! Program – Reusable Building Materials Recycling

APPENDIX A
1
Glossary of Terms The definitions of terms used in this Aiming for Zero Waste Plan are consistent with definitions contained in Chapter 48 of the Montgomery County Code and COMAR. Additional terms that are used in the Aiming for Zero Waste Plan that are not defined within Chapter 48 of the Montgomery County Code or COMAR have been given the following definitions below.
Term Reference
Aiming for Zero Waste Plan – a master planning study conducted by HDR Engineering, Inc., an on-call consultant of the Northeast Maryland Waste Disposal Authority, on behalf of Montgomery County, Maryland. The report will guide the future of responsible solid waste management in the County.
https://www.montgomerycountymd.gov/SWS/master-plan.html
Ashes - means the residue from the burning of wood, solid waste, coal, coke, and other combustible materials.
http://mdrules.elaws.us/comar/26.04.07.02
Biosolids - means treated sewage sludge that meets the standards for Class A or B sewage sludge.
http://mdrules.elaws.us/comar/26.04.06.03
Biosolids - are nutrient-rich organic materials resulting from the treatment of domestic sewage in a treatment facility. When treated and processed, these residuals can be recycled and applied as fertilizer to improve and maintain productive soils and stimulate plant growth.
https://www.epa.gov/biosolids/frequent-questions-about-biosolids
Bypass Waste - waste received by the County which is processible at the RRF but is not processed at the RRF and instead sent by the County to its out-of-County landfill.
Comprehensive Solid Waste Management 10 Year Plan 2012 – 2023
Back-End Scrap Metal - ferrous and non-ferrous metal pulled post incineration. Back-End Scrap Metal counts towards the MRA rate since it is recycled
Maryland Recycling Act Tonnage Reporting Survey Guidelines for CY 2017
Collection Contractor - a private company under contract with the County to provide solid waste collection services for dwelling units with less than 7 units within the Solid Waste Collection Districts.
County Code Chapter 48
Collector - any person who contracts to collect and provide services for collection and/or transporting the solid waste of others to its disposal site.
County Code Chapter 48
Composting - the biological decomposition of organic material such as food waste into a stable, humus-like product, is a first step in the recycling of food waste.
County Code Chapter 48
Compostable Material – non-recyclable paper, food waste, yard waste (grass, leaves, brush/pruning).
SCS Engineers: Montgomery County 2012-2023 Waste Composition Study).
COMAR – Code of Maryland Regulations http://www.dsd.state.md.us/COMAR/ComarHome.html
Construction and Demolition (C&D) Debris - Solid waste from construction, demolition and renovation projects that produce debris including wood, wood products such as fiberboard and particleboard, cardboard, sheetrock and other drywall, plaster, fiberglass, plastic and other polymers, composite
Comprehensive Solid Waste Management 10 Year Plan 2012 – 2023
2
2
materials, glass, stone, steel and other metals, rubber, geotextile, asphalt, concrete, brick and mortar, rock, dirt, rubble, tree stumps, logs and large tree limbs. C&D Debris does not include 1) asbestos, 2) hazardous waste, 3) municipal solid waste such as garbage, household goods and refuse, 4) sludge, 5) dredged material (silt and other water pollutants), 6) medical/pathological waste, 7) ash and other residue from combustion, 8) industrial waste, 9) agricultural waste, 10) oil, antifreeze, fuel and other fluids for machinery, 11) liquid waste, 12) dead animals, 13) yard trim, 14) sawdust and slash from sawmill operations, 15) vehicles, machinery and electronics (including separated components), 16) containers, 17) tires, 18) appliances and other "white goods", 19) furniture, 20) recreation equipment, and may exclude additional items not listed.
Controlled Hazardous Substance -Generally, a controlled hazardous substance is a solid waste that requires separate handling from MSW because it may pose a substantial hazard to human health or the environment.
a hazardous waste as defined in COMAR 26.13.01
a special medical waste as defined in COMAR 26.13.11.
County - Montgomery County, Maryland. https://www.montgomerycountymd.gov/sws/
County Solid Waste Facilities - all sanitary landfills, refuse transfer facilities, materials recovery facilities, compost production facilities, resource recovery facilities and related facilities wholly operated by, or on behalf, of the County.
County Code Chapter 48
Department - the Department of Environmental Protection. https://www.montgomerycountymd.gov/dep/
Director - the Director of the Department of Environmental Protection, or the Director's designee.
County Code Chapter 48
Disposal Refuse - all solid waste that is acceptable for disposal, as designated in executive regulations and delivered to a County solid waste acceptance.
County Code Chapter 48
Dwelling Unit - a building or part thereof arranged or designed for occupancy by not more than one family for living purposes and having cooking facilities.
County Code Chapter 48
Front-End Scrap Metal - Ferrous or non-ferrous materials pulled from the waste stream in a refuse disposal system. Front-end scrap counts towards the MRA rate and should be included in the “Other” section of the “Metals” category.
Maryland Recycling Act, Tonnage Reporting Survey Guidelines for CY 2017).
Garbage - all organic waste materials resulting from the preparation, cooking, handling or storage of food.
County Code Chapter 48
Generator - the owner or occupant of any dwelling unit where solid waste is generated, and the owner or occupant of any other business, entity or institution at, from, or by which solid waste is generated.
County Code Chapter 48
Hauler - any person operating a commercial business or engaged in any enterprise regularly generating solid waste which requires collecting and hauling to an approved point of disposal, when such collecting and hauling is done by the person generating such material in his own vehicles or in vehicles leased for the purpose, in lieu of having a licensed collector perform this service.
County Code Chapter 48
Hazardous Waste - Includes listed wastes, and characterized wastes that have one of the following properties: ignitability, corrosivity, reactivity, or toxicity.
As defined in COMAR 26.13.01.
3
3
Integrated Solid Waste Management System - the County's system of managing solid waste as that system is revised from time to time in the County's Comprehensive Solid Waste Management Plan. The system may include all aspects of solid waste management and handling, including any waste reduction program, recycling program or facility, disposal program or facility, and any other program related to the collection, management and disposal of solid waste.
County Code Chapter 48
https://www.montgomerycountymd.gov/sws/programs/solid-waste-plan.html
Land Clearing Debris - materials from land clearing operations including: earthen materials such as clays, sands, gravels, and silts; topsoil; tree stumps; root mats; brush and limbs; logs; vegetation; and rock.
COMAR 26.04.07.11(B)
Landfill - an engineered facility for disposing of solid wastes on land by spreading, compacting and covering the wastes.
Comprehensive Solid Waste Management 10 Year Plan 2012 – 2023
Leachate - means any liquid that has percolated through solid waste including sewage sludge and may contain dissolved, miscible, or suspended material from the sewage sludge or solid waste pile.
http://mdrules.elaws.us/comar/26.04.06.03
Maryland Department of the Environment (MDE) - in 1987, the Maryland Department of the Environment was created to protect and preserve the state's air, water and land resources and safeguard the environmental health of Maryland's citizens. MDE's duties also encompass enforcement of environmental laws and regulations, long-term planning and research. MDE provides technical assistance to Maryland industry and communities for pollution and growth issues and environmental emergencies.
https://mde.maryland.gov/Pages/index.aspx
Maryland Recycling Act (MRA) - in 1988, the Maryland Recycling Act (MRA) authorized MDE to reduce the disposal of solid waste in Maryland through management, education and regulation. The MRA requires that:
• Each of Maryland’s jurisdictions develop and implement recycling programs. Jurisdictions with populations greater than 150,000 are required to recycle 35% of their waste and jurisdictions with populations less than 150,000 are required to recycle 20% of their waste. State agencies must implement a recycling plan with a 30% recycling rate mandate. (2012)
• If a jurisdiction fails to meet the specified reductions, State and local authorities can prohibit the issuance of building permits for all new construction.
• Each jurisdiction selects materials to be recycled and the manner in which materials are to be separated and processed.
• State agencies participate in recycling programs. • Newsprint and telephone directories distributed in the State have a
recycled content, by weight, of 30% in 2001, increasing to 40% by 2005.
https://mde.maryland.gov/programs/land/recyclingandoperationsprogram/pages/faqs.aspx#1
MRA Waste and Non-MRA Waste – The list of materials that can be counted as a MRA material or not is constantly evolving. Every year MD counties have to get from MDE the latest guidelines prior to completing the MRA Tonnage Reporting Survey.
The latest guidelines for CY2017 can be found at: MRA Tonnage Reporting Survey Guidelines 2017.pdf https://mde.maryland.gov/programs/LAND/Documents/All%20StAR%20MRA%20definitions%202016.pdf
4
4
Materials Recovery Facility - a facility for separating recyclables from mixed waste or for separating commingled recyclables.
Comprehensive Solid Waste Management 10 Year Plan 2012 – 2023
Municipal Solid Waste - solid waste generated at residences, commercial establishments and institutions; excludes land clearing, construction and demolition debris.
Comprehensive Solid Waste Management 10 Year Plan 2012 – 2023
Mixed Yard Waste – includes Organic plan waste derived from gardening, landscaping, and tree trimming activities. Yard Waste Includes leaves, garden waste, lawn cuttings, weeds, and pruning material that is composted or mulched and marketed.
Annotated Code of Maryland, Environment Article § 9-1701(s)(1)(2)
Non-Processible Waste - a waste material which cannot be processed at the County's Resource Recovery Facility because of its size, bulkiness, composition or regulatory restrictions.
As further defined in the Service Agreement between the Northeast Maryland Waste Disposal Authority and Covanta Montgomery, Inc., f/k/a Ogden Martin Systems of Montgomery, Inc.
Non-Recyclable Paper - all paper products not covered by the above categories, including all tissues, paper towels, and napkins, carbon paper, and other non-recyclable papers.
Comprehensive Solid Waste Management 10 Year Plan 2012 – 2023
PJM or PJM Regional Electric Grid - a regional transmission organization (RTO) that coordinates the movement of wholesale electricity in Maryland and all or parts of 12 other states and the District of Columbia.
Comprehensive Solid Waste Management 10 Year Plan 2012 – 2023
Processible Waste – Waste that enters the County’s waste system and is deemed acceptable for processing at the Resource Recovery Facility.
Comprehensive Solid Waste Management 10 Year Plan 2012 – 2023
Recyclables - materials that can be readily separated from a waste stream and reused in their present form or can be converted into raw materials from which new products can be made.
Comprehensive Solid Waste Management 10 Year Plan 2012 – 2023
Regulated Asbestos-Containing Material - material for which Federal or State regulations require specialized handling and disposal to prevent creation of asbestos dust.
Comprehensive Solid Waste Management 10 Year Plan 2012 – 2023
Resource Recovery Facility - A facility in existence as of January 1, 1988 that: 1. Processes solid waste to produce valuable resources, including steam, electricity, metals, or refuse-derived fuel; and 2. Achieves a volume reduction of at least 50 percent of its solid waste stream.
Annotated Code of Maryland, Environment Article § 9-1701(o))
Septage - untreated sewage that accumulates in septic and holding tanks, including associated liquids, solids and semi-solids; the product of septic tank cleaning.
Comprehensive Solid Waste Management 10 Year Plan 2012 – 2023
Solid Waste - all waste materials and debris, including any garbage, sludge, medical/pathological waste, debris from building construction, ashes, junk, industrial waste, dead animal, salvable waste, deal or felled tree, uprooted tree stump, slash, tree limb, bush, plant, leaves, grass, garden trimmings, street refuse, abandoned vehicle, machinery, bottle, can, waste paper,
County Code Chapter 48
5
5
cardboard, sawdust and slash from sawmill operations, and any other waste materials. Solid waste also includes any automobile, truck, box, container, tire, appliance, furniture, or recreational equipment that is in a state of disrepair or disfunction, unless the items is awaiting removal or being repaired or renovated for the personal use of the owner or occupant and the repair, renovation or removal is completed within 30 days. Solid waste also includes any recyclable solid waste. Solid Waste Acceptance Facility - any state-approved sanitary landfill, central processing facility, transfer station, medical/pathological waste incinerator or any other type of plant the primary purpose of which is for the disposal, treatment or processing of solid waste.
County Code Chapter 48
Solid Waste Acceptance Fee - the charge established for use of the County solid waste acceptance facilities.
County Code Chapter 48
Solid Waste Charge - a charge established for use of County solid waste acceptance facilities for disposal, recycling, or otherwise processing or handling of solid waste.
County Code Chapter 48
Solid Waste Collection Charge - a charge established for the service of collecting solid waste in a Solid Waste Collection District.
County Code Chapter 48
Solid Waste Collection Districts - special service districts established from time to time, consisting of certain areas of the County as defined on maps in the office of the Director, in which solid waste is collected by the County or its contractor.
County Code Chapter 48
Solid Waste Management District - a special service district consisting of all of Montgomery County.
County Code Chapter 48
Solid Waste Management Service - any service provided by or on behalf of the County to plan, implement, or administer any part of an integrated solid waste management system.
County Code Chapter 48
Sustainable Materials Management – a systemic approach to using and reusing materials more productively over their entire lifecycles. By examining how materials are used throughout their lifecycle – from materials extraction to end-of-life management, this approach seeks to:
• Use materials in the most productive way with an emphasis on using less
• Reduce toxic chemicals and environmental impacts throughout the material lifecycle
• Assure there are sufficient resources to meet today’s needs and those of the future.
This approach means a product could be redesigned so it is manufactured using different, fewer, less toxic, and more durable materials. It could also be designed so that it can be readily disassembled for reuse or recycling of its parts at the end of its useful life. Establishing relationships among product manufacturers, suppliers or distributers, and customers along the supply chain helps ensure best use of the product, proposer product maintenance and return at end-of-life.
SWANA & CRRA, Zero Waste Principles and Practices
Special Medical Waste - Includes utensils, bandages, containers and other medical or laboratory materials that may harbor pathogens.
As defined in COMAR 26.13.11
6
6
Systems Benefit Charge - an annual service charge reflecting all or a portion of the cost to the County of providing base and incremental solid waste management services (County Code Chapter 48).
County Code Chapter 48
Transfer Station - a facility designed to reduce collection and/or transportation costs by the consolidation of solid wastes before transport to a site for final disposal.
Comprehensive Solid Waste Management 10 Year Plan 2012 – 2023
Yard Trim - vegetative materials generated through the normal maintenance of yards, lawns, gardens or other landscaped areas including grass, leaves and brush; excludes soils, tree stumps, logs, large tree limbs, rock and other land clearing debris.
Comprehensive Solid Waste Management 10 Year Plan 2012 – 2023
Zero Waste - there is no universally accepted definition of Zero Waste and the concept of Zero Waste is still evolving. However, the concept of Zero Waste is modeled on the biogeochemical and nutrient cycles found in nature, in which elements are continuously cycled in various forms between different compartments of the environment. Likewise, Zero Waste takes a cyclical approach to the vast flow of resources and products manufactured and utilized by human society. This cyclical, whole system approach seeks to minimize the extraction of resources form the earth by minimizing waste, reducing consumption, maximizing recycling, and developing products that are made to be reused, repaired, or recycled back into nature or the marketplace. Zero Waste requires changing the perspective from thinking of discarded materials as wastes to thinking of them as resources with functional value. Many professionals in the field believe that getting to Zero Waste does not mean achieving absolute zero.
SWANA & CRRA, Zero Waste Principles and Practices
1
APPENDIX B
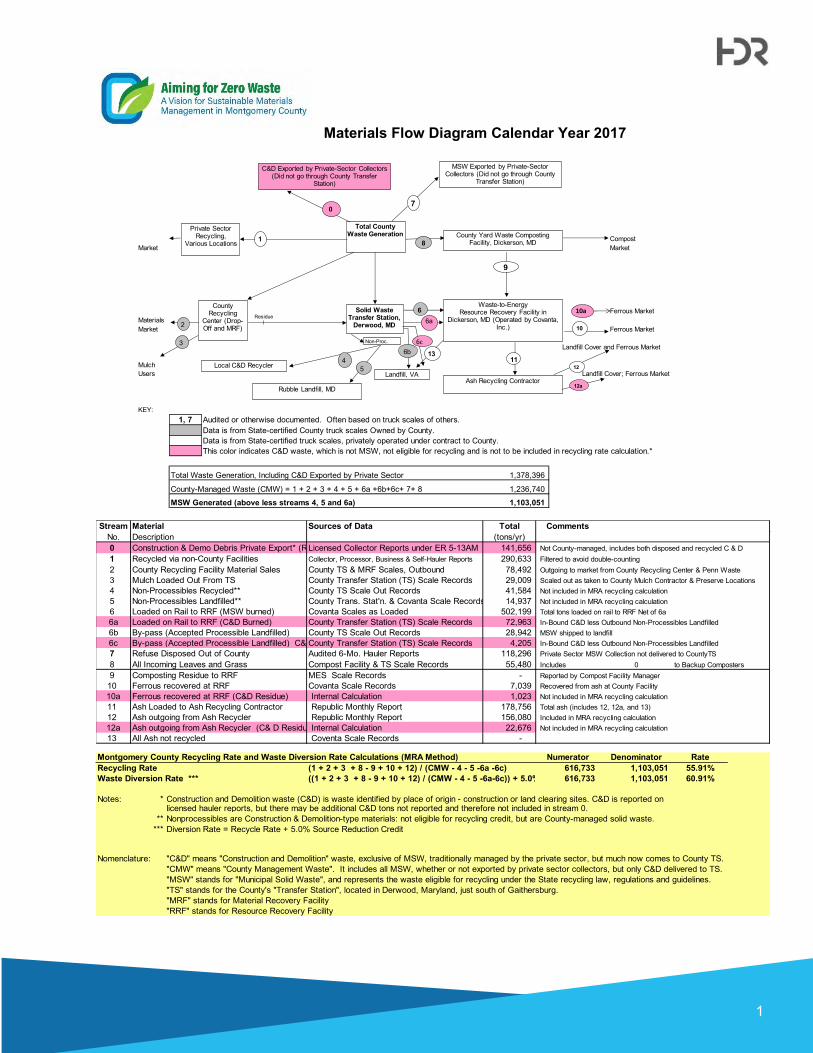
1
Materials Flow Diagram Calendar Year 2017
CompostMarket Market
Ferrous MarketMaterialsMarket Ferrous Market
Landfill Cover and Ferrous Market
MulchUsers Landfill Cover; Ferrous Market
KEY:1, 7 Audited or otherwise documented. Often based on truck scales of others.
Data is from State-certified County truck scales Owned by County.Data is from State-certified truck scales, privately operated under contract to County.This color indicates C&D waste, which is not MSW, not eligible for recycling and is not to be included in recycling rate calculation.*
Total Waste Generation, Including C&D Exported by Private Sector 1,378,396
County-Managed Waste (CMW) = 1 + 2 + 3 + 4 + 5 + 6a +6b+6c+ 7+ 8 1,236,740 MSW Generated (above less streams 4, 5 and 6a) 1,103,051
Total County Waste Generation
Waste-to-Energy Resource Recovery Facility in
Dickerson, MD (Operated by Covanta, Inc.)
County Recycling
Center (Drop-Off and MRF)
Solid Waste Transfer Station,
Derwood, MD
Private Sector Recycling,
Various Locations County Yard Waste Composting
Facility, Dickerson, MD
MSW Exported by Private-Sector Collectors (Did not go through County
Transfer Station)
Landfill, VAAsh Recycling Contractor
Residue
1
2
6
9
8
7
10
12511
Non-Proc.
4Local C&D Recycler
3136b
C&D Exported by Private-Sector Collectors (Did not go through County Transfer
Station)
0
6a
Rubble Landfill, MD
10a
6c
12a
Stream Material Sources of Data Total CommentsNo. Description (tons/yr)0 Construction & Demo Debris Private Export* (Recycled & Landfilled)Licensed Collector Reports under ER 5-13AM 141,656 Not County-managed, includes both disposed and recycled C & D1 Recycled via non-County Facilities Collector, Processor, Business & Self-Hauler Reports 290,633 Filtered to avoid double-counting2 County Recycling Facility Material Sales County TS & MRF Scales, Outbound 78,492 Outgoing to market from County Recycling Center & Penn Waste3 Mulch Loaded Out From TS County Transfer Station (TS) Scale Records 29,009 Scaled out as taken to County Mulch Contractor & Preserve Locations4 Non-Processibles Recycled** County TS Scale Out Records 41,584 Not included in MRA recycling calculation 5 Non-Processibles Landfilled** County Trans. Stat'n. & Covanta Scale Records 14,937 Not included in MRA recycling calculation 6 Loaded on Rail to RRF (MSW burned) Covanta Scales as Loaded 502,199 Total tons loaded on rail to RRF Net of 6a6a Loaded on Rail to RRF (C&D Burned) County Transfer Station (TS) Scale Records 72,963 In-Bound C&D less Outbound Non-Processibles Landfilled6b By-pass (Accepted Processible Landfilled) County TS Scale Out Records 28,942 MSW shipped to landfill6c By-pass (Accepted Processible Landfilled) C&DCounty Transfer Station (TS) Scale Records 4,205 In-Bound C&D less Outbound Non-Processibles Landfilled7 Refuse Disposed Out of County Audited 6-Mo. Hauler Reports 118,296 Private Sector MSW Collection not delivered to CountyTS8 All Incoming Leaves and Grass Compost Facility & TS Scale Records 55,480 Includes 0 to Backup Composters9 Composting Residue to RRF MES Scale Records - Reported by Compost Facility Manager
10 Ferrous recovered at RRF Covanta Scale Records 7,039 Recovered from ash at County Facility10a Ferrous recovered at RRF (C&D Residue) Internal Calculation 1,023 Not included in MRA recycling calculation 11 Ash Loaded to Ash Recycling Contractor Republic Monthly Report 178,756 Total ash (includes 12, 12a, and 13)12 Ash outgoing from Ash Recycler Republic Monthly Report 156,080 Included in MRA recycling calculation12a Ash outgoing from Ash Recycler (C& D Residue)Internal Calculation 22,676 Not included in MRA recycling calculation 13 All Ash not recycled Coventa Scale Records -
Montgomery County Recycling Rate and Waste Diversion Rate Calculations (MRA Method) Numerator Denominator RateRecycling Rate (1 + 2 + 3 + 8 - 9 + 10 + 12) / (CMW - 4 - 5 -6a -6c) 616,733 1,103,051 55.91%Waste Diversion Rate *** ((1 + 2 + 3 + 8 - 9 + 10 + 12) / (CMW - 4 - 5 -6a-6c)) + 5.0% 616,733 1,103,051 60.91%
Notes: * Construction and Demolition waste (C&D) is waste identified by place of origin - construction or land clearing sites. C&D is reported onlicensed hauler reports, but there may be additional C&D tons not reported and therefore not included in stream 0.
** Nonprocessibles are Construction & Demolition-type materials: not eligible for recycling credit, but are County-managed solid waste.*** Diversion Rate = Recycle Rate + 5.0% Source Reduction Credit
Nomenclature: "C&D" means "Construction and Demolition" waste, exclusive of MSW, traditionally managed by the private sector, but much now comes to County TS."CMW" means "County Management Waste". It includes all MSW, whether or not exported by private sector collectors, but only C&D delivered to TS."MSW" stands for "Municipal Solid Waste", and represents the waste eligible for recycling under the State recycling law, regulations and guidelines. "TS" stands for the County's "Transfer Station", located in Derwood, Maryland, just south of Gaithersburg."MRF" stands for Material Recovery Facility"RRF" stands for Resource Recovery Facility