AIAA 2001-0159 - NASA · (WICS) FOR RECTANGULAR TUNNELS ... interference for aircraftqike models...
28
AIAA 2001-0159 SENSITIVITY STUDY OF THE WALL INTERFERENCE CORRECTION SYSTEM (WlCS) FOR RECTANGULAR TUNNELS Eric L. Walker and Joel L. Everhart NASA Langley Research Center, Hampton, VA 23681 Venkit lyer Lockheed Martin, Hampton, VA 23681 39th AIAA Aerospace Sciences Meeting and Exhibit January 8-11, 2001/Reno, NV For permission to copy or republish, contact the American Institute of Aeronautics and Astronautics 1801 Alexander Bell Drive, Suite 500, Reston, VA 20191-4344 https://ntrs.nasa.gov/search.jsp?R=20010011089 2018-06-11T03:38:13+00:00Z
Transcript of AIAA 2001-0159 - NASA · (WICS) FOR RECTANGULAR TUNNELS ... interference for aircraftqike models...

AIAA 2001-0159SENSITIVITY STUDY OF THE WALLINTERFERENCE CORRECTION
SYSTEM (WlCS) FORRECTANGULAR TUNNELSEric L. Walker and Joel L. Everhart
NASA Langley Research Center, Hampton, VA 23681
Venkit lyer
Lockheed Martin, Hampton, VA 23681
39th AIAA Aerospace SciencesMeeting and Exhibit
January 8-11, 2001/Reno, NV
For permission to copy or republish, contact the American Institute of Aeronautics and Astronautics1801 Alexander Bell Drive, Suite 500, Reston, VA 20191-4344
https://ntrs.nasa.gov/search.jsp?R=20010011089 2018-06-11T03:38:13+00:00Z


AIAA2001-0159
SENSITIVITY STUDY OF THE WALL
INTERFERENCE CORRECTION SYSTEM
(WICS) FOR RECTANGULAR TUNNELS
Eric L. Walker* and Joel L. Everhart*
NASA Langley Research Center, Hampton, VA 23681
Venkit Iver*
Lockheed Martin, Hampton, VA 23681
Abstract
All off-line version of the Wall Interference Correc-
tion System (WICS) has been implemented for tile
NASA Langley National Transonic Facility. The cor-
rection capability is currently restricted to corrections
for solid wall interference in the model pitch plane forMath numbers less than 0.45 due to a limitation in
tunnel calibration data. A study to assess output sen-
sitivity to measurement uncertainty was conducted to
determine standard operational procedures and guide-lines to ensure data quality during the testing process.
Changes to the current facility setup and design rec-
ommendations for installing the WICS ('.ode into a newfacility are reported.
CD
Ct
EM
N
QU
u_Ux
_li, Ui _ Wi
0_
Nomenclature
Nondinlensional drag coefficientNondinlensional lift coefficient
An output variableError
Mach number
Number of ports
Dynamic Pressure
Uncertainty
Axial veh)city determined by calil)rationFree-strealn velocity
Velocity perturbation: X, Y, Z componentsCartesian tunnel axes
Angle of attack [ra(t]
* Research Engineer, Research Facilities Branch, Aerodynam-
ics, Aerothermodynamics, and Acoustics Competency. StudentMember AIAA.
tResearch Engineer, Research Facilities Branch, Aerodynam-
ics, Aerothermodynamics, and Acoustics Competency. SeniorMember AIAA.
SAeronautical Engineer. Senior Member AIAA.
Copyright @ 2001 by the American Institute of Aeronauli('s and
Astronautics. Inc. No copyright is asserted in the United Statesunder Title 17, U..q. Code. The U.S. Government has a royalty-
free license to exercise all rights under tim copyright claimed ilereinfor Governmental Purposes. All other rights are reserved by thecopyright owner.
A
G
b
Angle of sideslip [rad]Correction
Blockage Factor
Population Standard Deviation
Population Standard Deviation Estimator
Velocity t)otential
Subscripts
(%) Percent of value
corr CorrectedF Free air
i increnlental correctionP Pressure
T In tunnel
t Total
uric Uncorrected
oc Freestream
Superscripts
(L) Confidence level
Introduction
The subject of wall interference has broadened int-
mensel.v over the past century. Classical correction
methods for this effect incorporate a mathenmticalboundary condition for the wind tunnel walls. Non-
dinlensional parameters have been tatmlated and a
immber of formulas to correct spatially-varying wall-interference for aircraftqike models have I)een docu-
mented in texts such as AGARDograph 109. l Moreoften facilities are testing in regions that exceed the
design specifications of the facility, hlcreased nlodel
size, for instance, introduces larger amounts of block-age and lift interference than the classical meth-
ods can properly handle. Modern, more capal)le
interference-correction methods, including boundarypressure methods were recently published in AGARD-
ograpll 336. 2 The advantage of the boundary pressure
1 OF 27
AMERICAN INSTITUTE OF AERONAI!T1US AND ASTRONAUTICS PAPER 2001 0159

methods over classical methods is their ability to re-spond to the actual conditions of the flow in the tunnel
test section; additionally, boundary pressure methods
are more complex than classical methods but can be
implemented for online post-point/post-scan applica-tions.
Customers are also placing more stringent accuracy
requirements on tile acquired data. To reduce theuncertainties introduced in tunnel data due to tile
iu'esence of the walls, thereby enhancing data quality,
NASA Langley Research Center has implemented the
Wall Interference Correction System (WICS) for solid
wall testing in the National Transonic Facility (NTF)a
The code was originally developed by Ulbrich et al.4 9at NASA Ames Research Center for the 12-Foot Pres-
sure Wind Tunnel. The WICS code uses a modified
Hackett (Wall Signature) Method to determine wallinterference, corrections. This method was selected be-
cause it is rapid and robust, and it has nfinimal impact
on the facility in terms of instrumentation when com-
pared to other boundary pressure methods. A brief
description of the theory behind the WICS method
and the implementation at the NTF is presented.
The l)urpose of this paper is to determine code sen-sitivities to nmasurernent uncertainty and to establish
uncertainty boundaries. Guidelines for iinplementa,
tion and operation are provided based on observationsof this study. Although there is error inherent in the
theoretical model due to limiting assumptions, this
paper does not address the validity of the predictedcorrections.
Correction Accuracy Requirements
Before a sensitivity study can be conducted on the
WICS code, it is necessary to understand the accuracy
requirements placed on wall interference corrections in
general. According to Steinle and Stanewsky, l° tile
requirements for transonic cruise are dominated by
a one count (Co = 0.0001) accuracy for drag for a
transport-type aircraft. Since the WICS code is not
used exclusively on transport-type aircraft in cruise, a
more general requirement is needed. Newman and Ev-erhart ') report the accuracy requirements listed belowin Table 1.
Type of Test Incremental Absolute
High Lift 0.2% CL&CD 0.4% CL[_:C D
Transonic 1/2 count Co 1 count CD
Table 1 Generalized Industry Correction Accu-
racy Requirements
The Wall Interference Correction
System (WICS)
The following presents a brief overview of Ulbrich's
extension of the Hackett wall signature method, in-
cluding theory and the current implementation of
WICS in the NTF. A more detailed description isgiven by Ulbrich et aI. 4-9 and Iyer et al. a The
method applies a measured pressure boundary condi-tion which is the tared difference between the model
installed condition and the empty tunnel. The testarticle is comprised of singularities: a source-sink com-
bination is used to represent the fuselage; sources are
used to represent the viscous separation in the wake;
and line &tablets, typically placed on a lifting surface
quarter-chord, are used to simulate the effect of lift.
Additionally, a powered simulation can be represented
by proper placement of a sink. Once the strengths
of the line doublets and propulsion simulation sinks
are known, the signature of these singularities is sub-
tracted from the tared wall signature. The renmining
signature is used to determine the strengths of the solid
and wake blockage singularities. Hackett et al. l l.V,-
originally used a "local" least squares fitting procedure
of the wall pressure data, which was labor intensive
because each pressure measurement used in the fit _Jf
the wall signature had to he individually selected for
each data point. In an effort to improve the process,Ulbrich ° introduced a "global" least, squares fitting
procedure that uses all available pressure ports. The
use of panel codes to preeompute normalized solutions
for use in matching the signature was also introduced.
Ulbrich further modified tile Hackett method by us-
ing balance measured forces and moments to calculate
the strength of the doublet singularities. The methoduses tared data to assess the wall induced effects on
tile test article. The tared data are obtained by sub-
tracting empty tunnel wall pressure port calibrations
from the model-installed pressure data to remove first.
order effects of the empty tunnel boundary layer mid
buoyancy. This taring of the measured data assum_s
that the additional second order change in the bound-
ary layer displacement thickness due to the model
in the tunnel is negligible. Normalized perturbationveh>cities are calculated from the subsonic potential
equation using the method of images, for each type
of singularity, in discrete locations in the tunnel. By
superimposing these model singularities with their cor-
responding calculated strengths, interference velocities
are computed.
The blockage interference factor g is defined by
?Ai 'lt, T -- ?1 ve=-- _ (1)
ue u_
where ui/U_ = O_/Ox and _I _ *2T--_F. Incidenceand sideslip corrections are defined by
Ue Wi U'e WT- WF
ai - ._ (2)
rUc Ui _'e _UT -- VF
fli - _ (3)
where Uo_/g% is defined by 1 + c. It is important
to note that the integrated effect, of the empty tin>
2 OF 27
AMERIOAN [NSTITUTE OF AERONAUTICS AND ASTRONAUTICS PAPER 2001-0159

nel boundary layer growth and buoyancy due to im-
proper wall divergence are already included in U¢. The
"empty-tunnel" calibration provides the perturbationvelocity denoted by ua, which can be used to correct
the measured model-in-tunnel perturbation velocity,
@, by
"//T _l !r -- U 5
- (4)
The ratio u,r/_c is used to determine the singulariLv
strengths.
General Implementation Requirements
To implement the WICS code, 3 several tasks must
first be completed. The first task is to ensure tim facil-
ity has an adequate number of static pressure orifices
on the wall of the test section. (The meaning of ad-
equate will be discussed later in this paper.) Next, a
perturbation velocity database (PVD) must be gener-
ated using a panel method or the method of inmges.
This PVD is used in the matching of the tared wall
signature to determine singularity strengths, and togenerate the field of interference velocities so that cor-
rections can be computed.
Once the orifices have been installed, an "empty tun-nel" calibration must be performed. This calibration is
a function of independent test. parameters (e.9., totalpressure and Mach number) and support system atti-
tude (e.g., pitch and sideslip angles). For semispan
models, the empty tunnel calibration is the tunnel ge-
ometry minus the model. For fullspan models the
model support system is included, and the sting orsupport system kinematics must also be considered.
Semispan and fullspan model installation details are
provided subsequently.
Code Output Results
Figures 1 - 3 present a sample of the \VICS code
output from the NTF for a semispan model. Figure 1
gives a row-wise comparison of the tared signatt, re
with the WICS-fit wall signature for a single test. pointat M = 0.2,_,,,,_,. = 24 ° for a semispan model. The
symbols represent measured, tared wall perturbation
velocities and the solid line represents the global least
squares prediction of the code. (One measure of va-
lidity is how well these two match.) Mean primary
corrections are displayed in Figure 2. These correc-
tions are shown for an entire pitch polar (or group of
data points). Blockage corrections (g) are averaged in-terference velocities along the fuselage centerline, and
upwash (incidence) corrections (ai) are averaged alongthe wing three-quarter-chord. Corrections to Math
number (AM) and dynamic pressure (AQ) are de-
rived from the blockage factor. Coefficient corrections
for the entire polar are plotted in Figure 3. Note fl)r
the test point of _, = 24 ° in Figure 1 that signifi-
cant corrections of AM = 0.0025 and ai = 1.4 are
determined as shown in Figure 2. Correspondingly
large corrections for the coefficients are also observed
(Figure 3). Since the WICS code calculates the inter-
ference corrections for specified reference planes in a
vohnne surrounding the model, contours of the correc-
tion variation can be t)lotted.
Description of the NASA LaRC
National Transonic Facility
The NTF la is a fan-driven, ('losed-circuit,
continuous-flow, t)ressurized wind tunnel, which
is capable of testing at cryogenic conditions. The
test gas is dry air for elevated temt)erature ot)eration
and nitrogen for reduced temperature ot)eration.
The settling chamber contains four anti-turbulencescreens. A 15:1 contraction ratio entrance cone leads
into an 8.2 feet square cross sectional test section with
six inch triangular corner fillets which extends 25 feet
in length then opens imo a high speed diffuser. The
operational envelope of the NTF encomt)asses a largerange of test conditions. The facility can sustain a
continuous airspeed from 0.1 to 1.2 in Math mnnber.
Total pressure caI)abilities of tim facility range from
15 to 130 psi. The tunnel can operate at telnperatures
ranging from 150°F down to -320°F. These large
ranges of conditions allow Reynolds numl)er testing
from 3 to 120 nfillion per foot. NTF has the capa-
bility to independently vary' Math numt)er, Reynolds
mmlber, and dynanfic pressure.
Both fifllspan and semispan model mounting sys-
tems are available in the NTF. Fullspan models are
supported by an aft mounted sting. This sting isattached to a vertically oriented arc sector used to
change model pitch attitude over a range fi'om -11 °
to 19°. The roll mechanism has a range of -90 ° to
180 °. Sideslip angles are achieved by using combined
roll and t)itch angles. A sidewall mounting system is
used for semispan nlo(lels. The angle of attack rangeis ±180 °. The center of rotation for senfist)an and fifll-span models is tunnel station 13 feet.
Currently, the NTF has 459 operational wall pres-
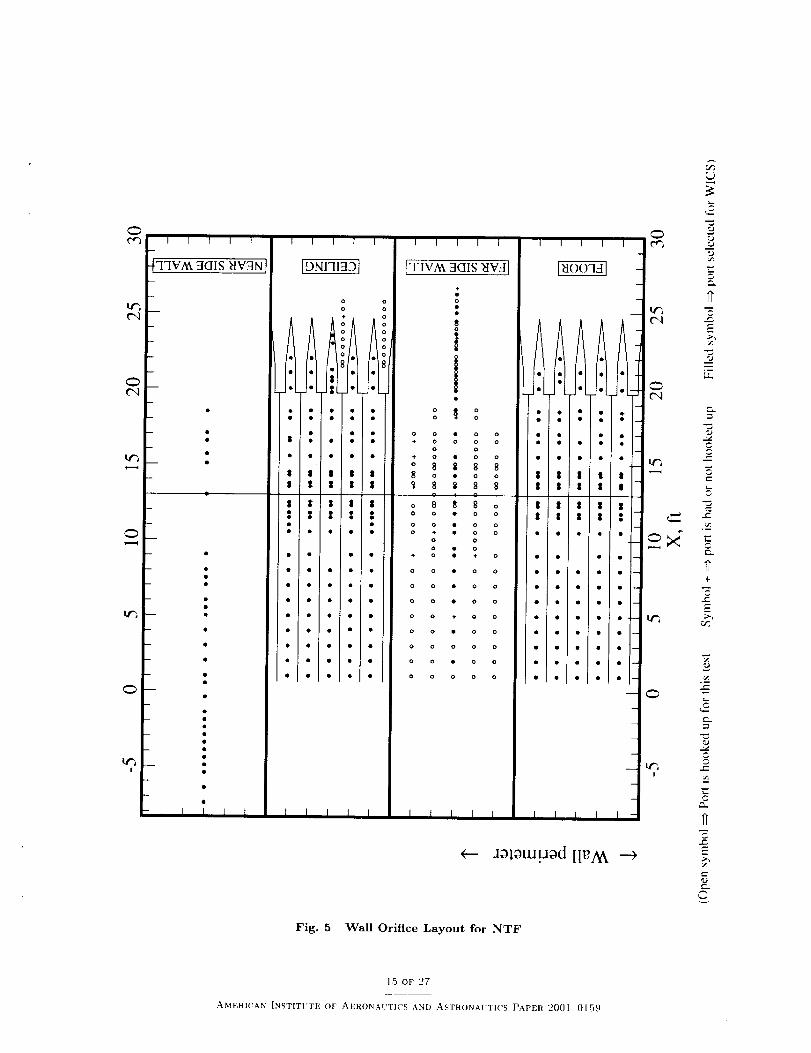
sure orifices of whictl the WICS code uses 360. Lookingdownstream, Figure 4 shows the cross sectional dia-
gram of the rows of t)ressure ports; it also serves as
ama t) between the NTF row mmd)ering scheme andthat used for WICS. Figure 5 unwraps the tunnel wails
to show the current wall orifice layout. The filled portsymbols are an exalnple subset of port selections usedfor WICS. a
Approach and Rationale
The original approach to define the WICS code sen-
sitivities to measurement uncertainty was to use actual
test data. perturb it using a known and controlled
random error and bias, and evaluate the output. Fol-
lowing tiffs path is equivalent to declaring an existingdata set to have zero mlcertainty. This method was
rejected because it gave no easy method for assessing
3 OF 27
AMERICAN INSTITUTE OF AERONAUTICS AND ASTRONAUTICS PAPER 2001-0159

the magnitude of instrumentation error inherent in thecurrent test data. Assessment of this error standard
deviation is part of the ongoing Data Quality Assur-
ance Program at LaRC conducted by Hemsch et al. 14An alternate method was devised to obtain an ide-
alized set of data fi'om actual test data. The code, as
part of the solution process, generates a global least
squares fit of the wall signatuw. Additional codingwas added to WICS to enable ttw discretization of this
wall signature fit. This result is reinput and a new fit
of tile wall pressure data is computed, thereby creat-
ing a data set with no random error. This new wall
signature and the corresponding test data are used asa baseline for the sensitivity study. In terms of the
WICS calculation, force, moment, and reference con-
dition data are point measurements. Therefore, only
the wall pressure data were deemed necessary to be
fitted (smoothed) to remove noise. The idealized dataset assumes that there are no second order boundary
layer or velocity perturbation eflbcts, such as modelinduced nonuniformities in the tunnel wall boundary
layer. Four test articles were used in this study; how-
ever, all figures shown refer to a low aspect ratio, highlift, semispan model. A more detailed description of
this analysis is given by Walker 15 including resultsfrom the other three test articles.
The code has four major categories of error sources:
the wall pressure signature, force and moment data,tunnel reference condition data, and the WICS math-
ematical model. Given this information, the total
uncertainty in the code output can be written as:
Ut = f(Uwps, UV/M, UnE_-, Uwlcs Mode.t)- (5)
Eacll of the four categories in Equation 5 can bc
expanded. First, the wall signature is composed of
precision and bias errors due to the wall pressure in-
strumentation, thus yielding:
Uu,ps = f(Pwps, Bwps). (6)
Second, force and moment data consist of calculated
lift, drag, and side force; roll, pitch, and yaw moments;and measured angle of attack.
UF/M = I(Ucv, UDV, USF, UpM, UrM, UnM). (7)
Third, the tunnel reference conditions, which in theNTF are determined from the Math number reference
system, will be examined.
UnEF = UMACH (8)
Last, the WICS model incorporates the singularity
representation, setup information, and the global leastsquares fitting process. The inherent error in the
WICS model is beyond the scope of this paper and
the corresponding uncertainty term is assumed to be
zero or negligible for this study. A discussion of the
remaining uncertainties is the subject of the remainder
of this paper.
Wall Pressure Measurements
The NTF wall signature used for WICS computation
currently consists of a total of 360 wall pressure orificesdistributed in rows on the four walls. In Equation (i
it was stated that the uncertainty in the wall pressure
signature could be broken into a precision error anda bias error. Precision error is defined as the randonl
normal variation of a measured parameter about some
expected value, whereas bias error is defined as thedifference between some measured expected value and
the "true value" of a parameter. The following sec-tions will evaluate the effects of these errors. As will
be discussed, the magnitude of precision error is used
to establish proper radial placement of rows, while the
magnitude of bias error establishes the orifice distri-bution within the rows.
Random Noise (Precision Error)
From elementary statistics, a confidence interval isdefined as the distance from the measured mean within
which the true mean should lie given a specified confi-
dence level or
z(L)_
CI (LI = 5: =t=-- (9)
where • is the measured mean, 6 the measured stan-
dard deviation of N samples or measurements and Z
the standard normal statistic at a confidence or signif-icance level of L. Make note that when the number of
samples is less than 30, Z is no longer standard normalbut follows the student t distribution, t6 For simplic-
ity, the standard normal distribution is assumed tohold for all values of N. A confidence interval can also
be thought of as the measured mean with some error
band at a given significance level, written as
,_ + E (L) (10)
If ap is defined as tile standard deviation of the wall
pressure measurements, an expression for the error
band of the wall pressures may be written
E(pL)- z(L)aP (ll)
Choosing a 99.72% significance level or a standard
normal statistic of approximately 3 for data quality
assurance purposes, the expected error band can be
predicted for a range of O'p and N. Note that choos-
ing a 99.72% significance level equates to one erroneousmeasurement out of approximately 350; whereas a 95¢/_
significance level is equivalent to one out of 20.An estimate of tile value of crp for the NTF is 0.002
psi. This value was inferred from output of the tunnolon-line data system for low Mach numbers (0.1 to 0.3}.
Random Seeding
If the confidence interval is tight around the ex-
pected value calculated from measured data, the true
4 OF 27
AMERICAN INSTITUTE OF AERONAUTICS AND ASTRONAUTICS PAPER 2001 0159

mean is confidently and accurately predicted. For thiscase, at a fixed 6, the predicted mean should be in-
sensitive to random seeding of tile random numbergenerator used to introduce a prescribed measurement
error. Increasing _ in Equation 9 with fixed Z f/'t andN, will, at some vahm of ?r, cause the confidence in-
terval to I)ecome so wide that the mean cannot I)e
predicted with accuracy. At this point the predicted
nman will be increasingly sensitive to the effects of
random seeding.
Based on results presented by Walker, la the wall
signature is insensitive to error due to random seeding
for ap < 0.05 psi; beyond this, the wall signature can-
not be accurately predicted. The global least squaresfitting routine is able to adequately recover the un-
derlying character of the pressure signature, therebyyielding a robust prediction technique. For values of
ap > 0.05 psi, the seed yielding the largest deviated
case was conservatively selected to minimize an intro-
duction of additional error in later analysis.
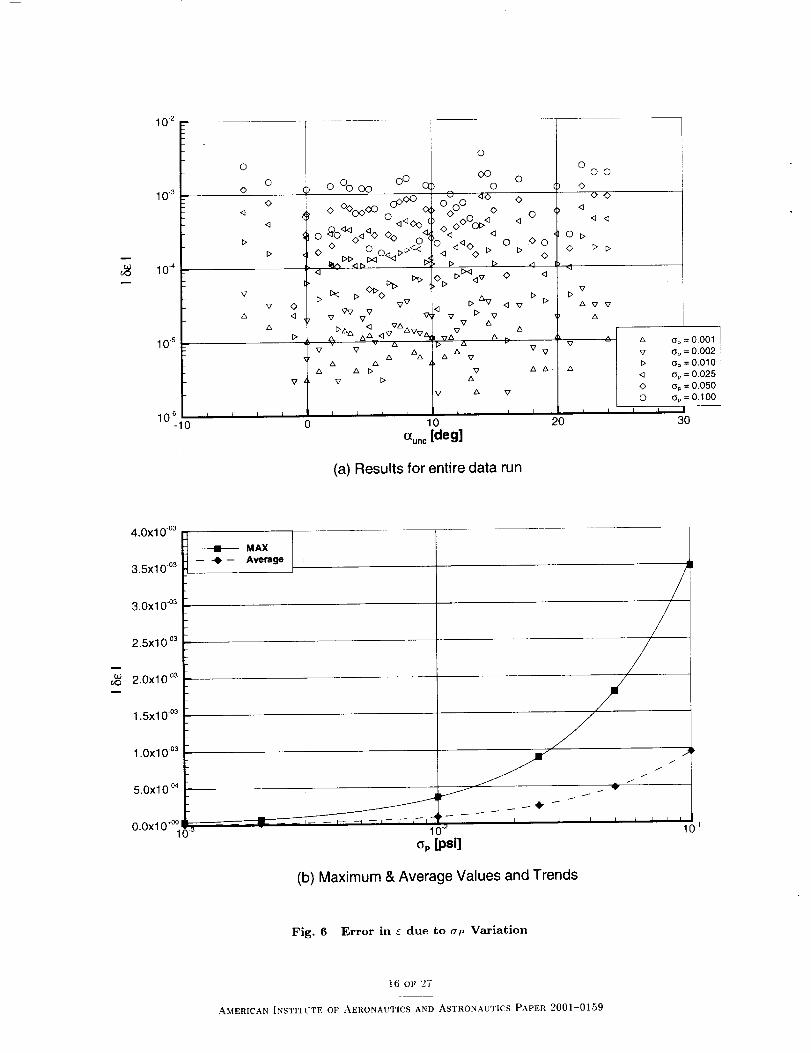
Variation of ap
Using the typical value of at, as a guideline, six val-
ues, ranging from 0.001 to 0.1 psi, encompassing threeorders of magnitude were used to define the code sensi-
tivity to variation of ap. The wall signature is not verysensitive to random perturbation as discussed in the
previous section. The insensitivity of wall pressure to
random perturbation translates, as would be expected,into output insensitivity as evidenced in the incremen-
tal blockage results presented in Figure 6. This figure
is representative of the sensitivities of each output vari-able examined over the data run for various values of
ap. The maximum and average values for the data run
are shown. Figure 6a shows the scatter of incremental
blockage error for the entire data run, and Figure 6bshows a linear-logarithnfic plot of the maximum and
nman values for each value of at,. The solid and dashed
lines represent a linear fit of the maximum and average
values for each value of at,, respectively. This figure is
representative of all the output and on this logarith-mic plot it shows a strong positive linear correlation
between the absolute and average error in the outputvariables and at-. It is also evident that the distance
between the fit of the maximum and mean errors be-
comes larger as crp increases, demonstrating that the
scatter in the error becomes large with relatively largeOrp.
Variation of N (Loss of Pressure Data)
A precision-sensitivity model that will enable theprediction of output error due to random noise in the
wall signature can be developed as follows. It is un-derstood that
E (L) = f(E_p L_) (12)
where C_ is any output variable. If f is assumed linear
due to the strong linear correlation as seen in Figure 6,
Equation 12 may be written as
E ¢LI= t_E_,LI + b (13)
Since this portion of the study is only concerned with
E_,L), it follows that b = 0, which implies that when
there is no error in the wall pressure system there isno error in the output variables. Thus, this model will
only predict output error due to random noise in the
wall signature. Using Equation 11, Equation 13 maybe re-expressed as
E(L) z(L)ap(, : a v_ (14)
Solving Equation 14 for N yields
-aZiL}ap] "2_x:= E _L_ / (15)
C_ _1
Equation 14 allows E (LIc'_ to be predicted for variationin N, and Equation 15 allows for the prediction of the
number of required pressure ports for a given ap, Z/L_,and E (L)
('x "
By regressing the maximum values of error for each
of the output variables, a conservative estimate of the
value of a for Equation 13 may be determined for eachoutput variable. Table 2 tabulates these values. Us-
ing Table 2 and Equation 15, prediction plots at the
99.5_ confidence level were made corresponding toseveral of the output variai)les. Figures 7 and 8 show
the predicted error for the primary corrections e and
_i, respectively. In these figures, the predicted rmm-
ber of ports required is plotted against ap for lines
of constant error in the output variables. This allows
the deternfination of a required mmfl)er of ports for agiven at, and a defined maximum error level. Make
note that. the units of each error level correspond to
the units of the output variable. As an example, for
the NTF typical ap = 0.002 psi, the number of ports
required to ensure incidence correction error predic-
tion below (I.005 ° is 240. The corresponding number
to ensure that the blockage correction is missed by nomore than 0.01Yv is 120. Accuracy of the angle of at-
tack is obviously the dominant criteria for selecting
the number of ports based on error in primary cor-
rections, while blockage requirements can be achievedwith a relatively small uumber. In accordance with
the generalized requirements placed on testing in Ta-ble 1, Figure 9 gives the predicted error in terms of
ACD,, and Figures 10 and 11 give the predicted error
in terms of ACL¢%/ and ACo, I'z,/, respectively.
Row Placement
The eight semispan and ten fifllspan wall pressureorifice configurations defined in Tables 3 and 4, re-
spectfidly, were used to evaluate output sensitivity due
5 OF 27
AMERICAN INSTITUTE OF AERONAUTI('S AND ASTRONAUTICS PAPER 2001-01.59

K
AM
AQ (psf)
(ti
ACL
ACL(%IACM
ACD
_CDt
ACD(%)
ACDb(%)
ACD,(%)
0.1887
0.0382
129.51
2.632
0.0118
1.652
0.0167
0.0349
0.0317
0.0382
14.065
17.461
14.868
Table 2 Regressed Values for the Coefficient ain Equation 15 for Prediction of Error in OutputVariables due to Variation in ap and N
Case
1
2
3
4
5
6
7
8
Table 3
Name WICS Rows
Full_Sig 1-5,7-12
Alternating 1,3,5,7,9,11,12
Mirror_CLine 5,7,12
Tunnel_CLine 3,9,12
Far_Field 1,11,12
M'in_Top 7
Min_Bott 5
Min_Side 12
N
260
161
67
64
62
26
25
16
Semispan Row Hookup Configurations
Case1
2
3
4
5
6
7
8
9
10
Table 4
Name WICS Rows
1-12Full_Sig
AlternatingFourCorner_Side
FourCorner
Tunnel_CLine
14x22_Sim
Min_Far_Side
Min_TopMin_Bott
Min_Near_Side
N
29O
1,3,5-7,9,11,12 191
1,5-7,11,12 143
1,5,7,11 97
3,6,9,12 94
6,9,12 72
6 30
9 26
3 22
12 16
Fullspan Row Hookup Configurations
to row placement configurations and to verify predic-tions in Figures 7 - 11 at various values of ryp. These
configurations include tile full measurement, near field
(radially), far field (radially), and single row resolu-
tions of the wall signature. In addition, approxima-
tions to other facility configurations were evaluated.
WalkeP _ showed that the error predicted in Figures 7
- 11 is a fairly conservative estimate with notable ex-
ceptions due to orifice placement.
In the random perturbation of the wall signature,
the doublet strengths which define the lift influence are
not affected. Therefore, all randomness is transferred
to the blockage component of the pressure signature.
and tile blockage factor will be more sensitive to this
type of experimental noise. Tile error in blockage in-
creases with the decrease in the number of active ports_
which corresponds to a less accurate fit of the singular-
it3' strengths. Error in the blockage factor was foundto be approxinmtely the same order of magnitude for
numbers of ports greater than or approximately equal
to 150. Row configurations with less than 150 ports
are therefore less desirable. Since the upwash correc-
tion incorporates both blockage and lift interference,
tile overall trends in the upwash correction factor will
differ slightly from those of the blockage. As with the
blockage correction, the magnitude of error in the up-
wash correction tends to be approximately the sam('
for cases in which the number of ports is greater than
approximately 150. This again suggests that row con-
figurations with less than 150 ports are inadequate,
unless special care is taken in the placenmnt of rows
and orifices. It is also important to note that the mea-
sured pressure signature from rows of orifices in the
spanwise far-field of the model yield a higher level of
error than those rows positioned near the model. This
is primarily due to the radial distance of the ports from
the singularity representation of the model. Giventhese trends, it is recommended that the majority of
the orifices be located in the vicinity of the model. It
is noteworthy to point out that a higher average errorexists for measurements from rows of pressure orifices
placed directly below the model as opposed to directly
above the model. This suggests a slight favoring of tho
ceiling orifices, and in terms of inaintenance and orifice
integrity, ceiling pressure ports are favorable. Rows of
pressure orifices in the spanwise far-field and snmll to-
tal numbers of orifices yield less accurate results due
to the inability of these configurations and numbers
of ports to adequately resolve the wall signature. Thisresults in the inability of the method to accurately dit:
ferentiate between the lift and blockage interference inthese instances. While some of these rows are less im-
portant for pitch-plane corrections, the sidewall roaswill become essential when full three-dimensional cor-
rections are implemented.
Bias
Bia_s error was introduced into tile wall pressure sy,_-
tern by adding a constant amount to each wall pressm emeasurement. The instrumentation used to record
wall pressure data has a quoted accuracy of ±0.0025
psi; additionally, bias of this magnitude was observed
during the acquisition of data used for this study. This
range is similar to the precision error case; therefore,
the same three orders of magnitude stud), was con-ducted to determine sensitivities of the code to bias
error. Two separate studies related to bias error wereconducted: a global biasing (i.e., the entire wall signa-
6 OF 27
,A.MER1CAN INSTITUTE OF AERONAUTIUS AND ASTRONAUTICS PAPER 2001-0159

lure) and selective biasing of chosen pressure modules.
Global Biasing
Biasing of tile wall signature on a global scale has
the same effect on blockage as changing the Reynolds
mlmber; when bias is increased the measured blockage
displays an apparent decrease. When Reynolds num-ber increases, the tunnel wall boundary layers thin and
blockage decreases. This suggests that bias error in the
wall pressures can manifest as a pseudo-I/eynolds num-
ber effect. Figure 12 shows the biased wall signature
for two values of Be as compared to the baseline case.
This figure shows the biased wall signatures shifted
from the baseline case arid gives the corresponding
fit of each case. As demonstrated by Walker, 1'_ the
blockage is affected significantly by bias error; whereas
the upwash correction contains only a slight variation.
Figure 13 shows the sensitivity" of the primary correc-tions to an increase in Bp. In contrast, to the random
noise study', a mininmm error now exists because the
measured values have been shifted away from the true
solution. Very little difference in the blockage is seenin Figure 13a, but the upwash correction in Figure 13b
contains a significant difference between the mmxinmmand minirnunl values of error for each level of bias.
This difference in the upwash is due to the fact. that the
upwash correction contains the superposition of both
lift and blockage interference, and any differences seen
in the blockage factor are inagnified in the upwash cor-
rection. Figure 14 shows the error in terms of the force
coefficients in percentage of the corresponding uncor-
rected coefficient, and Figure 15 shows the change in
the coefficients. These figures can be used to deter-
mine the level of bias allowed according to the error
levels in the general requirements for test.ing (see Ta-ble 1). Error in both lift and drag corrections has a
strong linear correlation with Be.
The effect of the bias is clearly seen in the following
example. Several repeat data runs were done dur-
ing the test of a low-aspect ratio, high-lift, semispan
model. Normally, before each set of data runs the wall
pressure system was fully calibrated while the tunnel
was offiine. Calibrations performed during a run are
zero calibrations. A full calibration entails fitting afourth order curve through five data points dispersed
over the testing range. During a zero calibration the
curve is assumed to have shifted and only the constant
or zero term is adjusted for offset, the other coefficients
remaiuing constant. For one particular run the refer-ence pressure drifted when the tunnel came online and
only a zero-calibration of wall pressure system was con-
ducted prior to taking data (the full calibration of thewall pressures was perforined while the tunnel was of-
fline). For this case it. resulted in a biasing of the wall
pressure data. During the same data run another zero
calibration was performed which unbiased the data.
Corrections were comt)ut.ed for these data. Figure 16a
shows the blockage results for the three repeat data
runs. The step change in the data at (_ _ 14° plottedwith deltas are the results where the zero calibration
was performed during the run. After calibration the
offset blockage results collapse and follow the trends of
the two other repeat runs. Figure 16b shows three re-
peat runs where a full calibration was performed otttinewith no zero calibration when the tunnel came online
and no problems were observed. Although this bias-
ing phelmmena can be duplicated with artificial error,
further investigation should be done into the calibra-
tion process of wall pressures. The zero calibration
taken before acquiring data was probably done before
the static reference pressure reached equilil)rium and
thereby biased the data. When the second zero cal-
ibration was performed the static reference pressure
had probably equilibrated and the bias was then ad-
justed out.
Another significant outcome of the global biasing of
the wall pressure data is that of port placement for
testing. By subtracting the fit of the wall pressures
from the biased wall pressures, the ports which exert
the most influence on the wall fit can easily be seen.
This effect can also be seen in Figure 12 I)y comparing
the biased data with its corresponding WICS fit. The
areas where the fit. has relatively, large deviation from
the data are upstream of the model. The data from
the ports in these areas of large error had an insignifi-
cant effect on the fit generated by the code. Therefore
an optimal port. configuration for nsing the WlCS code
would be to have a vast majority of the pressure ports
in the vicinity of the model and approximately one
fuselage length downstream where the wake is influen-
tial. The primary reason for this is the distance from
each port to singularity representation dictates how
much influence that port has oil_ the final output. This
also suggests that tunnel aspect, ratio will have some
effect on the fitting of the wall signature since the dis-
tance from the model representation singularities to
the pressure ports may be larger or smaller.
Selective Biasing
Selective biasing was performed by adding a pres-
sure increment to all the data from select pressure
sensing modules. It can be inferred from results pre-
sented by Walker] "5that error due to biasing becomes
smaller with fewer ports being biased so that the bias
is in effect averaged out over the other ports. This is
seen predominately in the error of the blockage factor,with one notable exception that the upwash correc-
tion seems to be more sensitive to a biasing of thefloor pressures than the ceiling.
Force and Moment Measurements
Of all the forces and moments measured on the
model, lift is the primary input to the WICS code.As stated previously, the lift force is used to calcu-
T OF 2T
AMERICAN [NSTITUTE OF AERONAUTICS AND ASTRONAUTICS PAPER 2001 0159

late the strengths of the line doublets. This meansthat error in the lift force will cause more error in
the upwash correction than blockage. Figure 17 ev-
idences this statement by showing resultant error in
the primary correcti(ms due to introducing error in lift
according to tile generalized industry requirements in
Table i. Here, the blockage and upwash correction er-
rors, 6c and _ai are plotted against c_unc for error inmeasured lift of 0.2_, and 0.4_,. These lift errors are
insignificant for blockage; however, they can achieve asn, wh as 5fl% of the allowable error hmm_e of attack
UF/M and UREF terms become negligible and dropfl'om Equation 5. This allows the total uncertainty to
be approximated by Equation 6. Then
gl _ Uwps = f(PH'I,S, Bwps) (16)
The combination of errors is done according to the
root sum square method (ttSS). With the use of this
method, any error less than half the size of a larger er-
ror is negligible. According to results presented in the_o__ti,:m__n wall nressllre nler%qur_IIlents, the al_lomtt
taFuller, D., Gloss, B., and Nystrom, D., "Guide for Users of
the National Transonic Facility," NASA TM 83124, July 1981.
taHemsch, M., Grubb, J., Krieger, W., and Clef, D., "Lang-
ley Wind Tunnel Data Quality Assurance-Check Standard Re-
suits," AIAA Paper 2000-2201, 2000,
tSWalker, E., Sensitivity of the Wall Interference Correc-
tion System to Me_surement Uncertainty, Master's thesis, The
George W_shington University, 2000.
_aColeman, H. and Steele, W., Experimentation and Uncer-
tainty Analysis for Engineers, Wi]ey-lnterseience, 1989.

o o_0
!
_000o
k
o _oo ROW 1 (Floor)
o o50
=
"I0 o0o
I_050
:1 Tared Data
WGS Fit
5 TO 15 2_0
x [rq
0 O5o
!+oo
o 1oo R()W 4 {Floor)
X [ftl
ROW 7 (Ceiling)
X fit}
ROW I0 (Ceiling)
o Ioo(
0 050
X [ill
q
o _oo ROW2 (Floor) o,oo,.
0 050
II _= , u_'_
=-
.o 050
5 10 ---'20
X [f_]
o_oo ROW 5 (Floor)
o O50
o 0oo
•o 050 %
///
,/
//
0 10o_ ---
.... 15 " _JO 1_ 215
X [ft]
ROW 8 (Ceiling)
5 10 15 20
X lfl]
o,oo ROW I 1 (Ceiling)
o 05o
050
o 0oo
ROW 3 (Floor)
o 050 F
oo5o_
• 15 20Io
X [ftl
ROW 6 (Far Wall)
This Row isDisabled for
Semispan Testing
o _oo ROW 9 (Ceiling)
o 050
o oo0
.... _o i5 _o 115
X Ift]
o,oo ROW 12 (Near W',dl)
JI3_
r_--
o 05O
5
_0 ooo
=-
-0 050
-010o I
X [ill X [ftl 1
Fig. 1 Wall Signature of a Model at a.,,_ = 24 °
11 ov 27
AMERICAN INSTITUTE OF AERONAUTICS AND ASTRONAUTI('S PAPER 2001 0159

Z:
F'-"C,,,,,L,;2,
0
Z'
,<
i ..........
..... i .........
..... i .....
I I
d " d
%
i i
Nv
o
ioo
Z
b-
©
<
<
0
M
Z'<
.....i
o.
..... i
..... i
i
0 ....
.... o'
i i io Lx_ o,.: d d
.....
..... )
D
[_p] ho
<r,
<
©,..1
........ °o ...............
f I I L I I I
3
lo
Z
©
V-
©
m,¢
Z
.o
t
..... i
I I I I I I I I I I Ioo'7,
bsd] OV
Fig. 2 Mean Primary Corrections
¢-
or-
¢-o
_0
e-
.=.m
e-co
¢du
¢-
12 OF 27
AMERICAN INSTITUTE OF AERONAUTICS AND ASTRONAUTICS PAPER 2001 0159

Z
_oV-
_9
Z_2
r"
Z
_2
©
Z ¸
_2©
-2
° o
; ° ° ....
°o °
\
\
i i l i i
"DV
o,
......... ,m
1 1 1 I I I I I I I
=
D
Z<
©
©
Z©
C
rr'
©
<r_
I I I I I I I , I __
_ _ _ o_ _ _ _ _,
"DV
Z
: 22
x
Z
©
r_Z
[.-
e_
%%
..... Q
%%
L I I I I I I I _
o d d d d d d d d
I_DV
%e-.,m>-.
e-
e-,
V.
t...
"-.d,e..
e.-
e'-
e".m
Fig. 3 Coefficient Corrections
c-
"D
-O¢-
.m
_9
I '_.--._
b
o?
m _
o ",9
13 OF 27
AMERICAN INSTITUTE OF AERONAUTICS AND ASTI_ONAUTICS PAPER 2001-0159

N
4
2
0
-2
-4
13.2
(Looking downstream)
15.2
13 14 15 16 17
12
11
F_] 18,18.1
6
[El r_ ® _1 IZl5 4 3 2 1
Z
I i t i I I I i I i4 2 0 -2 -4
Y, ft(WlCS row numbers in box outline)
Fig. 4 Cross-Sectional Pressure Measurement Row Setup of the NTF
14 oF 27
AMERICAN INSTITUTE OF AERONAUTICS AND ASTRONAUTICS PAPER 2001 0159
C)¢e3 J I t i r
_llVA_ H(IIS
t¢3¢'-1
0t't
t¢3M
- :
- :
.
1¢3
- I I T I 1
I I I I I
[DNn13 ]
o
o
4
j!j• [. : :
. : • : :• • ¢ ! • •
8 8 8 8 8
I l I I ,I
I II I I I
: •
1 I 1 I I
I I I I I
[TIVA_ _]OlS HVd
+
o _o
eo
o _o
° ioo
o o
o o • o o+ o o o o
o o
o 8 8_ o • o o
8 _ 8 8
o 8 i 8 o
o o • o o
o o • o oo ÷ • o o
o o
o : o+ o + o
o o • o o
o o • o o
o o • o o
o o + o o
o o • o o
o o o o o
o o • o o
o o o o o
I I I i I
I I I I
: : : : :
: : . : :
l IIl e 8
I l l l 8l
I I I I I
$ l l l :i
• • • • •
C',__,
• i • • • •- _
_ tr5I
I I I I I
JOlOul!Jod IleA,_ --4
Fig. 5 Wall Orifice Layout for NTF
¢-
+
¢-
¢.
©
r_
-5.£5
¢-"O
©
15 OF 27
AMERlCAN INSTITUTE OF AERONAUTICS AND ASTRONAUTICS PAPER 2001 0159
w
uJ
10 .2
10 .3
10 4
10 .6
10 .6-10
O
O
O
,q
>
D,
I L I I
O
V Z
" - I
0
O0
O%oo oO c_ o
o o%o_o oC_°°o, O_oo _°°
_, << ,_ <<oo c <>:,_OOo_<<o_o 0<0% o_0 v 0 0 I>i><<_ O< <<% >
> o>0%
> V v I> AV
V W V ' V I> V
#>am < _VaAv_. v v a
V V
_, Z_. Z Z_ VA A
V > A
V A
10
o_.._[deg]
0
o
0<3
0 0 0[>
0
<30
<_ V
A
(a) Results for entire data run
I>D
V
V V
_, /,, A
I
20
oOO
) <> <> <>
<3
o >
<> > >
VE>
A V V
A
/" op = 0.001
v op = 0.002
I> op : 0.010
< op : 0.025
0 (_p= 0.050
0 op 0.100I I I I
3O
4.0xl 0 -°_
3.5xl 0 °s
MAX
-- -0- Average
3.0xl 0 °_
2.5xl 0°3
u
_,_ 2.0x10 o_
1.5x1 0 -°3
1.0x10 03
5.0xl 0 -°4
0.0x10+°11 10
_ [psi]
(b) Maximum & Average Values and Trends
Fig. 6 Error in e due to O'p Variation
16 OF 27
AMERICAN |NSTITUTE OF AERONAUTICS AND ASTRONAUTICS PAPER 2001-0159

o_ oLU 0
So
oo0
0
\
\
\IIII IIII IIII IIII IIII IIII IIII llll lllJ llll III_
0 0 0 0 0 0 0 0 0 0 0r.4D CO 0 I_ _I" _ CO I._ OJ C_ r..OCO 03 CO OJ 0_1 0.1 _ _ .T-
(slJod) NFig. 7 e Error Prediction
\
\
III
OO3
o
O V--
,m
¢)
17 OF 27
AMERI('AN INSTITUTE OF AERONAUTI('S AND ASTRONAUTICS PAPER 2001- 0159

_5
\
\
\
v
llll IIII IIII IIit till t111 IIII IIII I111 tl_"'_ IIII IIII
0 0 0 0 0 0 0 0 0 0 0 0
Fig. 8
(siJod) Na_ Error Prediction
0
T'-
0 T--
|m
e_
eLD
18 OF 27
AMERICAN INSTITUTE OF AERONAUTICS AND ASTRONAUTICS PAPER 2001-0159

OO
00
o
o _Q,0d
0
d,
\
\
wII _ It Illl I_ll IIII _ll JITl lull J;It
0 0 0 0 0 0 0 0 0 0 0r4D CO 0 I'_ '_" "_- CO L.O O,J 0")CO CO CO CXl O,J Cxl _.- ._- _-
(s_Jod) NACD, Error PredictionFig. 9
Oq
OCD
"TO
O,i---
P''l|l
iX
D
[9 or 27
AMERICAN _NSTITUTE OF AERONAUTIC_ AND ASTRONAUTICS PAPER 2001 0159

/
\\/
0
0
_o.ILl 0
V
0
\LIII IIIL [III 1111 IIII illl IIII IIII IIII IIII IIII \III
0 0 0 0 0 0 0 0 0 0 0 0 0 _
(slJod) NACL(_I Error PredictionFig. 10
iim
t,_t--_J
a.
20 OF 27
AMERICAN INSTITUTE OF AERONAUTICS AND ASTRONAUTICS PAPER 2001 0159

0 0r.O COCO o3
H
/If)0
0
S
Fig. 11
(s_Jod) Ni-_CDt (%1 Error Prediction
\
\
\
"T,0
0 T-"
mm
¢R¢Z
L.--J
ft.
21 OF 27
AMERICAN |NSTITUTE OF AERONAUTICS AND ASTRONAUTICS PAPER 2001-0159

o050
=
o 050
o ioo _----
ROW I (Floor) 0 _0o ROW 2 (Floor)
li 050
v_'vvvvvvv v_ - vvvvv_vvv _v _
A_A_AZ_A_ A,_ I1_1_ A _ZXA_A_:,A ,_, ,t_
.... BaseNne Fit
a B=0.1 Data .oosol
B = 0.1 Fit
v B = -.1 Data
- B=-.1 Fit
10 15 0 5 _o 15 20
X Ifl] X [fl]
o _o ROW 4 (Fh)or)
/
' / .......
x Ift]
ROW 7 (Ceiling,
f\ ,),
% ---_vvv %
=_ / / A
& zx A _.A ,9,Z_
oO50
=
I1_oooo
o05o
4 ,_5 _ox In]
ROW 10 (Ceiling)
aa_a _aa
AAAAAAZX z_
x fit]
o o5o
o_oo ROW 5 (Floor)
o ooo %: : /
0050 _- _
4_
5 10 15 20
x fit]
-o lOO!
ROW 8 (Ceiling)
v_
vv _
vvvvV _a %_
AAAAA AA
X Ift]
oO5OF
"_o ooo
#
-o050 F-
o loo ROW 11 (Ceiling)
o 000
-o iooI
ROW 3 (Floor)
vvvvvvvv _ _.//
az_ _AAAz5 A Z_ Z_
_0
X [ft]
ROW 6 (Far Wall)
o 050
_o ooo
3
o 050
This Row isDisabled for
Semispan Testing
ROW 9 (Ceiling)
i vJ/:_ _ -v
z_z_z_&A AA
5 10 15 20
X [ft]
o ,oo ROW 12 (Near Wall)
AAAa
O05OF _3:plm_v 47 _ v - _
AAAAAA AAA
0 O5O _
5 10 1_ 2O
x [_t]
0050
=
oooo
o 050
.o lo.o
x [ft]Jo
Fig. 12 Wall Signature Comparison for Bp ---- ±0.I psi
22 OF 27
AMER[CAN INSTITUTE OF AERONAUTICS AND ASTRONAUTICS PAPER 2001-0159

2.0xl 0 °_
w
¢,,0¢,0
1.8xl 0 .o2
1.6x 10 o2
1.4x10 -°2
1.2xl 0 .o2
1.0x10 o2
8.0x 10 .o3
6.0x 10 -°3
4.0x10 o3
2.0x 10 o3
O.OxlO+°_l
[] Max
- -0- - Average_> Min
/
J
102
Bp [psi]10 1
(a) Error in Blockage Factor
1.0E-019.0E-02
8.0E-02
__
[] Max ]Avem¢,_
>- ; Min
7.0E-02
6.0E-02
5.0E-02
4.0E-02
3.0E-02
2.0E-02
1.0E-02
O.OE+O01
Fig. 13
/J
JJ
/
/
J
J
I ,I ,, i,
Bp [psi]
(./
.t
1
(b) Error in Upwash Correction
Primary Correction Sensitivity to Variation in Bp
23 OF 27
A},IERICAN INSTITUTE OF AERONAI'TICS AND ASTRONAUTICS PAPER 2001-0159

1.5x10 -°_ .---
1.4x10 -°_
1.3x10 -°1 ;--
1.2x10-o_ --_
1.1x10 -°1 ;=
1.0x10 -°1 ;.
__ 9.0x10 -°2 ;-
_' 8.0x10-o2 -U
7.0x10 .02
-- 6.0x1002 -
5.0x10 °2 _
4"0x10-°2
3.0x10 -02 :
2.0x10-o2 :_
1.0x10 `o2 _
O.OxlO+ 1 :
o Max
- _ - AverageMin
,./..,.-
..... -,-,-_ _ .... -1
Bp [psi]
//
J
/
J ....... ¢ ...... i ...... r ...... ] i
(a) Error in AC L in Percent CL uoc
f1
E
I",
L_
1.2E+00 1
1.1 E+O0
1.0E+O0
9.0E-01 -
8.0E-01
7.0E-01
6.0E-01 _--
5.0E-01
4.0E-01 j
3.0E-01 -
2.0E-01 -
1.0E-01
O.OE+O01
[] Max
-- Average- ...... Min
1
Bp [psi]
<
10 -1
(a) Error in ACot in Percent C D.n_
Fig. 14 Percent Force Coefficient Correction Sensitivity to Variation in .Bp
24 oF 27
AMERICAN [NSTIT(_TE OF AERONAUTICS AND ASTRONAUTICS _APER 2001-0159

<3t,O
1.5x10 -°3
1.4xl 0 .o3
1.3x10 o3
1.2x 10 `o3
1 .lx10 -°3
1.0xl 0 .o3
9.0x 10 TM
8.0X10-04
7.0X10 .04
6.0X 1 0 .04
5.0X 10-04
4.0X 1 0 .o4
3.0xl 0-04
2.0xl 0 `04
1.0x 1 0-04
0.0x10"° 1
D Max
- _ - AverageMin
/
/
Bp [psi]
(a) Error in AC L
m
0
5.0E-03
4.5E-03
4.0E-03
3.5E-03
3.0E-03
2.5E-03
2.0E-03
1.5E-03
1.0E-03
5.0E-04
O.OE+O(_ (
E3 Max
- -0- - AverageMin
///
/
/
, yi _ -_'_" j._1 i f
fi
J
J
J
I0
Bp [psi]
(b) Error in ,&Cot
Fig. 15 Force Coefficient Correction Sensitivity to Variation in Bp
101
25 OF 27
AMERICAN INSTITUTE OF AERONAUTICS AND ASTRONAUTICS PAPER 2001-0159

0.013 -
0.012 -
0.011 =
0.01
0.009 =
0.008 -
0.007 =
0.006_ 5 i h L L
[
Zero CalibrationPerformed
Zx_
o___ _ ,v__''__
I I I _ I I I 1 I I 1 I I I I I
0 5 10 15
c%_ [deg]
¢0
ZX
20
8A
25
(a) Biased Case
0.013
0.012 -
0.011 -
0.01
0.009 =
>
0.008 -
0.007
0.006.5 L I i I
Ak
I I I I I I I IIII I111
0 5 10 15
_.n¢ [deg]
,kill
20
(b) Unbiased Case
Fig. 16 Biasing of Wall Pressures due to Calibration
25
26 OF 27
AI_IERICAN INSTITUTE OF AERONAUTICS AND ASTRONAUTICS PAPER 2001-0159

_uco
i
2.5x10 °s
2.0xl 0°s <
1.5xl 0 -°s
1.0x 10 os -
5.0x10 06 =
0.0x10*°_4"O
00
10
o_..=[deg]
0 <>0
0©
<>
I[] L 0.2%
© L 0.4%M 0.01
00()0
o%o°°J[] [] []_313rm D[_3rs
I t J I I I I I
15
<>0
20 25
(a) Error in Blockage Factor
5.0E-03
4.0E-03
3.0E-03
8--- 2.0E-03
1.0E-030 (
t []0
L 0.2%
0 L 0.4%Q M 0.01
- ....... ()
/J
5 10 15
_.c [deg]
O0 O(
[]
1313 it1 [][] []
O0O0
] I I I
i
r3 i
L>0000
i
20 25
(b) Error in Upwash Correction
Fig. 17 Primary Correction Error for Other Error Sources
27 oF 27
AMERICAN INSTITUTE OF :'kERONAIYFI('S AND ASTRONAUTICS PAPER 2001 0159