Agua Fria River Watershed – Arizona - uafwp.orguafwp.org/html/WR6 NRCS-RWAReport.pdf · Agua Fria...
54
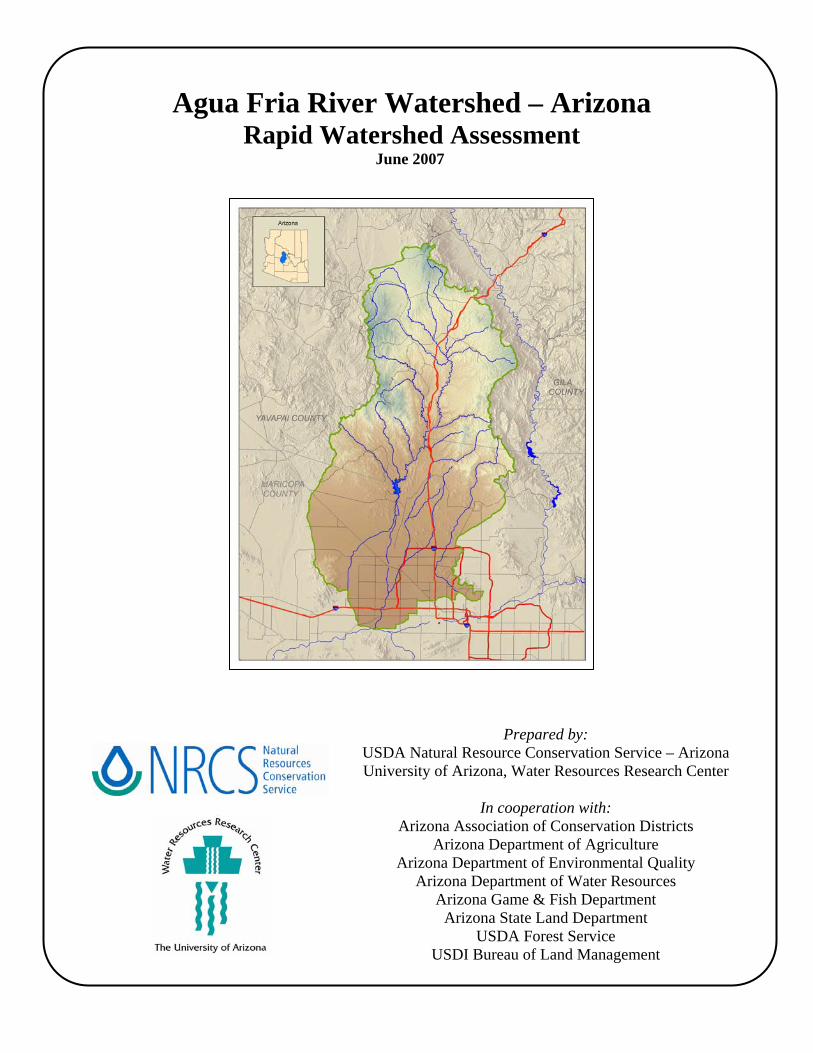
Agua Fria River Watershed – Arizona Rapid Watershed Assessment June 2007 Prepared by: USDA Natural Resource Conservation Service – Arizona University of Arizona, Water Resources Research Center In cooperation with: Arizona Association of Conservation Districts Arizona Department of Agriculture Arizona Department of Environmental Quality Arizona Department of Water Resources Arizona Game & Fish Department Arizona State Land Department USDA Forest Service USDI Bureau of Land Management
Transcript of Agua Fria River Watershed – Arizona - uafwp.orguafwp.org/html/WR6 NRCS-RWAReport.pdf · Agua Fria...
Agua Fria River Watershed – Arizona Rapid Watershed Assessment
June 2007
Prepared by: USDA Natural Resource Conservation Service – Arizona University of Arizona, Water Resources Research Center
In cooperation with:
Arizona Association of Conservation Districts Arizona Department of Agriculture
Arizona Department of Environmental Quality Arizona Department of Water Resources
Arizona Game & Fish Department Arizona State Land Department
USDA Forest Service USDI Bureau of Land Management
Released by:
Sharon Megdal Director
University of Arizona Water Resources Research Center
David McKay State Conservationist
U.S. Department of Agriculture Natural Resources Conservation Service
Additional Principal Investigators: Dino DeSimone – Natural Resources Conservation Service, Phoenix, Arizona Keith Larson – Natural Resources Conservation Service, Phoenix, Arizona Kristine Uhlman – Water Resources Research Center, University of Arizona D. Phil Guertin – School of Natural Resources, University of Arizona Deborah Young – Associate Director, Cooperative Extension, University of Arizona The United States Department of Agriculture (USDA) prohibits discrimination in all its programs and activities on the basis of race, color, national origin, gender, religion, age, disability, political beliefs, sexual orientation, and marital or family status. (Not all prohibited bases apply to all programs.) Persons with disabilities who require alternative means for communication of program information (Braille, large print, audiotape, etc.) should contact USDA’s TARGET Center at 202-720-2600 (voice and TDD). To file a complaint of discrimination, write USDA, Director, Office of Civil Rights, Room 326W, Whitten Building, 14th and Independence Avenue, SW, Washington, D.C., 20250-9410 or call (202) 720-5964 (voice or TDD). USDA is an equal employment opportunity provider and employer.

Agua Fria River – 15070102 8-Digit Hydrologic Unit
Rapid Watershed Assessment
Section 1: Introduction Overview of Rapid Watershed Assessments
A Rapid Watershed Assessment (RWA) is a concise report containing information on natural resource conditions and concerns within a designated watershed. The "rapid" part refers to a relatively short time period to develop the report as compared to a more comprehensive watershed planning effort. The “assessment” part refers to a report containing maps, tables and other information sufficient to give an overview of the watershed and for use as a building block for future planning. RWAs look at physical and socioeconomic characteristics and trends, as well as current and future conservation work.
The assessments involve the collection of readily available quantitative and qualitative information to develop a watershed profile, and sufficient analysis of that information to generate an appraisal of the conservation needs of the watershed. These assessments are conducted by conservation planners, using Geographic Information System technology, assessing current levels of resource management, identifying priority resource concerns, and making estimates of future conservation work. Conservation Districts and other local leaders, along with public land management agencies, are involved in the assessment process.
An RWA can be used as a communication tool between the Natural Resources Conservation Service (NRCS) and partners for describing and prioritizing conservation work in selected watersheds. RWAs provide initial estimates of conservation investments needed to address the identified resource concerns in the watershed. RWAs serve as a platform for conservation program delivery, provide useful information for development of NRCS and Conservation District business plans, and lay a foundation for future watershed planning.
General Description of the Agua Fria River Watershed The Agua Fria River Watershed is located in the central portion of the state of Arizona, southeast of the city of Prescott, and north of Phoenix. (Figure 1-1). The watershed can be defined as the area drained by the Agua Fria River to the confluence with the Gila River west of the Phoenix metropolitan area near Avondale. The watershed comprises 1.79 million acres (2,785 square miles), and is located 51% in Yavapai County and 49% in Maricopa County. Thirty-eight percent of the land is managed by BLM, 30% is State Trust Land, 16% is private land, 9% is managed by the Forest Service, 5% is USFS & BLM wilderness areas, and 3% is state park land. The watershed includes the Cities of Avondale, Carefree, Cave Creek Glendale, Peoria, and Prescott Valley. There are two U.S. Department of Agriculture (USDA) Service Centers located in Avondale and Prescott Valley. Conservation assistance is provided through seven Natural Resource
Agua Fria Watershed Rapid Watershed Assessment Section 1 - Introduction page 1-1

Conservation Districts: Chino Winds, Verde, Tonto, East Maricopa, Agua Fria-New River, Wickenberg, and Buckeye Valley (Figure 1-1). The area is mostly rangeland with a mixture of cropland and urban development. The watershed’s one large lake, Lake Pleasant, is used for water storage and recreation. Rangeland and most forestlands are grazed year around by cattle, except at lower elevations where grazing is seasonal with stocker cattle in years with good winter-spring rainfall. Irrigation land is used for cotton, alfalfa, barley, and other small grains. Where water supply is available, lettuce, carrots, cabbage, cauliflower, melons, among other market vegetables, and citrus are grown. Land available for cultivation is being encroached upon by rapid urbanization in the larger communities. Resource concerns in the watershed include soil erosion, excessive runoff (causing flooding or ponding), aquifer overdraft, contaminants in surface and ground water, air quality, declining threatened plant & animal species, invasive plants, and fish & wildlife habitat degeneration.
Agua Fria Watershed Rapid Watershed Assessment Section 1 - Introduction page 1-2

Section 2: Physical Description The Agua Fria River Watershed in Arizona is defined as the area drained by the Agua Fria River to the confluence with the Gila River west of the Phoenix metropolitan area near Avondale. The watershed is located in the central part of the state, from the western part of Phoenix, north to the Prescott area. Watershed Size The Agua Fria River Watershed covers approximately 2,784 square miles, representing about 2.4% of the state of Arizona. The watershed has a maximum approximate width of 46 miles east-west, and a maximum length of 90 miles north-south. The Agua Fria River Watershed was delineated by the U.S. Geological Survey and has been subdivided by the NRCS into smaller watersheds or drainage areas. Each drainage area has a unique hydrologic unit code (HUC) number and a name based on the primary surface water feature within the HUC. These drainage areas can be further subdivided into even smaller watersheds as needed. The Agua Fria has an 8-digit HUC of 15070102 and contains the following 10-digit HUCs:
• 1507010201 (Ash Creek and Sycamore Creek);
• 1507010202 (Big Bug Creek-
Agua Fria River);
• 1507010203 (Black Canyon Creek);
• 1507010204 (Bishop Creek);
• 1507010205 (Agua Fria River-Lake Pleasant), 1507010206 (Cave Creek-AZ Canal Diversion Channel), 1507010207 (Trilby Wash-Trilby Wash Basin);
• 1507010208 (New River); and,
• 1505010209 (Agua Fria River
below Lake Pleasant, Figure 1-2). Geology The Agua Fria River Watershed is characterized by a narrow, rugged valley rising up from the desert floor of the Phoenix Basin, steadily gaining in elevation as the watershed extends up and over a lava plateau and to the edge of the southern boundary of the Verde River Watershed. The geology of the watershed is complex, varying widely in age, rock-type, and structure (Figure 2-1). The Agua Fria Valley is formed by erosion of the Bradshaw Mountains. Subsidence along this zone eventually caused both the Verde River to the north and west, and the Agua Fria, to stop flowing, forming a series of ancient lakes and deposition of lake sediments. Damming of the Agua Fria also occurred due to multiple lava flows which originated from a source to the northeast. The mountains and ridges that border the watershed are composed of metamorphic rocks (rocks that undergo change due to extreme heat or pressure) which form mountains in the southern portion of the watershed; mesas to the east; and the Bradshaw Mountains to the west. The central portion of the valley consists of stream deposits of sand, silt and gravel with
Agua Fria Watershed Rapid Watershed Assessment Section 2 - Physical Description page 2-1

stream-rounded pebbles and lava flows, commonly lying on soil zones baked by the heat of the flowing lava. The rocks consist primarily of granite that weathers to rounded boulders and knobs, and flaky, silvery rocks. Flat-lying layers of whitish limestone, siltstone, and water-laid volcanic ash are found in lake sediments, and lava flows cap the higher mesas. Near Cordes Junction, loosely consolidated stream and lake deposits are capped with volcanic rock, and a lava plateau forms the drainage divide between Turkey Creek (an Agua Fria tributary) and the Verde River Watershed to the west (Chronic, 1983). Sunset Point Rest Area on Interstate Route 17 looks down on Black Canyon, named for the dark metamorphic rocks that give it its name. The Bradshaw Mountains are walled with the same rock but also is composed of a larger mass of granite. Along the edge of the Mogollon Rim (the boundary of the Colorado Plateau Highlands), lava flows cascaded from the plateau surface, draining and forming poorly drained, nearly flat-lying mesas in the eastern margin of the Agua Fria. Figure 2-1 shows the geology of the Agua Fria River Watershed, Soils Soils within the Agua Fria River Watershed are diverse and formed as the result of differences in climate, vegetation, geology, and physiography.
Detailed soils information for the watershed is available from the Natural Resources Conservation Service (NRCS) and the U.S. Forest Service (USFS). The USFS maintains Terrestrial Ecosystem Surveys on National Forest Lands within the watershed. Lands outside of National Forests are included within the following NRCS Soil Surveys: “Soil Survey of Yavapai County, AZ, Western Part”; “Soil Survey of the Black Hills-Sedona Area, AZ, Parts of Coconino and Yavapai Counties”; “Soil Survey of Maricopa County, AZ, Central Part”; “Soil Survey of Eastern Maricopa and Northern Pinal Counties Area, AZ”; and “Soil Survey of Aguila-Carefree Area, AZ, Parts of Maricopa and Pinal Counties, AZ.” Soils data and maps from these Soil Surveys can be accessed through the NRCS Web Soil Survey website: http://websoilsurvey.nrcs.usda.gov.
Agua Fria Watershed Rapid Watershed Assessment Section 2 - Physical Description page 2-2
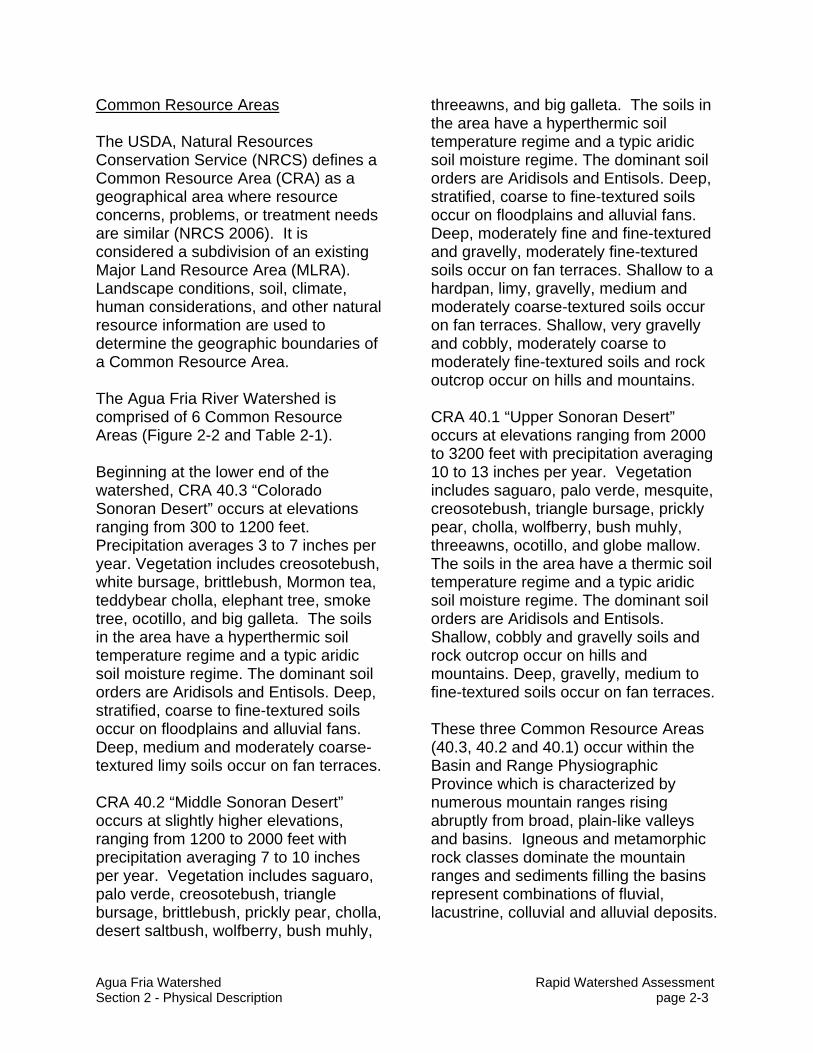
Common Resource Areas The USDA, Natural Resources Conservation Service (NRCS) defines a Common Resource Area (CRA) as a geographical area where resource concerns, problems, or treatment needs are similar (NRCS 2006). It is considered a subdivision of an existing Major Land Resource Area (MLRA). Landscape conditions, soil, climate, human considerations, and other natural resource information are used to determine the geographic boundaries of a Common Resource Area. The Agua Fria River Watershed is comprised of 6 Common Resource Areas (Figure 2-2 and Table 2-1). Beginning at the lower end of the watershed, CRA 40.3 “Colorado Sonoran Desert” occurs at elevations ranging from 300 to 1200 feet. Precipitation averages 3 to 7 inches per year. Vegetation includes creosotebush, white bursage, brittlebush, Mormon tea, teddybear cholla, elephant tree, smoke tree, ocotillo, and big galleta. The soils in the area have a hyperthermic soil temperature regime and a typic aridic soil moisture regime. The dominant soil orders are Aridisols and Entisols. Deep, stratified, coarse to fine-textured soils occur on floodplains and alluvial fans. Deep, medium and moderately coarse-textured limy soils occur on fan terraces. CRA 40.2 “Middle Sonoran Desert” occurs at slightly higher elevations, ranging from 1200 to 2000 feet with precipitation averaging 7 to 10 inches per year. Vegetation includes saguaro, palo verde, creosotebush, triangle bursage, brittlebush, prickly pear, cholla, desert saltbush, wolfberry, bush muhly,
threeawns, and big galleta. The soils in the area have a hyperthermic soil temperature regime and a typic aridic soil moisture regime. The dominant soil orders are Aridisols and Entisols. Deep, stratified, coarse to fine-textured soils occur on floodplains and alluvial fans. Deep, moderately fine and fine-textured and gravelly, moderately fine-textured soils occur on fan terraces. Shallow to a hardpan, limy, gravelly, medium and moderately coarse-textured soils occur on fan terraces. Shallow, very gravelly and cobbly, moderately coarse to moderately fine-textured soils and rock outcrop occur on hills and mountains. CRA 40.1 “Upper Sonoran Desert” occurs at elevations ranging from 2000 to 3200 feet with precipitation averaging 10 to 13 inches per year. Vegetation includes saguaro, palo verde, mesquite, creosotebush, triangle bursage, prickly pear, cholla, wolfberry, bush muhly, threeawns, ocotillo, and globe mallow. The soils in the area have a thermic soil temperature regime and a typic aridic soil moisture regime. The dominant soil orders are Aridisols and Entisols. Shallow, cobbly and gravelly soils and rock outcrop occur on hills and mountains. Deep, gravelly, medium to fine-textured soils occur on fan terraces. These three Common Resource Areas (40.3, 40.2 and 40.1) occur within the Basin and Range Physiographic Province which is characterized by numerous mountain ranges rising abruptly from broad, plain-like valleys and basins. Igneous and metamorphic rock classes dominate the mountain ranges and sediments filling the basins represent combinations of fluvial, lacustrine, colluvial and alluvial deposits.
Agua Fria Watershed Rapid Watershed Assessment Section 2 - Physical Description page 2-3

Table 2-1: Agua Fria River Watershed - Common Resource Areas Common Resource Area Type
Area (sq. mi.)
Percent of Watershed
40.3 Colorado Sonoran Desert 97.30 3.5 40.2 Middle Sonoran Desert 935.84 33.6 40.1 Upper Sonoran Desert 374.64 13.5 38.1 Lower Interior Chaparral 1,299.05 46.6 38.2 Interior Chaparral – Woodlands 23.97 0.8 35.1 Colorado Plateau Mixed Grass Plains 54.37 1.9 Data Sources: GIS map layer “cra”. Arizona Land Information System (ALRIS 2004). Natural Resource Conservation Service (NRCS 2006) Moving up the watershed, CRA 38.1 “Lower Interior Chaparral” occurs at elevations ranging from 3000 to 4500 feet. Precipitation averages 12 to 16 inches per year. Vegetation includes canotia, one-seed juniper, mesquite, catclaw acacia, jojoba, turbinella oak, ratany, shrubby buckwheat, algerita, skunkbush, tobosa, vine mesquite, bottlebrush squirreltail, grama species, curly mesquite, desert needlegrass and New Mexico feathergrass. The soils in the area have a thermic soil temperature regime and an ustic aridic moisture regime. The dominant soil orders are Aridisols and Mollisols. Shallow, gravelly and cobbly, moderately coarse to moderately fine-textured soils and rock outcrop occur on hills and mountains. Shallow to deep, gravelly, cobbly and stony, fine-textured soils occur on basaltic plains, mesas and hills. Deep, gravelly, medium to fine-textured soils occur on fan terraces. CRA 38.2 “Interior Chaparral – Woodlands” occurs at elevations
ranging from 4000 to 5500 feet with precipitation averaging 16 to 20 inches per year. Vegetation includes turbinella oak, hollyleaf buckthorn, desert buckbrush, one-seed juniper, alligator juniper, pinyon, algerita, sugar sumac, prairie junegrass, blue grama, curly mesquite, bottlebrush squirreltail, muttongrass, cane beardgrass, plains lovegrass and bullgrass. The soils in the area have a thermic to mesic soil temperature regime and an aridic ustic soil moisture regime. The dominant soil orders are Alfisols and Mollisols. Moderately deep and deep, gravelly and cobbly, moderately coarse to fine-textured soils occur on mountains. These two Common Resource Areas (38.1 and 38.2) occur within the Transition Zone Physiographic Province which is characterized by canyons and structural troughs or valleys. Igneous, metamorphic and sedimentary rock classes occur on rough mountainous terrain in association with less extensive sediment filled valleys. At the upper end of the watershed occurs CRA 35.1 “Colorado Plateau Mixed Grass Plains” with eelevations ranging from 5100 to 6000 feet. Precipitation averages 10 to 14 inches per year. Vegetation includes Stipa species, Indian ricegrass, galleta, and blue grama, fourwing saltbush, winterfat, and cliffrose. The soils in the area have a mesic soil temperature regime and an ustic aridic soil moisture regime. The dominant soil orders are Aridisols and Entisols. Deep, gravelly, moderately fine and fine-textured soils occur on floodplains and valley slopes and plains. Shallow, gravelly, medium-textured and deep, medium and moderately fine-textured soils occur on plains and hills.
Agua Fria Watershed Rapid Watershed Assessment Section 2 - Physical Description page 2-4

CRA 35.1 occurs within the Colorado Plateau Physiographic Province which is characterized by a sequence of flat to gently dipping sedimentary rocks eroded into plateaus, valleys and deep canyons. Sedimentary rock classes dominate the plateau with volcanic fields occurring for the most part near its margin. Slope Classifications Slope, as well as soil characteristics and topography, are important when assessing the vulnerability of a watershed to erosion. Approximately 42.6% of the Agua Fria Watershed has a slope greater than 15%, while 39.1% of the watershed has a slope less than 5%. The Agua Fria River Watershed below Lake Pleasant watershed is relatively flat, with only 11.6% of its area over 15% slope, and 80.1% less than 5% slope. The Black Canyon Creek and Agua Fria – Lake Pleasant watersheds are relatively steep, with 74.7% and 77.9% of the area greater than 15% slope, respectively (Table 2-2 and Figure 2-3). Table 2-2: Agua Fria River Watershed Slope Classifications.
Percent Slope Watershed Name
Area (sq. mi.) 0-5% 5-15% >15%
Ash Creek and Sycamore Creek 1507010201 261 15.1 34.2 50.7 Big Bug Creek-Agua Fria River 1507010202 324 22.3 31.1 46.6 Black Canyon Creek 1507010203 244 7.4 17.9 74.7 Bishop Creek 1507010204 236 18.1 24.2 57.7
Percent Slope Watershed Name
Area (sq. mi.) 0-5% 5-15% >15%
Agua Fria River-Lake Pleasant 1507010205 372 6.2 15.9 77.9 Cave Creek-Arizona Canal Diversion Channel 1507010206 288 51.0 14.7 34.2 Trilby Wash-Trilby Wash Basin 1507010207 242 71.1 10.9 18.0 New River 1507010208 353 56.9 15.3 27.8 Agua Fria River below Lake Pleasant 1507010209 464 80.1 8.3 11.6 Agua Fria River Watershed 2,784 39.1 18.4 42.6 Data Sources: Derived from DEM, obtained from U.S. Geological Survey, April 8, 2003 http://edc.usgs.gov/geodata/ Streams, Lakes and Gaging Stations The locations of active and inactive gaging stations, and their respective annual mean stream flow, are found in Table 2-3.1. Agua Fria River near Rock Springs has the largest annual stream flow with 78.80 cfs. Skunk Creek near Phoenix has the lowest annual stream flow with 1.48cfs. Table 2.3.2 lists major lakes and reservoirs in the Agua Fria River Watershed, as well as their watershed position, surface area, elevation and dam name. Trilby Wash Basin and Lake Pleasant are the largest surface waters with areas of 2,068 and 2,042 acres respectively. The next largest water body is Fain Lake which covers 1,015 acres. Table 2-3.3 lists the major streams and their lengths. Stream lengths range from 167.6 miles
Agua Fria Watershed Rapid Watershed Assessment Section 2 - Physical Description page 2-5

for Agua Fria to 29.0 miles for Big Bug Creek (Figure 2-4). Riparian Vegetation The Arizona Game & Fish Department has identified and mapped riparian vegetation associated with perennial waters in response to the requirements of the state Riparian Protection Program (July 1994). This map was used to identify riparian areas in the Agua Fria Watershed (Figure 2-5). Seven of the ten types of riparian areas occur within this watershed. Riparian areas encompass approximately 1,715 acres (2.7 sq. mi.) or 0.04% of the entire watershed. Mixed Broadleaf comprises about 1,025 acres (1.6 sq. mi., or
59.8%) of the riparian areas, and Strand (the area alongside the stream channel, or shore) comprises about 337.9 acres (0.53 sq. mi., or 19.7%). The Ash Creek and Sycamore Creek watershed has the greatest amount of riparian vegetation with about 577 acres (0.90 square miles). The Bishop Creek and Agua Fria – Lake Pleasant watersheds also have large amounts of riparian vegetation with 421 acres (0.66 sq. mi.) and 338 acres (0.51 sq. mi.) respectively. The Trilby Wash-Trilby Wash Basin and New River watersheds have no riparian vegetation associated with perennial waters. Table 2-4 lists riparian vegetation types and areas for each watershed.
Agua Fria Watershed Rapid Watershed Assessment Section 2 - Physical Description page 2-6

Table 2-3.1: Agua Fria River Watershed USGS Stream Gages and Annual Mean Stream Flow.
USGS Gage ID Site Name Begin Date End Date
Annual Mean Stream Flow
(cfs) Active Gages
9512280 Cave Creek Below Cottonwood Creek near Cave Creek 1981 2005 6.57
9512450 Agua Fria River near Humboldt 1/1/2001 12/30/2004 3.89 9512500 Agua Fria River near Mayer 1/1/1940 12/30/2004 22.25 9512800 Agua Fria River near Rock Springs 1/1/1971 12/30/2004 78.89 9513780 New River near Rock Springs 1/1/1966 12/30/2004 12.06 9513860 Skunk Creek, near Phoenix 1/1/1968 12/30/2004 1.48
Inactive Gages 9512300 Cave Creek near Cave Creek 1959 1967 4.07 9512400 Cave Creek at Phoenix 1990 1991 3.17 9512495 Perry Canal near Mayer 1/1/1941 12/30/1958 0.45 9512501 Sycamore Dam Site Total * 1/1/1941 12/30/1959 24.09 9512501 Sycamore Dam Site Total * 1/1/1978 12/30/1980 85.3 9512600 Turkey Creek near Cleator 1/1/1980 12/30/1991 11.26 9512830 Boulder Creek near Rock Springs 1/1/1984 12/30/1992 3.25 9512970 Cottonwood Creek near Waddell Dam 1/1/1984 12/30/1992 0.35 9513000 Agua Fria River at Waddell Dam 1/1/1915 12/30/1918 320.87 9513500 Lake Pleasant at Waddell Dam N/A N/A N/A 9513650 Agua Fria River at El Mirage 1/1/1994 12/30/1997 0.085 9513700 Agua Fria River Tributary at Youngtown 1/1/1962 12/30/1967 0.016 9513800 New River at New River 1/1/1961 12/30/1981 13.96 9513835 New River at Bell Road, near Peoria * 1/1/1968 12/30/1983 11.31 9513835 New River at Bell Road, near Peoria * 1/1/1991 12/30/1992 7.78 9513910 New River near Glendale * 1/1/1965 12/30/1969 11.19 9513910 New River near Glendale * 1/1/1991 12/30/1997 32.41 9513970 Agua Fria River at Avondale 1/1/1968 12/30/1981 35.25 *Discontinuous years of data Data Sources: USGS website, National Water Information System http://waterdata.usgs.gov/nwis/
Agua Fria Watershed Rapid Watershed Assessment Section 2 - Physical Description page 2-7

Table 2-3.2: Agua Fria River Watershed Major Lakes and Reservoirs.
Lake Name (if known) Watershed
Surface Area (acre)
Elevation (feet above mean sea
level) Dam Name (if known)
Trilby Wash Basin Trilby Wash-Trilby Wash Basin 2,068 1,348 McMicken Dam Lake Pleasant Agua Fria River-Lake Pleasant 2,042 1,570 Carl Pleasant Dam Fain Lake Big Bug Creek-Agua Fria River 1,015 4,600 not known Flood Pool for White Tanks #3 Flood Retarding Structure
Agua Fria River below Lake Pleasant 261 1,202
White Tanks #3 Flood Retarding Structure
Hank Raymond Lake
Agua Fria River below Lake Pleasant 78 1,438
Camp Dyer Diversion Dam
Lynx Lake Big Bug Creek-Agua Fria River 49 5,532 Lynx Lake Dam Dawn Lake New River 36 1,160 not known Viewpoint Lake New River 32 1159 not known
Lake Bonita Agua Fria River below Lake Pleasant 29 1,409 not known
Caterpillar Tank Agua Fria River below Lake Pleasant 12 1,535 not known
Layton Tank Agua Fria River-Lake Pleasant 8 2,786 not known Mesa Reservoir Big Bug Creek-Agua Fria River 6 5,108 Mesa Reservoir DamData Sources: GIS data layer “Lakes”, Arizona State Land Department, Arizona Land Resource Information System (ALRIS), February 7, 2003 http://www.land.state.az.us/alris/index.html Table 2-3.3: Agua Fria River Watershed Major Streams and Lengths.
Stream Name Watershed Stream Length
(miles)
Agua Fria River
Agua Fria River below Lake Pleasant; Agua Fria River-Lake Pleasant; Ash Creek and Sycamore Creek; Big Bug Creek-Agua Fria River; Bishop Creek 167.6
New River New River 58.7 Cave Creek Cave Creek-Arizona Canal Diversion Channel 45.6 Ash Creek Ash Creek and Sycamore Creek 39.7 Beardsley Canal Agua Fria River below Lake Pleasant 30.6 Castle Creek Agua Fria River-Lake Pleasant 30.4 Skunk Creek Bishop Creek 30.4 Trilby Wash Trilby Wash-Trilby Wash Basin 30.3 Turkey Creek Black Canyon Creek 30.2 Big Bug Creek Big Bug Creek-Agua Fria River 29.0 Data Sources: GIS data layer “Streams”, Arizona State Land Department, Arizona Land Resource Information System (ALRIS), October, 10, 2002. http://www.land.state.az.us/alris/index.html
Agua Fria Watershed Rapid Watershed Assessment Section 2 - Physical Description page 2-8
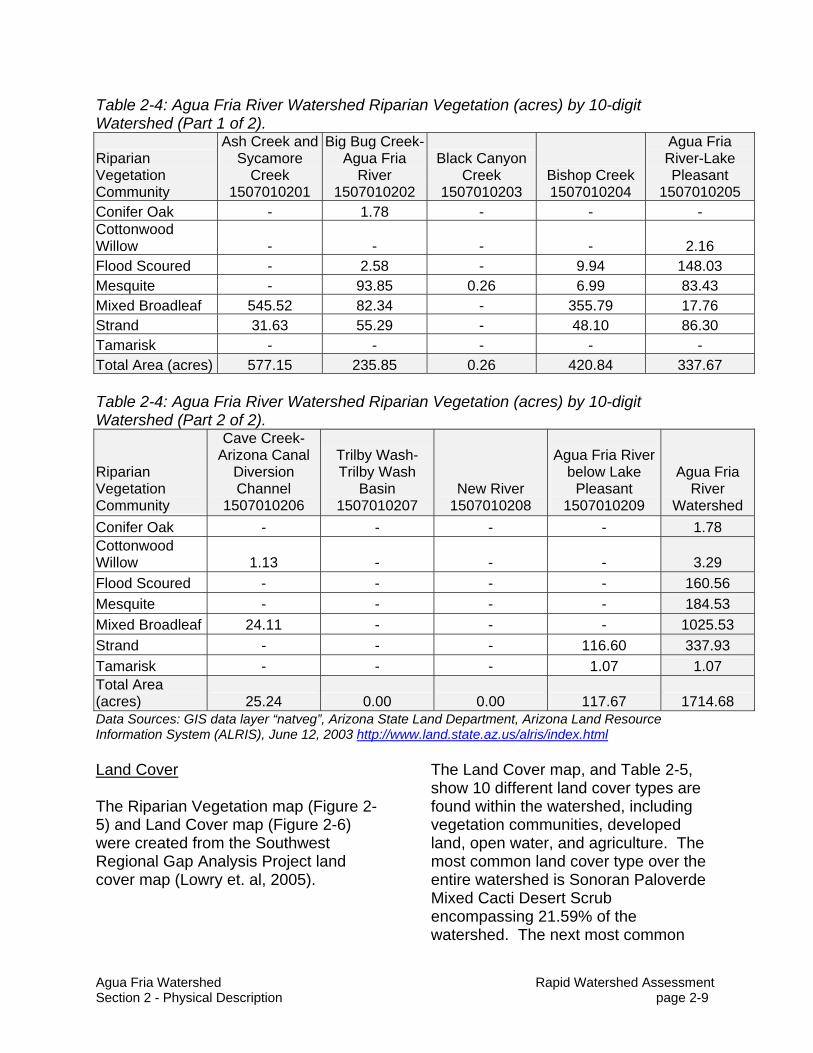
Table 2-4: Agua Fria River Watershed Riparian Vegetation (acres) by 10-digit Watershed (Part 1 of 2).
Riparian Vegetation Community
Ash Creek and Sycamore
Creek 1507010201
Big Bug Creek-Agua Fria
River 1507010202
Black Canyon Creek
1507010203 Bishop Creek 1507010204
Agua Fria River-Lake Pleasant
1507010205 Conifer Oak - 1.78 - - - Cottonwood Willow - - - - 2.16 Flood Scoured - 2.58 - 9.94 148.03 Mesquite - 93.85 0.26 6.99 83.43 Mixed Broadleaf 545.52 82.34 - 355.79 17.76 Strand 31.63 55.29 - 48.10 86.30 Tamarisk - - - - - Total Area (acres) 577.15 235.85 0.26 420.84 337.67 Table 2-4: Agua Fria River Watershed Riparian Vegetation (acres) by 10-digit Watershed (Part 2 of 2).
Riparian Vegetation Community
Cave Creek-Arizona Canal
Diversion Channel
1507010206
Trilby Wash-Trilby Wash
Basin 1507010207
New River 1507010208
Agua Fria River below Lake
Pleasant 1507010209
Agua Fria River
Watershed Conifer Oak - - - - 1.78 Cottonwood Willow 1.13 - - - 3.29 Flood Scoured - - - - 160.56 Mesquite - - - - 184.53 Mixed Broadleaf 24.11 - - - 1025.53 Strand - - - 116.60 337.93 Tamarisk - - - 1.07 1.07 Total Area (acres) 25.24 0.00 0.00 117.67 1714.68 Data Sources: GIS data layer “natveg”, Arizona State Land Department, Arizona Land Resource Information System (ALRIS), June 12, 2003 http://www.land.state.az.us/alris/index.html Land Cover The Riparian Vegetation map (Figure 2-5) and Land Cover map (Figure 2-6) were created from the Southwest Regional Gap Analysis Project land cover map (Lowry et. al, 2005).
The Land Cover map, and Table 2-5, show 10 different land cover types are found within the watershed, including vegetation communities, developed land, open water, and agriculture. The most common land cover type over the entire watershed is Sonoran Paloverde Mixed Cacti Desert Scrub encompassing 21.59% of the watershed. The next most common
Agua Fria Watershed Rapid Watershed Assessment Section 2 - Physical Description page 2-9

types are Developed, Medium-High Intensity (14.18%), Mogollon Chaparral (12.94%), and Sonora-Mojave Creosote bush – White Bursage Desert Scrub (10.65%). Note: There are a total of 26 GAP vegetation categories present within the Agua Fria River Watershed boundary. Some of these categories occur only in small concentrations, and are not visible
at the small scale in which the maps are displayed. It was decided that some of the vegetation categories would be logically grouped in order to increase the legibility of the map. In collaboration with NRCS, Project NEMO staff were able to create a total of 10 grouped GAP vegetation categories.
Table 2-5: Agua Fria River Watershed Southwest Regional GAP Analysis Project Land Cover, Percent of 10-digit Watershed (Part 1 of 2).
Watershed
Land
C
over
Ash Creek and
Sycamore Creek
1507010201
Big Bug Creek-Agua Fria River
1507010202
Black Canyon Creek
1507010203
Bishop Creek
1507010204
Agua Fria River-Lake Pleasant
1507010205
Agriculture* 0.10% 0.30% -- -- -- Apacherian-Chihuahuan
Grassland and Mesquite Scrub
22.95% 23.18% 24.38% 42.23% 11.14%
Developed 0.58% 9.56% 0.61% 1.53% 0.36% Madrean Pine Oak
Woodland 3.30% 5.80% 11.50% 2.15% 1.71%
Madrean Pinyon-Juniper Woodland 42.72% 25.33% 7.81% 19.06% 1.80%
Mogollon Chaparral 26.59% 27.11% 31.46% 23.01% 18.35% Open Water 0.03% 3.81%
Rocky Mountain Ponderosa Pine
Woodland 3.41% 8.50% 6.41% 0.43% 0.57%
Sonora-Mojave Desert Scrub 0.03% 0.04% 17.81% 0.09% 0.25%
Sonoran Desert Scrub 0.32% 0.16% 0.02% 11.51% 62.02%
Area (Sq.mi.) 260.56 324.13 244.06 236.44 371.83
*Not necessarily irrigated land.
Agua Fria Watershed Rapid Watershed Assessment Section 2 - Physical Description page 2-10

Table 2-5: Agua Fria River Watershed Southwest Regional GAP Analysis Project Land Cover, Percent of10-digit Watershed (Part 2 of 2)
Watershed La
nd
Cov
er
Cave Creek-Arizona Canal
Diversion Channel
1507010206
Trilby Wash – Trilby Wash
Basin 1507010207
New River 1507010208
Agua Fria River below Lake
Pleasant 1507010209
Percent Of Total
Agriculture* -- -- 1.08% 21.90% 3.84% Apacherian-Chihuahuan
Grassland and Mesquite Scrub
8.80% 0.12% 5.79% 33.65% 13.68%
Developed 43.51% 2.21% 27.06% -- 15.15% Madrean Pine Oak Woodland 1.25% -- 0.65% -- 2.61%
Madrean Pinyon-Juniper
Woodland 9.16% 0.18% 7.46% -- 11.38%
Mogollon Chaparral 4.14% 0.47% 3.66% -- 13.72%
Open Water 0.03% -- 0.09% -- 0.54% Rocky Mountain Ponderosa Pine
Woodland -- -- -- -- 1.98%
Sonora-Mojave Desert Scrub 5.01% 45.13% 15.84% 17.29% 9.40%
Sonoran Desert Scrub 28.10% 51.90% 38.36% 27.17% 27.72%
Area (Sq.mi.) 288.39 242.17 353.18 464.30 2785.06
*Not necessarily irrigated land. Data Sources: GIS data layer “Arizona Gap Analysis Project Vegetation Map”, University of Arizona, Southern Arizona Data Services Program, 2004 http://sdrsnet.srnr.arizona.edu/index.php Originated by Arizona Game & Fish Department, Habitat Branch, 1993, this dataset was digitized from the August 1980 David E. Brown & Charles H. Lowe 1:1,000,000 scale, 'Biotic Communities of the Southwest'. Meteorological Stations, Precipitation and Temperature For the 30 years (1961-1990) of precipitation data used in this report, the average annual precipitation for the Agua Fria River Watershed is 15.1 inches. The Black Canyon Creek watershed receives the most rainfall with 19.9 inches of rain in an average year, while the Agua Fria River below Lake Pleasant watershed typically
receives only 9.8 inches. The valley floor surrounding the Agua Fria main channel receives less rain than the surrounding mountains. The Agua Fria River below Lake Pleasant watershed had the highest maximum temperature at 87.3 oF, while the Black Canyon Creek watershed had the lowest temperature at 39.0 oF. Figure 2-7 shows the meteorological station locations and the distribution of precipitation over the watershed, and Table 2-6 shows the precipitation,
Agua Fria Watershed Rapid Watershed Assessment Section 2 - Physical Description page 2-11

temperatures and names of the meteorological stations. Some stations have more than one location on the
figure because they have been moved from one site to another by the National Weather Service.
Table 2-6: Agua Fria River Watershed Meteorological Stations, Temperature (oF) and Precipitation (in/yr) with Recent Long-term Records.
Temperature (oF) Precipitation (in/yr) 10-digit Watershed Name
Meteorological Stations and Map
ID Min. Max. Avg. Min. Max. Weighted Average
Ash Creek and Sycamore Creek 1507010201 None - - - 15.0 25.0 18.4 Big Bug Creek-Agua Fria River 1507010202 None - - - 15.0 27.0 18.8 Black Canyon Creek 1507010203
Cordes (N) Crown King (O)
46.9 39.0
75.7 67.9
61.3 53.5 13.0 31.0 19.9
Bishop Creek 1507010204
Black Canyon City (C) 55.9 83.6 69.8 13.0 23.0 17.4
Agua Fria River-Lake Pleasant 1507010205
Castle Hot Springs 4 N (I) 56.0 83.6 69.8 11.0 31.0 16.6
Cave Creek-Arizona Canal Diversion Channel 1507010206
Carefree (E) Cave Creek (J) Deer Valley (P)
56.6 53.4 54.2
82.0 83.1 85.2
69.3 68.3 69.7 9.0 23.0 14.0
Trilby Wash-Trilby Wash Basin 1507010207 Wittmann (AL) 54.4 84.2 69.3 9.0 17.0 12.1 New River 1507010208 Marinette (U) 52.9 86.9 69.9 9.0 25.0 13.2
Agua Fria River below Lake Pleasant 1507010209
Alhambra (A) Litchfield Park (T)
Thornburg Ranches (AF)
53.0 53.6 50.5
86.1 87.3 84.8
69.6 70.5 67.6
7.0 17.0 9.8 Agua Fria River Watershed - - - - 7.0 31.0 15.1 Data Sources: Western Regional Climate Center (WRCC), Temperature data. July 15, 2004. http://www.wrcc.dri.edu/summary/climsmaz.html Land Ownership/Management In the Agua Fria River Watershed, there are 8 different land ownership/management entities (Figure 2-8 and Table 2-7). Private individuals
are the largest land owners, representing 33.91% of the watershed. The Forest Service and the State of Arizona (State Trust Lands) are the next most significant land owners with 26.65% and 22.47% of the watershed.
Agua Fria Watershed Rapid Watershed Assessment Section 2 - Physical Description page 2-12

Table 2-7: Agua Fria River Watershed Land Ownership/Management (Percent of each 10-digit Watershed) (part 1 of 2).
Land Owner
Ash Creek and
Sycamore Creek
1507010201
Big Bug Creek-Agua Fria
River 1507010202
Black Canyon Creek
1507010203 Bishop Creek 1507010204
Agua Fria River-Lake Pleasant
1507010205 BLM 1.86% 11.34% 25.43% 8.65% 37.68% Military - 27.28% - - - Private - 37.47% 3.96% 3.67% 16.15% State Parks and Recreation Areas - - - - 3.20% State Trust 4.83% 23.90% 6% 32.54% 29.65% State Wildlife & Management Areas - - - - - USFS 87.50% - 49.91% 52.29% 8.64% USFS & BLM Wilderness Areas 2.72% - 14.68% 2.85% 4.69% Area (square miles) 261 325 244 236 372 Table 2-7: Agua Fria River Watershed Land Ownership/Management (Percent of each 10-digit Watershed) (part 2 of 2).
Land Owner
Cave Creek-Arizona Canal
Diversion Channel
1507010206
Trilby Wash-Trilby Wash
Basin 1507010207
New River 1507010208
Agua Fria River below
Lake Pleasant 1507010209
Agua Fria River
Watershed BLM 1.45% 8.32% 3.08% 9.17% 12.28% Military - 0.15% - 0.72% 0.13% Private 58.46% 36.38% 39.05% 72.74% 33.91%
State Parks and Recreation Areas 2.39% 10.95% 0.50% 2.06% 2.03% State Trust 13.15% 44.21% 33.65% 15.10% 22.47% State Wildlife & Management Areas 0.01% - 0.67% - 0.09% US Forest Service 25.54% - 23.08% - 26.65% USFS & BLM Wilderness Areas - - - 0.21% 2.44% Area (square miles) 288 24 353 464 2,78 Data Sources: GIS data layer “ownership”, Arizona State Land Department, Arizona Land Resource Information System (ALRIS), February 7, 2002 http://www.land.state.az.us/alris/index.html
Agua Fria Watershed Rapid Watershed Assessment Section 2 - Physical Description page 2-13

Land Use The land cover condition during the early 1990’s was determined using the National Land Cover Dataset (NLCD). The NLCD classification contains 21 different land cover categories; however, these categories have been consolidated into five land cover types (Figure 2-9 and Table 2-8). The five groupings for the land cover categories are:
• Crop, which includes confined feeding operations; cropland and pasture; orchards, groves, vineyards, nurseries and ornamental horticulture; other agricultural land.
• Forest, includes areas
characterized by tree cover (natural or semi-natural woody vegetation, generally greater than 6 meters tall); tree canopy accounts for 25-100 percent of the cover
• Water, identifies all areas of
surface water, generally with less than 25% cover of vegetation/land cover
• Range, which includes
herbaceous rangeland; mixed range; shrub and brush rangeland.
• Urban, which includes residential
areas; commercial and services; industrial and commercial complexes; mixed urban or built-up land; other urban or built-up land; strip mines quarries and
gravel pits; transportation, communication and utilities.
The most common land cover type is Range which makes up 76.04% of the watershed. Urban land is the next most common type with 19.41% of the total area. USGS, NLCD Land Cover Class Definitions, http://landcover.usgs.gov/classes.php Mines - Primary Ores There are1,061 mineral extraction mines recorded with the Office of the Arizona State Mine Inspector in the Agua Fria River Watershed. Table 2-9 and Figure 2-10 show the types of ores being mined in the Agua Fria watershed. There are 386 mines whose ore type is unknown. The most common known ore types are gold, copper, silver, and sand and gravel.
Agua Fria Watershed Rapid Watershed Assessment Section 2 - Physical Description page 2-14

2-8: Agua Fria River Watershed Land Use, Percent of 10-digit Watershed Land Cover/Location Crop Forest Urban Range Water Area (sq.mi.)Ash Creek and Sycamore Creek 0.10% 6.66% 0.57% 92.68% -- 260.56 Big Bug Creek-Agua Fria River 0.30% 14.17% 9.51% 76.00% 0.03% 324.13 Black Canyon Creek -- 17.65% 0.61% 81.74% -- 244.06 Bishop Creek -- 2.54% 1.51% 95.95% -- 236.44 Agua Fria River-Lake Pleasant -- 2.28% 0.35% 93.57% 3.80% 371.83 Cave Creek-Arizona Canal Diversion Channel -- 1.24% 43.15% 55.60% 0.03% 288.39 Trilby Wash-Trilby Wash Basin -- -- 2.20% 97.80% -- 242.17 New River 1.07% 0.65% 26.91% 71.28% 0.09% 353.18 Agua Fria River below Lake Pleasant 21.83% -- 33.54% 44.55% 0.08% 464.30 Percent of Agua Fria Watershed 3.82% 4.55% 15.06% 76.04% 0.54% 2785.06 Data Sources: GIS data layer “mines”, Arizona State Land Department, Arizona Land Resource Information System (ALRIS), February 7, 2002 http://www.land.state.az.us/alris/index.html
Table 2-9: Agua Fria River Watershed Mines – Primary Ores.
Ore Type Total Number of Mines Ore Type Total Number of Mines Unknown 386 Sodium 3 Gold 260 Calcium 2 Copper 125 Clay 2 Silver 81 Pumice 2 Sand & Gravel 55 Zinc 2 Lead 27 Aluminum 1 Iron 19 Antimony 1 Tungsten 19 Arsenic 1 Stone 16 Barium 1 Manganese 14 Chlorine 1 Mica 12 Columbium 1 Uranium 8 Diatomite 1 Mercury 6 Geothermal 1 Beryllium 5 Magnesium 1 Feldspar 3 Perlite 1 Gemstone 3 Vermiculite 1 Note: If a mine contains more than one ore, only the major ore is noted. Data Source: Natural Resource Conservation Service (NRCS).
Agua Fria Watershed Rapid Watershed Assessment Section 2 - Physical Description page 2-15

Section 3: Resource Concerns Introduction Conservation Districts and other local leaders, along with NRCS and other resource management agencies, have identified priority natural resource concerns for this watershed. These concerns can be grouped under the broad resource categories of Soil, Water, Air, Plants, or Animals (SWAPA). Refer to Table 3-1 for a listing of priority resource concerns by land use within the Agua Fria River Watershed.
Soil Erosion
Soil erosion is defined as the movement of soil from water (sheet and rill or gully) or wind forces requiring treatment when soil loss tolerance levels are exceeded. Sheet and rill erosion is a concern particularly on rangeland and forest land in areas of shallow soils and poor vegetative cover. Soil loss results in reduced water holding capacity and plant productivity. Gully erosion can be a significant problem in areas of steep slopes and deep soils. Loss of vegetative cover and down-cutting of streams contribute to gully formation. Wind erosion is locally significant where adequate vegetative cover is not maintained.
Conservation practices applied to address this resource concern are generally those that help improve vegetative cover, stabilize sites, and control water flows. Practices may include critical area planting, deferred grazing, grade stabilization structures, herbaceous wind barriers, prescribed
grazing, range planting, stream channel stabilization, tree and shrub establishment, water and sediment control basins, water spreading, windbreak establishment, and wildlife upland habitat management.
Soil Condition
Soil condition is a resource concern on cropland whenever soil tilth is poor or soil compaction is excessive. Poor soil tilth results whenever unsuitable combinations of minerals, air, water, and organic matter occur, resulting in low microbial activity and chemical reactions. Soil compaction results from excessive compressing of soil particles and aggregates by machines or livestock, thus affecting plant-soil-moisture-air relationships. Soil condition can become a problem whenever a field is excessively tilled or tilled when the soil is wet, lack of crop rotation, and lack of addition of organic matter. Poor soil condition reduces root growth and plant productivity.
Conservation practices applied to address this resource concern are generally those that improve plant cover, improve soil organic matter, improve soil microbial activity, reduce tillage operations, or mechanically break up compacted soils. Practices may include deep tillage, conservation cover, conservation crop rotation, cover & green manure crop, irrigation water management, mulching, nutrient management, pest management, residue management, tree and shrub establishment, and waste utilization. Reduced tillage passes and addition of
Agua Fria Watershed Rapid Watershed Assessment Section 3 – Resource Concerns page 3 - 1
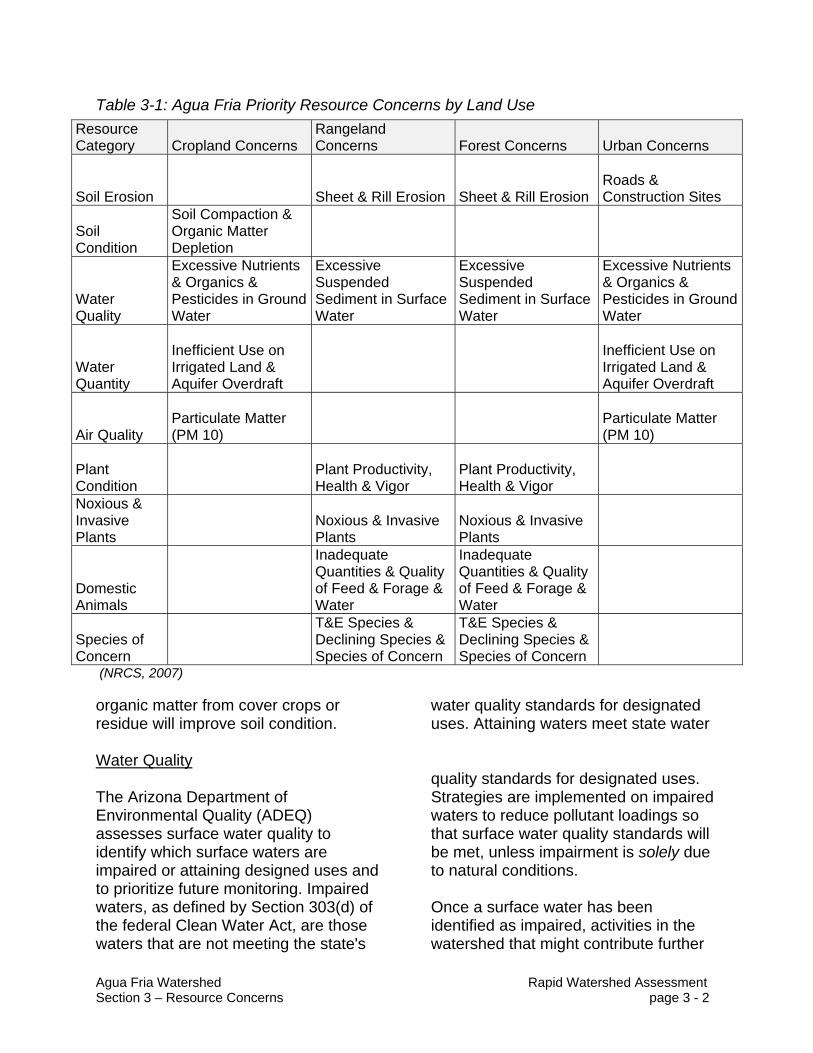
Table 3-1: Agua Fria Priority Resource Concerns by Land Use
(NRCS, 2007)
Resource Category Cropland Concerns
Rangeland Concerns Forest Concerns Urban Concerns
Soil Erosion Sheet & Rill Erosion Sheet & Rill Erosion
Roads & Construction Sites
Soil Condition
Soil Compaction & Organic Matter Depletion
Water Quality
Excessive Nutrients & Organics & Pesticides in Ground Water
Excessive Suspended Sediment in Surface Water
Excessive Suspended Sediment in Surface Water
Excessive Nutrients & Organics & Pesticides in Ground Water
Water Quantity
Inefficient Use on Irrigated Land & Aquifer Overdraft
Inefficient Use on Irrigated Land & Aquifer Overdraft
Air Quality
Particulate Matter (PM 10)
Particulate Matter (PM 10)
Plant Condition
Plant Productivity, Health & Vigor
Plant Productivity, Health & Vigor
Noxious & Invasive Plants
Noxious & Invasive Plants
Noxious & Invasive Plants
Domestic Animals
Inadequate Quantities & Quality of Feed & Forage & Water
Inadequate Quantities & Quality of Feed & Forage & Water
Species of Concern
T&E Species & Declining Species & Species of Concern
T&E Species & Declining Species & Species of Concern
organic matter from cover crops or residue will improve soil condition. Water Quality The Arizona Department of Environmental Quality (ADEQ) assesses surface water quality to identify which surface waters are impaired or attaining designed uses and to prioritize future monitoring. Impaired waters, as defined by Section 303(d) of the federal Clean Water Act, are those waters that are not meeting the state's
water quality standards for designated uses. Attaining waters meet state water quality standards for designated uses. Strategies are implemented on impaired waters to reduce pollutant loadings so that surface water quality standards will be met, unless impairment is solely due to natural conditions. Once a surface water has been identified as impaired, activities in the watershed that might contribute further
Agua Fria Watershed Rapid Watershed Assessment Section 3 – Resource Concerns page 3 - 2

loadings of the pollutant are not allowed. Agencies and individuals planning future projects in the watershed must be sure that activities will not further degrade these impaired waters and are encouraged through grants to implement strategies to reduce loading. One of the first steps is the development of a Total Maximum Daily Load (TMDL) analysis to empirically determine the load reduction needed to meet standards. The Draft 2006 Status of Ambient Surface Water Quality in Arizona (ADEQ 2007) indicates that generally surface water quality is excellent where monitored and assessed (Figure 3-1). However, the following surface waters in the Agua Fria Basin are impaired:
• Cortez Park Lake is a 2 acre lake in the Phoenix metropolitan area, and located in the Agua Fria Below Lake Pleasant Sub-Basin. It is impaired based on high pH and low dissolved oxygen, which may indicate excessive nutrient loading. Added to impaired waters list in 2004, a TMDL is scheduled to be initiated in 2007.
• Turkey Creek, from an unnamed
tributary to Poland Creek, is in the Black Canyon Sub-Basin. This 21 miles long reach is impaired by copper and lead. A TMDL has been completed and is in the final stages of review for approval by EPA (January 2007).
The draft assessment indicates that the following lakes and streams were either attaining all or some of their designated uses (other designated uses were assessed as “inconclusive.”)
• Lynx Lake is a 50 acre lake near
Prescott and located in the Big Bug-Agua Fria Sub-Basin. Attaining some uses, lead exceeded a standard in one of three sampling events and manganese exceeded standards in four of five sampling events. (Note that EPA may add this to the impaired waters list due to manganese.)
• Lake Pleasant was recently
expanded to 8900 acres and is located in the Agua Fria-Lake Pleasant Sub-Basin. Attaining all uses although low dissolved oxygen occurred during two of 15 sampling events and high pH in one of 15 sampling events may indicate occasional excessive nutrient loading.
• Fain Lake is a 1015 acre
reservoir in Lynx Creek near Prescott, and located in the Big Bug Creek-Agua Fria Sub-Basin. Assessed as attaining some uses, low dissolved oxygen occurred during one of three sampling events.
• Turkey Creek, from headwaters
to an unnamed tributary, is a 9.1 mile reach located in the Black Canyon Sub-Basin. It was assessed as attaining some uses. Insufficient monitoring data to assess some designated uses. No exceedances.
• Agua Fria River, from State
Route 169 to Yarber Wash, is a 17.8 mile reach in the Big Bug Creek-Agua Fria Sub-Basin.
Agua Fria Watershed Rapid Watershed Assessment Section 3 – Resource Concerns page 3 - 3

Attaining all uses and no exceedances.
• Agua Fria River, from Sycamore
Creek to Big Bug Creek, is a 9.1 mile reach primarily located in the Big Bug Creek-Agua Fria Sub-Basin. Attaining all uses and no exceedances.
• Agua Fria River, from Little
Squaw Creek to Cottonwood Creek, is a 5.8 mile reach in the Agua Fria-Lake Pleasant Sub-Basin. Attaining all uses and no exceedances.
• Cave Creek, from headwaters to
Cave Creek Dam, is a 32.9 mile reach in the Cave Creek-Arizona Canal Diversion Channel Sub-Basin. Attaining all uses and no exceedances.
• Sycamore Creek, from Tank
Canyon to Agua Fria River, is a 17.6 mile reach in the Ash Creek-Sycamore Creek Sub-Basin. Attaining all uses and no exceedances.
Water Quantity
The Agua Fria and its tributaries are generally intermittent streams except for some perennial stretches where impermeable bedrock forces groundwater into the streambed. The basin is bounded on the north by Hickey Mountain, on the west by the Bradshaw and Buckhorn Mountains, on the south by Lake Pleasant, and on the east by the Black Hills and New River Mountains.
Development of groundwater resources is increasing in the Agua Fria basin. Population growth in recent years has resulted in increased pumpage. Despite increased groundwater pumpage, water levels generally have not declined in the basin. The only area of declining water levels is around Cordes Junction where declines of several feet have been reported (Wilson, 1988). This suggests that overall the basin is still in a steady-state situation. Total groundwater reserves in the Agua Fria basin are estimated to be 3.5 million acre-feet.
(http://www.azwater.gov/dwr/Content/Find_by_Program/Rural_Programs/content/map/UppAguFri.htm) Air Quality Northern Maricopa County, which constitutes the lower section of the Agua Fria Watershed, is designated by EPA as a Non-Attainment Area because it does not meet EPA PM-10 Standards (Figure 3-2). The non-attainment area is identified as the “PM-10 Boundary” on Figure 3-2. The county is required to draw up and follow a plan to reduce the amount of PM-10 generated in order to put the area in compliance with the EPA standard. Local sources of PM-10 include agricultural operations, housing construction, vacant lots and unpaved roads. The implementation plan and a history of the process are found at ADEQ, http://www.azdeq.gov/environ/air/plan/notmeet.html#phoenix. The EPA defines particulate matter as the term for solid or liquid particles found in the air. Some particles are large enough to be seen as soot or smoke. Other particles are so small
Agua Fria Watershed Rapid Watershed Assessment Section 3 – Resource Concerns page 3 - 4

they can only be detected with an electron microscope. PM-10 particles are very small and can have adverse health effects because of their ability to reach the lower regions of the respiratory tract. Exposure to PM-10 can result in: effects on breathing and respiratory systems, damage to lung tissue, cancer, and premature death. Children, older people, and people with chronic lung disease, are particularly sensitive to particulate matter (EPA website http://epa.gov/air/airtrends/aqtrnd95/pm10.html ).
Plant Condition
Plant condition is a resource concern whenever plants do not manufacture sufficient food to continue the growth cycle or to reproduce. Plant condition is frequently a concern on rangeland where proper grazing management is not being applied.
Conservation practices applied to address this resource concern are generally those that maintain or improve the health, photosynthetic capability, rooting and reproductive capability of vegetation. Practices may include brush management, critical area planting, deferred grazing, fencing, forest stand improvement, herbaceous wind barriers, nutrient management, pest management, prescribed grazing, prescribed burning, range planting, recreation area improvement, riparian forest buffers, tree and shrub establishment, wetland development or restoration, wildlife upland habitat management, wildlife watering facility, wildlife wetland habitat management, and windbreak establishment.
Noxious and Invasive Plants
Noxious and invasive plants are a resource concern whenever these species cause unsuitable grazing conditions for livestock or wildlife and due to their potential to out-compete native species which are generally preferred for wildlife habitat value. Increases in noxious and invasive plants result from control of wildfires, poor grazing management, and other causes.
Conservation practices applied to address this resource concern are generally those that control the establishment or reduce the population of noxious and invasive plant species. Practices may include brush management, deferred grazing, fencing, forest stand improvement, pest management, prescribed burning, prescribed grazing, and wildlife upland habitat management.
Bark Beetle, Drought and Wildfire Over the past several years, Arizona has experienced increased piñon and ponderosa pine mortality due to outbreaks of several species of Ips beetles and the western pine beetle. Low tree vigor caused by several years of drought and excessively dense stands of trees have combined to allow beetle populations to reach outbreak levels. These insects are native to ponderosa pine forests and piñon-juniper woodlands of the Southwest, and normally only attack a small number of diseased or weakened trees. Healthy trees are usually not susceptible to these beetles. The vegetation communities in the Agua Fria Watershed are mostly desert
Agua Fria Watershed Rapid Watershed Assessment Section 3 – Resource Concerns page 3 - 5

shrubland and grassland, with only about 29% being forested lands subject to bark beetle infestation. Based on an analysis of the Forest Service GIS data, approximately 100 acres of forested federal lands in the Agua Fria have been affected by bark beetles, or only about 0.02 percent. This analysis only addresses Federal forested lands. The four forest types where bark beetles occur in the Agua Fria Watershed are Madrean Pine-Oak Forest and Woodland, Rocky Mountain Ponderosa Pine Woodland, Mogollon chaparral, and Madrean Pinyon-Juniper Woodland. The Climate Assessment for the Southwest (CLIMAS) website (www.ispe.arizona.edu/climas) provides information on Arizona's drought status. Recent precipitation events have placed the area of Arizona that encompasses the Agua Fria Watershed in moderate drought status. However, the watershed remains abnormally dry. The long term drought status remains moderate, persisting throughout the watershed, but possibly intensifying in the northern portion of the watershed, with some improvement possible in the southern portion. The Southwest Coordination Center (gacc.nifc.gov/swcc/predictive/outlooks/outlooks.htm) places the northern portion of the Agua Fria Watershed in the Normal category for significant wildland fire activity potential due to favorably moist conditions. However, the southern portion remains in the Above Normal category due to persisting drought conditions.
Domestic Animal Concerns
Domestic animal concerns occur whenever the quantity and quality of food are not adequate to meet the nutritional requirements of animals, or adequate quantity and quality of water is not provided. This is frequently a concern on rangeland when changes in species composition resulting from poor grazing management reduce the availability of suitable forage.
Conservation practices applied to address this resource concern are generally those that maintain or improve the quantity, quality, and diversity of forage available for animals, reduce the concentration of animals at existing water sources, and insure adequate quantity and reliability of water for the management of domestic animals. Practices may include brush management, deferred grazing, fencing, pest management, prescribed burning, prescribed grazing, pipelines, ponds, range planting, water spreading, wells, spring development, watering facility, and wildlife upland habitat management.
Species of Concern There are 55 threatened and endangered species listed for Arizona. (U. S. Fish and Wildlife Service website, http://ecos.fws.gov) In 1990 Arizona voters created the Heritage Fund, designating up to $10 million per year from lottery ticket sales for the conservation and protection of the state’s wildlife and natural areas. The Heritage Fund allowed for the creation of the Heritage Data Management System (HDMS) which identifies elements of concern in Arizona and consolidates information about their status and distribution throughout the state. (Arizona Game & Fish website,
Agua Fria Watershed Rapid Watershed Assessment Section 3 – Resource Concerns page 3 - 6

2006, http://www.azgfd.gov/w_c/heritage_program.shtml ) The Agua Fria Watershed contains 8 of the 55 threatened or endangered species listed for Arizona (Table 3-2). One of the species found in the Agua Fria watershed is the Mexican Spotted Owl (U.S. Fish & Wildlife Service, 2004). The Upper Agua Fria River contains the entire Mexican spotted owl habitat that occurs in the Agua Fria watershed. The Mexican spotted owl was listed as threatened on April 14, 1993, and a recovery plan was approved in December 1995. The distributional pattern of the Mexican spotted owl is more distinct than that of the other subspecies (Noon and McKelvey 1992). The Mexican spotted owl appears to use a wider range of habitat types than the other subspecies. These unique aspects of the ecology of this owl require unique approaches for management. Habitat management plans may need to consider not only areas occupied by owls but also intervening areas, even where such areas are very different in habitat structure from areas typically occupied by spotted owls. (U.S. Fish & Wildlife Service, 2004) The watershed also contains portions of desert tortoise habitat. The desert tortoise is listed as a wildlife of special concern by Arizona Game and Fish. The desert tortoise generally occupies Sonoran Desert habitat, along rocky slopes and bajadas, ranging from 508 feet to 5,250 feet in elevation. Although the desert tortoise is not listed as threatened or endangered, Arizona law prohibits removing these creatures from the wild or taking them across state
lines. Desert tortoise are threatened by habitat fragmentation, illegal capture, invasion of exotic species, road kill, and predation. (Arizona Game & Fish website, 2006, http://www.gf.state.az.us/w_c/desert_tortoise.shtml ).
Agua Fria Watershed Rapid Watershed Assessment Section 3 – Resource Concerns page 3 - 7

Table 3-2: Agua Fria River Watershed Species of Concern Classifications and Observation (1)
Common Name Species Name USESA
(2) USFS
(3) BLM (4)
STATE (5)
Range of Observation
American Peregrine Falcon Falco peregrinus anatum SC S WSC 2005
Arizona Agave Agave arizonica No status HS 1987-1992
Arizona Giant Sedge Carex ultra S S 2001 Arizona Phylox Phlox amabilis S 1970-1973
Arizona Myotis (bat) Myotis occultus SC S 1986-1994PRE
Arizona Toad Bufo microscaphus SC S 1978-1996
Bald Eagle Haliaeetus leucocephalus LT,PDL S WSC 2004
Bald Eagle
Haliaeetus leucocephalus (wintering pop.) LT,PDL S WSC 2005
Bat Colony 1993-2003 Belted Kingfisher Ceryle alcyon WSC 1994 Bigelow Onion Allium bigelovii SR 1977-1980 California Fan Palm Washingtonia filifera SR 1981 California Leaf-nosed Bat Macrotus californicus SC WSC 1993-2000
Cave Myotis (bat) Myotis velifer SC S 1986-1999PRE
Common Black-Hawk Buteogallus anthracinus S WSC 1993-2005 Desert Pupfish Cyprinodon macularius LE WSC 1993-2004 Desert Sucker Catostomus clarki SC S 1980-2003 Designated Critical Habitat for Gila chub CH for Gila intermedia Designated Critical Habitat for Mexican spotted owl
CH for Strix occidentalis lucida
Eastwood Alum Root Heuchera eastwoodiae S 1976-2001SU
Flannel Bush Fremontodendron californicum S SR 1985-2002
Fringed Myotis (bat) Myotis thysanodes SC S 1994 Gila Chub Gila intermedia LE S WSC 1980-2003
Gila Longfin Dace Agosia chrysogaster chrysogaster SC S 1980-2003
Gila Topminnow Poeciliopsis occidentalis occidentalis LE WSC 1975-2004
Greater Western Bonneted Bat
Eumops perotis californicus SC 1986PRE
Maricopa Tiger Beetle Cicindela oregona maricopa SC S S 1978-1995
Mazatzal Triteleia Triteleia lemmoniae SR 1965
Agua Fria Watershed Rapid Watershed Assessment Section 3 – Resource Concerns page 3 - 8

Common Name Species Name USESA
(2) USFS
(3) BLM (4)
STATE (5)
Range of Observation
Mexican Spotted Owl Strix occidentalis lucida LT S WSC 1997-2004 Mt. Dellenbaugh Sandwort Arenaria aberrans S 2003 Northern Goshawk Accipiter gentilis SC S WSC 1993 Northern Mexican Gartersnake SC S WSC 1980-1992 Pale Townsend's Big-eared Bat
Corynorhinus townsendii pallescens SC 1994
Pocketed Free-tailed Bat
Nyctinomops femorosaccus S 1993
Roundtail Chub Gila robusta SC S WSC 1965 Sonoran Desert Tortoise
Gopherus agassizii (Sonoran Population) SC WSC 1977-2004
Southwestern Willow Flycatcher Empidonax traillii extimus LE S WSC 2004 Speckled Dace Rhinichthys osculus SC S 1980-2003
Toumey Agave Agave toumeyana var. bella SR 1976-1980
Verde Rim Springsnail Pyrgulopsis glandulosa SC S S 2001 Western Burrowing Owl
Athene cunicularia hypugaea SC S 2001-2005
Western Red Bat Lasiurus blossevillii WSC 2002 Western Yellow Bat Lasiurus xanthinus WSC 2002 Western Yellow-billed Cuckoo
Coccyzus americanus occidentalis C S WSC 1993-2003PR
Yuma Clapper Rail Rallus longirostris yumanensis LE WSC 2003
Opuntia engelmannii var. flavispina SR 1977
Opuntia engelmannii var. flavispina SR NO DATE
Data Sources: Arizona Land Information System (ALRIS), Natural Resource Conservation Service (NRCS). Status Definitions as Listed by Arizona Game and Fish Department, Nov. 26, 2006 http://www.gf.state.az.us/w_c/edits/hdms_status_definitions.shtml (1) Proposed for Listing: (USESA) Federal U.S. Status ESA Endangered Species Act (1973 as amended) US Department of Interior, Fish and Wildlife Service (2) Listed: LE Listed Endangered: imminent jeopardy of extinction. LT Listed Threatened: imminent jeopardy of becoming Endangered. PDL Proposed for Delisting Candidate (Notice of Review: 1999): C Candidate. Species for which USFWS has sufficient information on biological vulnerability and
threats to support proposals to list as Endangered or Threatened under ESA. However, proposed rules have not yet been issued because such actions are precluded at present by other listing activity.
Agua Fria Watershed Rapid Watershed Assessment Section 3 – Resource Concerns page 3 - 9

SC Species of Concern. The terms "Species of Concern" or "Species at Risk" should be considered as terms-of-art that describe the entire realm of taxa whose conservation status may be of concern to the US Fish and Wildlife Service, but neither term has official status (currently all former C2 species).
(3) USFS US Forest Service (1999 Animals, 1999 Plants) US Department of Agriculture, Forest Service, Region 3 S Sensitive: those taxa occurring on National Forests in Arizona which are considered sensitive by
the Regional Forester. (4) BLM US Bureau of Land Management (2000 Animals, 2000 Plants) US Department of Interior, BLM, Arizona State Office S Sensitive: those taxa occurring on BLM Field Office Lands in Arizona which are considered
sensitive by the Arizona State Office. (5) State Status NPL Arizona Native Plant Law (1993) Arizona Department of Agriculture HS Highly Safeguarded: no collection allowed. SR Salvage Restricted: collection only with permit. WSC Wildlife of Special Concern in Arizona. Species whose occurrence in Arizona is or may be in
jeopardy, or with known or perceived threats or population declines, as described by the Arizona Game and Fish Department's listing of Wildlife of Special Concern in Arizona (WSCA, in prep).
Resource Concern Summary Local leaders have identified watershed health as a priority concern for the Agua Fria River Watershed. This includes both the upland areas of the watershed and the riparian or stream course areas. The condition of the upland areas is integral to the hydrologic function, such that when precipitation falls on the land its disposition is affected by the soil and vegetation, which in turn are affected by land uses, both historical and current. The amount of the precipitation which immediately runs off the land surface, and that which infiltrates into the soil to either be used for plant growth or to recharge groundwater, is dependent on this critical interface. The desert and semi-desert ecosystems have developed in a climatic regime of wide fluctuations of precipitation, ranging from drought to flood. Human uses superimposed on that climatic
regime can tend to exacerbate or ameliorate their effects on soils and vegetation. For example, early settlers brought in herds of livestock and eventually exceeded the capacity of the range, especially during drought periods. Changes in vegetation resulted, which in turn affect watershed condition. Large areas have seen increases in pinyon-juniper and reduced grasses and fibrous rooted plants. A number of introduced plants have also increased at the expense of native species. This has been the case on both some of the uplands and in riparian areas. Examples include annual plants such as cheatgrass (Bromus tectorum) and foxtail (Bromus rubens) on uplands and salt cedar (Tamarix pentandra) in riparian areas. With rapidly increasing development of private lands and accelerated recreational use of public lands, impacts to vegetation and the soil surface may
Agua Fria Watershed Rapid Watershed Assessment Section 3 – Resource Concerns page 3 - 10

affect hydrologic function. An increasing concern is the dumping and littering of waste materials, including some which are toxic, on public and private lands. This is particularly the case along major transportation arteries such as I-17 and Highway 69 and on public and state trust lands surrounding communities. Large areas of the watershed are in chaparral vegetation with lesser portions in ponderosa pine. These were subject to frequent fires prior to European settlement. Many decades of fire suppression have resulted in the buildup of fuel loads which, when ignited, burn with flame height and heat release sufficient to kill ponderosa pine overstory and create a situation vulnerable to heavy storm runoff and erosion during the first monsoon seasons following the fire. Riparian areas are quite limited in area but highly important to both humans and wildlife. Maintenance of base flow of stream segments and springs is necessary for the health of these critical
areas. (adapted from Barnett, Hawkins & Guertin, 2004). Conservation Progress/Status Conservation progress for the previous five years in the Agua Fria River Watershed has focused on addressing the following primary resource concerns:
• Soil Condition – Organic Matter Depletion
• Water Quantity – inefficient Water Use on Irrigated Land
• Water Quality – Excessive Nutrients and organics in Ground Water
• Air Quality – Particulate Matter Less than 10 Micrometers (PM10)
The following table presents conservation accomplishments in this watershed during fiscal years (FY) 2002 through 2006, according to the NRCS Progress Reporting (Table 3-3).
Table 3-3: Agua Fria River Watershed Conservation Treatment Applied
Agua Fria River Watershed (15070102) FY02-06 Conservation Treatment Applied TOTAL
Air Management (acres) 99 Comprehensive Nutrient Management Plan (number) 3 Conservation Crop Rotation (acres) 149 Irrigation Land Leveling (acres) 368 Irrigation System, Sprinkler (acres) 412 Irrigation Water Conveyance, Ditch and Canal Lining, (feet) 1,239 Irrigation Water Conveyance, Pipeline, Underground, Plastic (feet) 12,595 Irrigation Water Management (acres) 1,868 Nutrient Management (acres) 752 Pest Management (acres) 565 Prescribed Grazing (acres) 1,000 Residue Management, Seasonal (acres) 696 Upland Wildlife Habitat Management (acres) 100
Agua Fria Watershed Rapid Watershed Assessment Section 3 – Resource Concerns page 3 - 11

Section 4: Census, Social and Agricultural Data This section discusses the human component of the watershed and the pressure on natural resources caused by humans and by population change. Population Density, 1990 Census block statistics for 1990 were compiled from information prepared by Geo-Lytics (Geo-Lytics, 1998). These data were linked with census block data and used to create a density map (Figure 4-1) through a normalization process using a grid of 7 km squares. This process involves calculating density per census block and intersecting it with the grid, which is then used to calculate the number of people and thus density per grid square. Table 4-1 shows the tabulated minimum, maximum and mean number of people per square mile in 1990 for each watershed. In 1990, the mean population density for the entire watershed was 305 people per square mile. The Agua Fria River below Lake Pleasant watershed had the highest population density with an average of 901 people per square mile, and a maximum of 7179. The Ash Creek and Sycamore Creek watershed had the lowest density with an average of only 1.71 people per square mile. Population Density, 2000 The Census Block 2000 statistics data were downloaded from the Environmental Systems Research Institute (ESRI) website (ESRI Data Products, 2003) and are shown in Table 4-2. A population density map (Figure
4-2) was created from these data. The mean population density in 2000 was 437 people per square mile. The Cave Creek – Arizona Canal Diversion Channel and the Agua Fria River below Lake Pleasant watersheds had nearly the same population density with approximately 1,123 and 1,236 people per square mile, respectively. The Agua Fria River below Lake Pleasant watershed had the highest maximum density of 9,208 people per square mile. Population Density Change, 1990-2000 The 1990 and 2000 population density maps were used to create a population density change map. The resulting map (Figure 4-3) shows population increase or decrease over the ten year time frame. Overall, mean population density increased by 132 people per square mile during this ten year time period. Three watersheds had similar, large increases in average population: Agua Fria River below Lake Pleasant, New River, and Cave Creek – Arizona Canal Diversion Channel. Table 4-3 shows the change in population density from 1990 to 2000 in people per square mile. The Ash Creek and Sycamore Creek watershed experienced a mean decrease of 0.22 people per square mile. Housing Density, 2000 and 2030 The Watershed Housing Density Map for the years 2000 and 2030 were created with data developed by David M. Theobald (Theobald, 2005). Theobald developed a nationwide housing density model that incorporates a thorough way to account for land-use change beyond the “urban fringe.”
Agua Fria Watershed Rapid Watershed Assessment Section 4 – Census, Social and Agricultural Data page 4 - 1

Exurban regions are the “urban fringe”, or areas outside suburban areas, having population densities greater than 0.68 – 16.18 ha (1.68 – 40 acres) per unit. Theobald stresses that exurban areas are increasing at a much faster rate than urban sprawl, are consuming much more land, and are having a greater impact on ecological health, habitat fragmentation and other resource concerns. Theobald estimates that the exurban density class has increased at a much faster rate than the urban/suburban density classes. Theobald’s model forecasts that this trend will continue and may even accelerate by 2030. This indicates that development patterns are shifting more towards exurban, lower density, housing units, and are thereby
consuming more land. He suggests that exurban development has more overall effect on natural resources because of the larger footprint and disturbance zone, a higher percent of impervious surfaces. Figure 4-4 and Table 4-4, Agua Fria River Watershed Housing Density for 2000, identifies mostly “rural” housing densities (>40 acres per unit) for the Cave Creek/Carefree area. Figure 4-5 and Table 4-5, Agua Fria River Watershed Housing Density for 2030, projects much higher housing “urban” densities (<0.6 acres per unit) for the same area. Similarly, “undeveloped” and “rural” farming areas west of Phoenix in 2000 become “exurban” and “suburban” in 2030.
Table 4-1: Agua Fria River Watershed 1990 Population Density (people/square mile)
Population Density (people/sq.mi.) 10-digit Watershed Name
Area (sq. miles) Min Max Mean
Ash Creek and Sycamore Creek - 1507010201 260.55 0 46.00 1.71 Big Bug Creek-Agua Fria River - 1507010202 324.14 0 1,090.86 45.14 Black Canyon Creek - 1507010203 244.07 0 167.43 6.29 Bishop Creek - 1507010204 236.45 0 167.43 6.57 Agua Fria River-Lake Pleasant - 1507010205 371.81 0 129.43 2.00 Cave Creek-Arizona Canal Diversion Channel - 1507010206 288.47 0 6,190.29 839.43 Trilby Wash-Trilby Wash Basin - 1507010207 242.18 0 137.14 12.57
New River - 1507010208 353.18 0 6,190.29 488.86 Agua Fria River below Lake Pleasant - 1507010209 464.31 0 7,178.86 901.14
Total Agua Fria Watershed 2,785 0 7,179 305 Note: Adjacent watersheds may share a grid square. Data Sources: Census block statistics for 1990 were compiled from a CD prepared by Geo-Lytics (GeoLytics, Inc.1998. Census 1990. Census CD + Maps. Release 3.0.)
Agua Fria Watershed Rapid Watershed Assessment Section 4 – Census, Social and Agricultural Data page 4 - 2

Table 4-2: Agua Fria River Watershed 2000 Population Density (people/square mile) Population Density (people/sq.mi.)
Watershed Name Area (sq. mi.) Min Max Mean Ash Creek and Sycamore Creek - 1507010201 260.55 0 16.11 1.54 Big Bug Creek-Agua Fria River - 1507010202 324.14 0 2,490.12 92.84 Black Canyon Creek - 1507010203 244.07 0 526.09 15.92
Bishop Creek - 1507010204 236.45 0 526.09 13.03 Agua Fria River-Lake Pleasant - 1507010205 371.81 0 341.16 4.93 Cave Creek-Arizona Canal Diversion Channel - 1507010206 288.47 0 6,377.48 1,123.38 Trilby Wash-Trilby Wash Basin - 1507010207 242.18 0 965.74 28.51
New River - 1507010208 353.18 0 6,377.48 794.50 Agua Fria River below Lake Pleasant - 1507010209 464.31 0 9,208.12 1,235.97
Total Agua Fria Watershed 2,785 0 9,208 437 Note: Adjacent watersheds may share a grid square. Data Sources: ESRI Data Products, Census 2000, October 17, 2003. http://www.esri.com/data/ Table 4-3: Agua Fria River Watershed Population Density Change 1990-2000 (people/square mile)
Population Density (people/sq.mi.) Watershed Name
Area (sq. mi.) Min Max Mean
Ash Creek and Sycamore Creek - 1507010201 260.55 0 -38.07 -0.22 Big Bug Creek-Agua Fria River - 1507010202 324.14 0 1,399.05 47.69 Black Canyon Creek - 1507010203 244.07 0 358.51 9.72
Bishop Creek - 1507010204 236.45 0 358.51 6.44 Agua Fria River-Lake Pleasant - 1507010205 371.81 0 211.73 3.07 Cave Creek-Arizona Canal Diversion Channel - 1507010206 288.47 0 2,468.24 283.93 Trilby Wash-Trilby Wash Basin - 1507010207 242.18 0 882.31 15.89
New River - 1507010208 353.18 0 2,468.24 305.65 Agua Fria River below Lake
Pleasant - 1507010209 464.31 0 2,180.42 334.69 Total Agua Fria Watershed 2,785 0 2,468 132
Note: Adjacent watersheds may share a grid square. Data Sources: Derived from data from the GIS data used for tables 4-1 and 4-2.
Agua Fria Watershed Rapid Watershed Assessment Section 4 – Census, Social and Agricultural Data page 4 - 3

Table 4-4: Agua Fria River Watershed Housing Density 2000 (Percent of Watershed) (Part 1 of 2)
Housing Density
Big Bug Creek-Agua Fria River
1507010202
Ash Creek and
Sycamore Creek
1507010201
Bishop Creek
1507010204New River
1507010208
Cave Creek-Arizona Canal
Diversion Channel
1507010206Undeveloped Private
4.80%
1.00%
1.82%
7.40%
7.10%
Rural 6.01%
2.80%
0.14%
4.21%
4.19%
Exurban 5.17%
0.86%
0.95%
11.61%
21.47%
Suburban 0.34%
- 0.27%
4.14%
7.13%
Urban 0.15%
- 0.03%
7.49%
10.86%
Table 4-4: Agua Fria River Watershed Housing Density 2000 (Percent of Watershed) (Part 2 of 2)
Housing Density
Agua Fria River below
Lake Pleasant
1507010209
Trilby Wash-Trilby Wash
Basin 1507010207
Agua Fria River-Lake Pleasant
1507010205
Black Canyon Creek
1507010203
Agua Fria River
Watershed
Agua Fria River
Watershed (sq. miles)
Undeveloped Private
23.44%
20.86%
12.66%
0.78%
33.90%
277
Rural 14.54%
12.74%
7.50%
1.25%
22.41%
183
Exurban 9.30%
5.13%
0.11%
1.81%
22.64%
185
Suburban 4.49%
0.25%
0.05%
0.13%
7.22%
59
Urban 11.70%
0.08%
0.04%
<0.01%
13.83%
113
Source: Theobald, D. 2005. Landscape patterns of exurban growth in the USA from 1980 to 2020. Ecology and Society 10(1): 32. [online] URL: http://www.ecology and society.org/vol10/iss1/art32/
Agua Fria Watershed Rapid Watershed Assessment Section 4 – Census, Social and Agricultural Data page 4 - 4

Table 4-5: Agua Fria River Watershed Housing Density Projections 2030 (Percent of Watershed) (Part 1)
Housing Density
Big Bug Creek-Agua Fria River
1507010202
Ash Creek and
Sycamore Creek
1507010201 Bishop Creek 1507010204
New River 1507010208
Cave Creek-Arizona Canal
Diversion Channel
1507010206 Undeveloped Private
0.85%
0.28%
0.33%
1.52%
1.36%
Rural
2.72%
1.73%
1.38%
1.78%
1.27%
Exurban
10.80%
2.65%
0.43%
8.70%
13.38%
Suburban
1.00%
0.01%
0.27%
6.04%
7.72%
Urban
1.10%
- 0.79%
16.81%
27.02%
Table 4-5: Agua Fria River Watershed Housing Density Projections 2030 (Percent of Watershed) (Part 2)
Source: Theobald, D. 2005. Landscape patterns of exurban growth in the USA from 1980 to 2020. Ecology and Society 10(1): 32. [online] URL: http://www.ecology and society.org/vol10/iss1/art32/
Housing Density
Agua Fria River below
Lake Pleasant 1507010209
Trilby Wash-Trilby Wash
Basin 1507010207
Agua Fria River-Lake Pleasant
1507010205
Black Canyon Creek
1507010203
Agua Fria River
Watershed
Agua Fria River
Watershed (sq. miles)
Undeveloped Private
4.94%
5.11%
2.03%
0.39%
6.98%
57
Rural
1.73%
3.36%
17.04%
0.57%
13.10%
107
Exurban
27.32%
29.02%
1.12%
2.56%
39.16%
320
Suburban
5.29%
1.30%
0.06%
0.29%
9.30%
76
Urban
24.20%
0.27%
0.10%
0.17%
31.46%
257
Agua Fria River Watershed Agricultural Statistics Arizona is known as one of the most productive and efficient agricultural regions in the world, with beauty that also provides the food and fiber to sustain life in the desert. Arizona is also one of the most diverse agricultural
producing states in the nation, producing more than 160 varieties of vegetables, livestock, field crops and nursery stock. The climate, natural resources, agribusiness infrastructure and farm heritage help make agriculture a $9.2 billion dollar industry employing more than 72,000 individuals.
Agua Fria Watershed Rapid Watershed Assessment Section 4 – Census, Social and Agricultural Data page 4 - 5

According to the United States Department of Agriculture’s, 2002 Census, there are more than 7,000 farms and ranches, seventy-eight percent of which are owned by individuals or families. The total farmland in Arizona is comprised of more than 26,000,000 acres with irrigated crops on 1,280,000 acres and pasture for animals on 23,680,000. Agriculture in general on the Agua Fria River Watershed is comprised of:
• Considerable grazing land for many livestock operations
• Multiple recreational equestrian facilities
• A few equestrian breeding facilities
• Several small dairy facilities • Multiple nursery facilities • A few small hog facilities • A significant number of apiary
(honey bee) operations • A few citrus orchards • A few plantings of pecans • A significant amount of rose
production • A mixed variety of crops
including: Cotton Alfalfa Corn
• Small grains • Potatoes • A variety of melons • A variety of green leafy
vegetables Data Source: The NASS (National Agricultural Statistics Service, United States Department of Agriculture) has farm data by zip code. We used the U.S.
Census Bureau ZIP Census Tabulation Areas (ZCTA) to generate maps. A typical 5-digit ZCTA (there are 3-digit ZCTAs as well) is typically nearly identical to a 5-digit U.S. Postal Service ZIP code, but there are some distinctions. Unlike ZIP codes, ZCTA areas are spatially complete and they are easier to map. The Bureau created special XX ZCTAs (ZCTAs with a valid 3-digit ZIP but with “XX” as last two characters of the code) which represent large unpopulated areas where it made no sense to assign a census block to an actual ZIP code. Similarly, HH ZCTAs represent large bodies of water within a 3-digit zip area. There is typically no population in either an XX or HH ZCTA. Data is withheld by NASS for categories with one to four farms. This is to protect the identity of individual farmers. Farm counts for these zip codes are included in the "State Total" category. Some categories only contained stars instead of numbers. Each star was counted as one farm. But because each star could represent as many as 4 farms, each number on the tables are actually greater than or equal to the number listed. In some cases this results in percentages that add up to more or less that 100 percent. Tables Include data from zip codes both contained within the watershed and zip codes crossing watershed boundaries. A total of five zip code areas contained no NASS data about agricultural practices. Three of the zip codes that lie within AF Watershed contained no information from NASS databases. Two of the zip codes that lie partially within AF Watershed had no information in NASS databases. NASS assumed that
Agua Fria Watershed Rapid Watershed Assessment Section 4 – Census, Social and Agricultural Data page 4 - 6
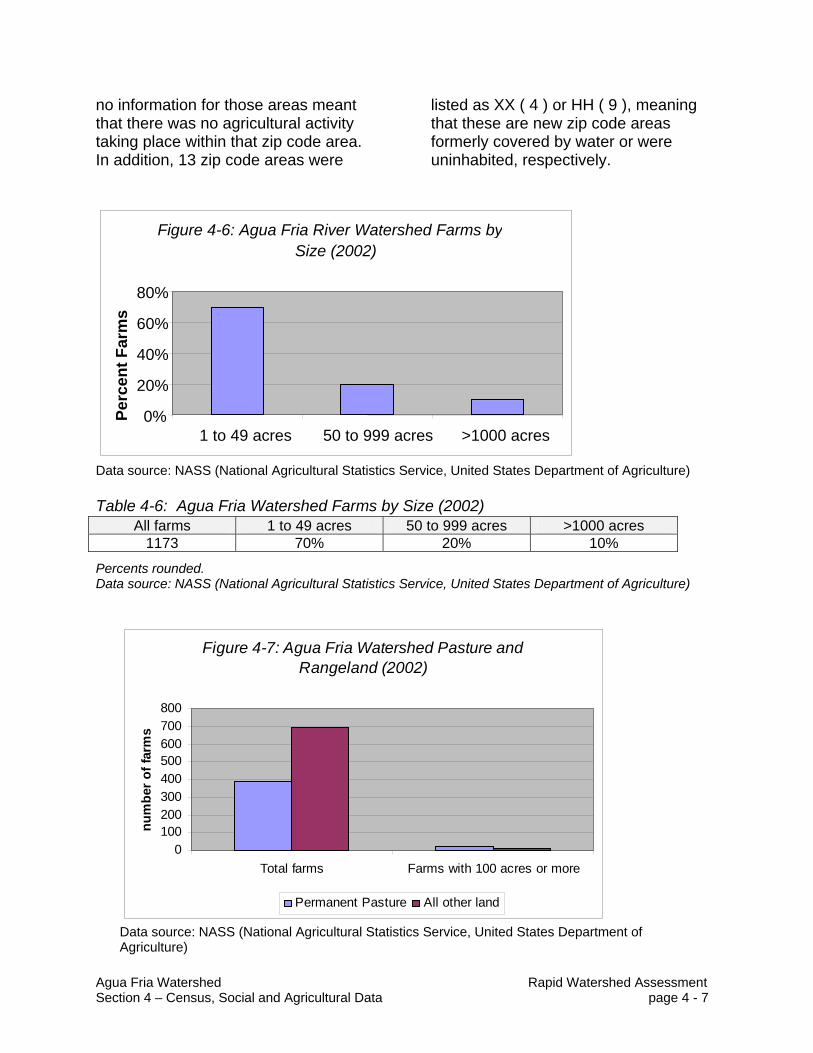
no information for those areas meant that there was no agricultural activity taking place within that zip code area. In addition, 13 zip code areas were
listed as XX ( 4 ) or HH ( 9 ), meaning that these are new zip code areas formerly covered by water or were uninhabited, respectively.
Data source: NASS (National Agricultural Statistics Service, United States Department of Agriculture) Table 4-6: Agua Fria Watershed Farms by Size (2002)
Percents rounded. Data source: NASS (National Agricultural Statistics Service, United States Department of Agriculture)
Figure 4-7: Agua Fria Watershed Pasture and Rangeland (2002)
0100200300400500600700800
Total farms Farms with 100 acres or more
num
ber o
f far
ms
Permanent Pasture All other land
Data source: NASS (National Agricultural Statistics Service, United States Department of Agriculture)
Figure 4-6: Agua Fria River Watershed Farms by Size (2002)
0%
20%
40%
60%
80%
1 to 49 acres 50 to 999 acres >1000 acres
Perc
ent F
arm
s
All farms 1 to 49 acres 50 to 999 acres >1000 acres 1173 70% 20% 10%
Agua Fria Watershed Rapid Watershed Assessment Section 4 – Census, Social and Agricultural Data page 4 - 7

Table 4-7: Agua Fria Watershed Pasture and Rangeland (2002)
Category Total farms Farms 100 acres or more Permanent pasture and rangeland
381 20%
All other land 694 10% Percents rounded. Data source: NASS (National Agricultural Statistics Service, United States Department of Agriculture)
Figure 4-8: Agua Fria Watershed CroplandHarvested (2002)
>1000 acres
50 to 999 acres15%
1 to 49 acres65%
20%
Data source: NASS (National Agricultural Statistics Service, United States Department of Agriculture)
Table 4-8: Agua Fria Watershed Cropland Harvested (2002) Total farms 1 to 49 acres 50 to 999 acres >1000 acres
413 65% 15% 20% Percents rounded. Data source: NASS (National Agricultural Statistics Service, United States Department of Agriculture)
Agua Fria Watershed Rapid Watershed Assessment Section 4 – Census, Social and Agricultural Data page 4 - 8
Section 5: Resource Assessment Tables The following Resource Assessment Tables summarize current and desired future natural resource conditions for the Agua Fria River Watershed. The tables present information on benchmark and future conservation systems and practices, qualitative effects on primary resource concerns, and estimated costs for conservation implementation. Conservation District board members, NRCS conservationists, and other people familiar with conservation work in the watershed were consulted for estimating current and future natural resource conditions. To contribute additional or updated information for this watershed, visit the NRCS Arizona website: www.az.nrcs.usda.gov/programs. The tables show three levels of conservation treatment (Baseline, Progressive, Resource Management System) for each of the major land uses (crop, range, forest, urban) within the watershed. Baseline is defined as a low level of conservation adoption with landowners who are typically not participating in conservation programs. There are, however, a few practices that have been commonly adopted by all landowners in this watershed. Progressive is defined as an intermediate level of conservation adoption with landowners who are actively participating in conservation programs and have adopted several practices but not satisfied all of the Quality Criteria in the NRCS Field
Office Technical Guide. Resource Management System (RMS) is defined as a complete system of conservation practices that addresses all of the Soil, Water, Air, Plant, and Animal (SWAPA) resource concerns typically seen for this land use in this watershed. For each land use, the results of the assessment are presented in two parts. Part 1 (Assessment Information) summarizes the conservation practices at each treatment level and the quantities of practices for current benchmark conditions and projected future conditions. Part 1 also displays the four primary resource concerns, along with individual practice effects and an overall Systems Rating (ranging from a low of 1 to a high of 5) indicating the effectiveness of the conservation system used at each treatment level. Part 2 (Conservation Cost Table) summarizes the installation, management, and related costs by conservation practice and treatment level for the projected future conditions by federal and private share of the costs. Part 2 also displays the benchmark and future conservation conditions status bars. Credit goes to NRCS in Oregon for development of the template for these Resource Assessment Tables. NOTE: the numbers in the first column of each table represent NRCS conservation practice codes.
Agua Fria Watershed Rapid Watershed Assessment Section 5 – Resource Assessment page 5 - 1

WA
TER
SH
ED
NA
ME
& C
OD
E
AG
UA
FR
IA R
IVE
R -
1507
0102
LA
ND
US
E A
CR
ES
68
,102
LAN
DU
SE
TY
PE
C
RO
P
TYP
ICA
L U
NIT
SIZ
E A
CR
ES
1,
000
AS
SE
SS
ME
NT
INFO
RM
ATI
ON
C
ALC
UL
ATE
D P
AR
TIC
IPA
TIO
N
75%
B
ench
mar
k C
ondi
tions
Fu
ture
Con
ditio
ns
RE
SO
UR
CE
CO
NC
ER
NS
Con
serv
atio
n S
yste
ms
by T
reat
men
t Lev
el
Tota
l U
nits
E
xist
ing
Unc
hang
edU
nits
New
Tr
eatm
ent
Uni
ts
Tota
l U
nits
Soi
l Con
ditio
n –
Org
anic
M
atte
r D
eple
tion
Wat
er
Qua
ntity
–
Inef
ficie
nt
Wat
er U
se o
n Ir
riga
ted
Land
Wat
er Q
ualit
y –
Exc
essi
ve
Nut
rien
ts a
nd
Org
anic
s in
G
roun
dwat
er
Air
Qua
lity
– P
artic
ulat
e m
atte
r le
ss
than
10
mic
rom
eter
s in
dia
met
er
(PM
10)
Bas
elin
e S
yste
m R
atin
g ->
1
5 2
0
Irrig
atio
n La
nd L
evel
ing
(ac
.) 4
64
4,25
6 1,
064
0 1,
064
0 4
0 0
Irrig
atio
n S
yste
m, S
urfa
ce a
nd S
ubsu
rfac
e (a
c.)
443
17
,026
4,
256
0 4,
256
0 4
0 0
Irrig
atio
n W
ater
Con
veya
nce,
Ditc
h an
d C
anal
Lin
ing
(ft.)
428
17
,026
4,
256
0 4,
256
2 4
2 0
Irrig
atio
n W
ater
Con
veya
nce,
Pip
elin
e (f
t.) 4
30
8,51
3 2,
128
0 2,
128
2 5
3 0
Str
uctu
re fo
r Wat
er C
ontr
ol
(no.
) 58
7 17
4
0 4
0 3
0 0
Tota
l Acr
eage
at B
asel
ine
17,0
26
4,25
6 0
4,25
6
Pro
gres
sive
S
yste
m R
atin
g ->
4
5 4
3
Con
serv
atio
n C
rop
Rot
atio
n (
ac.)
328
17
,026
4,
256
4,25
6 8,
513
4 3
1 3
Irrig
atio
n La
nd L
evel
ing
(ac
.) 4
64
8,51
3 3,
192
1,06
4 4,
256
0 4
0 0
Irrig
atio
n S
yste
m, S
urfa
ce a
nd S
ubsu
rfac
e (a
c.)
443
8,
513
4,25
6 0
4,25
6 0
4 0
0 Ir
rigat
ion
Wat
er C
onve
yanc
e, D
itch
and
Can
al L
inin
g (ft
.) 4
28
85,1
28
25,5
38
17,0
26
42,5
64
2 4
2 0
Irrig
atio
n W
ater
Con
veya
nce,
Pip
elin
e (f
t.) 4
30
17,0
26
6,38
5 2,
128
8,51
3 2
5 3
0 Ir
rigat
ion
Wat
er M
anag
emen
t (a
c.)
449
17,0
26
4,25
6 4,
256
8,51
3 4
5 5
3 R
esid
ue M
anag
emen
t, S
easo
nal
(ac.
) 34
4 8,
513
2,12
8 2,
128
4,25
6 3
1 -1
3
Str
uctu
re fo
r Wat
er C
ontr
ol
(no.
) 58
7 85
26
17
43
0
3 0
0 To
tal A
crea
ge a
t Pro
gres
sive
Lev
el
17,0
26
4,25
6 4,
256
8,51
3
RM
S
Sys
tem
Rat
ing
->
4 5
4 3
Con
serv
atio
n C
rop
Rot
atio
n (
ac.)
328
34
,051
46
,820
8,
513
55,3
33
4 3
1 3
Irrig
atio
n La
nd L
evel
ing
(ac
.) 4
64
34,0
51
42,5
64
12,7
69
55,3
33
0 4
0 0
Irrig
atio
n S
yste
m, M
icro
irrig
atio
n (a
c.)
441
3,40
5 3,
405
2,12
8 5,
533
0 4
0 0
Irrig
atio
n S
yste
m, S
prin
kler
(ac.
) 44
2 3,
405
3,40
5 2,
128
5,53
3 0
4 0
0 Ir
rigat
ion
Sys
tem
, Sur
face
and
Sub
surf
ace
(ac.
) 44
3 34
,051
48
,948
6,
385
55,3
33
0 4
0 0
Irrig
atio
n W
ater
Con
veya
nce,
Ditc
h an
d C
anal
Lin
ing
(ft.)
428
34
0,51
0 41
2,86
8 14
0,46
0 55
3,32
9 2
4 2
0 Ir
rigat
ion
Wat
er C
onve
yanc
e, P
ipel
ine
(ft.)
430
68
,102
85
,128
25
,538
11
0,66
6 2
5 3
0 Ir
rigat
ion
Wat
er M
anag
emen
t (a
c.)
449
34,0
51
46,8
20
8,51
3 55
,333
4
5 5
3 N
utrie
nt M
anag
emen
t (a
c.)
590
34,0
51
34,0
51
21,2
82
55,3
33
3 1
5 1
Pes
t Man
agem
ent
(ac.
) 59
5 34
,051
34
,051
21
,282
55
,333
0
1 0
0 R
esid
ue a
nd T
illag
e M
anag
emen
t, M
ulch
Till
(ac
.) 34
5 17
,026
17
,026
10
,641
27
,666
3
1 -1
3
Res
idue
Man
agem
ent,
Sea
sona
l (a
c.)
344
17,0
26
23,4
10
4,25
6 27
,666
3
1 -1
3
Str
uctu
re fo
r Wat
er C
ontr
ol
(no.
) 58
7 34
1 41
3 14
0 55
3 0
3 0
0 To
tal A
crea
ge a
t RM
S L
evel
34
,051
34
,051
21
,282
55
,333
Agua Fria Watershed Rapid Watershed Assessment Section 5 – Resource Assessment page 5 - 2

WA
TER
SH
ED
NA
ME
& C
OD
E
AG
UA
FR
IA R
IVE
R -
150
7010
2 L
AN
DU
SE
AC
RE
S
68,1
02
LA
ND
US
E T
YP
E
CR
OP
TY
PIC
AL
UN
IT S
IZE
AC
RE
S
1,00
0
CO
NS
ER
VA
TIO
N C
OS
T T
AB
LE
C
AL
CU
LA
TED
PA
RTI
CIP
ATI
ON
75
%
F
UTU
RE
F
ED
ER
AL
P
RIV
ATE
Inst
alla
tion
Cos
t M
anag
emen
t C
ost -
3 y
rs
Tec
hnic
al
Ass
ista
nce
Inst
alla
tion
Cos
t A
nnua
l O &
M
+ M
gt C
osts
C
on
serv
atio
n S
yste
ms
by
Trea
tmen
t L
evel
N
ew
Tre
atm
ent
Uni
ts
50%
10
0%
20%
Tot
al P
rese
nt
Val
ue C
ost
50%
10
0%
Tot
al P
rese
nt
Val
ue C
ost
Pro
gre
ssiv
e
Con
serv
atio
n C
rop
Rot
atio
n (
ac.)
328
4,
256
$0
$127
,691
$2
5,53
8 $1
39,3
12
$0
$42,
564
$65,
521
Irrig
atio
n La
nd L
evel
ing
(ac
.) 4
64
1,06
4 $5
32,0
47
$0
$106
,409
$6
38,4
56
$532
,047
$3
1,92
3 $6
66,5
17
Irrig
atio
n S
yste
m, S
urfa
ce a
nd S
ubsu
rfac
e (a
c.)
443
0
$0
$0
$0
$0
$0
$0
$0
Irrig
atio
n W
ater
Con
veya
nce,
Ditc
h an
d C
anal
Lin
ing
(ft.)
428
17
,026
$6
8,10
2 $0
$1
3,62
0 $8
1,72
2 $6
8,10
2 $2
,724
$7
9,57
7 Ir
rigat
ion
Wat
er C
onve
yanc
e, P
ipel
ine
(ft.)
430
2,
128
$10,
641
$0
$2,1
28
$12,
769
$10,
641
$426
$1
2,43
4 Ir
rigat
ion
Wat
er M
anag
emen
t (
ac.)
449
4,
256
$0
$127
,691
$2
5,53
8 $1
39,3
12
$0
$42,
564
$65,
521
Res
idue
Man
agem
ent,
Sea
sona
l (
ac.)
344
2,
128
$0
$38,
307
$7,6
61
$41,
793
$0
$12,
769
$19,
656
Str
uctu
re fo
r Wat
er C
ontr
ol
(no.
) 5
87
17
$2,5
54
$0
$511
$3
,065
$2
,554
$1
02
$2,9
84
Su
bto
tal
4,25
6 $6
13,3
44
$293
,690
$1
81,4
07
$1,0
56,4
29
$613
,344
$1
33,0
71
$912
,210
R
MS
Con
serv
atio
n C
rop
Rot
atio
n (
ac.)
328
8,
513
$0
$255
,383
$5
1,07
7 $2
78,6
23
$0
$85,
128
$131
,041
Ir
rigat
ion
Land
Lev
elin
g (
ac.)
464
12
,769
$6
,384
,563
$0
$1
,276
,913
$7
,661
,475
$6
,384
,563
$3
83,0
74
$7,9
98,2
08
Irrig
atio
n S
yste
m, M
icro
irrig
atio
n (a
c.)
441
2,
128
$1,5
96,1
41
$0
$319
,228
$1
,915
,369
$1
,596
,141
$1
59,6
14
$2,2
68,4
93
Irrig
atio
n S
yste
m, S
prin
kler
(ac
.) 4
42
2,12
8 $1
,808
,959
$0
$3
61,7
92
$2,1
70,7
51
$1,8
08,9
59
$72,
358
$2,1
13,7
59
Irrig
atio
n S
yste
m, S
urfa
ce a
nd S
ubsu
rfac
e (a
c.)
443
6,
385
$0
$0
$0
$0
$0
$0
$0
Irrig
atio
n W
ater
Con
veya
nce,
Ditc
h an
d C
anal
Lin
ing
(ft.)
428
14
0,46
0 $5
61,8
42
$0
$112
,368
$6
74,2
10
$561
,842
$2
2,47
4 $6
56,5
09
Irrig
atio
n W
ater
Con
veya
nce,
Pip
elin
e (f
t.) 4
30
25,5
38
$127
,691
$0
$2
5,53
8 $1
53,2
30
$127
,691
$5
,108
$1
49,2
07
Irrig
atio
n W
ater
Man
agem
ent
(ac
.) 4
49
8,51
3 $0
$2
55,3
83
$51,
077
$278
,623
$0
$8
5,12
8 $1
31,0
41
Nut
rient
Man
agem
ent
(ac
.) 5
90
21,2
82
$0
$638
,456
$1
27,6
91
$696
,558
$0
$2
12,8
19
$327
,603
P
est M
anag
emen
t (
ac.)
595
21
,282
$0
$6
38,4
56
$127
,691
$6
96,5
58
$0
$212
,819
$3
27,6
03
Res
idue
and
Till
age
Man
agem
ent,
Mul
ch T
ill (
ac.)
345
10
,641
$0
$2
71,3
44
$54,
269
$296
,037
$0
$9
0,44
8 $1
39,2
31
Res
idue
Man
agem
ent,
Sea
sona
l (
ac.)
344
4,
256
$0
$76,
615
$15,
323
$83,
587
$0
$25,
538
$39,
312
Str
uctu
re fo
r Wat
er C
ontr
ol
(no.
) 5
87
140
$21,
069
$0
$4,2
14
$25,
283
$21,
069
$843
$2
4,61
9
Su
bto
tal
21,2
82
$10,
500,
264
$2,1
35,6
36
$2,5
27,1
80
$14,
930,
305
$10,
500,
264
$1,3
55,3
49
$14,
306,
627
Gra
nd
To
tal
25,5
38
$11,
113,
608
$2,4
29,3
26
$2,7
08,5
87
$15,
986,
734
$11,
113,
608
$1,4
88,4
20
$15,
218,
836
Cha
rt R
efer
s To
La
ndus
e T
ype
CR
OP
C
alcu
late
d P
artic
ipat
ion
Rat
e 75
%
A
vera
ge
PV
Co
sts
per
Ac
Sys
tem
F
eder
al
Pri
vate
P
rog
$248
.20
$214
.32
RM
S
$701
.55
$672
.24
Agua Fria Watershed Rapid Watershed Assessment Section 5 – Resource Assessment page 5 - 3

WAT
ERSH
ED N
AME
& CO
DE
AGUA
FRI
A RI
VER
- 150
7010
2 LA
NDUS
E AC
RES
1,35
5,85
9
LAND
USE
TYPE
RA
NGE
TYPI
CAL
UNIT
SIZ
E AC
RES
50,0
00
ASSE
SSM
ENT
INFO
RMAT
ION
CALC
ULAT
ED P
ARTI
CIPA
TIO
N 50
%
Be
nchm
ark
Cond
ition
s Fu
ture
Con
ditio
ns
RESO
URCE
CO
NCER
NS
Cons
erva
tion
Syst
ems
by T
reat
men
t Lev
el
Tota
l Un
its
Exis
ting
Unch
ange
dUn
its
New
Tr
eatm
ent
Units
To
tal
Units
So
il Er
osio
n –
Shee
t and
Rill
Wat
er Q
ualit
y –
Exce
ssiv
e Su
spen
ded
Sedi
men
t and
Tu
rbid
ity in
Su
rface
Wat
er
Plan
t Co
nditi
on –
Pr
oduc
tivity
, He
alth
and
Vi
gor
Dom
estic
An
imal
s –
Inad
equa
te
Qua
ntiti
es a
nd
Qua
lity
of
Feed
and
Fo
rage
Base
line
Syst
em R
atin
g ->
1
3 0
0
Fenc
e (
ft.)
382
67,7
93
33,8
96
0 33
,896
0
1 1
1 Pi
pelin
e (
ft.)
516
67,7
93
33,8
96
0 33
,896
3
3 0
0 W
ater
ing
Facil
ity (n
o.)
614
136
68
0 68
0
4 1
0 To
tal A
crea
ge a
t Bas
elin
e 67
7,93
0 33
8,96
5 0
338,
965
Pr
ogre
ssiv
e Sy
stem
Rat
ing
->
4 3
4 4
Fenc
e (
ft.)
382
169,
482
101,
689
67,7
93
169,
482
0 1
1 1
Pipe
line
(ft.
) 51
6 16
9,48
2 10
1,68
9 67
,793
16
9,48
2 3
3 0
0 Pr
escr
ibed
Bur
ning
(a
c.)
338
33,8
96
16,9
48
16,9
48
33,8
96
1 1
4 4
Pres
crib
ed G
razin
g (
ac.)
528
33
8,96
5 16
9,48
2 16
9,48
2 33
8,96
5 5
3 5
5 W
ater
ing
Facil
ity (n
o.)
614
136
102
34
136
0 4
1 0
Tota
l Acr
eage
at P
rogr
essi
ve L
evel
33
8,96
5 16
9,48
2 16
9,48
2 33
8,96
5
RMS
Syst
em R
atin
g ->
4
4 5
5
Brus
h M
anag
emen
t (a
c.)
314
33,8
96
33,8
96
33,8
96
67,7
93
4 4
5 3
Fenc
e (
ft.)
382
338,
965
440,
654
237,
275
677,
930
0 1
1 1
Pipe
line
(ft.
) 51
6 33
8,96
5 44
0,65
4 23
7,27
5 67
7,93
0 3
3 0
0 Pr
escr
ibed
Bur
ning
(a
c.)
338
33,8
96
50,8
45
16,9
48
67,7
93
1 1
4 4
Pres
crib
ed G
razin
g (
ac.)
528
33
8,96
5 50
8,44
7 16
9,48
2 67
7,93
0 5
3 5
5 Ra
nge
Plan
ting
(ac
.) 5
50
33,8
96
33,8
96
33,8
96
67,7
93
4 2
5 5
Upla
nd W
ildlife
Hab
itat M
anag
emen
t (a
c.)
645
338,
965
338,
965
338,
965
677,
930
0 0
4 1
Wat
erin
g Fa
cility
(no.
) 61
4 33
9 44
1 23
7 67
8 0
4 1
0 W
ildlife
Wat
erin
g Fa
cility
(n
o.)
648
68
68
68
136
0 4
1 0
Tota
l Acr
eage
at R
MS
Leve
l 33
8,96
5 33
8,96
5 33
8,96
5 67
7,93
0
Agua Fria Watershed Rapid Watershed Assessment Section 5 – Resource Assessment page 5 - 4

WAT
ERSH
ED N
AME
& CO
DE
AGU
A FR
IA R
IVER
- 15
0701
02
LAND
USE
ACRE
S 1,
355,
859
LAND
USE
TYPE
RA
NGE
TYPI
CAL
UNI
T SI
ZE A
CRES
50
,000
CONS
ERVA
TIO
N CO
ST T
ABLE
CA
LCUL
ATED
PAR
TICI
PATI
ON
50%
FU
TURE
FE
DER
AL
PRIV
ATE
Inst
alla
tion
Cos
t M
anag
emen
tC
ost -
3 y
rs
Tech
nica
l As
sist
ance
In
stal
latio
n C
ost
Annu
al O
& M
+ M
gt C
osts
C
onse
rvat
ion
Syst
ems
by T
reat
men
t Lev
el
New
Tr
eatm
ent
Uni
ts
50%
10
0%
20%
Tota
l Pre
sent
Va
lue
Cos
t 50
%
100%
Tota
l Pre
sent
Va
lue
Cos
t
Prog
ress
ive
Fenc
e (
ft.)
382
67,7
93
$101
,689
$0
$2
0,33
8 $1
22,0
27
$101
,689
$4
,068
$1
18,8
24
Pipe
line
(ft.
) 51
6 67
,793
$2
71,1
72
$0
$54,
234
$325
,406
$2
71,1
72
$10,
847
$316
,863
Pr
escr
ibed
Bur
ning
(a
c.)
338
16,9
48
$423
,706
$0
$8
4,74
1 $5
08,4
47
$423
,706
$8
,474
$4
59,4
02
Pres
crib
ed G
razi
ng
(ac.
) 52
8 16
9,48
2 $1
27,1
12
$0
$25,
422
$152
,534
$1
27,1
12
$0
$127
,112
W
ater
ing
Faci
lity
(no.
) 61
4 34
$1
6,94
8 $0
$3
,390
$2
0,33
8 $1
6,94
8 $1
,017
$2
1,23
2
Subt
otal
16
9,48
2 $9
40,6
27
$0
$188
,125
$1
,128
,753
$9
40,6
27
$24,
405
$1,0
43,4
32
RMS
Brus
h M
anag
emen
t (a
c.)
314
33,8
96
$2,0
33,7
89
$0
$406
,758
$2
,440
,546
$2
,033
,789
$4
0,67
6 $2
,205
,130
Fe
nce
(ft.
) 38
2 23
7,27
5 $3
55,9
13
$0
$71,
183
$427
,096
$3
55,9
13
$14,
237
$415
,882
Pi
pelin
e (
ft.)
516
237,
275
$949
,101
$0
$1
89,8
20
$1,1
38,9
22
$949
,101
$3
7,96
4 $1
,109
,020
Pr
escr
ibed
Bur
ning
(a
c.)
338
16,9
48
$423
,706
$0
$8
4,74
1 $5
08,4
47
$423
,706
$8
,474
$4
59,4
02
Pres
crib
ed G
razi
ng
(ac.
) 52
8 16
9,48
2 $1
27,1
12
$0
$25,
422
$152
,534
$1
27,1
12
$0
$127
,112
R
ange
Pla
ntin
g (
ac.)
550
33
,896
$1
,016
,894
$0
$2
03,3
79
$1,2
20,2
73
$1,0
16,8
94
$20,
338
$1,1
02,5
65
Upl
and
Wild
life
Hab
itat M
anag
emen
t (a
c.)
645
338,
965
$0
$1,3
21,9
63
$264
,393
$1
,442
,266
$0
$4
40,6
54
$678
,322
W
ater
ing
Faci
lity
(no.
) 61
4 23
7 $1
18,6
38
$0
$23,
728
$142
,365
$1
18,6
38
$7,1
18
$148
,622
W
ildlif
e W
ater
ing
Faci
lity
(no
.) 6
48
68
$33,
896
$0
$6,7
79
$40,
676
$33,
896
$678
$3
6,75
2
Subt
otal
33
8,96
5 $5
,059
,049
$1
,321
,963
$1
,276
,202
$7
,513
,125
$5
,059
,049
$5
70,1
39
$6,2
82,8
07
Gra
nd T
otal
50
8,44
7 $5
,999
,676
$1
,321
,963
$1
,464
,328
$8
,641
,878
$5
,999
,676
$5
94,5
44
$7,3
26,2
39
Char
t Ref
ers
To
Land
use
Type
R
ANG
E
C
alcu
late
d Pa
rtici
patio
n R
ate
50%
Aver
age
PV C
osts
per
Ac
Syst
em
Fede
ral
Priv
ate
Prog
$6
.66
$6.1
6
R
MS
$22.
16
$18.
54
Agua Fria Watershed Rapid Watershed Assessment Section 5 – Resource Assessment page 5 - 5

WAT
ERSH
ED N
AME
& CO
DE
AGUA
FRI
A RI
VER
- 150
7010
2 LA
NDUS
E AC
RES
80,4
30
LAND
USE
TYPE
FO
REST
TY
PICA
L UN
IT S
IZE
ACRE
S 50
,000
ASSE
SSM
ENT
INFO
RMAT
ION
CALC
ULAT
ED P
ARTI
CIPA
TION
50
%
Be
nchm
ark
Cond
ition
s Fu
ture
Con
ditio
ns
RESO
URCE
CON
CERN
S
Cons
erva
tion
Syst
ems
by T
reat
men
t Lev
el
Tota
l Un
its
Exis
ting
Unch
ange
d Un
its
New
Tr
eatm
ent
Units
To
tal
Units
So
il Er
osio
n –
Shee
t and
Rill
Wat
er Q
ualit
y –
Exce
ssiv
e Su
spen
ded
Sedi
men
t and
Tu
rbid
ity in
Su
rface
Wat
er
Plan
t Co
nditi
on –
Pr
oduc
tivity
, He
alth
and
Vi
gor
Dom
estic
An
imal
s –
Inad
equa
te
Quan
titie
s an
d Qu
ality
of
Feed
and
Fo
rage
Base
line
Syst
em R
atin
g ->
1
3 0
0
Fenc
e (
ft.)
382
4,02
2 2,
011
0 2,
011
0 1
1 1
Pipe
line
(ft.
) 51
6 4,
022
2,01
1 0
2,01
1 3
3 0
0 W
ater
ing
Facil
ity (n
o.)
614
8 4
0 4
0 4
1 0
Tota
l Acr
eage
at B
asel
ine
40,2
15
20,1
08
0 20
,108
Prog
ress
ive
Syst
em R
atin
g ->
4
3 4
4
Fenc
e (
ft.)
382
10,0
54
6,03
2 4,
022
10,0
54
0 1
1 1
Pipe
line
(ft.
) 51
6 10
,054
6,
032
4,02
2 10
,054
3
3 0
0 Pr
escr
ibed
Bur
ning
(a
c.)
338
2,01
1 1,
005
1,00
5 2,
011
1 1
4 4
Pres
crib
ed G
razin
g (
ac.)
528
20
,108
10
,054
10
,054
20
,108
5
3 5
5 W
ater
ing
Facil
ity (n
o.)
614
8 6
2 8
0 4
1 0
Tota
l Acr
eage
at P
rogr
essi
ve L
evel
20
,108
10
,054
10
,054
20
,108
RMS
Syst
em R
atin
g ->
5
4 5
3
Brus
h M
anag
emen
t (a
c.)
314
2,01
1 2,
011
2,01
1 4,
022
4 4
5 3
Fenc
e (
ft.)
382
20,1
08
26,1
40
14,0
75
40,2
15
0 1
1 1
Pipe
line
(ft.
) 51
6 20
,108
26
,140
14
,075
40
,215
3
3 0
0 Pr
escr
ibed
Bur
ning
(a
c.)
338
2,01
1 3,
016
1,00
5 4,
022
1 1
4 4
Pres
crib
ed G
razin
g (
ac.)
528
20
,108
30
,161
10
,054
40
,215
5
3 5
5 Tr
ee/S
hrub
Est
ablis
hmen
t (a
c.)
612
2,01
1 2,
011
2,01
1 4,
022
5 1
4 -3
Up
land
Wild
life H
abita
t Man
agem
ent
(ac.
) 64
5 20
,108
20
,108
20
,108
40
,215
0
0 4
1 W
ater
ing
Facil
ity (n
o.)
614
20
26
14
40
0 4
1 0
Wild
life W
ater
ing
Facil
ity
(no.
) 64
8 4
4 4
8 0
0 0
0 To
tal A
crea
ge a
t RM
S Le
vel
20,1
08
20,1
08
20,1
08
40,2
15
Agua Fria Watershed Rapid Watershed Assessment Section 5 – Resource Assessment page 5 - 6

W
ATER
SHED
NAM
E &
CODE
AG
UA F
RIA
RIVE
R - 1
5070
102
LAND
USE
ACRE
S 80
,430
LAND
USE
TYPE
FO
REST
TY
PICA
L UN
IT S
IZE
ACRE
S 50
,000
CONS
ERVA
TIO
N CO
ST T
ABLE
CA
LCUL
ATED
PAR
TICI
PATI
ON
50%
FU
TURE
FE
DERA
L PR
IVAT
E
Inst
alla
tion
Cost
M
anag
emen
tCo
st -
3 yr
s Te
chni
cal
Assis
tanc
e In
stal
latio
n Co
st
Annu
al O
& M
+ M
gt C
osts
C
onse
rvat
ion
Syst
ems
by T
reat
men
t Lev
el
New
Trea
tmen
t Un
its
50%
10
0%
20%
Tota
l Pre
sent
Va
lue
Cost
50
%
100%
Tota
l Pre
sent
Va
lue
Cost
Prog
ress
ive
Fenc
e (
ft.)
382
4,02
2 $6
,032
$0
$1
,206
$7
,239
$6
,032
$2
41
$7,0
49Pi
pelin
e (
ft.)
516
4,02
2 $1
6,08
6 $0
$3
,217
$1
9,30
3 $1
6,08
6 $6
43
$18,
796
Pres
crib
ed B
urni
ng
(ac.
) 33
8 1,
005
$25,
134
$0
$5,0
27
$30,
161
$25,
134
$503
$2
7,25
2Pr
escr
ibed
Gra
zing
(ac
.) 5
28
10,0
54
$7,5
40
$0
$1,5
08
$9,0
48
$7,5
40
$0
$7,5
40W
ater
ing
Faci
lity (n
o.)
614
2 $1
,005
$0
$2
01
$1,2
06
$1,0
05
$60
$1,2
59
Subt
otal
10
,054
$5
5,79
8 $0
$1
1,16
0 $6
6,95
8 $5
5,79
8 $1
,448
$6
1,89
7RM
S
Brus
h M
anag
emen
t (a
c.)
314
2,01
1 $1
20,6
45
$0
$24,
129
$144
,774
$1
20,6
45
$2,4
13
$130
,809
Fenc
e (
ft.)
382
14,0
75
$21,
113
$0
$4,2
23
$25,
335
$21,
113
$845
$2
4,67
0Pi
pelin
e (
ft.)
516
14,0
75
$56,
301
$0
$11,
260
$67,
561
$56,
301
$2,2
52
$65,
787
Pres
crib
ed B
urni
ng
(ac.
) 33
8 1,
005
$25,
134
$0
$5,0
27
$30,
161
$25,
134
$503
$2
7,25
2Pr
escr
ibed
Gra
zing
(ac
.) 5
28
10,0
54
$7,5
40
$0
$1,5
08
$9,0
48
$7,5
40
$0
$7,5
40Tr
ee/S
hrub
Est
ablis
hmen
t (a
c.)
612
2,01
1 $9
,551
$0
$1
,910
$1
1,46
1 $9
,551
$1
91
$10,
356
Upla
nd W
ildlif
e Ha
bita
t Man
agem
ent
(ac.
) 64
5 20
,108
$0
$7
8,41
9 $1
5,68
4 $8
5,55
6 $0
$2
6,14
0 $4
0,23
8W
ater
ing
Faci
lity (n
o.)
614
14
$7,0
38
$0
$1,4
08
$8,4
45
$7,0
38
$422
$8
,816
Wild
life
Wat
erin
g Fa
cility
(n
o.)
648
4 $2
,011
$0
$4
02
$2,4
13
$2,0
11
$40
$2,1
80
Subt
otal
20
,108
$2
49,3
33
$78,
419
$65,
550
$384
,755
$2
49,3
33
$32,
805
$317
,649
Gra
nd T
otal
30
,161
$3
05,1
31
$78,
419
$76,
710
$451
,713
$3
05,1
31
$34,
253
$379
,546
Char
t Ref
ers
To
Land
use
Type
FO
REST
Ca
lcul
ated
Par
ticip
atio
n Ra
te
50%
Aver
age
PV C
osts
per
Ac
Syst
em
Fede
ral
Priv
ate
Prog
$6
.66
$6.1
6
RM
S $1
9.13
$1
5.80
Agua Fria Watershed Rapid Watershed Assessment Section 5 – Resource Assessment page 5 - 7
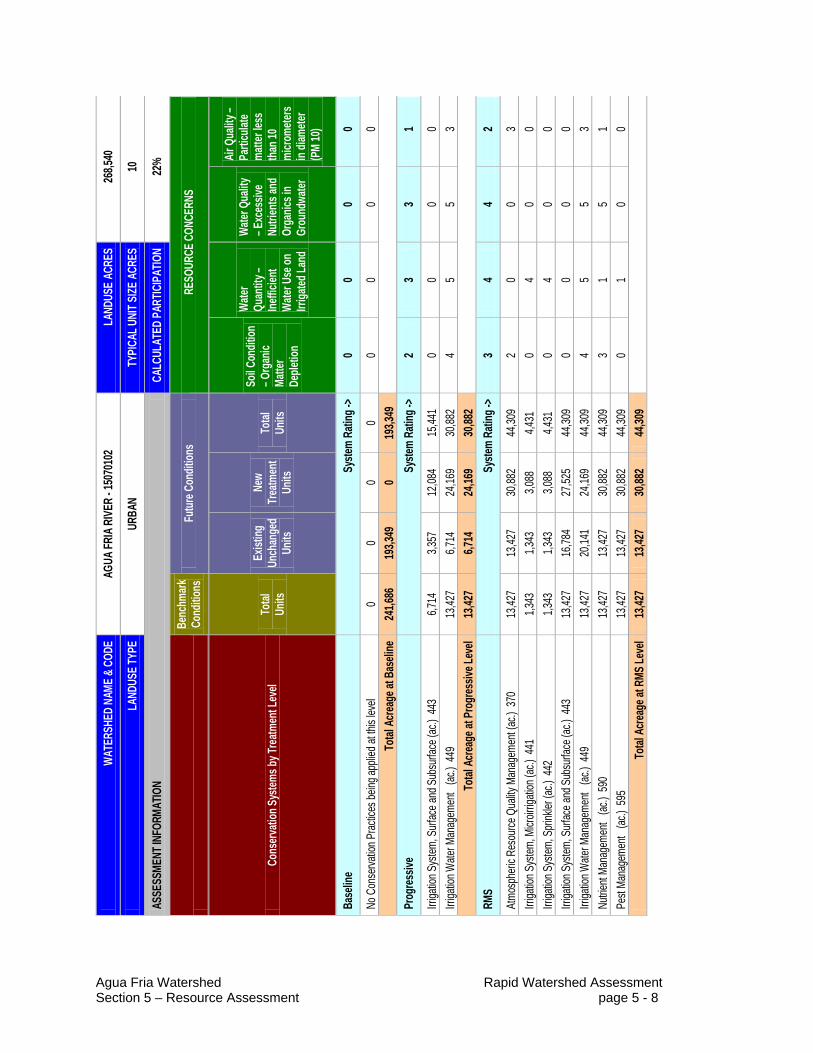
WAT
ERSH
ED N
AME &
COD
E AG
UA FR
IA R
IVER
- 150
7010
2 LA
NDUS
E AC
RES
268,5
40
LAND
USE T
YPE
URBA
N TY
PICAL
UNI
T SIZE
ACR
ES
10
ASSE
SSME
NT IN
FORM
ATIO
N CA
LCUL
ATED
PAR
TICIP
ATIO
N 22
%
Be
nchm
ark
Cond
itions
Fu
ture C
ondit
ions
RESO
URCE
CON
CERN
S
Cons
ervati
on Sy
stems
by Tr
eatm
ent L
evel
Total
Un
its
Exist
ing
Unch
ange
d Un
its
New
Trea
tmen
t Un
its
Total
Un
its
Soil C
ondit
ion
– Org
anic
Matte
r De
pletio
n
Water
Qu
antity
– Ine
fficien
t Wa
ter U
se on
Irr
igated
Land
Water
Qua
lity
– Exc
essiv
e Nu
trien
ts an
d Or
ganic
s in
Grou
ndwa
ter
Air Q
uality
– Pa
rticu
late
matte
r less
tha
n 10
micro
meter
s in
diame
ter
(PM
10)
Base
line
Syste
m Ra
ting -
> 0
0 0
0
No C
onse
rvatio
n Prac
tices
being
appli
ed at
this
level
0 0
0 0
0 0
0 0
Total
Acre
age a
t Bas
eline
24
1,686
19
3,349
0
193,3
49
Pr
ogres
sive
Syste
m Ra
ting -
> 2
3 3
1
Irriga
tion S
ystem
, Surf
ace a
nd S
ubsu
rface
(ac.)
443
6,7
14
3,357
12
,084
15,44
1 0
0 0
0 Irr
igatio
n Wate
r Man
agem
ent
(ac.)
449
13,42
7 6,7
14
24,16
9 30
,882
4 5
5 3
Total
Acre
age a
t Pro
gres
sive L
evel
13,42
7 6,7
14
24,16
9 30
,882
RM
S Sy
stem
Ratin
g ->
3 4
4 2
Atmo
sphe
ric R
esou
rce Q
uality
Man
agem
ent (a
c.) 3
70
13,42
7 13
,427
30,88
2 44
,309
2 0
0 3
Irriga
tion S
ystem
, Micr
oirrig
ation
(ac.)
441
1,3
43
1,343
3,0
88
4,431
0
4 0
0 Irr
igatio
n Sys
tem, S
prink
ler (a
c.) 4
42
1,343
1,3
43
3,088
4,4
31
0 4
0 0
Irriga
tion S
ystem
, Surf
ace a
nd S
ubsu
rface
(ac.)
443
13
,427
16,78
4 27
,525
44,30
9 0
0 0
0 Irr
igatio
n Wate
r Man
agem
ent
(ac.)
449
13,42
7 20
,141
24,16
9 44
,309
4 5
5 3
Nutrie
nt Ma
nage
ment
(ac.)
590
13
,427
13,42
7 30
,882
44,30
9 3
1 5
1 Pe
st Ma
nage
ment
(ac.)
595
13
,427
13,42
7 30
,882
44,30
9 0
1 0
0 To
tal A
creag
e at R
MS Le
vel
13,42
7 13
,427
30,88
2 44
,309
Agua Fria Watershed Rapid Watershed Assessment Section 5 – Resource Assessment page 5 - 8

WAT
ERSH
ED N
AME
& CO
DE
AGUA
FRI
A RI
VER
- 150
7010
2 LA
NDUS
E AC
RES
268,5
40
LAND
USE
TYPE
UR
BAN
TYPI
CAL
UNIT
SIZ
E AC
RES
10
CONS
ERVA
TION
COS
T TA
BLE
CALC
ULAT
ED P
ARTI
CIPA
TION
22
%
FU
TURE
FE
DERA
L PR
IVAT
E
Insta
llatio
nCo
st M
anag
emen
tCo
st - 3
yrs
Tech
nical
Assis
tanc
e In
stalla
tion
Cost
Annu
al O
& M
+ M
gt C
osts
Con
serv
atio
n Sy
stem
s by T
reat
men
t Lev
el Ne
w Tr
eatm
ent
Units
50
%
100%
20
%
Tota
l Pre
sent
Va
lue C
ost
50%
10
0%
Tota
l Pre
sent
Va
lue C
ost
Prog
ress
ive
Irriga
tion
Syste
m, S
urfa
ce a
nd S
ubsu
rface
(ac.)
443
12
,084
$0
$0
$0
$0
$0
$0
$0
Irr
igatio
n Wat
er M
anag
emen
t (a
c.) 4
49
24,1
69
$0
$725
,058
$1
45,0
12
$791
,041
$0
$2
41,6
86
$372
,040
Subt
otal
24,16
9 $0
$7
25,05
8 $1
45,01
2 $7
91,04
1 $0
$2
41,68
6 $3
72,04
0 RM
S
Atm
osph
eric
Reso
urce
Qua
lity M
anag
emen
t (ac
.) 3
70
30,8
82
$0
$555
,878
$1
11,1
76
$606
,465
$0
$1
85,2
93
$285
,231
Irr
igatio
n Sy
stem
, Micr
oirrig
ation
(ac.)
441
3,
088
$2,3
16,1
58
$0
$463
,232
$2
,779
,389
$2
,316
,158
$2
31,6
16
$3,2
91,8
07
Irriga
tion
Syste
m, S
prink
ler (a
c.) 4
42
3,08
8 $2
,624
,979
$0
$5
24,9
96
$3,1
49,9
74
$2,6
24,9
79
$104
,999
$3
,067
,273
Irr
igatio
n Sy
stem
, Sur
face
and
Sub
surfa
ce (a
c.) 4
43
27,5
25
$0
$0
$0
$0
$0
$0
$0
Irriga
tion W
ater
Man
agem
ent
(ac.)
449
24
,169
$0
$7
25,0
58
$145
,012
$7
91,0
41
$0
$241
,686
$3
72,0
40
Nutri
ent M
anag
emen
t (a
c.) 5
90
30,8
82
$0
$926
,463
$1
85,2
93
$1,0
10,7
75
$0
$308
,821
$4
75,3
84
Pest
Man
agem
ent
(ac.)
595
30
,882
$0
$9
26,4
63
$185
,293
$1
,010
,775
$0
$3
08,8
21
$475
,384
Subt
otal
30,88
2 $4
,941,1
36
$3,13
3,862
$1
,615,0
00
$9,34
8,419
$4
,941,1
36
$1,38
1,235
$7
,967,1
19
Gran
d To
tal
55,05
1 $4
,941,1
36
$3,85
8,920
$1
,760,0
11
$10,1
39,46
0 $4
,941,1
36
$1,62
2,921
$8
,339,1
59
Char
t Ref
ers T
o
La
ndus
e Ty
pe
URBA
N
Ca
lculat
ed P
artic
ipatio
n Ra
te
22%
Aver
age P
V Co
sts p
er A
c
Sy
stem
Fe
dera
l Pr
ivate
Pr
og
$32.
73
$15.
39
RMS
$302
.71
$257
.99
Agua Fria Watershed Rapid Watershed Assessment Section 5 – Resource Assessment page 5 - 9

Section 6: References Agua Fria National Monument (http://www.geocities.com/afnmus/Geology.html). Arizona Association of Conservation Districts (http://www.aaocd.org/). Arizona Dept. of Agriculture (http://www.azda.gov/). Arizona Dept. of Environmental Quality Water Quality Monitoring & Assessment (http://azdeq.gov/environ/water/assessment/assess.html). Arizona Department of Environmental Quality. Draft 2006 Status of Ambient Surface
Water Quality in Arizona – Arizona’s Integrated 305(b) Assessment and 303(d) Listing Report. Arizona Department of Environmental Quality, Phoenix, Arizona.
Arizona Department of Environmental Quality, Air Quality Division, http://www.azdeq.gov/environ/air/plan/notmeet.html#phoenix. Arizona Department of Water Resources, Arizona Drought Preparedness Plan,
Background & Impact Assessment Section, Governor’s Drought Task Force, Governor Janet Napolitano, October 8, 2004. http://www.azwater.gov/dwr/content/find_by_program/GDTF/conclusion/Background_Section_100804FINAL.pdf.
Arizona Department of Water Resources, Arizona Water Atlas,
(http://www.azwater.gov/dwr/Content/Find_by_Program/Rural_Programs/content/water_atlas/).
Arizona Department of Water Resources, Upper Agua Fria Basin, http://www.azwater.gov/dwr/Content/Find_by_Program/Rural_Programs/cont ent/map/UppAguFri.htm. Arizona Game & Fish Dept. Heritage Database http://www.azgfd.gov/w_c/edits/species_concern.shtml). Arizona Game & Fish Department, 2006, Desert Tortoise, http://www.gf.state.az.us/w_c/desert_tortoise.shtml0). Arizona State Land Department, Arizona Land Resource Information System (ALRIS),
GIS data layer “Geology,” February 7, 2003. http://www.land.state.az.us/alris/index.html.
Arizona State Land Department, Arizona Land Resource Information System (ALRIS),GIS data layer “Lakes,” February 7, 2003, http://www.land.state.az.us/alris/index.html.
Agua Fria Watershed Rapid Watershed Assessment Section 6 – References page 6 - 1

Arizona State Land Department, Arizona Land Resource Information System (ALRIS), GIS data layer “mines”, February 7, 2002 http://www.land.state.az.us/alris/index.html.
Arizona State Land Department, Arizona Land Resource Information System (ALRIS), GIS data layer “natveg”, June 12, 2003 http://www.land.state.az.us/alris/index.html.
Arizona State Land Department, Arizona Land Resource Information System (ALRIS), GIS data layer “ownership”, February 7, 2002
http://www.land.state.az.us/alris/index.html. Arizona State Land Department, Arizona Land Resource Information System (ALRIS); GIS data layer “Streams”, Arizona, October, 10, 2002 http://www.land.state.az.us/alris/index.html. Barnett, L. R.H. Hawkins, and P. Guertin.2001, Reconnaissance Watershed and
Hydrologic Analysis on the Upper Agua Fria Watershed, University of Arizona, Tucson, Arizona.
Bureau of Land Management Arizona Website (http://www.blm.gov/az/st/en.html). Chronic, Halka. 1983. Roadside Geology of Arizona. Mountain Press Publishing
Company, Montana. Climate Assessment for the Southwest (CLIMAS) website
(www.ispe.arizona.edu/climas), information on Arizona's drought status. ESRI Data Products, http://arcdata.esri.com/data/tiger2000/tiger_download.cfm
Census 2000. October 17, 2003. GeoLytics, Inc. 1998. Census 1990. Census CD + Maps. Release 3.0. Litten, G.R., 1981, Maps showing ground-water conditions in the Agua Fria area,
Yavapai and Maricopa Counties, Arizona – 1979: U.S. Geological Survey Open-File Report 81-804.
National Agricultural Statistics Service (http://www.nass.usda.gov/). Natural Resources Conservation Service (NRCS), 2007, Table generated by NRCS
Phoenix Office. Natural Resources Conservation Service (NRCS), Agua Fria River Watershed Soil Data and Maps, http://websoilsurvey.nrcs.usda.gov.
Agua Fria Watershed Rapid Watershed Assessment Section 6 – References page 6 - 2

Natural Resources Conservation Service (NRCS) Website 2006, Technical Guide – New Mexico http://www.nm.nrcs.usda.gov/technical/fotg/transmittals/fotg-1.doc
Natural Resources Conservation Service Arizona Website (http://www.az.nrcs.usda.gov/). Natural Resources Conservation Service Arizona GIS Webpage (http://www.az.nrcs.usda.gov/technical/gis/index.html). Natural Resources Conservation Service Web Soil Survey (http://websoilsurvey.nrcs.usda.gov/app/). Natural Resources Conservation Service Water & Climate Center (http://www.wcc.nrcs.usda.gov/). Noon B.R. and K.S. McKelvey 1992. Stability Properties of the Spotted Owl
Metapopulation in Southern California. Pages 187-206 in J. Verner et al., technical editors. The California Spotted Owl: A Technical Assessment of its current status. US Forest Service General Technical Report PSW – 133.
Southern Arizona Data Services Program, GIS data layer “Arizona Gap Analysis Project
Vegetation Map”, University of Arizona, 2004, http://sdrsnet.srnr.arizona.edu/index.php, originated by Arizona Game & Fish Department, Habitat Branch, 1993, this dataset was digitized from the August 1980 David E. Brown & Charles H. Lowe 1:1,000,000 scale, 'Biotic Communities of the Southwest'.
Southwest Regional GAP Project (http://fws-nmcfwru.nmsu.edu/swregap/. Theobald, D. 2005. Landscape patterns of exurban growth in the USA from 1980 to
2020. Ecology and Society 10(1): 32. [online] URL: http://www.ecology and society.org/vol10/iss1/art32/.
United States Bureau of Land Management, Draft Agua Fria National Monument/Bradshaw-Harquahala Draft Resource Management
Plan/Draft Environmental Impact Statement (DRMP/DFEIS) at https://www.blm.gov/eplanning/az_pn/builds/build217/index.htm.
United States Department of Agriculture, 2004, Arizona Bark Beetle Epidemics Fact Sheet and Information Bulletin, Southwestern Region, USDA Forest Service. United States Environmental Protection Agency, Surf Your Watershed (http://www.epa.gov/surf/). United States Environmental Protection Agency, Air Quality Trends,
http://epa.gov/air/aritrends/aqtrnd95/pm10.html.
Agua Fria Watershed Rapid Watershed Assessment Section 6 – References page 6 - 3

United States Fish & Wildlife Service. 2004. Mexican Spotted Owl, http://www.fws.gov/ifw2es/Documents/R2ES/MSO_Recovery_Plan.pdf.
United States Fish & Wildlife Service, Threatened and Endangered Species Listed for
Arizona, http://ecos.fws.gov. United States Fish & Wildlife Service Arizona Ecological Services
(http://www.fws.gov/southwest/es/arizona/). United States Forest Service, Forest Service, Fact Sheet “Arizona Bark Beetle
Epidemics,” produced by Forest Health Staff, Southwestern Region, USDA Forest Service, January 2004, http://www.fs.fed.us/r3/prescott/forest-health/index.shtml.
United States Forest Service (USFS), Terrestrial Ecosystem Surveys. Surveys are
available for National Forest Lands within the watershed. United States Forest Service Southwestern Region (http://www.fs.fed.us/r3/). United States Geological Survey, NLCD Land Cover Class Definitions, http://landcover.usgs.gov/classes.php. United States Geological Survey, April 8, 2003, derived from DEM,
http://edc.usgs.gov/geodata/. United States Geological Survey website, National Water Information System
http://waterdata.usgs.gov/nwis/. Western Regional Climate Center (WRCC), Temperature data. July 15, 2004.
http://www.wrcc.dri.edu/summary/climsmaz.html. Wilson, R. P. 1988. Water Resources of the Northern Part of the Agua Fria Area
Yavapai County, Arizona. Prepared by the U.S. Geological Survey. Arizona Department of Water Resources Bulletin 5.
Yavapai County. 1986. Black Canyon City Community Plan Update.
Agua Fria Watershed Rapid Watershed Assessment Section 6 – References page 6 - 4

GLOSSARY Drainage Basin A region or area bounded by a topographic divide and occupied by a
drainage system, also known as a watershed. Drought There is no universally accepted quantitative definition of drought.
Generally, the term is applied to periods of less than average precipitation over a certain period of time; nature's failure to fulfill the water wants and needs of man.
Flood A flood is an overflow or inundation that comes from a river or other body of water and causes or threatens damage. It can be any relatively high streamflow overtopping the natural or artificial banks in any reach of a stream. It is also a relatively high flow as measured by either gage height or discharge quantity.
Ground Water The supply of fresh and saline water found beneath the Earth's surface which is often used for supplying wells and springs. Because ground water is a major source of drinking water, there is a growing concern over areas where leaching agricultural or industrial pollutants are contaminating ground water.
Soil Moisture Regimes
Aridic is a soil moisture regime that has no water available for plants for more than half the cumulative time that the soil temperature at 50 cm (20 in.) below the surface is >5°C (41° F.), and has no period as long as 90 consecutive days when there is water for plants while the soil temperature at 50 cm (20 in.) is continuously >8°C (46°F.). Udic is a soil moisture regime that is neither dry for as long as 90 cumulative days nor for as long as 60 consecutive days in the 90 days following the summer solstice at periods when the soil temperature at 50 cm (20 in.) below the surface is above 5°C (41° F.). Ustic is a soil moisture regime that is intermediate between the aridic and udic regimes and common in temperate subhumid or semiarid regions, or in tropical and subtropical regions with a monsoon climate. A limited amount of water is available for plants but occurs at times when the soil temperature is optimum for plant growth.
Soil Orders
A soil order is a group of soils in the broadest category. In the current USDA classification scheme there are 12 orders, differentiated by the presence or absence of diagnostic horizons.
Soil Temperature
Regimes
Hyperthermic is a soil temperature regime that has mean annual soil temperatures of 22°C (72°F.) or more and >5°C (41° F.) difference between mean summer and mean winter soil temperatures at 50 cm (20 in.) below the surface.
Agua Fria Watershed Rapid Watershed Assessment Section 7 – Glossary page 7 - 1

Thermic is a soil temperature regime that has mean annual soil temperatures of 15°C (59°F.) or more but <22°C (72°F.), and >5°C (41° F.) difference between mean summer and mean winter soil temperatures at 50 cm (20 in.) below the surface. Mesic A soil temperature regime that has mean annual soil temperatures of 8°C (46°F.) or more but <15°C (59°F.), and >5°C (41° F.) difference between mean summer and mean winter soil temperatures at 50 cm (20 in.) below the surface.
Surface Water Water on the earth's surface. Lakes, bays, ponds, impounding reservoirs, springs, rivers, streams, creeks, estuaries, wetlands, marshes, inlets, canals, and all other bodies of surface water, natural or artificial, inland or coastal, fresh or salt, navigable or non-navigable, and including the beds and banks of all watercourses and bodies of surface water, that are wholly or partially inside or bordering the state or subject to the jurisdiction of the state; except that waters in treatment systems which are authorized by state or federal law, regulation, or permit, and which are created for the purpose of waste treatment.
Watershed The area of land that contributes surface run-off to a given point in a drainage system and delineated by topographic divides.
Agua Fria Watershed Rapid Watershed Assessment Section 7 – Glossary page 7 - 2
Acknowledgements The following University of Arizona staff and students contributed to the production of this report. Terry Sprouse Erin Westfall Lainie Levick Melisa Kennedy Ivan Parra Myrtho Joseph Dilruba Yeasmin Ari Posner Mickey Reed NRCS Field Office, Area Office and State Office staff contributed to the development of this assessment.
Agua Fria Watershed Rapid Watershed Assessment Section 7 – Glossary page 7 - 3