Agritourism in Wisconsin from the Consumer Perspective
15
Agritourism in Wisconsin from the Consumer Perspective Report from the 2012 Wisconsin Agritourism Survey Staff Paper Laura Brown and Colette Hershey University of Wisconsin‐ Extension Center for Community & Economic Development June 25, 2012
Transcript of Agritourism in Wisconsin from the Consumer Perspective
Agritourism in Wisconsin from the
Consumer Perspective
Report from the 2012 Wisconsin Agritourism Survey
Staff Paper Laura Brown and Colette Hershey University of Wisconsin‐ Extension
Center for Community & Economic Development June 25, 2012
2
Acknowledgements
The writers of this report would like to thank UW‐Extension colleagues Cara Carper, Rose Skora, Kathleen Haas, Jerry Hembd, Todd Johnson, Peg Reedy, Bill Ryan, and Bryan Wood as well as community partners Patrick Reinsma form the Wisconsin Department of Tourism and Anna Maenner from the Wisconsin Agricultural Tourism Association for providing feedback on the survey and assisting with dissemination. This survey would not have been possible without the gracious support from the agritourism business owners around the state who helped to disseminate this survey to their customers.
This report was developed by Laura Brown, Community Development Specialist, UW‐Extension Center for Community & Economic Development and Colette Hershey, Program Assistant Center for Community & Economic Development.
Executive Summary
This study was developed in response to a variety of inquiries that demonstrate increasing interest in agritourism development in Wisconsin. In 2011, the Wisconsin Agritourism Association (WATA) contacted UW‐Extension to request an analysis of data collected through an existing survey of over 1500 agritourism customers participating in food based tourism. While WATA businesses had conducted this short survey for several years, no analysis had been conducted of the aggregated data. The analysis was performed by UW‐Extension the Center for Community & Economic Development and presented at the Wisconsin Agritourism Association annual meeting in 2011. In response, participating businesses in WATA sought more in depth information about their customers beyond the questions asked in the initial survey. At the same time many communities around Wisconsin were beginning to consider support for agritourism as a strategy for rural economic development and inquired about available data and resources to support these efforts. While there is some existing national data regarding the customer preferences of food‐based agritourism customers1, this data is aggregated across the states and therefore may not accurately reflect the characteristics of Wisconsin’s agritourism customer base. Data is also proprietary and therefore not accessible to community practitioners. The following study was developed in response to these inquiries to address a gap in information about Wisconsin’s food based agritourism customers.
The 2012 Wisconsin Agritourism Study was conducted as a partnership between the Wisconsin Agricultural Tourism Association (WATA), the University of Wisconsin‐Extension Center for Community and Economic Development, and UW‐Extension Cooperative Extension county offices. Based on the research needs cited above, the study was designed to provide participating agritourism businesses with information on customer origin, motivations, and preferences to improve marketing; to estimate consumer expenditure potential and economic impact of the food‐based agritourism industry in Wisconsin; and to determine the relative size and composition of food‐based agritourism in Wisconsin.
To reduce measurement error (error caused by poorly worded questions or other aspects of questionnaire construction), the survey tool was reviewed by a group of UW‐Extension colleagues and agritourism business owners involved in the Wisconsin Agricultural Tourism Association. The survey structure and several of the questions were based on tested consumer surveys used in Colorado and Iowa. In addition, the tool was tested for reliability by colleagues on the review team and a group of citizens not affiliated with tourism.
The survey was an internet‐based questionnaire and was disseminated via a web link. This link was sent to agritourism customers directly, or forwarded by businesses that volunteered to send it to their customers. During the 30‐day study period, the survey link was sent to an estimated 16,827 customers of agritourism
1 International Culinary Tourism Association http://www.culinarytourism.org/
3
businesses in Wisconsin. This number is approximate since many of the 16 businesses that voluntarily forwarded the link via email or social media could not accurately estimate how many people received it through these means. The survey link was also emailed directly to customers who visited an agritourism business on the Wisconsin Autumn Harvest Trail in 2010 and provided an email address. The survey received an exemption for human subjects review by the Human Subjects Review Board of the University of Wisconsin.
Given the limits of the survey design, coverage or non‐response error may exist in the data. Because the survey was accessed via the internet, the sample includes data from those agritourists that use the internet and were willing to supply the agritourism business with their email address. Whether this group differs significantly from the broader population of agritourists or tourists is unknown. While mixed‐mode surveys have been demonstrated to reduce non‐response error, a mixed‐mode survey was not possible given budget constraints of the project.
The survey received 827 responses, for a response rate of approximately 4.9%. Response rates were also calculated for each of the participating businesses. The rates varied significantly by business, ranging from 2% to 34%.
This report includes an analysis of the data using descriptive statistics, provides suggestions for application of this research in business and tourism development planning for the state of Wisconsin, and suggests areas for further research and inquiry.
Highlights from the study include the following:
When compared to Wisconsin data from the US Census, Wisconsin’s agritourists (median age of 52 years) are older than the average Wisconsin resident (median age 38.5 years). Agritourists in Wisconsin also have higher levels of educational attainment and higher household incomes that the average Wisconsin resident.
78% of Wisconsin’s agritourists have some understanding of agriculture.
Over 50% of Wisconsin’s agritourists participated in the following activities at least once in the past year: visit to farmers markets, local or seasonal food festivals, farm stand, winemaking (tasting or tours), visit to a creamery (for ice cream or bakery), visit to an orchard, visit to an animal demo or petting zoo, participation in community supported agriculture, and pick‐your‐own fruits or vegetables.
63% participated in farmers markets four or more times in the past year.
Less than 10% reported having participated in straw bale mazes, fishing for a fee, farm‐based lodging, food incubator tours, barn dances, hunting for a fee, farm vacations, and other activities (including bicycling, farm conferences, and cider tastings) at least once in the past year.
For 88% of respondents, supporting local farmers/businesses was a somewhat or very important reason for participating in an agritourism activity.
The three most important amenities for agritourists were on‐site restrooms, adequate parking, and convenient location.
Respondents found recommendations from friends, personal web searches, and business websites to be the most important tools in planning their tourism visit.
Median spending during respondents’ last trip involving agritourism was $137.50.
Of those respondents who reported spending any money during their last agritourism visit, 93.8% spent on food or drink items produced by an agritourism business
Respondents are most likely to participate in agritourism activities in the Fall (63%) or Summer (56%) and least likely to participate in Winter (8%).
The greatest percentage of respondents participate in agritourism activities with their spouse or partner, with family, or friends. Participants were least likely to visit with a school, church, or tour group.
4
Suggested recommendations include (described further in the Conclusions section of this report):
Promote agritourism to baby boomers, school, church, and tour groups
Support the development of business amenities including ability to accept credit cards
Encourage collaboration between businesses and cross‐promotion between farm enterprises
Capitalize on agritourists’ willingness to spend on food items
Help agritourists tell their stories
Conduct additional agritourism research to include economic impact analysis, trade area analysis for agritourism customers, and research exploring the relationship between agritourism and culinary tourism.
Background For the purposes of this study agritourism is defined as “visiting a working farm or any agricultural, horticultural or agribusiness operation to enjoy, be educated or be involved in activities happening there.” Agritourism has seen a rise in popularity in the United States over the past decade from both farmers and tourists.
Agritourism includes a number of activities that take place on farms including hayrides, pumpkin patches, u‐pick operations, wine and brewery tours, and food‐based activities (often called culinary tourism.) According to Burdoc (2009), agritourism has four main features:
combines elements of the tourism and agriculture industries,
attracts members of the public,
designed to increase farm revenue
provides recreation, entertainment, or an educational component to its visitors
A limited scope literature review was conducted to provide back ground information for this study. The existing literature on agritourism includes a significant body of research from Europe and Canada and limited but growing number of studies from the United States (Bernardo, Velntin, & Leatherman 2004). This includes literature regarding both the supply side (farmer motivations for agritourism, farm diversification), demand side (consumer preferences, recreational trends), as well as community development and economic implications. Previous reviews of literature have noted that while there is a significant body of research regarding motivations of farmers to start agritourism, little exists regarding the consumer demand for agritourism, particularly at the national level (Carpio et al 2007). Several states, including Iowa, Colorado, and Maine, have conducted similar state studies that served as references for the Wisconsin study.
For many farmers agritourism serves as a form of farm diversification that generates additional income, allows for expanded operations, creates opportunities for family employees to remain in the business, meets social, educational or ethical goals of the business, and maximizes farm production by utilizing the farm as an amenity (Tew and Barbieri 2011). Interest in agritourism as a diversification strategy may be spurred by trends in agricultural production that depress commodity income, forcing farmers to look elsewhere for income (Bernardo et al 2004). According to data from the US Agricultural Census while the number of overall farms participating in agritourism dropped from 2002 to 2007 both in the United States (‐16.7) and in Wisconsin (‐9.6), income from agritourism grew by 180% nationwide and 260% in Wisconsin in that period. Although the traditional orientation of farmers toward commodity production may serve as a barrier to farm diversification into tourism enterprises (Che 2006) both the US and Wisconsin have seen large increases in agritourism enterprises and agritourism income on farms with annual receipts of $10,000 or more but declines in numbers of farms and income on farms grossing under $10,000 annually. This indicates that agritourism, and agritourism profitability, is growing particularly on larger scale farming operations.
5
Agritourism is increasingly being pursued by small rural communities as a small business and economic revitalization strategy (Nasers 2009, Wilson et al 2001, Dane 2001, Wicks & Merrit 2003). Community goals of agritourism development may be to increase revenue for local businesses, stimulate infrastructure upgrades, or diversify the economy (Bernardo et al 2004). Tourism may be perceived as more accessible than other economic development strategies since it involves established industries, requires little start‐up capital, and takes advantage of existing natural amenities common in rural areas. While tourism in rural areas is generally perceived as an overall benefit, drawbacks may include the possibility that jobs generated are often not full‐time or well‐paying (Wilson et al 2001), increased demands on infrastructure, and the reliance of tourism spending on discretionary income.
From the demand (consumer) perspective, interest in agritourism builds on demographic changes in the United States including an aging population with more leisure time and money, changes in overall travel patterns from longer week long trips to shorter weekend excursions, and growing interest in local agricultural products. US Census data shows that the number of farms that sold agricultural products directly to consumers for human consumption increased from 2002 to 2007 by 17% nationwide and by 26 % in Wisconsin. Agritourism provides an opportunity for outdoor recreation and satisfies increasing interest in experiencing farming and food production, often through locally produced foods (Sims 2009). Consumers may be attracted to agritourism for a variety of reasons including experiencing the rural landscape, purchasing fresh food products that may not be available elsewhere, or providing recreational activities that allow parents to teach children about food production (Che et al 2007).
According to a study involving data from the 2000 National Survey on Recreation and the Environment, tourists who placed a high value on the rural landscape took 1.9 more trips to farm‐based tourism operations than those who did not. Those tourists generated a consumer surplus of $174.82 per trip and made an average of 10.3 trips to agritourism operations per year. The average farm visitor was highly educated, had a higher‐than‐average income, and came with family members, especially if there were children under the age of six. In 2000, there were an estimated 62 million agritourists in the United States. A figure derived from the number of tourists, consumer surplus and average amount of trips estimates that $21.4 billion was generated from agritourism in 2000 (Carpio et al 2007). As interest in agritourism in the United States continues to grow, ongoing research and analysis of study results such as those detailed in this paper are essential to inform both businesses and community level decision making.

6
Survey Results
The data collected through the 2012 Wisconsin Agritourism Survey was analyzed using descriptive statistics. Additional statistical analysis will be conducted to explore ongoing research questions.
Demographics
Demographic data collected from the agritourism survey was compared to demographic data for the state of Wisconsin collected by the U.S. Census American Community Survey. The overwhelming majority of those who responded to the agritourism survey, 72%, were female, and 28% were male. The median age was 52 years, but males who responded tended to be older. The median age for female respondents was 50 and the median age for male respondents was 57. When compared to the data for the state of Wisconsin, Wisconsin’s agritourists, with a median age of 52 years, are older than the average Wisconsin resident, whose median age is 38.5 years.
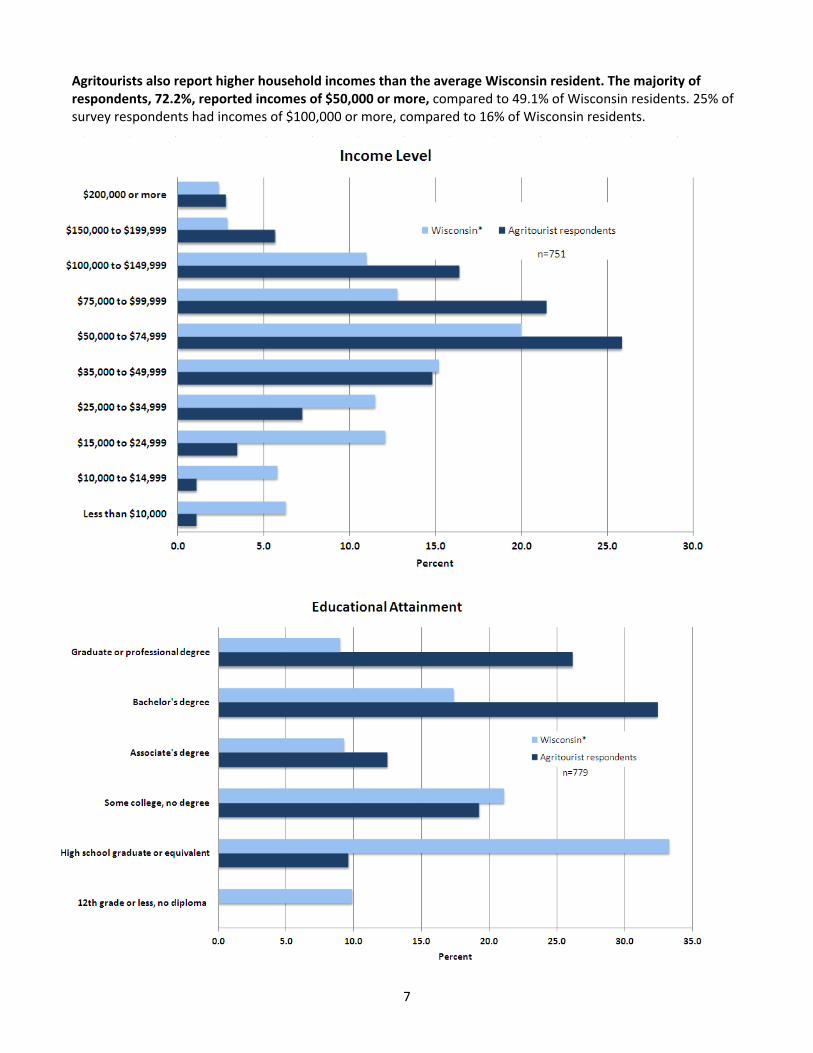
Agritourists in Wisconsin are more educated than the average Wisconsin resident. 58.6% of respondents reported having a bachelor’s, graduate, or professional degree, while 26.3% of Wisconsin residents have a bachelor’s degree or higher.
*
7
Agritourists also report higher household incomes than the average Wisconsin resident. The majority of respondents, 72.2%, reported incomes of $50,000 or more, compared to 49.1% of Wisconsin residents. 25% of survey respondents had incomes of $100,000 or more, compared to 16% of Wisconsin residents.
8
The survey also inquired about household composition. The largest percentage of respondents were couples with children over 18 years of age (36%). Retired couples and singles with children under 6 years of age comprised the smallest percentage of respondents in the sample.
Agritourist Characteristics, Motivations, and Preferences
To better understand customer tastes and preferences, the survey inquired about respondents’ general understanding of agriculture as well as their participation and planned participation in agritourism activities. In planning for this survey, businesses were particularly interested in using such information to explore cross‐marketing opportunities among customers of various enterprises within their business. The questions as presented in the survey appear below in italics.
Please select the statement which best represents your understanding of agriculture. (Please check one.) n=809
The overwhelming majority of Wisconsin’s agritourists, 79.5%, reported having “some understanding” of agriculture. 16.3% reported extensive understanding and only 4.2% reported no understanding of agriculture.
How many times did you participate in the following agritourism activities in the past year? (0, 1, 2, 3, 4 or more) (Sample size varied by activity)
At least 50% of Wisconsin’s agritourists participated in the following activities at least once in the past year: farmers markets, local or seasonal food festival; farm stand; winemaking, tasting, or tours; creamery (for ice cream) or bakery visit; orchard visit; animal demo or petting zoo; community‐supported agriculture; and pick‐your‐own fruits or vegetables. The majority of respondents, 63%, participated in farmers markets four or more times in the past year.
For all but one of the activities most common among Wisconsin’s agritourists, most respondents who participated in each activity did so multiple times in the past year. For other agritourism activities, respondents who participated tended to do so only once in the past year. These activities include visits to a pumpkin patch; corn maze; animal demonstrations or petting zoos; local or seasonal food festivals; cheese‐making, tasting, or tours; cut‐your‐own tree/greens; and farm tours. This frequency is logical given that some of these activities are seasonal events, such as cutting a holiday tree or picking a pumpkin. It also suggests there is potential to generate repeat visits for those activities that are, at this point, primarily one‐time events.
Less than 10% of respondents reported having participated in straw bale mazes, fishing for a fee, farm‐based lodging, food incubator tours, barn dances, hunting for a fee, farm vacations, and other activities (including bicycling, farm conferences, and cider tastings) at least once in the past year.
Additional activities described in the comments section included farm‐based activities such as mushroom hunting, soils explorations, farmer gatherings, weddings, hay slides, and hunting for free. Many respondents also described experiences they have had on land or farms that they own.
Which agritourism activities do you plan to participate in the next year? (Mark all that apply.)
The activities that respondents plan to participate in during the coming year were very similar to activities that were most frequented during the previous year. The majority of respondents plan to participate in farmers markets; local or seasonal food festivals; winemaking, tasting, or tours; farm stands; orchards (not pick‐your‐own); pick‐your‐own fruits or vegetables; and creamery (ice cream) or bakery visits.
9
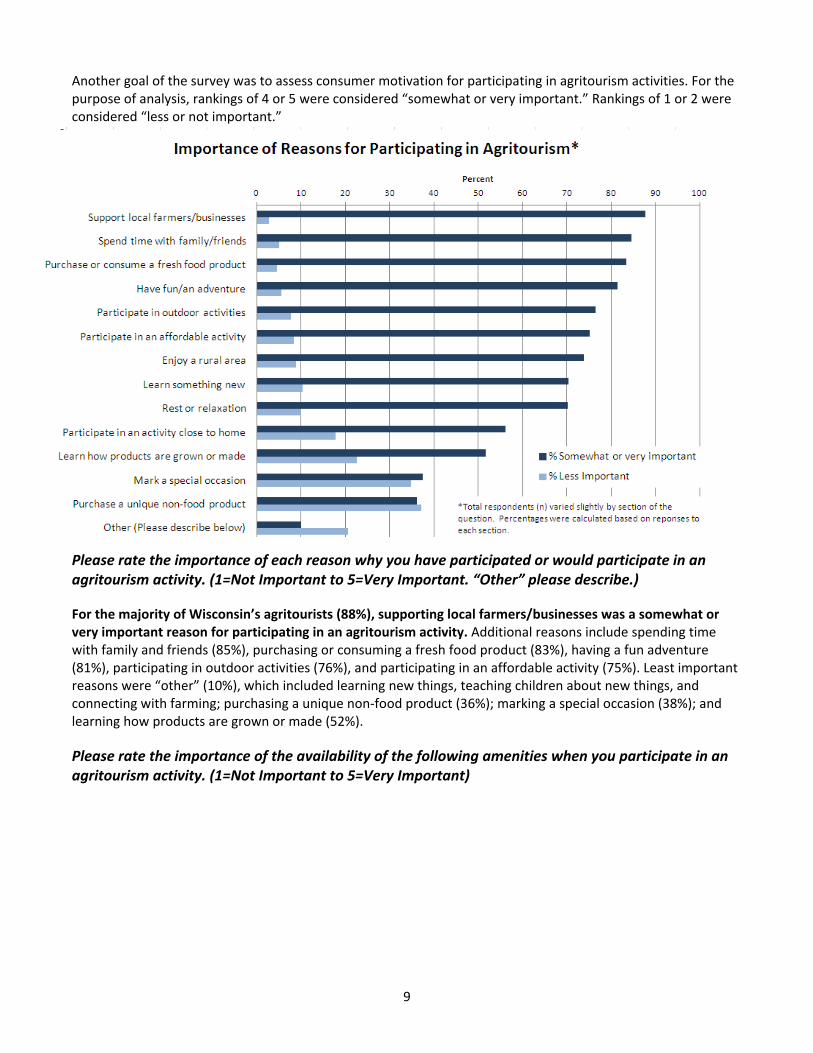
Another goal of the survey was to assess consumer motivation for participating in agritourism activities. For the purpose of analysis, rankings of 4 or 5 were considered “somewhat or very important.” Rankings of 1 or 2 were considered “less or not important.”
Please rate the importance of each reason why you have participated or would participate in an agritourism activity. (1=Not Important to 5=Very Important. “Other” please describe.)
For the majority of Wisconsin’s agritourists (88%), supporting local farmers/businesses was a somewhat or very important reason for participating in an agritourism activity. Additional reasons include spending time with family and friends (85%), purchasing or consuming a fresh food product (83%), having a fun adventure (81%), participating in outdoor activities (76%), and participating in an affordable activity (75%). Least important reasons were “other” (10%), which included learning new things, teaching children about new things, and connecting with farming; purchasing a unique non‐food product (36%); marking a special occasion (38%); and learning how products are grown or made (52%).
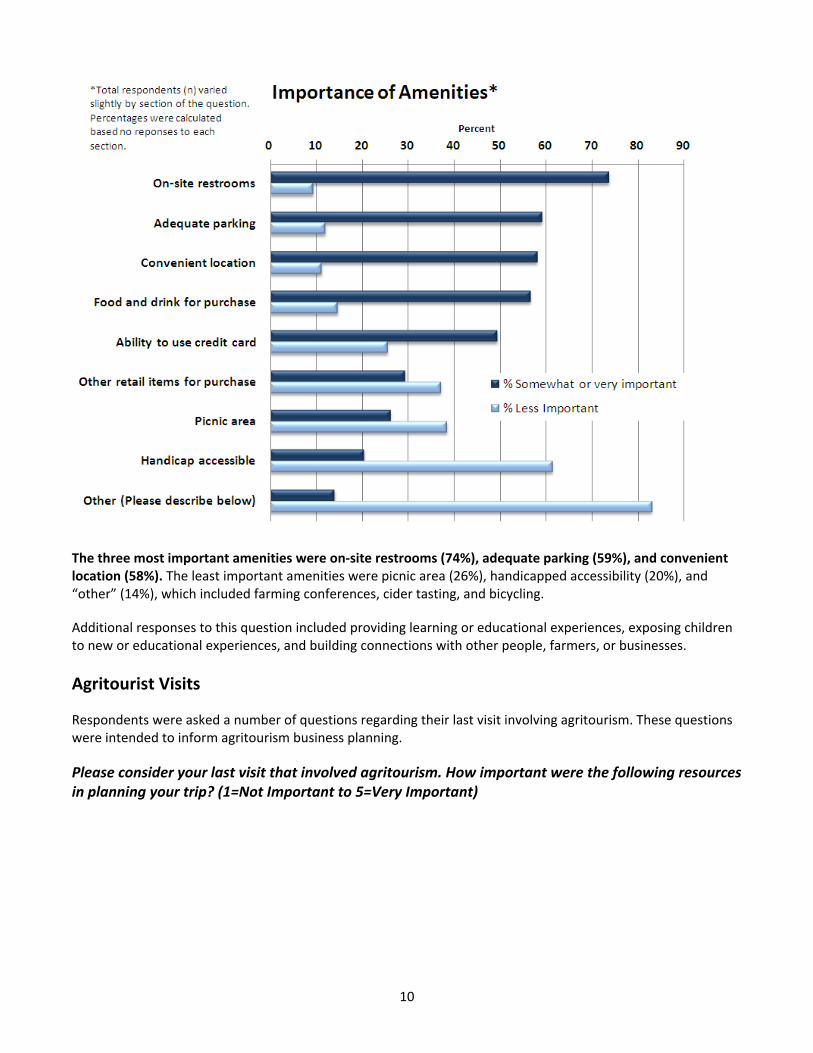
Please rate the importance of the availability of the following amenities when you participate in an agritourism activity. (1=Not Important to 5=Very Important)
10
The three most important amenities were on‐site restrooms (74%), adequate parking (59%), and convenient location (58%). The least important amenities were picnic area (26%), handicapped accessibility (20%), and “other” (14%), which included farming conferences, cider tasting, and bicycling.
Additional responses to this question included providing learning or educational experiences, exposing children to new or educational experiences, and building connections with other people, farmers, or businesses.
Agritourist Visits
Respondents were asked a number of questions regarding their last visit involving agritourism. These questions were intended to inform agritourism business planning.
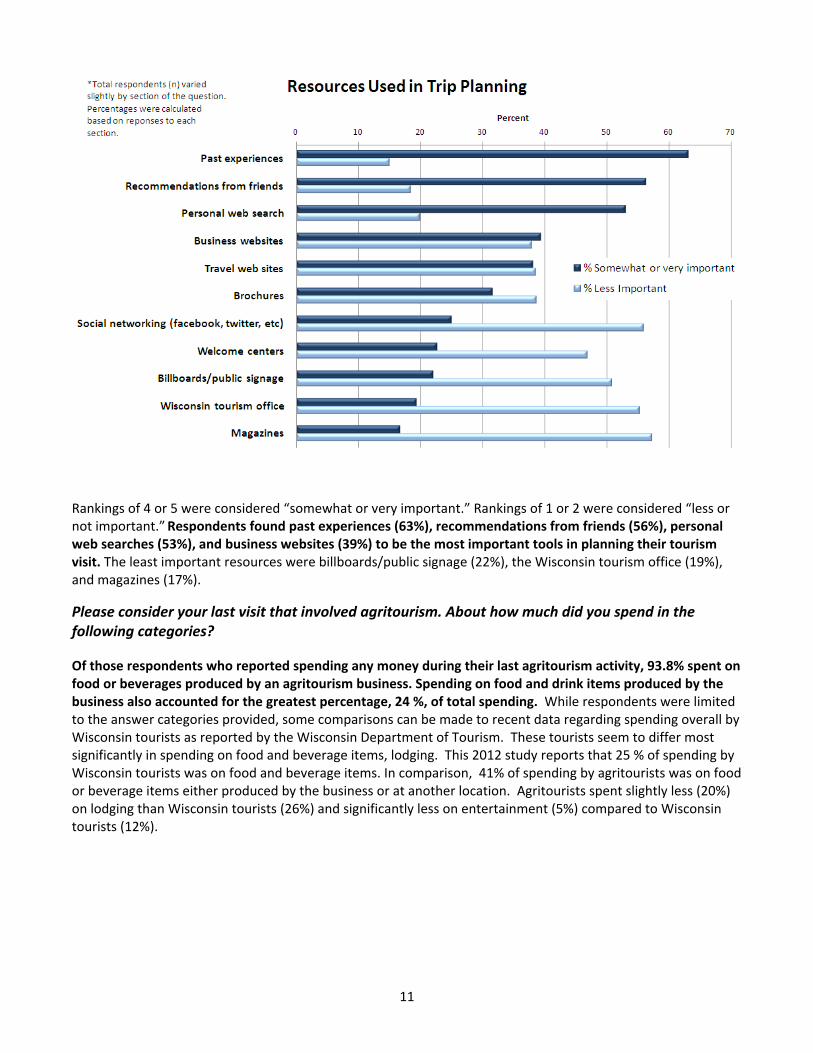
Please consider your last visit that involved agritourism. How important were the following resources in planning your trip? (1=Not Important to 5=Very Important)
11
Rankings of 4 or 5 were considered “somewhat or very important.” Rankings of 1 or 2 were considered “less or not important.” Respondents found past experiences (63%), recommendations from friends (56%), personal web searches (53%), and business websites (39%) to be the most important tools in planning their tourism visit. The least important resources were billboards/public signage (22%), the Wisconsin tourism office (19%), and magazines (17%).
Please consider your last visit that involved agritourism. About how much did you spend in the following categories?
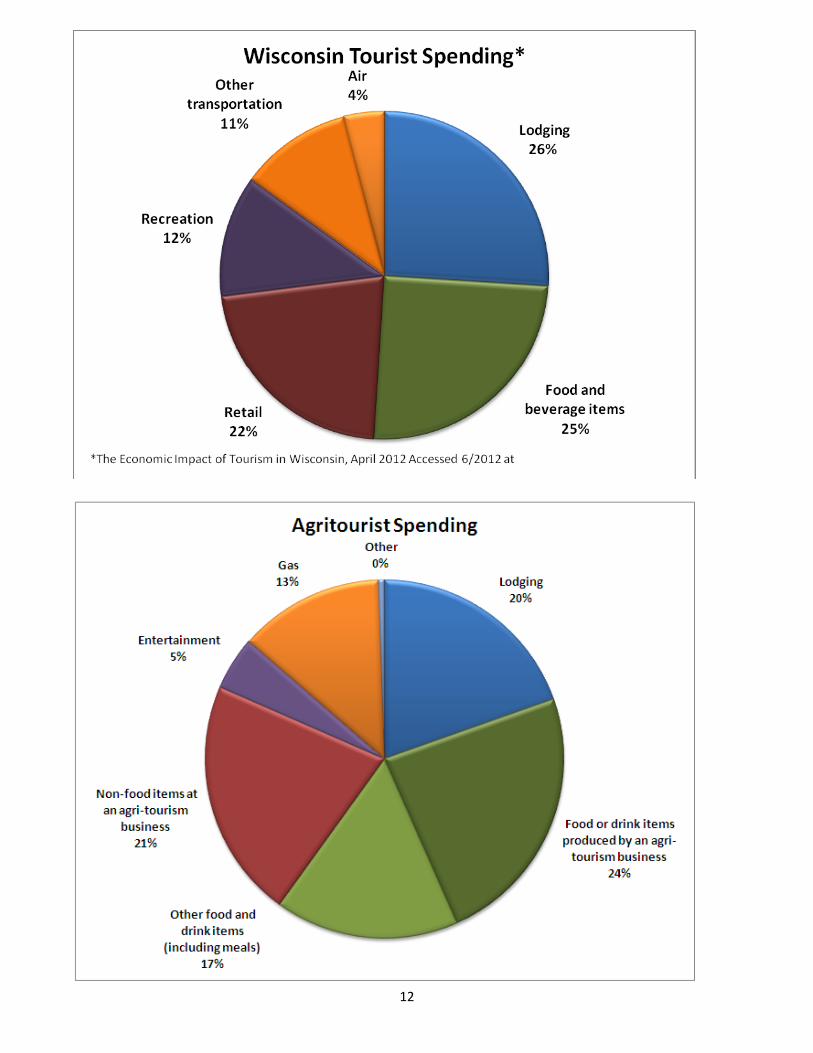
Of those respondents who reported spending any money during their last agritourism activity, 93.8% spent on food or beverages produced by an agritourism business. Spending on food and drink items produced by the business also accounted for the greatest percentage, 24 %, of total spending. While respondents were limited to the answer categories provided, some comparisons can be made to recent data regarding spending overall by Wisconsin tourists as reported by the Wisconsin Department of Tourism. These tourists seem to differ most significantly in spending on food and beverage items, lodging. This 2012 study reports that 25 % of spending by Wisconsin tourists was on food and beverage items. In comparison, 41% of spending by agritourists was on food or beverage items either produced by the business or at another location. Agritourists spent slightly less (20%) on lodging than Wisconsin tourists (26%) and significantly less on entertainment (5%) compared to Wisconsin tourists (12%).
12

13
Median spending during respondents’ last trip involving agritourism was $137.50. The was calculated as spending per respondent, not per person in the party. Average spending per respondent in all categories was $443.50 but since there were some significant outliers, the median is likely to better reflect the true average.
Median spending per respondent varied by category: lodging ($87), food and beverages produced by an agritourism business ($105), items other than food and beverages produced by an agritourism business ($96), entertainment ($21), and other ($2).
Please indicate the season you are most likely to visit a farm or participate in an agritourism activity. (Rank from 1=Most Likely to 4=Least Likely) Respondents were most likely to participate in agritourism activities in the fall (63%) or summer (56%) and least likely to participate in winter (8%).
Please indicate with whom you would be most likely to participate in an agritourism activity. (Rank from 1=Most Likely to 4=Least Likely)
The greatest percentage of respondents participate in agritourism activities with their spouse or partner (74%), with family (70%), or with friends (48%). Participants were least likely to visit with a school, church, or tour group.
Please consider your last visit that involved agritourism. What would have improved your agritourism experience?
280 customers provided individual feedback about their experience. When asked what would make their agritourism visit better, the most common answer, noted by 30% of respondents, was that they enjoyed their experience and would change nothing. Poor weather accounted for 14% of customer’s dissatisfaction with their tourism experience. Gas prices and long distances to the location were other, minor factors noted but outside the control of businesses.
Fifteen percent (15%) of respondents requested either additional products for purchase on the farm (“more” products or locally produced items) or for additional opportunities for learning opportunities or information. Several expressed a desire for knowledgeable and friendly workers on the premises. Many respondents sought additional attractions in the area, suggesting the potential for cooperation between local businesses as an effort to attract and retain customers.
Seven percent (7%) of respondents suggested that the quality of amenities at the establishment would have improved their experience including comments about bathrooms to more opportunities for children’s’ activities.
Other suggestions that appeared less often in comments included better parking, more time to enjoy premises, better signage (at location and online) of business hours, crowding, and high prices.
14
Conclusions, Implications and Recommendations for Further Research
This report includes summary statistics for data collected from the 2012 Wisconsin Agritourism Survey. The study was designed to provide participating agritourism businesses with information on customer origin, motivations, and preferences to improve marketing; to estimate consumer expenditure potential and economic impact of the food‐based agritourism industry in Wisconsin; and to determine the relative size and composition of food‐based agritourism in Wisconsin. This report largely addresses the analysis related to consumer origins, motivations and preferences used to improve individual business marketing, however, the results may be used to inform state and local tourism development in considering the following:
Promote agritourism to baby boomers, school, church, and tour groups It is notable that while the average age of agritourists is higher than the Wisconsin average, agritourists were least likely to participate through school, church, and tour groups.
Support the development of business amenities that will increase participation and spending by all age groups including bathrooms, parking facilities, and ability to accept credit cards.
Encourage collaboration between businesses and cross‐promotion between farm enterprises Businesses and communities should take advantage of agroitourists interest in farmers markets and consider ways to cross promote these opportunities.
Capitalize on agritourists willingness to spend on food items Agritourists spend more on food than the average tourist. Businesses and communities could build on this interest in food purchasing through cross marketing or regional events.
Help agritourists tell their stories It is clear from the data that Wisconsin’s agritourists are happy with their experiences. These tourists also rely significantly on recommendations from friends, experiences, and word of mouth (informal marketing) in planning their trip. Tourism promoters and developers should find ways to help these visitors tell their stories to other potential visitors.
The data collected from this survey is extensive. Given that relatively little research has been conducted on agritourism demand both in Wisconsin and nationwide, the data may be of further value in exploring additional areas of inquiry and research. Based on early discussions with tourism businesses and practitioners regarding the results of this survey, there is significant interest in the state in estimates of the economic impact of agritourism. The consumer spending data from this survey may be used to develop these estimations. This would be particularly useful if agritourism expenditures per person or household could be compared to per person expenditure estimates for tourists in the state of Wisconsin generally. Such comparisons’ may be possible using proprietary data but this data was not a available from the Department of tourism or other public sources. Additional research on this topic might also include a control group of all Wisconsin tourists to determine of there are significant differences between the agritourists surveyed and the general population of tourists.
Not included in this analysis but of potential interest to some may be further analysis of the location data collected in this survey. This includes zip code data for each of the agritourism customers. While individual business reports included customer maps, this was not included in eth complete analysis due to the significant clustering of customers in areas where there were more participating businesses. Further analysis of the data might explore relationships between respondents preferred type of agritourism activity and if they are in state or out of state visitors.
One of the primary motivations of this study was the exploration of food based tourism (through the development of the Wisconsin Autumn Harvest Trail). Representatives from the Wisconsin Department of
15
Tourism, Department of Agriculture, and numerous local community based organizations have expressed an interest in exploring food based and culinary tourism. Several questions in this survey explored the importance of food and local food products as a primary motivator for agritourism visits and spending. Further statistical analysis of this data may be useful in determining if there are significant correlations between visitors interest in local grown foods, likelihood of purchasing direct marketed foods ( through farmers markets, community supported agriculture, or on a farm), and interest in other food based activities. These correlations were of particular interest to participating businesses in exploring the behaviors of customers and exploring opportunities to cross market to customers across farm enterprises. Culinary tourism is often more broadly defined to include food based businesses that are not farm or agriculture related (such as urban breweries or distilleries, gastro‐pubs, urban food tours, culinary supply shops and retail stores. Additional research in this area might also explore the relationship between culinary tourism and agritourism both in terms of consumer demand and potential as a strategy for community tourism development.
References
Bernardo, D.,Valentin L., and Leatherman, J. (2004). Proceedings from the 2004: Risk and Profit Conference. Manhattan, KS. Accessed June 15 at http://www.uvm.edu/tourismresearch/agtour/publications/Kansas%20State%20Study.pdf
Bondoc, Irina. (2009). Finding fun in food and farming: characteristics of the U.S. agritourism industry. (Unpublished dissertation). University of Florida.
Carpio, C. E., Wohlgenant, M. K., & Boonsaeng, T. (2008). The demand for agritourism in the United States. Journal of Agricultural and Resource Economics, 33(2), 254‐269.
Che, D., Veeck, A., & Veeck, G. (2007). Demographic characteristics and motivations of Michigan agritourists. General Technical Report ‐ Northern Research Station, USDA Forest Service(NRS‐14), 98‐103.
Colton, J. W., & Bissix, G. (2005). Developing agritourism in Nova Scotia: Issues and challenges. Journal of Sustainable Agriculture, 27(1), 91‐112. doi: 10.1300/J064v27n01_06
Nasers, Melissa Sue. (2009). Iowa agritourism consumer profile: demographics, preferences, and participation levels. Retrieved from Graduate Theses and Dissertations. Iowa State University. (Paper 10647. http://lib.dr.iastate.edu/etd/10647)
Sims, Rebecca. (2009). Food, place, and authenticity: local food and the sustainable tourism experience. Journal of Sustainable Tourism, 27 (3), 321‐336. doi: 10.1080/09669580802359293
Tew, C., & Barbieri, C. (2012). The perceived benefits of agritourism: The provider's perspective. Tourism Management, 33(1), 215‐224. doi: 10.1016/j.tourman.2011.02.005
White, W., &Thilmany, D. (2006). Exploring consumer preferences and travel plans for agritourism in Colorado. Report from the Colorado Department if Agriculture. Accessed at http://www.ams.usda.gov/AMSv1.0/getfile?dDocName=STELPRDC5064320
Wilson, S., Fesenmaier, D. R., Fesenmaier, J., Es, J. C. v., & van Es, J. C. (2001). Factors for success in rural tourism development. Journal of Travel Research, 40(2), 132‐138.
Wisconsin Department of Tourism. (2010). The Economic Impact of Tourism in Wisconsin. Accessed June 2012 at http://industry.travelwisconsin.com/Research/Economic+Impact