Agritourism in Washington State: An Industry Profile
27
WASHINGTON STATE UNIVERSITY EXTENSION • EM040E Agritourism in Washington State: An Industry Profile
Transcript of Agritourism in Washington State: An Industry Profile

W A S H I N G T O N S T A T E U N I V E R S I T Y E X T E N S I O N • E M 0 4 0 E
Agritourism in Washington State: An Industry Profile

Table of ContentsAbstract ..........................................................................................................................................1
Introduction ...................................................................................................................................1
Survey Procedures ..........................................................................................................................2
Results ............................................................................................................................................3
Overview of the Agritourism Industry ..................................................................................3
Farm and Regional Impacts ..................................................................................................6
Marketing and Networking ..................................................................................................8
Challenges Facing Agritourism Farms .................................................................................10
Comparisons with Other Locations in the United States .....................................................11
Summary ......................................................................................................................................11
References ....................................................................................................................................12
Appendix ......................................................................................................................................14
Survey to Identify Agritourism Operations in Washington ..................................................14
Mail-in Survey and Frequency, Averages, and Mode of Responses ......................................16
1
Agritourism in Washington State: An Industry Profile
By Gregmar I. Galinato, Suzette P. Galinato, Hayley H. Chouinard,
Mykel R. Taylor, and Philip R. Wandschneider
Abstract
This report evaluates the motivations, impacts, and challenges faced by the farms in Washington as they relate to agritourism. We characterize agritourism entrepreneurship activities in 26 different counties of the state through a direct survey of farmers in the industry. We find that the most common agritourism activities vary by region. A majority of agritourism operations have been established in the last 20 years, but roadside stands in particular have a longer history. Farmers surveyed indicated that the primary reasons for including agritourism in their farm operations were to earn additional income and educate the local populace regarding agricultural and local activities. Many agritourism operations engage in direct marketing and interact with other producers. Respondents felt that the main obstacles to success in the industry are state laws and regulations, land use and zoning rules, lack of time, and concerns about liability.
I. Introduction
Washington state farmers produce many profitable, high-value crops; the state is a significant contributor to U.S. crop production of a number of fruits and vegetables, especially apples, hops, and potatoes (NASS 2009). Agriculture is also the second leading export sector in the state after aircrafts and ahead of computers and electronics.1 However, declining farm profits and real farm incomes over the past decade have put pressure on some farmers to augment their income. According to the 2007 Agriculture Census, total farm sales in Washington amounted to $6.8 billion, averaging $172,917 per farm (NASS 2009). Despite product diversity and significant acreage allocation for crop production, net returns to growers and farm income have been declining
1 According to the Washington Office of Financial Manage-ment, in 2008, agricultural exports were about one third of aircrafts but almost four times that of computers and electron-ics, the third leading export sector (http://www.ofm.wa.gov/trends/tables/fig106.asp).
since 1997. Figure 1 illustrates the trends of income and expenditure in the Washington state agricultural industry from 1987 to 2007. Generally, gross receipts have been increasing over time along with farm production expenses.
One strategy to increase farm income is to offer agritourism activities. Agritourism is an enterprise on a farm or ranch for the enjoyment or education of the public that promotes the products of the farm and generates additional farm revenue (Hilchey 1993). The most important reasons often stated for why farms operate an agritourism business are to supplement income and to employ diversification strategies in order to safeguard income against fluctuations in agricultural markets (Nickerson et al. 2001; McGehee and Kim 2004; Ryan et al. 2006). Agritourism provides the opportunity to increase revenues through on-farm direct sales in which consumers are often willing to pay more for the same or similar products purchased from conventional outlets (Jolly and Reynolds 2005). Additionally, entrance fees may be charged for agritourism experiences.
In Washington state, a number of farms in different counties offer agritourism activities such as winery tours, roadside stands, U-pick farms, and festivals. According to the 2007 Census of Agriculture, 342 farms in Washington received income from agritourism or recreational services (NASS 2009). The number of agritourism operations at that time was most likely greater, as some of the recreational services were not typically considered agritourism activities (e.g., fishing, hunting).
Agritourism in other states has significantly increased income for farmers. Surveys in Vermont and Hawaii showed an 86% increase in total annual farm income from agritourism between 2000 and 2002, and a 30% increase between 2000 and 2003, respectively (New England Agricultural Statistics Service 2001, 2004; Hawaii Agricultural Statistics 2004). Gross farm income from agritourism in 2007 was reported at $35

2
million in California and $17 million in New York (George et al. 2009).
Studies show that farm-based recreation activities also have a widespread impact on economic and community development since they benefit not only farmers, but also providers of other goods and services in the community. The increase in annual employment from agritourism activities in different states varies widely. For instance, in San Diego County, Florida, 69 agritourism jobs were added in 1998 (Lobo et al. 1999). In contrast, in South Miami-Dade County, Florida, agritourism activities generated 2,600 jobs in 2005 (Evans and Hodges 2006).
Farmer adoption of agritourism in Washington is gaining attention from state officials. The Governor’s Workgroup on Agritourism prepared a report examining the regulatory opportunities and barriers of permitting a “homestay” or overnight lodging at small farms—a very popular form of agritourism in Europe (Vasquez 2008). Although homestays are only one of numerous on-farm recreation activities, the report demonstrates the interest of the governor’s office, state agencies, county planners, and development specialists in agritourism.
To address the knowledge gap about the primary drivers and overall scope of agritourism in Washington state, this report offers the results of a
survey that explores the motivations and challenges faced by Washington farmers engaged in agritourism. The overall status and extent of agritourism, as well as the various types of agritourism activities in Washington, are also explored to provide a basis for adequately and thoroughly characterizing the different benefits that accrue to the farms and to other economic sectors from these activities. Policies that develop the agritourism industry in Washington state cannot be instituted without understanding the factors that influence participation decisions.
This report first provides an evaluation of the Washington agritourism industry as measured by a survey. Next is verifiable information in which to frame the identification and estimation of current and future agritourism benefits to these farmers and the local economy. The remainder of the report outlines the survey procedures, presents the results of the survey, and offers a conclusion.
II. Survey Procedures
The survey involved a two-stage process: (1) a preliminary inventory of agritourism activities and agritourism operators in 26 Washington counties; and (2) surveys of farm operators that conduct agritourism activities as outlined in the inventory completed in stage 1.
0
20,000
40,000
60,000
80,000
100,000
120,000
140,000
160,000
1987 1992 1997 2002 2007
dolla
rs
Gross Receipts Farm Production Expenses Net Farm Income
Figure 1. Income and Expenditure Trends in Washington Agritourism (PPI 1982 = 100), Average per Farm, 1987–2007 (NASS 1994, 1999, 2004, 2009; BLS 2010)
Note: “Gross receipts” refer to the “total market value of agricultural products sold and government payments.” The combination of sales and government payments is considered a better measure of the economic size of farm since it represents all income resources of an operation other than income from farm-related sources. “Farm production expenses” includes the production expenses provided by the operators, partners, landlords (excluding property taxes), and production contractors for the farm business. “Net farm income” is derived by subtracting total farm and farm-related expenses from total sales, government payments, and other farm-related income. Nominal figures are deflated using the farm products producer price index (PPI), with 1982 as the base year.
3
In the first stage, we collected information about various agritourism businesses from Internet searches. In an effort to build a comprehensive sample frame, we also conducted surveys of local Extension agents in each county who are knowledgeable about the diverse agritourism-related activities within their respective counties. We sent Extension agents a cover letter and survey, which included a brief description of the study and questions about the contact information of agritourism businesses within the county. We conducted follow-up telephone calls to all of the selected agents one week after the survey was mailed to (1) determine if they were the appropriate persons to fill out the questionnaire and obtain a referral in case they were not; (2) answer any questions they had about agritourism, the survey, and our study; and (3) talk with them about who else in the county might be knowledgeable about agritourism and farms engaged in agritourism in the area. The survey questionnaire sent to the Extension agents is shown in Appendix 1. As we collected and compiled the data from the surveys and the Internet, we eliminated duplicates and compiled the contact information, including phone numbers, email addresses, and mailing addresses. Thus, we were able to develop an extensive database of diverse agritourism businesses in the state.
In the second stage, we developed a survey questionnaire that focused on the characteristics of the farms and operators, types of agritourism activities offered, and motivations and challenges of operating their business. The survey sample was determined by data collected in stage 1. A pilot questionnaire, in both printed and electronic forms, was tested first with select people at Washington State University and in the industry to identify any necessary modifications to the questionnaire. We uploaded the electronic version to the Internet and sent the website link to the participants.2 2 A sample of the electronic survey is provided at http://impact.
wsu.edu/ADAM/Survey.html.
The web-based survey technique was convenient for respondents who use the Internet. A mail-back survey captured those businesses that do not maintain email addresses.3 From stage 2 we had two groups of respondents—those with and without documented email addresses. After testing and improving the survey instrument, we adapted the modified Dillman’s (1978) mail-back survey methodology by Rademaker et al. (2007). Table 1 illustrates the sets of mailings that were sent to two groups of the survey sample.
III. Results
We identified a total population of 292 small and medium-sized farms4 that conduct some form of agritourism in Washington, which is close to the 2007 USDA estimate of 342 agritourism operations discussed earlier. Out of the 292 farms, 116 responded to our survey, yielding a response rate of 40%. Approximately 67% of respondents answered via the online survey. We begin by presenting an overall description of the agritourism industry in Washington as revealed by our survey responses. Then, we discuss the reasons farmers engage in the industry, and some impacts on the regions where these operations exist. We then examine the marketing and other tools these farmers use. Finally, we present the challenges facing the industry.
Overview of the Agritourism Industry
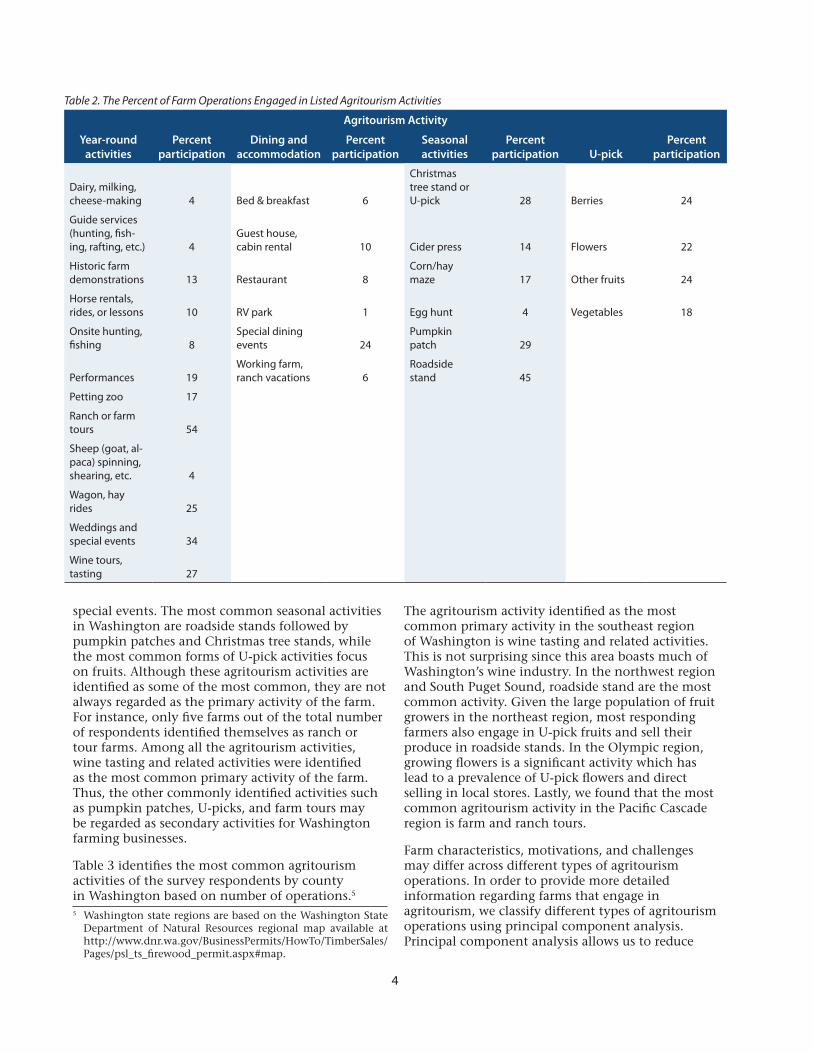
The agritourism activities of the survey respondents are given in Table 2. The majority of respondents participated in some form of year-round activity. Ranch or farm tours are the most common agritourism activity, followed by farms that host 3 Appendix 2 provides a sample of the mail survey along with
the count, mean, and mode of responses to selected ques-tions.
4 Small farms and medium-sized farms are defined as those hav-ing total sales of less than $250,000 and between $250,000 and $499,999, respectively (Economic Research Service 2005).
Table 1. Survey Procedures for the Two Groups of Respondents
Group 1: With Internet Access (3 Sets) Group 2: Without Internet Access (4 Sets)
Set 1: A letter introducing the study and providing the website of the questionnaire.
Set 2: A reminder post card was sent to the survey sample one week after the first mailing to thank those who responded and request non-respondents to fill out the survey.
Set 3: A final mailing was sent to non-respondents two weeks after the post card was delivered. The mailing contained a printed copy of the questionnaire and a note about the website link. This gave the respondents the option to mail back the survey or complete it on the Internet, depending on their preference.
Set 1: A letter introducing the study and informing the recipients that they would receive a survey questionnaire via mail.
Set 2: A copy of the survey was sent to the survey sample.Set 3: A reminder post card was sent one week after the second
mailing to thank those who responded and request non-respondents to fill out the survey.
Set 4: A final mailing was sent to non-respondents two weeks after the post card was delivered. The mailing contained a replacement survey.
4
Table 2. The Percent of Farm Operations Engaged in Listed Agritourism Activities
Agritourism Activity
Year-round activities
Percent participation
Dining and accommodation
Percent participation
Seasonal activities
Percent participation U-pick
Percent participation
Dairy, milking, cheese-making 4 Bed & breakfast 6
Christmas tree stand or U-pick 28 Berries 24
Guide services (hunting, fish-ing, rafting, etc.) 4
Guest house, cabin rental 10 Cider press 14 Flowers 22
Historic farm demonstrations 13 Restaurant 8
Corn/hay maze 17 Other fruits 24
Horse rentals, rides, or lessons 10 RV park 1 Egg hunt 4 Vegetables 18
Onsite hunting, fishing 8
Special dining events 24
Pumpkin patch 29
Performances 19Working farm, ranch vacations 6
Roadside stand 45
Petting zoo 17
Ranch or farm tours 54
Sheep (goat, al-paca) spinning, shearing, etc. 4
Wagon, hay rides 25
Weddings and special events 34
Wine tours, tasting 27
special events. The most common seasonal activities in Washington are roadside stands followed by pumpkin patches and Christmas tree stands, while the most common forms of U-pick activities focus on fruits. Although these agritourism activities are identified as some of the most common, they are not always regarded as the primary activity of the farm. For instance, only five farms out of the total number of respondents identified themselves as ranch or tour farms. Among all the agritourism activities, wine tasting and related activities were identified as the most common primary activity of the farm. Thus, the other commonly identified activities such as pumpkin patches, U-picks, and farm tours may be regarded as secondary activities for Washington farming businesses.
Table 3 identifies the most common agritourism activities of the survey respondents by county in Washington based on number of operations.5 5 Washington state regions are based on the Washington State
Department of Natural Resources regional map available at http://www.dnr.wa.gov/BusinessPermits/HowTo/TimberSales/Pages/psl_ts_firewood_permit.aspx#map.
The agritourism activity identified as the most common primary activity in the southeast region of Washington is wine tasting and related activities. This is not surprising since this area boasts much of Washington’s wine industry. In the northwest region and South Puget Sound, roadside stand are the most common activity. Given the large population of fruit growers in the northeast region, most responding farmers also engage in U-pick fruits and sell their produce in roadside stands. In the Olympic region, growing flowers is a significant activity which has lead to a prevalence of U-pick flowers and direct selling in local stores. Lastly, we found that the most common agritourism activity in the Pacific Cascade region is farm and ranch tours.
Farm characteristics, motivations, and challenges may differ across different types of agritourism operations. In order to provide more detailed information regarding farms that engage in agritourism, we classify different types of agritourism operations using principal component analysis. Principal component analysis allows us to reduce

5
the number of types of agritourism operations by identifying common variations in observations across different agritourism activities. We identified three common types of activities into which we sort the operations: (1) roadside stands, seasonal events, U-pick, and animal experiences; (2) catering, wine tasting or tours, and weddings; and (3) farmers markets and off-farm direct sales. Since several operations engage in many of these activities, we need to find a mechanism to systematically classify each operation into only one category. Using an index, we scored each operation and were able to determine which of the categories most accurately described each operation. Therefore, in the following discussions we report the results for all the respondents that engage in any agritourism activity (116 respondents); the subset of those whose agritourism activity is most focused on seasonal or roadside stands (39 respondents); and those working most with catering, wine, or weddings (40 respondents). We did not include the operations that
were mostly identified with farmers markets or off-farm direct sales, as these are not directly related to the traditional definition of agritourism.
Agritourism has only recently become part of the business plan for many Washington state agricultural producers, as shown in Table 4. Over a third of those in the agritourism business have operated for less than 10 years. More than half of those providing agritourism opportunities began these endeavors in the last 20 years. The seasonal/roadside operations have been in business longer than the catering/wine events producers. Nearly 75% of the catering/wine events operations started in the last 20 years.
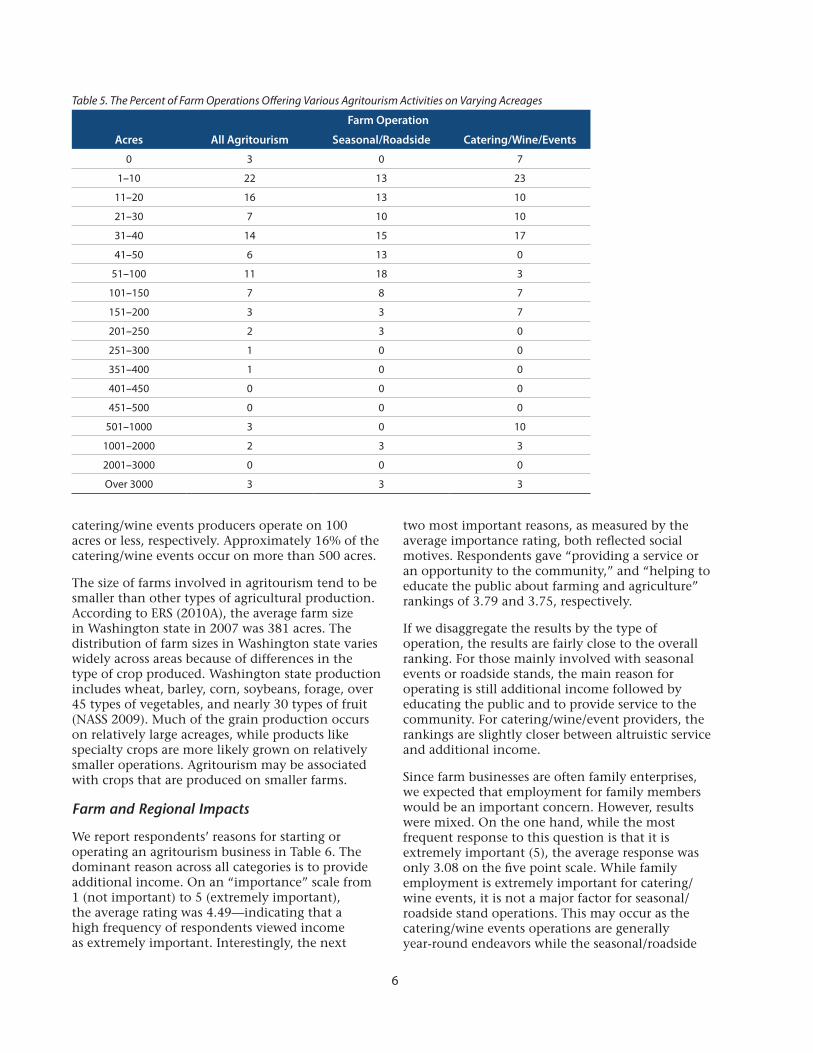
The size of land needed to conduct an agritourism activity varies depending on the type of activity, as shown in Table 5. Approximately 40% of the agritourism farms operate on 20 acres or less. An additional 38% operate on 21 to 100 acres. More than 82% and 70% of the seasonal/roadside and
Table 3. Agritourism Activities by Region and County in Washington
Northwest Southeast Northeast South Puget Sound Pacific Cascade Olympic Region
Whatcom Whitman Stevens Pierce Wahkiakum Clallam
Ranch or farm tours Ranch or farm tours Dairy, milking, cheese-making
U-pick berries Bed and breakfast U-pick flowers
Snohomish Yakima Mason Guest house, cabin rental
Wine tours, tasting
Roadside stand/store Wine tours, tasting Wine tours, tasting U-pick vegetables
Christmas trees Walla Walla Spokane Bed and breakfast Thurston
Pumpkin patch Wine tours, tasting Roadside stand/store King Pumpkin patch
Skagit Klickitat U-pick fruits Pumpkin patch Skamania
Roadside stand/store Wine tours, tasting Pend Oreille U-pick berries Weddings and special eventsChristmas trees Grant Ranch or farm tours Ranch or farm tours
U-pick berries Wine tours, tasting Okanogan Special dining events Clark
Wine tours, tasting Douglas Roadside stand/store Christmas trees
San Juan Cider press Dairy, milking, cheese-makingRoadside stand/store Chelan
U-pick flowers Roadside stand/store
Ranch or farm tours Wine tours, tasting
Wine tours, tasting Benton
Bed and breakfast Wine tours, tasting
Island
Roadside stand/store
Table 4. The Percent of Farm Operations Offering Various Agritourism Activities for Cumulative Ranges of Years
Farm OperationNumber of Years in Business
0–10 years 11–20 years 21–30 years Over 30 years
All Agritourism 38 31 16 15
Seasonal/Roadside 21 28 28 23
Catering/Wine/Events 30 43 13 13
6
catering/wine events producers operate on 100 acres or less, respectively. Approximately 16% of the catering/wine events occur on more than 500 acres.
The size of farms involved in agritourism tend to be smaller than other types of agricultural production. According to ERS (2010A), the average farm size in Washington state in 2007 was 381 acres. The distribution of farm sizes in Washington state varies widely across areas because of differences in the type of crop produced. Washington state production includes wheat, barley, corn, soybeans, forage, over 45 types of vegetables, and nearly 30 types of fruit (NASS 2009). Much of the grain production occurs on relatively large acreages, while products like specialty crops are more likely grown on relatively smaller operations. Agritourism may be associated with crops that are produced on smaller farms.
Farm and Regional Impacts
We report respondents’ reasons for starting or operating an agritourism business in Table 6. The dominant reason across all categories is to provide additional income. On an “importance” scale from 1 (not important) to 5 (extremely important), the average rating was 4.49—indicating that a high frequency of respondents viewed income as extremely important. Interestingly, the next
two most important reasons, as measured by the average importance rating, both reflected social motives. Respondents gave “providing a service or an opportunity to the community,” and “helping to educate the public about farming and agriculture” rankings of 3.79 and 3.75, respectively.
If we disaggregate the results by the type of operation, the results are fairly close to the overall ranking. For those mainly involved with seasonal events or roadside stands, the main reason for operating is still additional income followed by educating the public and to provide service to the community. For catering/wine/event providers, the rankings are slightly closer between altruistic service and additional income.
Since farm businesses are often family enterprises, we expected that employment for family members would be an important concern. However, results were mixed. On the one hand, while the most frequent response to this question is that it is extremely important (5), the average response was only 3.08 on the five point scale. While family employment is extremely important for catering/wine events, it is not a major factor for seasonal/roadside stand operations. This may occur as the catering/wine events operations are generally year-round endeavors while the seasonal/roadside
Table 5. The Percent of Farm Operations Offering Various Agritourism Activities on Varying Acreages
Farm Operation
Acres All Agritourism Seasonal/Roadside Catering/Wine/Events
0 3 0 7
1–10 22 13 23
11–20 16 13 10
21–30 7 10 10
31–40 14 15 17
41–50 6 13 0
51–100 11 18 3
101–150 7 8 7
151–200 3 3 7
201–250 2 3 0
251–300 1 0 0
351–400 1 0 0
401–450 0 0 0
451–500 0 0 0
501–1000 3 0 10
1001–2000 2 3 3
2001–3000 0 0 0
Over 3000 3 3 3

7
operators engage in these activities during only a portion of the year. Thus, the employment offered by catering/wine events is viewed as more desirable.
The results suggest that income is important for virtually all farms surveyed. Social purposes and family concerns are important for some farms. Two other plausible motives, tax purposes and hobby pursuits, scored very low and were judged not important.
The total gross revenue associated with the agritourism activities is summarized in Table 7. Approximately 34% of agritourism operations earn $50,000 or less from agritourism. The ERS (2010B) reports that the mean net farm income per operation in Washington state in 2008 topped $49,700. Thus, on average, the agritourism farms that responded to our survey generate slightly more income than the average farm in Washington assuming the state average. The seasonal/roadside operations have more variation in their revenues. More of these
farms have gross revenues below $50,000 and more earning at least $500,000 than the catering/wine events operations. However, the catering/wine events operations have more than 60% of the operations earning more than $100,000 from agritourism.
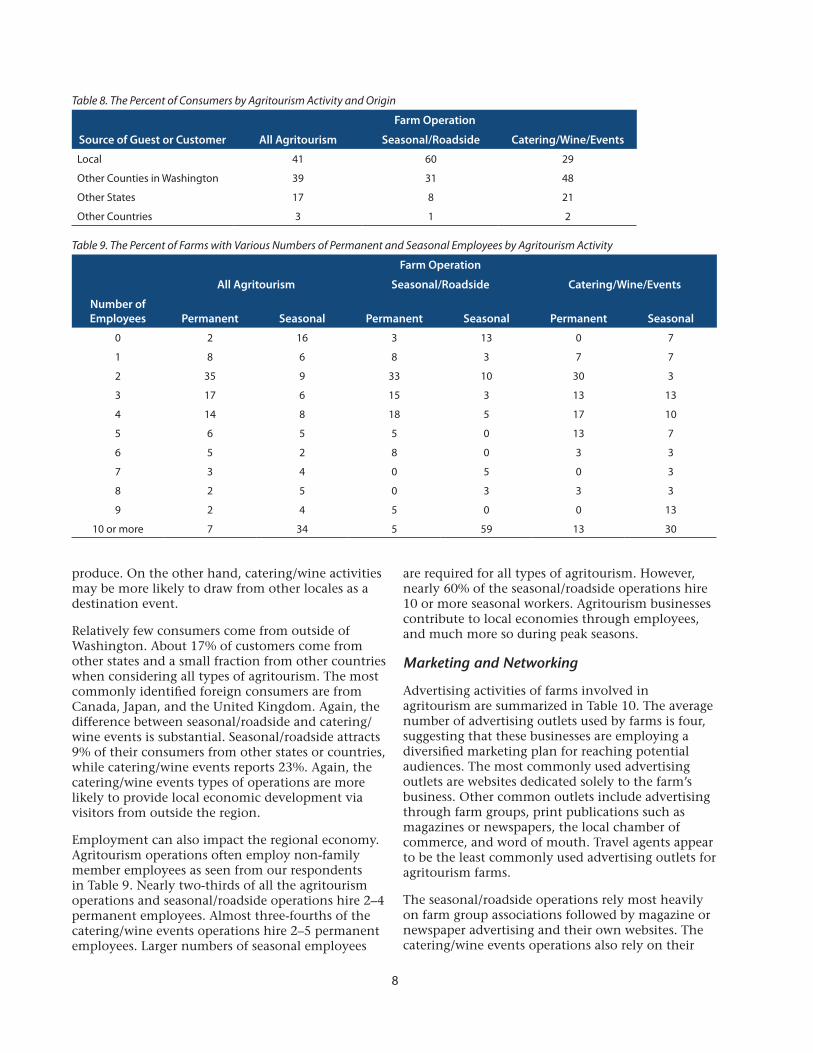
Beyond the revenue generated on the farms, the impacts to the regions can come in the form of visitors spending dollars in the local economy or employees earning wages. Table 8 summarizes the percent of consumers of agritourism products provided by our survey respondents by their point of origin. A majority of consumers reside in the same county with the agritourism activity (local) or come from other counties in Washington. However, the origin of consumers seems to depend on the type of agritourism activity. Seasonal and roadside stand consumers are 60% local and over 30% from other Washington counties. Catering/wine events consumers are about 30% local and nearly 50% from other counties in Washington. This makes sense, as the appeal of roadside stands may be local, fresh
Table 6. Reasons for Offering Various Agritourism Activities
Farm Operation
All Agritourism Seasonal/Roadside Catering/Wine/Events
ReasonsAverage Rating
Most Frequent
RatingAverage Rating
Most Frequent
RatingAverage Rating
Most Frequent
Rating
Additional income 4.49 5 4.51 5 4.59 5
Employment of family 3.08 5 3.10 1 3.08 5
Provide a service/opportunity to the community 3.79 5 3.67 4 3.76 5
Tax incentives 2.16 1 2.13 1 2.18 1
A hobby; for fun, to keep active 2.27 1 2.26 1 2.27 1
Educate people about farming, agriculture 3.75 5 4.51 5 3.75 5
Note: * Rating scale from 1 (not important) to 5 (extremely important)
Table 7. The Percent of Farms Earning Incremental Gross Revenues from Various Agritourism Activities
Farm Operation
Gross Revenue All Agritourism Seasonal/Roadside Catering/Wine/Events
Less than $25,000 23 23 11
$25,000–$50,000 11 13 4
$50,001–$75,000 7 8 11
$75,001–$100,000 10 5 14
$100,001–$200,000 11 8 18
$200,001–$300,00 8 5 4
$300,001–$400,000 5 5 11
$400,001–$500,000 4 5 7
$500,001–$750,000 9 15 4
$750,001–$1,000,000 4 3 4
Over $1,000,000 9 10 14
8
produce. On the other hand, catering/wine activities may be more likely to draw from other locales as a destination event.
Relatively few consumers come from outside of Washington. About 17% of customers come from other states and a small fraction from other countries when considering all types of agritourism. The most commonly identified foreign consumers are from Canada, Japan, and the United Kingdom. Again, the difference between seasonal/roadside and catering/wine events is substantial. Seasonal/roadside attracts 9% of their consumers from other states or countries, while catering/wine events reports 23%. Again, the catering/wine events types of operations are more likely to provide local economic development via visitors from outside the region.
Employment can also impact the regional economy. Agritourism operations often employ non-family member employees as seen from our respondents in Table 9. Nearly two-thirds of all the agritourism operations and seasonal/roadside operations hire 2–4 permanent employees. Almost three-fourths of the catering/wine events operations hire 2–5 permanent employees. Larger numbers of seasonal employees
are required for all types of agritourism. However, nearly 60% of the seasonal/roadside operations hire 10 or more seasonal workers. Agritourism businesses contribute to local economies through employees, and much more so during peak seasons.
Marketing and Networking
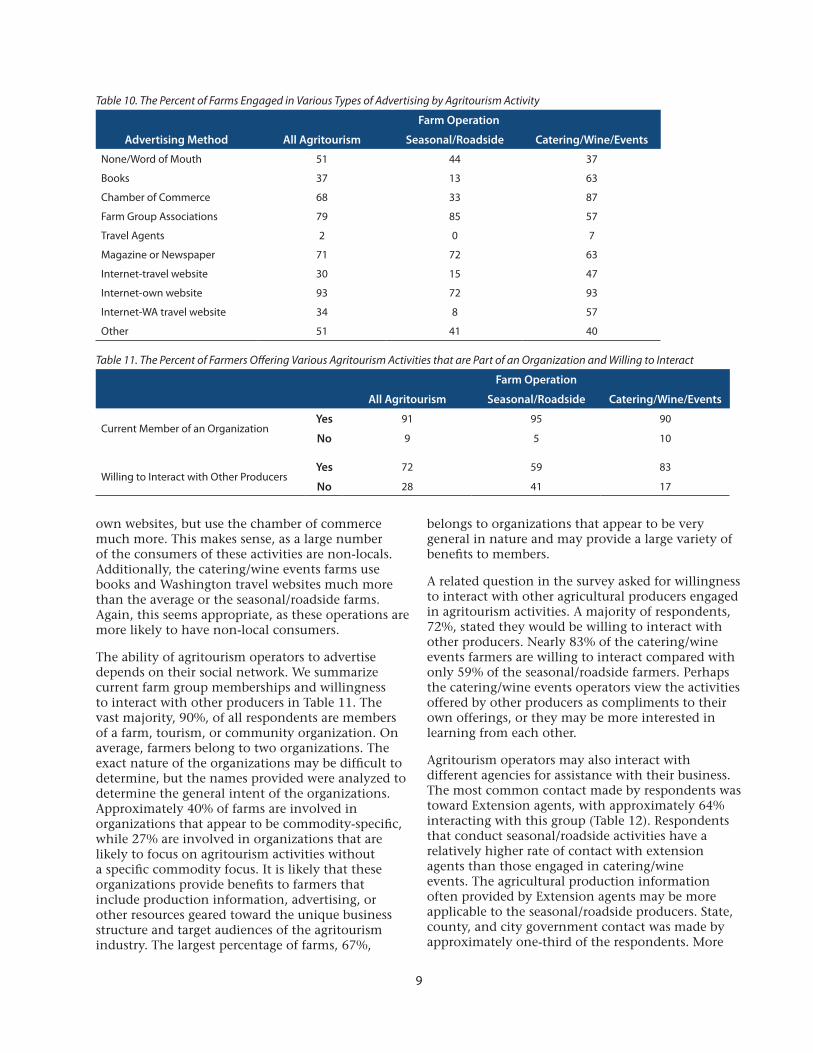
Advertising activities of farms involved in agritourism are summarized in Table 10. The average number of advertising outlets used by farms is four, suggesting that these businesses are employing a diversified marketing plan for reaching potential audiences. The most commonly used advertising outlets are websites dedicated solely to the farm’s business. Other common outlets include advertising through farm groups, print publications such as magazines or newspapers, the local chamber of commerce, and word of mouth. Travel agents appear to be the least commonly used advertising outlets for agritourism farms.
The seasonal/roadside operations rely most heavily on farm group associations followed by magazine or newspaper advertising and their own websites. The catering/wine events operations also rely on their
Table 8. The Percent of Consumers by Agritourism Activity and Origin
Farm Operation
Source of Guest or Customer All Agritourism Seasonal/Roadside Catering/Wine/Events
Local 41 60 29
Other Counties in Washington 39 31 48
Other States 17 8 21
Other Countries 3 1 2
Table 9. The Percent of Farms with Various Numbers of Permanent and Seasonal Employees by Agritourism Activity
Farm Operation
All Agritourism Seasonal/Roadside Catering/Wine/Events
Number of Employees Permanent Seasonal Permanent Seasonal Permanent Seasonal
0 2 16 3 13 0 7
1 8 6 8 3 7 7
2 35 9 33 10 30 3
3 17 6 15 3 13 13
4 14 8 18 5 17 10
5 6 5 5 0 13 7
6 5 2 8 0 3 3
7 3 4 0 5 0 3
8 2 5 0 3 3 3
9 2 4 5 0 0 13
10 or more 7 34 5 59 13 30
9
own websites, but use the chamber of commerce much more. This makes sense, as a large number of the consumers of these activities are non-locals. Additionally, the catering/wine events farms use books and Washington travel websites much more than the average or the seasonal/roadside farms. Again, this seems appropriate, as these operations are more likely to have non-local consumers.
The ability of agritourism operators to advertise depends on their social network. We summarize current farm group memberships and willingness to interact with other producers in Table 11. The vast majority, 90%, of all respondents are members of a farm, tourism, or community organization. On average, farmers belong to two organizations. The exact nature of the organizations may be difficult to determine, but the names provided were analyzed to determine the general intent of the organizations. Approximately 40% of farms are involved in organizations that appear to be commodity-specific, while 27% are involved in organizations that are likely to focus on agritourism activities without a specific commodity focus. It is likely that these organizations provide benefits to farmers that include production information, advertising, or other resources geared toward the unique business structure and target audiences of the agritourism industry. The largest percentage of farms, 67%,
belongs to organizations that appear to be very general in nature and may provide a large variety of benefits to members.
A related question in the survey asked for willingness to interact with other agricultural producers engaged in agritourism activities. A majority of respondents, 72%, stated they would be willing to interact with other producers. Nearly 83% of the catering/wine events farmers are willing to interact compared with only 59% of the seasonal/roadside farmers. Perhaps the catering/wine events operators view the activities offered by other producers as compliments to their own offerings, or they may be more interested in learning from each other.
Agritourism operators may also interact with different agencies for assistance with their business. The most common contact made by respondents was toward Extension agents, with approximately 64% interacting with this group (Table 12). Respondents that conduct seasonal/roadside activities have a relatively higher rate of contact with extension agents than those engaged in catering/wine events. The agricultural production information often provided by Extension agents may be more applicable to the seasonal/roadside producers. State, county, and city government contact was made by approximately one-third of the respondents. More
Table 10. The Percent of Farms Engaged in Various Types of Advertising by Agritourism Activity
Farm Operation
Advertising Method All Agritourism Seasonal/Roadside Catering/Wine/Events
None/Word of Mouth 51 44 37
Books 37 13 63
Chamber of Commerce 68 33 87
Farm Group Associations 79 85 57
Travel Agents 2 0 7
Magazine or Newspaper 71 72 63
Internet-travel website 30 15 47
Internet-own website 93 72 93
Internet-WA travel website 34 8 57
Other 51 41 40
Table 11. The Percent of Farmers Offering Various Agritourism Activities that are Part of an Organization and Willing to Interact
Farm Operation
All Agritourism Seasonal/Roadside Catering/Wine/Events
Current Member of an OrganizationYes 91 95 90
No 9 5 10
Willing to Interact with Other ProducersYes 72 59 83
No 28 41 17
10
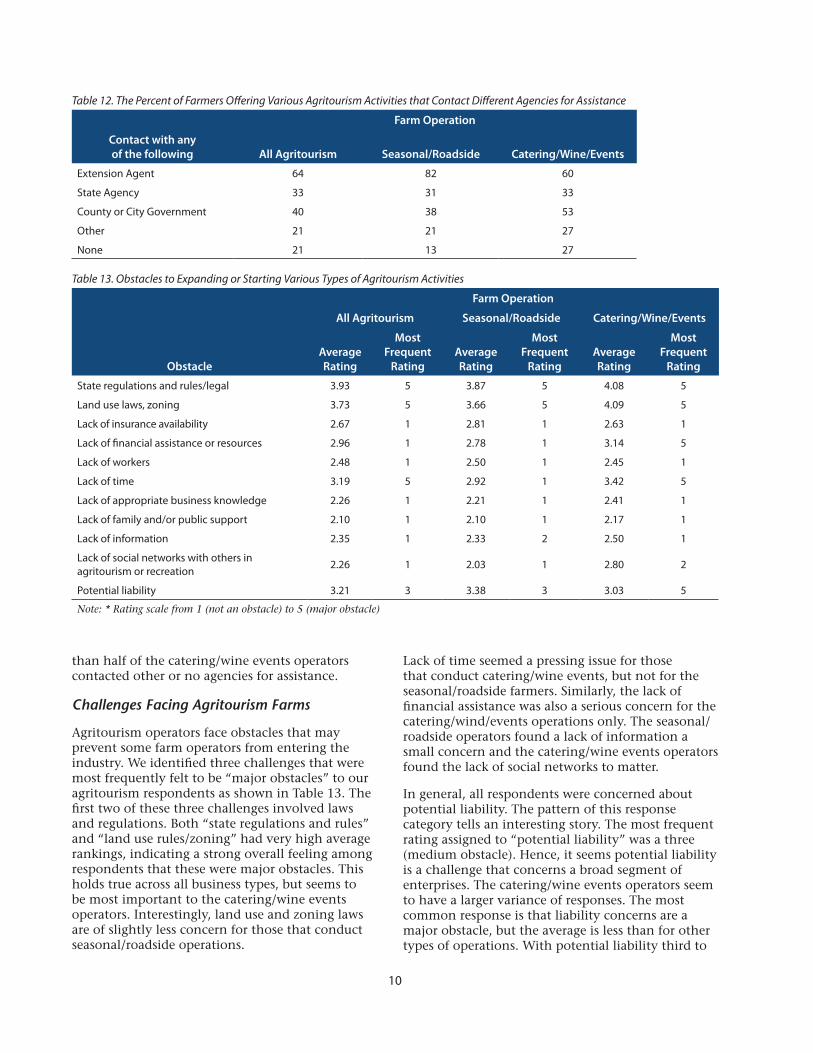
than half of the catering/wine events operators contacted other or no agencies for assistance.
Challenges Facing Agritourism Farms
Agritourism operators face obstacles that may prevent some farm operators from entering the industry. We identified three challenges that were most frequently felt to be “major obstacles” to our agritourism respondents as shown in Table 13. The first two of these three challenges involved laws and regulations. Both “state regulations and rules” and “land use rules/zoning” had very high average rankings, indicating a strong overall feeling among respondents that these were major obstacles. This holds true across all business types, but seems to be most important to the catering/wine events operators. Interestingly, land use and zoning laws are of slightly less concern for those that conduct seasonal/roadside operations.
Lack of time seemed a pressing issue for those that conduct catering/wine events, but not for the seasonal/roadside farmers. Similarly, the lack of financial assistance was also a serious concern for the catering/wind/events operations only. The seasonal/roadside operators found a lack of information a small concern and the catering/wine events operators found the lack of social networks to matter.
In general, all respondents were concerned about potential liability. The pattern of this response category tells an interesting story. The most frequent rating assigned to “potential liability” was a three (medium obstacle). Hence, it seems potential liability is a challenge that concerns a broad segment of enterprises. The catering/wine events operators seem to have a larger variance of responses. The most common response is that liability concerns are a major obstacle, but the average is less than for other types of operations. With potential liability third to
Table 12. The Percent of Farmers Offering Various Agritourism Activities that Contact Different Agencies for Assistance
Farm Operation
Contact with any of the following All Agritourism Seasonal/Roadside Catering/Wine/Events
Extension Agent 64 82 60
State Agency 33 31 33
County or City Government 40 38 53
Other 21 21 27
None 21 13 27
Table 13. Obstacles to Expanding or Starting Various Types of Agritourism Activities
Farm Operation
All Agritourism Seasonal/Roadside Catering/Wine/Events
ObstacleAverage Rating
Most Frequent
RatingAverage Rating
Most Frequent
RatingAverage Rating
Most Frequent
Rating
State regulations and rules/legal 3.93 5 3.87 5 4.08 5
Land use laws, zoning 3.73 5 3.66 5 4.09 5
Lack of insurance availability 2.67 1 2.81 1 2.63 1
Lack of financial assistance or resources 2.96 1 2.78 1 3.14 5
Lack of workers 2.48 1 2.50 1 2.45 1
Lack of time 3.19 5 2.92 1 3.42 5
Lack of appropriate business knowledge 2.26 1 2.21 1 2.41 1
Lack of family and/or public support 2.10 1 2.10 1 2.17 1
Lack of information 2.35 1 2.33 2 2.50 1
Lack of social networks with others in agritourism or recreation 2.26 1 2.03 1 2.80 2
Potential liability 3.21 3 3.38 3 3.03 5
Note: * Rating scale from 1 (not an obstacle) to 5 (major obstacle)

11
general regulations and land use laws as the most cited challenge overall, it is clear that legal issues rank high in the minds of agritourism operators.
The rest of the obstacle categories (insurance availability, worker availability, business knowledge, and family or public support) were most frequently rated as not an obstacle. The average ratings were between two (minor obstacle) and three (medium obstacle). This pattern suggests a set of challenges which are situational rather than general. Many businesses find no challenges, while others find minor or medium obstacles.
Comparison with Other Locations in the United States
Studies in other states, such as Montana (Nickerson et al. 2001; Rademaker et al. 2007), Pennsylvania (Ryan et al. 2006), and Virginia (McGehee and Kim 2004), found similar significant drivers in operating an agritourism business, as were encountered by agritourism operators in Washington state. The motivations include supplementing income, employing diversification strategies in order to safeguard income against fluctuations in agricultural markets, and educating consumers.
The major obstacles identified by agritourism operators in Washington state are also experienced by those whose agritourism businesses are located elsewhere in the United States. However, the degree of importance differs. For example, in California and New York, the major obstacles are liability and insurance issues, while in Hawaii and Pennsylvania, it is land use regulation and zoning restriction (Leff 2009; Kuehn and Hilchey 1999; Hawaii Agricultural Statistics 2008; Ryan et al. 2006).
IV. Summary
Using survey data with 116 respondents, we examined the characteristics of Washington agritourism operations. We found farm and ranch tours constitute the most common agritourism activity in the state. Roadside stands make up the most common seasonal agritourism activity Washington producers provide. The most common types of agritourism activities provided varied by region. Wine tours and tastings dominate the southern region of the state, while roadside stands and U-pick operations are the most common activity in the northwest and northeast, respectively. Farms in the Pacific Cascades area provide more tours than other types of agritourism, and U-pick flowers are the most common in the Olympic region.
We used principal component analysis to categorize the agritourism operations into two types, seasonal/roadside operations and operations that engage in catering/wine events. This allowed us to examine the agritourism operations in Washington state in general, and also determine how the major types of operations compared.
Agritourism activities for our respondents are somewhat new. Approximately 70% of the agritourism operations started in the last 20 years. The seasonal/roadside operations tended to exist longer, with a majority of these operating for at least 20 years. Most agritourism operations operate on less than 200 acres, which is less than the average Washington farm size of 381 acres.
The motivations for adding agritourism activities to farm operations can vary. The most common reason for operating an agritourism business is to increase income, according to our survey. However, the desire to provide service and education to the public are also factors. Nearly two-thirds of the agritourism operations in our study earn gross revenues of more than $50,000 from the agritourism portion of their operation. More than 20% yield gross revenues of over $500,000.
Agritourism operations can significantly impact regional economies. Although a majority of agritourism consumers of the businesses in our study come from Washington state, at least 20% are from other states or countries. Catering/wine events agritourism operations tend to have more non-local customers. If agritourism operations draw non-locals to Washington, then they will certainly have a positive impact on the regional economy. Additionally, agritourism operations provide wages to workers, which contributes to regional economies. On average, agritourism operations hire 2–5 permanent employees and many more seasonal employees.
Agritourism businesses engage in many different types of marketing and interactions. The most common marketing tools employed by our respondents are individual business websites, farm group associations, print advertisements, and local chambers of commerce. Nearly 90% of agritourism business owners are part of a farm organization and most are willing to interact with other producers. A majority of these owners have contacted an Extension agent, and many engage with other agencies.
There are many challenges agritourism operators respondents identified as significant. State regulations or rules and land use rules or zoning

12
concerns are a common concern for agritourism operations. The lack of time to meet all the demands of the operations appears to be of particular concern to the catering/wine events operators. Potential liability issues also create concern for agritourism operations. Furthermore, the most significant motivations found by this study were not unique to Washington state. Even though the incentives to set up and operate an agritourism business are similar across states, the most significant obstacle may vary.
References
Beus, Curtis E. 2008. Agritourism: Cultivating Tourists on the Farm. Extension Bulletin in the Farming the Northwest Series, EB2020. http://cru.cahe.wsu.edu/CEPublications/eb2020/eb2020.pdf.
Bureau of Labor Statistics (BLS). 2008. Producer Price Index-Commodities: Farm Products. Washington, DC.
Dillman, D.A. 1978. Mail and Telephone Surveys: The Total Design Method. New York: John Wiley & Sons.
Economic Research Service. 2005. Farm Typology. U.S. Department of Agriculture. http://www.ers.usda.gov/briefing/farmstructure/glossary.htm#typology.
__________. 2010A. Farm Characteristics. U.S. Department of Agriculture. http://www.ers.usda.gov/StateFacts/WA.htm.
__________. 2010B. Net Farm Income and Value of Production per Farm and per Acres for States. U.S. Department of Agriculture. http://www.ers.usda.gov/DAta/FArmIncome/FinfidmuXls.htm.
Evans, Edward and Alan Hodges. 2006. Potential Impacts of Agritourism in South Miami-Dade County. EDIS Document FE637. Food and Resource Economics Department, Florida Cooperative Extension Service, Institute of Food and Agricultural Sciences, University of Florida, Gainesville.
George, Holly, Ellie Rilla, and Penny Leff. 2009. Survey of California Agritourism Operators, National Extension Tourism Conference presentation, Park City, UT.
Hawaii Agricultural Statistics. 2004. Hawaii Ag-Tourism. http://www.nass.usda.gov/Statistics_by_State/Hawaii/index.asp.
__________. 2008. Hawaii Ag-Tourism. Hawaii: Department of Agriculture, National Agricultural Statistics.
Hilchey, Duncan. 1993. Leisure Trends Create Opportunities for Farmers. AgFocus November: 10.
Jolly, Desmond A. and Kristin A. Reynolds. 2005. Consumer Demand for Agricultural and On-Farm Nature Tourism. UC Small Farm Center Research Brief. http://sfp.ucdavis.edu/agritourism/agtourbrief0601.pdf.
Kuehn, Diane and Duncan Hilchey. 1999. New York State’s 1999 Agritourism Business Study. http://www.nrs.fs.fed.us/pubs/gtr/gtr_ne289/gtr_ne289_217.pdf.
Leff, Penny. 2009. New Farm Stand Regulations Now in Effect Expand Options. Small Farm News, Volume 2. Small Farm Program, Cooperative Extension, University of California.
Lobo, Ramiro E., George E. Goldman, Desmond A. Jolly, B. Diane Wallace, Wayne L. Schrader, and Scott A. Parker. 1999. Agritourism Benefits Agriculture in San Diego County. California Agriculture 53(6): 20-24. http://ucce.ucdavis.edu/files/repositoryfiles/ca5306p20-67422.pdf.
McGehee, Nancy G., and Kyungmi Kim. 2004. “Motivation for Agri-Tourism Entrepreneurship.” Journal of Travel Research 43: 161-170.
National Agriculture Statistics Service (NASS). 1994. 1992 Census of Agriculture: Washington State Level Data. Washington, DC: U.S. Department of Agriculture.
__________. 1999. 1997 Census of Agriculture: Washington State Level Data. Washington, DC: U.S. Department of Agriculture.
__________. 2004. 2002 Census of Agriculture: Washington State Level Data. Washington, DC: U.S. Department of Agriculture.
__________. 2009. 2007 Census of Agriculture: Washington State Level Data. Washington, DC: U.S. Department of Agriculture.
New England Agricultural Statistics Service. 2001. Vermont Agri-Tourism 2000. http://www.nass.usda.gov/Statistics_by_State/New_England_includes/Publications/agtour00.pdf.
__________. 2004. Vermont Agri-Tourism 2002. http://www.nass.usda.gov/Statistics_by_State/New_England_includes/Publications/agtour04.pdf.

13
Nickerson, Norma P., Rita J. Black, and Stephen F. McCool. 2001. Agritourism: Motivations behind Farm/Ranch Business Diversification. Journal of Travel Research 40: 19-26.
Rademaker, Lee, Norma P. Nickerson, and Kara Grau. 2007. Montana’s Agritourism and Recreation Business: Ten Years Later. Research Report 2007-4. Missoula, MT: Institute for Tourism and Recreation Research.
Ryan, Susan, Kristy DeBord, and Kristin McClellan. 2006. Agritourism in Pennsylvania: An Industry Assessment. Report prepared for The Center for Rural Pennsylvania, a legislative agency of the Pennsylvania General Assembly.
Vasquez, Michele. 2008. Agri-tourism Homestay Project. Final Report prepared in conjunction with the Agri-tourism Workgroup. Spokane, WA: Washington State Governor’s Office of Regulatory Assistance.

14
AppendixAppendix 1. Survey to Identify Agritourism Operations in Washington
Agritourism is a rapidly developing business opportunity that farmers in many parts of the U.S. are beginning to embrace. Although we know of a number of agritourism businesses in Washington, we know there are many more in the state that we are unaware of. The first step in our research aimed at documenting the current and potential future economic impact of agritourism is to identify as many agritourism operations in the state as possible. Please help us to do this by completing this brief survey. Thank you!
—WSU Extension, IMPACT Center and School of Economic Sciences
County:
Name of person filling out survey:
1) How knowledgeable would you say you are about agritourism?
q Very Knowledgeable q Somewhat Knowledgeable q Not Very Knowledgeable
2) Are you or someone else in your office interested in being involved in educational programs to help farmers and others learn about agritourism?
a. q YES q NO
b. If "YES," please provide the name(s) of persons:
3) Are you aware of people in your county or other nearby areas involved in agritourism businesses of some type (other than wineries)?
a. q YES q NO
b. If "NO," please skip to question #5
4) Please list as many agritourism operations and contact people for these operations as you are aware of in your county or area.
— Use Attached Sheets for Answers to this Question —
5) Are there other agencies or people (e.g., visitors' bureau, chamber of commerce, etc.) in your county who you believe to be knowledgeable about agritourism and who might potentially know of additional agritourism operations in the area?
a. q YES q NO
b. If "YES," can you please provide names and contact information for them?
6) Do you have any additional questions, comments, or information related to agritourism in Washington you would like to share with us?

15
Contact Info for Agritourism Operations (Annex to Question 4)
Please provide what information you can about each agritourism business
Name of business:
Briefly describe the nature of agritourism business:
Name of owner/manager:
Phone Number:
Mailing Address:
Email Address:
Website Address:
Name of business:
Briefly describe the nature of agritourism business:
Name of owner/manager:
Phone Number:
Mailing Address:
Email Address:
Website Address:
Name of business:
Briefly describe the nature of agritourism business:
Name of owner/manager:
Phone Number:
Mailing Address:
Email Address:
Website Address:
16
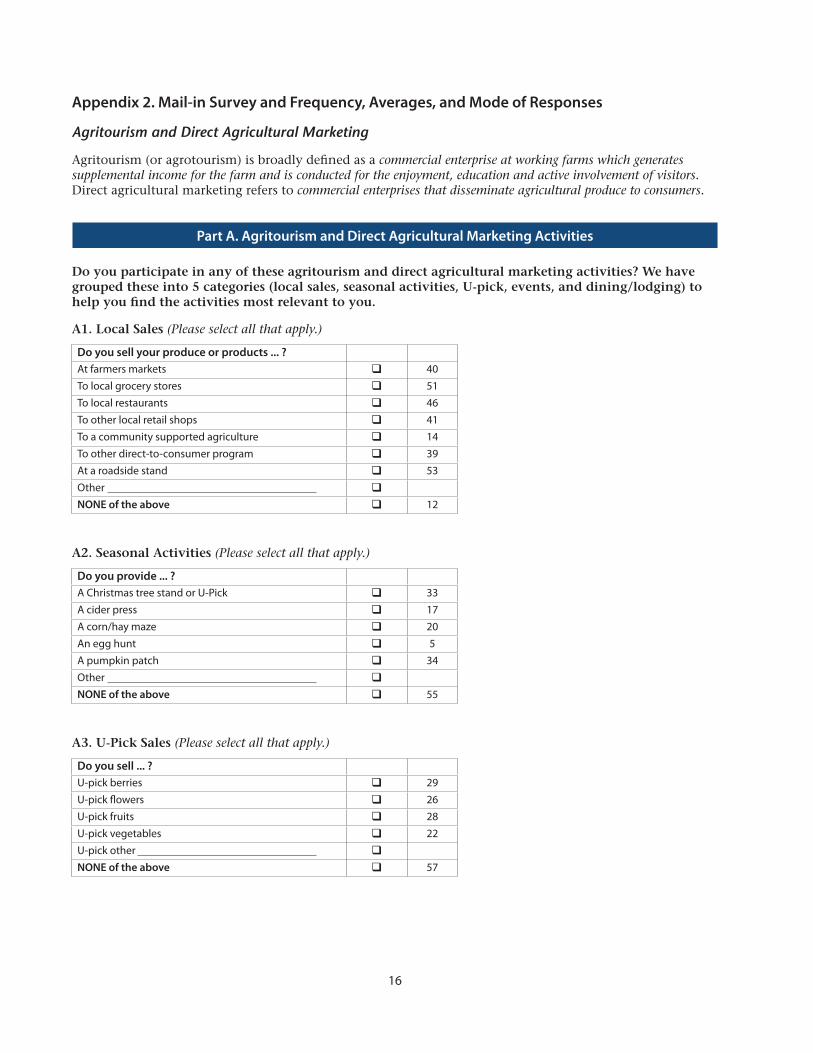
Appendix 2. Mail-in Survey and Frequency, Averages, and Mode of Responses
Agritourism and Direct Agricultural Marketing
Agritourism (or agrotourism) is broadly defined as a commercial enterprise at working farms which generates supplemental income for the farm and is conducted for the enjoyment, education and active involvement of visitors. Direct agricultural marketing refers to commercial enterprises that disseminate agricultural produce to consumers.
Do you participate in any of these agritourism and direct agricultural marketing activities? We have grouped these into 5 categories (local sales, seasonal activities, U-pick, events, and dining/lodging) to help you find the activities most relevant to you.
A1. Local Sales (Please select all that apply.)
Do you sell your produce or products ... ?At farmers markets q 40To local grocery stores q 51To local restaurants q 46To other local retail shops q 41To a community supported agriculture q 14To other direct-to-consumer program q 39At a roadside stand q 53Other qNONE of the above q 12
A2. Seasonal Activities (Please select all that apply.)
Do you provide ... ?A Christmas tree stand or U-Pick q 33A cider press q 17A corn/hay maze q 20An egg hunt q 5A pumpkin patch q 34Other qNONE of the above q 55
A3. U-Pick Sales (Please select all that apply.)
Do you sell ... ?U-pick berries q 29U-pick flowers q 26U-pick fruits q 28U-pick vegetables q 22U-pick other qNONE of the above q 57
Part A. Agritourism and Direct Agricultural Marketing Activities

17
A4. Events (Please select all that apply.)
Do you provide the following ... ?Dairy, milking, cheese-making q 5Guide services (hunting, fishing, rafting, etc.) q 5Historic farm demonstrations, activities q 16Horse (pony, etc.) rental, rides, or lessons q 12Onsite hunting, fishing q 9Pack animal rental q 0Performances (music, plays) q 23Petting zoo q 20Ranch or farm tours q 64Sheep (goat, alpaca) spinning, shearing, etc. q 5Wagon, hay rides q 30Weddings and special events q 40Wine tours, tastings q 32Other qNONE of the above q 74
A5. Accommodations & Dining (Please select all that apply.)
Do you provide the following ... ?Bed & Breakfast q 7Guest house, cabin rental q 12Restaurant q 9RV park q 1Special dining events q 29Working farm, ranch vacations q 7Other qNONE of the above q 74
A6. Of the items marked as "Yes," please write the primary activity that corresponds to your primary direct marketing/recreation/tourism business:
A7. Do you have guests or visitors?
q No (28) è Skip to A10
q Yes (91)
A8. On average, how many paying guests visit your agritourism and/or direct agricultural marketing business per month?
# of guests per month — High season Average: 6561
# of guests per month — Low season Average: 1057
18
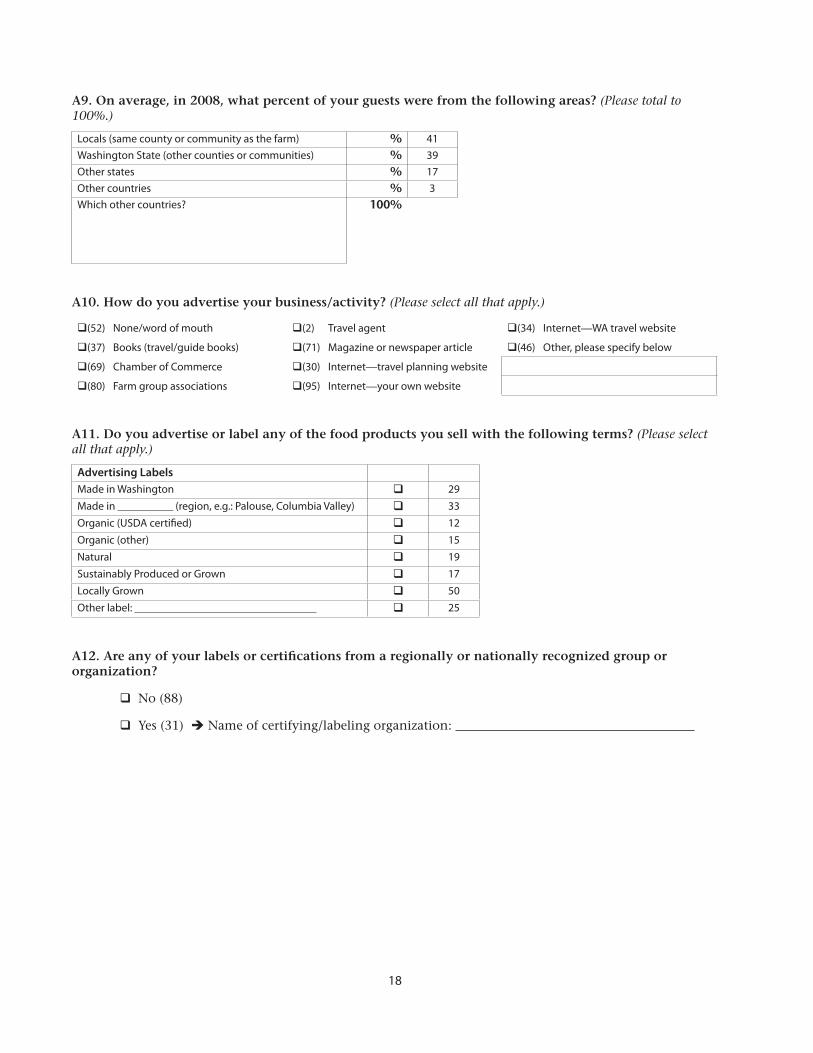
A9. On average, in 2008, what percent of your guests were from the following areas? (Please total to 100%.)
Locals (same county or community as the farm) % 41Washington State (other counties or communities) % 39Other states % 17Other countries % 3Which other countries? 100%
A10. How do you advertise your business/activity? (Please select all that apply.)
q(52) None/word of mouth q(2) Travel agent q(34) Internet—WA travel website
q(37) Books (travel/guide books) q(71) Magazine or newspaper article q(46) Other, please specify below
q(69) Chamber of Commerce q(30) Internet—travel planning website
q(80) Farm group associations q(95) Internet—your own website
A11. Do you advertise or label any of the food products you sell with the following terms? (Please select all that apply.)
Advertising LabelsMade in Washington q 29Made in (region, e.g.: Palouse, Columbia Valley) q 33Organic (USDA certified) q 12Organic (other) q 15Natural q 19Sustainably Produced or Grown q 17Locally Grown q 50Other label: q 25
A12. Are any of your labels or certifications from a regionally or nationally recognized group or organization?
q No (88)
q Yes (31) è Name of certifying/labeling organization:

19
Part B. Social Networking Background
In order to understand the potential future of agritourism and direct marketing, it will help to know what social connections you have and how those might help support your agritourism and agricultural enterprises.
B1. Do you currently belong to any farm, tourism, or community organization?
q No (12)
q Yes (107) è Which ones?
B2. Would you be interested in interacting with other agricultural producers who engage in agritourism activities?
q No (32)
q Yes (87)
B3. Have you had any contact with any of the following local or state agencies or personnel to help you in your farming or agritourism business? (Please select all that apply.)
AgentsExtension agent q 76State agency q 39County or city government q 46Other q 24None q 25
Part C. Motivations and Challenges in Operating the Agritourism and Direct Agricultural Marketing Business
C1. How important is each of the following reasons for operating an agritourism and/or direct agricultural marketing business?
Not important
1 2 3 4
Extremely important
5 Mea
n
Mod
eFor additional income q q q q q 4.50 5
For employment of family members q q q q q 3.08 5
To provide a service/opportunity to the community q q q q q 3.76 5
For tax incentives q q q q q 2.18 1
As a hobby; for fun, "to keep active" q q q q q 2.27 1
To help educate, teach people about farming, agriculture q q q q q 3.75 5
20
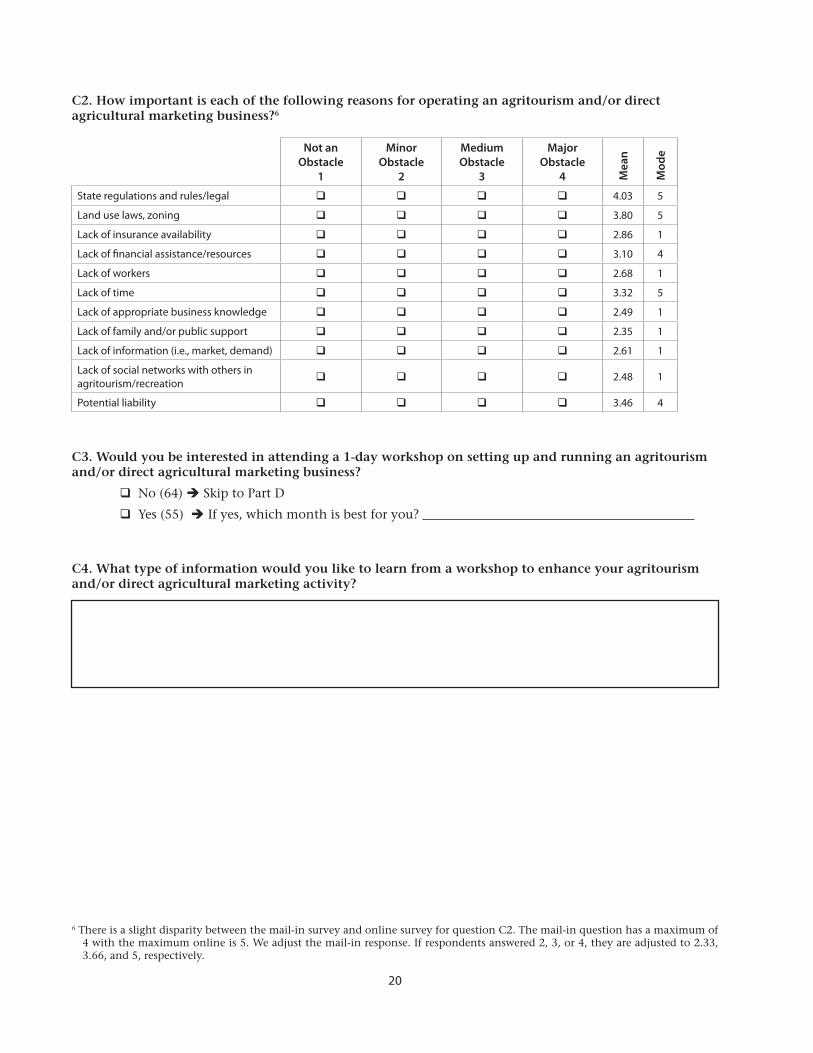
C2. How important is each of the following reasons for operating an agritourism and/or direct agricultural marketing business?6
Not an Obstacle
1
Minor Obstacle
2
Medium Obstacle
3
Major Obstacle
4 Mea
n
Mod
e
State regulations and rules/legal q q q q 4.03 5
Land use laws, zoning q q q q 3.80 5
Lack of insurance availability q q q q 2.86 1
Lack of financial assistance/resources q q q q 3.10 4
Lack of workers q q q q 2.68 1
Lack of time q q q q 3.32 5
Lack of appropriate business knowledge q q q q 2.49 1
Lack of family and/or public support q q q q 2.35 1
Lack of information (i.e., market, demand) q q q q 2.61 1
Lack of social networks with others in agritourism/recreation q q q q 2.48 1
Potential liability q q q q 3.46 4
C3. Would you be interested in attending a 1-day workshop on setting up and running an agritourism and/or direct agricultural marketing business?
q No (64) è Skip to Part D
q Yes (55) è If yes, which month is best for you?
C4. What type of information would you like to learn from a workshop to enhance your agritourism and/or direct agricultural marketing activity?
6 There is a slight disparity between the mail-in survey and online survey for question C2. The mail-in question has a maximum of 4 with the maximum online is 5. We adjust the mail-in response. If respondents answered 2, 3, or 4, they are adjusted to 2.33, 3.66, and 5, respectively.
21
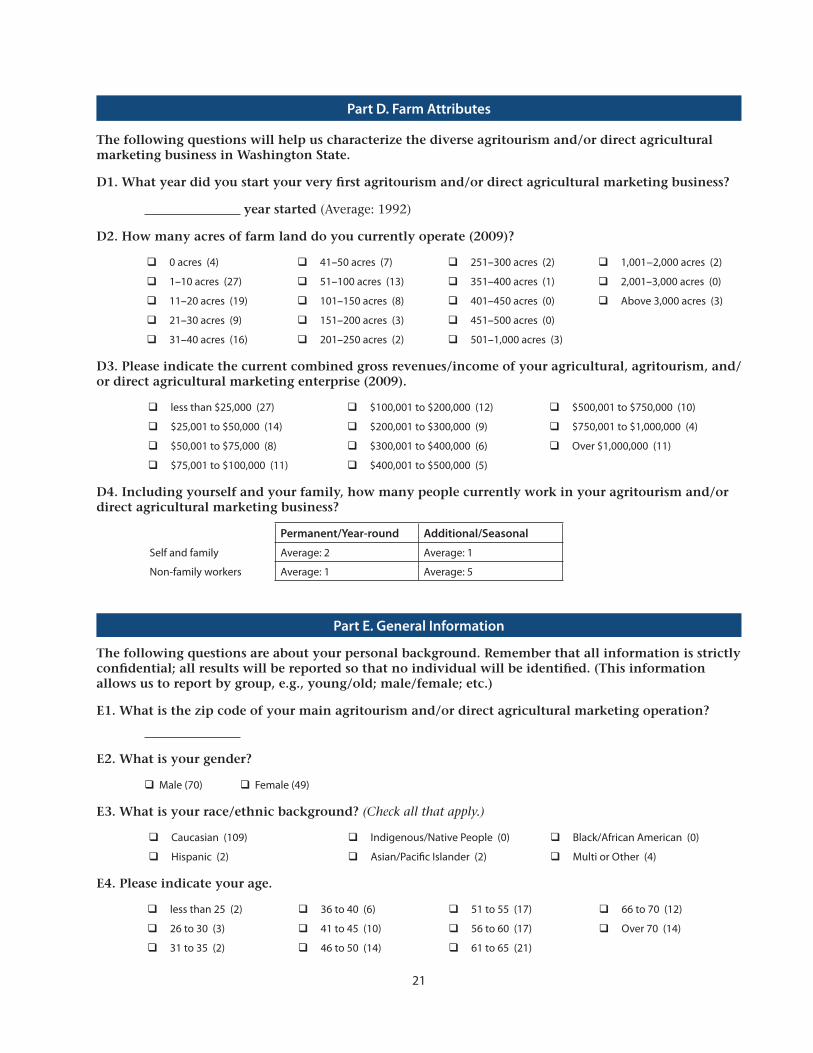
Part D. Farm Attributes
The following questions will help us characterize the diverse agritourism and/or direct agricultural marketing business in Washington State.
D1. What year did you start your very first agritourism and/or direct agricultural marketing business?
year started (Average: 1992)
D2. How many acres of farm land do you currently operate (2009)?
q 0 acres (4) q 41–50 acres (7) q 251–300 acres (2) q 1,001−2,000 acres (2)
q 1–10 acres (27) q 51–100 acres (13) q 351–400 acres (1) q 2,001–3,000 acres (0)
q 11–20 acres (19) q 101–150 acres (8) q 401–450 acres (0) q Above 3,000 acres (3)
q 21–30 acres (9) q 151–200 acres (3) q 451–500 acres (0)
q 31–40 acres (16) q 201–250 acres (2) q 501–1,000 acres (3)
D3. Please indicate the current combined gross revenues/income of your agricultural, agritourism, and/or direct agricultural marketing enterprise (2009).
q less than $25,000 (27) q $100,001 to $200,000 (12) q $500,001 to $750,000 (10)
q $25,001 to $50,000 (14) q $200,001 to $300,000 (9) q $750,001 to $1,000,000 (4)
q $50,001 to $75,000 (8) q $300,001 to $400,000 (6) q Over $1,000,000 (11)
q $75,001 to $100,000 (11) q $400,001 to $500,000 (5)
D4. Including yourself and your family, how many people currently work in your agritourism and/or direct agricultural marketing business?
Permanent/Year-round Additional/Seasonal
Self and family Average: 2 Average: 1
Non-family workers Average: 1 Average: 5
Part E. General Information
The following questions are about your personal background. Remember that all information is strictly confidential; all results will be reported so that no individual will be identified. (This information allows us to report by group, e.g., young/old; male/female; etc.)
E1. What is the zip code of your main agritourism and/or direct agricultural marketing operation?
E2. What is your gender?
q Male (70) q Female (49)
E3. What is your race/ethnic background? (Check all that apply.)
q Caucasian (109) q Indigenous/Native People (0) q Black/African American (0)
q Hispanic (2) q Asian/Pacific Islander (2) q Multi or Other (4)
E4. Please indicate your age.
q less than 25 (2) q 36 to 40 (6) q 51 to 55 (17) q 66 to 70 (12)
q 26 to 30 (3) q 41 to 45 (10) q 56 to 60 (17) q Over 70 (14)
q 31 to 35 (2) q 46 to 50 (14) q 61 to 65 (21)

22
E5. Please indicate your highest level of formal education.
q Some High School (2) q AA (2 yr) degree (6) q Graduate degree (MA, PhD, etc.) (19)
q High school graduate (12) q Some college (19) q Professional degree (Law, MD, etc.) (4)
q High school GED (0) q College degree (BA/BS) (38)
q Technical degree (2) q Some post-graduate education (16)
E6. Please indicate your total net annual household income (All sources: Off and On-farm income).
q less than $30,000 (17) q $120,001 to $150,000 (10) q Over $300,000 (1)
q $30,001 to $60,000 (34) q $150,001 to $200,000 (4) q If willing, specify income:
q $60,001 to $90,000 (27) q $200,001 to $250,000 (4)
q $90,001 to $120,000 (15) q $250,001 to $300,000 (4)
E7. Any comments about agritourism and/or direct agricultural marketing
The last section (Part F: Sustainability and Marketing) of this survey contains four questions and is Optional.
Farms come in all shapes, sizes and types. Farm operators vary at least as much. With the increasing attention given to greenness and sustainability*, we are trying to identify how direct marketing and agritourism operators approach sustainable food system/marketing issues. The following questions will help us to understand how YOU approach these issues.
*Sustainability (definition): The capacity of the food production and distribution system to provide high-quality safe food over the long term, with minimal damage to soil, water, air, and wildlife habitat quality.
If you are willing to answer Part F, please continue to page 10.
If not, you are done and we thank you for your participation! Please use the enclosed return envelope to mail us your completed questionnaire and yellow paper which contains the gift card information you wish to receive.
23
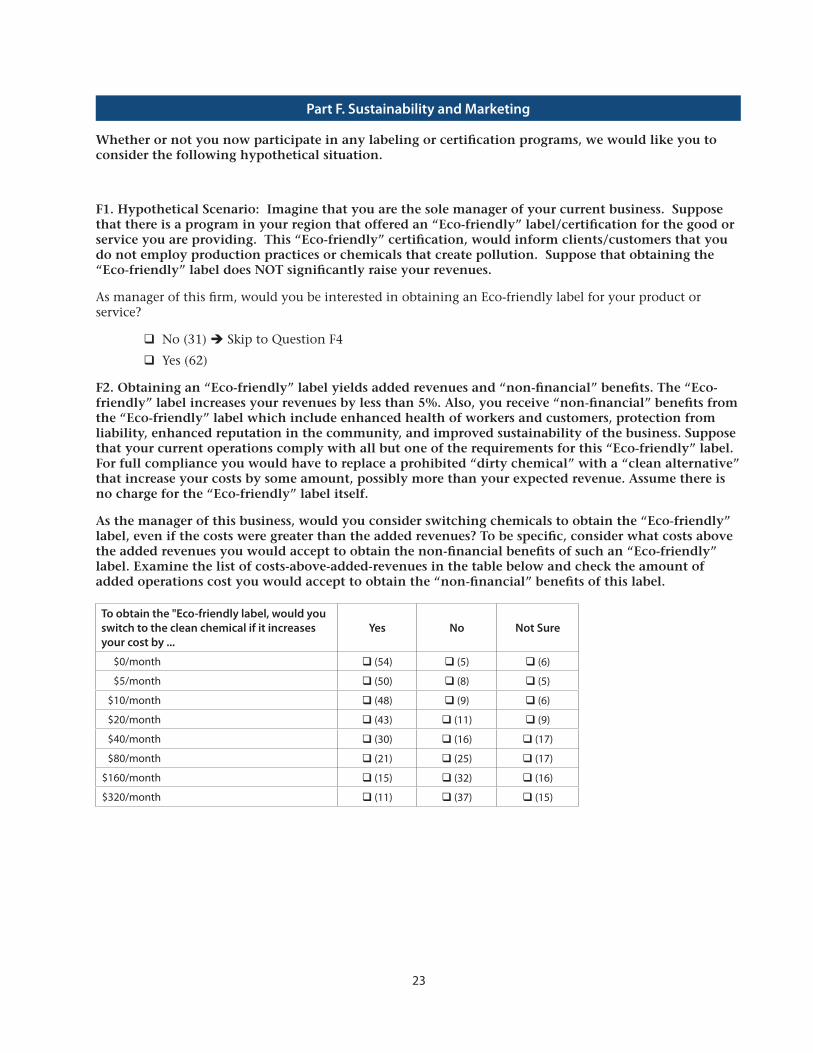
Part F. Sustainability and Marketing
Whether or not you now participate in any labeling or certification programs, we would like you to consider the following hypothetical situation.
F1. Hypothetical Scenario: Imagine that you are the sole manager of your current business. Suppose that there is a program in your region that offered an “Eco-friendly” label/certification for the good or service you are providing. This “Eco-friendly” certification, would inform clients/customers that you do not employ production practices or chemicals that create pollution. Suppose that obtaining the “Eco-friendly” label does NOT significantly raise your revenues.
As manager of this firm, would you be interested in obtaining an Eco-friendly label for your product or service?
q No (31) è Skip to Question F4
q Yes (62)
F2. Obtaining an “Eco-friendly” label yields added revenues and “non-financial” benefits. The “Eco-friendly” label increases your revenues by less than 5%. Also, you receive “non-financial” benefits from the “Eco-friendly” label which include enhanced health of workers and customers, protection from liability, enhanced reputation in the community, and improved sustainability of the business. Suppose that your current operations comply with all but one of the requirements for this “Eco-friendly” label. For full compliance you would have to replace a prohibited “dirty chemical” with a “clean alternative” that increase your costs by some amount, possibly more than your expected revenue. Assume there is no charge for the “Eco-friendly” label itself.
As the manager of this business, would you consider switching chemicals to obtain the “Eco-friendly” label, even if the costs were greater than the added revenues? To be specific, consider what costs above the added revenues you would accept to obtain the non-financial benefits of such an “Eco-friendly” label. Examine the list of costs-above-added-revenues in the table below and check the amount of added operations cost you would accept to obtain the “non-financial” benefits of this label.
To obtain the "Eco-friendly label, would you switch to the clean chemical if it increases your cost by ...
Yes No Not Sure
$0/month q (54) q (5) q (6)
$5/month q (50) q (8) q (5)
$10/month q (48) q (9) q (6)
$20/month q (43) q (11) q (9)
$40/month q (30) q (16) q (17)
$80/month q (21) q (25) q (17)
$160/month q (15) q (32) q (16)
$320/month q (11) q (37) q (15)

24
F3. When you are considering green/sustainability programs like the one described above, how important is each of these reasons? (Please check one box in each row.)
I would join ...Not
ImportantSomewhat Important
Very Important
Most Important M
ean
Mod
e
To increase product appeal & revenues q q q q 3.08 3
To decrease costs, now or in future q q q q 2.55 3
To help comply with legal requirements q q q q 2.32 2
To reduce potential liability (legal actions) q q q q 2.36 2
To improve the well-being of farm/food workers q q q q 3.18 4
To improve the well-being of customers q q q q 3.29 4
To increase my reputation as a "good citizen" q q q q 2.95 3
F4. When you are considering programs like the one described above, how important are the reasons NOT to join the program? (Please check one box in each row.)
Reasons for not joining:Not
ImportantSomewhat Important
Very Important
Most Important M
ean
Mod
e
It will increase costs too much. q q q q 2.66 3
There is too much uncertainty about costs & revenues. q q q q 2.49 2
It "opens doors" to future regulation. q q q q 2.61 4
My methods are already safe and sustainable. q q q q 3.18 4
I already have "eco-friendly" label/certificates. q q q q 1.79 1
I already have "eco-friendly" reputation. q q q q 2.61 4
Thank you for your participation!
Please use the enclosed return envelope to mail us your completed questionnaire and yellow paper which contains the gift card information you wish to receive.
By Gregmar I. Galinato, Assistant Professor, Suzette P. Galinato, Research Associate, IMPACT Center, Hayley H. Chouinard, Associate Professor, Mykel R. Taylor, Assistant Professor, and Philip R. Wandschneider, Professor, School of Economics, Washington State University, Pullman.
Copyright 2011 Washington State University
WSU Extension bulletins contain material written and produced for public distribution. Alternate formats of our educational materials are available upon request for persons with disabilities. Please contact Washington State University Extension for more information.
You may order copies of this and other publications from WSU Extension at 1-800-723-1763 or http://pubs.wsu.edu.
Issued by Washington State University Extension and the U.S. Department of Agriculture in furtherance of the Acts of May 8 and June 30, 1914. Extension programs and policies are consistent with federal and state laws and regulations on nondiscrimination regarding race, sex, religion, age, color, creed, and national or ethnic origin; physical, mental, or sensory disability; marital status or sexual orientation; and status as a Vietnam-era or disabled veteran. Evidence of noncompliance may be reported through your local WSU Extension office. Trade names have been used to simplify information; no endorsement is intended. Published October 2011.
EM040E
Acknowledgements
This study was funded by the WSU IMPACT Center through the USDA CSREES Special Research Grants (OGRD Grant Number 106392-004) as part of the Enhancing Competitiveness of Washington Agricultural Products project.
The authors thank Dr. Curtis Beus, WSU Okanogan County Extension Director, for his contributions to the development and implementation of the first stage of our survey; Fred Berman, WSDA Small Farm Program Coordinator, and Hank Manriquez, Cascade Foothills Farmland Association President, for their comments that helped streamline the survey questionnaire; Dr. Norma Nickerson, The University of Montana, Institute for Tourism and Recreation Research Director, for sharing their survey instrument in a Montana farm and ranch recreation and tourism study; and all WSU Extension faculty and staff for their participation in the initial survey. The authors also thank Aaron Olanie for research assistance and Justin Taylor for the online survey design and data cleaning.