Agriregionieuropa Farm level impact of rural development policy: a conditional difference in...
16
agriregionieuropa Farm level impact of rural development policy: a conditional difference in difference matching approach Salvioni C. 1 and Sciulli D. 2 1 DASTA, University of Chieti-Pescara, Pescara, Italy and SPERA 2 DMQTE, University of Chieti-Pescara, Pescara, Italy and SPERA 122 nd European Association of Agricultural Economists Seminar Evidence-Based Agricultural and Rural Policy Making Methodological and Empirical Challenges of Policy Evaluation February 17 th – 18 th , 2011, Ancona (Italy) associazioneAlessandroBar tola studi e ricerche di economia e di politica agraria Centro Studi Sulle Politiche Economiche, Rurali e Ambientali Università Politecnica delle Marche
-
date post
19-Dec-2015 -
Category
Documents
-
view
219 -
download
0
Transcript of Agriregionieuropa Farm level impact of rural development policy: a conditional difference in...

agrir
egio
nie
urop
a
Farm level impact of rural development policy: a conditional difference in difference matching approach
Salvioni C.1 and Sciulli D.2
1 DASTA, University of Chieti-Pescara, Pescara, Italy and SPERA 2 DMQTE, University of Chieti-Pescara, Pescara, Italy and SPERA
122nd European Association of Agricultural Economists Seminar
Evidence-Based Agricultural and Rural Policy MakingMethodological and Empirical Challenges of Policy Evaluation
February 17th – 18th, 2011, Ancona (Italy)
associazioneAlessandroBartola studi e ricerche di economia e di politica agraria
Centro Studi Sulle Politiche Economiche, Rurali e AmbientaliUniversità Politecnica delle Marche

agrir
egio
nie
urop
a
122nd EAAE Seminar, February 17th – 18th , 2011, Ancona (Italy)
Aim of the paperEU Rural development objectivesPolicy evaluation
– Assessing the counterfactual: matching methods
– Propensity score method– Diff-in-diff method
DataResultsWork in progress: the LFAs schemeFuture work
Plan of presentation

agrir
egio
nie
urop
a
122nd EAAE Seminar, February 17th – 18th , 2011, Ancona (Italy)
A key issue in policy evaluation is the establishment of a baseline or counter-factual scenario to determine “additionality”, i.e. the additional net impact that particular policy measures have had on a variable of interest. Propensity Score Mathing (PSM) methods can provide a tool to identify whether significant and causal differences in outcome variables occur between farms receiving and those not receiving a subsidy.
The aim of this paper is to evaluate the impact of the implementation of the first Italian Rural Development Programme (2000-06 period).
Aim of the paper

agrir
egio
nie
urop
a
122nd EAAE Seminar, February 17th – 18th , 2011, Ancona (Italy)
EU RD policy objectives
A menu of measures (22+4) that can be structured around 3 axes aiming at
a) improving the competitiveness of agriculture and forestry by encouraging farmers to structural changes (Axis 1);
b) improving the environment and the countryside (Axis 2); c) improving the quality of life in rural areas and encouraging
diversification of economic activity (Axis 3)
General goals of RD policy: To increase employment and GDP growth (Lisbon Strategy) Sustainable development (Goteborg Strategy)

agrir
egio
nie
urop
a
122nd EAAE Seminar, February 17th – 18th , 2011, Ancona (Italy)
Assessing the counterfactual: matching methods
Quasi-experimental (non-random) method used to construct control groups when it is not possible to obtain participating (“treatment”) and non-participating (“non-treatment”) groups through experimental design. It consists of constructing a comparison group using matching comparisons.
Matching involves identifying non–programme participants comparable in essential characteristics to participants. Both participating and non-participating groups should be matched on the basis of either a few observed characteristics or a number of them that are known or believed to influence both participation and programme outcomes.

agrir
egio
nie
urop
a
122nd EAAE Seminar, February 17th – 18th , 2011, Ancona (Italy)
Propensity Score Matching
PSM is a tool for identifying a suitable comparison group which can then be compared to the treatment group. Matching is done by using the propensity score, i.e. predicted probability of participation given observed characteristics p(X), which is estimated as a function of individual characteristics based on a statistical model (logit or probit model).
This method allows one to find a comparison group from a sample of non-participants closest to the treatment group in terms of observable characteristics.
agrir
egio
nie
urop
a
122nd EAAE Seminar, February 17th – 18th , 2011, Ancona (Italy)
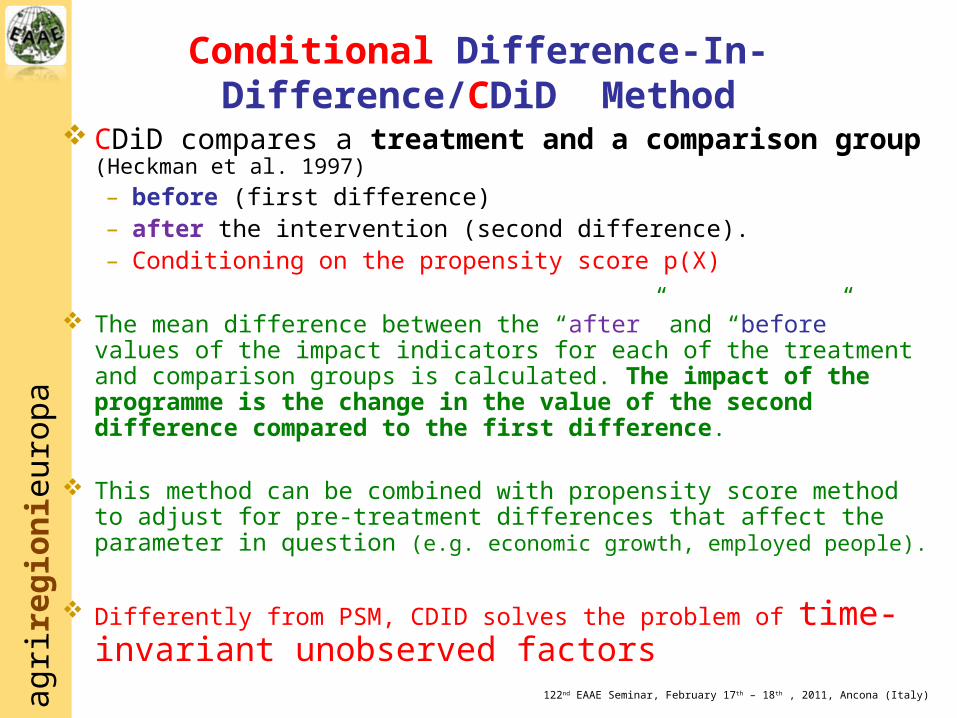
Conditional Difference-In-Difference/CDiD Method
CDiD compares a treatment and a comparison group (Heckman et al. 1997)
– before (first difference)– after the intervention (second difference). – Conditioning on the propensity score p(X)
The mean difference between the “after” and “before” values of the impact indicators for each of the treatment and comparison groups is calculated. The impact of the programme is the change in the value of the second difference compared to the first difference.
This method can be combined with propensity score method to adjust for pre-treatment differences that affect the parameter in question (e.g. economic growth, employed people).
Differently from PSM, CDID solves the problem of time-invariant unobserved factors

agrir
egio
nie
urop
a
122nd EAAE Seminar, February 17th – 18th , 2011, Ancona (Italy)
Data
The analysis is based on a panel of more than 3000 Italian family farms drawn from the 2003-2007 Italian FADN sample. Sample: stratified according to criteria of geographical region, economic size
(ESU) and farming type (FT). Field of observation: commercial farms (economic size greater than 4 ESU -
4,800 euro)
5 waves balanced panel of farms containing only those holdings for which information where collected in all years of the 2003-2007 period.
2000-03 2003 2004-2007 2007 2008 …
Volontary survey (not random sample)
Pre-treatment
(no RDP payments)
Treatment group: 341 farms (13.32%)
Control group: 2200 farms
outcomes Not
available (yet)

agrir
egio
nie
urop
a
122nd EAAE Seminar, February 17th – 18th , 2011, Ancona (Italy)
Type Variables Mean Std. Dev. Mean Std. Dev.
Outcomes (2003-2007)
D FAWU 0.077 0.608 0.003 0.592 **
D AWU 0.320 2.229 0.153 2.082D UAA 0.961 22.152 -0.375 12.460 *
D TAA 5.777 74.608 -0.454 14.208 ***
D Added value*/AWU 2090.295 34733.780 1120.656 29729.130D Profit/FAWU ratio 301.731 3418.284 -12.257 799.997 ***
Covariates (2003)
Age of the operator 54.100 13.746 50.325 13.217 ***
Male operator 0.760 0.428 0.807 0.395 **
North-West 0.217 0.413 0.195 0.396North-East 0.158 0.366 0.241 0.428 ***
Centre 0.220 0.415 0.180 0.384 *
South 0.279 0.449 0.289 0.453Islands 0.126 0.332 0.095 0.294 *
Plane 0.196 0.398 0.359 0.480 *
ESU < 8 0.161 0.368 0.196 0.397FT olive 0.079 0.270 0.071 0.256FT wine 0.050 0.218 0.067 0.249FT field crops 0.279 0.449 0.374 0.484 ***
FT citrus 0.073 0.261 0.095 0.294FT livestock 0.229 0.421 0.154 0.361 ***
Environ. protected areas 0.065 0.246 0.030 0.170 ***
Pluriactivity 0.079 0.270 0.150 0.357 ***

agrir
egio
nie
urop
a
122nd EAAE Seminar, February 17th – 18th , 2011, Ancona (Italy)
Horizontal axis: intervals of the propensity score;height of each bar on the vertical axis: fraction of the relevant sample with scores in the corresponding interval.
The figure shows that the overlapped region is quite wide, hence it is not needed to eliminate a relevant number of observations.
Propensity score histograms by treatment status
0 .2 .4 .6 .8Propensity Score
Untreated Treated

agrir
egio
nie
urop
a
122nd EAAE Seminar, February 17th – 18th , 2011, Ancona (Italy)
Average Treatment Ettect of the treated (ATT) –
RDP

agrir
egio
nie
urop
a
122nd EAAE Seminar, February 17th – 18th , 2011, Ancona (Italy)
Results Not significant impact on AWU: RDP did not produce a direct
impact on agricultural employment. Significant positive impact on FAWU.
Family labor substituted to waged labor force– Self-exploitation (accepting returns to owned labour and land lower than
the market wage and rent) to cope with external economic pressures and survive economic crisis;
– Maximization of farm family income (cope with high unemployment in rural areas – diversification increases on farm labor opportunities).
Significant positive impact on FNVA/AWU and profits/FAWU: RDP did produce a direct positive impact on agricultural and rural GDP.
Not significant impact on farm land, either total and cropped.

agrir
egio
nie
urop
a
122nd EAAE Seminar, February 17th – 18th , 2011, Ancona (Italy)
Work in progress: the LFAs scheme

agrir
egio
nie
urop
a
122nd EAAE Seminar, February 17th – 18th , 2011, Ancona (Italy)
Average Treatment Effect of the treated – LFA
Our findings suggest that the measure promoted the extensivation of farm production, while not negatively affecting farmers’ income.
These evidences appear to be encouraging in respect with the use of payments for ecosystem services (PES), that is payments, such as the compensatory allowances paid under the LFAs scheme, to compensate farmers for maintaining or promoting the use of sustainable farming systems in environmentally sensitive areas, in view of preserving farmland landscapes and conserving fragile environments.

agrir
egio
nie
urop
a
122nd EAAE Seminar, February 17th – 18th , 2011, Ancona (Italy)
Future work
Update the analysis in order to capture the long standing effect of RD policy.
A further direction of research is to enlarge the set of outcome variables in order to evaluate the environmental impact of measures.
In addition, it would be of interest to disentangle the complementarities between measures, for example LFAs compensatory allowances and agri-environmental measures.

agrir
egio
nie
urop
a
122nd EAAE Seminar, February 17th – 18th , 2011, Ancona (Italy)
Thank for your attention