Agriregionieuropa The CAP and the EU budget Do ex-ante data tell the true? Franco Sotte Università...
20
agriregionieuropa The CAP and the EU budget Do ex-ante data tell the true? Franco Sotte Università Politecnica delle Marche – Ancona (Italy) 122 nd European Association of Agricultural Economists Seminar Evidence-Based Agricultural and Rural Policy Making Methodological and Empirical Challenges of Policy Evaluation February 17 th – 18 th , 2011, Ancona (Italy) associazioneAlessandroBar tola studi e ricerche di economia e di politica agraria Centro Studi Sulle Politiche Economiche, Rurali e Ambientali Università Politecnica delle Marche
-
date post
19-Dec-2015 -
Category
Documents
-
view
216 -
download
0
Transcript of Agriregionieuropa The CAP and the EU budget Do ex-ante data tell the true? Franco Sotte Università...

agrir
egio
nie
urop
a
The CAP and the EU budget Do ex-ante data tell the true?
Franco Sotte
Università Politecnica delle Marche – Ancona (Italy)
122nd European Association of Agricultural Economists Seminar
Evidence-Based Agricultural and Rural Policy MakingMethodological and Empirical Challenges of Policy Evaluation
February 17th – 18th, 2011, Ancona (Italy)
associazioneAlessandroBartola studi e ricerche di economia e di politica agraria
Centro Studi Sulle Politiche Economiche, Rurali e AmbientaliUniversità Politecnica delle Marche

agrir
egio
nie
urop
a
122nd EAAE Seminar, February 17th – 18th , 2011, Ancona (Italy)
Summary
Overview on the CAP budget data on which the political debate on CAP reform relies
How different is the CAP passing from – its ex-ante image (MFP, appropriations for
commitments) – to its ex-post one (actual payments,
Financial Reports)Implications Conclusive remarks

agrir
egio
nie
urop
a
122nd EAAE Seminar, February 17th – 18th , 2011, Ancona (Italy)
The budget : an opportunity for policy analysisExpenditure is quantifiable
– It is expressed in monetary terms– This facilitates
• analysis• comparison in terms of time and space
– It is possible to • calculate simple and intuitive indicators • draw graphs and maps
It is easy to understand and interpret even for non experts – politicians (voters)

agrir
egio
nie
urop
a
122nd EAAE Seminar, February 17th – 18th , 2011, Ancona (Italy)
Risks with expenditure analysis
considering expenditure as the objective of the policy while it is only an instrument
neglecting differences btw ex-ante allocations and ex-post payments– attention concentrated on promises not on real
resultsunder-valuing the interplay btw policiespaying insufficient attention to indirect costs of a
policy – over-compensation, payments for costs never
incurred, deadweight effect, administrative costs, private connected costs, delays in payments

agrir
egio
nie
urop
a
122nd EAAE Seminar, February 17th – 18th , 2011, Ancona (Italy)
Breakdown of the EU MFP budget
Source: http://ec.europa.eu/budget/library/publications/budget_in_fig/syntchif_2009_e.pdf
Administrative costs should not be included: DG AGRI has 970 employees

agrir
egio
nie
urop
a
122nd EAAE Seminar, February 17th – 18th , 2011, Ancona (Italy)
CAP expenditure according to the DG AGRI web site
agrir
egio
nie
urop
a
122nd EAAE Seminar, February 17th – 18th , 2011, Ancona (Italy)
Appropriations for Payments 2009
Net of administrative costs = 47,1 per cent
44,0%

agrir
egio
nie
urop
a
122nd EAAE Seminar, February 17th – 18th , 2011, Ancona (Italy)
The CAP payments (Financial Report 2009)
Pillar1 / Total CAP
Pillar2 / Total CAP
Pillar1 / Net total
Pillar2 / Net total
Total CAP/ Net total EU
% % % % %
EU-15 87,5 12,5 51,3 7,4 58,6North-15 85,8 14,2 55,5 9,2 64,6Centre-15 87,3 12,7 54,4 7,9 62,4South-15 88,4 11,6 46,5 6,1 52,5EU-12 56,1 43,9 18,0 14,1 32,1EU-27 82,4 17,6 42,7 9,1 51,8Out MS 100,0 0,0 34,6 0,0 34,6Total EU 84,1 15,9 41,6 7,9 49,5
agrir
egio
nie
urop
a
122nd EAAE Seminar, February 17th – 18th , 2011, Ancona (Italy)
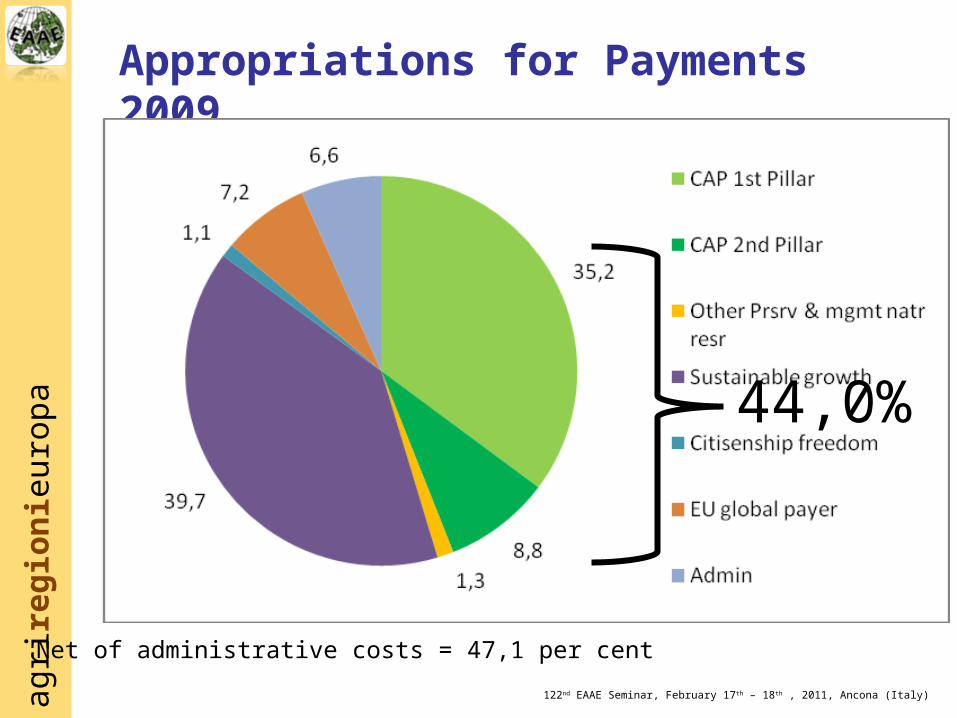
The CAP on the overall EU payments (net of administrative costs)
Financial Report – 2009
EU-27 -Total CAP
Pillar 1
Pillar 2

agrir
egio
nie
urop
a
122nd EAAE Seminar, February 17th – 18th , 2011, Ancona (Italy)
Reasons for the discrepancy btw appropriations and paymentsBefore the Commitment
– ability of MSs and regions to co-finance– ability of beneficiaries to enter into commitments– Late approval of programs by MSs / Regions
Withdrawal of the beneficiary and cancellation of commitments– Bank refusal to grant credit– Change in business plan– Discover of better funding opportunities in
competing policies– Death of the beneficiary or change in family
decisions Inflationary effect when payment is delayed

agrir
egio
nie
urop
a
122nd EAAE Seminar, February 17th – 18th , 2011, Ancona (Italy)
EU-12
EU-15
EU-27South
NorthCentre
(net from administrative costs)
The CAP on the overall EU payments by groups of MSs

agrir
egio
nie
urop
a
122nd EAAE Seminar, February 17th – 18th , 2011, Ancona (Italy)
The CAP on the Total EU payments per MS
Weighted average percentage - years 2007-2008-2009
agrir
egio
nie
urop
a
122nd EAAE Seminar, February 17th – 18th , 2011, Ancona (Italy)
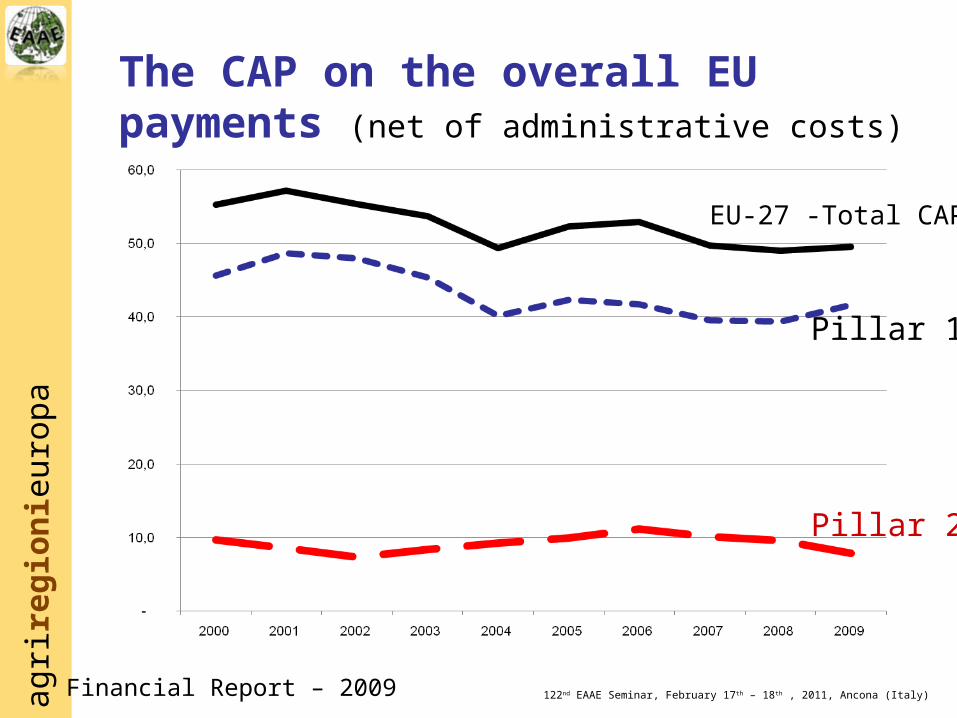
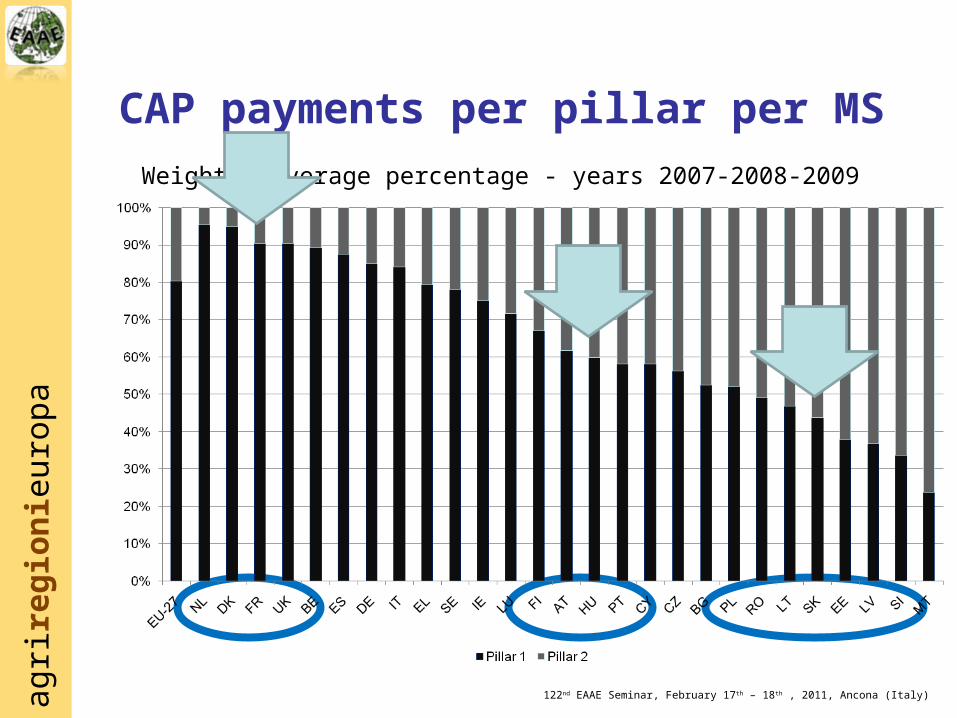
CAP payments per pillar per MSWeighted average percentage - years 2007-2008-2009

agrir
egio
nie
urop
a
122nd EAAE Seminar, February 17th – 18th , 2011, Ancona (Italy)
CAP expenditure per unit
CAP / AWU CAP / UAA CAP Ag Val add
euroindex
EU=100 euroindex
EU=100 euroindex
EU=100
EU-15 7630,4 182,5 348,4 121,8 35,2 101,2
North-15 12232,4 292,6 299,5 104,7 58,7 168,7
Centre-15 10208,5 244,2 368,4 128,8 35,9 103,1
South-15 5140,1 123,0 354,7 124,0 28,8 82,9
EU-12 1063,8 25,4 132,4 46,3 32,4 93,0
EU-27 4180,4 100,0 286,0 100,0 34,8 100,0
Weighted average percentage - years 2007-2008-2009
57 16 8

agrir
egio
nie
urop
a
122nd EAAE Seminar, February 17th – 18th , 2011, Ancona (Italy)
CAP payments in Italy
Payments €
CAP expenditure CAP beneficiariesAverage payment
Absolute value in
M€%
Absolute value in
000%
Euro per beneficia
ry
Less than 1.000 301.8 5.5 765.1 58.3 394
>1 000. <=5 000 791.4 14.5 352.2 26.8 2247>5 000. <=10 000 622.9 11.4 91.9 7.0 6780>10 000. <=25 000 971.7 17.8 67.2 5.1 14456>25 000. <=50 000 674.1 12.3 21.2 1.6 31861>50 000. <=100 000 573.6 10.5 9.2 0.7 62350More than 100 000 1538.5 28.1 4.9 0.4 314101
Total 5473.9 100.0 1311.6 100.0 4173
2,7%50,8%
85,1%20,0%

agrir
egio
nie
urop
a
122nd EAAE Seminar, February 17th – 18th , 2011, Ancona (Italy)
Comment
There are good reasons for a radical change– probably, for the few richest farms, the CAP
payments represent just an additional rent– while for the plethora of small farms, which
in Italy have generally a subsidiary role in the family interests and income, it has a minimal incidence

agrir
egio
nie
urop
a
122nd EAAE Seminar, February 17th – 18th , 2011, Ancona (Italy)
Concentration of CAP payments in Italy in quintiles
a) sorted by CAP payments / UAA b) sorted by CAP payments / AWU

agrir
egio
nie
urop
a
122nd EAAE Seminar, February 17th – 18th , 2011, Ancona (Italy)
Comment
Such strong concentration of the CAP expenditure in terms both of recipients and localization significantly reduces any alleged link between the present CAP expenditure and the provision of public goods through agriculture
agrir
egio
nie
urop
a
122nd EAAE Seminar, February 17th – 18th , 2011, Ancona (Italy)
Conclusions
The ex-ante image of the CAP is significantly and systematically distorted in comparison with its ex-post image– The relative weight of the CAP on the EU budget
changes, as well as the ratio between pillars 1 and 2.
Recognising this gap between image and reality – brings the discussion on the CAP and its reform
process to a more objective ground– suggests
• making more of an effort to rationalize implementation and administrative procedures
• attributing more importance to evaluation and monitoring

agrir
egio
nie
urop
a
122nd EAAE Seminar, February 17th – 18th , 2011, Ancona (Italy)
Thank [email protected]