Agriculture Sector Analysis 300113
24
India Agricultural Sector review
-
Upload
arnav-sarkar -
Category
Documents
-
view
225 -
download
1
description
agricultural sector review INDIA
Transcript of Agriculture Sector Analysis 300113

India Agricultural Sector review

Overview
• Post independence till 1964. Reliance on imported food and Food AID from Developed countries and UN.
• 1960s –Green Revolution (wheat)• 1970s – extension to Rice – poorly irrigated areas.
Tube well system of irrigation increased.• 1980s - White revolution (milk)• 1990s - Yellow revolution (vegetable oils)• 2000s - Blue revolution (fisheries)• 2010s - Pink revolution (horticulture)

Overview
• Punjab, UP, MP, Haryana, Bihar top 5• Agriculture is a state list item and central govt can not
form uniform national policies• MSP generally is below market prices due to
inefficiency

Quick overview
• 20.43% of electricity consumption• Rs 8349 Cr import of fertilizer (8% of import bill)• 46 mn farmers covered under NAIS• Average size of holdings: 1.23 ha• Nearly 50% unirrigated• MSP and PDS systems• Various environmental concerns
• Fertilizers and pesticides• Animal husbandry

Farm SubsidiesCountry Subsidy / ha ($) % Pop dependent on
agriculture
USA 32 5
Japan 35 4
China 30 24
S Africa 24 18
India 14 60

Farm Subsidies
• Accounts for 40% of subsidy bill (Rs 190 K Cr); around 0.8% of GDP
• 87% through fertilizer subsidies (Rs 67K Cr)• 13% through electricity subsidies (Rs 10 K Cr)

Minimum support price (in Rs /q)
Kharif crop MSP Market
Paddy 1250 1300
Jowar / Ragi 1500 1500
Bajra / Maize 1175 1175
Arhar 3200 3850
Moong 3500 4400
Urad 4300 4300
Cotton 3600 3600
Groundnut/Sunflower 3700 3700
Soybean 2200 2200
Sesame 4200 4200
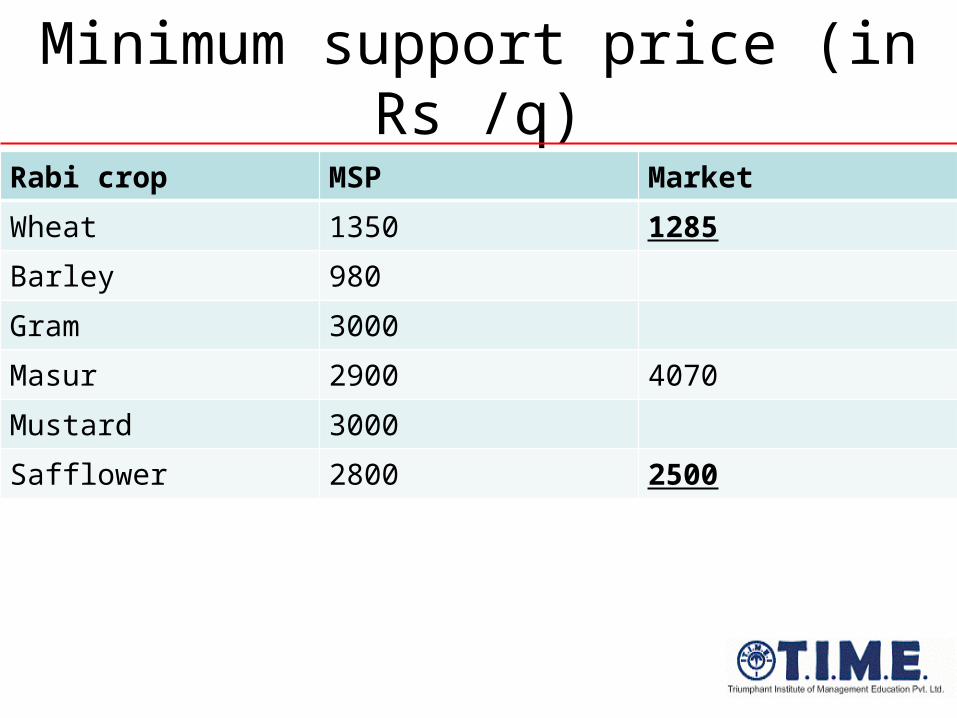
Minimum support price (in Rs /q)
Rabi crop MSP Market
Wheat 1350 1285
Barley 980
Gram 3000
Masur 2900 4070
Mustard 3000
Safflower 2800 2500

Land distribution: 305.7 mn ha
Forest69.6316% Non-agri
6%
Barren4%
Pasture2%
Trees/Groves1%
Wasteland3%Fallow land
33%
Net area sown33%

Fertilizer consumption: kg/ha
USA (40.1)China (92.7)
India (138.6)World (31.9)
N; 26.5N; 63.6 N; 84
N; 20.2
P; 7.5
P; 20.1
P; 36.2
P; 7
K; 6.2
K; 9
K; 18.4
K; 4.7

Land usage pattern
% land area % irrigated % fertilizers0
10
20
30
40
50
60
70
80
21
53
77
21
43
75
24
42
72
23
42
67
10
37
51MarginalSmallS MediumMediumLarge

Share in production (figures in percentage)
Food/cash crops; 52
Fruits/Veg; 16
Livestock; 26
Fisheries; 4 Horticulture etc; 2

Exports: 10.47% (figures in percentage)
Cotton11%
Marine10%
Oil9%
B.Rice9%
Sugar9%
Meats7%
Spices7%
Paper/Wood6%
Cereals3%
Tea3%
Others27%

Imports: 3.5% (figures in percentage)
Vegetable Oils52%
Wood13%
Pulses12%
Fruits & Nuts7%
Sugar 5%
Cashew Nuts4%
Spices2%
Cotton1%
Milk1%
Jute0%
Others2%

Sources of irrigation (51 mn ha)
Canals28%
Tanks4%
Wells18%
Tubewells 40%
Others9%

Crop-wise irrigation
Paddy Wheat Pulses Sugarcane Oilseeds Fibres
58.9
90.0
17.6
94.3
33.9
44.7
41.1
10.0
82.4
5.7
66.155.3

Monsoons in India (in mm)
2001-02
2002-03
2003-04
2004-05
2005-06
2006-07
2007-08
2008-09
2009-10
2010-11
800
900
1000
1100
1200
1300
ActualNormal
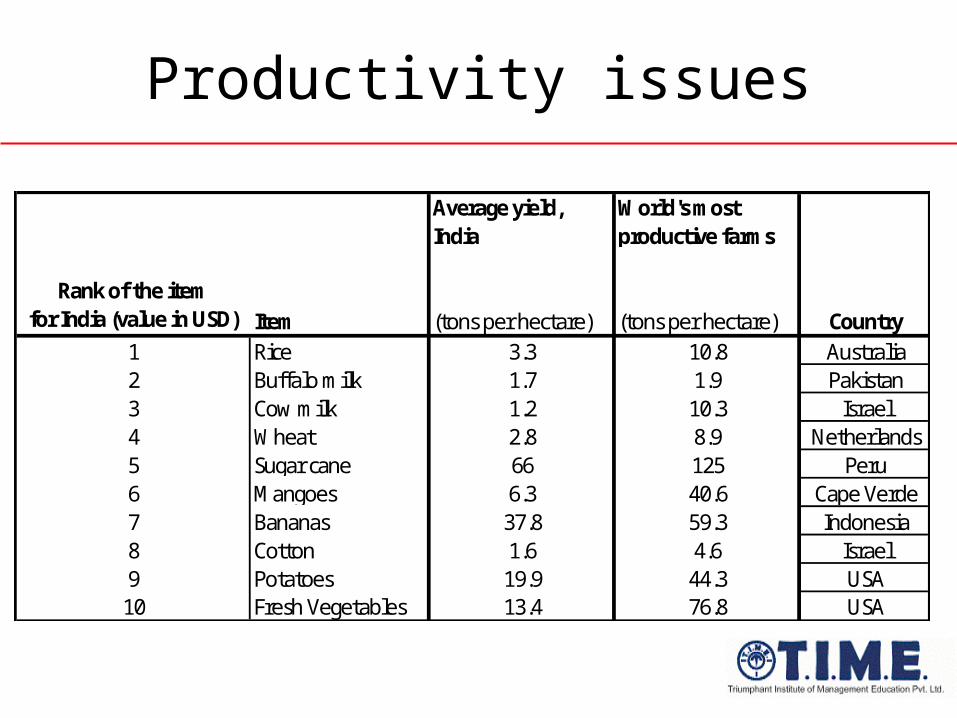
Average yield, India
World's most productive farms
Rank of the item for India (value in USD) Item (tons per hectare) (tons per hectare) Country
1 Rice 3.3 10.8 Australia2 Buffalo milk 1.7 1.9 Pakistan3 Cow milk 1.2 10.3 Israel4 Wheat 2.8 8.9 Netherlands5 Sugar cane 66 125 Peru6 Mangoes 6.3 40.6 Cape Verde7 Bananas 37.8 59.3 Indonesia8 Cotton 1.6 4.6 Israel9 Potatoes 19.9 44.3 USA
10 Fresh Vegetables 13.4 76.8 USA
Productivity issues

Crop Average farm yield in Bihar Average farm yield in Punjabkilogram per hectare kilogram per hectare
Wheat 2020 3880Rice 1370 3130Pulses 610 820Oil seeds 620 1200Sugarcane 45510 65300
Productivity issues

Supply chain issues
Supply Chain Farmer
Village Comm. Agent
District Comm. Agent
Wholesaler
Sub-Wholesaler
Retailer Consumer
Margin-% share of final price
35% 15% 10% 10% 10% 20%
Issues
Non transparent pricingLimited financial capabilityPrimitive cleaning, sorting & grading facility
Wastage rampantLack of quality and hygiene consciousnessLop sided pricingOpportunistic profiteering
High pricesLimited choices

Supply chain issues
Description Cumulative Wastage
Potato 24%
Cauliflower 24%
Banana 30%
Cabbage 36%
Tomato 40%

Road ahead
• ITC e-choupal: from 2000-2007,– 6,400 internet kiosks , 4 million farmers, 38,000 villages, 9 states– It also serves as a purchase centre for 13 agricultural commodities– In 2006-07, ITC purchased about 2 million tons of wheat, soybeans,
coffee, shrimps & pulses, worth $ 400 million through these e-choupal networks.
• ITC Choupal Fresh Model:– Providing Extension services (technical know-how, market
information) – Freedom to sell anywhere at prevailing market price, ITC offering a
buying platform production and market risks are borne by the farmer.– On retail front, instead of super markets, chain of “push carts”

More opportunities
• Drip irrigation• Rainwater harvesting• Organic farming• Packaged farming products• Microfinance• Crop insurance• CSR initiatives

WTO
• Agreement on Agriculture– domestic support – MSP, subsidies – Market access
– reduction of import duties by 24%– export subsidies
– Reduce by 14% by volume, 24% by valye