AGRICULTURAL MONITORING - ESA
60
AGRICULTURAL MONITORING BR-128/II
Transcript of AGRICULTURAL MONITORING - ESA

AGRICULTURALMONITORING
BR-128/II

The Need for BetterInformationSince its inception, the CommonAgricultural Policy (CAP) has been theEuropean Community’s biggest singlebudgetary item. More than 60% of theCommunity’s agricultural output isregulated by mechanisms that determineinternal prices and incomes to producersand processors using agriculturalproducts emanating from the Community.In 1995, this activity absorbed about 48%of the European Union’s total budget.Major goals include increasingproductivity and stabilising internalmarkets whilst adapting Europeanagriculture to an increasingly competitiveinternational environment and to theenlargement to the east. Control ofagricultural expenditure is therefore akey objective of European Union policy.
The European Commission has identifiedthe following needs for information foragricultural monitoring: • distinguish, identify and measure the
areas of important crops in Europe • estimate production early in the year• check the validity of farmers’
applications for EU subsidies.
The primary information need forexpenditure control is to determinebefore harvest time what a farmer isgrowing, in order to predict yields,anticipate the market and estimate thesupport needed. There is a major timeconstraint in that the relevant informationhas to be gathered in the periodbetween crop emergence and cropharvesting, which is just a few months.
The Limitations of TraditionalTechniquesThe Common Agricultural Policyprogramme currently depends on thetimely gathering of information via fieldand aerial surveys, i.e. operationalsystems that provide accurate data buthave a number of inherent drawbacks,including:• difficulties in comparing statistics and
validating information collected by thevarious European countries, whichcurrently use different methodologiesfor monitoring and measuring theiragricultural production
• availability of production estimatesonly close to harvest time
• time-consuming and expensive natureof frequent field trips and airbornesurveys.
AGRICULTURALMONITORING
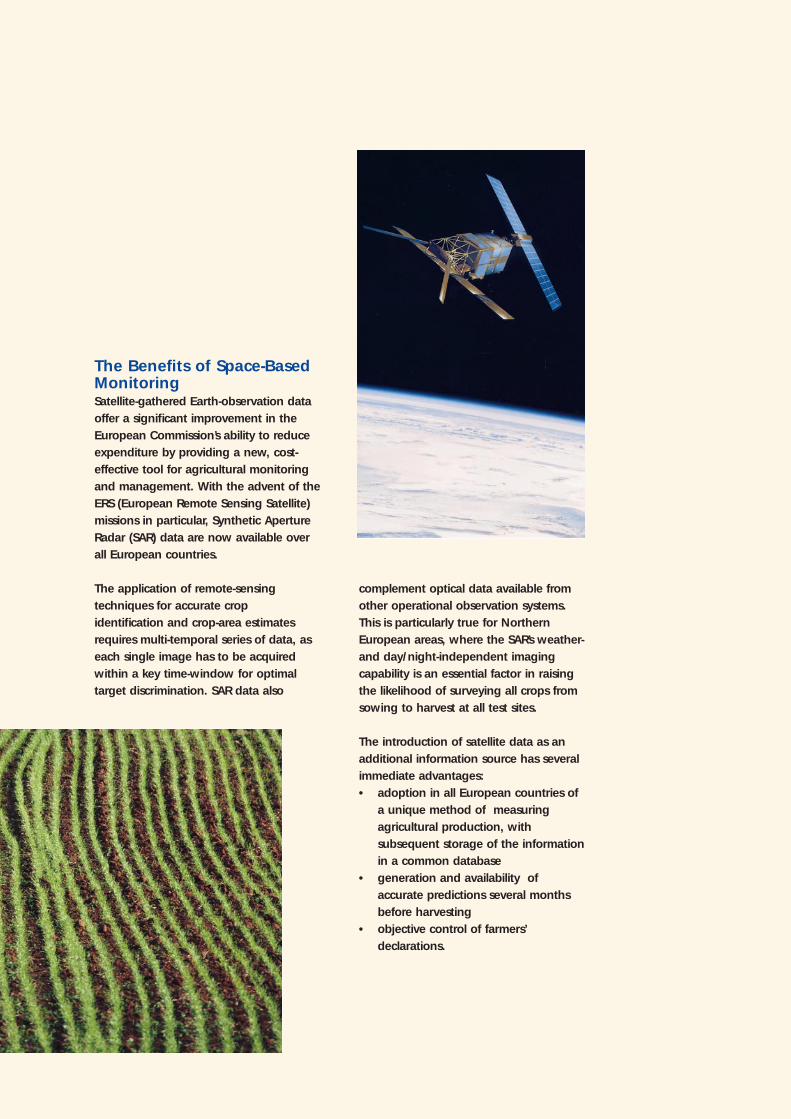
complement optical data available fromother operational observation systems.This is particularly true for NorthernEuropean areas, where the SAR’s weather-and day/night-independent imagingcapability is an essential factor in raisingthe likelihood of surveying all crops fromsowing to harvest at all test sites.
The introduction of satellite data as anadditional information source has severalimmediate advantages: • adoption in all European countries of
a unique method of measuringagricultural production, withsubsequent storage of the informationin a common database
• generation and availability of accurate predictions several months before harvesting
• objective control of farmers’declarations.
The Benefits of Space-BasedMonitoringSatellite-gathered Earth-observation dataoffer a significant improvement in theEuropean Commission’s ability to reduceexpenditure by providing a new, cost-effective tool for agricultural monitoringand management. With the advent of theERS (European Remote Sensing Satellite)missions in particular, Synthetic ApertureRadar (SAR) data are now available overall European countries.
The application of remote-sensingtechniques for accurate cropidentification and crop-area estimatesrequires multi-temporal series of data, aseach single image has to be acquiredwithin a key time-window for optimaltarget discrimination. SAR data also

The Contribution of ERS SAR Qualitative and quantitative experimentsto assess the potential of ERS SAR data foragricultural monitoring have shown veryencouraging results. The detectioncapability of this instrument iscomparable to that provided by theoptical sensors commonly used so far.
ERS SAR data, with their 25 m resolution,supply information on the crop structureas it grows and, thanks to the highaccuracy and stability of the ERS-1 andERS-2 SARs, precise and repeatablemeasurements can be made throughoutthe growing season. Crop discriminationis achieved by analysing the radar signalbackscatter using multi-temporal datasets. By taking advantage of theparticular sensitivity of SAR to surfaceroughness, additional information aboutsoil preparation can be collected andanalysed during the winter months toprovide early estimates for major croptypes. Indications of generic crop classes,such as grassland, winter crops (smoothseedbeds at the onset of winter) andspring/summer crops (rough fields) canalso be derived. With the multi-temporalapproach, one can also monitor changesin surface roughness, which are indicativeof soil tillage and crop-class-specificactivity. Still better crop-typediscrimination can be achieved by thecombined analysis of the reflectance andbackscatter, respectively, of the opticaland radar data sets. By using ERS SARdata, the chances of obtaining both earlyestimates of crop production and crop
estimates over sites where optical dataare unavailable are substantiallyincreased.
SAR image processing and interpretationdoes have some constraints: • the interaction between microwaves
and land surfaces is not always clear:the temporal backscatter signature is dependent on both soil surfaceconditions, and vegetation type anddevelopment stage. Directional effects also have an influence on backscattering. Therefore, temporal backscattering profiles tend to be highly variable, especially early in theseason. Ancillary data, such as soil,meteorological and crop knowledge,need to be used as a support tosignature interpretation;
• strong geometric and radiometric distorsions of the image due to local relief have to be removed before analysis; and
• speckle noise needs to be reduced by applying filtering techniques.
These issues have been addressedthrough Pilot Projects in 1996 and 1997.

Examples of Space-BasedApplicationsThe MARS-STAT pre-operationalprojectIn 1988, the European Commissionapproved the creation of a ten-year pilotR&D project known as MARS (MonitoringAgriculture with Remote Sensing) topursue the application of remote sensingto help upgrade and unify its agriculturalstatistics system. The project, the aims ofwhich were defined jointly by theCommission’s Agriculture Directorate (DG VI) and the Statistical Office of theEuropean Communities (EUROSTAT), is run by the EC’s Joint Research Centre(JRC) in Ispra, Italy. The MARS-STATelement of the project is aimed atdeveloping methods for improvingagricultural statistics. Its results will formpart of the "Advanced System ofInformation on Agriculture" which, inaddition to data from conventionalsources, will employ remote-sensinginformation collected with both high- and low-resolution space sensors. Thesystem will incorporate sophisticatedinterpretation techniques as well as agro-meteorological models.
Colour-codedclassification resultsfrom the MARSproject’s Great Driffieldsite in the UnitedKingdom, using anoptimal four-datecomposite (spring andsummer images).Several distinct classesare discriminatedincluding: oil-seed rape,spring barley,grassland, winter barleyand winter wheat. Left: Knowledge-steered classification(analysis of ERS SARbyte composite incombination withoptical satellite imageryresults, meteorologicaldata, soil data, DEM,agronomic informationand ancillary siteinformation) with aclassification accuracyof 69.9%. Below: Unsupervisedisodata classificationwith a classificationaccuracy of 66.3%
LEGENDMask
Summer Crops
Winter Rape
Peas/Sugar Beet
Spring Cereals
Grass Land
Winter Barley
Winter Wheat
Other

The agricultural crops targeted are thosewith high market potential, but excludingfarm fodder crops. Representativeness issought not only at the Community level,but at national and regional level also. Aquick estimation of crop areas is derivedfrom an analysis of high-resolutionremote-sensing data sets acquired fromthe SPOT or Landsat (Thematic Mapper)missions. The system operations arebased on: • definition of a sample of
representative sites (60 for the whole of the European Community)
• acquisition, processing andinterpretation of satellite images over the test-site areas
• extraction of the information needed by means of computer-aided image-interpretation techniques.
The first reliable crop-area estimates areproduced at the end of April using opticalimagery. Each month from April toOctober, a single estimate of the yearlypercentage change for each crop and forthe whole of Europe is derived andforwarded to the EC’s Directorate Generalfor Agriculture within 10 days of thesatellite image acquisition.
The timeliness and quality of suchinformation derived from passive opticalsystems alone is subject to severalconstraints, not least those due tocloudiness and haze, which result in areduced sampling of the area. Thisproblem of data unavailability due tocloud cover can be overcome by usingmicrowave sensors such as the ERS SAR.
The feasibility of using SAR data to derivecrop estimates was tested in severalstudies in 1994 and 1995 at JRC with thesupport of the University of Stuttgart(Germany) and Synoptics (TheNetherlands). The continuity in suchstudies was ensured in 1996 by a PilotProject aimed at analysing the feasibilityof SAR data operational use within MARS.Initiated by DG VI, the work was carriedout by the Space Application Institute atJRC in cooperation with GAF (Germany),NRSC (UK) and Synoptics.
Twenty project sites were selected mainlyon the basis of historical data availabilityand frequent cloud cover. Three ERS SARimages were acquired over each site andsubmitted to a classification analysis afterthe application of image-processingtechniques such as geometric andradiometric correction and filtering.Optical satellite images from the previousyear were used to produce masksindicating non-arable land.
The classification was based on the use of decorrelated synthetic channelscomputed from the multitemporal datasets. This method was tested on three testsites of the MARS-STAT Project, within anexperimental study carried out in1995(Nezry et al., 1995).
A higher accuracy can be achieved byusing more data sets and further specificprocessing. A new method was thendeveloped and tested, based on byte-slicecomposition of scaled images (Lemoine etal., 1997). Significant results were

Synoptics (NL) and SOTEMA (F), was totest the time series interpretation of datain an operational context, with specialemphasis on such aspects as SAR datatimeliness and reliability, and projectcosts. These were drastically reducedcompared with those in the MARS-operational project. Five SAR images persite were analysed and estimates weregenerated which are presentlyundergoing a thorough validationprocess.
obtained at several test sites and could besatisfactorily compared with the existinginformation. The method was alsoadopted in the generation ofclassification products over selected testsites, based on long time series of data.
By using autumn and early springimagery, it is possible to separate cropgroups such as “winter crops”,“spring/summer crops” and “permanentgrassland”.
A more sophisticated degree ofseparation can be achieved through theuse of additional SAR data sets, alone orcombined with optical sensor data, ifpossible together with the application ofstatistical methods and with theintegration of ground-truth information.
In 1997, autumn and early spring SARdata were applied to 60 test sites withinthe framework of a second Pilot Project.The main objective of this project, carriedout with the support of NRSC (UK),
Synthetic channel composite for the Chartres (F) test site, with the meanbackscatter amplitude channel in red, the range-radar cross-section variation forthe time series in green and the date of maximum backscattering in blue. Fromthe first two channels, it is possible to separate urban, forest, grassland/baresoils and agricultural themes. From the third channel, crop identification ispossible by comparing the backscatter signal and the field preparation and thecrop calendar
Multitemporal ERS SAR image of the Chartres test site in France (28 November 1994 in red, 4 January 1995 in green and 10 February 1995 in blue)

Crops (areas in ha) ERS, 4 dates SPOT, 2 dates28 Nov. - 10 Feb. 4 Mar. - 5 May
Non cultivated 14 225 11 499Winter wheat 68 178 70 622Other cereals 5357 10 015
Rape seed 12 834 11 360Summer crops 24 368 25 784
Non agriculture 35 038 30 720
Comparison of early surface estimates for the Chartres (F) test site using ERS(results obtained in March 1995) and SPOT (results obtained in May 1995) data.The SPOT-based accuracy is estimated at 85%
Final classification for the Chartres (F) test site.Non-cultivated, bare soils and natural vegetation
low in winter appear black, forest is green, winterwheat on soils prepared before November
appears in red, winter wheat on soils preparedearly in November appears in pink, other winter
cereals appear in light grey, rape seed appears inyellow, soil prepared in February for summer crops,
as well as field peas and fodder beets are darkgrey, urban areas and roads appear in light blue

Controlling farmers’ declarationsMARS-CAP (Common Agricultural Policy)is a programme of activities conceived tosupport DG VI in controlling farmers’crop declarations. Every year, some 17billion European Currency Units (ECUs)are paid out in subsidies by theEuropean Commission directly to farmerscomplying with the CAP’s objectives andregulations, on the basis of farmers’requests. To help verify such cropdeclarations, new methods involving theuse of remote-sensing data have beenunder test since 1991. They have provedto be useful at both the regional andfield level.
Based on the analysis of multi-temporalremote-sensing data, the operationalsystem set up for the Commission andthe Member State Administrationsdetermines the individual crop classesrelated to specific farms on a field-by-fieldbasis. The results are compared with adigital map in which the candidateapplications for subsidy are listed. Anaccurate validation is then obtained on a’’per-farm’’ basis.

Another example of the usefulcontribution that remote-sensinginformation can make is the Pilot Projectset up in 1995 by the UK NationalRemote Sensing Centre on behalf of theMinistry of Agriculture, Fisheries andFood. The objective was to test theoperational use of ERS SAR datacollected over a particularly cloud-pronesite. A combined optical and radar (SAR)automatic classification, optimised on per-field signature characteristics, wasperformed after full correction of thegeometric and radiometric effects of theterrain. The main project deliverableswere reports on a ’’per-farm’’ basisindicating whether or not the applicationfor subsidies was justified. Theclassification accuracy obtained using ERSSAR data was comparable to that ofoptical satellite data, and accuracyimproved considerably when the opticaland radar data were combined. Theproject demonstrated conclusively thatSAR can be used operationally for thesuccessful control of area aiddeclarations.
In 1996, most of the EU States verifiedtheir farmers’ crop declarations usingeither satellite imagery or aerialphotography, thereby significantlyreducing the number and cost of fieldinspections. The work was organisedsuch that each Member State arrangedto have the highly specialised photo-interpretation work performed byexternal contractors on satellite imagery -including radar images - purchased bythe EC (at a cost of approx. 0.54 ECU perhectare, compared with 0.57 ECU foraerial photographs).
Great Driffield (UK): oneof the test sites of theMARS (MonitoringAgriculture with RemoteSensing) Project. Theimage derives from aclassification utilisingdata from the SAR(Synthetic ApertureRadar) instrumentonboard ERS-2. Itshows preliminaryresults obtained in earlyspring 1997 from theinterpretation of fourimages acquired in thetime frame betweenOctober 1996 andFebruary 1997. Fourdistinct classes can bediscriminated, namely:winter crops (yellow), spring crops(blue), summer crops(red) and grassland(green)

Contact Addresses For further information on projectsreferred to in this fact-sheet:
Agricultural Information SystemsMARS-STATSpace Applications InstituteJoint Research CentreMr G. LemoineI - 21020 ISPRA (VA), ItalyTel.: +(39) 332 786239Fax: +(39) 332 789936
NRSC Ltd.Ms J. ConwayDelta HouseSouthwood Crescent, SouthwoodFarnborough, Hampshire GU14 0NLUnited KingdomTel.: +(44) 1252 541464Fax: +(44) 1252 375016
SYNOPTICS, Integrated RS & GISApplications BVMr J. BakkerP.O. Box 1176700 AC WageningenThe NetherlandsTel.: +(31) 317 421 221Fax: +(31) 317 416 146
PRIVATEERS NV42 De Weaver DrivePhilpsburgNetherlands Antillesorc/o E. Nezry13 avenue de la Gloire31500 Toulouse, FranceTel./Fax: +(33) 5 61545827
Future OutlookFurther research into SAR data use needsto be conducted by taking advantage ofall of the information already gathered.There are now ample SAR data sets -thanks to ERS - and correspondingancillary data (ground surveys,agricultural practices) available for suchstudies, which need to focus on theoptimum combination for long-termagricultural applications of the radar databeing provided by ESA’s present ERSsatellites and forthcoming Envisatmission, as well as Radarsat. In the shortterm, the integration of the radar datawith optical datasets, as well as theimprovement and automation of theinterpretation cycle and the testing ofwide-area sampling, are importantobjectives.
An additional key factor could be theimplementation of quick imagedissemination systems, in order to ensurethe transmission via electronic networksof not only “browse” imagery, alreadyoperational today, but of customised, fullresolution SAR products referring to smallgeographical areas and tailored tospecific user requirements.
AcknowledgementsThe support provided by JRC (SAI) andPrivateers NV is gratefully acknowledged.

For further information on ERSdata applications:
Remote Sensing Exploitation DivisionData Utilisation SectionESRINVia Galileo Galilei00044 Frascati, ItalyTel: +(39) 6 94180626 or 625
For further information on the ERSProgramme, mission planning, datacatalogues:
Remote Sensing Exploitation DivisionERS Help DeskESRINVia Galileo Galilei00044 Frascati, ItalyTel: +(39) 6 94180666Fax: +(39) 6 94180272e-mail:[email protected]
For information on ERS productsand services (ERS Consortium):
EURIMAGE Customer Services Via Galileo Galilei00044 Frascati, ItalyTel.: +(39) 6 94180741/752/760/776 Fax: +(39) 6 9416772e-mail: [email protected] WWW: http://www.eurimage.it
SPOT Image 5 rue des SatellitesBP 435931030 Toulouse, Cedex 4, France Tel.: +(33) 562194040 Fax: +(33) 562194011 WWW: http://www.spotimage.fr
RADARSAT INTERNATIONAL3851 Shell Road, Suite 200 Richmond, British Columbia Canada V6X 2W2 Tel: (1) 604 2314970Fax: (1) 604 2440404e-mail: [email protected]: http://www.rsi.ca
ESA Publications Divisionc/o ESTEC, PO Box 299, 2200 AG Noordwijk, The NetherlandsTel. (31) 71 565 3400 - Fax (31) 71 565 5433
><Prepared by:Remote Sensing Exploitation DivisionESRIN

SATELLITE MAPPING
BR-128/II

The Need for BetterInformationMany remote areas of the World are nowbeing opened to exploration anddevelopment, generating a growingdemand for up-to-date maps of landtopography, land-use and otherinformation products. Such maps are ofgreat importance for activities rangingfrom managing and planning land-usedevelopment, to natural-resourcemanagement and engineering studies. Inthis context, more and more users havestarted to integrate cartographic andthematic mapping products into theirmanagement and decision-makingsystems.
The mapping industry worldwide iscurrently experiencing rapid technologicaland organisational change. A prerequisitefor obtaining a complete knowledge ofany landscape is to rely on as many datasources as possible. Today’s mappingprojects are therefore relying more andmore on multi-source remote-sensingtechniques capable of providing high-resolution data sets over widegeographical areas. In addition, mapproducts available in digital format are ofa great value in the rapidly expandingmarket of Geographical InformationSystems (GISs). These are now usedextensively to integrate data fromdifferent sources in domains like landmanagement, monitoring and planning.Moreover, map producers are looking tothe latest and least time-consumingmethods to ensure the best productquality at the lowest cost.
The Limitations of TraditionalTechniquesAerial surveys and ground measurementsare the conventional means of producingmaps. These traditional map-makingtechniques rely on scanning anddigitising processes for their updatingand injection into modern decision-management systems. However this typeof process does not allow the fast andcheap production of maps covering largegeographical areas such as entire regions.Consequently, there is a lack of regular
SATELLITE MAPPING

The Benefits of Space-BasedMonitoringBecause of its ability to provide fast, up-to-date information and wide spatialcoverage, spaceborne imagery is beingused more and more by the mappingindustry. Optical remote-sensing dataproducts are used to produce space mapson a wide range of scales to serve manydifferent needs. These include 1:50 000scale (one of the standard scales) mapcompilation and map updating, as wellas Digital Terrain Models (DTMs) based onstereoscopic imagery. Space maps aregeocoded products, annotated in thesame way as traditional maps.Although optical remote-sensinginformation is widely used particularly inremote regions, it has two majorlimitations:• excessive cloud cover often precludes
its utilisation, and• the location accuracy of individual
points within a space map is sometimesnot sufficient for some applications.
information updating and many mapsquickly become obsolete and aretherefore of little practical use.
Furthermore, statistics provided in 1987by a United Nations Secretariat Surveyshowed that more than 40% of theWorld’s land surface is still not covered by1:100 000 scale maps. Almost 50% is notcovered by 1:50 000 scale maps, and80% is not covered by 1:25 000 scalemaps.

The Contribution of ERS SARThe Synthetic Aperture Radar (SAR)instrument carried by the EuropeanRemote Sensing satellites ERS-1 and ERS-2 has proved extremely valuable indeveloping markets dependent on large-coverage maps on scales ranging from1:1 000 000 to 1:50 000. A large archiveof SAR data has been constructed sincethe launches of ERS-1 and ERS-2 in July1991 and April 1995, respectively, andthis database is continually beingupdated with new acquisitions.
The SAR is an active instrument thatproduces images under all weatherconditions by analysing the echoes (C-band and VV polarisation) transmittedfrom the satellite and backscattered bythe Earth’s surface. An ERS SAR scenecovers an area of 100 km by 100 km andhas a high geographical locationaccuracy. Because of the specificinteraction between the radar wave andthe ground surface, the informationcontent of SAR images is different fromthat of optical images.
The accompanying figures show a sampleimage-map product extract over FrenchGuiana derived from SPOT opticalimagery (a), and the equivalent image-map based on ERS-1 SAR data (b).Ground visibility is much improved in thelatter thanks to the radar’s cloudpenetration, while the topographicfeatures stand out clearly as a result ofthe SAR’s oblique viewing angle. Bothimages have been post-processed andgeo-referenced by CEGN (Cellule d’Etudes
en Geographie Numerique), thegeographic research department of theFrench armament agency.
The synergy between ERS SAR andoptical images, for both cartographicmap generation and updating, increasesthe ability to extract thematicinformation. Thematic and topographicmaps compiled using ERS SAR data allowone to detect and identify specificfeatures such as hydrographic networksand structures, which are particularlyimportant in geomorphologic analysisand geology.
In regions such as the tropics, whereoptical satellite information is eitherunavailable or not usable due toexcessive cloud cover, space mapsgenerated from SAR data are a precioustool, and sometimes represent the onlysolution. SAR images can be a uniquesource of information for compiling high-resolution space imagery at a continentalscale, and for providing highly valuablethematic information as the sensor can
(a)
(b)

Extract of IGN mapsheet over a test area(top left); subsets ofERS SAR PRI (top right)and SPOT XS (bottomleft) images acquiredover the same area;temporal filtering of ERSSAR PRI data (bottomright)
Filtering techniques applied on the SARimage can reduce this noisy effect, andthereby enhance image quality.
The example shows how multi-temporalfiltering techniques have been applied toSAR data by the French company SERTIT,specialised in image processing and GISsystems, in order to reduce the speckleand thus tobe able to use enhancedradarimagery as an input to GeograficalInformation System. The informationcontent of ERS temporally filtered imageis highly valuble in this context andfacilitates the interpretation
also discriminate between a wide varietyof land-cover types.
The capabilities of ERS for large-coverageimage mosaicing and thematic mappingworldwide are well-established. They arebased on state-of-the-art processingtechniques which allow improvement ofboth the radiometric and geometricquality of the data. For example, thespeckle induces alterations in the radio-metric resolution of SAR data. This effect,which is inherent in the SAR system anddue to the coherent nature of the SARsignal, gives a noisy effect in the images.

An ERS SAR imageoverlaid on an ERS-SAR-derived DTM of theMount Etna volcano,Italy
ERS SAR image maps can be exploited forvarious types of applications:• cartography: for map compiling and
updating taking advantage of the thematic information provided by the radar for broad applications and its capabilities to extract topographic information.
• localisation: to detect or identify controlpoints and localise targets on the ground surface, as a complement to GPS measurements for remote areas.
• rectification: to rectify old or inaccurate maps, space maps generated using remote-sensing data with inaccurate localisation accuracy, or even to rectify a Digital Terrain Model (DTM).
In addition, ERS SAR data products canbe used for topographic mapping asDigital Terrain Models can be providedusing techniques such as radargrammetryand interferometry (INSAR). Radargram-metry allows one to generate DTMs usingstereopairs of radar images with differentviewing angles, as for optical stereoimaging.
INSAR is based on the combination oftwo ERS SAR images acquired with slightlydifferent geometrical configurations. UsingINSAR, highly accurate DTMs can beproduced, depending mainly on thestability of the observed surface over timewith respect to radar signal phase andatmospheric effects that may affect thephase information during the acquisitions.Under favourable conditions, thealtimetric accuracy achievable can be afew metres.

ERS-1 SAR mosaic extract over the Odzala National Park, a major biosphere reserve in Central Africa (Republic of Congo). An importantsanctuary for birds and large mammals (gorillas, chimpanzees, forest elephants), the park’s vegetation is a complex of lowland rain forests,swamp forests, open forests with marantaceae and savannah. An extension of the park is planned to include a wider spectrum of foresttypes. The Odzala Park is currently managed through the ECOFAC (ECOsystemes Forestiers d’Afrique Centrale) Programme of theEuropean Union (DG VIII), dedicated to the conservation of the Central African ecosystems. The mosaic was produced to help theECOFAC team delineate the park’s future boundaries. The Central Africa Mosaic Project (CAMP) is part of a novel approach forcontinental-scale mapping of the tropical forest using radar remote sensing. The new approach calls for the rapid assembly of a vastamount (approximately 470 images) of high-resolution ERS-1 SAR imagery in order to obtain thematic information over the whole rain-forest domain of Central Africa at several scales and with unprecedented completeness, spatial resolution and quality. The CAMP imageryconsists of a multi-resolution pyramid of products with different spatial scales, generated using a wavelet representation. Both the so-calledsmooth images (approximations at that scale) and the detail images (texture measures) are generated at each resolution level.
This mosaic was assembled in the framework of the TREES Project (EU-JRC, Ispra)
Differential interferometry allows one tomeasure surface movements with asensitivity of the order of a fewcentimetres over large surfaces. Thistechnique can be applied for subsidencemonitoring and in the observation ofactive volcanoes, earthquakes and faults.
Moreover, interferometry can be used toextract thematic information from ERSSAR data for land-use mapping. Bycomputing the correlation of the SARsignal between the two images, valuablethematic information is obtained. Theinterferometric correlation, or coherence,mainly depends on radar waveinteractions with the target, and itstemporal stability. Such derived imagery isused as an additional channel allowingthe generation of multi-band radarproducts (i.e. colour composite productscombining coherence image, amplitudeimage, and amplitude change betweenthe two images).
Space-Based Services forCartographyToday, more and more specialisedcompanies are offering services includingvalue-added products like thosementioned above. The contribution ofERS SAR has proved fundamental inmeeting precision mapping requirements.
In the generation of geocoded products(rectified to a particular map projection),ground control points are needed todefine the geometric models and improvethe location accuracy. Generally, ground

control points are identified on maps, orsurveyed during field work when nomaps are available. It is often necessaryto use old and inaccurate maps, e.g. at1:250 000 or 1:500 000 scales. When nogeographic information (maps or GPSpoints) is available, the geocodingaccuracy is often driven by the SPOTsatellite’s absolute positioning accuracy,which is in the order of several hundredmetres for most optical data (e.g. SPOT).
Thanks to the high positioning accuracyof the ERS platform, and using thegeometric properties of SAR imagery, anew methodology has been developedrecently for localisation purposes. Such amethodology proposed and implementedby IGN-Espace allows the extraction ofnetworks of ground control points (GCPs)using a combination of ascending anddescending images. The methodology isbased on a space-triangulation technique,and uses ERS as a passive positioningsystem. The following results can beachieved:• absolute accuracy of localisation better
than 50 m in X,Y,Z (planimetric errors around 27 m and altimetric errors around 34 m)
• estimated r.m.s. precision around 15m for planimetry and 10 m for altimetry when combined with Global Positioning System (GPS) data.
The adoption of such a methodologyproves particularly useful whengenerating value-added products basedon satellite images such as: stereoscopicDTMs, ortho images, or space maps.
Moreover, this technique can helpsubstantially in reducing the field workneeded to determine GPS points, withconsequent cost and time savings. Agood example is when those networks ofreference points are used to geocodeSPOT data in remote regions.
The use of a similar technique has beeninvestigated by ISTAR to improve theabsolute positioning accuracy of SPOTproducts. It combines the geometricmodel of both ERS and SPOT satellites,and it is based on ERS SAR imagesacquired in the same mode (ascending ordescending). Such a methodology allowsone to reduce the number and the level

ERS SAR mosaic image of French Guiana based on data acquired in descendingmode. It was generated by merging two groups of 18 PRI ERS images indescending mode, acquired at two different time periods, in 1992 and in 1993-94, respectively. In addition, a strip of five scenes acquired in ascending modehas been used for localisation purposes, including height references
inaccessibility of the terrain and thealmost permanent cloud cover. It isvirtually impossible to conduct ground orairborne surveys, and to utilisespaceborne optical data extensively.
The available cartography includes 1:100 000 and 1:200 000 scale maps inthe form of sketches. Indeed, only thehydrographic network is present, withoutany altimetric information except somevery rare spot heights. Moreover, theplanimetric accuracy of such sheets ispoor, ranging from 100 to 200 m orworse. There is a tourist map at 1:500 000 scale available, but with poorelevation information and a lowgeometric accuracy.
The coastal plain is the only regionmapped at 1:25 000 scale, according tothe cartography produced by the FrenchNational Geographic Institute (IGN). Eachone of these maps contains contour lineswith adequate geometric accuracy. Anacceptable 1:50 000 map sheet series hasthen been derived over the coastal zonecomprising the northern regions of thecountry. It shows adequate contour linesand a dense network of spot heightmeasurements.
A project for the cartographic coverageof the whole territory, at a scale of 1:200 000, based entirely on ERS SARdata has been undertaken, through aninitiative of the French Ministry ofDefence, and IGN, the French mappingagency. The project has been developedby IGN-Espace (part of IGN, France) in
of accuracy of ground control pointsrequired to geocode SPOT data.
An Example of SpaceborneMappingThe French-Guiana Space MapFrench Guiana is a territory in SouthAmerica, located between 2°N and 6°N.Its population is concentrated in thecoastal plain, the rest of the territorybeing covered by rain forest. Riversprovide the only communication linkswith the hinterland. For the central andsouthern parts of the territory, theexisting cartography is old, inaccurateand incomplete, due mainly to the

A 1:200 000 scale mapof an area in southernFrench Guiana, onwhich an ERS SAR mapproduct has beensuperimposed. Thisexample shows howgeometric distortions inold maps can becorrected using ERSSAR data
cooperation with CEGN (the geographicresearch department of the Frencharmament agency) and the UniversityPierre et Marie Curie (UPMC), Paris. Theresulting space map is the only global,homogeneous, complete andgeometrically correct example ofcartography for the region, resulting from ERS radar imagery and spacetriangulation techniques. Derivedproducts have grids with geographic andcartographic coordinates as a reference.They are specially suited for medium- tosmall-scale map coverage (1:100 000 to1:1 000 000).
The space triangulation techniquesdeveloped by IGN-Espace allow relativeand/or absolute geo-referencing of alarge number of image products usingGround Control Points (GCPs) and ageometric model of the acquisition.
A DTM was produced by IGN-Espace torectify ERS SAR images in the local geo-detic and projection systems as no DTMcovering the entire country was available.The only altimetric data sources availablewere an IGN DTM over the coastal plainderived from the 1:25 000 map sheetcoverage and the “Digital Chart of theWorld” (DCW). The latter, however, coversonly a small region at the border ofSurinam. The existing cartography hastherefore been used to generate themissing DTM, including features such ascontour lines and spot heights.
SAR images acquired in ascending modecombined together with SAR descending
passes provided stereo pairs that allowedthe calculation of series of groundcontrol points (X,Y,Z) which have beenused to locally “densify” the DTM.After mosaicing and geo-referencing theSAR images, multi-temporal filteringtechniques were developed and appliedby CEGN to increase the informationcontent.
The success of this project hasdemonstrated that the geometric qualityof ERS SAR data products allows one tocomplement the incomplete anduncertain conventional cartography datasets that exist in many equatorial areas.Although no ground control pointinformation was available for southernFrench Guiana, the space triangulation

Example of a remote-sensing cartographicproduct derived fromthe mosaic. Marginalinformation, such ascontour lines derivedfrom the DTM,toponyms selected onthe 1:200 000 mapseries and roads fromthe 1:50 000 mapseries, has also beenintegrated into the map.This does not bear thehydrographic networkreference, as the mainriver channels can beeasily detected. Here,the contribution of SARis evident: land coverand topographic reliefinformation can beextracted; forest areas,clearings, agriculturalfields and settlementscan all be identified
shown high potential for the generationof products especially tailored totopography and thematic-cartographyrequirements. Moreover, thanks to theSAR instrument onboard Radarsat and tothe C-band ASAR instrument that will beflown on ESA’s Envisat mission at the endof 1999, wider spatial coverages as wellas additional polarisation modes will alsobe available.
Based on the scope and capabilities ofboth existing and planned Earth-observation platforms, the map-makingindustry is likely to make ever-greater useof remote-sensing data in the years tocome, as an indispensable complementto traditional techniques.
AcknowledgementThe cooperation and contributions fromIGN-Espace, CEGN, ISTAR, SERTIT andSPOT Image in the production of this factsheet are gratefully acknowledged.
technique was sufficiently reliable toallow map production.
Surveys undertaken by French-armytroops in August 1995 provided GPSobservations both in the coastal regionand close to the eastern and westernborders, along the Oyapock and MaroniRivers. The absolute planimetric accuracyof the space map was checked andfound to be around 15 m r.m.s. error.
Further applications of ERS SAR in theregion include geological interpretationand planning, as well as the definition ofstrategies for urban settlements andinfrastructure development.
Future OutlookFurther developments of remote-sensingtechniques for mapping require the fullexploitation of ERS SAR capabilities,including an increased use of techniquessuch as interferometry. The latter has

Contact AddressesFor further information on projectsreferred to in this fact sheet:
IGN-Espace, Parc technologique du canalJ.P. Cantou24 rue Hermes 31527 Ramonville -Saint- Agne FranceTel : +(33) 05 62 19 18 18 Fax : +(33) 05 61 75 03 17
ISTARL. RenouardRoute des LuciolesSophia Antipolis 06560 Valbonne, France Tel: +(33) 04 93 95 72 30Fax: +(33) 04 93 95 83 29
Space Applications InstituteMonitoring Vegetation Unit MTVDr. F. De GrandiJoint Research CentreI-21020 Ispra (VA), ItalyTel.: +(39) 332 786239Fax: +(39) 332 789936
For further information on ERSdata applications:
Remote Sensing Exploitation DivisionData Utilisation SectionESRINVia Galileo Galilei00044 Frascati, ItalyTel: +(39) 6 94180626 or 625
For further information on the ERSProgramme, mission planning, datacatalogues:
Remote Sensing Exploitation DivisionERS Help DeskESRINVia Galileo Galilei00044 Frascati, ItalyTel: +(39) 6 94180666Fax: +(39) 6 94180272e-mail:[email protected]
For information on ERS productsand services (ERS Consortium):
EURIMAGE Customer Services Via Galileo Galilei00044 Frascati, ItalyTel.: +(39) 6 94180741/752/760/776 Fax: +(39) 6 9416772e-mail: [email protected] WWW: http://www.eurimage.it
SPOT Image 5 rue des SatellitesBP 435931030 Toulouse, Cedex 4, France Tel.: +(33) 562194040 Fax: +(33) 562194011 WWW: http://www.spotimage.fr
RADARSAT INTERNATIONAL3851 Shell Road, Suite 200 Richmond, British Columbia Canada V6X 2W2 Tel: (1) 604 2314970Fax: (1) 604 2440404e-mail: [email protected]: http://www.rsi.ca
ESA Publications Divisionc/o ESTEC, PO Box 299, 2200 AG Noordwijk, The NetherlandsTel. (31) 71 565 3400 - Fax (31) 71 565 5433
><Prepared by:Remote Sensing Exploitation DivisionESRIN

RICE MAPPING ANDMONITORING
BR-128/II

The Need for BetterInformationTwo thirds of the rice-growing areas inthe World are in South East Asia andhundreds of millions of people dependon rice as their staple food source. Forcountries such as Indonesia, Thailand andChina, regular monitoring of the crop isnecessary for both economic and politicalreasons. In particular, accurate yieldpredictions early in each growing seasonallow better planning and more efficientmanagement of harvesting, storage anddistribution systems or, in the case of acrop failure, the timely implementation ofmeasures to mitigate the effects of such adisaster.
There are many issues associated withefficient rice growing, including themaintenance and improvement of theproductive functions of the crop, crophealth and vitality, soil fertility and theprevention of damage due to droughts,etc. All countries involved in riceproduction therefore share a critical needfor accurate and up-to-date informationthroughout the crop’s growth cycle.
There are generally two growing seasonsper year in South East Asia, although inmany cases rice is alternated with adifferent crop to preserve or enhance soilfertility. The rice crop’s growth cycledepends on whether the plants aregrowing in the irrigated areas (usuallylow-lying land) or the more remoteupland areas which depend on rainwaterfor irrigation.
The basic difference between cycles is theamount of the time that the plant spendsin flooded soil. Upland rice crops are notdrained during the ripening phase,whereas lowland crops are. The paddy-field conditions vary widely during thegrowth cycle, depending on localclimate, environmental conditions andagricultural practices (such astransplanting or direct sowing).
The following main stages can beidentified in the rice-growing cycle inmany parts of Indonesia:
Rice Mapping andMonitoring

producing a panicle. The soil remains under water during this stage and the plant structure remains vertical.
– Reproductive phase: this lasts about 25-35 days. During a complete growth cycle, a rice plant will produce a total of 10 to 20 leaves, but with only 5 to 10 in place at any one time. Once the last leaves have formed, the plant flowers and distorts to allow the panicle to rise. Complete panicle formation and flowering takes about 17 to 24 days.
– Ripening: this also lasts about 25-35 days and is characterised by a decreasein stem and leaf moisture content and a reduction in the number of leaves. In some areas irrigation is stopped during this period, but in others the fields remain flooded. At the end of this phase, depending on the availability of labour, the crop is harvested. Thereafterthe paddy fields are characterised by bare dry soil.
– Flooded fields: at the onset of the rains or the arrival of irrigation water, fields are flooded to a depth of between 2 and 15 cm. The rice plants are sown in nurseries and transplanted after 25 to 35 days to the flooded fieldsin clusters of 1 to10 plants.
– Vegetative phase: the duration of this phase depends on the rice variety being grown. It is characterised by the increase in the plant’s height, the development of leaves, and the development of secondary and tertiary stems, each with the possibility of

The Limitations of TraditionalTechniquesIn many countries there is no suitableinfrastructure for the implementation ofprogrammes to monitor rice production.The conventional method of compilingstatistics on rice-crop acreage is for stafffrom the appropriate GovernmentMinistry to make ground surveys, duringwhich selected farmers or village officialsare interviewed regarding their crops.This information is then extrapolated togenerate data and predictions on aregional basis. The principal difficultyassociated with the collection of grounddata in this way is the remoteness ofmany of the farming areas, especially forthe upland varieties of rice. This meansthat these traditional surveys are bothtime-consuming and expensive. Inaddition, the information collected isoften inaccurate and unreliable, leadingto inaccurate crop-yield forecasts andsubsequent difficulties for agriculturalplanners and managers on both aregional and a national scale.
The Benefits of Space-BasedMonitoringThe requirement for inexpensive, synopticinformation on crop acreages in remoteregions lends itself to the use of satelliteimagery, which has traditionally meantoptical imagery. Unfortunately, satellitescarrying optical sensors cannot acquiredata regularly in tropical regions duringthe rainy season. The usefulness ofoptical satellite imagery from the Landsatand SPOT missions for rice monitoringhas therefore proved to be limited, as themain rice growing takes place during therainy season when there is typically 90%cloud cover. In this situation, the all-weather monitoring capability andparticular instrument characteristics ofSynthetic Aperture Radar (SAR) can providea unique and timely source of data.
Test sites in Thailand, Indonesia, Malaysia,Japan and the Philippines have alreadybeen used to demonstrate the potentialof SAR data for providing rice-cropinformation.

The Contribution of ERS SARRice is one of the agricultural crops mostsuited to monitoring with the SARinstruments on the European RemoteSensing Satellites (ERS-1 and ERS-2). Theparticular interactions between the radarbeams and the rice crop in the presenceof underlying water during the variousstages of the growth cycle give rise to acharacteristic temporal variation inbackscatter response, which is aparameter that is measured by the SAR.Because the ERS SAR instruments have aparticularly high radiometric accuracyand stability, precise and repeatablemeasurements can be performed. Whenanalysed over a growing season, thetemporal variations in the backscatterfrom each growth stage allow one todelineate rice-growing areas within multi-date images. The backscatter results frommultiple interactions between the radarbeam, the plant and the water and isinfluenced by various biophysicalparameters, including the structure andbiomass of the plant and the structure ofthe canopy.
Combined analyses of SAR measurementsand ground surveys have demonstratedunique characteristics in the radarmeasurements:– the backscatter is strongly correlated to
rice crop parameters such as height and biomass
– the backscatter of a rice field varies strongly with time, as the crop grows
– the backscatter of rice fields varies widely from a field to another, depending on the crop calendar.
During the early growth stages, paddy fields exhibit very low backscatter levels,whereas at the end of the vegetative phase, when the plants have typical canopyheights of 1 m, backscatter levels are relatively high for agricultural vegetation.The increase in the backscatter is typically due to wave-plant-water multipleinteractions, which increase with the plant’s growth. No other crop type displaysa comparable range of backscatter values over such time periods (from -18 to -6 dB over 100 days).

Location of the Semarang test site inIndonesia. Cultivated areas within theregion are mainly rice fields (typically1000 to 2000 m2) within a flood plain.The main rice variety (IRS64) has ashort growth cycle (~120 days). Riceproduction within the area can beclassified into two categories: - irrigated sawah where water issupplied artificially and one, two oreven more rice crops per year areproduced, depending on the area (insome regions five crops over a two-year period are common) - rain-fed sawah where fields irrigatedby rainfall and in some cases withadditional run-off collection provideone rice crop per year together with asecondary crop such as vegetables.
Examples of Space-BasedApplicationsThe Satellite Assessment of Rice inIndonesia (SARI) ProjectAgriculture, together with forestry andfishing, represents an important sector ofthe Indonesian economy, accounting for21% of GDP and occupying over 50% ofthe labour force. The staple crop is rice.Once the World’s largest rice importer,Indonesia is now nearly self-sufficient. In order to manage their rice cropsefficiently, however, the Indonesianauthorities need reliable crop-acreageinformation, in particular the Ministry ofAgriculture which is responsible forproviding rice-acreage statistics for theGovernment.
A project entitled Satellite Assessment ofRice in Indonesia (SARI) was therefore setup with the objective of providingaccurate and timely acreage measurementson an operational basis using ERS SARdata. To this end, a high degree ofinvolvement of the relevant Indonesianauthorities was necessary and varioustraining programmes were conductedalongside the investigation of theinfrastructure required for the task. Anadditional consideration was the use ofstandard computer hardware and image-processing software products in order tosimplify the implementation of the systemas an in-house service operated by theMinistry. The SARI project was initiated,with European Union support, early in1997. However, back in 1994 a so-calledPhase-1 of the project had already beenconducted as a cooperative enterprise
between Scot Conseil and CESBIO inFrance, and the Agency for Technology(BPPT) and Ministry of Agriculture inIndonesia. Funded by the French CentreNational d’Etudes Spatiales (CNES), theSARI Phase-1 was an ESA ERS Pilot Projectintended to demonstrate the feasibility ofusing ERS SAR for rice-acreage estimationand, to a lesser extent, for monitoringgrowing conditions. Based on theexperience acquired in the framework ofSARI Phase-1, and using additionalexperimental data sets over a test site inJapan, CESBIO has since conducted afurther project geared to developing rice-mapping and rice-monitoring methods.
A rice-mapping method has beenestablished that is based on the temporalchange of the backscatter - the so-called˝change index˝ - at the field scale. Thevalue of this change index depends onthe points during the growing cycle atwhich the SAR data are acquired, i.e.whether the change is over the growingseason when the backscatter isincreasing, or between harvesting andthe beginning of the next cycle when thebackscatter is descreasing. In order toapply this method, these changes needto be accurately quantified. This is madedifficult because of speckle, a well-knowneffect in SAR imagery that gives a noisyaspect to images and introduces errors inthe measurements of the backscatter. Arice-field mapping algorithm has thereforebeen developed that enables one toreduce speckle, derive a suitable changeindex, and finally separate rice and non-rice areas.

Location of the second test site, at Akita in Japan, wheredata were gathered in the framework of a rice crop-monitoring experiment carried out in 1992 and 1993. Thetargetted rice field is about 300 m long by 1 km wide,divided into 20 subsections of 140 m by 90 m. The ricevariety grown, which is adapted to the site’s relatively highlatitude, has a comparatively long growth cycle of 150days. The experiment was carried out during the entirerice-growth cycle, from June to October in 1992 and1993, during the 35-day repeat cycle of ERS-1
A distinct advantage of using the ratio ofbackscatter values to detect changes inSAR images is that the radiometric effectsdue to relief are removed. This isimportant since the precise digitalelevation models needed in order tocorrect for the effects of sloping terrain(terrain geocoding) are often notavailable in such regions.
Results of the classification of rice fields. Rice/non-rice segmentation has beenperformed using a threshold of 3 dB, which was identified as being the optimalvalue given the constraints in terms of test-site conditions and available SARdata. In addition to the rice/non-rice classification, the rice fields could beseparated into early and late varieties, depending on the ratio value. For latevarieties, the rice had not been harvested leading to an increase in backscatterbetween the two image acquisitions and a negative ratio in dB. For earlyvarieties, the rice had been harvested between acquisitions resulting in a drop inbackscatter and a positive ratio in dB. Rice fields at the end of the cyclecorresponding to late rice crops are shown in dark blue, whereas rice fields thatwere at the end of the cycle when the first image was acquired and are at thebeginning of the cycle for the second are visualised in magenta. Non-rice areasare shown in light green. Ground surveys confirmed that all the sites at which riceparameters were measured were correctly identified as rice crops by thismethod. The calculation of rice coverage is then possible from the classification.

The ERS SAR measurements have beeninterpreted using a theoretical modelwhich is based on a detailed descriptionof the structure of rice plants and whichtakes into account the interactionsbetween the radar wave and the groundsurface, including the contribution fromstems and leaves, as well as the effects ofattenuation by the canopy of the wavepropagation. The model indicates thatthe dominant scattering mechanism isthat of the vegetation, followed by areflection on the underlying water andvice-versa. Good agreement has beenobtained between experimental data andtheoretical results. In addition, simulationsusing the validation model indicate thatthe increase in the temporal radarresponse remains predictable with goodaccuracy for different rice growthconditions and different rice varieties.
In addition to rice-acreage maps,agricultural planners need forecasts of thelevels of crop production. This can becalculated from the crop acreage and aforecast of the crop yield. Whilst satelliteSAR data are well-suited to providing thecrop-acreage information needed, thecrop-yield information is somewhat moredifficult to extract, requiring the use ofcomplex models which are susceptible tolocal environmental perturbations. One ofthe principal inputs required for suchmodelling is more detailed data on cropheight and biomass parameters.
MAPS OF HEIGHT
23/01/94
16/02/94

Mapping of rice fields in a vegetative stage (green) and a reproductive stage (yellow) at different dates, allowing one to follow the evolutionof the different rice fields (late and early) which have distinct growing cycles. Based on the relation between the backscattering coefficient,as measured using a data set of four ERS acquisitions, and the rice height or biomass, it is possible to derive a map of the rice fields atdifferent heights and/or different levels of biomass. The map was derived from images of plant heights calculated for each of the four datesin order to relate each value of the backscatter to a plant height using the experimental relationship derived from SAR measurements. A segmentation is performed using the height images so as to separate the rice fields that still are at the vegetative stage and those at the end of the cycle (reproductive stage). The beginning of the reproductive cycle appears when the plant is about 80 cm high. A segmentation was performed to separate the rice fields with a biomass threshold of 2200 g/m2. This value corresponds to the saturationpoint of the relationship between the backscatter and biomass, indicating the beginning of the reproductive cycle. The fields with abiomass below 2200 g/m2 are displayed in green and those with a biomass exceeding 2200 g/m2 in yellow in the next figure. Accuracy ofthe plant-height retrieval using ERS SAR corresponds to a standard deviation of ±9 cm.
CLASSES MAPS OF BIOMASS CLASSES
10/02/94 23/01/94 10/02/94
06/03/94 16/02/94 06/03/94

Map of rice fields in a mountainous area
Prospects for a SAR-basedRice Monitoring SystemBased on the above studies performed attwo different sites with differentgeographical and rice-growth conditions,and using a theoretical backscattermodel, methods using ERS SAR data havebeen developed that allow theidentification of rice crops, the calculationof rice acreages and the monitoring ofspecific rice-growing parameters. Theresults are in good agreement with theexisting crop maps of both areas.Application of the method calls for theavailability of at least two SAR imagesrecorded within the same growth cycle,or during consecutive cycles. The timeinterval between the two acquisitionsshould not be more than 80 to 100 daysin order to maximise the variation.Potential confusion between rice fieldsand other types of land cover isminimised since no other land-cover typeundergoes a backscatter-change similar tothat of paddy fields.
For rice-growing areas with non-uniformcrop calendars (e.g. varying numbers ofcrops per year from one area to another,or delays in the start of the growth cycledue to water-supply or manpower-availability problems), three to four ERSSAR acquisitions per year may benecessary. However, the exact number ofSAR data acquisitions must be refinedaccording to the particular characteristicsof a site. Other limitations stem firstlyfrom wind effects which increase theradar backscatter from the water surfaceof newly flooded rice field, and secondly
from alternative cultural practicesinvolving direct crop sowing on non-flooded fields, both of which causevariations in the radar backscattercharacteristics during the rice’s earlygrowth stage.
Future refinement of the methods shouldinclude testing over a variety of rice-growing areas in Indonesia, takingaccount of different terrain types (coastal,alluvio-colluvial hills, transition andmountainous regions), the type of watersupply, the crop-management practicesand the cropping patterns.

It is already clear that SAR data haveimportant potential for providingregional, national and internationalorganisations with the information thatthey need to make comprehensive andreliable crop growth and yield predictions.Two key parameters in this respect arethe total area prepared for wetland ricecultivation and the harvested area, whichdepend on the number of growing cyclesper year. By applying the temporal-change approach with four well-scheduled SAR acquisitions, it should bepossible to determine the number ofcycles per year for a given field.
Future OutlookWhen the project presented here isconsidered in the context of similarprojects in South East Asia andelsewhere, it becomes clear that the ERSand Radarsat SARs have an important roleto play today as a complement to opticalsensors in managing the food economiesand agricultural practices of the region.The benefits to be derived from applyinga more tailored approach to the use ofexisting satellite data in these regionsneeds to be investigated, and the nextgeneration of SAR systems need to beanalysed in terms of the furtheropportunities for, and refinements in cropmonitoring that they will bring. One suchpossibility is the combination of imagesobtained with two different polarisations(horizontal and vertical), which promisesgood discrimination between plantspecies with different characteristicstructures. The Advanced SAR instrumentcarried by ESA’s Envisat platform, due forlaunch at the end of 1999, will have theability to operate with these twodifferent polarisations.
AcknowledgementThe cooperation and participation ofCESBIO (F) is gratefully acknowledged.

Contact AddressesFor further information on projectsreferred to in this fact sheet:
CESBIODr T. Le Toan 18 ave. Edouard Belin 31055 Toulouse Cedex 4FranceTel: (33) 5 61 55 85 71 Fax: (33) 5 61 55 85 00
For further information regardingERS data applications:
Remote Sensing Exploitation DivisionData Utilisation SectionESRINVia Galileo Galilei00044 Frascati, ItalyTel: +(39) 6 94180626 or 625
For further information on the ERSProgramme, mission planning, datacatalogues:
Remote Sensing Exploitation DivisionERS Help DeskESRINVia Galileo Galilei00044 Frascati, ItalyTel: +(39) 6 94180666Fax: +(39) 6 94180272e-mail:[email protected]
For information on ERS productsand services (ERS Consortium):
EURIMAGE Customer Services Via Galileo Galilei00044 Frascati, ItalyTel.: +(39) 6 94180741/752/760/776 Fax: +(39) 6 9416772e-mail: [email protected] WWW: http://www.eurimage.it
SPOT Image 5 rue des SatellitesBP 435931030 Toulouse, Cedex 4, France Tel.: +(33) 562194040 Fax: +(33) 562194011 WWW: http://www.spotimage.fr
RADARSAT INTERNATIONAL3851 Shell Road, Suite 200 Richmond, British Columbia Canada V6X 2W2 Tel: (1) 604 2314970Fax: (1) 604 2440404e-mail: [email protected]: http://www.rsi.ca
><ESA Publications Divisionc/o ESTEC, PO Box 299, 2200 AG Noordwijk, The NetherlandsTel. (31) 71 565 3400 - Fax (31) 71 565 5433
Prepared by:Remote Sensing Exploitation DivisionESRIN

FLOOD MAPPING
BR-128/II
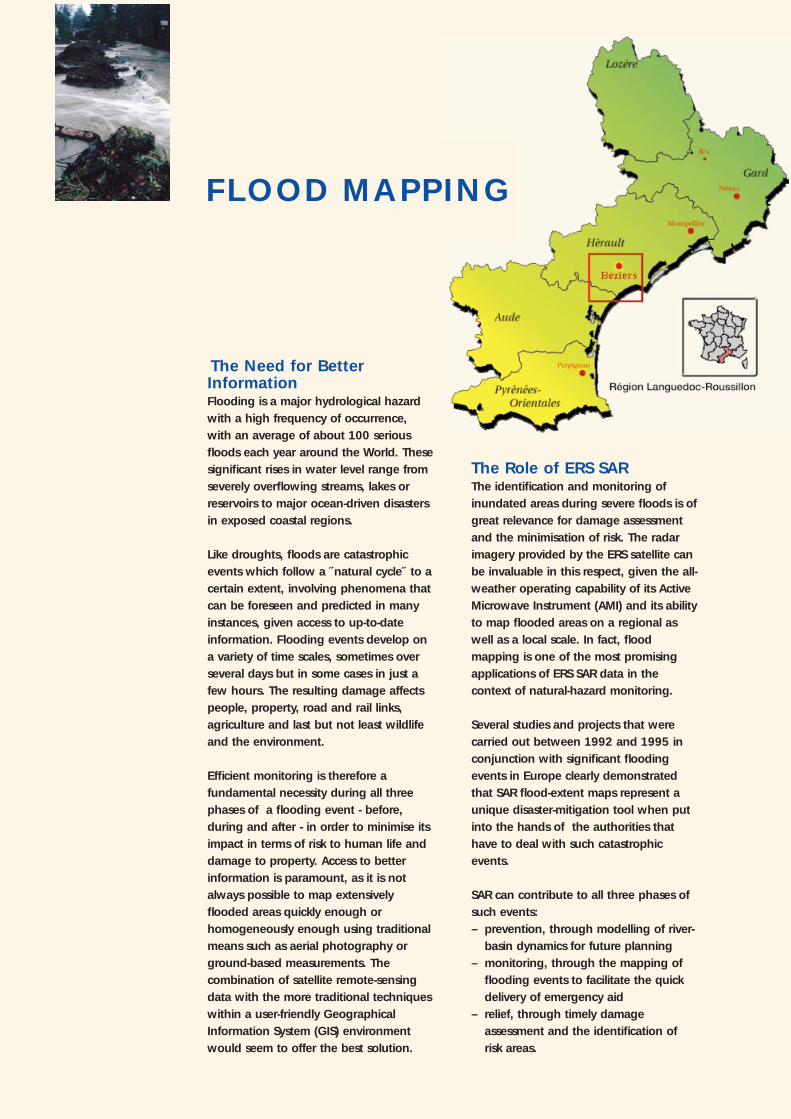
The Need for BetterInformationFlooding is a major hydrological hazardwith a high frequency of occurrence,with an average of about 100 seriousfloods each year around the World. Thesesignificant rises in water level range fromseverely overflowing streams, lakes orreservoirs to major ocean-driven disastersin exposed coastal regions.
Like droughts, floods are catastrophicevents which follow a ˝natural cycle˝ to acertain extent, involving phenomena thatcan be foreseen and predicted in manyinstances, given access to up-to-dateinformation. Flooding events develop ona variety of time scales, sometimes overseveral days but in some cases in just afew hours. The resulting damage affectspeople, property, road and rail links,agriculture and last but not least wildlifeand the environment.
Efficient monitoring is therefore afundamental necessity during all threephases of a flooding event - before,during and after - in order to minimise itsimpact in terms of risk to human life anddamage to property. Access to betterinformation is paramount, as it is notalways possible to map extensivelyflooded areas quickly enough orhomogeneously enough using traditionalmeans such as aerial photography orground-based measurements. Thecombination of satellite remote-sensingdata with the more traditional techniqueswithin a user-friendly GeographicalInformation System (GIS) environmentwould seem to offer the best solution.
The Role of ERS SARThe identification and monitoring ofinundated areas during severe floods is ofgreat relevance for damage assessmentand the minimisation of risk. The radarimagery provided by the ERS satellite canbe invaluable in this respect, given the all-weather operating capability of its ActiveMicrowave Instrument (AMI) and its abilityto map flooded areas on a regional aswell as a local scale. In fact, floodmapping is one of the most promisingapplications of ERS SAR data in thecontext of natural-hazard monitoring.
Several studies and projects that werecarried out between 1992 and 1995 inconjunction with significant floodingevents in Europe clearly demonstratedthat SAR flood-extent maps represent aunique disaster-mitigation tool when putinto the hands of the authorities thathave to deal with such catastrophicevents.
SAR can contribute to all three phases ofsuch events:– prevention, through modelling of river-
basin dynamics for future planning– monitoring, through the mapping of
flooding events to facilitate the quick delivery of emergency aid
– relief, through timely damage assessment and the identification of risk areas.
FLOOD MAPPING

Survey in the AudeBasin lowlands: • black & white:
topography as shaded relief
• white line and plot:profile and waterstages
• red polygons: estimated flooded areas.
Example of Space-BasedApplicationsThe Hérault Floods in France inJanuary 1996After a very rainy autumn and earlywinter in 1995, further intense rainfall (> 200 mm in 24 hours) affected the areaaround the city of Béziers, in the Héraultdépartement, on 28 and 29 January1996. The Aude and Orb Basins wereparticularly badly affected (seeaccompanying map). The peak flow rateof the Orb River exceeded 2000m3/s atBéziers, causing major flooding andheavily inundating the Orb Valley all theway down to the sea. The lowlands ofthe Aude Basin were also flooded to
exceptional levels and the whole regionwas declared a disaster area, withmaterial damage totalling many millionsof Francs.
In an attempt to try to protect the AudeBasin lowlands against flooding, detailedsurveys have been performed for manyyears, including a detailed topographicsurvey (1cm precision, 100m grid), towhich an hydraulic model describing therun-off dynamics has been coupled. Inaddition, the maximum water levelsduring the 1996 floods were carefullyregistered within the area. Thisgroundwork provided a very goodopportunity to assess and demonstratethe contribution that ERS imagery canmake for flood mapping over the wholeof such a stricken region.
Scale Kilometers
5 0 5
4.6 m
A) Capestang B) Matte C) Vendres
2.5 m
1.0 m
20
18
16
14
12
10
8
6
4
2
0
Alti
tud
e (m
)
Sea level
Distance (km)
0 5 10 15 20 25 30

ERS-2 SAR imageacquired on 29 January1996 at 23:00 hourslocal time

The ERS SAR spaceflood map: • channels :
green 29 January 1996, blue 7 August 1995
• red polygons: flooded area from modelling
• black lines: main drainage network
By combining the image taken on 29 January with an image taken earlier inthe year during summer conditions, on 7 August 1995, as a reference (at lowwater), and applying both radiometric(speckle filtering and reduction of reliefdistorsion) and geometric (geocoding)processing, it was possible to produce theSAR ˝space flood map˝ shown above. Theflooded areas which are delineated indark-blue hues in this map are inexcellent agreement with those obtainedfrom ground-based modelling.
ERS SAR’s contributionThe ERS-2 SAR image shown here (left)was acquired at night during badweather conditions, less than 24 hoursafter the heavy rainfall that occurred on28 January. Flooded areas appear as verydark patches, and large areas of lowlandsand ponds were filled to an exceptionallevel (A).The vicinity of Béziers wasflooded, as well as the valley runningdown to the sea (B).

Conventional mapincluding flooded areas(purple) mapped fromERS SAR images
A final step taken with this ERS SAR mapwas to apply an image classificationprocess in order to extract flooded areas,which can be combined via a GeographicInformation System (GIS) to provide: – a scanned traditional topographic map – other remote sensing data, a digital
elevation model and the drainage network
– land cover, soil types, administrative boundaries, networks, socio-economic data, etc.
as shown in the accompanying figures.

Three-dimensional viewof the Aude Basinlowlands: • flooded areas from
ERS SAR (purple)• SPOT panchromatic
data (black & white) • main drainage
network (blue)
synergy with meteorological, hydrologicaland soil-characteristic information fromother sources means that it can be ofgreat help not only for monitoringpurposes, but also in the improvement ofmodels. Moreover, by exploiting ERS-1/ERS-2 tandem-mode type SAR data, onecan achieve a close to real-time flooddetection and monitoring capability.
In terms of continuity, the launch at theend of 1999 of ESA’s Envisat mission,equiped with a complex payload thatincludes an Advanced SAR, will make afurther substantial contribution in termsof the availability of radar data for flood-related applications.
AcknowledgementsThe participation and cooperation of:– LCT Cemagref-ENGREF– Association SIG-LR, Montpellier– BRL Ingenierie, Nimes– the ESRIN Earth Watching Team– Ms M. Vinje, Young Graduate, ESTEC.
is gratefully acknowledged.
Future OutlookThese various flood maps and associatedspace-derived data can be used for twomain types of application:
(i) flood monitoring at a scale of less than 1: 50 000:
– estimation of flooded areas and volumes, within administrative or geographical limits
– flood damage caused to communication networks, agricultural and urban areas
– help in financial compensation.
(ii)prediction of flood risks: assessment of hydraulic models simulating the area liable to flooding, which are presently validated mainly by aerial photography and ground-based water-level measurements. Both of these approaches have many limitations that can be largely overcome by employing ERS SAR imagery acquired before, during and after the peak of the flooding.
Whilst SAR data cannot drasticallyimprove flood warning/monitoringservices if used in isolation, its proven

Contact AddressesFor further information on projects referred to in this fact sheet:
LCT Cemagref-ENGREFMr A. Beaudoin500 rue J.F. Breton34093 Montpellier, FranceTel. (33) 4 67548752Fax. (33) 4 67548700e-mail: [email protected]
For further information on ERSdata applications:
Remote Sensing Exploitation DivisionData Utilisation SectionESRINVia Galileo Galilei00044 Frascati, ItalyTel: +(39) 6 94180626 or 625
For further information on the ERSProgramme, mission planning, datacatalogues:
Remote Sensing Exploitation DivisionERS Help DeskESRINVia Galileo Galilei00044 Frascati, ItalyTel: +(39) 6 94180666Fax: +(39) 6 94180272e-mail:[email protected]
For information on ERS productsand services (ERS Consortium):
EURIMAGE Customer Services Via Galileo Galilei00044 Frascati, ItalyTel.: +(39) 6 94180741/752/760/776 Fax: +(39) 6 9416772e-mail: [email protected] WWW: http://www.eurimage.it
SPOT Image 5 rue des SatellitesBP 435931030 Toulouse, Cedex 4, France Tel.: +(33) 562194040 Fax: +(33) 562194011 WWW: http://www.spotimage.fr
RADARSAT INTERNATIONAL3851 Shell Road, Suite 200 Richmond, British Columbia Canada V6X 2W2 Tel: (1) 604 2314970Fax: (1) 604 2440404e-mail: [email protected]: http://www.rsi.ca
ESA Publications Divisionc/o ESTEC, PO Box 299, 2200 AG Noordwijk, The NetherlandsTel. (31) 71 565 3400 - Fax (31) 71 565 5433
><Prepared by:Remote Sensing Exploitation DivisionESRIN

TROPICAL FORESTMONITORING
BR-128/II

The Need for BetterInformationTropical rain forests constitute the mostdiverse ecosystem on our planet, as morethan 80% of all known species of plantsand animals live in the tropics. Inaddition, they are home to millions ofpeople and comprise a natural resourceso rich that their exact value is impossibleto quantify in financial terms.Uncontrolled deforestation is estimated tobe resulting in the extinction of severalspecies each day. In addition, as tropicalsoils are often extremely susceptible todegradation and erosion, any economicexploitation must be carefully planned,implemented and managed. In order tomonitor these unique tropical-forestregions adequately, accurate and up-to-date information on forest characteristicsand forest health is required. This meansthat the appropriate national agenciesmust regularly conduct land-use surveys,leading to a continual demand for thesort of information that is difficult andexpensive to obtain with conventionalland-based surveying expeditions.
An increasing number of politicians anddecision-makers are recognising theimportance of sustainable developmentfor the tropics. A pre-requisite for suchdevelopment is the availability of reliable,complete and up-to-date information,especially in Developing Countries. Often,however, the only maps available in thosecountries are 30 years old. A number ofstates and international organisationshave decided to set up monitoringinfrastructures capable of identifying and
controlling deforestation activities, whichcan have a serious impact on theenvironment, with heavy financialconsequences. These monitoringinfrastructures require timely and accuratedata on: the location and extent ofclearing-cutting activities; burning offorest areas; settlement patterns; land-use practices, such as shifting andpermanent cultivation; differences inlogging intensities within particularregions; etc.
A complete knowledge of loggingoperations is essential. Statistics areneeded to estimate the extent of theareas involved, as well as areas subjectto selective logging, in order to be ableto monitor restocking and to assess thedamage caused to the forest structure inaddition to the timber’s removal.
TROPICAL FORESTMONITORING

geographical areas repeatedly at relativelylow cost, can help in overcoming thedifficulties of keeping inaccessible regionsof rain forest under constant supervision.However, remote-sensing informationderived from optical sensors is often ofvery limited use for monitoring forestcanopy and land surfaces in the tropicsbecause of the almost permanent cloudcover. Synthetic Aperture Radar (SAR)instrumentation of the sort carried byERS-1and ERS-2 is ideal for such regionsdue to its unique ability to operateunhindered day and night and in allweather conditions.
The Contribution of ERS SARSAR has proved itself to be the onlyrealistic source of geographicalinformation in such regions as theKalimantan Islands (Borneo, Indonesia),Papua New Guinea and the AmazonianForest, where the mean annual cloudcover can reach 90%. The instrument’shigh radiometric accuracy and stabilityallow one to make precise and repeatablebackscatter measurements in suchenvironments. Each forest type has adifferent backscatter behaviour, i.e.specific value and variation of the returnsignal, so that by analysing time series ofSAR images it is possible to both map andmonitor forested areas. In addition, theuninterrupted data flow from space-basedSAR’s since the launches of ERS-1 andERS-2, in July 1991 and April 1995,respectively, provides for a consistent andcontinually updated archive.
The Limitations of TraditionalTechniquesCurrent practices include field and aerialsurveys that collect information on theareal extent of forests, timber volumes,afforestation and deforestation levels, andthe impact of storm and fire damage. Intropical regions, however, regular fieldsurveys are expensive and time-consuming, so that only limited areas canactually be covered in the time available.In addition, many areas are hard toaccess. Traditional airborne surveys doprovide wider coverage, but the costs areextremely high.
The Benefits of Space-BasedMonitoringEarth-observation satellites in general,with their ability to monitor large

ERS-1 SAR mosaic extract over the Odzala National Park, a major biospherereserve in Central Africa (Republic of Congo). An important sanctuary for birds andlarge mammals (gorillas, chimpanzees, forest elephants), the park’s vegetation is acomplex of lowland rain forests, swamp forests, open forests with marantaceaeand savannah. An extension of the park is planned to include a wider spectrum offorest types. The Odzala Park is currently managed through the ECOFAC(ECOsystemes Forestiers d’Afrique Centrale) Programme of the European Union(DG VIII), dedicated to the conservation of the Central African ecosystems. Themosaic was produced to help the ECOFAC team delineate the park’s futureboundaries. The Central Africa Mosaic Project (CAMP) is part of a novel approachfor continental-scale mapping of the tropical forest using radar remote sensing. Thenew approach calls for the rapid assembly of a vast amount (approximately 470images) of high-resolution ERS-1 SAR imagery in order to obtain thematicinformation over the whole rain-forest domain of Central Africa at several scales andwith unprecedented completeness, spatial resolution and quality. The CAMPimagery consists of a multi-resolution pyramid of products with different spatialscales, generated using a wavelet representation. Both the so-called smoothimages (approximations at that scale) and the detail images (texture measures) aregenerated at each resolution level.
This mosaic was assembled in the framework of the TREES Project (EU-JRC, Ispra)
Examples of Space-BasedApplicationsThe Central Africa MosaicThe Central Africa Mosaic is a goodexample of how ERS SAR information canbe a real “database/catalogue” in itself.Compiled by the Joint Research Centre(JRC) of the European Commission withinthe framework of the TREES (TropicalEcosystem Environment Observations bySatellite) Project, a joint initiative of theEU and ESA, the Mosaic represents thepreliminary coverage of a 3 000 000 km2
area within the tropical belt. It can alsobe “navigated” to extract specificinformation for further processing forparticular applications. Approximately470 ERS SAR Precision Processed Images(PRIs) were collected, selected andprocessed to build up the Mosaic. Beingable to rely on acquiring such widespreadcoverage on short time scales allows oneto compile high-resolution imageryquickly on a continental scale to monitorand discriminate between a variety ofvegetation-related features like deforestationfronts, savannah, and forest.
Mapping land-cover changes inIndonesiaIn Indonesia, the National Land-UsePlanning Agency (BPN) has used ERS SARdata to successfully identify areas subject to deforestation and alert theGovernment to the extent of theproblem. This was done in the context ofthe “Tropical Rainforest and Use of LandInvestigation” (TRULI) Project, coordinatedby Kayser-Threde GmbH and the ZoologyDepartment of the University of Munich.The primary aim of the project was todevelop an operational forest-monitoringand management system for remoteregions of Indonesia.

TRULI project test areaalong the MahakamRiver in the province ofKalimantan Timur on theisland of Kalimantan(Borneo), Indonesia. Theterrain is relatively flatwith altitude differencesseldom exceeding 50m.The main issues ofinterest are the extent ofthe logging activities,the expansion ofsettlements and theencroachment ofshifting cultivation onforested areas. Thereare two principal foresttypes within the areamonitored: the originaldipterocarp forest, theregion’s main timberresource, and heathforest which grows onpoor soil unsuitable foragriculture
The primary source of information wasgeocoded SAR (SAR GEC) images derivedfrom data acquired at the Bangkok ERSground receiving station in Thailandbetween July 1993 and September 1994.High-resolution optical data from the KFA-1000 instrument (7m ground resolution)on Mir were also used as a reference.Speckle-reduction, variance-filtering andtexture-analysis techniques were appliedto enhance and analyse the radarimagery’s content in order to delineatedifferent land-cover classes, namely:– undisturbed forest – logged forest with different logging
intensities – newly regenerated forest– clearings due to fires or deforestation – logging infrastructure such as roads
and settlements and agriculture.
Two field surveys were conducted atthree locations within the area imaged bythe SAR for the preliminary identificationof the land-cover classes that would haveto be detectable from the space-acquireddata.

An enhanced SARimage and thecorresponding KFA-1000 image. Severalvegetation classes canbe detected in bothdata sets. The KFA-1000 data are well-suited for the detectionof such tell-tale featuresas small roads andagricultural cropsassociated with loggingactivities. The opticaldata together with anyin-situ observationsavailable form a basisfor the interpretation ofmulti-date SAR imagesand the extraction offorest-health parameters
Using multi-temporal SAR data andapplying principal-component analysis, itwas possible to determine the extent ofland-cover changes within the testregion, particularly in terms of forestcutting, agriculture, logging, etc. Thismethod also improved on the accuracy ofthe initial classification scheme for thearea, which had been derived fromsingle-date imagery.
As BPN’s experience has confirmed, theavailability of land-cover change maps isa key issue in forest monitoring as theyallow the authorities to identify exactlywhere illegal deforestation is occurringand then to implement suitablemechanisms for its control or prevention.
The so-called “demonstration changemap” shown here was compiled fromthree SAR images acquired on differentdates. In some cases, selectively loggedforest can be distinguished from virginforest due to a change in backscatter.Most of the logging road infrastructurecannot be detected in an ERS SAR image,
unless the roads happen to be orientedperpendicular to the radar beam.Nevertheless, SAR is a useful tool fordetecting clearing-cutting and a numberwere identified, corresponding togovernment-sponsored resettlementprogrammes and to pulp-relatedreforestation. Many small villages can beidentified close to the Mahakam River,both in single and multi-temporal SARimages, as well as new fields in thevicinity of those villages.
Hill-based rice crops and othervegetation types could not bedistinguished. SAR is normally well-suitedfor detecting wet rice-crop growth, butmulti-temporal data need to be acquiredon suitable dates during the growingprocess. Newly burnt forest areas can alsoeasily be identified in the SAR images,allowing an estimation of the extent ofillegal settlement activity along formerlogging roads.

Demonstration changemap for the MahakamRiver region producedfrom three images(shown above) acquiredon 12 July 1993, 29 November 1993 and15 September 1994

An inspection of the change map clearlyshows a situation typical of shiftingcultivation and, to a lesser extent,clearing-cutting for plantations. Inaddition to the change map, several land-use maps of the same site weregenerated. Together, they represent thefirst map products generated for theregion for many years and BPN was ableto rely on accurate and updated forest-health information for the first time.
The National Land-Use Planning Agency’splans foresee continuation of theexperiment in the form of a moredetailed analysis of land-use change,once these map products, together withall available ground-truth data, have beenincorporated into a GeographicalInformation System (GIS). Theprogramme’s ultimate goal at present is totransfer the mapping technology to theend-user organisations in Indonesia. Inaddition, BPN will operate a GIS currentlybeing set up for the Kalimantan region.From the study and research point ofview, the TREES programme has beenextended to include Kayser-Threde’s andthe University of Munich’s work in theTRULI project.
Forest monitoring on the island ofSumatraTropical rain forest constitutes one ofIndonesia’s major natural resources,covering about 60% (110Mha in 1990) ofthe total land area. Most of the existingforests have been destroyed, mainly byshifting cultivation, by logging and,above all, by the growing number ofpeople involved in agricultural activities.Three regions were selected for analysisin South Sumatra - where the maincharacteristics are a fair-to-mediumtopography, a super-humid climate withjust a few dry months - as beingrepresentative of varying degrees offorest exploitation and re-conversion:• Kotabumi, a site largely covered by tree
plantations and subject to extensive exploitation, where existing secondary forests are being over-logged
• Baturaja, a region whose eastern part has been extensively exploited. Secondary forests remain in the central part, whereas plantation forests occupythe western part
• the Ranau Lake area, comprising primary forest coverage in mountainous and sub-mountainous regions where secondary growth and a mosaic of secondary forests and grassland represent important coverage.
The general land-use/land-cover classescomprise: – primary forests, subsisting only on
mountainous or sub-mountainous areasand representing very marginal coverage at the three test sites

The accuracy and repeatability of the ERSSAR’s backscatter measurements made itpossible to analyse temporal variationsfor a variety of forest and land-coverclasses. Other parameters like surfacetype, time of the year and topographywere also taken into account. A land-cover map derived from Landsat data andverified by a field trip in January 1994was also used.
In ERS SAR images, the forest backscattercorresponds to the volume scatteringfrom the foliage of the upper canopy.Rain forest shows backscatter values of -7 or -8 dB, whereas temperateconiferous species have lower responses,around -8 or -9 dB. Less dense canopiesshow a temporal variation, especiallybetween the dry and wet seasons,caused mainly by changes in soilmoisture and underlying re-growthconditions. For low canopies such ascrops, the backscatter results from bothvolume and surface scattering, leading tovariable radar backscatter and variabletemporal change. Consequently, threecategories of canopy could bedistinguished in South Sumatra: • Dense canopy, characterised in terms of
biomass (of order 50 ton/ha) by stable radar backscatter values (except in mountainous areas) and small temporalchanges. It includes closed primary forest, secondary forests and “older” tree plantations.
– secondary forests, including shrubs and thickets
– low forest, Schima forest, and Melaleuca in swampy areas.
In addition, the deforested areas havemostly been converted into treeplantations, with rubber, oil palm,coconut and fruit trees. Agricultural cropsinclude mainly paddy fields, and in someinstances sugar cane, cassava, and corn.
Some interesting results have beenachieved by CESBIO, a French instituteinvolved in the TREES Project which isrunning an experiment to assess theutilisation of ERS SAR data in SouthSumatra. It worked with ERS-1 data overan area covered by eight SAR frames,each 100 km x 100 km, acquiredbetween September 1993 and September1994.

• Less-dense canopy (< 50 ton/ha), characterised by small temporal changes (± 2 dB) and variable backscatter values. It includes shrubs, thickets, over-logged forest and young tree plantations.
• Low canopy. It is characterised by highly variable radar backscatter and their temporal change (agricultural crops, clearing-cut areas, young forest regrowth, new tree plantations, etc.).
Other non-temporally stable land coversinclude swamps, savannahs and waterbodies. Urban areas are characterised byhigh backscatter values and no temporalvariation.
Based on the above observations, it ispossible to develop unsupervisedmethods to discriminate a land-cover
category with stable radar backscatterand small temporal change,corresponding to a particular forest class(primary forest, secondary forest, maturefruit tree plantation, etc.). Inmountainous areas where only thetemporal change can be used as aclassifier, the temporally stable classes willinclude all other mature tree categoriessuch as plantations and oil palms, andmineral and urban areas. A method hasbeen developed that is based on thetemporal variations of the radarbackscatter, using the ratios of thebackscatters between two images.
This method includes spatial andtemporal speckle filtering ofmultitemporal data sets of ERS SARimages, temporal image ratioing andchange-detection techniques to extract

The Baturaja regionforest/non-forest map(far left) derived fromERS SAR data and theland-cover map (left)derived from LandsatTM data
Forest/non-forest mapping based on ERSSAR data appears to be very promising,despite the complexity of the land-coverdistribution and the relief effects.Supervised methods can be used todiscriminate more classes for treeplantations (coconut, oil palm, certainfruit trees, etc.) characterised by thedifferences in their backscatter levels fromthose of the main forest. A strategy fordeforestation monitoring will involveregular updatings with new ERS imageryfor regions of active deforestation. Theboundaries of deforested areas can beeasily detected because the contrastbetween the temporal changes of theforest and that of clearings, bare soil oragricultural fields are significant.
forest classes. As a result, forest featuresare generally classified correctly (70 to 80% success rate confirmed bycomparisons with reference maps).Intermediate tree canopies, such as over-logged forest, shrub and fruit-treeplantations, are classified partly as forestand partly as non-forest, depending ontheir biomass values. Crops are identifiedas non-forest and grassland for 75%. Theresults have to be treated carefully as theland-cover map has been derived fromthe interpretation of Landsat TM imagery.
An important issue raised by the proposedmethod is the saturation level of the ERSradar signal in vegetal features whosebiomass is 50 ton/ha or more. Selectivelogging can hardly be distinguishedwhere the biomass remains high.

The above figure shows an ERS-1 SARscene in which the geometrical shapes ofdeforestation features are clearly visible.In addition, the identification of differentre-conversion classes based on theirbackscatter values
appears possible, which means thatdeforestation monitoring can beachieved using just two ERS dataacquisitions each year, one during thewet and one during the dry season.

A region in South Sumatra, Indonesia, where important logging activities takeplace. The left-hand image is a Spot XS product acquired on 8 April 1996 andused as a reference for the interpretation of the INSAR product. In this originalimage, five land-use classes were defined and marked: bare soil, deforestedarea, primary forest, and two classes of plantations at different growth stages.The ERS INSAR-derived image on the right is a colour-composite with thecoherence component shown in red. The amplitude images of ERS-1 (acquiredon 17 May 1996) and ERS-2 (acquired on 18 May 1996) are shown in green andblue, respectively. Clearings and bare ground appear in red, with a highcoherence level. Two types of plantations - namely old and young oil-palmplantations - can be distinguished, as blue/green areas. Darker blue areas relateto rain forest ▼
low coherence due to significantvariations in the volume backscatter ofthe canopy layer, whilst bare soils or built-up areas have higher coherence levels.
Most of the ongoing projects in forestmonitoring and mapping make use ofINSAR-derived colour composites showingcoherence, in conjunction with the tworadar amplitudes of the relevantacquisitions. Although still at anexperimental stage, these INSARtechniques are showing enormouspotential in domains like forestry, wherethe use of SAR imagery alone might giveonly partially satisfactory results.
The Contribution of ERS SARInterferometryERS SAR Interferometry (INSAR)techniques represent an additional toolthat is likely to be used increasingly in thefuture in the tropical (and even non-tropical) forestry domain. To extract thethematic information needed, ERS SARdata acquisitions from two satellite repeatpasses over the same area are processedtogether. The interferometric correlation -coherence - computed from the imagepair is used as a discriminator for land-useclassification. The degree of coherencedepends mainly on the changes in targetgeometry that have occurred betweenthe two acquisitions. Forest areas show

Mosaic of forested/non-forested areas for alarge region of South Sumatra (200 km x 300km) based on multitemporal ERS SAR images,as processed by the Centre d’Etudes Spatialesde la BIOsphère (CESBIO). The pixel size of theoutput product is about 150 m
Future OutlookOn the regional scale, the strategy forusing ERS SAR data for annualdeforestation monitoring involvesproducing mosaics of the forest/non-forest segmentation by processing thewet/dry-season image pair, perhapsemploying data-compression techniquessuch as spatial averaging to reduce datavolumes and allow speckle reduction.
In addition to the generation ofoperational techniques for tropical-forestmonitoring, adequate methods nowneed to be developed to cope withmountainous regions, where a digitalelevation model is needed. Work is also inprogress to quantify the cost/benefitaspect of using ERS SAR data for routineforest mapping and monitoringcompared with more conventional high-resolution optical data (SPOT, Landsat)and low-resolution data such asNOAA/AVHRR. Envisat, the forthcomingESA mission due for launch at the end of1999, and equipped with a payload thatincludes an Advanced SAR instrument,will guarantee continuity of SAR dataavailability.
AcknowledgementsThe illustrations and imagery used herehave been provided by CESBIO, Kayser-Threde GmbH, the University of Munich,Spot Image and CNES. Their participationand cooperation are gratefullyacknowledged.

Contact AddressesFor further information on projects referred to in this fact sheet:
CESBIODr. T. Le Toan18 ave. Edouard Belin31401 Toulouse Cedex 4FranceTel: (33) 5 61 55 85 01Fax: (33) 5 61 55 85 00
Kayser -Threde GmbHDr. S. KuntzWolfrathauserstasse 4981379 MunichGermanyTel: (49) 89 72495119Fax: (49) 89 72495291
Dept. of ZoologyLudwig-Maximillians UniversityDr. F. SiegertLuisenstrasse 1480333 MunichGermanyTel: (49) 89 5902442Fax: (49) 89 5902450
Space Applications InstituteMonitoring Vegetation Unit MTVDr. F. GrandiJoint Research CentreI-21020 Ispra (VA), ItalyTel: +(39) 332 786239Fax: +(39) 332 789936
For further information on SARInterferometry projects:
Centre for Remote Image Sensing andProcessing (CRISP)Prof. Lim HokFaculty of ScienceNational University of SingaporeLower Kent Ridge Road119260 SingaporeTel: +(65) 8743220Fax: +(65) 7757717e-mail: [email protected]
For further information on ERSdata applications:
Remote Sensing Exploitation DivisionData Utilisation SectionESRINVia Galileo Galilei00044 Frascati, ItalyTel: +(39) 6 94180626 or 625
For further information on the ERSProgramme, mission planning, datacatalogues:
Remote Sensing Exploitation DivisionERS Help DeskESRINVia Galileo Galilei00044 Frascati, ItalyTel: +(39) 6 94180666Fax: +(39) 6 94180272e-mail:[email protected]
For information on ERS productsand services (ERS Consortium):
EURIMAGE Customer Services Via Galileo Galilei00044 Frascati, ItalyTel.: +(39) 6 94180741/752/760/776 Fax: +(39) 6 9416772e-mail: [email protected] WWW: http://www.eurimage.it
SPOT Image 5 rue des SatellitesBP 435931030 Toulouse, Cedex 4, France Tel.: +(33) 562194040 Fax: +(33) 562194011 WWW: http://www.spotimage.fr
RADARSAT INTERNATIONAL3851 Shell Road, Suite 200 Richmond, British Columbia Canada V6X 2W2 Tel: +(1) 604 2314970Fax: +(1) 604 2440404e-mail: [email protected]: http://www.rsi.ca
ESA Publications Divisionc/o ESTEC, PO Box 299, 2200 AG Noordwijk, The NetherlandsTel. (31) 71 565 3400 - Fax (31) 71 565 5433
><Prepared by:Remote Sensing Exploitation DivisionESRIN