Agricultural Commissioners’ Crop Reports Santa Cruz...
100
California Department of Food and Agriculture Agricultural Commissioners’ Crop Reports Santa Cruz County 1962-1969 California County Agricultural Commissioners' Reports from the California Department of Food and Agriculture. This collection consists of annual crop and livestock data from each of the 58 California Counties. The collection covers 1915-1981; digitization of the rest of the collection is forthcoming. This digitization project was funded by the Giannini Foundation of Agricultural Economics, http://giannini.ucop.edu/ . The work was completed by the staff of the Giannini Foundation Library, University of California, Berkeley, http://are.berkeley.edu/library/ . Please contact the Library to consult the originals.
Transcript of Agricultural Commissioners’ Crop Reports Santa Cruz...

California Department of Food and Agriculture
Agricultural Commissioners’ Crop Reports
Santa Cruz County
1962-1969
California County Agricultural Commissioners' Reports from the California Department of Food and Agriculture. This collection consists of annual crop and livestock data from each of the 58 California Counties. The collection covers 1915-1981; digitization of the rest of the collection is forthcoming. This digitization project was funded by the Giannini Foundation of Agricultural Economics, http://giannini.ucop.edu/ . The work was completed by the staff of the Giannini Foundation Library, University of California, Berkeley, http://are.berkeley.edu/library/ . Please contact the Library to consult the originals.


ANNUAL
REPORT

0.0.0.0. 0.0.0. 0.0.0.0.0-0-0-0-0"0"0"0"0~0. O. 0.0. O. O. O. O-,,t, 0-,~ O, O. 0 ~ O. O* O-X~ O* 0"0" 0 ~" O* O*
’ * 0

0 * 0 * 0 * 0 * 0 * O* 0
0-)l-
0
0
0
0
0
0
0
0.0.0.0.0"0"0
0
0
SANTA CRUZ COUNTY
DEPARTMENT OF AGRICULTURE PERSONNEL
AGRICULTURAL CgMMISSIONER
MATT MELLO
ASSISTANT COMMISSIONER
CHARLES G° LIPSKA
CLERKS
Sarah R°OdomMary Boyle
0
0
0
0
0
O
0
0
0*
0
0
0
0
0
0
AGRICULTURAL INSPECTORS
Kenneth TweedyDonald Ho ShawRichard NutterFred Hamisch
Robert J° HoffW~ So Jamison
SEASONAL INSPECTOR
Joseph To Brazil
A C K N OWL’E D GEM EN_T
To compile this report and have it as accurate as possible,required the help of many people and firms who cooperated withthe department by furnishing information and statistics° To allof you, our sincere thanks°
.0.0.0.0-0"0
0
0
0@
0
0
0
0
0
O * 0 * 0 * 0 * 0 * 0 * 0

APIARY INSPECTION .........................
APPLE CROP UTILIZATION - CHART ..................
COUNTY STATISTICS .........................
CROP STATISTICS - Acreage & Production ..............
- Crop Sumary ...................
- Trend of Permanent Crops ............
- Trend of Other Crops ..............
- Trend of Value in Production ..........
NURSERY INSPECTION ........................
PEST CONTROL OPERATORS ........
PEST SURVEYS & PEST CONTROL .....
PLANT QUARANTINE ...........
RODENT & PEST ANIMAL CONTROL .....
RODENT & PEST ANIMAL CONTROL - CHART ................
SEED INSPECTION .........................
STANDARDIZATION .........................
WEED CONTROL ...........................
Pag__e
lO
7
1
3
4
5
6
2
13
.............. I0
oowoeo,~,,,uo, 9
.............. 13
.............. ll
12
13
8
14
OOO&,O’,
OOO
OOO
9S
OO
O
,,D.-4
OO
,,D
O O O O O O O O
~j o o o o o o
°o
gOI ~’, ~ ~., ~ ~- ~ ~ ~ o~ -.o 0-,
r.Dl ~ 0 C~ ¢’~ "OD O~ [.~ ~0i"--i
r’~l
,P~ i @r--~l
m!
rDI O OO O
¯ 1 O O
OOO
mlp-0
%I1)
O O OO O OO O O
~ s .0"
O
r.D
O OO OO O
O’, ,,D¯ .~ O~
i
5
O O O O O O O~
O O O O O O OO O O -4- O O O
".O u-x 3.. ’C0 O ¢xi O0", ,-’ O". ~ O", 00
0-, ~ ~ ~ o~ ~ °~
O O O O O OO O O O O OO O O O O O
O C~ ~-I ~r~ ’.,.O ~’~O "¢O O ~0 u’~ "09
O O O OO O O OO O O O
-2 o~ ~ H~cr~ 0"~ u~ O
O O O O O OO O O O O OO O O O O O
u’x ~0 O O", .-~ ,-4
~1 0h .-4" ~ M:) ~ "~0
I~I H H ,--I H ,-.4 1-.4
-2 -
g O O OO O O
-.~ O O O
OTM O r-t C~/
~ (3" Ox h,H H H ,.-t

ACREAGE, PRODUCTION and VALUE of AGRICULTURAL PRODUCTSSANTA CRUZ COUNTY, CALIFORNIA
FRUIT CROPSApples
- -Fresh--Dryer--Processing--Juice
Apricots--Fresh--Dry*--Processing
CherriesGrapesPearsPersimmonsPlumsPrunes---Dry*WalnutsMiscellaneous
Compiled by MATT MELLO, Agricultural Commissioner
1962
Bearing PRODUCTIONAcres Per Acre Total U~t
8,986 13.4 (120,490)52,09019,98534,50513,910
235 1.1 150 Tons22 Tons*
89 1.66 150 Tons104 1. 105 Tons741 4.65 3,445 Tons18 6. 108 Tons541 .87 470 Tons502 2.27 570 Tons*55 .26 15 Tons66
11,337
1961
F.O,B. VALUE Bearing PRODUCTION F.O.B. VALUE
Per Uni~ Total Acres Per Acre Total Unit Per Unit Total
Tons ($12,355,000) 8,778 12.95 (113,665) Tons ($ 12,344,000)
Tons $ 153.76 8,009,000 45,975 Tons $ 177.16 8,145,000
Tons 64.48 1,289,000 21,790 Tons 64.80 1,412,000
Tons 72.36 2,497,000 32,585 Tons 71.69 2,336,000
Tons 40.25 560,000 13,315 Tons 33.90 451,000
260.00 39,000 236 7.5 1,320 Tons 210.00 277,000
1,360.00 30,000 80 Tons* 770.00 61,00055 Tons 71.00 4,000
786.00 118,000 103 0.47 50 Tons 625.00 31,000
152.00 16,000 124 1.1 135 Tons 144.00 20,060
78.95 272,000 733 4.73 3,470 Tons 97.30 338,000
230.00 25,000 18 5.4 95 Tons 260.00 25,000
260.00 122,000 512 4.73 2,420 Tons 246.00 595,000
320.00 182,000 513 2.0 515 Tons* 340.00 174,000
600.00 9,000 62 0.25 15 Tons 660.00 10,000
6,000 66 9,000
$13,174,000 11,14"-"-~ $13,888,000
BERRY CROPSBlackberriesBoysenberriesLoganberriesRaspberriesBlue and Misc.Strawberries
--Fresh--Processing
305 7.25 2,180 Tons $ 213.75170 3.3 560 Tons 260.00
75 2.7 205 Tons 230.0060 1,287. 77,200 Trays 9# 3.3625 480. 12,000 Trays 10# 3.75
940 1,709,000 Trays 12# 2.1612.8 1,660 Tons 260.00
1,575
466,000146,00047,000
259,60045,000
355 7.0 2,485 Tons $ 218.00 $ 542,000
185 3.5 645 Tons 330.00 213,000
50 3.1 155 Tons 304.00 47,000
75 840. 63,000 Trays 9~ 3.14 198,00025 300. 7,500 Trays 10~ 3.85 29,000
1,240,000 Trays 12# 1.96 2,427,000
13.6 5,135 Tons 220.00 1,130,000" $4,586,0e0
3,688,000 925430,000
$ 5,081,000 1,615
FIELD CROPSBeans, dry 740 16.12 11,930 cwt. $ 10.94 $ 131,000 300
Grain 650 1.34 875 Tons 44.81 39,000 605
Hay 4,500 2.37 10,650 Tons 34.10 363,000 4,720
Corn Silage 160 14.5 2,345 Tons 15.00 35,000 160
Pasture, Irrig. 2,850 Acres 35.00 100,000 2,700
Pasture, Other 49,850 Acres 2.75 137,000 50,000
Sugar Beets 219 26. 5,460 Tons 11.00 60,000 630
Veg. & Flower Seed 25 3,000 Lbs. 86,000 30
Mushrooms 2,990,000 Lbs. ..55 1,643,000
Nursery Stock 595 10,512,000 Plants 1,441,000 530
--Bulbs 5,456,500 Bulbs 667,000
--Cut Flowers 26,515,000 Blooms 1,173,000 __
59,58--"~ $ 5,875,000 59,675
12.851.242.3511.5
25.
3,855 cwt. $10.28 $ 40,000750 Tons 43.36 32,000
11,090 Tons 33.10 367,0001,840 Tons 15.00 28,000
Acres 35.00 95,000Acres 2.75 137,000
15,750 Tons 11.00 173,0002,750 Lbs. 78,000
2,276,000 Lbs. 0.59 1,345,0009,533,000 Plants 1,286,0004,528,000 Bulbs 556,000
28,636,000 Blooms 1,010,000$ 5,147,006
VEGETABLE CROPSArtichokes 390 270. 105,000 bxs. 21# $1.85 $ 194,000 390 195.
Beans, Green 2,170 7.7 16,710 Tons 126.75 2,118,000 1,770 9.36
Broccoli 410 2.3 945 Tons 175.24 166,000 650 2.57
Brussels Sprouts 2,750 7.1 19,595 Tons 212.50 4,160,000 2,760 7.95
Cabbage 65 234. 14,725 cwt. 2.00 30,000 45 216.
Cauliflower 690 96. 66,470 cwt. 7.37 490,000 1,175 93.4
Celery 1~ 701. 133,200 ctns. 2.13 264,000 250 855.
Corn, sweet 80 720. 57,600 Doz. .40 23,000 75 1084.
Cucumbers 60 7.6 455 Tons 67.56 31,000 90 11.3
Lettuce 3,595 494. 1,776,000 ctns. 1.64 2,913,000 3,935 494.
Peas 70 65. 4,500 cwt. 12.60 57,000 175 23.1
Squash 370 82. 30,340 cwt. 4.79 145,000 325 140.
Tomatoes 150 73. 10,950 ewt. 4.62 51,000 140 143.
Misc. Veg. 330 145,000 255
11,32"-----"0" $10,807,00G 12,035
PLANT INDUSTRY 83,812 $34,937,000 84,470
76,000 bxs. 21# $1.95 $152,000
16,570 Tons 132.00 2,187,000
1,670 Tons 205.00 343,00021,940 Tons 196.00 4,300,0009,730 cwt. 3.19 31,000
109,745 cwt. 8.30 911,000213,000 ctns. 2.10 447,00078,500 Doz. .35 27,000
1,015 Tons 81.30 82,0001,946,000 cfms. 1.50 2,928,000
4,050 cwt. 5.67 23,00045,500 ~wt. 6.20 ?~32,000
20,020 cwt 4.10 82,00013~,000
¯ $ 11,928,000
$ 35,54t~,OOe

1962/~---,~
PRODUCTION F.O.B. VALUETotal Unit Per U~it Total
2,475 colonies 196,000 Lhs. $ 0.12 $ 24,0001,855 Lbs. 0.48 1,000
2,475 colonies 20,000
112.000 cwt. 4.70 526,00053,400 cwt. 2.98 159,000
5,535 head 47,700 cwt. 21.96 1,047,00~135 head 53,000765 head 1,45(I cwt. 18.38 27,000
2,480 head 2,570 cwt. 17.62 45,00017,580 Lbs. .43 8,000
4,560,430 Doz. .35280,280 Doz.
3,970.000 fryers 15,942,000 Lhs. .144
86,400 birds 1,810,800 Lbs. .216
59,360 head 258,000 Lbs. .295
3,220 head
1961
PRODUCTION F.O.B. VALUETotal Unit Per Unit Total
2,900 colonies 197,500 Lbs. $ 0.10 $ 20,0002,180 Lbs. 0.48 1,000
2,355 colonies 20,000
74,600 Cwt. 4.60 343,00057,~90 Cwt. 3.01 172,000
4,760 head 40,~00 cwt. 20.74 846,000110 head 41,000
1,020 h .ad 2,093 cwt. 17.18 36,000
3,190 head 3,530 cwt. 12.58 44,00019,190 Lbs. 0.40 8,000
6,478,760 Doz. 0.356345,050 Doz.
8,136,400 fryers 12,643,000 Los. 0.134
97,800 birds 2,031,500 Lbs. 0.177
66,280 head 303,800 Lbs. 0.2952,400 head
2,306,000405,000
1,687,000995,000359,00090,000
125,000
APIARYHoneyWaxPollination
MILKMarketMamffacturing
LIVESTOCKCattle & CalvesBreedersSwineSheep & Lambs--Wool
EGGS--Market 1,597,000
--Hatching 303,000
CHICKENS 2,296,000
POULTRY, Other 585,000~U’RKEYS 394,000RABBITS 76,000
FUR ANIMALS 107,000
ANIMAL INDUSTRY $ 7,268,000 $ 7,498,000
GRAND TOTAL---All Production $42,205,000 $ 43,047,00o
GOVERNMENT PAYMENTS $ 41,000 $ 53,000

CROPSUMMARY - 1962
The F.O.B. value represents the gross value of the commodities when readyfor market and does not mean net income to the producer.
Overall gross value declined, ~_th vegetable production le~ding the dropfollowed by livestock and fruit crops.
Field crops and berry crops reflected a substantial increase in values.
Adverse weather conditions were a dominant factor in reducing production insome major crops while economic conditions were the principal influence in others.
APPLES - Additional bearing acreage coming into production and i~creasing yieldis indicated by higher tonnage. Fresh market demand and value slipped early inthe season when the market was oversupplied by shipments from outside the State.Thereafter trading in fresh channels remained somewhat weak. Processor demandwas good during the season and provided a firmer undertone to the entire deal.
The expansion of controlled atmosphere storages and the revolutionary con-version to bin harvesting has accelerated the shortening of the harvest seasonwhich was almost completed early in October°
APRICOTS - Severely affected by frost at critical stage of development reducedproduction to very low level.
PLUMS - Freeze reduced fruit set to very light crop.
PEARS ~ Production reduced by decline and blight diseases. Market prices consider-a~y lower this year.
BUSHBERRIES - Reduced acreage and production due to old fields in black varieties.Raspberries indicated improved market returns but others were lower.
STRAWBERRIES - Returns were slightly higher and heavier shipments to fresh market~nstead of processing channels. Most plantings new and quality berries broughtbetter returns fresh.
NURSERY STOCK - Increase in plant nurseries moving into the County and hot houseproduction reflect an upswing in production and values.
LETTUCE - Erratic season beginning with a hot market in the spring, weak in thesummer, and fair in the fall. Marketing Order controls of volume by a discingprogram and shipping periods were effected for stability in times of oversupply.
GREEN BEANS - Acreage and production in oversupply in addition to quality affectedby adverse weather, lack of sufficient pickers and increased labor costs withlower price returns, caused these producers great loss and unhappiness.
BRUSSELS SPROUTS - Early season demand slow, prices depressed but later, marketdemand exceeded supply with favorable returns.
-4-

Bushberries
BlackberryBlueberryBoysenberryLoganberryRaspberry
Strawberries
TREND OF OTHER CROPSN --4
IN SANTA CRUZ COUNTY
Total Acres Grown ( Includes New Plantings)
1958 1959 196o 1961 1962
I,IOO 940 865 815 715
450 435 415 375 34025 2o 25 25 25360 285 225 235 205165 125 12o 90 85I00 75 80 90 60
2,610 1,850 1,070 925 940
Artichokes
Beans, green
Broccoli
Brussels sprouts
Cabbage
Cauliflower
Celery
Corn, sweet
Lettuce, spring
Lettuce, summer
Lettuce, fall
Potatoes
Squash
Tomatoes
Beans, dry
Grain
Hay
Sugar beets
Nursery Stock
397 410 395 390 390
875 945 1,290 1,770 2,17o
i~300 1,145 680 650 410
2,235 2,725 2,635 2,760 2,750
165 90 140 45 65
600 685 1,325 !,175 690
65 190 230 250 190
160 200 215 75 80
215 1,050 535 445 340
2,665 2,115 2,b80 2,310 2,100
1,200 985 1,220 1,180 1,155
I00 50 170 70 125
185 220 505 325 370
310 230 230 140 150
615 575 360 300 740
355 315 450 605 650
3,575 2,600 4,870 4,720 4,500
420 425 520 630 210
550 620 690 530 595
~6-

CROPSL~ARY - 1962
The F.O.B. value represents the gross value of the commodities when readyfor market a~d does not mean net income to the producer.
Overall gross value declined, with vegetable production leading the dropfollowed by livestock and fruit crops.
Field crops and berry crops reflected a substantial increase in values.
Adverse weather conditions were a dominant factor in reducing production insome major crops while economic conditions were the principal influence in others.
APPLES - Additional bearing acreage coming into production and increasing yieldis indicated by higher tonnage. Fresh market demand and value slipped early inthe season when the market was oversupplied by shipments from outside the State.Thereafter trading in fresh channels remained somewhat weak. Processor demandwas good during the season and provided a firmer undertone to the entire deal.
The expansion of co~trolled atmosphere storages and the revolutionary con-version to bin harvesting has accelerated the shortening of the harvest seasonwhich was almost completed early in October.
APRICOTS - Severely affected by frost at critical stage of development reducedproduction to very low level.
PLUMS - Freeze reduced fruit set to very light crop.
PEARS - Production reduced by decline and blight diseases. Market prices consider-a-5~-lower this year.
BUSHBERRIES - Reduced acreage and production due to old fields in black varieties.Raspberries indicated improved market returns but others were lower.
STRAWBERRIES - Returns were slightly higher and heavier shipments to fresh market~nstead of processing channels. Most plantings new and quality berries broughtbetter returns fresh.
NURSERY STOCK - Increase in plant nurseries moving into the County and hot houseproduction reflect an upswing in production and values.
LETTUCE - Erratic season beginning with a hot market in the spring, weak in thesummer, and fair in the fall. Marketing Order controls of volume by a discingprogram and shipping periods were effected for stability in times of oversupply.
GREEN BEANS - Acreage and production in oversupply in addition to quality affectedby adverse weather, lack of sufficient pickers and increased labor costs withlower price returns, caused these producers great loss and unhappiness.
BRUSSELS SPROUTS - Early season demand slow, prices depressed but later, marketdemand exceeded supply with favorable returns°
-4-
m

TRENDOF PERMANENT CROPS IN SANTA CRUZ COUNTY
Bearing Acres
APPLES - 1953 1957 1962
TotalNon-bearing AcreageAcreage 1962
Newtown Pippin 4,882 4,588 4,577 355 4,932
Delicious- Red 1,452 1,695 2,710 1,570 4,280
Delicious- Std. 769 536 488 I 489
Bellefleur 854 493 421 2 423
Winter Banana 204 226 208 32 240
Wo Wo Pearmain 192 163 124 2 126
Gravenstein 152 119 I0i 21 122
Golden Delicious 33 78 65 53 118
Mclntosh 5 I0 i0 138 148
Other Varieties 1,283 215 282 26 308
TOTAL 9,826 8,123 8,986 2,200 11,186
APRICOTS -
All Varieties 426 260 235 14 249
CHERRIES -
Royal Ann 107 44 37 0 37
Bing 69 43 34 I 35
Other Varieties 105 26 18 O 18
TOTAL 281 113 89 I 90
GRAPES -
Wine Varieties 536 214 86 0 86
Table varieties 36 31 18 _ 2 20
TOTAL 572 245 104 2 106
PEARS -
Bartlett 622 572 565 37 602
Beurre Hardy 202 180 139 39 178
Comice 43 26 19 0 19
Other Varieties 60 38 18 i 19
TOTAL 927 816 741 77 818
PLUMS -
- Sa----~ta Rosa 289 323 490 64 554
Other V~rieties 106 31 51 6 57
TOTAL 395 354 541 70 611
PRUNES -
French 541 425 398 O 398
Other Varieties 126 I00 104 O 104
TOTAL ’ 57 525 502 0 502
ALL FPUIT &NUT CROPS -
GPAND TOTAL (Acres) 13,272 13,737
¯ nl iii

CROP YEAR - 1960
Total Tons Produced - 118,344
CROP YEAR - 195o
Total Tons Produced - 77,879
/
CROP YEAR - 19hO
Total Tons Produced - 74,560
55~ ’,,,76,* tk~9~l1/
LEGEND - Fresh ~ Dried ~ Processed
-7-

Bushberries
BlackberryBlueberryBoysenberryLoganberryRaspberry
Strawberries
Artichokes
Beans, green
Broccoli
Brussels sprouts
Cabbage
Cauliflower
Celery
Corn, sweet
Lettuce, spring
Lettuce, summer
Lettuce, fall
Potatoes
Squash
Tomatoes
Beans, dry
Grain
Hay
Sugar beets
Nursery Stock
TREND OF 0M --.
I N S A N T A Cm
Total Acres Grown (
THER CROPS
RUZ COUNTY
Includes New Plantings)
1958 1959 1960 1961. 1962
l,lO0 940 865 815 715
450 435 415 375 34025 2o 25 25 25
360 285 225 235 205165 125 120 90 85I00 75 80 90 60
2,610 1,850 1,070 925 940
397 410 395 390 390
875 945 1,290 1,770 2,170
1,300 1,145 680 650 410
2,235 2,725 2,635 2,760 2,750
165 90 140 45 65
600 685 1,325 1,175 690
65 190 230 250 190
160 200 215 75 80
215 1,050 535 445 340
2,665 2,115 2,h80 2,310 2,100
1,200 985 1,220 1,180 1,155
I00 50 170 70 125
185 220 505 325 370
310 230 230 140 150
615 575 360 300 740
355 315 450 605 650
3,575 2,600 4,870 4,720 4,500
420 425 520 630 21o
550 620 690 530 595
-6-

APPLE CROP UTILIZATION
i"
duced - 120,490 ’.~~:~li .\ \ ".l/~~-[~J.~l ", \ \ ’J/’
CROP YEAR - 1960
Total Tons Produced - 118,344
CROP YEAR - 195o
Total Tons Produced 77,879
CROP YEAR - 1940
Total Tons Produced - 74,560
LEGEND- Fresh ~_~ Dried ~ Processed
-7-
~.. , I I |
STANDARDIZATION
Standard of quality packing, containers, and markings, are established bylaw toprevent fral~ and deception in the marketing of agricultural products. Inspection of fruits,nuts, vegetables, eggs, poultry, meat and honey,wherever these commodities are prepared,packed or offered for sale, is a major function of this department.
Other phases of this work include the Lettuce Certification Program, ProduceClearances and cooperative enforcement in five (5) Marketing Order Programs. S1~mmer HeadLettuce Order converted entirely to a percentage disclng program this year. Cold storagere~crts on apple holdings and checking controlled atmosphere storage records and roomloadings are among duties performed.
Expansion of controlled atmosphere storage for apples was very significant asis indicated by the following:
1962 - C.A. Storages - 8 C.A. Rooms - 34( 1959 ) " " 3 " "
LETTUCE INSPECTION
No° certificates issued.No. man hoursNo. p~gso certifiedNo. inspections made
PRODUCE CERTIFICATION
Capacity 770,300 boxes" 262,350 "
1962~
1,7941,683
1,782,1604,237
(1961)
2,1032,601
I, 923,6766,433
MARKETING
No. certificates issued - 609No. man hours - 403No. pkgs. certified - 189,486No. inspections made - 618
ORDER CERTIFICATION
9o4740
206,7931,285
No. inspections made - 225No. man hours -. 145Early Apples (pkgso) - 1,958Bartlett Pears (pkgso) - 87Fresh Plums (pkgs.) - 16,710Fall Pears (pkgs.) - 7,799
EGG & POULTRY INSPECTION
Eggs inspected (doz.) ~ 127,724Eggs rejected (doz.) - 2,815No° ~iolations - 50Poultry premises inspected - 498Poultry inspected (pkgso) - 41~O42Honey inspected (pkgs~) ~ 78,243
Sb~IARY ~FRUIT &VEGETABLE STANDARDIZATION
218147
1,74721
13,5101,285
47,150412
6258
12,68032,775
Man days (total) ~ 571Total pkgso inspected ~ 3,091~184Total pkgso certified ~ 1,998,200Total pkgso rejected - 9,447Noo violations issued ~ 184Total certifo fees rec~do ~ $ 9,084°68
6463~1359532,1~6,644
Ii, 646143
$ I0~956o 8i
-8-

PEST SURVEYS AND PEST CONTROL
Pest detection surveys to assure early discovery and eradication of new plantpests are performed in cooperatiouwith State and Federal agencies. An intensified pro-~ram resulted in some interesting discoveries this year.
Field and orchard inspections for common plant pests, and effective controlrecommendations to prevent spread and crop losses also reduces problems of qualitycontrol in standardization inspection.
PESTDETECTION SURVEYS - 1962
Pest
Fruit FliesJapanese BeetleGypsy MothCitrus Wh.Fly & Olive ScaleEuropean Corn BorerCorn & Sorghum pestsMexican Bean BeetleKhapra BeetleEuropean Pine Shoot MothPeach Mosaic Vector MiteBlack Stem RustPear Juniper RustClub RootEuropean Can]~rFlat Limb
Properties
Host Properties Inspected Calls Infested
Fruit llO llO traps 1196 0Lawns-Orna 17 17 " 220 0Treees 1 4 4 0Ornamentals 107 17o5 acres 107 0Corn 5 41 " 5 0Corn 2 31 " 2 0Beans 8 306 " 8 OGrain 62 62 0Pines 3 3 0Peach 50 94 trees 50 0NsryStock 4 12,000 plants 4 0
Pears 7 40 acres 7 0
Crucifers 31 1,040 " 31 4Apples 24 800 " 25 IApples I 8 " I I
432 1725 6
SUMMARY- 1962
PEST SURVEYS AND CONTROL - 3,368 .o Man hours - 3,956 Calls.LABORATORY IDENTIFICATION SAMPLES - Plant Diseases - 222 -- Insects -lll.PERMITS ISSUED FOR USE OF INJgRIOUS MATERIALS - 658EXPERIMENTAL PEST CONTROL INFORMATION PLOTS - 31
PEST ABATEMENTS - 17 properties -. 122 acres apples/pears - treated or removed.
EUROPEAN RED MITE - The major pest problem here on apples. Suppression maintainedin early season~th Karathane mildew sprays. Populations in July and August be-came severe and some growers attempted control with oil and miticide combinationswith limited results° Tepp or Chlorobenzilate was effective for short period control.
[email protected] TORTRIX - Caused severe injury to apples where timing or applications wereinadequate.
CABBAGE F~GGOT ~ Extensive damage to Brussels sprout plantings.
PEAR DECLINE - Fairly widespread and resulted in removal of several orchards°
FiRE BLIGHT ~- Caused trouble in pear and apple orchards requiring active control
measures.GREEN CRINKLE ~ A ~irus disease has occasionally been found in a few apple orchardsduring the last twenty years° Infected wood used for grafting caused extensivefruit injul 7 in one orchard observed this year°
i

PEST CONTROL OPERATORS
Thirty-seven (37) licensed pest control operators registered to engagein pest control work in Santa Cruz County during 1962. Six of these wereaerial applicators.
The Agricultural Commissioner has the responsibility to require pestcontrol for hire to be performed in a workman-like manner to insure effectivecontrol by competent operators. Regulations specify precautions regardingsafety of materials used and drift residues that must be observed.
SUMMARY OF WORK BY PEST CONTROL OPERATORS
Application By Type Crop
Aircraft OrchardsGround Rig "
Aircraft BerriesGround Rig "
Aircraft Ve~’~tablesGround Rig
Aircraft Orns° & MiscoGround Rig " "
Area Treated1962 (1961)
4,563 acres 3,757 acres1,466 acres 1,477 acres
3,200 acres 2,891 acres679 acres 108 acres
9,906 acres 8,979 acres6,222 acres 4,985 acres
453 acres 582 acres368 acres 257 acres
APIARY 1962
Inspection of apiaries for the detection of disease, advisory assistanceto bee keepers, and issuance of certificates for the movement of bees and queensare among the services rendered by this department.
This area lends itself principally to migratory beekeeping and use ofbees for the pollination of deciduous fruits, so the overall bee population inSanta Cruz County varies with the seasons. Many colonies are moved from thisCounty to the San Joaquin Valley for Alfalfa seed pollination and are returnedhere only to overwinter. Many colonies from the Valley are also moved to thisarea to overwinter due to excellent winter bloom.
Summary of Apiary Inspection
Number of ApiariesTotal Number of ColoniesApiaries InspectedColonies InspectedColonies Infected~ AoF.B.Apiaries Infected, A.F.B.
1962 (1961) (196o)
114 112 lO63,089 2,907 2,917
22 33 17343 1,995 625"
I 13 161 5 6

ANh~OAL REPORT 1962RODENT & PEST A~-ZMAL CONTROL
GF OU}[D SQUIRPELS
The large populations of ~round squirrels that once occurred in Santa Cruz<oun~y no longer exists° Only with persistent effort has this economic and diseaseproblem been reduced. This is best reflected in the accompanying chart by theamounts of CS2 and poisoned grain used. The man days and mileage cannot be materiallyreduced because of the constant surveillance that is necessary to control this minimumpopulation that has been achieved. As populations become smaller, control becomes moredifficult ~lth this terrain°
This year’s gassing program was hampered by dry ground. New fumigants, baitsand methods are being tested for better control° Areas of intended constructionsuch as the University of California campus and new subdivision areas are treatedand a special effort for eradication of ground squirrels is made°
OTHER RODENTS :
Except in localized areas the rat populations were not abnormal. The Countyd~mps were poisoned with good results° A heavy rat population moved into the OpalClifi~ area~ apparently from the harbor construction at Wood’s Lagoon° Several in-spections were made in this area -with the Health Depar~hnento Wax blocks of anti-c~agu~an~ treated baits were used effectivelyo
The City of Watsonville is maintaining excellent rat control in their sewerswmth this same type wax block° Use of anticoagulant baits as purchased at our officeis shown in the chart on the opposite page°
Zinc phosphide treated grain bait for the control of meadow mice shows a re-duction due to the use and effectiveness of Endrin sprays° Some mice damage wasreported to bean fields as well as the usual damage to strawberries and artichokes,
Several Uo C. gopher baiting machines are now in operation in this County.Test plots for the evaluation of baits and poisons under local conditions were putout with "~he cooperation of the State Department of Agriculture. A poison mixerwas designed and purchased by this dejar~lento This mixer will increase theefficiency of our mixing operation and will produce a more effective bait. Sale of~opher bait was started the last two months of 1962.
No complaints of muskrat damage were received this year. These rodents canbe found throughout the valley° Several persons reported weasels in their yards andfields°
BIRD CONTROL~
The commercial treatment of lettuce seed has stopped some depredations ofthe spring plantings° Bushbero~ and strawberries were damaged by crowned sparrowslinnets, and gold finches° Crowned sparrows caused some damage to flower buds inplastic hot houses° Use of bird control baits is shown in the accompanying chart.
Pigeons caused hea~v dsmage to some bushberr9- plantings° A survey was madewith the Fish and Wildlife Service to devise better control°
In Febr’o~,ry an experimental light trap was designed and constructed atH¢ily Hills Fsrm for the purpose of trapping starlings°
An amplified distress call was used this winter to prevent extensive damagecaused by roosting in the grove° Up to this time it has been 100% effective° Theseexperiments were conducted in cooperation with the State Department of Agricultureand the U. So Fish and Wiidlife Service°
ll-

195o-19541955-1959
1962
!
GROUND SQUIRREL CONTROL
1962 Compared to 5 year averages
~8,601Acres Treated
195o-19541955-1959
1962
175 I~~361
Man Days
195o-1954~955-1959
1962 I~’~!~.._~~’~ .....~ ..... ~,~ ~ -~,~
7,032 IMiles_ 6,347 __.
1950-1954
1955-19591962
1,262 [Lbs. CS2 Used
{% 3,3o9 I
1950-19541955-1959
1962LbSo Poisoned Grain
OTHER PEST AN-h~AL CONTROL MEASURES
1955-19591962
1955-19591962
Lbs. Zinc Phosphide Treated Grain
Lbs. Anti-coagulantTreated Bait
1955--19591962
[0[I~ .... 730 -~L"-2L~" ~i_,-~ ~[~.:J!l Lbs. Strychnine Treated Gopher Bait
1955-19591962 Lbs° Bird Control Bait
1955:19591962
[ 109 OZo I~~" oz.~~i~-:-=- ..... ~ ...... 162
Ounces of Strychnine Gopher Poison
- 12

PLANT QUARANTINE
[nspeLtion of plant material entering the County from other states or counties<~s been a long established legal requirement for preventing the introduction or<rr~sJ of plant diseases~ insect pests, noxious weeds or seeds.
F~=ende4 findings of club root disease in this County required definite quarantine~r~a ~oundaries to be proposed° Several meetings on the efficacy of the club root.~r~ntine wsre heed with the surrounding County Agricultural Commissioners, the Cali-.... ..... ~ "~ [~p:r-~,ent of Agriculture and University of California pathologists.
The v,jl~ne of material certified for export increased over four (4) t~mes more¯ .n~n ias~ ~/e~r~
"~<APY C? INCOMING SHIH~ENTS interstate Intrastate Total Shipments
Sh ip~ents inspected - 2,037 675 2,712ShipmenLs Rejected 22 0 22Plants Inspected - 3,675,911 9,662,283 13,338,194Plants ~ejected - 659 0 659~ulk Tnspected (tons) - h,403 59 4,462Grain Fejected (tons) 966 0 966
,- ¯ u~F~pcr’t er’.:mflca~s 358 shipments 1,500,734 plants - 31,865 pkgs. produce.
£]~b rcot disease Certificates of Treatment issued - 16
NURSERY INSPECTION
With greater tendency toward origin inspection and intercounty certification~ore eft’oft is being directed to nursery inspection ~o assure pest free nursery stock.
An increase of over 13% in the number of licensed nurseries is noted this year.2everal ~arge new ornamental greenhouse operations have found this area ideally~uite:! ~o their needs for growing roses, carnations and chrysanthemums.
The increase in nursery inspection work required, is reflected in an increasef nearly 25~% in number of plants held for non-compliance, of which 66% was for
pe~t infestations requiring cleanup and 34% improperly labeled.
" ~’,~°r OF I’~URSERY INSPECTION- . ~ m~L~_..~n~:,d nurseries in County - 144i~Co nursery inspections made 166Non-compliance violations 31
Pinto Tag nurseries 29inspection man days - 156NOo plants held 31,868
SEED INSPECTION
[he California seed law requires labeling of agricultural and vegetable seeds fore~ty~ purity, germination, and weed seed content. Tnspeotion and sampling of
1 ..... is made in wholesale and retail sales places. Stop sales doubled overlast ~ear.
--,~, ,~..-v. OF SEED INSPECTION 1962 (1961)
Uo. of sued houses in County - 57 515ee~ inspection, man hours - 76 76Stop Sales issued - 4’1 20Official s--mnpies drawn I0 4
¯ - 13 -

WEED CONTROL - 1962
Regulations requiring the buyer of injurious materials to obtain a permitprior to purchase or use were extended this year to include Sodium Arsenite, whichhas caused considerable death loss to livestock and some humans to lose their livesin past years° By this regulation the permittee is given first hand information onhis weed problem and the proper methods and care to be taken in use of this material.
573 permits were issued for weed control this year -(316 - Sodium Arsenite (Triox) 212 ~ Herbicides)
Biological control of Puncture Vine was started late this summer with theestablishment of two colonies of the weevils Microlarinus lareynii. Many new colonieswill be started from these two releases next year.
Sixty-two (62) test plots were established this year using various newherbicides and mixtures in order to check local results that may be expected fromtheir use.
SUMMARY OF NOXIOUS WEED INFESTATIOLS - 1962
Infested Area (Acres)
Italian ThistlePurple Star ThistleKlamath WeedJohnson GrassYellow Star ThistleHoary CressQuack GrassRussian KnapweedWavy Leaved GauraAlkali MallowPoverty WeedWhite HorsenettleMorning GloryScented GauraPuncture VineGorseRussian Thistle
Crops & Roadsides No. Infestations Type of
Pasture Wasteland TOTAL Old New Total Program
2,200.00 340.00 2,540.00 24 0 24 Control
351o00 0.25 351.25 3 1 4 Eradicate
0.I0 1,218.00 1,218.10 3 0 3 Eradicate
42°55 6°60 49.15 82 3 85 Control
39.00 62°50 101o50 13 7 20 Eradicate
75 O o O0 5o 25 755.25 73 0 73 Control
0°50 3°70 4°20 15 0 15 Eradicate
2.50 0.25 2.75 3 0 3 Eradicate
0.I0 0oi0 I 0 I Eradicate
117.00 13o00 130o00 12 0 12 ControlIo00 1.00 I 0 I Eradicate
0.25 0.21 0.46 3 I 4 Eradicate
14,800.00 2~125.00 16,925.00 993 0 993 Control
2.00 2.00 I 0 I Eradicate
10.26 16.01 26°27 27 3 30 Eradicate
2.50 2.50 2 0 2 Eradicate0.02 0.02 2 0 2 Eradicate
18,317.66 3,791.89 22,109.55 1258 15 1273
14-


/
1 i ~’~ ~,~~" U~’~" ~ ¯ ~L’ ,~" " ~ ....
1963
County of
SANTA CRUZ
AGRICULTURAL COMMISSIONER

~D
K F/rm.a I ~o,.¢if 3
J[
REPORT OF SANTA CRUZ COUNTY
DEPARTMENT OF AGRICULTURE
TO
CHARLES PAUL, DIRECTOR
CALIFORNIA DEPARTMENT OF AGRICULTURE
AND
THE SANTA CRUZ COUNTY BOARD OF SUPERVISORS
RUSS MCCALLIE, CHAIRMAN
(Seaside)
FRANCIS SILLIMAN - (Pajaro)LEWIS NELSON - (Soquel)VINCEhF LOCATELLI - (San Lorenzo)ROBERT E, BURTON - (Brauciforte)

\
SANTA CRUS COUNTY
DEPARTMENT OF AGRICULTURE PERSONNEL
AGRICULTURAL CC~MISSIONER
MATT MELLO
ASSISTANT CC~MISSIONER
ROBERT J. HOFF
CLERKS
Sarah R.OdomMary Boyle
AGRICULTURAL INSPECTORS
Kenneth TweedyDonald H. ShawRichard Nutter
Fred HamischW. S. JamisonJerry Littleton
SEASONAL INSPECTOR
Joseph T. Brazil
ACKNOWLEDGEMENT
We are indebted to many individuals for their help andcooperation in making available to us their records and informationwith which to compile this Annual Report.

Page
;,_PI ARY INSPECTION ...................... ii
COUNTY STATISTICS ...................... I
CROP STATISTICS - Acreage & Production ........... 3-h
- Crop Summary ............... 5
- Trend of Permanent Crops ......... 6
- Trend of Other Crops ........... 7
- Trend of Value in Production ....... 2
NURSERY INSPECTION ............... 8
PEST CONTROL OPERATORS ............ II
PEST SURVEYS & PEST CONTROL .......... i0
8PLANT QUARANTINE .....................
RODENT & PEST ANIMAL CONTROL ................ 12
SEED INSPECTION ..................... 8
STANDARDIZATION ...................... 9
WEED CONTROL ........................ 13

Tm
Im
S"T
i
Elevation Range - 0 to 2,715
1963 TEMPERATURE RANGE
War s onville
73.96° F920 F38.76 ° F240 F
Average MaximumJuly 26th HighAverage MinimumJanuary l3thLow
Santa Cruz
68.80° F96o F .5oo F220 F
RAINFALL
Watsonville
34.26 inches26.02 inches19.34 inches
1963 Season (7-1-62 to 6-30-63)1962SeasonNormal Averages (Last 20 yrs.)
POPULATION & APPRAISAL
County Population (C.T.A. Estimate)Total net assessed valuation of property’(1963"64)~Total area of County (439 sq. miles) .......Total area of farm land (1959 Census) .......
(Not including forest land)
Santa Cruz
33.86 inches27.36 inches32.50 inches
¯ 105,200¯ $ 235,000,000.00¯ 280,960 acres¯ 108,984 acres
Big Basin ParkCapitola BeachHenry CowellManresa BeachTwin Lakes
STATE PARKS AREA
11,553 acres6 acres
1,737 acres21 acres
112 acresNesine Marks Forest -
- 21,195 acres
Natural BridgesNew BrightonSeacliffSunsetSanta Cru~Mimsion
7,27~ acres
-i-
47 acres63 acres84 acres
292 acresi acre

H
~o ~o
rJIG)
a) bJ)l
o
.p
MI(~1(DI
ooo
o~
S
ooooxor~
ooo
o~~o
8oo~oxc~J
o~
ooo
ooo
H
ooo
dp,.,.
ooo,S
ooo
sMD
000._4p.-
o8r-t0
000
r-t
8o
t’.-
ooo
co
ooo
H
o
ooo
8o
H
ooo
d
ooo
r~
0o0
o8
ooo
~D
ooo
H
8o-4
r~
ooo
ooo
o
ooo
ooo..4
0oo
e-t
co
oo
~o
oo
r-4
00~Q
00
r’4
08
oo
~g
-2-
80,g
ooo
o8
p.-
ooo_4oge-t
o8
ooo
r.-t
o
o00
do
m
8o
o8,o
ooo
p.-
r-t
08,S
.-4
ooo
~D
r’t
80
ooo
ooo
._4
oooc~
r-i
ooo
o,2,
ooo
_4r-I
e-t
.-4
i1)
m
o m
ox

ACREAGE, PRODUCTION and VALUE of AGRICULTURAL PRODUCTS
FRUIT CROPSApples
--Fresh--Dryer--Processing---Juice
Apricots--Fresh--Dry*--Processing
CherriesGrapesPearsPersimmonsPlumsPrunes---Dry*WalnutsMiscellaneous
SANTA CRUZ COUNTY, CALIFORNIACompiled by MATT MELLO, Agricultural Commissioner
1963 1962
Bearing PRODUCTION F.O.B. VALUE Bearing PRODUCTION F.O.B. VALUEAcres Per Acre Total Unit Per Unit Total Acres Per Acre Total Unit Per Unit Total
7,488 14.66 (109,790) Tons ($ 8,124,000) 8,986 13.4 (120,490) Tons ($12,355,000)
33,220 Tons $ 112.72 3,745,000 52,090 Tons $ 153.76 8,009,000
12,t.15 Tons 59.50 721,000 19,985 Tons 04.48 1,289,000
45,480 Tons 61.59 2,801,0~0 34,505 Tons 72.30 2,497,000
18,975 Tons 45.17 857,000 13,910 Tons 40.25 560,000
154 3.46 205 Tons 161.00 33,000 235 1.1 150 Tons 260.00 39,000
57 Tons* 1,100.00 63,000 22 Tons* 1,360.00 30,000
45 Tons 77.00 3,000 -- -- --46 .04 2 Tons 650.00 1,000 89 1.66 150 Tons 786.00 118,000
107 .71 75 Tons 109.00 8,000 104 1. 105 Tons 152.00 16,000
514 2.26 1,160 Tons 110.00 128,000 741 4.65 3,445 Tons 78.95 272,000
21 3.37 70 Tons 111.00 8,000 18 6. 108 Tons 230.00 25,000
440 1.24 545 Tons 124.00 68,000 541 .87 470 Tons 260.00 122,000
304 .88 160 Tons* 230.00 37,000 502 2.27 570 Tons* 320.00 182,000
48 .03 1 Tons 624.00 1,000 55 .26 15 Tons 600.00 9,000
66 5,000 66 6,000
9,248 $ 8,479,000 " 11,337 $13,174,000
BERRY CROPSBlackberriesBoysenberriesLoganberriesRaspberriesBlue and Misc.Strawberries
--Fresh--Processing
265 5.8 1,540 Tons $238.00 $ 366,000 305 7.25 2,180 Tons $ 213.75 $ 466,000
140 3.0 420 Tons 286.00 120,000 170 3.3 560 Tons 260.00 146,000
70 2.5 175 Tons 241.00 42,000 75 2.7 205 Tons 230.00 47,000
60 1,154.0 69,200 Trays 9~ 3.35 232,000 60 1,287. 77,200 Trays 9# 3.36 259,000
30 305.0 9,150 Trays 10~ 4.00 37,000 25 480. 12,000 Trays 10# 3.75 45,0@0
820 1,685,000 Trays 12# 2.20 3,708,000 940 1,709,000 Trays 12# 2.16 3,688,000
14.6 1,810 Tons 240.00 434,000 12.8 1,660 Tons 260.00 430,000
1,385 "$ 4,939,000 1,575 $ 5,081,000
FIELD CROPSBeans, dry 385 17.
Grain 630 1.26
Hay 4,240 2.44Corn Silage 205 14.25Pas .%tre, Irrig. 3,050Pasture, Other 49,715
Sugar Beets 545 33.
Veg. & Flower Seed 5Nursery Stock 595
--Bulbs--Cut Flowers
6,545 cwt. $ 9.40 $ 62,00{} 740 16.12790 Tons 44.90 35,000 650 1,34
10,345 Tons 35.30 365,000 4,500 2.372,920 Tons 15.00 44,000 160 14.5
Acres 15.00 107,0{)0 2,850Acres 2.75 137,000 49,850
17,985 Tons 11.50 207,000 210 26.210 Lbs. 56,000 25
4,704,000 Plants 1,506,000 5954,869,000 Bulbs 461,000
41,744,000Blooms 1,572,000
11.930 cwt. $ 10.94 $ 131,000875 Tons 44.81 39,000
10,650 Tons 34.10 363,0902,345 Tons 15.00 35,000
Acres 35.00 100,000Acres 2.75 137,000
5,460 Tons ii.00 60,0003,000 Lbs. 86,000
10,512,000Plants 1,441,0005,456,000Bulbs 667,000
26,515,000Blooms 1,173,000
59,370 $ 4,552,000 59,580 $ 4,232,000
97,700 bxs. 21# $ 2.00 $ 195,00011,590 Tons 144.75 1,078,000
755 Tons 184.40 139,000
21,505 Tons 215.00 4,624,00018,045 cwt. 3.70 67,00063,590 cwt. 7.25 461.000
119,000 errs. 2.15 256,00020,000 doz. .55 ii,0001,245 Tons 71.00 88,000
1.74 2,469,000.50 1,369,000
14.00 21,0005.28 802,0004.07 99,000
237,000
VEGETABLE CROPSArtichokes 380 257.2 390 270. 105,000 bxs. 21#- $ 1.85 $ 194,000
Beans, Green 1,380 8.4 2,170 7.7 16,710 Tons 126.75 2,118,000
Broccoli 375 2.02 410 2.3 945 Tons 175.24 166,000
Brussels Sprouts 2,930 7.34 2,750 7.1 19,595 Tons 212.50 4,160,000
Cabbage 140 128.9 65 234. 14,725 cwt. 2.00 30,000
Cauliflower 870 73.1 690 96. 66,470 cwt. 7.37 490,000
Celery 220 541. 190 701. 133,200crts. 2.13 284,000
Corn, sweet 25 800. 80 720. 57,600 Doz. .40 23,000
Cucumbers 150 8.3 60 7.6 455 Tons 67.56 31,000
Lettuce 3,220 440.7 1,419,000 ctus. 3,595 494. 1,776,000ctns. 1.64 2,913,000
Mushrooms 2,739,000 Lbs. 2,990,000Lbs. .55 1,643,000
Peas 30 51. 1,530 cwt. 70 65. 4,500 cwt. 12.60 57,000
Squash 485 I18. 57,230 cwt. 370 82. 30,340cwt. 4.79 145,000
Tomatoes 140 174. 24,360 cwt. 150 73. 10,950 cwt. 4.62 51,000
Misc. Veg. 305 330 145,00010,650 $ 12,016,000 "11,320 $12,450,000
PLANT INDUSTRY 80,653 $ 29,986,000 83,812 $34,937,009

1963
PRODUCTION F.O.B. VALUETotal Unit Per Unit Total
APIARYHoney 2,500 colonies 133,000 Lbs. $ 0.14 $ 19,000Wax 1,500 Lbs. 0.44 7,000Pollination 2,450 colonies 20,000
MILKMarket 119,000 cwt. 4.60 547,000Manufacturing 39,800 cwt. 2.99 118,000
LIVESTOCKCattle & Calves 8,690 head 62,050 cwt. 21.66 1,344,000Breeders 350 head 92,000Swine 815 head 1,615 cwt. 16.62 27,000Sheep & Lambs 2,740 head 2,835 ewt. 18.08 51,000--Wool 16,670 Lbs. 0.43 7,000
EGGS--Market 4,280,000doz. 0.342 1,464,000--Hatching 451,670doz. 482,000
CHICKENS 4,634,700 fryers18,631,500Lbs. 0.177 3,298,000POULTRY, Other 395,000TURKEYS 101,210 birds 2,132,300Lbs. 0.224 478,000RABBITS 35,320 head 159,000Lbs, 0.291 46,000FUR ANIMALS
ANI3IAL INDUSTRY $ 8,395,000
1962
PRODUCTION F.O.B. VALUETotal Unit Per Unit Total
2,475 colonies 198,000 Lbs. $ 0.12 $ 24,0001,855 Lbs. 0.48 1,00O
2,475 colonies 20,000
112,000 cwt. 4.70 529,00053,400 cwt. 2.98 159,000
5,535 head 47,700 cwt. 21.96 1,047,000135 head 53,000765 head 1,450 cwt. 18.38 27,000
2,480 head 2,570 cwt. 17.62 45,00017,580 Lbs. .43 8,000
4,500,430 Doz. .35 1,597,000280j280 Doz. 303,000
3,970,000 fryers 15,942,000 Lbs. .144 2,296,000585,000
86,400 birds 1,810,800 Lbs. .216 394,00059,360 head 258,000 Lbs. .295 76,0003,220 head 107,000
$ 7,268,000
GRAND TOTAL---All Production $38,381,000 S42,205,000
GOVERNMENT PAYMENTS $ 58,000 $ 41,000

CROP SUMMARY - 1963
The total gross value of agricultural production reflected a decline withfruit crops hardest hit.
The F.O.B. value represents the gross value of the product when sold and doesnot mean net income to the producer.
Many factors influenced the figures indicated in this report. Shrinking acreagein production reduced by subdivisions and economic conditions of high costs and lowreturns. Adverse weather severely affected most fruit crops. Frost, hail and lateheavy spring rains affected fruit set and caused poor quality and disease conditions.
A Federal-State tree census completed during the year changed the recordedfruit acreage in the County.
Mushroom production and value is changed in this report from Field Crops toVegetable Crops to conform with Statewide reporting procedure.
APPLES - Adverse weather affected production and quality. Severe russeting wasgeneral and presented marketing problems. Other Western States had large applecrops and swamped the markets in California, giving local producers unusually hea~jcompetition at low prices. Fresh market prices were weak from the start and did notimprove. Processing demand helped the apple movement extensively during the earlyseason period. Heavy importation of cheaper processing apples from other states bylocal processors had a depressing influence on demand and price in late season.
CHERRIES - A crop failure due to weather and bird damage.
PEARS - Good market price and demand but light crop due to weather, decline andacreage removal.
PLUMS - Light crop, severe hail injury and heavy shipments from competitive pro-ducin-----g areas resulted in low market returns.
BUSHBERRIES - Production lower but market demand and returns considerably better.
STRAWBERRIES - Some acreage reduction but production and fresh market prices improved.
NURSERY STOCK - Substantial increase in cut flowers production. Economics shiftingproduction of ornamental plants.
LETTUCE - Marketing program not in effect this season° Heavy spring rains affectedspring crop with weak market. Summer crop good with improved market. Weak marketdemand and growing conditions affected the fall crop.
BRUSSELS SPROUTS - Continued to increase in importance as a major crop here. Withimminent harvest labor problems, growers are directing their attention to newvarieties that may be mechanically harvested.
LIVESTOCK - Marketings of cattle reflected sizeable increase with sheep and hogsalso on upswing.
-5-
TRENDOF PERMANENT CROPS IN SANTA CRUZ COUNTY
APPLES - 1954 1958
Newtown PippinDelicious - RedDelicious - StdBellefleurWinter BananaWoWoPearmainGravensteinGolden DeliciousMcIntoshOther Varieties
TOTAL
Bearing Acres TotalNon-bearing Acreage
1963 Acreage 1 9 6 3
4,918 4,373 3j762 413 4,1751,781 1,779 2,363 1,551 3,914
528 536 396 5 401846 480 284 i 285214 202 151 27 178193 160 106 0 106156 103 89 i0 9939 43 72 40 112
6 6 ii 205 216474 292 254 196 450
9,155 7,974 7,488 2,448 9,936
APRICOTS -
All Varieties 378 257 154 32 186
CHERRIES
Royal Ann 106 46 13 0Bing 67 43 19 IOther Varieties 96 26 14 0
TOTAL 269 ll5 46 1
GRAPES
Wine Varieties 500 217 87 2Table Varieties 50 28 20 2
TOTAL 550 245 107 4
PEARS
132O1447
8922
Iii
Bartlett 627 575 399 50 449Beurre Hardy 192 172 104 17 121Comice 46 26 9 0 9Other Varieties 55 38 2 I 3
TOTAL 920 811 514 68 582
PLUMS
Santa Rosa 299 368 391 58 449Other Varieties 106 32 50 3 53
TOTAL 405 400 441 61 502
PRUNES -
French 541 416 292 1 293Other Varieties 126 52 72 6 78
TOTAL 667 503 364 7 371
)
ALL FRUIT & NUT CROPS -
GRAND TOTAL (Acres)
~.~ ...........
12,344 lO,3O5-6-
11,735

Bushberries
TREND OF OTHER CROPS
-N SANTA CRUZ COUNTY
Total Acres Grown ( Includes New Plantings)
1959 1960 1961 1962 1963
940 865 815 715 655
Blackberry 435 415 375 340 340Blueberry* Misc. 20 25 25 25 30Boysenberry 285 225 235 205 155Loganberry 125 120 90 85~ 70Raspberry 75 80 90 60 60
Strawberries 1,850 1,070 925 940 820
Artichokes 410 395 390 390 380
Beans, green 945 1,290 1,770 2,170 1,380
Broccoli 1,145 680 650 410 375
Brussels sprouts 2,725 2,635 2,760 2,750 2,930
Cabbage 90 140 45 65 140
Cauliflower 685 1,325 1,175 690 870
Celery 190 230 250 190 220
Corn, sweet 200 215 75 80 25
Lettuce, spring 1,050 535 445 340 250
Lettuce, summer 2,115 2,480 2,310 2,100 2,105
Lettuce, fall 985 1,220 1,180 I~155 865
Potatoes 50 170 70 125 65
Squash 220 505 325 370 485
Tomatoes 230 230 140 150 140
Beans, dry 575 360 300 740 385
Grain 315 450 605 650 630
Hay 2,600 4,870 4,720 4,500 4,240
Sugar beets 425 520 630 210 545
Nursery Stock 620 690 530 595 595
-7-

PLANT QUARANTINE
Restricting the movement of commodities or appliances that may introduce or spreadinsect pests~ notions weeds or seeds and plant diseases has long been an effectivetool in protecting agriculture in California.
In many cases treatment can be applied insuring cleanliness and the commoditiesmay be released.
Clearance of farm equipment leaving the Club Root quarantine area of the Countywas handled smoothly and effectively with good cooperation from growers in the area.Considerable man time was required to ser~ce this r~,~.rL:~ed program during the year.
The usual interceptions of incoming quarantine s~ib1 ~mts in violation were notedwith cit~as whitefly and chestnut bark disease predominating.
SUMMARY OF INCOMING SHIPMENTS Interstate Intrastate
Shipments Inspected 2,064 767Shipments Rejected 14 0
Plants Inspected 6,120,252 8,159,662Plants Rejected 76 OBulk Tnspected (T~ns) 7,394 0
Total Shipments
2,83114
14,279,91476
7,394
Export Certificates - 323 shipments - 1,517,832 plants - 14,152 pkgs.Club Root Disease Certificates of Treatment issued - 223Postentry Shipments ~ 4 (80 plants)
NURSERY INSPECTION
produce
Plant nurseries are required by State law to maintain proper labeling and standardsof pest cleanliness°
A marked improvement in labeling by local nurseries was noted during the year° Overfive times as many plants were required to be held for pest cleanup this year.
New firms engaged in floriculture continue to locate here from other areas.
SUMMARY OF ~RSERY INSPECTION
Noo Plant Nurseries - i17Noo Nursery Inspections - 120Non-Compliance violations - 30Noo Cut Flower Nurseries - 18
Pinto Tag Nurseries 30Inspection man days - 134No. Plants held - 171,222
SEED INSPECTION
Inspection aua sampling of agricultural and vegetable seed lots made in wholesaleand retail sales places for proper labeling as to germination and weed seeds in-creased over the pre~ous year.
S~ARY OF SEED INSPECTION
Noo of seed houses in CountySeed inspection, man hoursStop Sales issuedOfficial samples drawn
1963 1962
62 5712’~ 7681 4116 lO

STANDARDIZATION
This function relates to inspection of fruits, vegetables, nuts, eggs, poultry meat,and honey for compliance with standards of quality, packing arrangement, containers andmarking requirements when these products are prepared and offered for sale.
Inspections are made in the fields, packing houses and truck terminals on out-goingshipments as well as in the retail and wholesale markets affecting local consumer levels.
Work load on marketing order programs was lighter due to short crops but more effortwas required on egg inspection to correct problem areas.
Cold storage reports of apple holdings from the 24 storages here were assembledmonthly for growers information.
Apple maturity tests reflected low soluble solids levels due to a late cool season.
LETTUCE INSPECTION
No. certificates issuedNo. man hoursNo. pkgs. certifiedNo. inspections
1963 1962
1,602 1,7941,471 1,683
1,392,989 1,782,1603,494 4,237
PRODUCE CERTIFICATION
No. certificates issuedNo. man hoursNo. pkgs. certifiedNo. inspections
718 609379 403
179,430 189,486718 618
MARKETING ORDER CERTIFICATION
No. inspectionsNo. man hours~resh Plums (Pkgs.)Other Marketing Orders
82 22563½ 145
9,973 16,710938 9,844
MARKET INSPECTION
No. produce inspectionsNo. egg inspectionsEggs inspected (doz~Eggs rejected (doz)No. egg violationsPoultry inspected (pkgs.)Honey inspected
3,789 4,205702 571
115,096 127,72411,56o 2,815
214 5033,287 41,04267,564 78,243
SUMMARY - STANDARDIZATION
Man days - totalTotal inspectionsTotal pkgs. inspectedTotal pkgs. certifiedTotal pkgs. rejectedNo. violations issuedTotal certif, fees rec’d
687 635lO,371 lO,972
2,637,042 3,338,1931,572,419 1,998,2oo
2o,915 12,262392 234
$ 6,92o. $ 9,o85.
-9-

PEST SURVEYS AND PEST CONTROL
PESTDETECTION SURVEYS - 1963PROPERTIES
~EST HOST PROPERTIES INSPECTED CALLS INFESTED
Frult Files Fruit IIO llO Traps 1173 0;~panese Beetle Lawns-Ornam° 17 17 " 218 0Burrowing Nematode Anthurium I 50 Plants i 02~trus Wh°Fly & O1.Scale Ornamentals 148 27 Acres 148 07~urb1~ Insects Cucurbits 12 53 Acres 2 0~rn Inse~ts Corn 8 41 Acres 8 0’]rape Insects Grape 1 17 Acres 5 0Spruce Needle Miner Spruce Trees 4 6 Acres 4 0Kh~pra Beetle Grain 18 18 0Club Root Crucifers 34 516 Acres 34 iM~eie Bladder Gall Mite Maple i 500 Trees i 0FJcnsla Leaf Rust Fuchsias 3 14,000 Plants 3 0Tree Fern Mite Ferns 6 i00 Plants 6 0
363 1621 I
PEST SURVEYS AND CONTROL - 3,749 Man Hours - 3,464 Calls.LABORATORY IDENTIFICATION SAMPLES - Plant Diseases 183 - Insects 155.PERMITS ISSUED FOR CSE OF INJURIOUS MATERIALS - 251.EXPER~ENTAL PEST CONTROL INFORMATION PLOTS - 19NON-COMMERCIAL PEST CONTROL - 117½ Man Hours - 186 Properties 297 Calls.PEST ABATEMENTS - 38 Properties - 88°3 Acres Apples/Pears - Noxious Weeds - Treated or removed.
Major pest control problems involved the following:
EUROPEAN RED MITE - Severe on apples during late smnmer and fall. Control with most miticidesineffective or short duration° Early season Karathane applications for mildew gave suppressioncontrolo Oil in combination with Ethion WoP. tried and was satisfactory in most cases. Othero~[ miticide combinations gave variable results° Tepp dusts used by air as temporary controlsand last ditch effort°
TWO SPOT MITE -Troublesome on strawberries, beans and cucumbers.
CABBAGE MAGC~T - Severe in Brussels Sprouts°
CABBAGE WORM & CABBAGE BUTTERFLY - Damaging in Cauliflower plantings.
WALNUT HUSK FLY - Becoming wide spread in County generally°
PEACH TWIG BORER - Unusual infestations affecting prune fruit°
CALIFORNIA OAK MOTH Extensive infestations on Oak trees.
CLUB ROOT Reduced production in some Cauliflower fields.
ANGULAR LEAF SPOT - Not common here - found affecting cucumbers.
FUSARIUM ox_y~porium - Causing trouble in asparagus.
APPLE SCAB - Fairly widespread °~iage°I
- lO -

PEST CONTROL OPERATORS
Pest control operators are licensed by the State Department of Agricultureand must register with the Commissioner of the County in which work is to be done.
State regulations specify conditions of workmanship and precautions inapplications under direction of the Agricultural Commissioner.
There were forty-three (43) Pest Control Operators registered in Santa CruzCounty in 1963. Five of these were aerial applicators.
SUMMARY OF WORK BY PEST CONTROL OPERATORS
Area TreatedApplication By Type Crop 1963 1962
Aircraft Orchards 4,104 4,563Ground Rig " 1,448 1,466
Aircraft Berries 2,652 3,200Ground Rig " 129 679
Aircraft Vegetables 10,408 9,906Ground Rig " I0,010 6,222
Aircraft Ornam& Misc 181 582Ground Rig " " 742 257
APIARY 1963
During 1963, 2509 colonies of bees were registered in this County. Thisregistered colony population is only a small portion of the total number ofhives present during late winter and spring months. Migratory bee keepers movetheir bees into this County principally to pollinate our tree fruits, thusincreasing the hive count to an estimated 5,000 colonies.
Because of the hazard of bee losses due to insecticide poisoning, we main-tain a map recording all locations of Apiaries. This information is valuable toall parties concerned, Beekeepers, Pest Control Operators and Farmers and hasproved to be effective with no loss occurring. Most Beekeepers cooperated promptlyreporting all movement of bees.
One of the duties of this office is the inspection of Apiaries for beediseases. Inspection emphasis was based upon field experience and the detectionincidence of diseased colonies.
SUMMARY OF APIARY INSPECTION
N~ber of ApiariesTotal Number of ColoniesApiaries InspectedColonies InspectedColonies Infected A.F.B.Apiaries Infected A.F.B.
1963 1962 1961
115 114 1123,097 3,089 2,907
42 22 33827 343 1,995
6 i 135 1 5
- ll -

ANNUAL REPORT 1963RODENT & PEST ANIMAL CONTROL
GPOL~ND SQUIRRELS~. Soil moisture conditions were favorable for burrow fumigation, althoughthe numerous sprlng rains caused some delays in our gassing program. Experiements in co-operation with the State Department of Agriculture using anhydrous ammonia as a fumigantwore carried out but this method did not prove as effective as had been hoped. Extendedperiods of rain split the breeding season into two distinct parts. Our poisoning programwas delayed because of this fact and also a noted lack of acceptance in early prebait trialsSquirrels in urban areas are still a control problem. Cage feeding trials using severalcoagulant poisons were also carried out with the State. Improvement in trapping techniquesare making control in these areas more economical. Moving of our bait materials, suppliesand our new poison mixing machine into larger quarters at the Holohan Yard was completedthls year°
1955-1959 Average 1963
Man Days 175 Days 150 DaysCS2 1,262 Lbs 870 LbsGrain 243 Lbs 237 Lbs
OTHER RODENTS: Anti-coagulant treated rolled wheat prepared and sold by our Departmentis our chief method of control for commensal rodent population. Sewer rat control ismaintained by the use of wax block anti-coagulants. The heaviest rat population is tobe found at the County dump. These rats are poisoned every year but the results are poordue mainly to large amounts of exposed food and harborage.
1955-1959 Average 1963Anti-Coagulant Grain 1,851 Lbs 2,110 Lbs
Meadow mice populations were high this year as indicated by the amount ofZinc Phosphide treated grain that was sold, in addition to chemical treatments.
1962 1963
Zinc treated grains sold 520 Lbs 545 Lbs
Tbo Pocket Gopher causes more damage to crops and gardens than all otherrodents. Trapping is still the primary method of control for small acreage. The useof the mechanical gopher baiting machine has been found to be very effective in orchardsand pastures. The amount of use of this machine is reflected by the amount of gopherbait soldo The bait is used at approximately 4# per acre.
1955-1959 Average 1963Strychnine-grain 0 2,695 LbsOzs° Strychnine 109 0zs. 132 Ozs
BIRD CONTROL: Damage to strawberries by Linnets and Crowned Sparrows was normal. Bait-ing trials indicated that good control could be obtained if enough care was takenduring pre-baiting°
1955-1959 Average 1963
Lbs treated bait 303 Lbs 400 Lbs
Wild Pigeons were not as plentiful as they have been in the past butsome damage was caused to bushberrieso Cedar WaxWings caused some heavy damageover a long period of time°
- 12 -
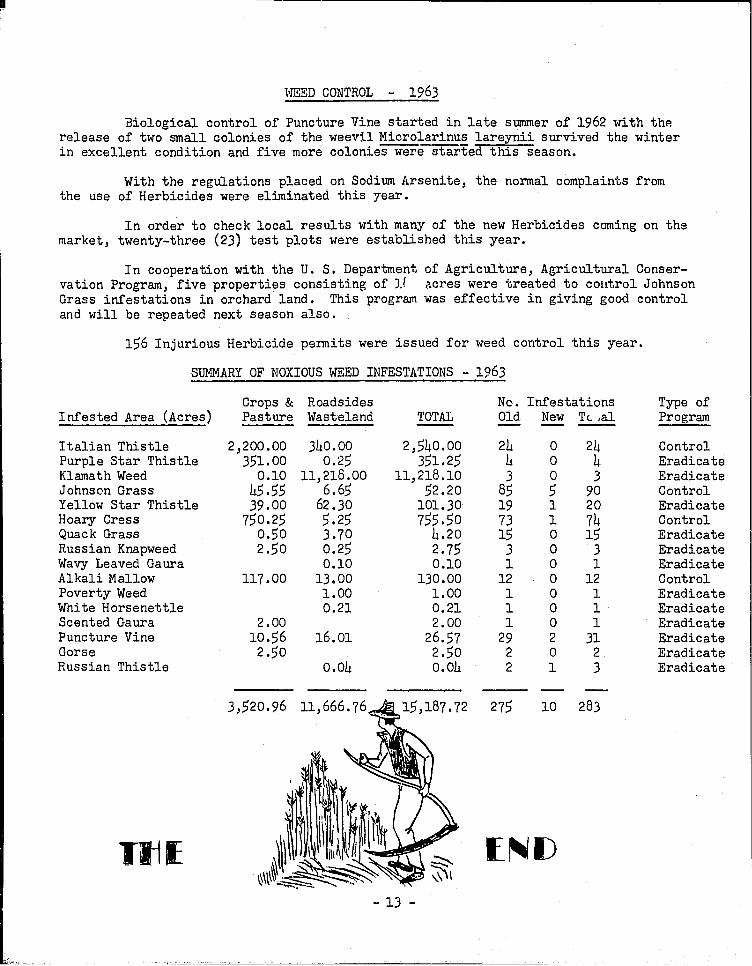
WEEDCONTROL - 1963
Biological control of Puncture Vine started in late simmer of 1962 with therelease of two small colonies of the weevil Microlarinus lareyuii survived the winterin excellent condition and five more colonies were started this season.
With the regulations placed on Sodium Arsenite, the normal complaints fromthe use of Herbicides were eliminated this year.
In order to check local results with many of the new Herbicides coming on themarket, twenty-three (23) test plots were established this year.
In cooperation with the U. S. Department of Agriculture, Agricultural Conser-vation Program, five properties consisting of I[ acres were treated to control JohnsonGrass infestations in orchard land. This progr~l was effective in giving good controland will be repeated next season also.
156 Injurious Herbicide permits were issued for weed control this year.
SUMMARY OF NOXIOUS WEED INFESTATIONS - 1963
Crops & Roadsides Nc. Infestations Type ofInfested Area (Acres) Pasture Wasteland TOTAL Old New Tc ,al Program
Italian Thistle 2,200.00 340.00 2,540.00 24 0 24 ControlPurple Star Thistle 351.00 0.25 351.25 4 0 4 EradicateKlamath Weed 0.I0 11,218.00 11,218.10 3 0 3 EradicateJohnson Grass 45.55 6.65 52.20 85 5 90 ControlYellow Star Thistle 39.00 62.30 101.30 19 I 20 EradicateHoary Cress 750.25 5.25 755.50 73 I 74 ControlQuack Grass 0.50 3.70 4.20 15 0 15 EradicateRussian Knapweed 2.50 0.25 2.75 3 0 3 EradicateWavy Leaved Gaura 0.i0 0.I0 I 0 I EradicateAlkali Mallow 117.00 13.00 130.00 12 0 12 ControlPoverty Weed 1.00 1.00 I 0 I EradicateWhite Horsenettle 0.21 0.21 I O I EradicateScented Gaura 2.00 2.00 i 0 I EradicatePuncture Vine 10.56 16.01 26.57 29 2 31 EradicateGorse 2.50 2.50 2 0 2 EradicateRussian Thistle 0.04 0.04 2 I 3 Eradicate
3,520.96 ii, 666.76~5,187.72 275 I0
- 13 -
m
283


ACREAGE, PRODUCTION and VALUE of AGRICULTURAL PRODUCTSSANTA CRUZ COUNTY, CALIFORNIA
Compiled by MATT M~LLO, Agricultural Commlstioner
1964f A
Bearing PRODUCTION F.O.B. VALUEFRUIT CROPS Acres Per Acre Total Unit Per Unit TotalApples 7,800 17.4 (135,750) Tons ($ 9,122,090)
--Fresh 58,310 Tons $ 109.47 6,383,000--Dryer 8,900 Tons 39.40 351,000--Processing 42,150 Tons 41.23 1,738,000-Juice 26,390 Tons 24.62 650,000
Apricots--Fresh 158 4.12 260 Tons 240.00 62,000 154--Dry* 76 Tons* 800.00 61,000--Processing 11 Tons 90.00 1,000
Cherries 46 .80 40 Tons 372.00 15,000 46Grapes 109 1.01 110 Tons 145.00 16,000 107Pears 520 3.47 1,805 Tons 93.00 168,000 514Persimmons 21 4.4 92 Tons 200.00 18,000 21Plums 510 3.II 1,585 Tons 192.00 304,000 440Prunes--Dry* 346 .81 140 Tons* 180.00 25,000 364Walnuts 68 18 12 Tons 606.00 7,000 48Miscellaneous 77 5,000 66
9,655 $ 9,804,000 9,248
1963
Bearing PRODUCTION F.O.B. VALUEAcres Per Acre Total U~dt Per Unit Total7,488 14.66 (109,790) Tons ($ 8,124,000)
33,220 Tons $ 112.72 3,745,00012,115 Tons 59.50 721,00045,480 Tons 61.59 2,801,00018,975 Tons 45.17 857,000
3.46 205 Tons 161.00 33,00057 Tons* 1,100.00 63,00045 Tons 77.00 3,000
.04 2 Tons 650.00 1,000
.71 75 Tons I09.00 8,0002.26 1,160 Tons 110.00 128,0003.37 70 Tons 111.00 8,0001.24 545 Tons 124.00 68,000.88 160 To,ls* 230.00 37,000.03 1 Tons 624.00 1,000
5,000$ 8,479,000
BERRY CROPSBlackberriesBoysenberriesLoganberriesRaspberriesBlue and }~isc.Strawberries
--Fresh--Processing
350 5.2110 2.450 2.470 1,052.30 365.
77515.6
1,385
1,820 Tons $ 329.00 $ 699,000 265 5.8265 Tons 377.00 100,000 140 3.0120 Tons 340.00 41,000" "~ 2.5
73,640 Trays 9# 3.70 272,000 1,154.010,950 Trays i0# 3.80 42,000 30 305.0
1,800,000 Trays 12# 2.41 4,338,000 8201,280 Tons 235.00 301.000 14.6
$ 5,693,000 1,385
1,540 Tons $238.00 $ 366,000420 Tons 286.00 120,000175 Tons 241.00 42,000
69,200 Trays 9# 3.35 232,0009,150 Trays 10# 4.00 37,000
1,685,000 Trays 12# 2.20 3,708,0001,810 Tons 240.00 434.000
$ 4,939,000
FIELD CROPSBeans, dry 320 17.Grain 500 1.11Hay 4,015 1.84Corn Silage 145 21.75Pasture, Irrig. 3,070Pasture, Other 49,715Sugar Beets 565 32.Veg. & Flower Seed 10Nursery Stock 695
--BulbsCut Flowers
59,055
5,440 Cwt. $11.00 $ 60,000 17.555 Tons 44.60 25,000 630 1.26
7,390 Tons 33.20 245,000 4,240 2.443,155 Tons 15.00 47,000 205 14.25
Acres 35.00 107,000 3,050Acres 2.75 137,000 49,715
18,720 Tons 12.30 230,000 545 33.915 Lbs. 46,000 5
5,465,00(}Plants 1,618,000 595
3,528,000Bulbs 436,00041,008,000Blooms 1,696,000
$ 4,647,000 59,370
6,545 cwt. $ 9.46 $ 62,000790 Tons 44.90 35,000
10,345 Tons 35.30 365,0002,920 Tons 15.00 44,000
Acres 35.00 107,000Acres 2.75 137,000
17,985 Tons 11.50 207,000210 Lbs. 56,000
4,704,000 Plants 1,506,0004,869,000 Bulbs 461,000
41,744,000 Blooms 1,572,000$ 4,552,000
VEGETABLE CROPSArtichokes 430 229.Beans, Green 1,365 9.23Broccoli 205 2.29Brussels Sprouts 3,015 7.00Cabbage 80 231.Cauliflower 780 71.4Celery 240 630.Corn, sweet 30 815.Lettuce 3,125 556.MushroomsSquash 520 i07.Tomatoes 115 180.Misc. Veg. 420
10,325
98,470 Bxs.21# $ 1.70 $ 167,000 380 257.2 97,700 bxs. 21# $ 2.00 $ 195,00012,600 Tons 145.70 1,836,000 1,380 8.4 11,590 Tons 144.75 1,678,000
470 Tons 153.45 72,000 375 2.02 755 Tons 184.40 139,00021,105 Tons 192.40 4,061,000 2,930 7.34 21,505 Tons 215.00 4,624,00018,480 Cwt. 3.15 58,000 140 128.9 18,045 cwt. 3.70 67,00055,690 Cwt. 6.95 387,000 870 73.1 63,590 cwt. 7.25 461,000
151,200 Crts. 2.38 360,000 220 541. 119,000 errs. 2.15 256,00024,500 Doz. .55 13,000 25 800. 20,000 doz. .55 Ii,000
1,737,000 Ctns. 1.45 2,519,000 3,220 440.7 1,419,000 ctns. 1.74 2,469,0002,893,000 Lbs. .55 1,591,000 2,739,000 Lbs. .50 1,369,000
55,640 Cwt. 7.40 412,000 485 118. 57,230 cwt. 5.28 302,00020,700 Cwt. 7.60 157,000 140 174. 24,360 cwt. 4.07 99,000
292.000 485 346,00010,650$ 11,925,000 $ 12,016,000
PLANT INDUSTRY 80,420 $ 32,069,000 80,653 $ 29,986,000
c~ ,.~ ~ c~ ~ c~" ,.~" T~- c~’c~~
~ ~"
J!°
I!°
r~
LIJ

County of Santa Cruz
1964
CROP
REPORT
AGRICULTURAL COMMISSIONERP. O. Box 590
WATSONVILLE, CALIFORNIA


CROP
REPORTCounty of Santa Cruz
1965
AGRICULTURAL COMMISSIONERP. O. Box ~90
WATSONVILLE, CALIFORNIA

ACREAGE, PRODUCTION and VALUE of AGRICULTURAL PRODUCTSSANTA CRUZ COUNTY, CALIFORNIA
Coraptlad by MATT MELLO, Agricultural Commissioner
1965 1964
Bearing PRODUCTION F.O.B. VALUE Bearing PRODUCTION F.O.B. VALUEFRUIT CROPS Acres Per Acre Total Unit Per Unit Total Acres Per Acre Total Unit Per Unit Total
Apples 7,486 16.93 (126,780) Tons ($12,773,000) 7,800 17.4 (135,750) Tons ($9,122,000)
-Fresh 53,200 Tons $150.22 7,992,000 58,310 Tons $109.47 6,383,000
-Dryer 15,295 Tons 63.96 978,000 8,900 Tons 39.40 351,000
-Processing 40,735 Tons 71.76 2,923,000 42,150 Tons 41.23 1,738,000
-Juice 17,550 Tons 50.12 880,000 26,390 Tons 24.62 650,000
Apt,cot s 165 4.55 (750) Tons (146,000) 158 4.12 (650) Tons
- Fresh 540 Tons 200.00 108,000 260 Tons 240.00 62,000
-Dry" 36 Tons* 1,000.00 36,000 76 Tons~ 800.00 61,000
-Processing 30 Tons 60.00 2,000 11 Tons 90.00 1,000
Cherries 30 .17 5 Tons 700.00 4,000 46 .86 40 Tons 372.00 15,000
Grapes 102 1.47 150 Tons 168.00 25,000 109 1.01 110 Tons 145.00 16,000
Pears 444 3.33 1,480 Tons 138.00 204,000 520 3.47 1,805 Tons 93.00 168,000
Persimmons 21 2.86 60 Tons 240.00 14,000 21 4.4 92 Tons 200.00 18,000
Plums 439 1.77 775 Tons 97.00 75,000 510 3.11 1,$85 Tons 192.00 304,000
Prunes-Dry’ 293 1.37 200 Tons~ 200.00 40,000 346 .81 140 Tans* 180.00 25,000
Walnuts 44 .18 8 Tons 505.00 4,000 68 .18 12 Tons 606.00 7,000
M; scel laneous 25 14,000 77 5,000
9,049 $13,299,000 9,655 $9,804,000
BERRY CROPSBlackberries 375 .5.01 1,880 Tons $386.00 $ 726,000 350 5.2 1,820 Tons $329.00 $ 599,000
Boysenberrles 95 2.9 - 275 Tons 432.00 119,000 11r’"b. 2.4 265 Tons 377.00 100,000
Loganberr,es 35 1.9 65 Tons 440.00 29,000 L 2.4 120 Tons 340.00 41,000
Raspberries 55 889.00 48,900 Trays9# 3.80 186~000 70 1,052. 73,640 Trays 9 H 3.70 272,000
Bl~e & M,sc. 25 285.00 7,100 Trays10 # 3.40 24,000 30 365. 10,950 Trays 10 ~ 3.80 42,000
Strawberries 810 14.75 (11,9441 Tons (5,113,000) 775 15.6 (12,070) Tons-Fresh 1,719,000Trays12# 2.64 4,538,000 1,800,000 Trays12#2.41 4,338,000
-Processmg 1,630 Tons 353.00 575,000 1~280 Tons 235.00 301,000
1,395 $ 6,197,000 I 38~ $5,693,000
FIELD CROPSBeans, Dry 500 16.8 8,400 Cwt. $ 12.50 $ 105,000 320 17. 5,440 Cwt. $ 11.00 $ 60.000
Grain 745 1.08 805 Tons 49.25 40,000 500 1.11 555 Tons 44.60 25,000
Hay 5,380 2.62 14,100 Tons 30.35 428,000 4,015 1.84 7,390 Tons 33.20 245,000
Corn S,lage 155 19.82 3,070 Tons 15.00 46,000 145 21.75 3,155 Tons 15.00 47,000
Posture, lrrig. 3,070 Acres 35.00 107,000 3,070 Acres 35.00 107,000
Pasture, Other 49,700 Acres 2.75 137,000 49,715 Acres 2.75 137,000
Sugar Beets 335 26.00 8,710 Tons 12.00 105,000 585 32. 18,720 Tons 12.30 230,000
Veg. & FI ower Seed 10 1,830 Lbs 63,000 10 915 Lbs. 46,000
Nursery Stock 745 6,368,000 Plants 1,747,000 695 5,455,000 Plants 1,618,000
-Bulbs 4,009,000 Bulbs 591,000 3,528,000 Bulbs 436,000
-Cut Flowers 36,525,000 Blooms 2,056,000 41,008,000 Blooms 1,696,000
$ 5,425,000 5%05560,640 $4,647,000
VEGETABLE CROP5Arhchokes 430 56.5 24,300 Cwt. $ 8.15 $ 198,000 430 229. 98,470 Bxs.21# 1.70 $ 167,000
Beans, Green 815 4.48 3,650 Tons 136.85 500,000 1,365 9.23 12,600 Tons 145.70 1,836,000
Broccol, (Misc. Veg.) 205 2.29 470 Tons 153.45 72,000
Brussels Sprouts 2,930 6.09 17,845 Tons 240. 4,283,000 3,015 7.00 21,105 Tons 192.40 4,061,000
Cabbage 270 200. 54,000 Cwt. 3.17 171,000 80 231 18,480 Cwt. 3.15 58,000
Cauliflower 745 58.9 43,900 Cwt. 9.10 399,000 780 71.4 55,690 Cwt. 6.95 387,000
C~lery 250 448. 112,000 Cwt. 5.16 578,000 240 630. 151,200 Crts60# 2.38 360,000
Corn, Sweet 40 540. 21,600 Doz. .62 13,000 30 815. 24,500 Doz .55 13,000
L,ettuce 3,465 563. 1,951,000 Ctns. 2.07 4,038,000 3,125 556. 1,737,000 Ctns. 1.45 2,519,000
Mushrooms 2,905,000 k_bs. .543 1,577,000 2,893,000 Lbs. .55 1,591,000
Squash 445 111. 49,400 Cwt. 5.75 284,000 520 107. 55,640 Cwt. 7.40 412,000
Tomatoes 120 257.5 30,900 Cwt. 5.63 174,000 115 180. 20,700 Cwt. 7.60 157,000
MJ sc. Veg. 420 282,000 420 292,000
9,930 $12,497,000 10,325 $11,925,000
PLANT INDUSTRY 81,014 $37,418,000 80,420 $32,069,000

1965 1964
PRODUCTION F.O.B. VALUE PRODUCTION F.O.B VALUETotal Unit Per Unit Total Total Unit Per Unit Total
APIARYHoney 3,650 colonies 155,000 Lbs. $ .14 $ 22,000 3,660 colonies 179,000 Lbs. $ .145 $ 26,000Wox 1,700 Lbs. .46 1,000 2,000 Lbs. .42 1,000Pollination 2,990 colonies 21,000 2,980 colonies 20,000
MILKMorket 129,000Cwt. 4.48 578,000 119,000Cwt. 4.55 541,000
Manufacturing 39,600 Cwt. 3.26 129,000 36,000 Cwt. 3.22 116,000LIVESTOCK
Cattle & Calves 8,350 head 57,000 Cwt. 21.00 1,197,000 8,830 head 63,755 Cwt. 18.40 1,173,000Breeders 470 head 139,000 290 h sad 114,000Swine 515 head 1,210 Cwt. 21.50 26,000 735 head 1,305Cwt. 17.66 23,000Sheep & Lambs 2,490 head 2,600 Cwt. 20.10 52,000 2,510 head 2,600 Cwt. 18.15 47,000-Wool 17,100 Lbs. .49 8,000 14,700 Lbs. .47 7,000
EGGS-Market 3,096,000 Doz. .358 1,108,000 3,130,000 Doz. .362 1,133,000-Hatching 87,700 Doz. 223,000 122,500 Doz. 247,000
CHICKENS 1,305,000 fryarl 5,222,000 Lbn. .172 898,000 2,886,70C fryers 11,546,800 Lbs. .173 1,998,000
POULTRY, Other 710,000 499,000TURKEYS 49,000 blrds 1,029,000L.bs. .223 229,000 54,500 birds 1,275,300 Lbs. .221 282,000
RABBITS 36,800 head 166,000L.bs. .294 49,000 34,350 head 155,000 Lbs. .268 42,000
ANIMAL INDUSTRY $5,390,000 $6,269,000
GRAND TOTAL - All Production $42,808,000 $38,338,000
GOVERNMENT PAYMENTS $ 35, 000 $ 62,000


~C,a]if. Santa Cruz County.---Commxss loner.
Agricultural
~County of Santa Cruz
1966
CROP
REPORT
~ERSITY ~ d’J, LIFoR-NiA
~ ~ DAVIS
MAY 8 1967
I_.GOV’T. DOCS. LIBRARY --
AGRICULTURAL COMMISSIONERP. O. Box 590
WATSONVILLE, CALIFORNIA

ACREAGE, PRODUCTION and VALUE of AGRICULTURAL PRODUCTSSANTA CRUZ COUNTY - 1966
Compiled by MATT MELLO, Agricultural Commissioner
1966 1965
Bearing PRODUCTION F.O.B. VALUE Bearing PRODUCTION F.O,B. VALUEFRUIT CROPS Acres Per Acre Total Unit Per Unit Total Acres Per Acre Total Unit Per Unit Total
;,~, ~,. 7,575 16.45 (124,635) Tons ~$11,800,00017,486 16.93 (126.780) Tans S12,773 000¯ ash 54,235 Tons $140.50 7,620,000 53,200 Tans $150.22 " 992,000
D,~e~ 16,040 Tons 62.50 1,002,000 15.295 Tons 63.96 978,C00P,o~ ass n~ 36,520 Tons 67.00 2,447,000 40,735 Tons 71.76 2,923,000J., e 17,840 Tons 41.00 731,000 17,550 Tons 50,12 880 000
A~. ~o,,. 157 5.26 ~825) Tons (163,000/ 16.5 4.55 (750) Tons 146.000),ash 400 Tons 195.00 78,000 540 Tons 200.00 108,000
D~>’ 80 Tons" 1,040.00 83,000 36 Tons* 1.000.00 36 000Processing 25 Tons 84.00 2,000 30 Tons 60.00 2,000
...... es 29 1.21 35 Tons 600.00 21,000 30 . t7 5 Tans 700.00 4,000~,r apes 102 1.2 120 Tons 205.00 25,000 102 1.47 150 Tons 168.00 25,000P~a,,. 435 3.4 1,480 Tons 76.00 112,000 444 3.33 1,480 Tons 138.00 204,000Pc ....... ~ons 23 5.9 135 Tons 200.00 27,000 21 2.86 60 Tons 240.00 14,000Pl Jm,, 441 2.35 1,035 Tons 174.00 180,000 439 1.77 775 Tons 97.00 75,000P,.-es-Dr~" 272 .81 220 Tons~ 280.00 62,000 293 .682 200 Tons" 200.00 40,000~aM~ts 44 .21 9 Tans 501.00 5,000 44 .18 8 Tans 505.00 4,000M,srellaneo~s 24 9,000 25 14,000
9,102 $12t404r000 9,049 $13,299.000BERRY CROPS[{lackberr,es 475 5.6 2,600 Tons S280.00 ~ 7!5,000 375 5.01 1,880 Tons $386.00 $ 726,000[~o~ ,,enberr,es 70 2.4 t 168 Tans 360 00 60,000 95 ~r’?.9 275 Tans 432.00 119,000[ ~g]nberr,es 25 1.8 45 Tans 380 00 t7,000 35 ~_~ .9 65 Tons 440.00 29,000Raspberr,es 45 918. ,41,300 Trays 9:: 4.38 181,000 55 889.00 48,900 Trays 9 fl 3.80 186 000Bl~, & M, sc 25 114. 2,850 Trays 10: 3.50 10,000 25 285.00 7,100 Trays ]0 # 3.40 24,000St,a~b~’-,e, 720 17.72 (12,755/ Tons 5,529,000~ 810 14.75 11 9441 Tons 4’5, 113,000}
F~esh 1,679,400 Trays 12.: 2.75 4,6t8,000 1,719,000 Trays12 tt 2.64 4,538,000Process,rig 2,680 Tans 340.00 911.000 1,630 Tons 353.00 575.000
1,360 S 6,542,000 1,395 $ 6,197,000FIELD CROPSBeans Dry 635 22.33 14,180 Cwt $ 11.30 $ 160,000 500 16.8 8.400 Cwt. $ 12.50 S 105,000G,a,n 170 .9 155 Tons 50.40 8,000 745 1.08 805 Tons 49.25 40,000Ha~ 4,775 1.24 5,920 Tons 33.80 200,000 5,380 2.62 14,100 Tons 30.35 428.000Corn S,lage 135 13.8 1,860 Tons 18.40 34,000 155 19.82 3,070 Tons 15.00 46,000Pasture, Irrlg 5,155 Acres 35.00 110,000 3,070 Ae,es 35.00 107.000Pasture. Other 49,780 Acres 2.75 137,000 49,700 Acres 2.75 137,000Sugar Beets 165 27.45 4,530 Tons 12.90 58,300 335 26.00 8,710 Tons 12.00 105,000Veg. & Flower Seed 15 10,580 Lbs. 84,000 10 1,830 Lbs 63,000Nur ser~, Stock 640 6,668,000 Plants 1.831,000 745 6,368,000 Plants 1,747,000
-Bulb~ 3,375,000 Bulbs 556,000 4,009,000 Bulbs 591,000-Cut Flowers 37,849,000 Blooms 1,664,000 36,525,000 Blooms 2,056,000
59,470 S 4,842,000 60,640 S 5,425,000
VEGETABLE CROPSA~t,chokes 430 60. 25,800 Cwt $ 8.02 $ 207,000 430 56.5 24,300 Cwt. $ 8.15 $ 198,000Beans, Green 450 7.1t 3,200 Tons 180.40 577,000 815 4.48 3,650 Tons 136.85 500.000Broccol, 155 3.17 491 Tons 180.25 89,000 (Misc. Veg.)Brussels Sprouts 3, ~,80 6.18 19,655 Tons 245.00 4,815,000 2,930 6.09 17,845 Tons 240. 4,283,000Cabbage 300 264. 79,200 Cwt 4.48 355,000 270 200, 54,000 Cwt. 3.17 171,000Cauliflawe~ 800 76.31 61,050 Cwt 7.39 451,900 745 58.9 43,900 Cwt. 9,10 399,000Ce’,,,y 255 488. 124,500 Cwt 4.34 540,000 250 448. 112,000 Cwt. 5,16 578,000Corn. Sweet 55 484. 26,600 Doz. .59 16, O00 40 540. 21,600 Doz. .62 t3,000Lettuce 4,390 600. 2,634,000 Ctns. 2.20 5,795,000 3,465 563. 1,951,000 Ctns, 2.07 4,038,000Mushrooms 3,516,000 Lbs. .547 1,923,000 2,905,000 Lbs, .543 1,577,000Squash 310 168. 52,080 Cwt 8.62 449,000 445 11 I. 49,400 Cwt. 5.75 284,000Tomatoes 105 199. 20,900 Cwt 8.14 170,000 120 257,5 30,900 Cwt. 5.63 174,000Misc. Veg. 380 376,000 420 282,000
10,810 $15,763,000 9,930 "$12,497,000
PLANT INDUSTRY 80,742 $39,551,000 81,014 $37,418,000

1966 1965
PRODUCTION F.O.B. VALUE PRODUCTION F.O.B. VALUETotal Unit Per Unit Total Total Unit Per Unit Tota
APIARY~4..~e~ 4,830 Colonies 106,000 Lbs. S .145 $ 15,000 3,650 colonies 155,000 Lbs. $ .14 S 22,000"’~ 1,200 Lbs .47 1.000 1,700 Lbs. .46 1,000,’_ I ,~*,o, 2,140 Colonies 11,000 2,g90 ~olan,es 21,000
M~LK,~ J,k~.t 150,000 Cwt 4.52 678 000 129,000 Cwt. 4.48 578,000’~a.,, ~a~,t~r,ng 27,900 Cwt 3.73 104 00C 39,600 Cwt. 3.26 :29,000
LIVESTOCK, ,:,h, & Calves 8,245 Head 55,160 Cwl 20.63 1,138,000 8,350 head 57,000 Cwt. 21.00 1,197,000,~,~’¢" ]e~, 150 Head 58,000 470 head 139,000S~ ,~e 610 Head 1,240 Cwt 25.85 32,000 5"~5 head 1,210 Cwt. 21.50 26,000h~,,~ep & L arabs 2,285 Head 2,400 Cwt 19.90 48.000 2,490 he~d 2,600 Cwt. 20.10 52,000,’,-o 16,050 Lbs. 49 8.000 17,100 Lbs. .49 8,000
.EGGS~:,~* 2,554,000 Doz 415 1,060,000 3,096,000 Doz. .358 1,108,000H~,:hmg 110,800 Doz. 285,000 87,700 Doz. 223,000
CHICKENS 1,139,200 Fryers 4,557,000 Lbs, 175 797,000 1,305,000 f, ye,s 5,222,000 Lbs. .172 898,000POULTRY, Other 833,000 710,000TURKEYS 69,100 Birds 1,431,500 Lbs. 246 352,000 49,000 b rds 1,029,000 Llos. .223 229,000RABBITS 44,100 Head 198,500 kbs. 292 58,000 36,800 head 166,000 Lbs. .294 49,000
ANIMAL INDUSTRY S 5,478,000 $5,390,000
GRAND TOTAL - All Production $45,029,000 $42,808,000GOVERNMENT PAYMENTS $ 31,000 $ 35,000

/9 7

1967
County of
UNIVERSITY C-~ ,-- , .....~AL,FO, .... ,\
APR 23 IS88
SANTA CRUZ
AGRIOilLTUIIAL COMMISSIONER....... ...... : ....... IInI " ................

0.0.0.0.0.0.0 nO.O.OnOnononOnOnOnOnO*On0nOnOnO.OnOnOnOnOnOnOnOnOnO*O*O*OnO*0*ononO*
*00 n* 0O**0On* 0O**0O*nOO*nOO**00**0O*n 0O**0O**0O** 0O**0O*.0O**0O*
O**0O**00 **0O*nOO**0O**00 *nO0 ** 0O**0O**0O*
REPORT OF SANTA CRUZ COUNTY
DEPARTMENT OF AGRICULTURE
TO
EARL COKE, DIRECTOR
CALIFORNIA DEPARTMENT OF AGRICULTURE
AND
~E SANTA CRUZ COUNTY BOARD OF SUPERVISORS
~ICMAS A. BLACK - Soquel DistrictRUSS McCALLIE - Seaside "VINCENT LOCATELLI - San Lorenzo "ROBERT E. BURTON - Branciforte "HENRY MELL0 - Pajaro "
COUNTY ADMINISTRATIVE OFFICERCARLYLE MILLAR
0 n¯ Ic- 00*nO0 @nO0 **0on*0On*0O**0O*nO0 n¯ 0on-~ 00**00 *.0O*-x-OO*nO0 **00 *¯ 0O**0O*.0O**0O*n 00 -]t-@00 **0O**0O*n 0O*nO0 @*00 *
*00.0.0.0.0.0.0.0.0.0-0-0-0"0"O*0"0"0"0" O* 0
*O *0 *0 *0 * 0 *0 *0 *0 *0 *0 n 0 nO *O * 0 *0 *0 nO * 0 *0 *0 *

0
0
0
0
0
0
0
0
0
*0-0-0-0-0-0
SANTA CRUZ COUNTY
DEPARTMENT OF AGRICULTURE PERSONNEL
AGRI CI£LTURAL CCMMISSI ONER
MATT MELLO
ASSISTANT CC~MISSIONER
ROBERT J. HOFF
DEPUTY AGRICULTURAL CCMMISSIOE~R
RICHARD NUTTER
CLERKS
Sarah R. OdomAleene L.Howe
AGRICULTURAL INSPECTORS
Kenneth TweedyDonald H. ShawFred HamischW. S. JamisonJay Bauer
SEASONAL INSPECTOR
0 * 0 * 0 * 0 * 0 * 0 *.O’.
0
0
0
0
0
0
0
0
Joseph T. Brazil
0
0
0
0
0
0
0
0
0
ACKNOWLEDGMENT
Our sincere appreciation is extended to all the individualsand organizations who provided us with information which helpedmake this report possible.
*0-0-0-0-0-0
MATT M~LOAgricultural Commissioner
0
0@
0
0
0
0
0
0
0 * 0 * 0 * 0 * 0 * 0 * 0
-
APIARY INSPECTION .....................
COUntY STATISTICS .....................
CROP STATISTICS - Acreage & Production ...........
- Crop Summary ................
- Trend of Permanent Crops .........
- Trend of Other Crops ...........
- Trend of Value in Production .......
INSECT & DISEASE DETECTION SURVEYS ............
NURSERY INSPECTION ...................
PEST CONTROL & ABAT~ENT ..................
PEST CONTROL OPERATORS ...................
PLANT QUARANTINE ....................
SEED INSPECTION .....................
STANDARDIZATI ON ....................
VERTEBRATE PEST CONTROL ..................
WEED CONTROL ........................
Page
9
1
3-4
5
6
7
2
I0
9
II
II
i0
9
8
12
13

Elevation Range - 0 to 3,214
~tsonville
1967 Temperature Range
Santa Cruz
74.71 ° F Average Maximum 76.10° F
I01 ° F Oct. 16th High Oct. 16th 96° F
38.83 ° F Average Minimum 45~00° F
27° F Dec. 15th Low Dec. 16th 28v F
Watsonville
33.81 inches16.57 inches19.84 inches
RAINFALL
1967 Season (7-1-66 to 6-30-67)1966 Season
Normal Average (Last 20 years)
POPULATION & APPRAISAL
Santa Cruz
40.57 inches20.15 inches31.72 inches
Santa Cruz County Population (State Dept of Finance est.)Total assessed valuation of property (1967-68)Total area of County (439 sq. miles)
STATE PARKS AREA - 21,195 acres
112,700$ 289,154,5oo.
280,960 acres
Big Basin Park 11,553 acres Natural Bridges 47 acres
Capitola Beach 6 acres New Brighton 63 acres
Henry Cowell 1,737 acres Seacliff 84 acres
Manresa Beach 21 acres Sunset 292 acres
Twin Lakes ll2 acres Santa Cruz Mission 1 acre
Nesine Marks Forest - 7,279 acres
-1-

~. u-~~,i1
oo
~2
OoO
ooO
Oo
" oOoO
OoO
0oo
ooO
o
0 0 0 0 0 0 0 00 0 0 0 0 0 0 0
0 0 0 0 0 0 0
~-H
0 0 0 0 0 0 0 00 0 0 0 0 0 0 0¯ ,0 0 0 0 0 0 0 0
" .4 ~
o o o 8 o o o o 8 o o 8o oo o o o o o oe~ 0-,
c~ o c’W ~ 0 o’~ ..~ L’--..
r-I r-I H ,-’1
0 0 0 0 0 0 0 00 0 0 O 0 0 O 00 0 0 0 0 0 0 0
o o o o o o o ~g o 8 o o o o o
o o 0 0 o
-., o- -d o- 8
0~ o r-t 0~ o’~ ~ ~ ~o
-2-
oo
0~
8o
i"
H

ACREAGE, PRODUCTION and VALUE of AGRICULTURAL PRODUCTSSANTA CRUZ COUNTY - 1967
Compiled by MATT MELLO, Agricultural Commissioner
1967
Bearing PRODUCTION F.O.B. VALUEFRUIT CROPS Acres Per Acre Total Unit Per Unit TotalApples 7,586 12.97 (98,400) Tons ($ 9,086,000) 7,575
-Fresh 25,700 Tons $175.00 4,498,000-Dryer 10,900 Tons 65.00 708,000-Processing 40,800 Tons 74.10 3,023,000-Juice 21,000 Tons 40.80 857,000
Apr,cots 129 5.08 (655) Tons (150,000) 157-Fresh 300 Tons 270.00 81,000-Dry" 60 Tons* 1,100.00 66,000-Processing 25 Tons 120.00 3,000
Cherr,es (Misc. Fruit) 29Grapes 102 1.08 110 Tons 230.00 25,300 102Pears 395 2.34 925 Tons 173.00 160,000 435Persimmons 26 2.32 60 Tons 240.00 14,400 23Plums 389 2.98 1,160 Tons 59.00 68,400 441Prunes-Dry’ 254 .04 10 Tons* 240.00 2,400 272Walnuts 21 .14 3 Tons 570.00 1,700 44Miscellaneous 45 8,300 24
8,947 $ 9,516,500 9t102"BERRY CROPSBlackberries 440 4.89Boysenberries 55 2.64Loganberries & Misc. 15 1.67Raspberries 55 618.Strawberries 750 16.80
-Fresh-Proces sing
2,150 Tons $137.00 $ 295,000 475 5.6145 Tons 184.00 26,700 70 2.425 Tons 480.00 12,000 50 1.2
34,000 Trays 9# 3.85 131,000 45 918.(12,600) Tons (4,466,000) 720 17,72
1,712,000 Trays 12# 2.25 3,852,0002,360 Tons 260.00 614,000
1966
Bearing PRODUCTION F.O.B. VALUEAcres Per Acre Total Unit Per Unit Total
16.45 (124,635) Tons ($11,800,000)54,235 Tons $140.50 7,620,00016,040 Tons 62.50 1,002,00036,520 Tons 67.00 2,447,00017,840 Tons 41.00 731,000
5.26 (825) Tons (163,000)400 Tons 195.00 78,00080 Tons* 1,040.00 83,000
84.00 2,000600.00 21,000205.00 25,00076.00 112,000
200.00 27,000174.00 180,000280.00 62,000501.00 5,000
9,000
$12,404,000
2,600 Tons $280.00 $ 745,000168 Tons 360.00 60,00060 Tons 450.00 27,000
41,300 Trays 9# 4.38 181,000(12,755) Tons (5,529,000)
1,679,400 Trays 12# 2.75 4,618,0002,680 Tons 340.00 911,000
25 Tons1.21 35 Tans1.2 120 Tons3.4 1,480 Tons5.9 135 Tons2.35 1,035 Tons,81 220 Tons*.21 9 Tons
1,315 $ 4,930,700 1,360 $ 6,542,000FIELD CROPSBeans, Dry 215 19.8Grain 165 1.06Hay 5,150 1.6Corn Silage 90 12.Pasture, Irrlg. 3,290Pasture, Other 49,700Sugar Beets 215 23.
¯ & Flower Seed 35,.ur sery Stock 640
-Bulbs-Cut Flowers
59,500
4,260 Cwt175 Tons
8,250 Tons1,080 Tons
AcresAcres
4,940 Tons32,000 Lbs.
5,981,000 Plants3,292,000 Bulbs
43,597,000 Blooms
$ 14.70 $ 62,60057.3033.2019.9035.002.77
14.00
635 22.3310,000 170 .9
274,000 4,775 1.2421,500 135 13.8
115,000 3,155138,000 49.78069,200 165 27.4599,400 15
1,683,000 640538,000
2,094,000
$ 5,104,700 59,470
14,180 Cwt $ 11.30 $ 160,000155 Tons 50.40 8,000
5,920 Tons 33.80 200,0001,860 Tons 18.40 34,000
Acres 35.00 110,000Acres 2.75 137,000
4,530 Tons 12.90 58,00010,580 Lbs. 84,000
6,668,000 Plants 1,831,0003,375,000 Bulbs 556,000
37,849,000 Blooms 1,664,000
$ 4,842,000
VEGETABLE CROPSArtichokes 430 53.5Beans, Green 480 6.4Broccoli 165 2.61Brussels Sprouts 3,460 6.16Cabbage 310 241.Cauliflower 515 68.2
Celery 245 498.
Corn, Sweet 25 904.Cucumbers 105 145.Lettuce 4,060 484.MushroomsSquash 270 142.Tomatoes 85 117,Misc. Veg. 230
10,380
23,000 Cwt $ 8.00 $ 184,0003,070 Tons 170.00
430 Tons 128.0021,300 Tons 198.0074,700 Cwt 3.2435,100 Cwt 8.20
122,000 Cwt 5.3522,600 Doz. .6815,200 Cwt 4.33
1,965,000 Ctns 2.403,668,000 Lbs. .516
38,300 Cwt 7.479,940 Cwt 10.20
430 60.522,000 450 7.1155,000 155 3.17
4,217,000 3,180 6.18242,000 300 264.288,000 800 76.31653,000 255 488.
15,400 55 484.65,800 (Misc.Veg.)
4,716,000 4,390 600.1,893,000
286,000 310 168.101,000 105 199.275,000 380
$13,513,200 10,810
25,800 Cwt $ 8.02 $ 207,0003,200 Tons 180.40 577,000
491 Tons 180.25 89,00019,655 Tons 245.00 4,815,00079,200 Cwt 4.48 355,00061,050 Cwt 7.39 451,000124,500 Cwt 4.34 540,00026,600 Doz. .59 16,000
2,634,000 Ctns. 2.20 5,795,0003,516,000 Lbs. .547 1,923,000
52,080 Cwt 8.62 449,00020,900 Cwt 8.14 170,000
376,000
$15,763,000
PLANT INDUSTRY 80,142 $33,065,100 80,742 $39,551,000
OVER

1967 1966
PRODUCTION F.O.B. VALUE PRODUCTIONTotal Unit Per Unit Total Total Unit
APIARYHoney 4,850 Colonies 112,000 Lbs. $ .13 $ 14,600 4,830 Colonies 106,000 Lbs. $ .145Wax 1,300 Lbs. .63 800 1,200 Lbs. .47Pollination 14,800 2,140 Colonies
MILKMarket 138,000 Cwt 4.61 636,000 150,000 Cwt 4.52Manufacturing 34,400 Cwt 3.83 132,000 27,900 Cwt 3.73
LIVESTOCKCattle & Calves 8,380 Head 55,200 Cwt 20.80 1,148,000 8,245 Head 55,160 Cwt 20.63Breeders 360 Head 119,000 150 HeadSwine 460 Head 930 Cwt 18.80 17,500 610 Head 1,240 Cwt 25.85Sheep & Lambs 2,340 Head 2,470 Cwt 19.00 46,900 2,285 Head 2,400 Cwt 19.90Wool 17,000 Lbs. .43 7,300 16,050 kbs. .49
EGGSMarket 2,598,000 Doz. .35 909,000 2,554,000 Doz. .415Hatching 161,000 Doz. 384,000 110,800 Doz.
CHICKENS 1,000,000 Fryers 3,998,000 Lbs. .169 676,000 1,139,200 Fryers 4,557,000 Lbs. .175POULTRY, Other 768,000TURKEYS 74,700 1,500,000 Lbs. .18 270,000 69,100 Birds 1,431,000 Lbs. .246RABBITS 46,700 210,000 Lbs. .295 62,000 44,100 Head 198,500 Lbs. .292
F.O.B. VALUEPer Unit Total
15,0001,000
11,000
678,000104,000
I, 138,00058,00032,00048,0008,000
1,060,000285,000797,000833,000352,00058,000
GI;.AND TOTAL - All Production $38,271,000 $45,029,000
GOVERNMENT PAYMENTS $ 40,000 $ 31,000
ANIMAL INDUSTRY $ 5,205,900 $ 5,4; 0

SANTACRUZ COUNTY CROP SUMMARY - 1967
Adverse weather during this year was a major factor affecting acreage, productionand value of principal crops produced in this County. Economic conditions in marketingcontributed to the decline in gross value of many important agricultural products.
In combination this resulted in a total gross value of $ 38,271,000. a decrease of$ 6,758,000. from the year 1966. The F. O. B. value represents the gross value of theproduct when sold and is not net income to the producer.
APPLES - Growers experienced an extremely difficult season. Disease was rampant in thetrees during the early growing season from rains and with poor pollination, both affectedcrop set. Delicious variety was most seriously affected and heavy russeting on Newtownseliminated a high percentage of the fruit from fresh market shipments.
Fresh market prices were good most of the season due to light supplies. Early priceoffering by processors was low, but as the season progressed, prices advanced when shortsupply became evident and processor needs were not being filled. Reduced tonnage resultedin a decline exceeding 2.7 million dollars in total gross returns for this crop.
APRICOTS - Rain and hail in bloom and jacket stages affected crop and reduced yield. Themarket price received on fresh shipments was considered very good but growers were dis-satisfied with returns on dried apricots.
PEARS - Bloom and fruit set severly affected by rain and hail caused substantial cropreduction. Canning price abnormally high since crop condition was short state wide anddemand was strong. All sold for processing.
PLUMS - Bulk of production severely hail damaged, utilized by processing in larger quantitythan any previous year and growers salvaged this crop at low value level.
BUSHBERRIES - Low market prices and fruit spoilage from rain contributed to a very poorseason with much fruit left unharvested.
STRAWBERRIES - Production reduced by weather and with lower market returns, a substantialdecline in gross value of this crop occurred.
LETTUCE - Heavy rains prevented normal spring plantings reducing total acreage plantedand lower overall production. During a period when market supplies nationally were light,prices reached an unprecendented $8.00 per carton for a brief period, then returned tonormal levels.
CUT FLOWERS - A sizeable increase is noted in area, production and gross returns whichis largely from hot house grown carnations and mums.New ranges currently under constructionindicates the flower industry will continue to expand and become increasingly importantin the local economy.
A total of 1,886,245 sq. ft. of production area reflects an increase of 1/3 moresquare footage than last year.
ANIMAL INDUSTRY - Slight increase in number and value of cattle marketed but other live-stock in downward trend. Hog prices dropped sharply and sheep and wool slightly down.Egg, poultry and turkey producers received much lower returns with several going outof production.

TREND OF PERMANENT CROPS IN SANTA CRUZ COUNTY - I0 years
MAJORVARIETIES
APPLES
Newtown PippinDelicious - RedDelicious - StdBellefleurWinter BananaW. W. PearmainGravensteinGolden DeliciousMcIntoshOther Varieties
TOTAL
TotalAcreage1 9 6 7
4,1103,798
3452011388765
lO3356391
9,594
Non-bearingAcreage
5851,008
20
13I3
1728495
2,008
1967
3,5252,790
34320112586628672
296
7,586
Bearing Ac~.~
1962
4,5772,710
488421208124I0165I0
282
8,986
APRICOTS
All Varieties 135 129 235
CheRRIES
BingOther Varieties
TOTAL
GRAPES
Wine VarietiesTable Varieties
TOTAL
1214
26
9713
llO
0O
0
8O
1214
26
8913
lO2
3455
89
8618
PEARS
BartlettHardyOther Varieties
TOTAL
PLUMS
Santa RosaOthe ~’ Varieties
TOTAL
330724
4o6
31971
39o
560
Ii
1O
1
325664
395
31871
389
56513937
741
49051541
PRUNES
FrenchOther Varieties
TOTAL
21442256
02
2
2144o
398104
502
OTHER FRUITS-NUTS 87 21 6b 143
1958
4,5731,979
53648o202160103436
292
8,374
257
4372
115
15431
57517264
811
368324O0
41698514
137
GRAND TOTAL (Acres) .7.1,004 2,057 11,341 10,793

TREND OF OTHER CROPS
IN SANTA CRUZ COUNTY
Total Acres Grown (Includes New Plantings)
1967 1966 1965 1964
Bushberries 580 735 745 695
1963
655
Blackberry 440Boysenberry 60Logan & Misc. 15Raspberry 65
Strawberries 750
Asparagus 65
Artichokes 430
Beans, green 480
Broccoli 165
Brussels Sprouts 3,460
Cabbage 310
Cauliflower 515
Celery 245
Corn, sweet 25
Lettuce, spring 340
Lettuce, summer 2,390
Lettuce, fall 1,330
Potatoes 80
Squash 270
Tomatoes 85
Beans, dry 215
Grain 165
Hay 5,150
Sugar beets 215
Nursery 640
54o 52o 4259O I00 12055 60 805o 65 7o
720 810 775
120 175 175
430 430 430
45o 815 1,365
155 15 2o5
3,180 2,930 3,015
300 270 80
800 745 7 80
255 250 240
55 40 30
695 280 215
2,345 2,170 2,035
1,350 815 875
60 85 85
310 445 520
lO5 12o ll5
635 500 320
170 745 500
4,775 5,380 4,0!5
165 335 585
640 745 695
7-
340155i006o
82o
165
38O
1,380
375
2,930
14o
87o
220
25
25O
2ji05
865
65
485
14o
385
63o
4,240
545
595
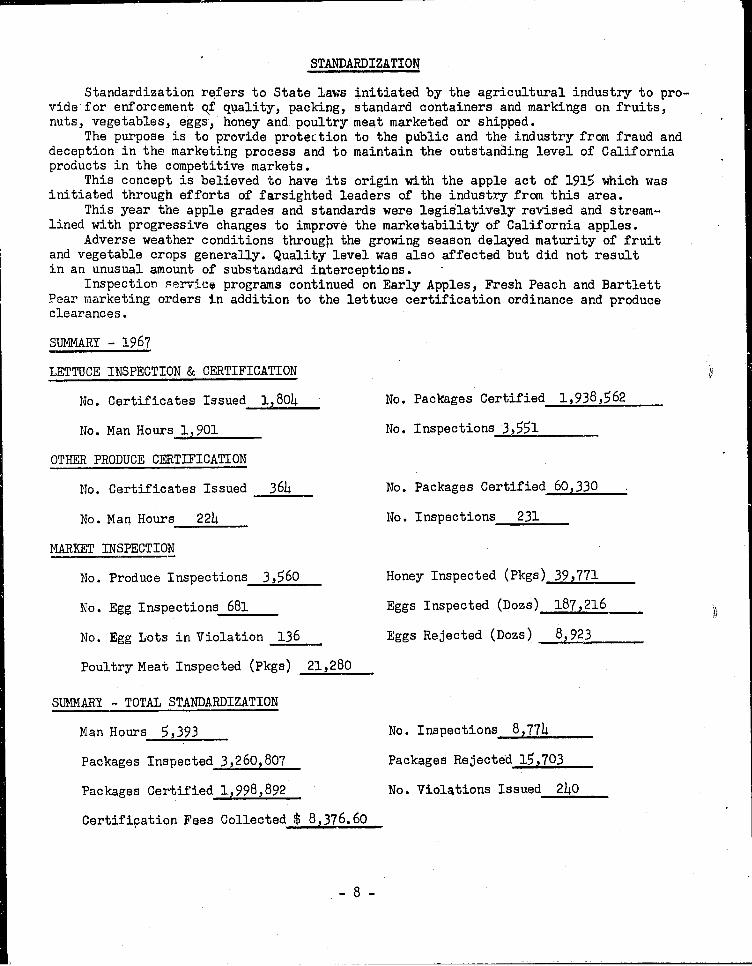
STANDARDIZATION
Standardization refers to State laws initiated by the agricultural industry to pro-vide for enforcement qf quality, packing, standard containers and markings on fruits,nuts, vegetables, eggs, honey and poultry meat marketed or shipped.
The purpose is to provide protection to the public and the industry from fraud anddeception in the marketing process and to maintain the outstanding level of Californiaproducts in the competitive markets.
This concept is believed to have its origin with the apple act of 1915 which wasinitiated through efforts of farsighted leaders of the industry from this area.
This year the apple grades and standards were legislatively revised and stream-lined with progressive changes to improve the marketability of California apples.
Adverse weather conditions throng b the growing season delayed maturity of fruitand vegetable crops generally. Quality level was also affected but did not resultin an unusual amount of substandard i~terceptions.
Inspection service programs continued on Early Apples, Fresh Peach and BartlettPear marketing orders in addition to the lettuce certification ordinance and produceclearances.
SUMMARY - 1967
LETTUCE INSPECTION & CERTIFICATION
No. Certificates Issued
No. Man Hours l~901
OTHER PRODUCE CERTIFICATION
i~8o4 No. Packages Certified 1,938,562
No. Inspections 3,551
No. Certificates Issued 364 No. Packages Certified 60t330
No. Man Hours 224 No. Inspections 231
~L~RKET INSPECTION
No. Produce Inspections 3,560
No. Egg Inspections 681
No. Egg Lots in Violation 136
Poultry Meat Inspected (Pkgs) 21~280
Honey Inspected (Pkgs) 39~771
Eggs Inspected (Dozs) 187~216
Eggs Rejected (Dozs) 8~923
SUMMARY - TOTAL STANDARDIZATION
Man Hours 5,393
Packages Inspected 3,260~807
Packages Certified I~998,892
Certification Fees Collected $ 8~376.60
No. Inspections 8~774
Packages Rejected 15~703
No. Violations Issued 240
_

SEED INSPECTION
All lots of agricultural and vegetable seed are required to be labeled to establishidentity, purity and germination for protectlonto the buyer.
Inspection and official samples are made to determine if the seed and labels comply.
SUMMARY OF SEED INSPECTION 1967 1966
Number of Seed Houses in County-’~ ----~"
Seed Inspection, Man Hours148 157
Stop Sales Issued42 38
Official Samples Drawn13 16
***** NURSERY INSPECTION
A regular systematic inspection program is followed in checking all plant nurseriesin the county periodically to maintain standards of pest cleanliness, proper labelingand quality. This also facilitates shippingnurseries to move most types of nursery stockby intracounty certificate without the inconvenience Of destination inspection.
Two nurseries werJ found with "B" rated pests requiring eradication or treatment
of nursery stock.The modern plant nursery business today is a highly specialized industry supplying
the fruit trees, vines and plants for commercial farming or the ornamental stock tobeautify the landscape of commercial areas and parks or the gardens of the home owner.
SUMMARY OF NURSERY INSPECTION
Licensed Plant Nurseries 109
Fee Exempt Nurseries 7
Number Cut Flower Nurseries 31
Christmas Tree Growers 30
Number of Nursery Inspections 190Inspection Man Hours 1,032
N0n-Compliance Violations 18
Number of Plants Held 2,531
~.~ :~- APIARY ~
Inspsction of colonies for disease detection, advisory assistance to beekeepers andorchardists who are in need of p011±nation for the ir fruit crops, issuance of certifi-cates for movement of bees and queens are among the services rendered by this department.
The migratory movement of honey bees into this County continues to be heavy, dueto favorable overwiuteriug conditions here and all increasing demand for honey bees to
pollinate our fruit crops.The wet cold spring this year caused many colonies to run very low on supplies,
with the producer of package bees being hit veryhard.Due to excellent cooperation with the beekeeper - farmer and pest control opera-
tors, we hadno reported losses due to the improper application of pesticides this year.
SUMMARY OF APIARY INSPECTION
Number of AplariesTotal Number of ColoniesApiaries InspectedColonies InspectedColonies Infected AFBApiaries Infected AFB
1967 1966 1965
4,849 4,831 3,64666 40 42
2,316 988 760
5 109 16
2 5 5
-9-
¯ I If|

PLANT QUARANTINE
This function is intended to prevent the introduction or spread of serious in-sect pests, plant diseases and noxious weeds or seeds not commonly found in California.
It is the legal means of restricting the movement of plants, plant products orappliances which may serve as hosts or carriers of certain pests and prescribes thetreatment or conditions of admission.
Four Notice of Warning violations were issued far shipments not reported forinspection.
Restricted material in violation was intercepted twenty-six (26) t~mes. Thenumber of incoming shipments inspected increased 12% and the volume of plant materialwas up 15%.
Export Certificates issued - 476 (477,242 plants - 1,550 pkgs. of produce)Club Root Disease Certificates of Treatment issued 228Misc. Origin Certificates issued - 44
SUMMARY OF QUARANTINE -1967 Interstate Intrastate Total
Shipments InspectedShipments RejectedPlants InspectedPlants RejectedBulk Inspected (Tons)
3,751 612 4,36326 0 26
9,970,022 3,728,798 13,698,8202,58o o 2,58o7,239 530 7,769
***** INSECT AND DISEASE DETECTION SURVEYS ***~*
Increasing emphasis is directed toward planned survey programs coordinated withState and Federal agencies to find new pest infestations and implement eradicationefforts when found before serious economic losses occur.
New techniques and methods are continually needed and tried to improve the effect-iveness of this program.
PESTDETECTION SURVEYS - 1967PROPERTIES
PEST HOST PROPERTIES UNITS INSPECTIONS INFESTED
Fruit FliesJapanese BeetleCitrus White FlyTulip Tree ScaleResidential GridKhapra BeetleCereal Leaf BeetlePlum CurculioSpruce Needle MinerEuropean Pine Shoot MothWhite Fringed BeetleNew Pests (transp.terminals)Mexican Bean BeetleGypsy MothCrucifer InsectsGrape Leaf Skeletonizer
Fruit 55 55 traps 471 0Lawns-Orn. 13 13 traps 99 0Ornamentals I16 553 hosts ll6 0Tulip Tree 1 1 host 1 0Various 87 1,711 hosts 87 0Grain 13 96 traps 26 . 0Native weeds 15 582 acres 23 0Fruit 13 265 hosts 13 0Spruce 26 96 hosts 26 0Pine 7 63 hosts 7 0Various 8 1,267 hosts 8 0Weedy areas 3 12 acres 3 0Beans 7 72 acres 5 0Vehicles 30 30 hosts 30 0Crucifers 3 35 acres 3 0Grapes 3 I00 hosts 3 0
Club RootBushberryAngular Leaf SpotGeranium Leaf Rust
Crucifers 4 50 acres 4 0Olallie Berry ii 143 acres II 0Strawberry 5 48 acres 5 0Geranium 8 75 hosts 8 3
428 9~9 3- I0 -

PEST CONTROL .AND ABATEMENT
Prolonged spring rains contributed to severe pest control problems in various crops.Fifteen investigations involving crop damage or improper use of pesticides were
processed. One incident involved cows in a plastic greenhouse enjoying a diet of carna-tions~ Two instances involved youngsters accidentlydrinking toxic phosphate chemicals,fortunately both recovered after hospital treatment.SL~S~ARY - 1967
PEST CONTROL - 2,391 hours - 2,097 Inspections - PEST CONTROL FIELD TESTS - 30LABORATORY IDENTIFICATION SAMPLES - PlaNt Diseases 104 - Insects 173PEST ABAT~ENTS - lO properties - Total 177 acres - INJURIOUS PEWITS ISSUED - 320APPLE SCAB - Widespread and severest damageon record here. Nearly caused completedefoliation and fruit loss in many orchardc. Weather conditions favorable to scaband continuous spraying failed to control infections where early critical timing wasmissed. Every fungicide available was tried in an effort to stop the disease. Trialtests with Dupont 1991 looked promising under these conditions.RUSSETTING - Cause unknown, but prevalent on Newtown apples in all orchards, severelyaffecting fruit finish.SCLEROTINIA SCLEROTIORUM - Caused losses in lettuce fields early season as expectedwith prevailing conditions.RED STELE - Affected localized areas in strawberry fields severely where drainageproblems existed.POWDERY MILDEW - Troublosome to apples and bushberries.EUROPEAN RED MITE - Were not a serious problem this year.ORANGE TORTRIX - Affected some apple orchards in late season and ca,° ~a f kit damage.WOOLLY APHIS - Became fairly prevalent in some apple orchards by late season.OAK MOTH - A very minor problem this year contrasted withepidemic populations of 1966.Test of microbial insecticide looked favorable for control.
~** PEST CONTROL OPERATORS ~
Forty-seven (47) operators were registered in the County of which six were aircraft.An increase in acreage treated is noted for this year.
Seven (7) Notice of Warning violations were issued, principably involving drift materials. One aircraft operator was cited to office hearing on four violation counts.Continuance of operation was placed on a probationary basis.
Enforcement of pest control operator regulations is the responsibility of theAgricultural Commissioner.
SUMMARYOF WORK BY PEST CONTROL OPERATORSAcres Treated
Application By Type of Crop 1967 1966
Aircraft Orchards 4,486 3,390Ground Rig " 1,926 2,662
Aircraft Berries 4,028 4,346Ground Rig " 349 333
Aircraft Vegetables 14,804 16,781Ground Rig " 19,688 15,099
Aircraft Ornam. & Misc. 124 596Ground Rig " " 334 1,838
5,739 45,oh5- ll -

VERTEBRATE PEST CONTROL
Our repertory of pest control material for sale remained the same this year. We didconsider adding wax blocks of Pival bait and a bait for moles but because of technical
difficulties these were not made available for sale.
GROUND SQUIRRELS (Citellus beecheyi) This year because of a very long wet spring therewere two distinct peaks inthe breeding season. The average litter was 10.4. This isconsiderably higher than our five year average of 9.0. We treated 104 separate proper-ties for squirrel control using fumigants, baits and traps, as the situation called for.The use of fumigants was very successful this year because the ground moisture was re-tained for a long period. Bait acceptance seemed to be a little poorer. Use of anti-coagulants is increasing and trapping is becoming a prominent part of the program.
Materials used in 1967 :
1080 Grain 87 3/4 lbs Anticoagulant Grain 48 lbs
Zinc Phosphide 32 lbs Carbon Bisulphide Fumigant 923 lbs
MEADOW MICE (Microtus sp) Serious outbreaks in artichoke and brussels sprouts arer-e l~c~ in our zinc phosphide treated crimped oat sales. In 1967 we sold 8,533 lbs.This amount is more than double the amount sold in 1964 which was the highest yearwe had. Part of the cause of this problem are changes in the cultural practice ofthe artichoke growers.
POCKET GOPHERS (Thomomys sp) The peak month for use of grain bait was June which’wasgreater than the four year average. This also is a reflection of the abnormal wetspring. Total sales of strychnine treated grain bait was 3,855 lbs. A slight in-crease from 1966 saies. Strychnine far treatment of fresh bait was well below thefive year average. Small packages of treated grain are gradually taking the placeof fresh baits.
RATS (Rattus & Neotoma sp) and HOUSE MICE ~us) Sales ~f mlzhicoagnlant treated baitsi-~967 was well below the seve~h year average. The particular reason for this lac’.zslogical explanation. Making of wax blocks of this material is being suggeqted whencontrol of wood rats is desired. We sold 1,575 lhs of pival treated graiuo
BIRD CONTROL - Institution of more effective supervision in the use of bird controlmaterials that was started several years ago is still noticed because of the lesseramounts of material issued but better control obtained. Fewer people are interestedin the program when they find they cannot expose baits at random. Two new materialswere tested for linnet control this year. Neither proved to be better than thestandard strychnine formula. One grower used electronic sound equipment in straw-berries and was very satisfied with the results.
A study was made on feral pigeon control. Bandtailed pigeons were not the problemthis year that they were in the past. Low value of the bushberry crop also madegrowers less interested in the damage. Starlings have established resident nestingpopulations in the County but no damage from them has been reported by growers.
- 12-

WEED CONTROL
This has been a prolific year in the spread of noxious weeds. Vehicular traffic and trans-portion of feed stuffs~ manure etc. from San Joaquin valley areas has caused an excessivenumber of new infestations of Johnson Grass and Puncture Vine to show up along our roads and
highways.The A 3.P. program has been very helpful in our continued effort to bring Johnson Grass
under cot%trol in our agricultural areas. Now it is our hope to broaden this program to in-
clude more noxious weeds.Service Agreements with the California State Department of Highways has financially
assisted in the eradication of new infestations along State routes before they become
established and move into agricultural areas.In our continued determinations in the use of herbicides, this office in cooperation
with various formulators of these chemicals established fifty-eight (58) field test plotsto check results locally this year. Two Hundred and Three (203) permits were issued forthe use of Injurious Herbicides this year.
SUMMARY OF NOXIOUS WEED INFESTATIONS
Infested Area (Acres) Crops Roadsides TOTAL No. Infestations Type of
Pasture Other Old New Total Pro$ram
Klamath Weed O.lO 5,010.00 5,010.10 3 0 3 Eradicate
Italian Thistle 4,200.00 425.00 4,625.00 30 0 30 Control
Hoary Cress 730.25 4.50 734.75 74 0 74 Control
Purple Star Thistle 300.25 - 300.25 2 0 2 Eradicate
Alkali Mallow 45.00 13.00 58.00 12 0 12 Control
Yellow Star Thistle 40.00 63.98 103.98 22 2 24 Eradicate
Johnson Grass 73.82 11.27 85.09 98 22 120 Eradicate
Puncture Vine lO.81 55.88 66.69 68 34 102 Eradicate
Quack Grass 0.~6 3.72 4.28 17 1 18 Eradicate
Russian Knapweed 2.50 - 2.50 1 0 1 Eradicate
Gorse 0.50 - 0.50 1 O 1 Eradicate
Scented Gaura 2.00 - 2.00 1 0 1 Eradicate
Russian Thistle 0.50 - 0.50 6 0 6 Eradicate
White Horsenettle 0.50 - 0.50 1 0 1 Eradicate
5,406.79 5,587.35 lO,994.14 336 59 395
- 13 -


AGRICULTURALCROP REPORT
COUNTY OF SANTA CRUZ
1968
Agricultural CommissionerP. O. Box 590
WATSONVILLE, CALIFORNIA

NOTICE
Agricultural CommissionerSanta Cruz CountyP 0 Box 590Watsonville, California 95076
Please keep my name on the mailing list to receive the Annual Crop Report ofSanta Cruz County. Your r~ame will be removed from the mailing list unless thisnotice is returned within 30 days.
NAME:
FIRM.
ADDRESS: CITY STATE ZIP

AGRICULTURAL COMMISSIONERMAI-r MKLLO. COMMIIIIONER WATSONVILLE. CALIFORNIA
MAIN OFFICEP. O. BOX 590
1430 FREEDOM BLVD.WATSONVILLE, CALIFORNIA
BRANCH OFFICESANTA CRUZ, CALIFORNIA
Director, California Department of AgricultureandSanta Cruz County Board of Supervisors
J. Russ McCallie Ralph C. Sanson Jr.D. Dan Forbus George L. Cress
Henry Mello, Chairman
Gentlemen:
This Agricultural Crop Report is submitted in accordance withSection 2279 of the California Agricultural Code.
The gross value of agricultural products produced in Santa CruzCounty for 1968 totaled $ 54,762,000 which is an increase of $ 16,746,000over the year 1967.
The F. O. B. value represents the ~ross value of the product whensold and is not net income to the producer.
In addition to the comparative 1968 and 1967 acreage, production andvalue of all products, are data information indicating trend of value and trendof plantings for the past 5 years, a crop s~nmary analysis for 1968, and tempera-ture, rainfall information, intended to enhance the interest and understandingof this report in its total perspective.
I wish to express my sincere appreciation for the cooperation andassistance of all individuals and organizations who cooperated with thisdepartment in providing the information that helped make this report possible.
MN:so
Respectfully submitted,
MATT MELLOAgricultural Commissioner

Elevation Range - 0 to 3,214 feet
1968 Temperature Range
Santa CruzWatsonville
78.30° F Average Maximum 69.75° F
105° F Aug. 29th High Aug. 29th 99° F
41.26 ° F Average Minimum 44.77° F
26° F Dec. 21st Low Dec. 21st 24° F
Watsonville
19.84 inches33.81 inches19.83 inches
RAINFALL
1968 Season (7-1-67 to 6-30-68)1967 Season
Normal Average (Last 20 years)
POPULATION & APPRAISAL
Santa Cruz20.91 inches40.57 inches28=91 inches
Santa Cruz County Population ( State Department of Finance est.)113,800
Total assessed valuation of property (1968-69)$ 306,342,210o
Total area of County (439 sq. miles)280,960 acres
Big Basin ParkCapitola BeachHenry Cowell ParkManresa BeachTwin Lakes
STATE PARKS AREA - 21~195 acres,
11,553 acres Natural Bridges Beach 47 acres
6 acres New Brighton Beach 63 acres
1,737 acres Seacliff Beach 84 acres
21 acres Sunset Beach 292 acres
ll2 acres Santa Cruz Mission 1 acre
Nesine Marks Forest - 7,279 acres
i i ¯ !

SANTACRUZ COUNTY CROP SD]~MARY - 1968
Growing conditions generally were very favorable for agriculture and contri-buted to the highest gross return for agricultural production on record in this county.This was in direct contrast with the conditions that prevailed in 1967 when almostevery segment of agriculture sustained severe losses.
APPLES - The major crop in the county had good fruit set with exceptional quality.Short crops in other competing States helped bo firm market demand that remainedsteady all season at favorable prices. A strong demand for prepack of small sizesin poly bags provided a good outlet.
Low price offerings for processing apples in early season were replaced byhigher levels as strong fresh market demand competition limited supplies availableto meet processing needs.
This was the first operating season of the new marketing order for sales pro-motion of California apples. With this organization providing an industry program,and the adoption of improved standards of quality, color and sizing with other favor-able factors, combined to make this an outstanding successful season.
APRICOTS - Heavy bloom followed by rain and high temperature affected fruit set and re-sulted in reduced tonnage, buthigher market returns for fresh and dried apricotsreflected a gross increase of $ 47,000 above last year.
PEARS - Tonnage produced showed a fairly substantial increase altho a heavy Junedrop was noted throughout the district. Prices were lower so the gross overallvalue indicates a slight increase. Most of the tonnage used for processing.
PLUMS - Reduced acreage and lower production but much higher returns increased totalgross value.
BUSHBERRIES - Experienced some frost damage in the spring but production turned outbetter than expected. Bulk of the tonnage goes for processing and is being machineharvested on the blacks. Returns were more favorable than 1967 season which wasvery poor and resulted in acreage reduction.
STRAWBERRIES - A good production year with improved returns although some growersfelt prices should have been higher in relation to costs. Some reduction in acre-age is noted but gross returns were up $ 1,62~,000 above the previous year.
LETTUCE - As s whole the season considered fairly good on the average although weakmarket prices prevailed at peak periods. High yields due to favorable growing condi-tions and increased acreage with a lower average season price reflected a moderategross increase of $218,000 over the 1967 crop year.
NURSERY & CUT FLOWER CROPS - Have been separated from Field Crops in this reportbecause of the increasing importance of this industry and to provide greaterrecognition and information on its economic significance. A substantial increasein gross value is indicated for the 1968 year.
ANIMAL INDUSTRY - A substantial downward revision in milk production and totalvalue figures supplied by California Crop Reporting Service is indicated andmaterially affected our industry total. Livestock generally showed higher levelsbut egg production and values declined, chicken fryer production substantially re-duced and a slight up trend in turkeys.

SANTA CRUZ COUNTY TREND OF VALUE IN PRODUCTION- I -
CROPS
Fruit & Nut
Berries
Vegetables
Field *
Nursery *
1968 1967 1966
21,873,000 $ 9,516,500 $ 12,404,000
6,793,000 4,930,700 6,542,000
15,458,000 13,513,200 15,763,000
1,021,000 789,700 791,000
4,853,000 4,315,000 4,051,000
1 9 6 5 1 9 6 4
$ 13,299,000 $ 9,804,000
6,197,000 5,693,000
12,497,000 11,925,000
1,031,000 897,000
4,394~000 3,750,000
TOTAL PLANTINDUSTRY
Harvested Acres
ANIMAL INDUSTRY
$ 49,998,000 $ 33,065,100 $ 39,551,000 $ 37,418,000 $ 32,069,000
(82,118) (80,142) (80,742) (81,014) (80,420)
$ 4,764,000 $ 4,950,900 $ 5,478,000 $ 5,390,000 $ 6,269,000
TOTAL ALLPRODUCTION
$ 54,762,000 $ 38,016,000 $ 45,029,000 $ 42,808,000 $ 38,338,000
(Not included in above)GOVERNMENT PAYMENT PROGRAMS
(By Agricultural Stabilization Conservation Service, USDA)
Ao C.P. $ 9,000 $ 27,000 $ 17,O00 $ 14,000 $ 21,000Sugar Beets 14,000 12,000 I0,000 17..500 38,500
Wool 1,000 1,000 4,000 3,000 2,000
Feed Grain 0 0 0 500 500
Soil Bank 0 0 O 0 0
$ 24,000 $ 40,000 $ 31,0OO $ 35,000 $ 62,000
* Revised Classification** Revised Value

- 2
Crop
FRUIT & NUT CROPS - ACREAGE~ PRODUCTION & VALUE 1968
Bearing PRODUCTION F.O.B.
Year Acreage Per Acre Total Unit Per Unit
VALUETotal
Apples
Fresh
Dryer
Processing
Juice
Apricots
Fresh
Dry*
Processing
1968 8,024 16.461967 7,586 12.97
19681967
19681967
19681967
19681967
1968 127 4.881967 129 5.08
19681967
19681967
19681967
Cherries 1968 16 .381967 (Misc Fruit)
Grapes 1968 99 1.161967 102 1.08
Pears 1968 392 3.781967 395 2.34
Persimmons 1968 19 5.261967 26 2.32
Plums 1968 369 1.761967 389 2.98
Prunes-Dry~ 1968 250 1.02
1967 254 .04
Walnuts 1968 17 .241967 21 .14
Misc. 1968 151967 45
(132,100) Tons(98,400)
61,300 Tons $ 260.0025,700 175.00
12,600 Tons 73.7010,900 65.00
42,000 Tons 83.0040,890 74.10
16,200 Tons 49.8021,000 40.80
(620) Tons(655)
280 Tons 400.003O0 270.00
60 Tons* 1,400.0060 i,I00.00
I0 Tons Ii0.0025 12o.oo
6 Tons 700.00
115 Tons 240.00II0 230.00
1,480 Tons 119.00925 173.00
i00 Tons 254.0060 240.00
650 Tons 324.001,160 59.00
255 Tons* 250.00lO 240.00
4 Tons 600.003 570.00
( 21,160,000)( 9,086,000)
15,938,0004,498,000
929,000708,000
3,486,0003,023,000
807,000857j000
(197,000)(15o, ooo)
112,00081,000
84,00066,000
1,0003,000
4,000
28,00025,300
176,000160,000
25,00014,400
211,00068,400
64,0002,400
2,0001,700
Total 1968 9,3281967 8,947
$ 21,873,000$ 9,516,5oo

Crop Year
BERRY CROPS
Harvested PRODUCTIONAcreage Per Acre Total Unit
-3-
F. O. B o VALUEPer Unit Total
Blackberries
Boysenberries
Logan & Misc.
Raspberries
Strawberries
Fresh
Processing
Total
19681967
420 4.88 2,050 Tons440 4.89 2,150
1968 45 2.27 102 Tons1967 55 2.64 145
1968 IO 2.00 20 Tons1967 15 1.67 25
19681967
19681967
19681967
19681967
19681967
40 1,175.OO 47,000 Trays55 618.00 34,000
700 21.O9 (14,760) Tons750 16.80 (12,600)
1,2151,315
1,997,000 Trays1,712,000
9#
12#
238.00 $ 488,000137.OO 295,000
305.00 31,000184.00 26,700
610.00 12,000480°00 12,000
3.64 171,OOO3.85 131,O00
(6,091,000)(4,466,000)
2.62 5,232,0002.25 3,852,000
2,780 Tons 309.00 859,0002,360 614,000
$ 6,793,000$ 4,930,000
Beans, Dry
Grain
Hay
Corn Silage
Pasture, Irrig.
Pasture, Other
Sugar Beets
Veg & Flwr Seed
Total
19681967
19681967
19681967
19681967
19681967
19681967
19681967
19681967
19681967
FIELD CROPS
470 21.91 10,300 Cwt215 19.8 4,260
270 I. 04 280 Tons165 i. 06 175
5,160 1.53 7,9105,150 1.6 8,250
Tons
290 17.90 5,190 Tons90 12. 1,080
4,0203,290
49,10049,700
180 36°22 6,520215 23° 4,940
35 35,ooo35 32,000
59,52558,860
Acres
Acres
Tons
Lbs
iio00 113,00014.70 62,600
80.00 22,00057°30 I0,000
32°35 256,00033.20 274,000
17.00 88,00019.90 21,500
35.00 141,00035.00 115,000
5.00 246,0002°77 138,000
14.20 93,00014.00 69,200
62,00099,400
$ 1,021,000789,700

_
Year
NURSERY CROPS
Acres Production Sold F. O. B. Value
Ornamentals & Other
Bulbs
* Cut Flowers
Total
19681967
19681967
19681967
19681967
475 6,123,000 plants376 5,981,000
59 2,785,000 bulbs70 3,292,00[
$ 1,697,0001,683,000
496,000538,000
191 47,907,000 blooms 2,660,000
194 43,597,000 2,094,000
725640
$ 4,853,0004,315,000
FIELD GROWN
Item
* CUT FLOWERS - 1968
Production ProductionArea Sold
F. O. B. ValuePer Unit (av) Total
Daisies 32.00 acresIris 35.00 acresMisc. (Including Daffodils, 75.25 acres
Glads,Fern,Agapanthus,Heather, Strawflowers}Calendula,Corn Flowe~Candytuft,Ranuculus,Mums, Begonias)
142.25 acres
INDOOR - GLASS or PLASTIC
CarnationsChrysanthemums (stds)OrchidsRosesMisc. (including Fern,Min. Carnations ,Freesia,Daisy, Iris ,Snapdragons~Stephanotis)
1,183,540 sq.ft.216,700 sq.ft.163,820 sq.ft.274,000 sq°ft.297,380 sq.ft.
2,135,440 sq.ft.(49.02 acres)
3,106,200 blooms2,842,800 blooms
12,728,920 blooms
.06 $ 186,201
.054 153,354(various) 265,274
18,677,920 blooms $ 604,829
20,720,736 blooms1,875,595 blooms
179,550 blooms3,312,000 blooms3,141,500 blooms
.062 $ 1,292,329
.13 243,498¯ 559 100,366.089 293,850.04 125,475
29,229,381 blooms $ 2,o55,518
Bulb acres not included
, --I

Crop
°
VEGETABLECROPS - 1968- 5 -
Harvested PRODUCTION F.O.B. VALUEYear Acreage Per Acre Total Unit Per Unit To{al
Artichokes
Beans, Green
Broccoli
BrusselsSprouts
Cabbage
Cauliflower
Celery
Corn-Sweet
Cucumbers
Lettuce
Mushrooms
Squash
Tomatoes
Misc. Veg.
1968 430 59.53 25,600 Cwt $ 7.94 $ 203,0001967 430 53.50 23,000 8.00 184,000
1968 460 6.09 2,800 Tons 197.O0 552,0001967 480 6.40 3,070 170.00 522,000
1968 Mise.Veg.1967 165 2.61 430 Tons 128.00 55,000
1968 3,270 6.02 19,7OO Tons 242.20 4,771,OO01967 3,460 6.16 21,300 198.O0 4,217,O00
1968 375 258.40 96,900 Cwt 4.10 397,0001967 310 241.OO 74,700 3.24 242,000
1968 800 67.75 54,200 Cwt 9.78 530~0001967 515 68.20 35,100 8.20 288,000
1968 325 548.00 178,o00 Cwt 5.3? 956,o0o1967 245 498.00 122,0o0 5.35 653,000
1968 25 960.00 24,000 Doz .75 18,0OO1967 25 904.00 22,600 .68 15,400
1968 165 227.00 37,500 Owt 4.53 170,0001967 105 145.00 15,200 4.33 65,800
1968 4,670 553.00 2,583,000 Ctns 1.91 4,934,0001967 4,060 484.00 1,965,OO0 2.40 4,716,OOO
1968 3,630,000 Lbs .526 1,909,OOO1967 3,668,000 .516 1,893,OOO
1968 305 141.OO 43,000 Cwt 8.60 370,0001967 270 142.OO 38,300 7.47 286,000
1968 115 345.20 39,700 Cwt 5.82 231,O001967 85 117.00 9,940 10.20 IO1,O00
1968 385 417,OOO1967 230 275,000
TOTAL 1968 11,325 $ 15,458,OO01967 10,380 13,513,200
PLANTINDUSTRY
1968 82,118 $ 49,998,0001967 80,142 33,065~I00

_
Year
AND4AL INDUSTRY
PRODUCTIONTotal Unit
F. O. B. VALUEPer Unit Total
APIARY
Honey 19681967
Wax 19681967
Pollination 19681967
MILK - Market 19681967
Manufacturing 19681967
LIVESTOCKCattle & Calves 1968
1967
Breeders 19681967
Swine 19681967
Sheep & Lambs 19681967
Wool 19681967
EGGS - Market 19681967
Hatching 19681967
CHICKENS 19681967
POULTRY, Other 19681967
TURKEYS 19681967
RABBITS 19681967
4,890 Colonies 112,000 Lbs4,850 112,000
¯ 14I $ 16,000.13 14,600
1,300 Lbs .60 1,0001,300 .63 800
51,100* 83,200
Cwt
Cwt38,900* 35,100
18,00014,800
4.85 248,0004.57 380,000
4.08 159,0003.78 133,000
9,740 Head 60,900 Cwt8,380 55,200
425 Head36O
500 Head 875 Cwt460 930
2,630 Head 2,780 Cwt2,340 2,470
18,500 Lbs17,000
2,364,000 Doz2,598,000
189,000 Doz161,000
322,000 Fryers 1,286,000 Lbs1,000,000 3,998,000
76,800 Birds 1,435,000 Lbs74,700 I~500,000
51,500 232,000 Lbs46,700 210,000
21.80 1,328,.00020.80 1,148,000
161,000119,000
21.40 19,00018.80 17,500
20.60 57,00019.00 46,900
¯ 39 7,000¯ 43 7,300
.328 775,000
.35 909,000
309,000384,ooo
.181 233,000
.169 676,000
1,069,000768,000
.205 294,000
.18 270,000
¯ 30 70,000¯ 295 62,000
TOTAL 19681967
* Revised Crop Reporting Service figures
$ 4,764,000. $ 4,95O,9OO

TREND OF PER~_~NENT CROPS .IN SANTA CRUZ COUNTY - lO years - 7 -
MAJORVARIETIES
APPLESTotal
Acreage!968
Non-bearingAcreage 1968
Newtown Pippin 4,142 597 3,545Delicious - Red 3,798 623 3,175Delicious - Std 333 2 331Bellefleur 195 0 195Winter Banana 142 19 123W. W. Pearmain 87 i 86Gravenstein 65 3 62Golden Delicious 114 22 92Mclntosh 331 235 96Other Varieties 399 80 319
TOTAL 9,606 1,582 8,024
APRICOTSAll Varieties 133 6 127
CHERRIESBing i0 0 I0Other Varieties 6 0 6
TOTAL 16 0 16
Bearing Acres
1963
3,7622,363
3962841511068972II
2547,488
154
1927
46
,4
1959
4,5722,127
5294712,321349842
6292
8,473
255
457o
115
GRAPESWine Varieties 94 8 86 87 iiiTable Varieties 13 O 13 20 31
TOTAL 107 8 99 107 142
PEARS
Bartlett 327 2 325 399 551Hardy 69 6 63 104 167Other Varieties 4 0 4 ll 65
TOTAL 400 8 392 514 783
PLUMSSanta Rosa 305 i 304 391 435Other Varieties 65 0 65 50 41
TOTAL 370 I 369 441 476
PRUNESFrench 210 0 210 292 415Other Varieties 42 2 40 72 98
TOTAL 252 2 250 364 513
OTHER FRUITS-NUTS 87 36 51 134 142
Total Bearing Acres 9,328 9,248 10,899Total Non-Bearing Acres 1,643 2,670 2,269
GRAND TOTAL ALL IO, 971 i~,918 13,168

-8-
Bushberries
TREND OF OTHER CROPS
IN SANTA CRUZ COUNTY
Total Acres Grown ( Includes New-Plantings
1968 1967 1966 1965 ].964
530 580 735 745 695
Blackberry 420Boysenberry 50Logan & Misc I0Raspberry 50
Strawberries 700
Asparagus 50
Artichokes 430
Beans, green 460
Broccoli 180
Brussels Sprouts 3,270
Cabbage 375
Cauliflower 800
Celery 325
Cucumbers 165
Lettuce, spring 750
Lettuce, summer 2,530
Lettuce, fall 1,390
Potatoes 60
Squash 305
Tomatoes "115
Beans, dry 470
Grain 270
Hay 5,160
Sugar beets 180
Nursery 725
h~O 540 52060 90 lO015 55 6065 50 65
750 720 81o
65 120 175
430 430 430
480 450 815
165 155 15
3,460 3,180 2,930
310 300 270
515 8oo 745
245 255 25o
Io5 5o 45
340 695 480
2,390 2,345 2,170
1,330 1,350. 815
80 60 85
270 310 445
85 1o5 12o
215 635 500
165 170 745
5,150~ 4,775 "5,380
215 165 335
64o 64o 745
4?51208O7O
775
175
430
1,365
205
3,015
8O
78O
240
65
215
2,035
875
85
52O
115
320
5OOL
4~,o15
585
695

.r~
0
kfDr-i
.r-t 4.= rJ
~ ~.~’~
~v


f
:.: ~ :.: ~ :.: ~ :-: ~ :.: ~ :.: :----~ :.: ~ :.: ~ :.: ~ :.: ~ :.:--= :.: ~__~_~_ :.: ~ :.: =:~ :.: ~.~ :.: ~~" :.: ~-- :.: --- :.: ~:.: ~ :.: --- :.: ~ :.: ~-~
AGRICULTURALCROP REPORT
COUNTY OF SANTA CRUZ
1969
JNIVERSITY OF CALIFORNII~"DAVIS
/~P~ 1 ~ 1970L~ ~ ~! #~, R y
Agricultural CommissionerP. O. Box 590
WATSONVILLE, CALIFORNIA
i :-: ~ :’: ~---- :’: ~ :’: ~ :’: -------- :’: ~ :’: =" :’: ~ :’: --~ :’: ~ :’: ------- :’: ~ :’:~ :’: --=-~ :’: ~ :’: "TL= "’: ~--- :’: ~-~-: :’: ~ :’: =-’---~= :’: ~------:’: ~----~-~ :’: ---~---- :’: --~--’-- :’: --~;: :’

AGRICULTURALCOMMISSIONER
COURTHOUSE ANNEX
(408) 724-1149
MATT MELLOAGRICULTURAL COMMISSIONER
COUNTY OF SANTA CRUZ
P, O. BOX 590 WATSONVILLE, CALIFORNIA 95076
Jerry W. Fielder, DirectorCalifornia Department of AgricultureandSanta Cruz County Board of Supervisors
HenryMello ~a]ph C. Sanson Jr.J. Russ MeCallie George L. Cress
D. Dan Forbus, Chairman
Gentlemen:
As provided by Section 2279 of the California AgriculturalCode, this Agricultural Crop Report is submitted for your informationon the acreage, production and value for Santa Cruz County.
The year 1969 for many of our major crop producers was aneconomic dilemma with labor shortages, innreasing costs of productionand substantial declines in market price returns for their products.
The gross value of agricultural produc+,~ produced in SantaCruz County for 1969 totaled $42,73~,000 which is a decrease of$12,31h,000 below the gross r~s-~tbe year ]968.
The F. O. B. value represents lhe gross value of the productwhen sold and is not net income to the producer.
To all the individuals and organizations who cnnperated inprovidir,g information ’5o help make this report possible, we extend oursincere apprecJ ation.
Respectfully submitted,
MATT MELLOAgricultural CommissJor,er
~:bl

Elevation Range - 0 to 3,214 feet
WatsonvJlle
1969 Temperature Range.
Santa Cruz
76.02° F Average Maximum 68.02° F92o F Aug. 2hth High Aug. 5th 89° F43.03° F Average Minimum hh.57° F30° F Jan. 9th Low Jan. 5th 28° F
Watsonville
hi.30 inches
19.84 inches21.14 inches
1969 Season (7-1-68 to 6-30-69)1968 Season
Normal Average (Last 20 years)
Santa Cruz
45.44 inches20.91 inches31.72 inches
POPULATION & APPRAISAL
Santa Cruz County Population (State Dept. of Finance est.)Total Assessed Valuation of Property’ (1969-70)
Total Area of County (439 sq. miles)
Big Basin ParkCapitola BeachHenry Cowell Park
Manresa BeachTwin Lakes
STATE PARKS AREA - 21,195 Acres
1],5q3 acres
6 acres
1,737 acres21 acres
I12 acres
Nesine Marks Forest
Natural Bridges BeachNew Brighton Beach
Seacliff BeachSunset BeachSanta Cruz Mission
7,279 acres
119,300$ 302,038,375
280,960 acres
h? acres63 acres8ll acres
292 acresI acre

SANTACRUZ COUNTY CROP SUMMARY - 1969
Growing conditions generally were favorable and a few crops reflected favorabledemand and returns, while many others were seriously affected by weather, low marketreturns, labor shortages and increased costs. The F.O.B. value represents the gross~,alue of the product when sold and is not net income to the producer.
APPi.ES - With an unprecedented national crop production of apples, the impact on thismajor crop of the county caused local growers and shippers considerable anxiety thisseason. All the major terminal markets were flooded with shipments from other WesternStates which sent prices tumbling at the start of the season, Most growers delayedharvesting as long as possible for better market stability and firmer prices. Withthe benefit of cold storage facilities and nearly all fresh market shipments waxed toprc:’Jde superior quality and appearance, gradual movement of supplies was achieveddespite heavy competition with other areas. Promotional efforts stimulated goodmovement of prepacked consumer poly bags for supermarket chains. Federal institutionalpurchase programs helped move many carloads to relieve the slmplus pressure.
~PRiCOTS - Bloom was about ten days later than normal. The rains let up by late Feb-rusty which reflected an increase in production over the 1968 crop. Returns were lowerthis season, although they started off good. Other areas were also shipping heavily,which flooded the markets°
PEARS - Total tons increased slightly over the 1968 crop. The price per ton was much!owe4 this year,
PL~S - Some reduction in acreage, but total gross value increased due to higher freshmarket value~ Adjusted average price indicates lower value because 39% of the totaltonnage went processing @ $30 per ton due to size and quality of fruit.
BUSHBERRIES - Most of the berries went to processing due to the exceptionally goodprice, Machines were used to harvest the larger acreages of Olallieberries. Produc-tion was also good and reflects an increase over past years’ tonnages and values despitereduced acreage°
STRAWBERP.IES - Production hit its peak early this year with a very heavy production,then dropped very low for an extended period. Prices were fair but labor was a seriousproblem during the peak period and total result was a substantial reduction in tonnagemarketed and gross value,
BRUSSELS SPROUTS - Production per acre declined and freezer price was much lower.Fresh market price slightly above last year, Total acreage was the same as 1968.Growers still have problems due to labor shortage. Generally considered a poor year,total value substantially lower.
LETTUCE - As a whole, the growers did not have a good year. A number of factors wereresponsible, but the chief one was poor price~ Late spring rains resulted in a smallspring crop~ This resulted in an exceptionally heavy summer crop at a period of over-supply on the market.
ANIMAL INDUSTRY - Hog and sheep prices increased, but wool price dropped. Returnsfor cattle were much better. Eggs, poultry and turkeys had improved market pricesand demand.
CUT FLOWERS - Prices nearly the same as 1968o Demand was steady° Total gross valueinc~reased over 1968. Upward trend in rose production and some reduction in carnationswere noted.

% ROPS
Fruit & Nu+~
!~,~rries
7e~etables
Field
}~ursery
SANTA CRUZ COUNTY TREND OF VALUE IN PRODUCTION
$
1969 1968 1967 1966 1965
9,964,000 $ 2!,873,000 $ 9,516,500 $ 12,404,000 $ 13,299,000
6,366,000 6,793,000 4., O~,O~O0 6,542,000 6,197,000
ih,238,ooo 15,458,ooo 13,513,2oo 15,763,ooo 12,497,ooo
925,000 1,021,O00 789,700 791,000 1,031,000
5,285,00o 4,853,oo0 4,315,ooo 4,o51,coo i~,394,ooo
TOTAl, PLA~~T[.’.DT!STRY
A YTMAL INDUSTRY
$ 36,778,000 $ 49,998,000 $ 33,065,1OO $ 39,551,000 $ 37,418,OO0
(82,~14) (821,1~. 8’) (80,142) (80,742) (81,O14)
$ 5,960,000 *$ 5,o54~.ooo $ 5,950,900 $ 5,478,000 $ 5,390,000
TOTAL ALI,PRODUCTION $ 42,738,000 *$ 55,o52,000 $ 38,o16,o0o $ 45,o29,ooo $ 42,808,000
GOVER.}~E~FP PAYMENT PROGRAMS
(~!ot inclvded in above)
(By Agricultural Stabilization Conservation Service, USDA)
A, C.P. $ 13,000 $ 9,000 $ 27,000 $ 17,000 $ 14,000
u<~, Beets 7,000 14,000 12,000 I0,000 17,500
~Z~c] 1,000 1,000 1,000 4,000 3,000
Feed Grain 0 O 0 O 500
S~i] Bank 0 O O O O
$ 21,ooo $ 24,000 $ ho,ooo $ 31,ooo $ 35,ooo
~Reviscd Value
-I-
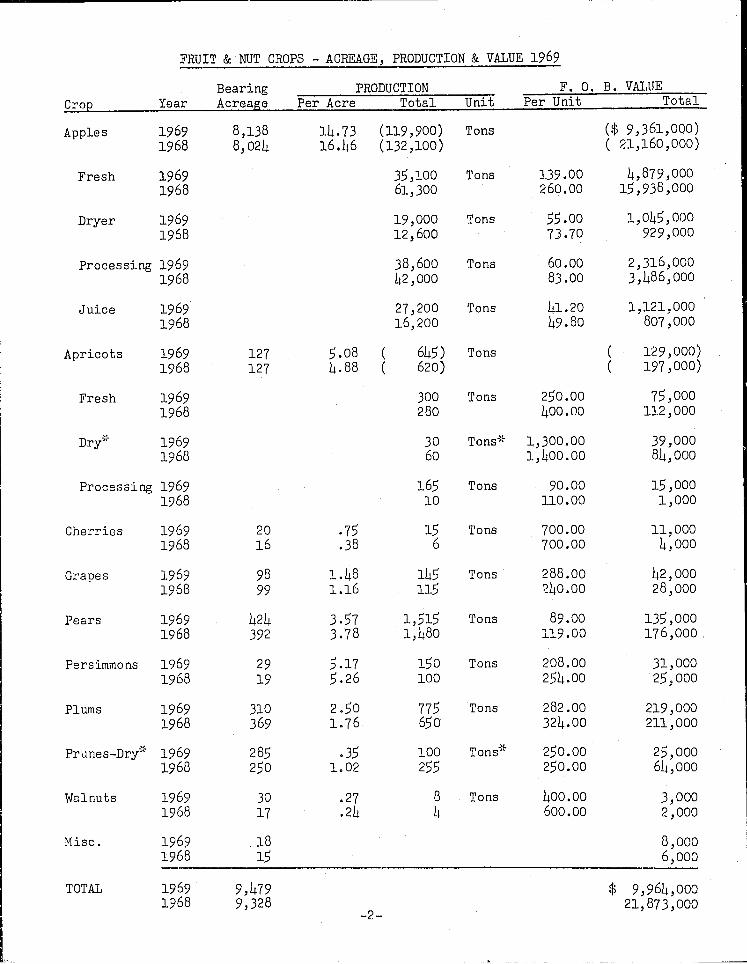
FRUIT & NUT CROPS - ACREAGE, PRODUCTION & VALUE 1969
Crop
Apples
BearingYear Acreage Per Acre
1969 8,138 14.731968 8,024 16.46
Fresh 19691968
Dryer 19691968
PRODUCTION
Processing 19691968
Total UnitF o O. B. VALUE
Per Unit Total
(119,900)(132,1oo)
Tons
35,100 Tons61,300
19,OOO Tons12,600
38,600 Tons42,000
!39.oo260.00
55.0073.70
6o.oo83.oo
($ 9,361,000)(21,160,000)
4,879,00015,938,000
1,045,000929,000
2,316,0003,486,O00
Juice 19691968
Apricots 19691968
127127
27,200 Tons16,200
5.08 ( 645) Tons4.88 ( 620)
41.2049.80
1,121,000807,000
( 129,000)( 197,O00)
Fresh 19691968
300 Tons28O
250.0040o.oo
75,000112,000
Dr~~ 19691968
30 Tons*60
1,300.001,400.O0
39,00084,000
Processing 19691968
165 TonslO
90.00ii0.00
15,0001,000
Cherries 19691968
2O16
.75
.3815 Tons
6700.00700.00
II,OOO4,000
Grapes 1969 98 1.48 1451968 99 1.16 115
Tons 288.00~4o.oo
42,00028,000
Pears 1969 424 3.57 1,5151968 392 3.78 1,480
Tons 89.00119.00
135,000176,000
Persimmons 19691968
2919
5.175.26
150 TonsI00
208°00254.00
31,O0025,000
Plums 1969 310 2.501968 369 1.76
Prunes-Dr~ ~ 19691968
285250
,351.02
775 Tons650
282.00324.00
I00 Tons* 250.00255 250,00
219,000211,000
25,00064,ooo
Walnuts 1969 30 .27 81968 17 .24 4
Tons 400.00600.0o
3,0002,000
Misc. 1969 181968 15
8,0006,000
TOTAL 1969 9,4791968 9,328
-2-
$ 9,964,00021,873,000

BERRY CROPS
Harvested PRODUCTION F.O.B. VALUECrop Year Acreage Per Acre Total Unit Per Unit Total
Blackberries 1969 355 6.70 2,380 Tons $ 390.00 $ 928,0001968 420 4.88 2,050 238.00 488,000
Boysenberries 1969 35 2.86 i00 Tons 420.00 42,0001968 45 2.27 102 305.00 31,000
Logan & Misc. 1969 5 4.00 20 Tons 556.00 Ii,0001968 I0 2.00 20 610.00 12,000
Raspberries 1969 55 960.00 52,800 Trays 7# 4.00 211,0001968 40 1,175.00 47,000 3.64 171,000
Strawberries 1969 725 15.81 (11,460) Tons (5,174,000)1968 700 21.09 (14,760) (6,091,000)
Fresh 1969 1,713,000 Trays 12# 2.80 4,796,0001968 1,997,000 2.62 5,232,000
Processing 1969 1,180 Tons 320.00 378,0001968 2,780 309.00 859,000
Total 1969 1,175 $ 6,366,0001968 1~215 6,793,000
FIELD CROPS
Beans, Dry 1969 465 21.29 9,900 Cwt1968 470 21.91 10,300
Grain 1969 60 .75 45 Tons1968 270 1.04 280
Hay 1969 5,090 1.68 8,530 Tons1968 5,160 1.53 7,910
Corn Silage 1969 85 17.30 1,470 Tons1968 290 17.90 5,19o
Pasture, Irrig. 1969 4,270 Acres1968 L,020
Pasture, Other 1969 49.,100 Acres1968 49,100
lO.36 $ lO3,OOOIi.00 113,000
50.00 2,00080.00 22,000
36.50 311,00032.35 256,000
17.40 26,00017.00 88,OOO
35.oo 149,ooo35.00 141,ooo
5.00 246,0005.00 246,000
Sugar Beets 1969 I00 31.50 3,150 Tons 13.90 44,0001968 180 36.22 6,520 14.20 93,000
Veg & Flwr Seed 1969 15 24,000 Lbs1968 75 35,000
44,00062,000
Total 1969 59,1851968 59,525
$ 925,0001,021~000
-3-

NURSERY CROPS
Year Acres Production Sold F. O. B. Value
Ornamentals & Other
Bulbs
~ut Flowers
Total
1969 575 6,857,000 plants $ 2,121,0001968 475 6,123,000 1,697,000
1969 47 2,210,000 bulbs 414,0001968 59 2,785,000 496,000
1969 213 48,123,000 blooms 2,750,0001968 191 47,907,000 2,660,000
1969 835 $ 5,285,0001968 725 4,853,000
FIELD GROWN
Item
*CUT FLOWERS - 1969
Production F.O.B. ValueArea Sold Per Unit (av) Total
DaisiesIris~isc.
(Including Begonias, Scilla,Daffodils, Ranunculus, Fern,Agapanthus, Heather, Asters,Calendula, Candytuft, Holly~Strawflowers, Corn Flowers,Glads, Soars, Mums, Stock)
27.75 acres 2,628,600 blooms .0458 $ 120,39042.50 acres 3,124,440 blooms .0673 210,41988.25 acres 7,936,185 blooms (Various) 172,471
158.50 acres 13,689,225 blooms $ 503,280
INDOOR - GLASS or PLASTIC
CarnationsOrchidsRoses~Misc.
(Including Snapdragons, Fern,Chrysanthemums Std. and Min.,Stephanotis, Freesia, Daisy,Iris)
1,067,990 sq.ft. 19,676,600 blooms .0606206,320 sq.ft. 272,395 blooms .530733~,000 sq.ft. 5,908,500 blooms .0780729,030 sq.ft. 8,575,966 blooms (Various)
$ 1,191,986144,562460,845249,339
Bulb acres not included
~isc. - Three or less growers
2,337,340 sq.ft. 34,433,461 blooms(53.66 acres)
-4-
$ 2,246,732

Crop
VEGETABLE CROPS - 1969
Harvested Production F.O.B. VALUE
Year Acreage Per Acre Total Unit Per Unit Total
Artichokes
Beans, Green
Br occ oli
Brusse].sS pr out s
Cabbage
Cauliflower
Celery
Corn, Sweet
Cucumbers
Lettuce
Mushrooms
Squash
Tomatoes
Misc. Veg.
TOTAL
1969 420 59.29 24,900 Cwt $ 8.65 $ 215,0001968 430 59.53 25,600 7.94 203,000
1969 l, hO 4.89 2,150 Tons 247.00 531,0001968 460 6.09 2,800 197.00 552,000
1969 375 3.28 1,230 Tons 191.00 235,0001968 Misc. Veg.
1969 3,270 5.63 18,400 Tons 216.40 3,982,0001968 3,270 6.02 19,700 242.20 4,771,000
1969 375 285.00 107,000 Cwt 3.24 347,0001968 375 258.40 96,900 4.10 397,000
1959 620 85.97 53,300 Cwt 9.27 494,0001968 800 67.75 54,200 9.78 530,000
].969 310 377.00 117,000 Cwt 6.21 727j0001968 325 548.00 178,000 5.37 956,000
].969 40 798.00 31,900 Doz .70 22,0001968 25 960.00 24,000 .75 18,000
1969 160 265.00 42,400 Cwt 4.63 196,0001.968 165 227.00 37,500 4.53 170,000
1969 4,640 520.00 2,455,000 Ctns 1.69 4,149,0001968 4,670 553.00 2,583,000 1.91 4,934,000
1969 3,726,000 Lbs .525 1,956,0003.968 3,630,000 .526 1,909,000
].969 450 154.00 69,300 Cwt 8.15 565,0001968 305 141.00 43,000 8.60 370,000
1969 II0 252.73 27,800 Cwt 14.88 414,00o1968 ll5 345.20 39,700 5.82 231,000
1969 230 405,0001968 385 417,000
1969 11,440 $ 14,238,0001968 11,325 15,458,000
PLANTIN~]STRY
1969 82,114 $ 36,778,0001968 82,118 49,998,000
-5-

Year
AN]Z~AL INDUSTRY
PRODUCTION
Total Unit
F. O. B. VALUE
Per Unit Total
APIARYHoney
Wax
19691968
19691968
Pollination 19691968
MILKMarket
Manu/’acturing
19691968
19691968
LIVESTOCKCattle & Calves
4,280 Colonies 139,000 Lbs4,890 112,000
1,500 Lbs1,300
Breeders
Swine
Sheep & Lambs
Wool 19691968
EGGSMarket
113,000 Cwt*’112,000
35,200* 37,700
Cwt
1969 7,920 Head 54,100 Cwt1968 9,740 60,900
1969 340 Head1968 425
1969 570 Head 903 Cwt1968 500 875
1969 2,320 Head 2,430 Cwt1968 2~630 2,780
14,800 Lbs18,500
1969,1968
Hatching 19691968
CHICKENS 19691968
POULTRY, Other 19691968
TURKEYS 19691968
RABBITS 19691968
TOTAL 19691968
~evised Crop Reporting
¯ 14 $ 19,000¯ 14 16,000
.58 1,000
.60 1,000
26,00018,000
5.13 580,0004.86 544,ooo
2,240,0002,364,000
205,000189,000
Doz
Doz
434,000 Fryers 1,736,000 Lbs322,000 1,286,000
4.14 146,0004.07 153,000
26.40 1,428,00021.80 1,328,000
135,000161,000
26.05 24,00021.40 19,000
23.60 57,00020.60 57,000
.34 5,000¯ 39 7,000
70,500 Birds 1,674,000 Lbs76,8o0 1,435,0o0
57,1o0 257,00051,5o0 232,000
Lbs
¯ 454 1,017,000.328 775,000
Service figures -6-
309,000309,000
.186 323,000¯ 181 233,000
1,384,0001,069,000
¯ 249 417,000.205 294,000
¯ 347 89,000¯ 30 70,000

TREND OF PERMANENT CROPS IN SANTA CRUZ COUNTY - I0 Years
MAJOR VARIETIES
APPLES
Newtown PippinDelicious - RedDelicious - StdBellefleurWinter BananaW. W. PearmainGravensteinGolden DeliciousMcIntoshOther Varieties
TOTAL
Total Bearing AcresAcreage Non-bearing1969 Acreage 1969 196._~4 196___O0
4,170 583 3~587 3,864 4,5393,B03 360 3,443 2,522 2,285
5 0 305 396 494
193 i 192 282 451
144 18 126 162 203
84 o 84 lO2 13155 2 53 89 97
114 18 96 85 50
325 176 149 22 6
144 hl 103 276 293
9,337 1,199 8,138 7,800 8,549
APRICOTS
All Varieties
CHERRIESBingOther VarietiesTOTAL
GRAPES
Wine VarietiesTable Varieties
TOTAL
132 5 127 158 245
12 0 12 19 42
8 O 8 27 65
2O O 2O 46 107
93 8 85 93 107
13 0 13 22 31
106 8 98 i15 138
PEARS
BartlettHardyOther Varieties
TOTAL
366 2 364 409 55853 2 51 99 128
9 0 9 12 55
428 h h24 520 741
PLUMS
Santa RosaOther Varieties
TOTAL
278 0 278 426 515
33 1 32 86 44
311 1 310 512 559
PRUNES
FrenchOther VarietiesTOTAL
OTHER FRUITS-NUTS
Total Bearing AcresTotal Non-Bearing Acres
25138
289
119 42
25134285
77
292 41654 983h6 514
151 141
9,648 10,9942,567 2,3h9
GRAND TOTAL ALL 10,742 12,215 13,343
-7-
-’-1

TREND OF OTHER CROPS
IN SANTA CRUZ COUNTY
Total Acres Grown (Includes New Plantings)
1969 1968 1967 1966 1965
Bushberries 450 530 580 735 745
Blackberry 355Boysenberry 35Logan & Misc 5Raspberry 55
Strawberries 725
Asparagus 0
Artichokes 420
Beans, Green 440
Broccoli 3~5
Brussels Sprouts 3,270
Cabbage 375
Cauliflower . 620
Celery 310
Corn, Sweet 40
Cucumbers 160
Lettuce, spring 300
Lettuce, summer 2,790
Lettuce, fall 1,550
Potatoes 25
Squash 450
Tomatoes llO
Beans, dry 465
Grain 60
Hay 5,090
Sugar Beets I00
Nursery 835
420 44o 54o 52o50 60 90 lO0lO 15 55 6o5o 65 5o 65
700 750 720 810
50 65 120 175
430 430 430 430
46o 48o 45o 815
18o 165 155 15
3,270 3,460 3,180 2,930
375 31o 300 270
800 515 800 745
325 245 255 250
25 25 55 40
165 105 50 45
750 340 695 480
2,530 2,390 2,345 2,170
1,390 1,330 1,350 815
60 80 60 85
305 270 310 445
115 85 105 120
470 215 635 500
270 165 170 745
5,16o 5,15o 4,775 5,38o
180 215 165 335
725 640 640 745
-8-

/
,--7


![Stefano Profumo UC Santa Cruz Santa Cruz Institute for Particle Physics T.A.S.C. [Theoretical Astrophysics in Santa Cruz] TeV Particle Astrophysics 2009.](https://static.fdocuments.in/doc/165x107/56649d805503460f94a63a80/stefano-profumo-uc-santa-cruz-santa-cruz-institute-for-particle-physics-tasc.jpg)