Agricultural and Food Policy Center Texas A&M University ...
60
AFPC Economic Impacts of the Sensible Taxation and Equity Promotion Act and the For the 99.5 Percent Act on AFPC’s Representative Farms and Ranches Agricultural and Food Policy Center Texas A&M University June 15, 2021 Department of Agricultural Economics Texas AgriLife Research Texas AgriLife Extension Service Texas A&M University College Station, Texas 77843-2124 Telephone: (979) 845-5913 Fax: (979) 845-3140 http://www.afpc.tamu.edu | @AFPCTAMU
Transcript of Agricultural and Food Policy Center Texas A&M University ...

AFPC
Economic Impacts of the Sensible Taxation and Equity Promotion Act and the For the 99.5 Percent Act
on AFPC’s Representative Farms and Ranches
Agricultural and Food Policy CenterTexas A&M University
June 15, 2021
Department of Agricultural EconomicsTexas AgriLife ResearchTexas AgriLife Extension ServiceTexas A&M University
College Station, Texas 77843-2124Telephone: (979) 845-5913
Fax: (979) 845-3140http://www.afpc.tamu.edu | @AFPCTAMU

© 2021 by the Agricultural and Food Policy Center
Research Report 21-01
Cover photo by Phil Hogan, USDA.
Agricultural and Food Policy CenterDepartment of Agricultural Economics2124 TAMUCollege Station, TX 77843-2124Web site: www.afpc.tamu.eduTwitter: @AFPCTAMU
1Economic Impact of the STEP Act and 99.5 Percent Act on AFPC’s Representative Farms and Ranches
Joe L. OutlawBart L. FischerHenry L. Bryant
J. Marc RaulstonGeorge M. Knapek
Brian K. Herbst
Agricultural & Food Policy CenterDepartment of Agricultural Economics
Texas A&M AgriLife ResearchTexas A&M AgriLife Extension Service
Texas A&M University
Research Report 21-01
June 15, 2021
College Station, Texas 77843-2124Telephone: 979.845.5913
Fax: 979.845.3140Web site: http://www.afpc.tamu.edu/
Twitter: @AFPCTAMU
Economic Impacts of the Sensible Taxation and Equity Promotion Act and the For the 99.5 Percent Act
on AFPC’s Representative Farms and Ranches
AFPCAgricultural and Food Policy Center
The Texas A&M University System

Economic Impact of the STEP Act and 99.5 Percent Act on AFPC’s Representative Farms and Ranches2

3Economic Impact of the STEP Act and 99.5 Percent Act on AFPC’s Representative Farms and Ranches
Executive Summary
Under current law, when the owner of a farm or ranch dies, the estate is subjected to federal estate taxes. As of 2021, $11.7 million per individual and $23.4 million per couple in assets are exempted from the estate tax, effectively protecting most farms from the estate tax. In addition, when a decedent passes farm assets to an heir, the heir is allowed to take fair market values as their basis in the property (i.e. stepped-up basis), effec-tively avoiding capital gains taxes. Given that cropland values have roughly tripled over the past 25 years, most producers are extremely sensitive to any changes to the estate tax exemptions or stepped-up basis.
In Spring 2021, a number of proposals surfaced that would significantly change how inheritance is treated. For example, the Sensible Taxation and Equity Promotion Act (STEP Act)—announced by Sen. Chris Van Hollen (D-MD)—proposes to eliminate stepped-up basis upon death of the owner. The For the 99.5 Percent Act (99.5% Act)—introduced by Sen. Bernie Sanders (I-VT)—would decrease the estate tax exemption to $3.5 million ($7 million per couple), among other things. Senator John Boozman, Ranking Member, Senate Committee on Agriculture, Nutrition, and Forestry, and Representative G.T. Thompson, Ranking Member, House Committee on Agriculture, asked the Agricultural and Food Policy Center (AFPC) to examine the impact of the proposals on agricultural producers.
AFPC maintains a database of 94 representative farms in 30 different states. That data, in conjunction with a farm-level policy simulation model, allows AFPC to analyze policy changes on farms and ranches across the country. As part of this analysis, AFPC analyzed a total of five scenarios:
• Scenario 1: Current Tax Law with No Generational Transfer. • Scenario 2: Generational Transfer under Current Tax Law. • Scenario 3: Generational Transfer under STEP Act.
• Scenario 4: Generational Transfer under 99.5% Act. • Scenario 5: Generational Transfer under STEP Act and 99.5% Act.
Under current tax law, only 2 of the 94 representative farms would be impacted by an event triggering a gen-erational transfer. By contrast, under the STEP Act, 92 of the 94 representative farms would be impacted, with additional tax liabilities incurred averaging $726,104 per farm. Under the 99.5% Act, 41 of the 92 representative farms would be impacted, with additional tax liabilities incurred averaging $2.17 million per farm.
If both the STEP Act and the 99.5% Act were simultaneously implemented, 92 of the 94 representative farms would be impacted, with additional tax liabilities incurred averaging $1.43 million per farm across the 92 repre-sentative farms.

Economic Impact of the STEP Act and 99.5 Percent Act on AFPC’s Representative Farms and Ranches4
Economic Impacts of the Sensible Taxation and Equity Promotion Act and the For the 99.5 Percent Act
on AFPC’s Representative Farms and Ranches
Introduction
This report analyzes the economic impacts of the tax provisions of the Sensible Taxation and Equity Promotion Act (STEP Act) and the For the 99.5 Percent Act (99.5% Act) on the Agricultural and Food Policy Center’s (AFPC’s) 94 representative farms and ranches. The analysis was requested by Senator John Boozman, Ranking Member, Senate Committee on Agriculture, Nutrition, and Forestry, and Representative G.T. Thompson, Ranking Mem-ber, House Committee on Agriculture. The results are presented relative to a status-quo baseline that main-tains the current estate tax exemption and stepped-up basis provisions through 2026.
Background
Overview of Capital Gains Tax Provisions in Current Law
When an asset appreciates in value, the difference between the current fair market value and the amount paid for the asset (less accumulated depreciation) is known as a capital gain. Under current tax law, assets held longer than one year are taxed at long-term capital gains rates of up to 20% depending on one’s underlying tax-able income. As noted in an April 2021 report by Ernst and Young for the Family Business Estate Tax Coalition (FBETC), “a longstanding provision of US tax law, in place since the Revenue Act of 1921, is that a capital gains tax is not imposed when assets are transferred at death to an heir. Furthermore, tax law allows the heir to in-crease their basis in the bequeathed assets to fair market value without paying capital gains tax. This is referred to as a step-up of basis.”
Overview of Estate Tax Provisions in Current Law
While stepped-up basis provisions have largely rendered capital gains tax irrelevant when assets are transferred to an heir at death, that is not the case with the federal estate tax. Prior to passage of the Tax Cuts and Jobs Act of 2017 (P.L. 115-97), the estate tax exemption level was $5.49 million (indexed to inflation) (Figure 1). Be-cause property left to a surviving spouse transfers free of the estate tax, the exemptions for a married couple are effectively doubled—$10.98 million for 2017.
The Tax Cuts and Jobs Act of 2017 raised the exemption level to $11.18 million for 2018 (still indexed to infla-tion). As of 2021, the estate tax exemption is $11.7 million per person which is set to expire in 2025, at which

5Economic Impact of the STEP Act and 99.5 Percent Act on AFPC’s Representative Farms and Ranches
$0
$2,000,000
$4,000,000
$6,000,000
$8,000,000
$10,000,000
$12,000,000
1997199819992000200120022003200420052006200720082009201020112012201320142015201620172018201920202021
point the estate tax exemption reverts to $5.49 million per person. When accounting for a spouse, the current exemption level is effectively $23.4 million per couple.
Application to Agriculture
Agricultural producers are extraordinarily sensitive to changes in stepped-up basis and estate taxes because much of their net worth is traditionally comprised of land and equipment. Given recent trends in land values, that concern now is even more heightened. As noted in Figure 2, cropland values have more than tripled since 1997. So, even if a producer has not purchased any additional land, the land they were already holding is now considerably more valuable.
Figure 1: Historic Individual Estate Tax Exemption Levels.
Source: IRS and Jacobson et al.

Economic Impact of the STEP Act and 99.5 Percent Act on AFPC’s Representative Farms and Ranches6
Proposed Changes
The Sensible Taxation and Equity Promotion Act (STEP Act)—announced by Sen. Chris Van Hollen (D-MD)—pro-poses to eliminate stepped-up basis upon death of the owner.1 Under the STEP Act, $1 million in capital gains would be excluded from taxation. The STEP Act also anticipates situations where generational transfers do not occur—for example, imposing capital gains taxes on trusts every 21 years. With that said, it is not clear how similar situations would be treated. For example, assume an institutional investor (e.g. hedge fund) holds farm-land in an LLC. It is not clear if those institutional landowners would be impacted. As a result, that analysis is beyond the scope of this report.
1 For more information on the STEP Act, see: https://www.vanhollen.senate.gov/news/press-releases/van-hollen-leads-colleagues-in-announcing-new-legislation-to-close-the-stepped-up-basis-loophole.
Figure 2: Farm Real Estate Values (Including Buildings), Cropland Values, and Pastureland Values (in $/Acre), 1988-2020.
Source: USDA/NASS
$0
$500
$1,000
$1,500
$2,000
$2,500
$3,000
$3,500
$4,000
$4,500
1988
1989
1990
1991
1992
1993
1994
1995
1996
1997
1998
1999
2000
2001
2002
2003
2004
2005
2006
2007
2008
2009
2010
2011
2012
2013
2014
2015
2016
2017
2018
2019
2020
Farm Real Estate Cropland Pastureland

7Economic Impact of the STEP Act and 99.5 Percent Act on AFPC’s Representative Farms and Ranches
The For the 99.5 Percent Act (99.5% Act)—introduced by Sen. Bernie Sanders (I-VT)—includes modifications to estate, gift, and generation-skipping transfer taxes.2 The 99.5% Act would, among other things, decrease the estate tax exemption to $3.5 million per individual and $7 million per couple. If signed into law this year, the changes would be effective for decedents dying and gifts made during calendar year 2021.
This analysis evaluates the elimination of stepped-up basis alone and in conjunction with estate tax changes, depending upon the scenario being analyzed. Each of the scenarios are described in more detail below and do not assume any special rules or exceptions other than those explicitly stated.
Data and Methods
Model
For over 30 years, AFPC has maintained a farm-level policy simulation model (FLIPSIM) developed by Richard-son and Nixon (1986) for analyzing the impact of proposed policy changes on U.S. farms and ranches. AFPC currently uses a next generation simulation model—Farm Economics and Solvency Projector (FarmESP)—de-veloped by Dr. Henry Bryant, that moves to the Python platform and includes all of the previous generation’s policy and tax capabilities with a significant upgrade in terms of crop insurance capabilities.
Data
The data to simulate farming operations in FarmESP comes primarily from AFPC’s database of representative farms. Information to describe and simulate these farms comes from panels of farmers (typically 4-6 produc-ers per location) located in major production regions in 30 states across the United States (Figure 3). The
farm panels are reconvened frequently to update their representative farm’s data. The representative farms are categorized by their primary source of receipts—for example, feedgrain, wheat, cotton, rice, dairy, and cattle ranches. The representative farm database has been used for policy analysis for over 30 years.
In the tables that follow, the first two letters of a farm’s name is the state abbreviation followed by the letter describing the type of farm (e.g., G for feedgrain, W for wheat, etc) followed by an M or L indicating if the farm is moderate or large (an X indicates there is only one farm size of that type in the region). The number in a farm’s name indicates the acres or number of head of cattle for ranches or milk cows for dairies. Appendix A provides an overview of the characteristics of AFPC’s representative farms. Appendix B provides the names of producers, land grant faculty, and industry leaders who cooperated in the panel interview process to develop the representative farms. Additional information about the representative farms can be found in AFPC Working
2 For more information on the 99.5% Act, see: https://www.sanders.senate.gov/press-releases/sanders-and-colleagues-introduce-legis-lation-to-end-rigged-tax-code-as-inequality-increases/.

Economic Impact of the STEP Act and 99.5 Percent Act on AFPC’s Representative Farms and Ranches8
Figure 3: Map of AFPC Representative Farm and Ranches.
3500
2300
2000
16002000
20003500
30004050
25004500
25002640
10003500
800
80012003000
2000800050004100
9500
30005640
30008000
24004500
20005300
40007000
5000
345010640
2500
2500
25004500
30001600
1600 2500400010000
15003000
13503400
230023004200
4000
32406500
400050002500
5500
3001200
1000
2000
650
1500
600
475
275
240
600 1801700
5001200
180675
160400
550
1750
250550
400400
3800
150032001800300
550
50002000
4007001500
Paper 21-1 by Outlaw et al., March 2021. The breakdown of farms by type is as follows:
• Feedgrain: 25• Wheat: 11• Cotton: 13• Rice: 15• Cattle: 10• Dairy: 20
Projected prices, policy variables, and input inflation rates are from the Food and Agricultural Policy Research Institute (FAPRI) 2021 Baseline (Tables 1 and 2). Notably, there are occasions when we would expect a policy change to greatly change relative commodity prices necessitating a FAPRI analysis of the sector level that would feed into the representative farm models. This is not the case for the current tax analyses. We expect any impacts to be experienced over time and localized to operations with significant owned land.
AFPC’s representative farms and ranches are all assumed to be full-time, commercial-scale family operations. The results of this analysis will vary greatly by farm depending upon each farm’s asset base and the share of their farmland they own versus rent. Tables 3 and 4 provide the percent of the farm’s cropland or ranch’s pastureland that is owned for the representative farms. The percentage varies greatly across farms and farm

9Economic Impact of the STEP Act and 99.5 Percent Act on AFPC’s Representative Farms and Ranches
2019 2020 2021 2022 2023 2024 2025 2026Crop Prices
Corn ($/bu.) 3.56 4.22 4.04 3.96 3.91 3.85 3.80 3.78
Wheat ($/bu.) 4.58 4.84 5.00 5.09 5.09 5.05 5.03 5.01
Upland Cotton Lint ($/lb.) 0.5960 0.6816 0.6785 0.6675 0.6689 0.6807 0.6821 0.6919
Sorghum ($/bu.) 3.34 4.59 4.06 3.98 3.90 3.86 3.82 3.82
Soybeans ($/bu.) 8.57 11.15 10.49 10.34 10.09 9.80 9.60 9.45
Barley ($/bu.) 4.69 4.64 4.76 4.78 4.73 4.68 4.63 4.61
Oats ($/bu.) 2.82 2.77 2.63 2.69 2.70 2.69 2.67 2.67
All Rice ($/cwt.) 13.50 13.10 12.61 12.85 12.98 13.12 13.33 13.60
Soybean Meal ($/ton) 285.67 366.40 334.10 334.07 329.04 323.51 317.02 314.86
All Hay ($/ton) 163.00 159.10 162.69 161.62 160.53 159.08 157.73 157.14
Peanuts ($/ton) 410.00 426.61 412.71 404.76 400.25 401.29 402.55 404.02
Cattle Prices
Feeder Cattle ($/cwt) 153.65 145.83 148.81 163.34 171.77 177.61 182.36 184.49
Fed Cattle ($/cwt) 116.78 108.46 116.47 122.63 127.73 131.68 134.85 136.33
Culled Cows ($/cwt) 58.97 58.50 60.45 64.85 66.71 68.25 70.68 71.82
Milk Price
U.S. All Milk Price ($/cwt) 18.63 18.30 17.50 17.59 17.78 18.01 18.05 18.04
Table 1: FAPRI January 2021 Baseline Crop and Livestock Prices, 2019-2026.
Source: Food and Agricultural Policy Research Institute (FAPRI) at the University of Missouri-Columbia.

Economic Impact of the STEP Act and 99.5 Percent Act on AFPC’s Representative Farms and Ranches10
2020 2021 2022 2023 2024 2025 2026Annual Rate of Change for Input Prices Paid
Seed Prices (%) -2.00 2.45 3.17 2.51 1.94 1.47 1.22
All Fertilizer Prices (%) 3.29 3.63 4.11 -1.03 0.37 0.54 0.50
Herbicide Prices (%) -1.85 3.80 1.96 1.51 1.62 1.58 1.67
Insecticide Prices (%) -6.59 2.80 1.87 1.71 1.81 1.77 1.82
Fuel and Lube Prices (%) -3.26 2.17 6.45 6.72 2.42 3.17 4.20
Machinery Prices (%) -0.12 1.98 1.84 0.94 1.13 1.17 1.30
Wages (%) 1.48 2.62 3.31 3.42 3.22 3.20 3.30
Supplies (%) 1.49 1.63 1.42 1.43 1.39 1.57 1.62
Repairs (%) 1.29 2.57 2.35 2.39 2.29 2.42 2.50
Services (%) -0.24 1.81 2.44 2.15 2.16 2.13 2.24
Taxes (%) 1.36 3.17 2.46 4.94 5.13 1.33 1.40
PPI Items (%) -0.89 3.52 2.51 1.33 1.04 1.12 1.27
PPI Total (%) -0.39 3.32 2.57 1.71 1.47 1.38 1.53
Annual Change in Consumer Price Index (%) 1.25 2.12 2.46 2.10 2.12 2.15 2.23
Annual Rate of Change for U.S. Land Prices (%) 0.00 5.15 5.10 -2.20 -1.92 -1.33 -1.20
Table 2: FAPRI January 2021 Baseline Assumed Rates of Change in Input Prices and Annual Changes in Land Values, 2020-2026.
Source: Food and Agricultural Policy Research Institute (FAPRI) at the University of Missouri-Columbia.

11Economic Impact of the STEP Act and 99.5 Percent Act on AFPC’s Representative Farms and Ranches
FeedgrainFarms
WheatFarms
CottonFarms
RiceFarms
IAG-M-1350 19% WAW-M-2800 29% TXSP-X-4500 11% CAR-M-1200 23%IAG-L-3400 25% WAW-L-10000 25% TXEC-X-5000 25% CAR-L-3000 30%
NEG-M-2400 25% WAAW-X-5500 45% TXRP-X-3000 29% CABR-X-800 40%
NEG-L-4500 48% ORW-X-4500 44% TXMC-X-2500 7% CACR-X-800 30%NDG-M-3000 24% MTW-X-9500 53% TXCB-M-4000 15% TXR-M-1500 27%NDG-L-9000 44% KSCW-M-2000 35% TXCB-L-10000 15% TXR-L-3000 0%ING-M-1000 30% KSCW-L-5300 25% TXVC-X-5500 32% TXBR-X-1800 0%
ING-L-3500 35% KSNW-M-4000 29% ARNC-X-5000 20% TXER-X-2500 0%
OHG-M-700 50% KSNW-L-7000 30% TNC-M-3000 10% LASR-X-2000 10%OHG-L-1500 25% COW-M-3000 70% TNC-L-4050 25% ARMR-X-6500 18%MOCG-M-2300 60% COW-L-6000 50% ALC-X-3500 10% ARSR-X-3240 20%MOCG-L-4200 43% GAC-X-2500 100% ARWR-X-2500 50%MONG-X-2300 70% NCNP-X-1600 38% ARHR-X-4000 25%LANG-X-2500 20% MSDR-X-5000 60%TNG-M-2500 25% MOBR-X-4000 25%TNG-L-5000 28%NCSP-X-2000 35%NCC-X-2030 11%SCC-X-2000 28%SCG-X-3500 40%
TXNP-M-3450 75%
TXNP-L-10880 38%TXPG-X-2500 75%
TXHG-X-3000 15%
TXWG-X-1600 9%
Table 3: Percent of Cropland on the Farm that is Owned by Farm Type.
types. For example, two of the four Texas rice farms are comprised only of rented land. As a result, any capital
gains or estate taxes accrue from sources other than land (if at all—as noted later in the results, two Texas rice farms were the only farms not impacted by this analysis). Importantly, the analysis does not include indirect impacts. For example, while two of the Texas rice farms were not impacted, if they were renting land from a landowner who was impacted by either proposal, one could reasonably assume that rental rates would in-crease as a result.
Producer Input
Each time a policy proposal is evaluated that depends on individual producer responses, AFPC sends an email asking for information from representative farm panel participants that would make the analysis more realistic. For this analysis, representative farm participants provided information that assisted with allocating the per-

Economic Impact of the STEP Act and 99.5 Percent Act on AFPC’s Representative Farms and Ranches12
Ranches Dairy FarmsCropland Pastureland Cropland Pastureland
Acres Percent Acres Percent Acres Percent Acres PercentNVB-X-650 1,300 100% 10,725 81% CAD-X-2000 700 86% 0 n/a
NVSB-X-550 125 100% 375 100% WAD-M-300 250 50% 0 n/a
MTB-X-600 900 100% 20,700 63% WAD-L-1200 850 50% 0 n/aWYB-X-475 330 100% 2,200 68% IDD-X-1500 850 50% 0 n/aCOB-X-275 650 69% 3,050 75% NVD-X-1000 500 60% 0 n/aNMB-X-210 0 n/a 12,333 82% TXND-X-3800 1,920 100% 0 n/a
SDB-X-600 1,000 100% 14,200 46% TXCD-X-1500 616 59% 500 100%
MOB-X-250 360 60% 850 67% TXED-X-400 950 50% 0 n/aTXRB-X-400 0 n/a 20,000 50% WID-M-180 800 50% 40 100%TXSB-X-300 100 100% 1,575 51% WID-L-1700 3,200 50% 0 n/a
OHD-X-400 700 50% 25 100%NYWD-M-400 800 60% 0 n/aNYWD-L-1200 2,100 67% 50 100%NYCD-M-180 400 80% 30 100%NYCD-L-800 1,800 75% 50 100%VTD-M-160 220 45% 60 n/aVTD-L-400 1,000 53% 100 50%MOGD-X-550 460 100% 0 n/aFLND-X-550 600 75% 60 100%
FLSD-X-1750 400 100% 470 100%
Table 4: Percent of Crop and Pastureland on the Farm/Ranch that is Owned by Farm Type.
centage of owned land on each type of farm (crop, dairy, ranch) into time periods of acquisition to calculate potential capital gains tax obligations. Naturally, AFPC anticipates land that was recently acquired will have a higher basis compared to land that panel members acquired comparatively earlier.
A total of 247 responses were received from the representative farm/ranch panel members. This represents approximately 40% of the panel members in the AFPC database. This is by far the highest response rate AFPC has ever received when asking questions about potential policy changes. There were 23 responses from the 10 ranches, 186 responses from the 64 crop farms, and 38 responses from the 20 dairy farms. As noted earlier, we typically have 4-6 producers on each representative farm panel, so the number of producer responses we re-ceived easily exceeded the number of representative farms in our analysis. Major agricultural states often have more than one representative farm/ranch panel in our network of representative farms; producers in every state with a representative farm or ranch registered responses.
The percentage of owned land by years of ownership has similar patterns across farm types. A relatively large percentage was purchased within the past 5 years, and 49 percent or more of the land for each farm type was

13Economic Impact of the STEP Act and 99.5 Percent Act on AFPC’s Representative Farms and Ranches
acquired over 15 years ago. As discussed in more detail below, these percentages were utilized in the FarmESP simulation model to incorporate realistic land ownership patterns (Figure 4).
Model Modifications
To simulate the effects of the STEP Act and 99.5% Act provisions, the following changes were incorporated into FarmESP:
• To calculate the potential capital gain tax liability under the STEP Act, capital gain amounts were calcu-lated for each farm based on owned land and equipment. The capital gain on land was dependent on the farm type (crop, dairy, or ranch) and panel member feedback on the length of time the land was owned. For example, if a crop farm owned 100 acres, it was assumed that 18.3% of the 100 acres was owned for more than 30 years, 6.6% was owned for 26 to 30 years, and so on based on the producer responses summarized in Figure 4.
• The taxable amount of capital gains on owned land was defined as the difference between the current market value of the land in 2021 and the value of the land when it was acquired. The current value of
Figure 4: Simple Average of Panel Member Responses to Length of Time They Have Owned Land.
0%
5%
10%
15%
20%
25%
30%
35%
< 5Years
6-10Years
11-15Years
16-20Years
21-25Years
26-30Years
>30Years
Ranches Crop Farms Dairy Farms

Economic Impact of the STEP Act and 99.5 Percent Act on AFPC’s Representative Farms and Ranches14
the land reflects discussions by panel members in the most recent update meeting with AFPC person-nel. The value of the land when it was acquired was determined by taking the current market value in 2021 and applying a percentage price change for each land vintage that is equal to their state-level pastureland (ranches) or cropland (all other farms) percentage price change based on NASS data.
• The taxable amount of capital gains on machinery was calculated on the current market value of machinery in 2021 less the book value in 2021. The current market value of machinery reflects dis-cussions by panel members in the most recent update meeting with AFPC personnel. The book value is based on the purchase price and depreciation schedule in FarmESP. Both the machinery and land capital gains were assumed to be taxed at the current 20% long-term capital gains rate. The exclusion of tax on the first $1 million of capital gain was also assumed (consistent with the STEP Act).
• The estate tax liability under the 99.5% Act was calculated using the nominal net worth of each farm in 2021. The nominal net worth was taxed at the applicable updated marginal tax rates outlined in the 99.5% Act. Each farm was assumed to be eligible for double the $3.5 million exclusion amount (consistent with AFPC’s assumption of two payment limits for purposes of Title 1 benefits). Thus, the assumed estate tax exclusion on each farm went from $23.4 million in current law to $7 million under the 99.5% Act. In scenario 3 (Generational Transfer under STEP Act) and the final scenario (Generational Transfer under STEP Act and 99.5% Act), it was assumed that the applicable capital gains tax amount was deducted from the decedent’s gross estate for purposes of calculating the estate tax obligation.
• This analysis for all of the farms starts in 2018 using actual prices and output variables (e.g., crop yields, milk production per cow, and calf crop) for 2018-2020 and uses FAPRI commodity and input price forecasts for 2021-2026. Using three years of history provides the opportunity to check to en-
sure the model results are aligned with the panel’s experiences.
• AFPC’s representative farms are constructed to analyze policy changes going forward. Under the status quo, the farms are assumed to continue operating in perpetuity. For purposes of this analysis and for the sake of consistency, the operator/landowner is assumed to die in 2021 with the farm transferring ownership in 2021 and taxes due in 2022. Naturally, farms that recently went through a generational transfer would not be impacted by the proposed changes (at least not in the near term), but this assumption is obviously key to analyzing the impact of the tax proposals on the farms in the event of an operator death.
• Finally, farms are expected to pay the calculated tax obligations in the year they are due. All farms are assumed to pay calculated taxes out of existing cash (if available). If the farm does not

15Economic Impact of the STEP Act and 99.5 Percent Act on AFPC’s Representative Farms and Ranches
have enough cash to pay all cash obligations, then a carryover is experienced, and a short-term loan is established for the debt. While the results would suggest that some farms would have difficulty securing financing, this assumption of available financing is consistent with the fact that the STEP Act, for example, provides a 15-year financing option. While there are a number of ways a producer could choose to address a large additional tax liability, the assumptions made in this analysis provide a snap-shot of the magnitude of the financial impacts of the proposed tax policy changes.
Scenarios Analyzed
The following five scenarios were analyzed for each of the 94 representative farms and ranches:
• Scenario 1: Current Tax Law with No Generational Transfer. This baseline scenario assumes current tax law remains in place and that no event triggers a generational transfer.
• Scenario 2: Generational Transfer under Current Tax Law. This scenario assumes current tax law remains in place and an event triggers a generational transfer in 2021 (e.g. death of the principal operator).
• Scenario 3: Generational Transfer under STEP Act. This scenario assumes the STEP Act is in effect and an event triggers a generational transfer in 2021 (e.g. death of the principal operator). Under the STEP Act, the current estate tax exemption levels are maintained and stepped-up basis is eliminated.
• Scenario 4: Generational Transfer under 99.5% Act. This scenario assumes the 99.5% Act is in effect and an event triggers a generational transfer in 2021 (e.g. death of the principal operator). Under the 99.5% Act, the estate tax exemption levels are lower but stepped-up basis is maintained.
• Scenario 5: Generational Transfer under STEP Act and 99.5% Act. This scenario assumes both the STEP Act and the 99.5% Act are in effect and an event triggers a generational transfer in 2021 (e.g. death of the principal operator). In this scenario, the estate tax exemption levels are lower and stepped-up basis is eliminated.
Results
As noted above, Scenario 1 is a baseline scenario where no event triggers a generational transfer. Under this status quo scenario, 38 of the 94 representative farms and ranches are projected to have a negative ending cash balance at the end of 2026—and that is without any policy changes. In other words, even in the status quo scenario, there are farms struggling to cash flow across all types of farms and ranches (7 feedgrain, 4 wheat, 5 cotton, 10 rice, 8 dairy and 4 cattle ranches).

Economic Impact of the STEP Act and 99.5 Percent Act on AFPC’s Representative Farms and Ranches16
As noted in Table 5, under Scenario 2 (Generational Transfer under Current Law), only two of the larger dairies (CAD-X-2000 and TXND-X-3800) face estate tax liabilities as a result of a generational transfer—owing to stepped-up basis (i.e. no long-term capital gains tax) and the $23.5 million estate tax exclusion in current law. Naturally, larger farms would be impacted by current law during a farm transition, but none of the other 92 farms in AFPC’s database would incur capital gains or estate taxes resulting in a change in ending cash balances under current law.
In sharp contrast, under Scenario 3 (Generational Transfer under the STEP Act), 92 of the 94 representative farms are impacted. Despite the $1 million exclusion included in the STEP Act, the elimination of stepped-up basis impacts almost all of AFPC’s representative farms. Across the 92 impacted farms, the additional tax liabil-ity incurred averages $726,104 per farm.
Under Scenario 4 (Generational Transfer under the 99.5% Act), lowering the estate tax exemption levels to $3.5 million (or a combined total of $7 million per couple) impacts 41 farms, with the additional tax liability incurred averaging $2.17 million per farm.
If the STEP Act and 99.5% Act were both implemented (Scenario 5), 92 of the 94 representative farms would be impacted. The additional tax liability incurred would average $1.43 million per farm across all 92 farms. While the average impact in Scenario 5 is lower than that in Scenario 4, that is entirely because Scenario 5 impacts 92 farms (whereas Scenario 4 impacted only 41 farms). Importantly, when looking at individual farm results (Table 6), in no case was the tax liability in Scenario 5 lower than that incurred in Scenarios 3 or 4; in other words, combining the two policies always resulted in an equal or higher tax liability.
Scenario 1 Scenario 2 Scenario 3 Scenario 4 Scenario 5No Generational
TransferGenerational
TransferGenerational
TransferGenerational
TransferGenerational
TransferCurrent Tax
PolicyCurrent Tax
Policy STEP Act 99.5% Act STEP + 99.5% Acts
Number of Farms Impacted n/a 2/94 (2%) 92/94 (98%) 41/94 (44%) 92/94 (98%)
Average Addi-tional Tax Liability Incurred for Farms Impacted
n/a $370,431 $726,104 $2,166,415 $1,431,408
Average Change in Ending Cash Bal-ances (2026)
n/a -$382,200 -$796,627 -$2,375,717 -$1,588,365
Table 5: Summary of Results for the Representative Farms for the Five Tax Scenarios.

17Economic Impact of the STEP Act and 99.5 Percent Act on AFPC’s Representative Farms and Ranches
Table 5 also includes the average change in ending cash balances in 2026 for each scenario. The fact that the reduction in ending cash balances exceeds the tax liability incurred largely reflects the interest costs incurred in financing the debt resulting from the tax liability.
Tables 6-8 contain the results for the 25 feedgrain, 11 wheat, 13 cotton, 15 rice, and 20 dairy farms along with 10 cattle ranches. For this analysis, the key output variables used to demonstrate the impact of the two tax policy changes are (1) additional tax liability incurred and (2) ending cash balances in 2026. With everything on the operation staying the same except for the policy change associated with each scenario, these variables highlight any liabilities and potential cash flow shortfalls that would be created by the tax changes.
Tables 6 and 7 also utilize average annual net cash farm income (NCFI) for 2021-2026 under the baseline sce-nario (i.e. current tax law with no generational transfer) as a point of reference. NCFI equals total cash receipts minus all cash expenses. It is used to pay family living expenses, principal payments, income taxes, self-employ-ment taxes, and machinery replacement costs.
Table 7 reflects the ratio of additional tax liability incurred to NCFI for Scenarios 3-5. For context, Table 7 il-lustrates how many years it would take to pay off the new tax liability if NCFI were used exclusively for that purpose. For example, on the 4,500-acre Nebraska feedgrain farm, it would take 14.5 years using all of the NCFI generated by the farm (while ignoring all other obligations normally covered by NCFI) to pay off the tax liability from the STEP Act and 99.5% Act.
Table 8 includes the average change in ending cash balances in 2026 for each scenario. As noted earlier, any reduction in ending cash balances that exceeds the tax liability incurred largely reflects the interest costs in-curred in financing the debt resulting from the tax liability. As shown in Table 8, a number of farms were already facing negative ending cash balances in 2026 under status quo.
While there is no perfect point of reference (or context), another approach would be to compare the addi-tional tax liability incurred to the cost basis of the assets on the farm. For 11 of the 94 representative farms, the tax liability incurred in Scenario 5 was more than 50% of the cost basis of the assets on the farm. In the extreme case, for the large Texas dairy (TXND-X-3800), the tax liability exceeded the cost basis of the farm (106%).

Economic Impact of the STEP Act and 99.5 Percent Act on AFPC’s Representative Farms and Ranches18
Scenario 2 Scenario 3 Scenario 4 Scenario 5
Type Farm Average Annual NCFI
Generational Transfer
Generational Transfer
Generational Transfer
Generational Transfer
Base (2021-26) Current Tax Policy STEP Act 99.5% Act STEP + 99.5% Acts
Feedgrain IAG-M-1350 89,090 0 283,842 0 283,842
IAG-L-3400 531,862 0 1,244,826 1,027,064 1,711,563
NEG-M-2400 435,960 0 713,177 0 713,177
NEG-L-4500 419,070 0 2,956,842 4,591,837 6,070,258
NDG-M-3000 278,514 0 450,627 0 450,627
NDG-L-9000 1,351,884 0 2,763,619 5,996,955 7,378,764
ING-M-1000 239,848 0 332,811 0 332,811
ING-L-3500 652,927 0 1,467,786 1,738,634 2,507,257
OHG-M-700 125,353 0 201,014 0 201,014
OHG-L-1500 407,906 0 346,212 0 346,212
MOCG-M-2300 575,856 0 1,513,229 1,873,664 2,655,537
MOCG-L-4200 1,122,730 0 2,321,461 4,605,774 5,766,504
MONG-X-2300 587,196 0 1,716,843 2,201,626 3,065,311
LANG-X-2500 205,219 0 193,054 0 193,054
TNG-M-2500 322,796 0 288,653 0 288,653
TNG-L-5000 874,612 0 850,887 1,835,971 2,268,907
NCSP-X-2000 183,313 0 306,738 0 306,738
NCC-X-2030 422,000 0 4,424 0 4,424
SCC-X-2000 195,420 0 191,371 0 191,371
SCG-X-3500 493,834 0 784,226 42,908 784,841
TXNP-M-3450 666,326 0 760,188 491,731 933,396
TXNP-L-10880 1,515,870 0 2,026,900 6,140,075 7,153,525
TXPG-X-2500 324,813 0 503,516 0 503,516
TXHG-X-3000 154,201 0 119,460 0 119,460
TXWG-X-1600 63,661 0 31,866 0 31,866
Wheat WAW-M-2800 307,995 0 113,573 0 113,573
WAW-L-10000 751,923 0 839,410 1,580,241 2,019,522
WAAW-X-5500 16,889 0 90,880 0 90,880
ORW-X-4500 145,686 0 30,282 0 30,282
MTW-X-9500 759,114 0 844,122 497,394 970,260
KSCW-M-2000 315,536 0 215,694 0 215,694
KSCW-L-5300 751,846 0 618,500 8,088 618,533
KSNW-M-4000 289,968 0 479,058 0 479,058
KSNW-L-7000 525,991 0 1,048,546 378,545 1,084,027
COW-M-3000 179,199 0 368,527 0 368,527
COW-L-6000 65,283 0 666,247 0 666,247
Cotton TXSP-X-4500 230,148 0 140,492 0 140,492
TXEC-X-5000 410,855 0 338,474 0 338,474
TXRP-X-3000 5,356 0 12,680 0 12,680
TXMC-X-2500 161,687 0 52,494 0 52,494
TXCB-M-4000 175,477 0 219,094 0 219,094
TXCB-L-10000 845,126 0 727,223 981,309 1,381,657
TXVC-X-5500 594,979 0 663,329 212,613 706,259
ARNC-X-5000 1,278,995 0 1,029,805 2,157,625 2,676,174
TNC-M-3000 612,663 0 62,219 0 62,219
TNC-L-4050 644,658 0 505,551 95,867 515,022
ALC-X-3500 967,496 0 291,897 0 291,897
GAC-X-2500 614,064 0 770,004 1,245,734 1,667,186
NCNP-X-1600 77,648 0 174,455 0 174,455
Table 6: Average Annual Net Cash Farm Income (NCFI) and Tax Liability for the Representative Farms for Select Tax Scenarios (in Dollars).

19Economic Impact of the STEP Act and 99.5 Percent Act on AFPC’s Representative Farms and Ranches
Rice CAR-M-1200 349,839 0 387,583 0 387,583
CAR-L-3000 112,705 0 1,471,776 2,696,234 3,440,680
CABR-X-800 262,352 0 400,802 0 400,802
CACR-X-800 -76,059 0 352,582 0 352,582
TXR-M-1500 37,579 0 147,822 0 147,822
TXR-L-3000 157,929 0 4,464 0 4,464
TXBR-X-1800 148,843 0 0 0 0
TXER-X-2500 213,467 0 0 0 0
LASR-X-2000 99,116 0 116,394 0 116,394
ARMR-X-6500 831,787 0 797,103 958,548 1,418,087
ARSR-X-3240 316,344 0 464,406 0 464,406
ARWR-X-2500 291,745 0 885,012 82,666 885,133
ARHR-X-4000 209,290 0 880,740 271,001 899,695
MSDR-X-5000 1,009,655 0 2,132,270 4,659,867 5,726,002
MOBR-X-4000 229,378 0 1,119,486 741,637 1,368,706
Ranch NVB-X-650 97,922 0 1,851,122 2,064,410 3,011,086
NVSB-X-550 83,046 0 386,106 0 386,106
MTB-X-600 144,217 0 874,000 620,397 1,101,097
WYB-X-475 34,455 0 236,199 0 236,199
COB-X-275 151,476 0 1,460,362 4,038,415 4,768,596
NMB-X-210 47,185 0 544,318 0 544,318
SDB-X-600 10,942 0 1,032,121 297,084 1,032,193
MOB-X-250 216,147 0 192,957 0 192,957
TXRB-X-400 119,777 0 972,300 731,541 1,266,307
TXSB-X-300 134,256 0 570,520 0 570,520
Dairy CAD-X-2000 1,483,972 1,815 2,124,243 7,016,637 8,078,759
WAD-M-300 -67,127 0 223,542 0 223,542
WAD-L-1200 376,854 0 1,158,760 3,055,598 3,634,978
IDD-X-1500 1,276,968 0 1,217,659 1,888,263 2,514,284
NVD-X-1000 814,030 0 318,521 218,965 434,172
TXND-X-3800 2,318,634 739,047 2,091,233 8,910,791 9,821,758
TXCD-X-1500 526,077 0 779,773 1,033,075 1,462,828
TXED-X-400 -53,969 0 81,163 0 81,163
WID-M-180 345,162 0 455,045 0 455,045
WID-L-1700 1,205,662 0 2,459,744 4,761,203 5,991,074
OHD-X-400 298,843 0 651,910 0 651,910
NYWD-M-400 267,324 0 422,625 0 422,625
NYWD-L-1200 797,816 0 1,733,207 3,802,948 4,669,552
NYCD-M-180 237,356 0 105,510 0 105,510
NYCD-L-800 598,976 0 1,384,251 1,860,716 2,572,514
VTD-M-160 -57,479 0 48,520 0 48,520
VTD-L-400 -158,767 0 544,104 0 544,104
MOGD-X-550 279,483 0 174,427 0 174,427
FLND-X-550 123,601 0 109,499 0 109,499
FLSD-X-1750 190,761 0 761,215 1,409,379 1,814,163
Scenario 2 Scenario 3 Scenario 4 Scenario 5
Type Farm Average Annual NCFI
Generational Transfer
Generational Transfer
Generational Transfer
Generational Transfer
Base (2021-26) Current Tax Policy STEP Act 99.5% Act STEP + 99.5% Acts
Table 6: Average Annual Net Cash Farm Income (NCFI) and Tax Liability for the Representative Farms for Select Tax Scenarios (in Dollars) (continued).

Economic Impact of the STEP Act and 99.5 Percent Act on AFPC’s Representative Farms and Ranches20
Scenario 3 Scenario 4 Scenario 5
Type Farm Generational Transfer
Generational Transfer
Generational Transfer
STEP Act 99.5% Act STEP + 99.5% Acts
Feedgrain IAG-M-1350 3.2 3.2
IAG-L-3400 2.3 1.9 3.2
NEG-M-2400 1.6 1.6
NEG-L-4500 7.1 11.0 14.5
NDG-M-3000 1.6 1.6
NDG-L-9000 2.0 4.4 5.5
ING-M-1000 1.4 1.4
ING-L-3500 2.2 2.7 3.8
OHG-M-700 1.6 1.6
OHG-L-1500 0.8 0.8
MOCG-M-2300 2.6 3.3 4.6
MOCG-L-4200 2.1 4.1 5.1
MONG-X-2300 2.9 3.7 5.2
LANG-X-2500 0.9 0.9
TNG-M-2500 0.9 0.9
TNG-L-5000 1.0 2.1 2.6
NCSP-X-2000 1.7 1.7
NCC-X-2030 0.0 0.0
SCC-X-2000 1.0 1.0
SCG-X-3500 1.6 0.1 1.6
TXNP-M-3450 1.1 0.7 1.4
TXNP-L-10880 1.3 4.1 4.7
TXPG-X-2500 1.6 1.6
TXHG-X-3000 0.8 0.8
TXWG-X-1600 0.5 0.5
Wheat WAW-M-2800 0.4 0.4
WAW-L-10000 1.1 2.1 2.7
WAAW-X-5500 5.4 5.4
ORW-X-4500 0.2 0.2
MTW-X-9500 1.1 0.7 1.3
KSCW-M-2000 0.7 0.7
KSCW-L-5300 0.8 0.0 0.8
KSNW-M-4000 1.7 1.7
KSNW-L-7000 2.0 0.7 2.1
COW-M-3000 2.1 2.1
COW-L-6000 10.2 10.2
Cotton TXSP-X-4500 0.6 0.6
TXEC-X-5000 0.8 0.8
TXRP-X-3000 2.4 2.4
TXMC-X-2500 0.3 0.3
TXCB-M-4000 1.2 1.2
TXCB-L-10000 0.9 1.2 1.6
TXVC-X-5500 1.1 0.4 1.2
ARNC-X-5000 0.8 1.7 2.1
TNC-M-3000 0.1 0.1
TNC-L-4050 0.8 0.1 0.8
ALC-X-3500 0.3 0.3
GAC-X-2500 1.3 2.0 2.7
NCNP-X-1600 2.2 2.2
Table 7: Years of Net Cash Farm Income (NCFI) Required to Eliminate Tax Liability for the Representative Farms for Select Tax Scenarios.
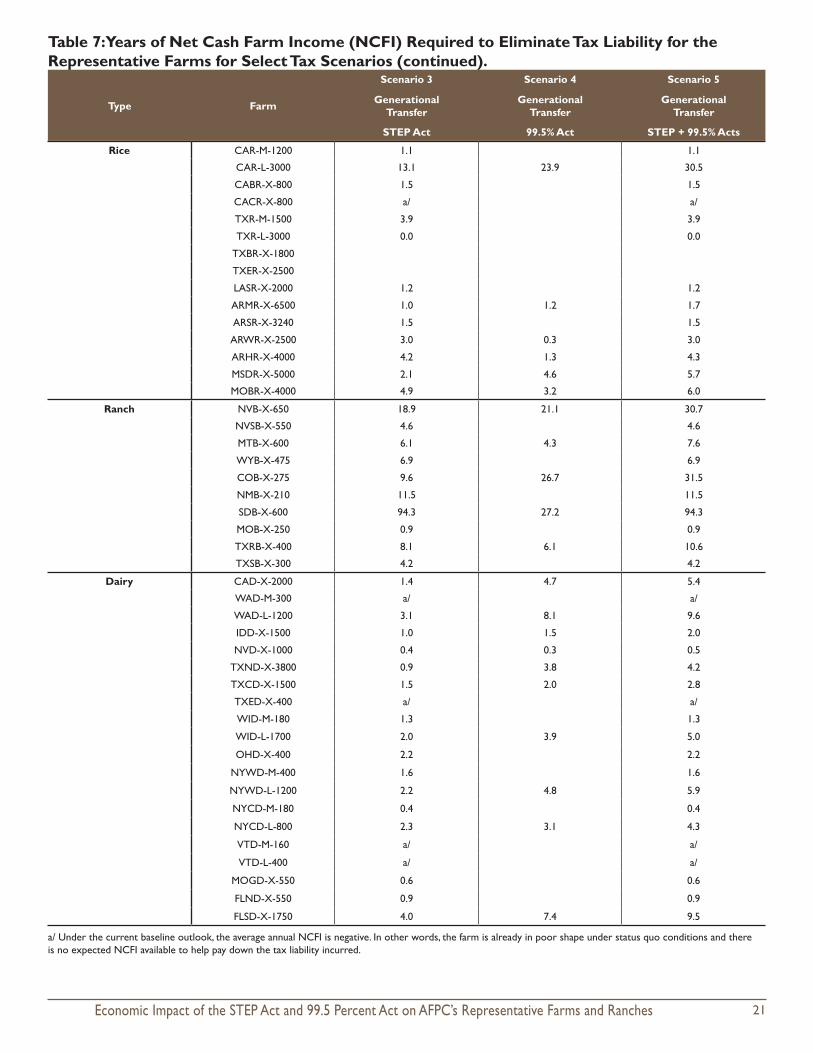
21Economic Impact of the STEP Act and 99.5 Percent Act on AFPC’s Representative Farms and Ranches
Rice CAR-M-1200 1.1 1.1
CAR-L-3000 13.1 23.9 30.5
CABR-X-800 1.5 1.5
CACR-X-800 a/ a/
TXR-M-1500 3.9 3.9
TXR-L-3000 0.0 0.0
TXBR-X-1800
TXER-X-2500
LASR-X-2000 1.2 1.2
ARMR-X-6500 1.0 1.2 1.7
ARSR-X-3240 1.5 1.5
ARWR-X-2500 3.0 0.3 3.0
ARHR-X-4000 4.2 1.3 4.3
MSDR-X-5000 2.1 4.6 5.7
MOBR-X-4000 4.9 3.2 6.0
Ranch NVB-X-650 18.9 21.1 30.7
NVSB-X-550 4.6 4.6
MTB-X-600 6.1 4.3 7.6
WYB-X-475 6.9 6.9
COB-X-275 9.6 26.7 31.5
NMB-X-210 11.5 11.5
SDB-X-600 94.3 27.2 94.3
MOB-X-250 0.9 0.9
TXRB-X-400 8.1 6.1 10.6
TXSB-X-300 4.2 4.2
Dairy CAD-X-2000 1.4 4.7 5.4
WAD-M-300 a/ a/
WAD-L-1200 3.1 8.1 9.6
IDD-X-1500 1.0 1.5 2.0
NVD-X-1000 0.4 0.3 0.5
TXND-X-3800 0.9 3.8 4.2
TXCD-X-1500 1.5 2.0 2.8
TXED-X-400 a/ a/
WID-M-180 1.3 1.3
WID-L-1700 2.0 3.9 5.0
OHD-X-400 2.2 2.2
NYWD-M-400 1.6 1.6
NYWD-L-1200 2.2 4.8 5.9
NYCD-M-180 0.4 0.4
NYCD-L-800 2.3 3.1 4.3
VTD-M-160 a/ a/
VTD-L-400 a/ a/
MOGD-X-550 0.6 0.6
FLND-X-550 0.9 0.9
FLSD-X-1750 4.0 7.4 9.5
Scenario 3 Scenario 4 Scenario 5
Type Farm GenerationalTransfer
Generational Transfer
Generational Transfer
STEP Act 99.5% Act STEP + 99.5% Acts
Table 7: Years of Net Cash Farm Income (NCFI) Required to Eliminate Tax Liability for the Representative Farms for Select Tax Scenarios (continued).
a/ Under the current baseline outlook, the average annual NCFI is negative. In other words, the farm is already in poor shape under status quo conditions and there is no expected NCFI available to help pay down the tax liability incurred.

Economic Impact of the STEP Act and 99.5 Percent Act on AFPC’s Representative Farms and Ranches22
Scenario 2 Scenario 3 Scenario 4 Scenario 5
Type Farm Ending CashBalance
Generational Transfer
Generational Transfer
Generational Transfer
Generational Transfer
Base (2026) Current Tax Policy STEP Act 99.5% Act STEP + 99.5% Acts
Feedgrain IAG-M-1350 -887.9 0.0 -330.8 0.0 -330.8
IAG-L-3400 89.3 0.0 -1,367.2 -1,120.6 -1,896.6
NEG-M-2400 771.3 0.0 -755.2 0.0 -755.2
NEG-L-4500 -2,087.6 0.0 -3,597.6 -5,612.3 -7,438.9
NDG-M-3000 318.4 0.0 -483.2 0.0 -483.2
NDG-L-9000 4,813.6 0.0 -2,842.0 -6,378.4 -7,944.2
ING-M-1000 212.1 0.0 -348.9 0.0 -348.9
ING-L-3500 1,154.5 0.0 -1,525.4 -1,816.6 -2,653.6
OHG-M-700 14.3 0.0 -226.6 0.0 -226.6
OHG-L-1500 1,252.1 0.0 -348.7 0.0 -348.7
MOCG-M-2300 921.9 0.0 -1,640.7 -2,048.8 -2,944.9
MOCG-L-4200 3,188.1 0.0 -2,408.3 -4,882.3 -6,160.5
MONG-X-2300 289.1 0.0 -1,934.7 -2,490.4 -3,483.2
LANG-X-2500 -232.5 0.0 -223.7 0.0 -223.7
TNG-M-2500 183.0 0.0 -315.9 0.0 -315.9
TNG-L-5000 2,349.2 0.0 -877.4 -1,926.3 -2,412.5
NCSP-X-2000 -1,021.9 0.0 -361.8 0.0 -361.8
NCC-X-2030 1,356.2 0.0 -4.5 0.0 -4.5
SCC-X-2000 -115.6 0.0 -217.1 0.0 -217.1
SCG-X-3500 910.6 0.0 -822.7 -43.2 -823.3
TXNP-M-3450 2,038.7 0.0 -772.9 -494.3 -948.4
TXNP-L-10880 6,946.2 0.0 -2,042.4 -6,383.8 -7,560.5
TXPG-X-2500 366.6 0.0 -550.5 0.0 -550.5
TXHG-X-3000 -212.7 0.0 -136.1 0.0 -136.1
TXWG-X-1600 -479.4 0.0 -40.4 0.0 -40.4
Wheat WAW-M-2800 702.6 0.0 -116.1 0.0 -116.1
WAW-L-10000 1,654.5 0.0 -903.2 -1,723.3 -2,248.8
WAAW-X-5500 -1,153.0 0.0 -112.6 0.0 -112.6
ORW-X-4500 -274.5 0.0 -35.6 0.0 -35.6
MTW-X-9500 1,508.6 0.0 -869.4 -510.0 -1,000.6
KSCW-M-2000 766.8 0.0 -218.3 0.0 -218.3
KSCW-L-5300 2,810.2 0.0 -626.6 -8.2 -626.6
KSNW-M-4000 354.7 0.0 -526.6 0.0 -526.6
KSNW-L-7000 1,206.3 0.0 -1,106.4 -387.3 -1,143.3
COW-M-3000 -120.8 0.0 -434.9 0.0 -434.9
COW-L-6000 -2,420.8 0.0 -828.5 0.0 -828.5
Cotton TXSP-X-4500 -182.4 0.0 -156.4 0.0 -156.4
TXEC-X-5000 1,142.1 0.0 -358.1 0.0 -358.1
TXRP-X-3000 -1,036.4 0.0 -15.6 0.0 -15.6
TXMC-X-2500 -149.4 0.0 -57.8 0.0 -57.8
TXCB-M-4000 -8.9 0.0 -238.2 0.0 -238.2
TXCB-L-10000 3,439.2 0.0 -743.2 -1,000.8 -1,412.7
TXVC-X-5500 2,406.7 0.0 -667.5 -212.9 -710.6
ARNC-X-5000 4,101.8 0.0 -1,045.6 -2,191.9 -2,726.8
TNC-M-3000 2,610.7 0.0 -63.0 0.0 -63.0
TNC-L-4050 2,126.1 0.0 -508.6 -96.2 -518.1
ALC-X-3500 4,072.0 0.0 -309.4 0.0 -309.4
GAC-X-2500 1,610.9 0.0 -783.9 -1,277.2 -1,735.1
NCNP-X-1600 -1,017.1 0.0 -206.1 0.0 -206.1
Table 8: Changes in Ending Cash Balances in 2026 for the Representative Farms for Select Tax Scenarios (in $1,000).

23Economic Impact of the STEP Act and 99.5 Percent Act on AFPC’s Representative Farms and Ranches
Rice CAR-M-1200 702.4 0.0 -401.2 0.0 -401.2
CAR-L-3000 -2,314.8 0.0 -1,663.4 -3,066.5 -3,920.9
CABR-X-800 153.2 0.0 -424.2 0.0 -424.2
CACR-X-800 -1,665.0 0.0 -425.4 0.0 -425.4
TXR-M-1500 -1,125.1 0.0 -185.9 0.0 -185.9
TXR-L-3000 -452.0 0.0 -5.2 0.0 -5.2
TXBR-X-1800 -161.0 0.0 0.0 0.0 0.0
TXER-X-2500 -28.9 0.0 0.0 0.0 0.0
LASR-X-2000 -504.7 0.0 -142.2 0.0 -142.2
ARMR-X-6500 1,918.8 0.0 -830.7 -985.2 -1,478.5
ARSR-X-3240 275.6 0.0 -500.4 0.0 -500.4
ARWR-X-2500 -620.3 0.0 -1,058.6 -96.1 -1,058.8
ARHR-X-4000 -2,029.5 0.0 -1,036.9 -317.0 -1,059.2
MSDR-X-5000 1,487.6 0.0 -2,299.2 -5,206.8 -6,445.0
MOBR-X-4000 -864.7 0.0 -1,343.1 -877.9 -1,649.8
Ranch NVB-X-650 -109.1 0.0 -2,317.5 -2,590.1 -3,802.2
NVSB-X-550 -54.0 0.0 -490.4 0.0 -490.4
MTB-X-600 234.2 0.0 -1,039.9 -726.4 -1,324.7
WYB-X-475 -460.8 0.0 -291.5 0.0 -291.5
COB-X-275 461.7 0.0 -1,660.9 -4,806.4 -5,713.1
NMB-X-210 -78.0 0.0 -684.7 0.0 -684.7
SDB-X-600 -1,088.2 0.0 -1,296.4 -373.1 -1,296.5
MOB-X-250 616.5 0.0 -196.4 0.0 -196.4
TXRB-X-400 319.4 0.0 -1,122.0 -832.4 -1,479.5
TXSB-X-300 262.8 0.0 -654.3 0.0 -654.3
Dairy CAD-X-2000 3,280.4 -1.9 -2,222.6 -7,612.8 -8,804.7
WAD-M-300 -2,092.3 0.0 -274.2 0.0 -274.2
WAD-L-1200 -284.4 0.0 -1,279.6 -3,468.4 -4,144.0
IDD-X-1500 3,888.0 0.0 -1,288.6 -2,006.0 -2,694.4
NVD-X-1000 3,146.2 0.0 -327.9 -225.4 -446.9
TXND-X-3800 9,200.1 -762.5 -2,167.1 -9,497.1 -10,511.6
TXCD-X-1500 1,084.7 0.0 -826.6 -1,095.8 -1,563.5
TXED-X-400 -1,334.1 0.0 -107.8 0.0 -107.8
WID-M-180 734.5 0.0 -470.4 0.0 -470.4
WID-L-1700 3,938.9 0.0 -2,579.6 -5,100.3 -6,495.3
OHD-X-400 -788.5 0.0 -754.8 0.0 -754.8
NYWD-M-400 448.5 0.0 -446.6 0.0 -446.6
NYWD-L-1200 1,199.9 0.0 -1,860.5 -4,244.1 -5,259.7
NYCD-M-180 555.0 0.0 -108.3 0.0 -108.3
NYCD-L-800 405.3 0.0 -1,535.4 -2,097.0 -2,945.8
VTD-M-160 -1,200.7 0.0 -58.5 0.0 -58.5
VTD-L-400 -3,034.8 0.0 -653.6 0.0 -653.6
MOGD-X-550 544.3 0.0 -183.3 0.0 -183.3
FLND-X-550 -246.4 0.0 -123.9 0.0 -123.9
FLSD-X-1750 -715.9 0.0 -843.7 -1,574.8 -2,042.5
Table 8: Changes in Ending Cash Balances in 2026 for the Representative Farms for Select Tax Scenarios (in $1,000) (continued).
Scenario 2 Scenario 3 Scenario 4 Scenario 5
Type Farm Ending CashBalance
Generational Transfer
Generational Transfer
Generational Transfer
Generational Transfer
Base (2026) Current Tax Policy STEP Act 99.5% Act STEP + 99.5% Acts

Economic Impact of the STEP Act and 99.5 Percent Act on AFPC’s Representative Farms and Ranches24
Summary and Conclusions
This analysis utilized AFPC’s 94 representative farms to determine the likely impacts of two tax policy propos-als—the Sensible Taxation and Equity Promotion Act and the For the 99.5 Percent Act—on the farm’s ability to cash flow. Under current tax law, an assumed death of the principal operator would impact 2 of 94 representative farms.
Eliminating stepped-up basis in the Sensible Taxation and Equity Promotion Act—even with the $1 million exclu-sion—would impact 92 of 94 representative farms, including all of the ranches and dairies, with an additional tax liability incurred of $726,104 per farm.
Imposing lower estate tax exemption levels from the For the 99.5 Percent Act would impact 41 farms (26 of 64 crop farms, 5 of 10 ranches and 10 of 20 dairies) with an average additional tax liability incurred of $2.17 mil-lion per farm.
The combination of the two tax policy changes would impact 92 representative farms at an average additional tax liability incurred of $1.43 million and an average loss in ending cash balances of all affected farms of $1.59 million in 2026. While the average tax liability declines (relative to imposing the For the 99.5 Percent Act alone), the number of farms impacted climbed from 41 to 92.
References
Ernst and Young. Repealing step-up of basis on inherited assets: Macroeconomic impacts and effects on illustrative family businesses. Prepared for the Family Business Estate Tax Coalition (FBETC), April 2021. Available at: https://www.fb.org/files/FBETC_Stepped-Up_Ba-sis_Report_2021.
Food & Agricultural Policy Research Institute. U.S. Agricultural Market Outlook. University of Missouri, Division of Applied Social Sci-ences, FAPRI-MU Report #01-21, March 2021. Available at: https://www.fapri.missouri.edu/wp-content/uploads/2021/03/2021-U.S.-Agricultural-Market-Outlook-FINAL.pdf.
Internal Revenue Service (IRS). Estate Tax. Available at: https://www.irs.gov/businesses/small-businesses-self-employed/estate-tax [ac-cessed on May 28, 2021].
Jacobson, D.B., B.G. Raub, and B.W. Johnson. The Estate Tax: Ninety Years and Counting. Available at: https://www.irs.gov/pub/irs-soi/nine-tyestate.pdf.
Outlaw, J. L., B. L. Fischer, G. M. Knapek, B. K. Herbst, J. M. Raulston, H. L. Bryant, D. P. Anderson, S. L. Klose and P. Zimmel. Representa-tive Farms Economic Outlook For The January 2021 FAPRI/AFPC Baseline. Agricultural and Food Policy Center, Texas A&M University, College Station, Texas, AFPC Working Paper 21-1, March 2021. Available at: https://www.afpc.tamu.edu/research/publications/files/707/WP-21-01.pdf.
Richardson, James W. and Clair J. Nixon. (1986). Description of FLIPSIM V: a General Firm Level Policy Simulation Model. Texas Agricultural Experiment Station. Available at: https : / /hdl .handle .net /1969 .1 /129137.

25Economic Impact of the STEP Act and 99.5 Percent Act on AFPC’s Representative Farms and Ranches
Appendix A
Representative Farm and Ranch Characteristics

Economic Impact of the STEP Act and 99.5 Percent Act on AFPC’s Representative Farms and Ranches26
2020 CHARACTERISTICS OF PANEL FARMS PRODUCING FEED GRAINS AND OILSEEDS
IAG1350 IAG1350 is a 1,350-acre northwestern Iowa (Webster County) grain farm. The farm is moderate-sized for the region and plants 810 acres of corn and 540 acres of soybeans annually. Sixty-one percent of this farm’s 2020 receipts come from corn production.
IAG3400 This 3,400-acre large-sized grain farm is located in northwestern Iowa (Webster County). It plants 2,040 acres of corn and 1,360 acres of soybeans each year, realizing 60 percent of receipts from corn production.
NEG2400 South-central Nebraska (Dawson County) is home to this 2,400-acre grain farm. This farm plants 1,600 acres to corn and 800 acres to soybeans. The farm splits its corn acres evenly between yellow and white food-grade corn. Sixty-four percent of gross receipts are derived from corn sales.
NEG4500 This is a 4,500-acre grain farm located in south-central Nebraska (Dawson County). This operation plants 3,000 acres of corn and 1,000 acres of soybeans each year. Remaining acres are planted to alfalfa. A portion (25 percent) of the corn acreage is food-grade corn. In 2020, 67 percent of total receipts were generated from corn production.
NDG3000 NDG3000 is a 3,000-acre, moderate-sized, south central North Dakota (Barnes County) grain farm that plants 500 acres of wheat, 1,000 acres of corn, and 1,500 acres of soybeans. One hundred acres are enrolled in the Conservation Reserve Program. The farm generated 39 percent of 2020 receipts from soybean sales and 40 percent from corn sales.
NDG9000 This is an 9,000-acre, large-sized grain farm in south central North Dakota (Barnes County) that grows 4,500 acres of soybeans, 2,500 acres of corn, 1,250 acres of wheat, and 500 acres of barley annually. The remaining acreage is enrolled in the Conservation Reserve Program. Soybean and corn sales accounted for 75 percent of 2020 receipts.
ING1000 Shelby County, Indiana, is home to this 1,000-acre moderate-sized feedgrain farm. This farm annually plants 475 acres of corn, 525 acres of soybeans, and 50 acres of wheat that is double cropped with soybeans. Due to this farm’s proximity to Indianapolis, land development pressures will likely constrain further expansion of this operation. Forty-seven percent of 2020 receipts came from corn sales.
ING3500 ING3500 is a large-sized grain farm located in east central Indiana (Shelby County). This farm plants 1,750 acres to corn and 1,750 acres to soybeans each year. In 2020, 53 percent of gross receipts were generated by corn sales.
OHG700 This is a 700 acre, moderate sized grain farm in north western Ohio (Henry County). This farm planted 105 acres of corn and 280 acres of soybeans in 2020. Because of the wet spring there were 315 acres that were not planted and was taken as preventive planting insurance. Normally would be 350 acres each of corn and soybeans. Twenty-seven percent of 2020 receipts were generated by corn sales.
OHG1500 This is a 1,500 acre, large-sized grain farm in north western Ohio (Henry County). This farm planted 202 acres of corn, 304 acres of soybeans, and 150 acres of wheat in 2020. Because of the wet spring there were 844 acres that were not planted and was taken as preventive planting insurance. Normally would be 675 acres each of corn and soybeans plus the 150 acres of wheat. Thirty-five percent of 2020 receipts were generated by corn sales.

27Economic Impact of the STEP Act and 99.5 Percent Act on AFPC’s Representative Farms and Ranches
2020 PANEL FARMS PRODUCING FEED GRAINS AND OILSEEDS
MOCG2300 MOCG2300 is a 2,300-acre grain farm located in central Missouri (Carroll County) and plants 1,150 acres of corn and 1,150 acres of soybeans annually. This farm is located in the Missouri River bottom, an area with a large concen-tration of livestock production. This farm generated 52 percent of its total revenue from corn and 38 percent from soybeans during 2020.
MOCG4200 This is a 4,200-acre central Missouri (Carroll County) grain farm with 2,310 acres of corn and 1,890 acres of soy-beans. This farm is located in the Missouri River bottom, an area with a large concentration of livestock production. Corn sales accounted for 59 percent of farm receipts and soybeans accounted for 32 percent in 2020.
MONG2300 MONG2300 is a 2,300-acre diversified northwest Missouri grain farm centered in Nodaway County. MONG2300 plants 1,125 acres of corn, 1,125 acres of soybeans, and 50 acres of hay annually. The farm also has a 300-head cow-calf herd. Proximity to the Missouri River increases marketing options for area grain farmers due to easily accessi-ble river grain terminals. In 2020, 46 percent of the farm’s total receipts were from corn, 42 percent from soybeans, and 8 percent from cattle sales.
LANG2500 This is a 2,500-acre northeast Louisiana (Madison Parish) diversified grain farm. This farm harvests 500 acres of rice, 875 acres of soybeans, 375 acres of cotton, and 750 acres of corn. For 2020, 49 percent of farm receipts came from corn and soybean sales.
TNG2500 This is a 2,500-acre, moderate-sized grain farm in West Tennessee (Gibson County). Annually, this farm plants 1,025 acres of corn, 1,475 acres of soybeans, and 375 acres of wheat (planted before soybeans) in a region of Tennessee recognized for the high level of implementation of conservation practices by farmers. For 2020, 39 percent of farm receipts were from sales of corn and 43 percent from soybeans.
TNG5000 West Tennessee (Gibson County) is home to this 5,000-acre, large-sized grain farm. Farmers in this part of Tennes-see are known for their early and continued adoption of conservation practices, including no-till farming. TNG5000 plants 2,500 acres of corn, 500 acres of wheat, 2,500 acres of soybeans (500 of which are double-cropped after wheat). The farm generated 50 percent of its 2020 gross receipts from sales of corn and 35 percent from soybeans.
NCSP2000 A 2,000-acre diversified farm located in southern North Carolina (Bladen County). NCSP2000 plants 400 acres of peanuts, 1,100 acres of corn, and 500 acres of soybeans. Sixty-two percent of receipts for this farm came from corn and soybean sales in 2020; thirty-one percent of receipts came from peanut sales.
NCC2030 This is a 2,000-acre grain farm located on the upper coastal plain of North Carolina (Wayne County). NCC2030 plants 400 acres of corn, 200 acres of wheat, and 1,000 acres of soybeans annually. Corn accounted for 23 percent of this farm’s 2020 receipts, while soybeans accounted for 35 percent.
SCC2000 SCC2000 is a moderate-sized, 2,000-acre grain farm in South Carolina (Orangeburg County) consisting of 800 acres of corn, 550 acres of cotton, 250 acres of peanuts, and 400 acres of soybeans. Thirty-nine percent of the farm’s receipts were from corn sales during 2020.
SCG3500 A 3,500-acre, large-sized South Carolina (Clarendon County) grain farm with 1,800 acres of corn, 750 acres of cotton, 600 acres of peanuts, and 350 acres of soybeans. The farm generated 45 percent of 2020 receipts from corn sales and 5 percent from soybean sales.

Economic Impact of the STEP Act and 99.5 Percent Act on AFPC’s Representative Farms and Ranches28
2020 PANEL FARMS PRODUCING FEED GRAINS AND OILSEEDS
TXNP3450 This is a 3,450-acre diversified grain farm located on the northern High Plains of Texas (Moore County). This farm plants 1206 acres of cotton, 1,294 acres of irrigated corn, 260 acres of irrigated sorghum for seed production, and 432 acres of irrigated wheat annually. Forty-five percent of total receipts are generated from corn sales.
TXNP10880 TXNP10880 is a large-sized diversified grain farm located in the Texas Panhandle (Moore County). This farm an-nually plants 4,454 acres of cotton (3,962 irrigated/492 dryland); 3,962 acres of irrigated corn; 1,272 acres of grain sorghum (530 irrigated for seed production/492 dryland/250 irrigated for commercial use); and 492 acres of dry-land winter wheat. Thirty-eight percent of 2020 cash receipts were derived from corn sales.
TXPG2500 The Texas Panhandle is home to this 2,500-acre farm (Deaf Smith County). Annually, wheat is planted on 534 acres (350 irrigated and 184 dryland), 1,000 acres planted to irrigated corn, 783 acres are planted to cotton (600 irrigat-ed and 183 dryland), and grain sorghum is planted on 183 dryland acres. Fifty-three percent of 2020 cash receipts were generated by corn sales.
TXHG3000 This 3,000-acre grain farm is located on the Blackland Prairie of Texas (Hill County). On this farm, 2,000 acres of corn, 500 acres of cotton, and 500 acres of wheat are planted annually. Grain sales accounted for 65 percent of 2020 receipts with cotton accounting for nineteen percent of sales. Forty beef cows live on 300 acres of improved pasture and contribute approximately two percent of total receipts.
TXWG1600 This 1,600-acre farm is located on the Blackland Prairie of Texas (Williamson County). TXWG1600 plants 800 acres of corn, 300 acres of sorghum, 400 acres of cotton, and 100 acres of winter wheat annually. Additionally, this farm has a 40-head beef cow herd that is pastured on rented ground that cannot be farmed. Grain sales accounted for 54 percent of 2020 receipts with cotton accounting for 29 percent of sales.

29Economic Impact of the STEP Act and 99.5 Percent Act on AFPC’s Representative Farms and Ranches
2020 CHARACTERISTICS OF PANEL FARMS PRODUCING WHEAT
WAW2800 This is a 2,800-acre moderate-sized grain farm in the Palouse of southeastern Washington (Whitman County). It plants 1,840 acres of wheat and 800 acres of dry peas. Disease concerns dictate rotating a minimum acreage of peas to maintain wheat yields. This farm generated 63 percent of 2020 receipts from wheat.
WAW10000 A 10,000-acre, large-sized grain farm in the Palouse of southeastern Washington (Whitman County). Annually, this farm allocates 5,800 acres to wheat and 2,700 acres to dry peas. Diseases that inhibit wheat yield dictate the rota-tion of a minimum acreage of peas. Wheat sales accounted for 61 percent of 2020 receipts.
WAAW5500 South-central Washington (Adams County) is home to this 5,500-acre, large-sized wheat farm. Annually, this farm plants 2,600 acres of wheat in a wheat-fallow rotation. Additionally, 300 acres are enrolled in CRP. In 2020, 91 per-cent of the farm’s income came from wheat.
ORW4500 ORW4500 is a 4,500-acre large-sized grain farm located in northeastern Oregon (Morrow County). This farm plants 2,250 acres annually in a wheat-fallow rotation. Eighty-six percent of this farm’s 2020 total receipts came from wheat sales.
MTW8000 North-central Montana (Chouteau County) is home to this 9,500-acre farm on which 3,500 acres of wheat (1,920 acres of winter wheat, 1,344 acres of spring wheat, and 544 acres of Durham), 590 acres of barley, and 1200 acres of dry peas are planted each year. MTW8000 uses no-till production practices. In 2020, 50 percent of receipts came from wheat.
KSCW2000 South central Kansas (Sumner County) is home to this 2,000-acre, moderate-sized grain farm. KSCW2000 plants 800 acres of winter wheat, 1,100 acres of soybeans, 200 acres of cotton, and 500 acres of corn each year. For 2020, 18 percent of gross receipts came from wheat.
KSCW5300 A 5,300-acre, large-sized grain farm in south central Kansas (Sumner County) that plants 2,385 acres of winter wheat, 1,590 acres of corn, and 3,352 acres of soybeans. Twenty-two percent of this farm’s 2020 total receipts were generated from sales of winter wheat.
KSNW4000 This is a 4,000-acre, moderate-sized northwest Kansas (Thomas County) grain farm. This farm plants 1,200 acres of winter wheat (wheat-fallow rotation), 1,200 acres of corn, and 600 acres of sorghum. This farm generated 33 percent of 2020 receipts from wheat and 57 percent of its receipts from feed grains.
KSNW7000 KSNW7000 is a 7,000-acre, large-sized northwest Kansas (Thomas County) grain farm that annually plants 1,700 acres of winter wheat, 3,770 acres of corn, 700 acres of sorghum, and 130 acres of soybeans. The farm generated 16 percent of receipts from wheat and 74 percent from feed grains during 2020.
COW3000 A 3,000-acre northeast Colorado (Washington County), moderate-sized farm that plants 1,012 acres of winter wheat and 675 acres of corn each year. COW3000 has adopted minimum tillage practices on most of its acres. This farm generated 54 percent of its receipts from wheat and 34 percent from corn.
COW6000 A 6,000-acre, large-sized northeast Colorado (Washington County) wheat farm. It plants 2,000 acres of wheat, 1,000 acres of millet, and 1,000 acres of corn. During 2020, 50 percent of gross receipts came from wheat sales and 23 percent came from corn sales.

Economic Impact of the STEP Act and 99.5 Percent Act on AFPC’s Representative Farms and Ranches30
2020 CHARACTERISTICS OF PANEL FARMS PRODUCING COTTON
TXSP4500 The Texas South Plains (Dawson County) is home to this 4,500-acre, large-sized cotton farm that grows 4,380 acres of cotton (2,880 dryland, 1,500 irrigated), and 120 irrigated acres of peanuts. Cotton sales comprised 76 percent of 2020 receipts.
TXEC5000 This 5,000-acre farm is located on the Eastern Caprock of the Texas South Plains (Crosby County). Annually, 4,700 acres are planted to cotton (2,230 irrigated and 2,470 dryland) and 300 acres to dryland wheat. In 2020, cotton sales accounted for 75 percent of gross receipts.
TXRP3000 TXRP3000 is a 3,000-acre cotton farm located in the Rolling Plains of Texas (Jones County). This farm plants 1,800 acres of cotton and 1,200 acres of winter wheat each year. The area is limited by rainfall, and the farm uses a con-servative level of inputs. Sixty-five percent of 2020 farm receipts came from cotton sales. Fifty head of beef cows generated three percent of farm receipts.
TXMC2500 This 2,500-acre cotton farm is located on the Coastal Plain of southeast Texas (Wharton County). TXMC2500 farms 300 acres of sorghum, 1,455 acres of cotton, and 655 acres of corn. In 2020, cotton sales comprised 57 per-cent of total cash receipts on this operation.
TXCB4000 A 4,000-acre cotton farm located on the Texas Coastal Bend (San Patricio County) that farms 2000 acres of cotton, 1,600 acres of sorghum, and 400 acres of corn annually. Sixty percent of 2020 cash receipts were generated by cot-ton.
TXCB10000 Nueces County, Texas is home to this 10,000-acre farm. Annually, 5,000 acres are planted to cotton, 4,500 acres to sorghum, and 500 acres of corn. Cotton sales accounted for 63 percent of 2020 receipts.
TXVC5500 This 5,500-acre farm is located in the lower Rio Grande Valley of Texas (Willacy County) and plants 2,550 acres to cotton (425 irrigated and 2,125 acres dryland), 2,295 acres to sorghum (170 irrigated and 2,125 dryland), and 255 acres of corn. In 2020, 42 percent of TXVC5500’s cash receipts were generated by cotton sales.
ARNC5000 This 5,000-acre farm is located in northern Arkansas (Mississippi County) and plants 2,500 acres to cotton, 500 acres to corn, 1,000 acres of soybeans, and 1,000 acres to peanuts. In 2020, 44 percent of ARNC5000’s cash re-ceipts were generated by cotton sales.
TNC3000 A 3,000-acre, moderate-sized West Tennessee (Fayette County) cotton farm. TNC3000 consists of 825 acres of cot-ton, 1,375 acres of soybeans, and 800 acres of corn. Cotton accounted for 29 percent of 2020 gross receipts, with corn and soybeans contributing 24 percent and 28 percent, respectively.
TNC4050 TNC4050 is a 4,050-acre, large-sized West Tennessee (Haywood County) cotton farm. This farm plants 1,500 acres of cotton, 1,950 acres of soybeans, 550 acres of corn, and 750 acres of wheat each year. During 2020, cotton sales generated 34 percent of gross receipts.

31Economic Impact of the STEP Act and 99.5 Percent Act on AFPC’s Representative Farms and Ranches
2020 CHARACTERISTICS OF PANEL FARMS PRODUCING COTTON
ALC3500 A 3,500-acre cotton farm located in northern Alabama (Lawrence County) that plants 1,050 acres to cotton, 1,050 acres to corn, 1,400 acres of soybeans and 875 acres to wheat (double cropped with soybeans) annually. This farm was early to adopt no-till cropping practices. Cotton sales accounted for 27 percent of total farm receipts during 2020.
GAC2500 Southwest Georgia (Decatur County) is home to a 2,500-acre cotton farm that plants 1,250 acres to cotton, 800 acres to peanuts, and 450 acres to corn. In 2020, farm receipts were comprised of cotton sales (36 percent), corn (15 percent), and peanut sales (33 percent). The farm also runs a 125-head beef cow herd, generating 3 percent of 2020 receipts.
NCNP1600 A 1,600-acre diversified farm located in northern North Carolina (Edgecombe County). NCNP1600 plants 320 acres of peanuts, 240 acres of corn, 640 acres of cotton, and 400 acres of soybeans. Twenty-three percent of re-ceipts for this farm came from peanut sales in 2020, 38 percent from cotton sales and 23 percent came from corn and soybean sales.
Economic Impact of the STEP Act and 99.5 Percent Act on AFPC’s Representative Farms and Ranches32
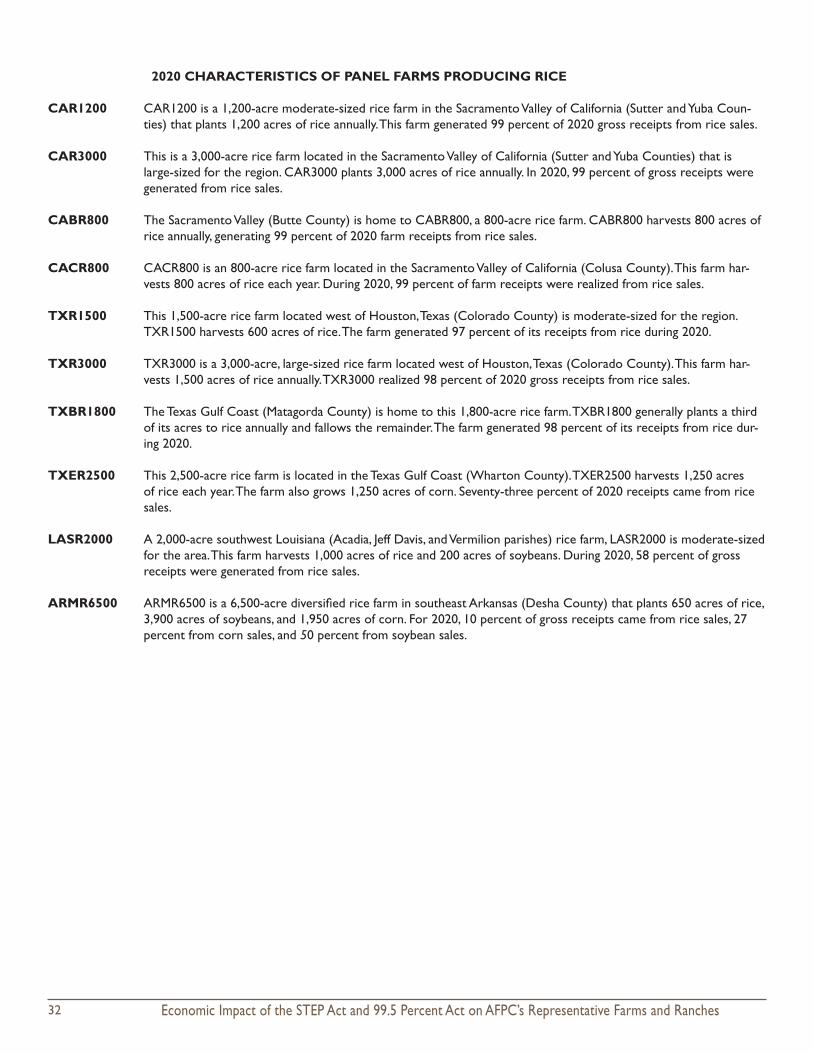
2020 CHARACTERISTICS OF PANEL FARMS PRODUCING RICE
CAR1200 CAR1200 is a 1,200-acre moderate-sized rice farm in the Sacramento Valley of California (Sutter and Yuba Coun-ties) that plants 1,200 acres of rice annually. This farm generated 99 percent of 2020 gross receipts from rice sales.
CAR3000 This is a 3,000-acre rice farm located in the Sacramento Valley of California (Sutter and Yuba Counties) that is large-sized for the region. CAR3000 plants 3,000 acres of rice annually. In 2020, 99 percent of gross receipts were generated from rice sales.
CABR800 The Sacramento Valley (Butte County) is home to CABR800, a 800-acre rice farm. CABR800 harvests 800 acres of rice annually, generating 99 percent of 2020 farm receipts from rice sales.
CACR800 CACR800 is an 800-acre rice farm located in the Sacramento Valley of California (Colusa County). This farm har-vests 800 acres of rice each year. During 2020, 99 percent of farm receipts were realized from rice sales.
TXR1500 This 1,500-acre rice farm located west of Houston, Texas (Colorado County) is moderate-sized for the region. TXR1500 harvests 600 acres of rice. The farm generated 97 percent of its receipts from rice during 2020.
TXR3000 TXR3000 is a 3,000-acre, large-sized rice farm located west of Houston, Texas (Colorado County). This farm har-vests 1,500 acres of rice annually. TXR3000 realized 98 percent of 2020 gross receipts from rice sales.
TXBR1800 The Texas Gulf Coast (Matagorda County) is home to this 1,800-acre rice farm. TXBR1800 generally plants a third of its acres to rice annually and fallows the remainder. The farm generated 98 percent of its receipts from rice dur-ing 2020.
TXER2500 This 2,500-acre rice farm is located in the Texas Gulf Coast (Wharton County). TXER2500 harvests 1,250 acres of rice each year. The farm also grows 1,250 acres of corn. Seventy-three percent of 2020 receipts came from rice sales.
LASR2000 A 2,000-acre southwest Louisiana (Acadia, Jeff Davis, and Vermilion parishes) rice farm, LASR2000 is moderate-sized for the area. This farm harvests 1,000 acres of rice and 200 acres of soybeans. During 2020, 58 percent of gross receipts were generated from rice sales.
ARMR6500 ARMR6500 is a 6,500-acre diversified rice farm in southeast Arkansas (Desha County) that plants 650 acres of rice, 3,900 acres of soybeans, and 1,950 acres of corn. For 2020, 10 percent of gross receipts came from rice sales, 27 percent from corn sales, and 50 percent from soybean sales.
33Economic Impact of the STEP Act and 99.5 Percent Act on AFPC’s Representative Farms and Ranches
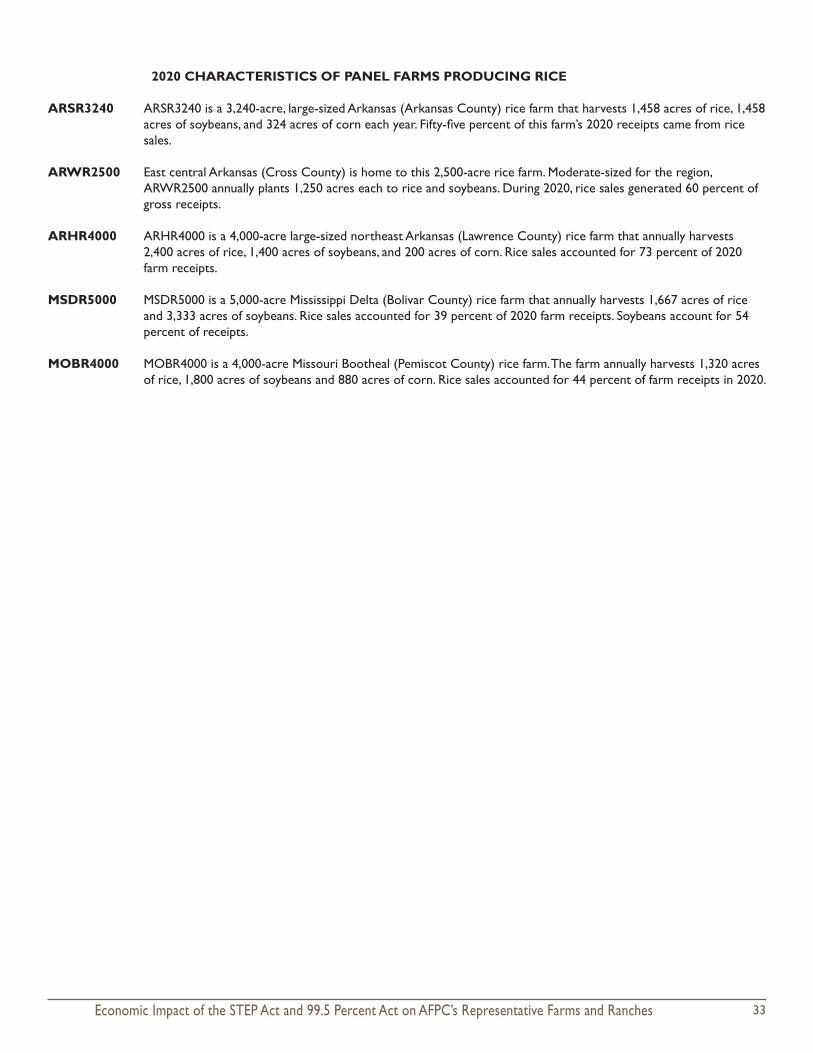
2020 CHARACTERISTICS OF PANEL FARMS PRODUCING RICE
ARSR3240 ARSR3240 is a 3,240-acre, large-sized Arkansas (Arkansas County) rice farm that harvests 1,458 acres of rice, 1,458 acres of soybeans, and 324 acres of corn each year. Fifty-five percent of this farm’s 2020 receipts came from rice sales.
ARWR2500 East central Arkansas (Cross County) is home to this 2,500-acre rice farm. Moderate-sized for the region, ARWR2500 annually plants 1,250 acres each to rice and soybeans. During 2020, rice sales generated 60 percent of gross receipts.
ARHR4000 ARHR4000 is a 4,000-acre large-sized northeast Arkansas (Lawrence County) rice farm that annually harvests 2,400 acres of rice, 1,400 acres of soybeans, and 200 acres of corn. Rice sales accounted for 73 percent of 2020 farm receipts.
MSDR5000 MSDR5000 is a 5,000-acre Mississippi Delta (Bolivar County) rice farm that annually harvests 1,667 acres of rice and 3,333 acres of soybeans. Rice sales accounted for 39 percent of 2020 farm receipts. Soybeans account for 54 percent of receipts.
MOBR4000 MOBR4000 is a 4,000-acre Missouri Bootheal (Pemiscot County) rice farm. The farm annually harvests 1,320 acres of rice, 1,800 acres of soybeans and 880 acres of corn. Rice sales accounted for 44 percent of farm receipts in 2020.

Economic Impact of the STEP Act and 99.5 Percent Act on AFPC’s Representative Farms and Ranches34
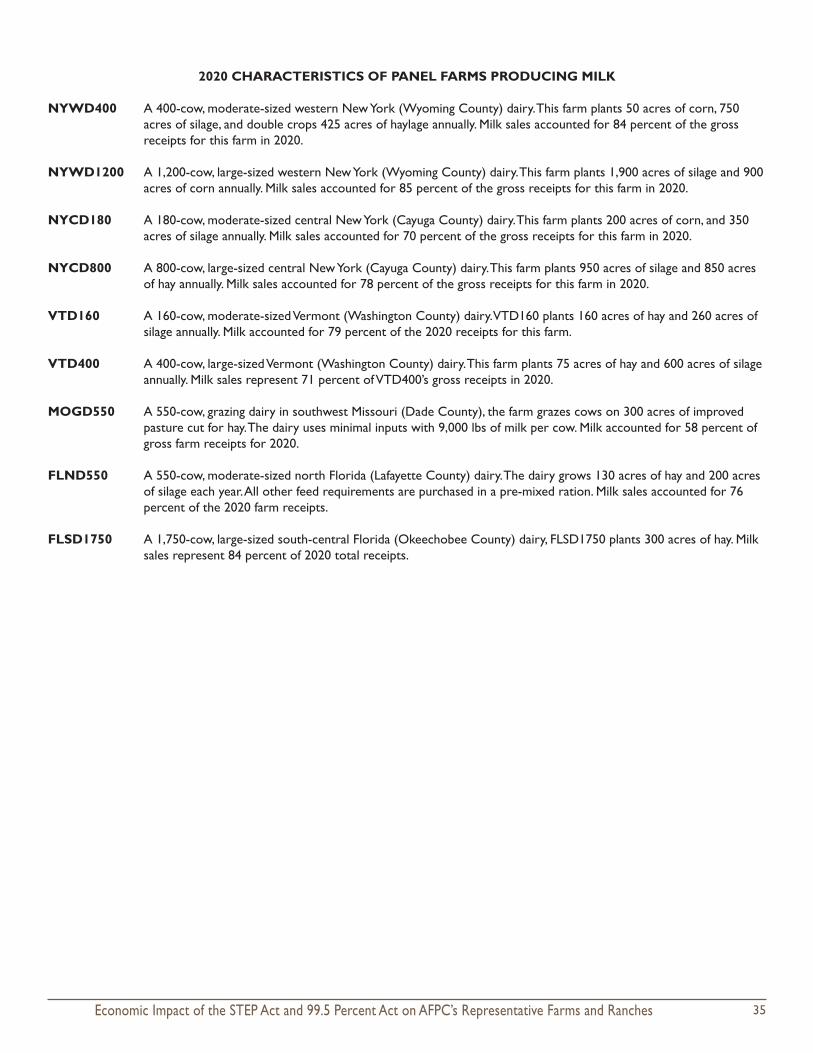
2020 CHARACTERISTICS OF PANEL FARMS PRODUCING MILK
CAD2000 A 2,000-cow, large-sized central California (Tulare County) dairy, the farm plants 975 acres of hay/silage for which it employs custom harvesting. Milk sales generated 81 percent of 2020 total receipts.
WAD300 A 300-cow, moderate-sized northern Washington (Whatcom County) dairy. This farm plants 250 acres of silage and generated 79 percent of its 2020 gross receipts from milk sales.
WAD1200 A 1,200-cow, large-sized northern Washington (Whatcom County) dairy. This farm plants 850 acres for silage annu-ally. During 2020, 80 percent of this farm’s gross receipts came from milk.
IDD1500 A 1,500-cow, large-sized dairy located in the Magic Valley of Idaho (Twin Falls County). This farm plants 550 acres of corn silage and 300 acres of hay annually. Milk sales account for 79 percent of 2020 gross receipts.
NVD1000 A 1,000-cow, moderate-sized Nevada (Churchill County) dairy. This farm plants 475 acres of hay and 200 acres of corn silage annually. Milk sales accounted for 85 percent of NVD1000’s gross receipts for 2020.
TXND3800 A 3,800-cow, large-sized dairy located in the South Plains of Texas (Bailey County). This farm plants 1,920 acres of corn silage annually. Milk sales account for 83 percent of 2020 gross receipts.
TXCD1500 A 1,500-cow, large-sized central Texas (Erath County) dairy, TXCD1500 plants 366 acres of silage and 500 acres of hay annually. During 2020, milk sales accounted for 85 percent of receipts.
TXED400 A 400-cow, moderate-sized northeast Texas (Hopkins County) dairy. This farm has 200 acres of hay. During 2020, milk sales represented 77 percent of annual receipts.
WID180 A 180-cow, moderate-sized eastern Wisconsin (Winnebago County) dairy, the farm plants 120 acres of silage, 50 acres for hay, 320 acres of corn, 100 acres of wheat, and 180 acres of soybeans. Milk constituted 64 percent of this farm’s 2020 receipts.
WID1700 A 1,700-cow, large-sized eastern Wisconsin (Winnebago County) dairy, the farm plants 850 acres of haylage, 1,000 acres of silage, 75 acres of soybeans, 150 acres of wheat, and 1,200 acres of corn. Milk sales comprised 80 percent of the farm’s 2020 receipts.
OHD350 A 350-cow, moderate-sized central Ohio (Gonzalez County) dairy, the farm plants 575 acres of silage, 200 acres of corn, 50 acres of soybeans, and 50 acres of wheat. Milk sales comprised 73 percent of the farm’s 2020 receipts.
35Economic Impact of the STEP Act and 99.5 Percent Act on AFPC’s Representative Farms and Ranches
2020 CHARACTERISTICS OF PANEL FARMS PRODUCING MILK
NYWD400 A 400-cow, moderate-sized western New York (Wyoming County) dairy. This farm plants 50 acres of corn, 750 acres of silage, and double crops 425 acres of haylage annually. Milk sales accounted for 84 percent of the gross receipts for this farm in 2020.
NYWD1200 A 1,200-cow, large-sized western New York (Wyoming County) dairy. This farm plants 1,900 acres of silage and 900 acres of corn annually. Milk sales accounted for 85 percent of the gross receipts for this farm in 2020.
NYCD180 A 180-cow, moderate-sized central New York (Cayuga County) dairy. This farm plants 200 acres of corn, and 350 acres of silage annually. Milk sales accounted for 70 percent of the gross receipts for this farm in 2020.
NYCD800 A 800-cow, large-sized central New York (Cayuga County) dairy. This farm plants 950 acres of silage and 850 acres of hay annually. Milk sales accounted for 78 percent of the gross receipts for this farm in 2020.
VTD160 A 160-cow, moderate-sized Vermont (Washington County) dairy. VTD160 plants 160 acres of hay and 260 acres of silage annually. Milk accounted for 79 percent of the 2020 receipts for this farm.
VTD400 A 400-cow, large-sized Vermont (Washington County) dairy. This farm plants 75 acres of hay and 600 acres of silage annually. Milk sales represent 71 percent of VTD400’s gross receipts in 2020.
MOGD550 A 550-cow, grazing dairy in southwest Missouri (Dade County), the farm grazes cows on 300 acres of improved pasture cut for hay. The dairy uses minimal inputs with 9,000 lbs of milk per cow. Milk accounted for 58 percent of gross farm receipts for 2020.
FLND550 A 550-cow, moderate-sized north Florida (Lafayette County) dairy. The dairy grows 130 acres of hay and 200 acres of silage each year. All other feed requirements are purchased in a pre-mixed ration. Milk sales accounted for 76 percent of the 2020 farm receipts.
FLSD1750 A 1,750-cow, large-sized south-central Florida (Okeechobee County) dairy, FLSD1750 plants 300 acres of hay. Milk sales represent 84 percent of 2020 total receipts.
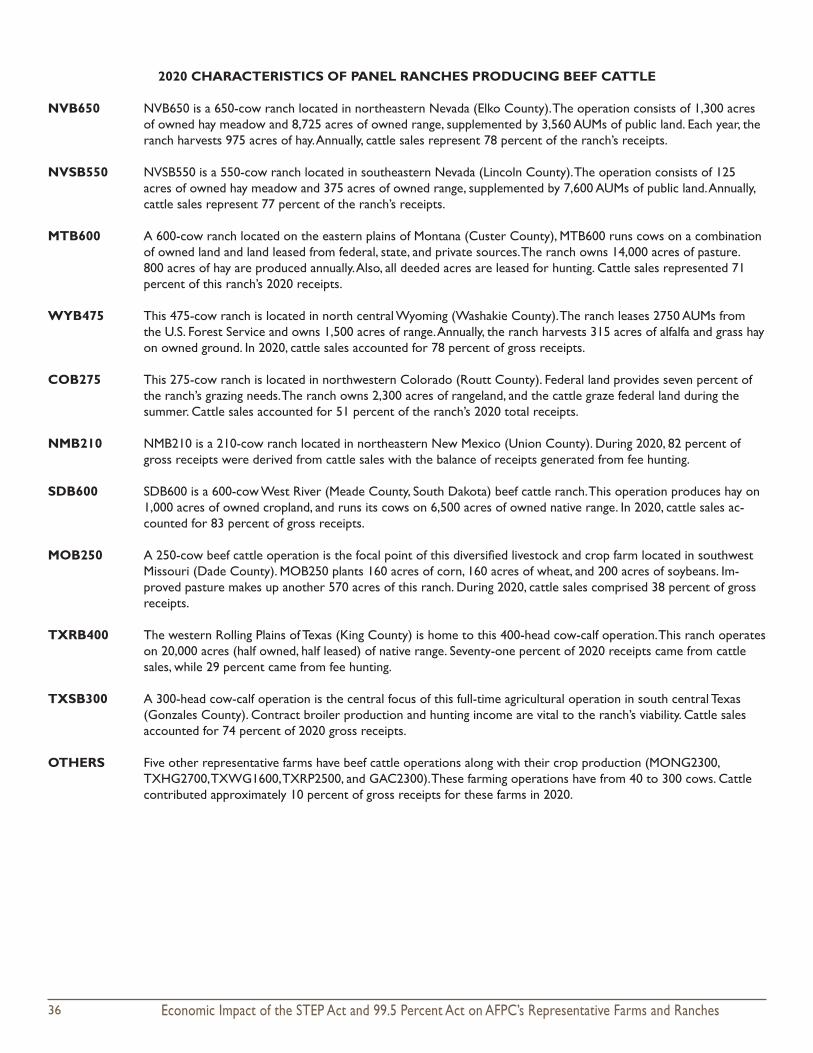
Economic Impact of the STEP Act and 99.5 Percent Act on AFPC’s Representative Farms and Ranches36
2020 CHARACTERISTICS OF PANEL RANCHES PRODUCING BEEF CATTLE
NVB650 NVB650 is a 650-cow ranch located in northeastern Nevada (Elko County). The operation consists of 1,300 acres of owned hay meadow and 8,725 acres of owned range, supplemented by 3,560 AUMs of public land. Each year, the ranch harvests 975 acres of hay. Annually, cattle sales represent 78 percent of the ranch’s receipts.
NVSB550 NVSB550 is a 550-cow ranch located in southeastern Nevada (Lincoln County). The operation consists of 125 acres of owned hay meadow and 375 acres of owned range, supplemented by 7,600 AUMs of public land. Annually, cattle sales represent 77 percent of the ranch’s receipts.
MTB600 A 600-cow ranch located on the eastern plains of Montana (Custer County), MTB600 runs cows on a combination of owned land and land leased from federal, state, and private sources. The ranch owns 14,000 acres of pasture. 800 acres of hay are produced annually. Also, all deeded acres are leased for hunting. Cattle sales represented 71 percent of this ranch’s 2020 receipts.
WYB475 This 475-cow ranch is located in north central Wyoming (Washakie County). The ranch leases 2750 AUMs from the U.S. Forest Service and owns 1,500 acres of range. Annually, the ranch harvests 315 acres of alfalfa and grass hay on owned ground. In 2020, cattle sales accounted for 78 percent of gross receipts.
COB275 This 275-cow ranch is located in northwestern Colorado (Routt County). Federal land provides seven percent of the ranch’s grazing needs. The ranch owns 2,300 acres of rangeland, and the cattle graze federal land during the summer. Cattle sales accounted for 51 percent of the ranch’s 2020 total receipts.
NMB210 NMB210 is a 210-cow ranch located in northeastern New Mexico (Union County). During 2020, 82 percent of gross receipts were derived from cattle sales with the balance of receipts generated from fee hunting.
SDB600 SDB600 is a 600-cow West River (Meade County, South Dakota) beef cattle ranch. This operation produces hay on 1,000 acres of owned cropland, and runs its cows on 6,500 acres of owned native range. In 2020, cattle sales ac-counted for 83 percent of gross receipts.
MOB250 A 250-cow beef cattle operation is the focal point of this diversified livestock and crop farm located in southwest Missouri (Dade County). MOB250 plants 160 acres of corn, 160 acres of wheat, and 200 acres of soybeans. Im-proved pasture makes up another 570 acres of this ranch. During 2020, cattle sales comprised 38 percent of gross receipts.
TXRB400 The western Rolling Plains of Texas (King County) is home to this 400-head cow-calf operation. This ranch operates on 20,000 acres (half owned, half leased) of native range. Seventy-one percent of 2020 receipts came from cattle sales, while 29 percent came from fee hunting.
TXSB300 A 300-head cow-calf operation is the central focus of this full-time agricultural operation in south central Texas (Gonzales County). Contract broiler production and hunting income are vital to the ranch’s viability. Cattle sales accounted for 74 percent of 2020 gross receipts.
OTHERS Five other representative farms have beef cattle operations along with their crop production (MONG2300, TXHG2700, TXWG1600, TXRP2500, and GAC2300). These farming operations have from 40 to 300 cows. Cattle contributed approximately 10 percent of gross receipts for these farms in 2020.
37Economic Impact of the STEP Act and 99.5 Percent Act on AFPC’s Representative Farms and Ranches
Appendix B
Representative Farm Panel Members and Facilitators

Economic Impact of the STEP Act and 99.5 Percent Act on AFPC’s Representative Farms and Ranches38
FEED GRAIN FARMS
Indiana
Facilitators Mr. Scott Gabbard - Extension Educator, Shelby County, Purdue Cooperative Extension Panel Participants
Mr. David Brown Mr. Kevin Carson Mr. Gary Everhart Mr. Andy Fix Mr. Jason & Dan Foltz Ms. Carmen Hawk Mr. Darrell Linville Mr. Gary Robards Mr. Ken Simpson Ms. Angie Steinbarger Mr. Doug Theobald Mr. Jeremy Weaver
Iowa
Facilitators Mr. Jerry Chizek - County Extension Director, Webster County Panel Participants
Mr. Doug Adams Mr. Brad Black Mr. Dean Black Mr. Perry Black Mr. A.J. Blair Mr. Gregg Hora Mr. Tyler Lane Mr. Jay Lynch Mr. Steve Peterson Mr. Doug Stanek Mr. Jason Stanek Mr. Brent Wells Mr. Kent Wuebker Mr. Loren Wuebker
Missouri - Central
Facilitators Mr. Parman Green Panel Participants
Mr. Joe Brockmeier Mr. Michael Brockmeier Mr. Kevin Casner Mr. Mark Casner Mr. Kyle Durham Mr. Dennis Germann Mr. Todd Gibson Mr. Dale Griffith Mr. Jack Harriman Mr. Todd Hensiek Mr. Mike Hisle Mr. Preston Hisle Mr. Glenn Kaiser Mr. Marc Kaiser Mr. David Kipping Mr. Robert Kipping Mr. Craig Linneman Mr. Mike Ritchhart Mr. James Wheeler
Missouri - Northwest
Facilitators Mr. Peter Zimmel - FAPRI, University of Missouri Panel Participants
Mr. Terry Ecker Mr. Curtis Lewis Mr. Russell Miller Mr. Matt Rosenbohm Mr. Nick Rosenbohm Mr. Andrew Stoll
39Economic Impact of the STEP Act and 99.5 Percent Act on AFPC’s Representative Farms and Ranches
FEED GRAIN FARMS (CONTINUED)
Nebraska - Central
Facilitators Ms. Sarah Sivits Mr. Bruce Treffer - Extension Educator, Dawson County Panel Participants
Mr. Jim Aden Mr. Rob Anderson Mr. Bart Beattie Mr. Greg Hueftle Mr. Pat Luther Mr. Tim Maline Mr. Clark McPheeters Mr. Scott McPheeters Mr. Cody Peden Mr. Rod Reynolds Mr. Dave Rowe Mr. Paul Stieb Mr. Dan Strauss
North Dakota
Facilitators Mr. Randy Grueneich - County Extension Agent, North Dakota State University Dr. Bryon Parman - Extension Associate-Farm Management, North Dakota State University Panel Participants
Mr. John Robert Anderson Mr. Eric Broten Mr. Jim Broten Mr. Wade Bruns Mr. Mike Clemens Mr. Mark Formo Mr. Leland Guscette Mr. Rob Hanson Mr. Jason Haugen Mr. Charlie Kreidelcamp Mr. Greg Shanenko Mr. Anthony Thilmony
Ohio
Facilitators Mr. Ben Brown - Assistant Professor Panel Participants
Mr. Dean Bixel Mr. Scott Conrad Mr. Mark Drewes Mr. Matt Eggers Mr. Todd Hesterman Mr. Tim Holbrook Mr. Eric Johnson Mr. Jeremy Tedrow Mr. Kevin Thierry
Ohio - Napoleon
Facilitators Mr. Ben Brown - Assistant Professor Panel Participants
Mr. Dean Bixel Mr. Scott Conrad Mr. Mark Drewes Mr. Matt Eggers Mr. Todd Hesterman Mr. Tim Holbrook Mr. Eric Johnson Mr. Jeremy Tedrow Mr. Kevin Thierry

Economic Impact of the STEP Act and 99.5 Percent Act on AFPC’s Representative Farms and Ranches40
FEED GRAIN FARMS (CONTINUED)
South Carolina
Facilitators Mr. Scott Mickey Dr. Nathan Smith Panel Participants
Mr. Neal Baxley Ms. Vikki Brogdon Mr. Chris Cogdill Mr. Harry DuRant Mr. Sam DuRant Mr. Jason Gamble Mr. Steven Gamble Mr. Barry Hutto Mr. Tommy Lee Mr. Joe McKeower Mr. John Michael Parimuha
Tennessee - Trenton
Facilitators Mr. Jeff Lannom - Extension Agent & County Director, Weakley County Mr. Chris Narayanan Mr. Philip Shelby - Extension Agent, Gibson County Mr. Tim Smith - County Extension Agent, Obion County Panel Participants
Mr. Steven Agee Mr. Brent Baier Mr. Kenneth Barnes Mr. Randy Boals Mr. Mike Brundige Mr. John Chester Mr. Kaleb Dinwiddie Mr. Mike Freeman Mr. Bobby Garner Mr. Derek Griffin Mr. Brent Griggs Mr. Gary Hall Mr. Rob Holman Mr. Josh Little Mr. Todd Littleton Mr. Jason Luckey Mr Ben Moore Mr. Scotty Ogg Mr. David Oliver Mr. Eric Owen Mr. John Parrish Mr. Eric Partee Mr. Hedrick Shoaf Mr. Kevin Smethwick Mr. Keith Steele Mr. Seth Taylor Mr. James Wall Mr. Jody Wright Mr. Jay Yeargin
Texas - Northern Blackland Prairie
Facilitators Mr. Zach Davis - County Extension Agent, Hill County Panel Participants
Mr. Chad Kaska Mr. Todd Kimbrell, Jr. Mr. Chad Radke Mr. John Sawyer

41Economic Impact of the STEP Act and 99.5 Percent Act on AFPC’s Representative Farms and Ranches
FEED GRAIN FARMS (CONTINUED)
Texas - Northern High Plains
Facilitators Mr. Marcel Fischbacher - County Extension Agent, Moore County Panel Participants
Mr. Tommy Cartrite Mr. Brent Clark Mr. Justin Garrett Mr. Kelly Hays Mr. Casey Kimbrell Mr. Tom Moore Mr. Chandler Preston Mr. Jon Reznik Mr. Stan Spain Mr. Darren Stallwitz Mr. Dee Vaughan Ms. Linda Williams
Texas - Panhandle
Facilitators Mr. Rick Auckerman - County Extension Agent, Texas Cooperative Extension Panel Participants
Mr. Michael Carlson Mr. Roy Carlson Mr. Greg Chavez Mr. Steve Hoffman Mr. Bob Meyer Mr. Tom Schlabs
Texas - Southern Blackland Prairie
Facilitators Mr. Cooper Terrill - County Extension Agent, Williamson County Panel Participants
Mr. Terry Pekar Mr. Herbert Raesz Mr. Ken Seggern
Texas - Southwest
Facilitators Mr. Samantha Korzekwa - County Extension Agent, Uvalde County Panel Participants
Mr. Jimmy Carnes Mr. Ralph Hesse Mr. Mark Landry Mr. Danny Parker

Economic Impact of the STEP Act and 99.5 Percent Act on AFPC’s Representative Farms and Ranches42
WHEAT FARMS
Colorado
Facilitators Mr. John Deering - Ag Business Agent, North Star Bank Mr. Dennis Kaan - Director, Golden Plains Area Extension, Colorado State University Panel Participants
Mr. Rollie Deering Mr. Ward Deering Mr. David Foy Mr. Dale Hansen Mr. William Harman Mr. Barry Hinkhouse Mr. Terry Kuntz Mr. Shane Leoffler Mr. Dave Lillich Mr. Max Olsen Ms. Sara Olsen Mr. Ken Remington Mr. Craig Saxton Mr. Calvin Schaffert Mr. Harlan Schaffert Mr. Dave Wagers Mr. John Wright
Kansas - Northwest
Facilitators Dr. Dan O’Brien - Area Extension Director, Kansas State University Mr. Mark Wood - Extension Agricultural Economist, Kansas Farm Mgmt. Association Panel Participants
Mr. Tanner Brown Mr. Steve Busse Rich Calliham Mr. Richard Calliham Mr. Sam Crouse Mr. Aaron Horinek Mr. Lee Juenemann Mr. Brian Laufer Mr. Lance Leebrick Mr. Steve Schertz
Kansas - South Central
Facilitators Mr. Randy Hein - County Extension Agent, Sumner County Mr. Zach Simon - County Extension Agent, Sedgwick County
Panel Participants
Mr. Colton Day Mr. Dennis Gruenbacher Mr. Doug Hisken Mr. Aaron Lange Mr. Kent Ott Mr. Steve Schmidt Mr. Mike Slack Mr. Nick Steffen Troy & Julia Strnad Mr. Tim Turek Mr. Robert White
Montana - North Central
Facilitators Mr. Lochiel Edwards Panel Participants
Mr. Darin Arganbright Mr. Steve Bahnmiller Mr. Duane Beirwagen Mr. Will Roehm Mr. Dan Works

43Economic Impact of the STEP Act and 99.5 Percent Act on AFPC’s Representative Farms and Ranches
WHEAT FARMS (CONTINUED)
Oregon - North Central
Facilitators Jon Farquharson Panel Participants
Mr. Dana Heideman Mr. Bill Jepsen Mr. Joe McElligott Mr. Craig Miles Mr. Eric Orem Mrs. Shannon Rust Mr. Tim and Shannon Rust
Washington
Facilitators Mr. Aaron Esser - County Director, WSU Extension Panel Participants
Mr. Trevor Jantz Mr. Ron Jirava
Mr. Mike Miller Mr. Justin Simonson Mr. Travis Simonson Mr. Tim Smith Mr. Traven Smith Mr. Steve Taylor
Washington - Palouse
Facilitators Dr. Janet Schmidt - Extension Faculty, Washington State University Mr. Steve Van Vleet - Extension Agronomist, Washington State University Panel Participants
Mr. Ben Barstow Mr. Asa Clark Mr. Gavin Clark Mr. Scot Cocking Mr. Aaron Gfeller Mr. David Harlow Ms. Kenda Hergert Mr. Dean Kinzer Ms. Heidi Kopf Mr. Brian Largent Mr. Gary Largent Mr. Michael Largent Mr. Steve Mader Ms. Amy McKay Mr. Clark Miller Mr. Bruce Nelson Mr. Chris Schultheis Mr. David Swannack Mr. Steve Teade Mr. Jon Whitman

Economic Impact of the STEP Act and 99.5 Percent Act on AFPC’s Representative Farms and Ranches44
COTTON FARMS
Alabama
Panel Participants
Mr. James Blythe Mr. Paul Clark Mr. Jarred Darnell Dr. Steve Ford Mr. William Lee Ms. Larkin Martin
Arkansas
Facilitators Mr. Ray Benson Mr. Ronnie Kennett Dr. Brad Watkins - Research Assistant Professor, U. of Arkansas Cooperative Extension Panel Participants
Mr. Chad Costner Mr. Heath Donner Mr. Todd Edwards Mr. Cole Hawkins
Mr. Justin Hawkins Mr. Kenny Jackson Mr. David Wildy
Georgia - Southwest
Facilitators Ms. Nan Bostick - County Extension Coordinator, Decatur County Mr. Cody Powell Dr. Adam Rabinowitz Panel Participants
Mr. Andy Bell Mr. Jerry Jones Mr. Greg Mims Mr. Willard Mims Mr. Brad Thompson Mr. Raymond Thompson
North Carolina
Facilitators Mr. Daryl Anderson - County Extension Agent
Dr. Blake Brown Mr. Gary Bullen Mr. Kevin Johnson - County Extension Director, Wayne County Panel Participants
Mr. Landis Brantham, Jr. Mr. Michael Gray Mr. Willie Howell Mr. David B. Mitchell, Sr. Mr. Danny C. Pierce Mr. Craig West Mr. Bryant Worley

45Economic Impact of the STEP Act and 99.5 Percent Act on AFPC’s Representative Farms and Ranches
COTTON FARMS (CONTINUED)
South Carolina
Facilitators Mr. Jonathan Croft Mr. Scott Mickey Dr. Nathan Smith Panel Participants
Mr. Jimmie Griner Mr. Dean Hutto Mr. John McLaurin Mr. David Tindal Mr. Landrum WeathersTennessee
Facilitators Mr. Walter Battle - Co-Director, Haywood County Extension Mr. Chuck Danehower - Extension Area Specialist, Farm Management Mr. Chris Narayanan Mr. Tyson Raper Ms. Lindsay Stephenson-Griffin Mr. Jeff Via - County Extension Director, Fayette County Panel Participants
Mr. Alex Armour Mr. Chuck Dacus Mr. R. Morris English, Jr. Mr. Willie German Mr. Lee Graves Mr. Dewayne Hendrix Mr. Ed Karcher Mr. Rob Karcher Mr. Allen King Mr. John King Mr. Travis Lonon Mr. Kinney McRae Mr. Hassell Smith Mr. Ronald Woods
Texas - Coastal Bend
Facilitators Mr. Bobby McCool - County Extension Agent, San Patricio County and Aransas County
Mr. Mark Miller - Chief Operations Officer, Texas AgFinance Mr. Jeff Nunley - Executive Director, South Texas Cotton & Grain Association Mr. Jason Ott - County Extension Agent, Nueces County Mr. John Parker - Vice President, Texas AgFinance Panel Participants
Mr. Travis Adams Mr. Marvin Beyer, Jr. Mr. Colin Chopelas Mr. Jimmy Dodson Mr. Jon Gwynn Mr. Darrell Lawhon Mr. Larry McNair Mr. Andrew Miller Mr. Toby Robertson Mr. Darby Salge Mr. David Weaver Mr. Jon Whatley

Economic Impact of the STEP Act and 99.5 Percent Act on AFPC’s Representative Farms and Ranches46
COTTON FARMS (CONTINUED)
Texas - Eastern Caprock
Facilitators Ms. Caitlin Jackson Panel Participants
Mr. Lloyd Arthur Mr. Brooks Ellison Mr. Mark Schoepf Mr. Conner Wilmeth
Texas - Mid Coast
Facilitators Mr. Jeff Nunley - Executive Director, South Texas Cotton & Grain Association Mr. Jimmy Roppolo - General Manager, United Ag Panel Participants
Mr. Daniel Gavranovic Mr. Duane Lutringer Mr. Cedric Popp Mr. Michael Popp Mr. Darrell Schoeneberg Mr. Mike Watz
Texas - Rio Grande Valley
Facilitators Mr. Matthew Rodriguez - County Extension Agent Panel Participants
Mr. Jerry Chappell Mr. Joe Pennington Mr. Spence Pennington Mr. Ivan Salazar Mr. Zachary Swanberg Mr. Mark Willis
Texas - Rolling Plains
Facilitators Mr. Steven Estes - County Extension Agent, Texas AgriLife Extension Panel Participants
Mr. Larry Lytle Mr. Michael McLellan Mr. Cody Roberts Mr. Brian Sandbothe Mr. Mike Sloan Mr. Dale Spurgin Mr. Rick Vickers Mr. Ferdie Walker Mr. Terry White
Texas - Southern High Plains
Facilitators Mr. Gary Roschetzky - County Extension Agent, Dawson County Panel Participants
Mr. Terry Coleman Mr. Will Cozart Mr. Kirk Tidwell Mr. Johnny Ray Todd Mr. Donald Vogler Mr. David Warren

47Economic Impact of the STEP Act and 99.5 Percent Act on AFPC’s Representative Farms and Ranches
RICE FARMS
Arkansas
Facilitators Mr. Chuck Capps Mr. Steve Kelley Mr. Steven Stone Dr. Brad Watkins - Research Assistant Professor, U. of Arkansas Cooperative Extension Mr. Gus Wilson Panel Participants
Mr. John Gates Mr. Andrew Gill Mr. Andy Gill Mr. Tad Keller Mr. Joe Mencer Mr. Matt Miles Mr. Jim Whitaker Mr. Sam Whitaker
Arkansas - East Central-Arkansas County
Facilitators Mr. Bill Free - Riceland Foods, Inc. Dr. Brad Watkins - Research Assistant Professor, U. of Arkansas Cooperative Extension Panel Participants
Mr. Brandon Bauman Mr. Derek Bohanan Mr. Monty Bohanan Mr. Dusty Hoskyn Mr. Stephen Hoskyn Mr. David Jessup Mr. Garth Jessup
Arkansas - East Central-Cross County
Facilitators Dr. Brad Watkins - Research Assistant Professor, U. of Arkansas Cooperative Extension Mr. Rick Wimberley - County Extension Agent - Staff Chair, U. of Arkansas Cooperative Panel Participants
Mr. Corbin Brown Mr. John Cooper Mr. Byron Holmes, Jr. Mr. Bryan Moery Mr. Roger Pohlner
Arkansas - Northeast-Lawrence County
Facilitators Mr. Michael Andrews Mr. Bryce Baldridge Ms. Courtney Sisk Dr. Brad Watkins - Research Assistant Professor, U. of Arkansas Cooperative Extension Panel Participants
Mr. Greg Baltz Mr. Jeremy Baltz Mr. Ricky Burris Mr. Ronald Cavenaugh Mr. Doug Cox Mr. Bruce Manning Mr. Joe Richardson Mr. Vic Stone

Economic Impact of the STEP Act and 99.5 Percent Act on AFPC’s Representative Farms and Ranches48
RICE FARMS (CONTINUED)
California - Butte County
Facilitators Dr. Luis Espino Mr. Tim Johnson - President and CEO, California Rice Commission Panel Participants
Mr. Seth Fiack Mr. Imran Khan Mr. Peter Rystrom Mr. Josh Sheppard Mr. Derek Sohnrey
California - Colusa County
Facilitators Dr. Luis Espino Mr. Tim Johnson - President and CEO, California Rice Commission Panel Participants
Mr. Don Bransford Ms. Kim Gallagher Mr. Leo LaGrande Mr. Charles Marsh Mr. Alex Struckmeyer
California - Sutter County
Facilitators Ms. Whitney Brim-DeForest - UCCE Farm Advisor Mr. Tim Johnson Panel Participants
Mr. Bard Anderson Mr. Paul Baggett Mr. Tom Butler Mr. Mike DeWit Mr. Ned Lemenager Mr. Charley Mathews Mr. Jon Munger Mr. Rick Nelson Mr. Michael Rue Mr. Don Traynham Mr. Rob Van Dyke Ms. Nicole Van Vleck
Louisiana - Northeast
Facilitators Mr. Scott Franklin Panel Participants
Mr. Ed Greer Mr. Heath Herring Mr. Jim Lingo Mr. Jon Michael Livingston Mr. John Owen Mr. Russ Ratcliff
Louisiana - Southwest-Acadiana
Panel Participants
Mr. Al Cramer Mr. Tommy Faulk Mr. David Lacour Mr. Alan Lawson Mr. Jackie Loewer Mr. Micah Loewer Mr. Christian Richard Mr. Fred Zaunbrecher

49Economic Impact of the STEP Act and 99.5 Percent Act on AFPC’s Representative Farms and Ranches
RICE FARMS (CONTINUED)
Mississippi - Cleveland
Facilitators Dr. Larry Falconer - Extension Professor Mr. Craig hankins - Extension Agent Panel Participants
Mr. Michael Aguzzi Mr. Austin Davis Mr. Gary Fioranelli Mr. Randy Howarth Mr. Kirk Satterfield
Missouri
Facilitators Mr. Trent Haggard - Director, Fisher Delta Research Center Panel Participants
Mr. John Anderson Mr. Alex Clark Mr. Rance Daniels Mr. Russ Hoggard Mr. Jim Priggel Mr. Will Spargo
Texas - Bay City-Matagorda County
Panel Participants
Mr. Donnie Bulanek Mr. Barrett Franz Mr. Billy Mann Mr. Curt Mowery Mr. Bob Reed Mr. Joey Sliva Mr. Paul Sliva
Texas - Eagle Lake-Colorado County
Panel Participants
Mr. Andy Anderson Mr. Kenneth Danklefs Mr. W.A. “Billy” Hefner, III Mr. Jason Hlavinka
Mr. Ira Lapham Mr. Patrick Pavlu Mr. Bryan Wiese
Texas - El Campo-Wharton County
Panel Participants
Mr. Daniel Berglund Mr. Timothy Gertson Mr. Mark Rasmussen Mr. L.G. Raun Mr. Glen Rod Mr. Tommy Turner

Economic Impact of the STEP Act and 99.5 Percent Act on AFPC’s Representative Farms and Ranches50
DAIRY FARMS
California
Facilitators Dr. J.P. Martins Panel Participants
Mr. Steve Gaspar Mr. Dino Giacomazzi Mr. Claudio Ribeiro Mr. Jeff Wilbur
Florida - North
Facilitators Ms. Mary Sowerby - Regional Dairy Extension Specialist, UofF Extension Mr. Chris Vann - County Extension Agent, Lafayette County Panel Participants
Mr. Johan Heijkoop Mr. Everett Kerby Mr. Rod Land Mr. Terry Reagan
Mr. Klaas Reynevelds Mr. George Wedsted
Florida - South
Facilitators Mr. Ray Hodge - Director of Govt Relations, Southeast Milk Panel Participants
Mr. Ben Butler Mr. Bob Butler Mr. Jacob Larson Mr. Woody Larson Mr. Tony Moens Mr. Keith Rucks Mr. Sutton Rucks, Jr. Mr. Glynn Rutledge Mr. Tommy Watkins
Idaho
Facilitators Mr. Rick Naerebout - Executive Director, Idaho Dairymen’s Association Panel Participants
Mr. Willie Bokma Mr. Christopher Stevenson Mr. Ted Vander Scheaf Mr. Pete Wiersma
Missouri
Facilitators Mr. Stacey Hamilton - Dairy Specialist and Dade Co. Program Director Panel Participants
Mr. Niall Murphy Mr. Gary Nolan Mr. Bernie Van Dalfsen Mr. Zach Ward Mr. Craig Zydenbos

51Economic Impact of the STEP Act and 99.5 Percent Act on AFPC’s Representative Farms and Ranches
DAIRY FARMS (CONTINUED)
Nevada - Fallon
Facilitators Mr. Bob Fletcher Dr. Tom Harris - Dept. of Resource Econ, University of Nevada Ms. Pam Powell - Extension Agent Panel Participants
Mr. Pete Homma Mr. Cameron Mills Mr. Alan Perazzo Mr. David Perazzo Mr. Charles Turner Mr. Jeff Whitaker
New York - Central
Facilitators Ms. Betsy Hicks Panel Participants
Mr. Eric Carey Ms. Amanda Fitzsimmons Mr. and Mrs. Mike McMahon Mr. Kenton Patchen Mr. & Mrs. Todd & Josie Spencer Mr. Zach Young
New York - Western
Facilitators Ms. Joan Petzen - Farm Business Mngt Specialist, Cornell Cooperative Extension Panel Participants
Ms. Tammy Andrews Mr. Benjamin Chamberlain Mr. Gerry Coyne Mr. Malachy Coyne Mr. Peter Dueppengiesser Ms. Kitty Dziedzic Mr. John Emerling Mr. Walter Faryna Mr. Tom and Bill Fitch Mr. Craig Harkins Ms. Sarah Keem Mr. John Knopf Mr. Jeff Mulligan Ed & Jody Neal Mr. John Noble Mr. Lyman Rodgers Mr. Steve Sondericker Ms. Cyndy Van Lieshout Mr. Ken Van Slyke
Ohio - Wooster
Facilitators Ms. Dianne Shoemaker Panel Participants
Ms. Jenny Bernhard Mr. Gary Dotterer Mr. Henry Hughes Mr. Joe Miley Ms. Joan Winkler Ms. Rebecca Winkler

Economic Impact of the STEP Act and 99.5 Percent Act on AFPC’s Representative Farms and Ranches52
DAIRY FARMS (CONTINUED)
Texas - Central
Facilitators Mr Lonnie Jenschke - County Agent, TexasAgriLife Extension Dr. Jason Johnson - Area Economist, TexasAgriLIfe Extension Panel Participants
Mr. Frans Beukeboom Ms. Linda Beukeboom Mr. Johann DeBoer Mr. Johan Koke Mr. Clemens Kuiper Mr. Joseph Osinga Mr. Henk Postmus
Texas - Northeast
Facilitators Dr. Mario Villarino - County Agent, Texas Cooperative Extension Panel Participants
Mr. Alan Bullock Mr. Blake Fisher Mr. Don Smith Mr. Jerry Spencer Mr. Mark Sustaire
Texas - South Plains
Facilitators Ms. Janet Claborn - Director of Economic Development Mr. Curtis Preston - County Extension Agent Bailey County Panel Participants
Mr. Tom Alger Mr. Matt Beckerink Mr. Larry Hancock Mr. David Lawerence Mr. Reed Mulliken Mr. Joe Osterkamp Mr. Bob Wade
Vermont
Facilitators Dr. Bob Parsons - Asst. Professor-Farm Management, University of Vermont Panel Participants
Mr. Paul Bourbeau Mr. David & Deb Conant Mr. Ashley Farr Mr. Ted Foster Mr. Steven Jones Mrs. Polly McEwing Mr. Les Pike Mrs. Kathrine Scribner Mr. Onan Whitcomb

53Economic Impact of the STEP Act and 99.5 Percent Act on AFPC’s Representative Farms and Ranches
DAIRY FARMS (CONTINUED)
Washington
Facilitators Dr. Amber Itle Dr. Susan Kerr - Dairy Extension Specialist, WSU Panel Participants
Mr. John/Rich Appel Mr. Ed Blok Mr. Rod & Jon De Jong Mr. Larry DeHaan Mr. Troy Lenssen Mr. Sherman Polinder Mr. Ed Pomeroy Mr. Jeff Rainey Mr. Galen Smith Mr. John Steensma Mr. Harold Van Berkum Mr. Jerry Van Dellen Mr. Peter Vlas
Wisconsin
Facilitators Ms. Tina Kohlman Panel Participants
Mr. David Beck Mr. Mark Breunig Mr. John Diedrichs Ms. Gooitske Dijkstra Mr. Roger Grade Mr. Ben Hesselink Mr. Clint Hodorff Mr. Corey Hodorff Ms. Linda Hodorff Mr. Matt Hunter Mr. Randy Julka Mr. Jim Kasten Mr. and Mrs. Charlie Knigge Mr. Pete Knigge Mr. Jeff Liner Mr. Chris Pollack Mr. Jeff Reiden Mr. Jim Rickert Mr. John Ruedinger Mr. Steve Smits Mr. Rob Stone Mr. Jason Vorpahl Mr. Bill & Tammy Wiese

Economic Impact of the STEP Act and 99.5 Percent Act on AFPC’s Representative Farms and Ranches54
BEEF PRODUCERS
California
Facilitators Mr. Josh Davy - Livestock and Natural Resources Rep, UC-Davis Extension Mr. Larry Forero - Farm Advisor, Livestock and Natl. Res., California Cooperative Extension Mr. Glenn Nader - Farm Advisor, Livestock and Natl. Res., California Cooperative Extension Panel Participants
Mr. Jerry Hemsted Mr. Ron Masingale Mr. Dick O’Sullivan Mr. Wally Roney Mr. Britt Schumacher
Colorado
Facilitators Mr. Todd Hagenbuch - County Extension Agent, Routt County Mr. CJ Mucklow - Western Region Director Panel Participants
Mr. Doug Carlson Mr. Jay Fetcher Mr. Larry Monger Mr. Dustin Neelis Mr. Jim Rossi Mr. Phillip Rossi Ms. Kathy Smith Mr. Justin Warren
Florida
Panel Participants
Mr. Mike Adams Mr. Wes Carlton Mr. Alan Kelley Mr. Cary Lightsey Mr. Ralph Pelaez Mr. Bert Tucker Dr. Fred Tucker Mr. Wes Williamson
Missouri - Southwest
Facilitators Mr. Brian Gillen - Agricultural Science Instructor, Lockwood High School
Panel Participants
Mr. Marc Allison Mr. Steve Allison Mr. Scott Daniel Mr. Randall Erisman Mr. James A. Nivens Mr. Mike Theurer Mr. Gary D. Wolf
Montana
Facilitators Mr. Michael Schuldt - County Extension Agent, Custer County Panel Participants
Mr. Clarence Brown Mr. Art Drange Mr. Levi Foreman Mr. Kendall Groer Mr. Alyn Haughian Mr. Scot Robinson Mr. Andy Zook

55Economic Impact of the STEP Act and 99.5 Percent Act on AFPC’s Representative Farms and Ranches
BEEF PRODUCERS (CONTINUED)
Nevada
Facilitators Dr. Tom Harris - Dept. of Resource Econ, University of Nevada Dr. Ron Torell - Custom A.I. & Ranch Consulting Panel Participants
Mr. Tom Barnes Mr. and Mrs. Brad & Dani Dalton Mr. and Mrs. Jay Dalton Mr. Jon Griggs Mr. and Mrs. Mitch & Rhonda Mr. Pete Mori Mr. and Mrs. Sam Mori Mr. and Mrs. Ed Sarman Mr. Paul Sarman Mr. and Mrs. Craig Spratling
Nevada - Caliente
Facilitators Ms. Holly Gatzke Dr. Tom Harris - Dept. of Resource Econ, University of Nevada Panel Participants
Mr. Pete Delmue Mr. Sam Higbee Ms. Kena Lytle-Gloeckner Mr. Robert Mathews
New Mexico
Facilitators Ms. Talisha Valdez - County Extension Agent, Union County Panel Participants
Mr. Justin Bennett Mr. Damon Brown Mr. Blair Clavel Mr. John Gilbert Mr. Russell Kear Mr. J.C. Miller Mr. Red Miller Mr. John Vincent Mr. Derek Walker
South Dakota
Facilitators Ms. Adele Harty Panel Participants
Mr. Kory Bierle Mr. Reed Cammack Mr. Jim Cantrell Mr. Gary Clanton Mr. Casey Doud Mr. Josh Geigle Ray & Linda Gilbert Mr. Riley Kammerer Mr. Willis Kopren Mr. Sam Smith Mr. Andrew Snyder Mr. Monty Williams

Economic Impact of the STEP Act and 99.5 Percent Act on AFPC’s Representative Farms and Ranches56
BEEF PRODUCERS (CONTINUED)
Texas - Rolling Plains
Facilitators Mr. Thomas Boyle - County Extension Agent, Dickens County Mr. Toby Oliver - County Extension Agent, King County Panel Participants
Mr. Greg Arnold Hon. Duane Daniel Mr. Steve Drennan Mr. Leland Foster Mr. Glenn Springer
Texas - South
Facilitators Mr. Dwight Sexton - County Extension Agent, Gonzales County Panel Participants
Mr. Jason Breitschopf Mr. Michael Ehrig Mr. Brian Fink Mr. Mitchell Hardcastle Mr. Michael Kuck Mr. Billy Parker
Wyoming - Worland
Facilitators Mr. Jim Gill - Senior University Extension Educator, Washakie County Panel Participants
Mr. Matt Brown Ms. Teresa Brown Mr. Maurice Bush Mr. Tim Flitner Mr. Dan Rice Mr. Gary Rice

57Economic Impact of the STEP Act and 99.5 Percent Act on AFPC’s Representative Farms and Ranches
PEANUT FARMS
North Carolina - Conway
Facilitators Dr. Blake Brown Mr. Gary Bullen Mr. Bob Sutter Panel Participants
Mr. Clarke Fox Mr. Ray Garner Mr. Wayne Harrell Mr. Donny Lassiter Mr. Brad West Mr. Donnie White
North Carolina - Elizabethtown
Facilitators Dr. Blake Brown Mr. Gary Bullen Mr. Matthew Strickland Mr. Bob Sutter Panel Participants
Mr. Robert Byrd Mr. Wade Byrd Mr. Jart Hudson Mr. Alex Jordan Mr. Dan McDuffie Mr. Sean Morris Mr. Dan Ward Mr. Wilbur Ward

Economic Impact of the STEP Act and 99.5 Percent Act on AFPC’s Representative Farms and Ranches58
Mention of a trademark or a proprietary product does not constitute a guarantee or a warranty of the product by Texas AgriLife Re-search or Texas AgriLife Extension Service and does not imply its approval to the exclusion of other products that also may be suitable.
All programs and information of Texas A&M AgriLife Research or Texas A&M AgriLife Extension Service are available to everyone with-out regard to race, color, religion, sex, age, handicap, or national origin.
6/15/2021__5