Tech Talk: The Continuous Delivery Metrics That Will Make Your Pipeline Fast and Your Apps Better

Agile&Metrics,&Value,&and&So4ware&Don McGreal [email protected] @donmcgreal linkedin.com/in/donmcgreal

Agenda&
1. Is&Agile&Helping?&
2. Problems&with&Metrics&
3. Metrics&in&So4ware&Development&
4. EvidenceFBased&Management&
5. QuesJons&
&

Is&Agile&Successful?&

Teams&Have&OrganizaJonal&Impediments&
Copyright&Scrum.org&2013&
impediments& management&

Management&Makes&Investments&
Copyright&Scrum.org&2013&
impediments& management&
training,&coaching,&infrastructure,&tools,&&faciliJes&
But&how&do&we&know&these&investments&
are&making&a&posiJve&difference?&

How&do&you&measure&progress&on&your&so4ware&projects?&How&about&value?&

What&is&Value?&
val$ue'noun'the®ard&that&something&is&held&to&deserve;&the&importance,&worth,&or&usefulness&of&something.&
For&companies,&it&is&always&presented&in&money&terms.&Profit&derived&from&the&use&of&a&product&or&service&

Delivery Metrics Pizzas Delivered per Trip Time taking an order Time for Delivery Miles per Delivery Fuel Used Order Accuracy (Quality) Route Efficiency Orders per Driver
Owner Metrics Revenue Investments/Costs Customer Satisfaction Repeat Customers Employee Satisfaction Growth Market Drivers & Trends Market Share
CircumstanJal & & & & & & & & & &Direct&

Delivery Metrics Velocity Number of Tests Code Coverage Defects Coupling Cohesion Code Complexity Build Failures Process Adherence
Owner Metrics Revenue
Per Release Per Employee
Investments/Costs Customer Satisfaction Employee Satisfaction Lead & Cycle Time Innovation Rate Customer Usage
CircumstanJal & & & & & & & & & &Direct&

The&Only&Real&Direct&Evidence&Metric&

So&what?&
3&Challenges&

1.&Efficiency&
Cargo&Cults&

1.&Efficiency&
Using&circumstanJal&metrics&as&your&main&guide&can&lead&to&more&overhead&and&waste.&

2.&Vision&
Are&we&aligned?&

2.&Vision&
Using&circumstanJal&metrics&as&your&main&guide&can&misalign&the&business&and&the&delivery&organizaJons.&

3.&IncenJve&
SubopJmal&Metrics& Source:&Robert&D.&AusJn,&Measuring'and'Managing'Performance'in'Organiza6ons'&
Performance&
Time&
measurement&indicators&
true&&performance&

3.&IncenJve&
Once&a&measure&of&performance&is&made&a&target&or&incenJve&for&the&purpose&of&driving&behavior,&it&loses&the&informaJon&content&that&qualifies&it&to&play&such&a&role.&
This&is&even&more&true&of&circumstanJal&metrics.&
Source:&Robert&D.&AusJn,&Measuring'and'Managing'Performance'in'Organiza6ons'&

Who?&
Delivery Metrics Pizzas Delivered per Trip Time taking an order Time for Delivery Miles per Delivery Fuel Used Order Accuracy (Quality) Route Efficiency Orders per Driver
Owner Metrics Revenue Investments/Costs Customer Satisfaction Repeat Customers Employee Satisfaction Growth Market Drivers & Trends Market Share
CircumstanJal & & & & & & & & & &Direct&
?"?"

Who?&
Delivery Metrics Velocity Number of Tests Code Coverage Defects Coupling Cohesion Code Complexity Build Failures Process Adherence
Owner Metrics Revenue
Per Release Per Employee
Investments/Costs Customer Satisfaction Employee Satisfaction Lead & Cycle Time Innovation Rate Customer Usage
CircumstanJal & & & & & & & & & &Direct&
?"?"

21 © 1993-2013 Scrum.org, All Rights Reserved
Six simple KPIs as a proxy for more traditional measurements
InnovaJon&Rate&
Strategic&Alignment&Index&
OnFProduct&Index&
Product&Availability&
Usage&Index&
Installed&Version&Index&

22 © 1993-2013 Scrum.org, All Rights Reserved
What percentage of your product budget is spent on building new functionality vs. maintaining the existing vs. expanding capacity?
18%&
53%&
29%&
2010"IT"Budgets"
Build&New&
Maintain&
Expand&
1: Innovation Rate
Source:&Forrester,&October&2010&“2011&IT&Budget&Planning&Guide&For&CIOs”)&

23 © 1993-2013 Scrum.org, All Rights Reserved
MIN Innovation Rate. Which is better? 5
18%&
53%&
29%&Build&New&
Maintain&
Expand&38%&
10%&
52%& Build&New&
Maintain&
Expand&

24 © 1993-2013 Scrum.org, All Rights Reserved
• “We lack a focused, cohesive vision for our company.” • “We lack clarity of ownership and accountability.” • “We lack decisiveness.” • “I've heard our strategy described as spreading peanut
butter across the myriad opportunities that continue to evolve in the online world. The result: a thin layer of investment spread across everything we do and thus we focus on nothing in particular.”
– Wall Street Journal, Nov 18 2006
Yahoo Memo: The 'Peanut Butter Manifesto‘

25 © 1993-2013 Scrum.org, All Rights Reserved
2: Strategic Alignment Index
Source:&“Measuring&the&Business&Value&of&InformaJon&Technology”,&Intel&Press&
Business""Strategic"Alignment&
Low&
High&
IT"Strategic"Alignment&
High&Low&
Size&of&bubble&=&TCO&
Highest benefits are most likely realized when building these products or features

26 © 1993-2013 Scrum.org, All Rights Reserved
2: Strategic Alignment Index
Source:&“Measuring&the&Business&Value&of&InformaJon&Technology”,&Intel&Press&
Business""Strategic"Alignment&
Low&
High&
IT"Strategic"Alignment&
High&Low&
Size&of&bubble&=&TCO&
But why do these get built?
Highest benefits are most likely realized when building these products or features
Total&Cost&of&Ownership&(TCO)&and&value&are&variables&used&in&development&prioriJzaJon.&

27 © 1993-2013 Scrum.org, All Rights Reserved
Percent of time team spends working on product and value
3: On-Product Index
Generally,&higher&is&bejer&

28 © 1993-2013 Scrum.org, All Rights Reserved
3: On-Product Index
Task switching destroys efficiency and quality
Source:&Gerald&Weinberg,&Quality&So4ware&Management:&Systems&Thinking&

29 © 1993-2013 Scrum.org, All Rights Reserved
Product&Availability&
Product&Performance&
Support&ExecuJon&
OperaJonal&Excellence&
4: Product Availability

30 © 1993-2013 Scrum.org, All Rights Reserved
• Build things that people will actually use.
• If they aren’t, try to figure out why and drive more usage. If you can’t, get rid of the feature.
5: Usage Index
Size'of'bubble'='Time'spent'using'
Higher&tends&to&be&bejer&F20&
0&
20&
40&
60&
80&
100&
0& 5& 10&
Percen
t"of"u
sers"using"
Times"used"per"<me"period"Size'of'bubble'='Time'spent'using'

31 © 1993-2013 Scrum.org, All Rights Reserved
What percentage of your customers are on your latest (n) release?
6: Installed Version Index
Monitoring product absorption
29%&
45%&
23%&
3%&
Version&5.x&
Version&6.x&
Version&7.x&
Version&8.0&
Installed"versions"

32 © 1993-2013 Scrum.org, All Rights Reserved
MIN
What would happen if you tied a PO’s bonus to the % of people on the same release? What are the drawbacks?
Installed Version Index. Let’s make this a bonus target. 5
29%&
45%&
23%&
3%&
Version&5.x&
Version&6.x&
Version&7.x&
Version&8.0&
Installed"versions"

33 © 1993-2013 Scrum.org, All Rights Reserved
These KPIs are interconnected
InnovaJon&Rate&
Strategic&Alignment&
OnFProduct&Index&
Availability&Index&
Usage&Index&
Versions&Index&

34 © 1993-2013 Scrum.org, All Rights Reserved
KPIs provide a high-level proxy of actual value delivered InnovaJon&
Rate&
Strategic&Alignment&Index&
OnFProduct&Index&
Product&Availability& Usage&Index&
Installed&Version&Index&
29%& 50%& 80%& 99%& 35%& 70%&
$1&
&$0.29&&
&$0.15&& &$0.13&& &$0.13&&&$0.05&& &$0.03&&
Source:&Forrester&and&Advanced&Development&Methods&
35 © 1993-2013 Scrum.org, All Rights Reserved
MIN
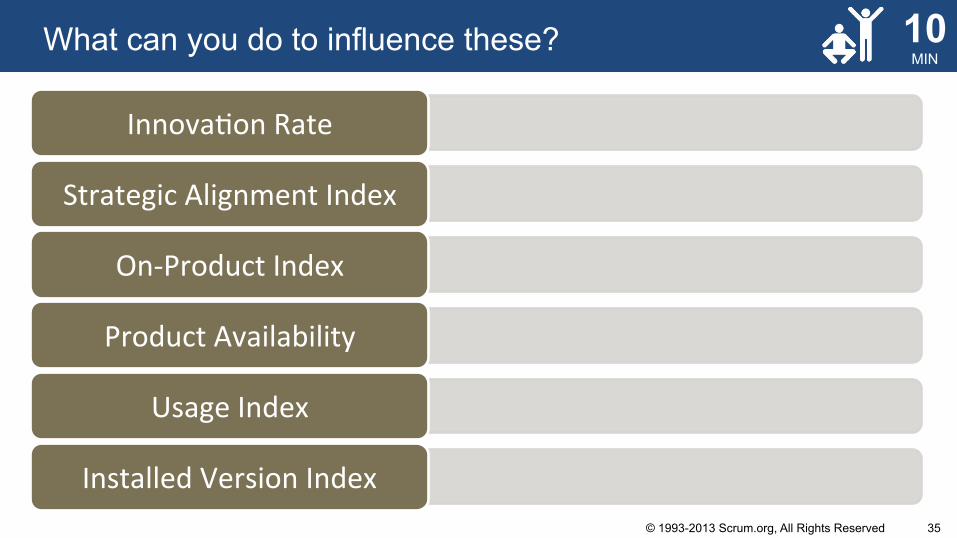
InnovaJon&Rate&
Strategic&Alignment&Index&
OnFProduct&Index&
Product&Availability&
Usage&Index&
Installed&Version&Index&
What can you do to influence these? 10

Enterprise&Agile&AdopJon&

Evidence&Based&Medicine&1. Frame a proper, pertinent,
focused, and answerable question 2. Systematically assemble best
available evidence
3. Clinically appraise evidence for validity and usefulness
4. Apply results in practice of the art
5. Evaluate performance

Evidence&Based&Management&
hjp://www.ebmgt.org/&

Evidence&Based&Management&
&& &&&&
Current&Value& Ability&to&Innovate&Time&to&Market&
Release&Frequency&
Release&StabilizaJon&
Cycle&Time&
Installed&Version&Index&
Usage&Index&
InnovaJon&Rate&
Defects&
Revenue&per&Employee&
Employee&SaJsfacJon&
Customer&SaJsfacJon&
Product&Cost&RaJo&

Evidence&Based&Management&
Direct'Evidence' Circumstan6al'Evidence'
Improve'
Diagnose'

1. Establish&Urgency&2. Create&Guiding&CoaliJon&3. Develop&Change&Vision&4. Communicate&Vision&for&BuyFin&5. Empower&BroadFbased&AcJon&6. Generate&ShortFterm&Wins&7. Never&Let&Up&8. Incorporate&Change&into&Culture&
Leading&REAL&Change&

1. Metrics&Baseline&Review&&
2. PracJces&Baseline&Review&&
3. Plan&a&Sprint&from&the&PracJces&Backlog&&
4. Change&Team(s)&implement&pracJces&
5. Sprint&PracJces&Review&
6. Periodic*&Metrics&Review&
How&EBM&is&Applied&

Tracking&Metrics&

Tracking&Metrics&

Tracking&Metrics&
Sales"
Employee"Sa<sfac<on"
Cost:&&$50k/Sprint&

Scoreboard&

Evidence&Based&Management&
&& &&&&
Current&Value& Ability&to&Innovate&Time&to&Market&
Release&Frequency&
Release&StabilizaJon&
Cycle&Time&
Installed&Version&Index&
Usage&Index&
InnovaJon&Rate&
Defects&
Revenue&per&Employee&
Employee&SaJsfacJon&
Customer&SaJsfacJon&
Product&Cost&RaJo&

So…&Agility&isn’t&just&for&IT.&Agility&can&provide&the&business&with&a&true&compeJJve&advantage.&
The&right&measurements&are&essenJal&for&this.&They&can&improve&communicaJon,&producJvity,&business&alignment...&&and&they&can&help&guide&your&agile&adopJon&effort.&

Thank&You!&Don McGreal [email protected] @donmcgreal linkedin.com/in/donmcgreal