Agenda item 4 Identification of Investment Priority Needs to Improve Transport Operations
78
Agenda item 4 Identification of Investment Priority Needs to Improve Transport Operations UNECE TEM and TER Master Plan Methodology for Selection, Evaluation and Prioritization of Transport Projects Dimitrios Tsamboulas, Assoc. Professor National Technical University of Athens, External Consultant, TEM and TER Master Plan
-
Upload
stephen-black -
Category
Documents
-
view
26 -
download
0
description
Agenda item 4 Identification of Investment Priority Needs to Improve Transport Operations. UNECE TEM and TER Master Plan Methodology for Selection, Evaluation and Prioritization of Transport Projects. Dimitrios Tsamboulas, Assoc. Professor National Technical University of Athens, - PowerPoint PPT Presentation
Transcript of Agenda item 4 Identification of Investment Priority Needs to Improve Transport Operations

Agenda item 4Identification of Investment Priority Needs to
Improve Transport Operations
UNECE TEM and TER Master Plan
Methodology for Selection, Evaluation
and Prioritization of Transport Projects
Dimitrios Tsamboulas, Assoc. Professor
National Technical University of Athens,
External Consultant, TEM and TER Master Plan

Necessity of the Evaluation Methodology for Projects’
Prioritization
Evaluation is a complex exercise when it comes to a group of projects either related or constituting segments of a transport corridor/ network or located in different regions/ countries.
If projects are also competing for scarce financial resources, evaluation and subsequently prioritization becomes even more difficult.

Scope of TEM and TER Master Plan Methodology To assist the evaluation/prioritization at the
strategic level (on network not on project level)
To function as a decision tool, structured in three levels (identification, assessment and prioritization) and employing: criteria reflecting societal values, priorities and available resources (mainly
financial) of countries concerned, viability of projects to secure loans and
possible private funds.

Possible Benefits of TEM and TER Methodology Identification of the priority projects for
road, rail, combined transport infrastructure along multi-national transport corridors, which will encompass the priorities at:
Regional National Transnational (e.g.cross-border)
Assist involved countries to achieve: interconnection - interoperability of national and
trans-national networks (regardless of being within the considered area or at a broader neighbouring ones)
access to those networks

Outputs of the Methodology Projects prioritization and categorization to
Support elaboration of a medium and long-term investment strategy in the countries concerned, with national funds, subsidies from EU/donors and loans
Encourage the realization of projects that have good chances of implementation and fall within the objectives of the respective governments and international agencies in case of funding from them.

Phases of TEM and TER Master Plan Methodology PHASE A – Identification
PHASE B – Forecasting
PHASE C – Evaluation
PHASE D – Prioritisation

Identification Phase Identification of the projects, that
worth further analysis and evaluation, consists of three levels: Relevance Readiness Viability

Project Relevance “relevance” level, expresses relevant importance
of a project within a group of projects, under international perspective, using generic criteria:
Related to international transportation policies and agreements
Related to national transportation policies and objectives
Dealing with elimination of cross-border transportation problems (bottlenecks, missing links etc.)

Project Readiness “readiness” level, concerns maturity of project
in terms of planning and evidence of authorities commitment for implementation, using generic criteria: Related with project status (existing studies,
allocation of work among the responsible stakeholders, time plan for elaboration)
Related with planning organization’s and implementation authority’s commitment to the project

Project Viability “viability” level, concerns expected transportation,
economic and social benefits of project, using generic criteria:
Related to financial and economic impacts and benefits
Related to societal and environmental impacts and benefits
Related to traffic impacts and benefits
…for projects passing all identification levels, the following TEMPLATES will be completed.

TEMPLATE 1 – Identified Projects

TEMPLATE 2A – Road and related infrastructure Project Fiche


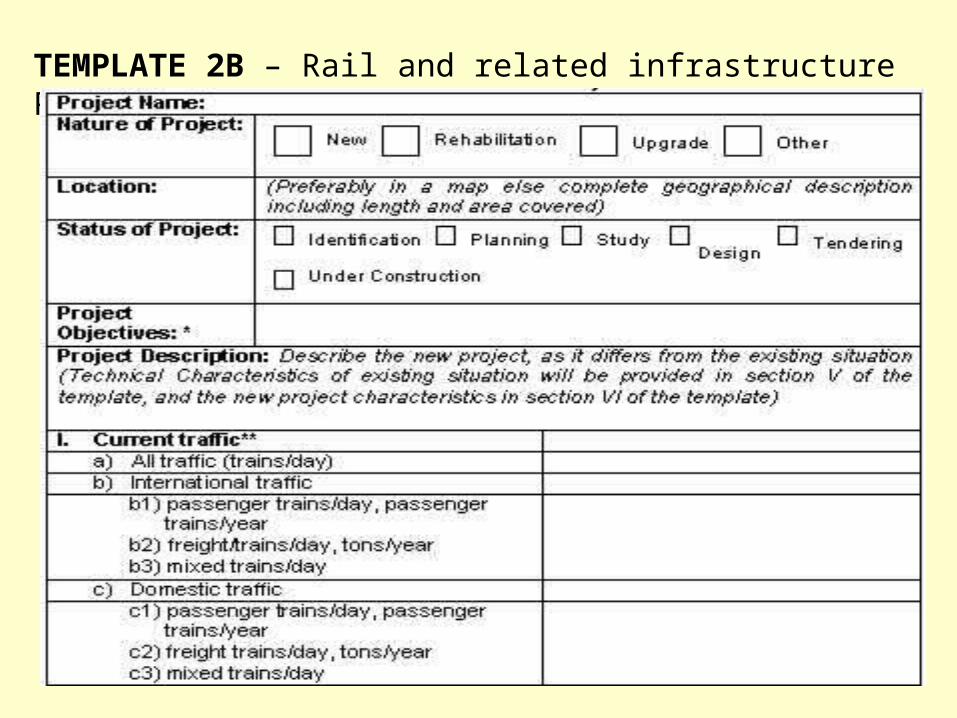
TEMPLATE 2B – Rail and related infrastructure Project Fiche


TEMPLATE 2C – Maritime/port Fiche


Forecasting Phase Large-scale plans that include international projects
and often conflicting but urgent political and social priorities, consultants, authorities and modelers are often asked to elaborate forecasting issues within a short time period
The idea of not using any formal model –due to the above mentioned limitations- means that empirical heuristic approaches will be applied. They are formed and refined through observations, analogies, discussions, experimentations and mistakes/ corrections, emphasizing the use of readily available data.
Forecasting is on a macro level

Forecasting Results/ Scenarios So, the forecasting phase of methodology
provides reference transportation demand and supply scenarios for use in the
evaluation. it does not apply transportation models
linking socio-economic variables (inputs) and traffic levels (outputs), assigned on a network,
it is based on readily available data

Evaluation Phase Selection of Criteria – 3 hyper-criteria
CLUSTER A: Socio-economic return on investment (CA)
CLUSTER B: Functionality and coherency of the network (CB)
CLUSTER C: Strategic/ Political concerns regarding the network (CC):
Quantification of Criteria - Scores Weighting/ Hierarchy of Criteria – Delphi/Pair-wise
Comparison Total Performance of Project

Selection of Criteria Criteria as developed for the TEM and TER
Master Plan are presented Most of them, can be used for the
evaluation/prioritization of the projects identified in Euro- Asian Transport Linkages
Additional ones might be needed for Euro- Asian Transport Linkages, following the Decisions reached at the International Euro-Asian Conferences on Transport

Selection of Criteria -1 CLUSTER A
Socio-economic return on investment (CA):
Degree of urgency (CA1),
Cost effectiveness (CA2),
Relative investment cost (CA3),
Level of transport demand (CA4),
Financing feasibility (CA5).

Selection of Criteria -2 CLUSTER B Functionality and coherency of the
network (CB): Relative importance of international demand of
traffic/ passengers (CB1), Relative importance of international demand of
traffic/ goods (CB2), Alleviation of bottlenecks (CB3), Interconnection of existing networks
(international level) (CB4), Interoperability of networks (CB5).

Selection of Criteria -3 CLUSTER C
Strategic/ Political concerns regarding the network (CC):
Border effects (CC1),
Political commitment (CC2),
Regional and international cooperation (CC3),
Historical/ heritage issues (CC4),
Economic impact (CC5).

Quantification of Criteria -11. Degree of urgency A: Immediate requirement (in the next 2 years-
until 2005), B: Very urgent (between 2005 and 2010), C: Urgent (between 2010 and 2015), D: May be postponed for some years (between 2015 and 2020), E: To be reconsidered later (after 2020)
2. Cost effectiveness A: Excellent (IRR more than 15%), B: Very good
(13-15%), C: Good (10-13%), D: Acceptable (4,5-10%), E: Low (less than 4,5%)
3. Relative investment costs (costs/GDP) (see nomograph next)

X1: the min cost of the project
type observed in the country (in million € or $).
X2: the max cost of the project
type observed in the country (in million € or $)
X3: the considered project cost
(in million € or $)
Country’s GDP given in million € or $
ED= DC= CB= BA=1 and
A=5, B=4, C=3, D=2, E=1
Figure 1

Quantification of Criteria -24. Level of transport demand Highways: A: present traffic more than 14000 vpd; B:
present traffic from 10000 to 14000 vpd; C: from 6000 to 10000 vpd; D: from 3000 to 6000 vpd; E: less than 3000vpd
Border crossings: A: present traffic more than 3500 vpd; B: present traffic from 2500 to 3500 vpd; C: from 1500 to 2500; D: from 800 to 1500; E: less than 800 vpd
Railways: A: present traffic more than 140 trains a day; B: present traffic from 100 to 140 trains a day; C: from 60 to 100 trains a day; D: from 25 to 60 trains a day; E: less than 25 trains a day
5. Financing feasibility A: Excellent, B: Very Good, C: Good, D: Medium, E: Low

Quantification of Criteria -36. Relative importance of international demand
of traffic (passengers) A: more than 30 % of total traffic; B: from 25 to 30 % of
total traffic; C: from 15 to 25 % of total traffic; D: from 7 to 15 % of total traffic; E: less than 7 % of total traffic
7. Relative importance of international demand of traffic (goods)
The same as 6.
8. Alleviation of bottlenecks A: Satisfactory, B: Adequate, C: Medium, D:
Inadequate, E: Unsatisfactory
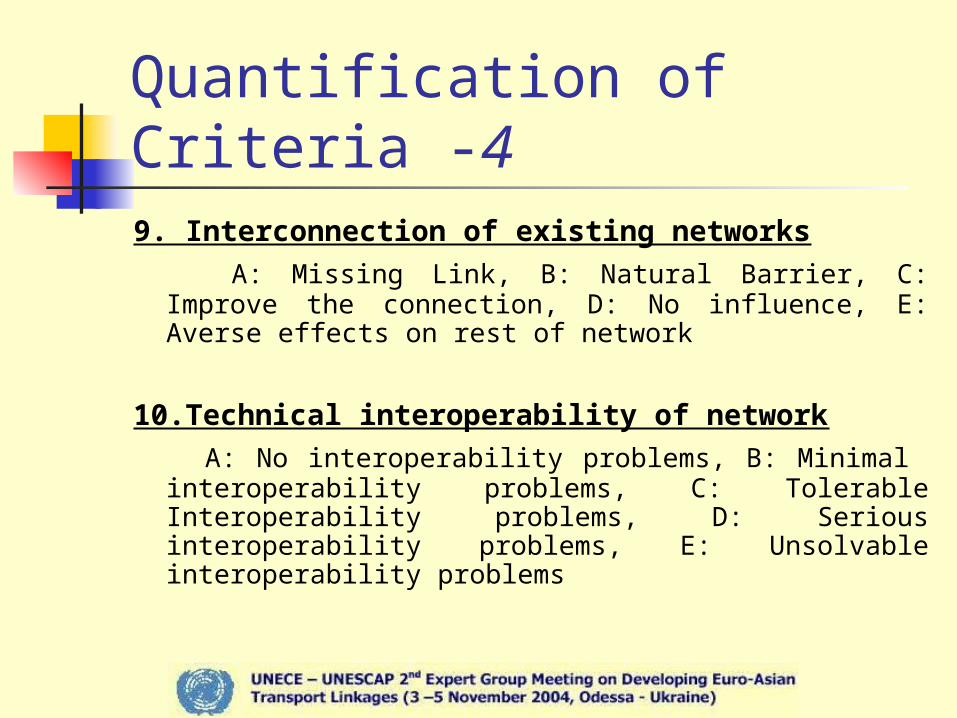
Quantification of Criteria -49. Interconnection of existing networks A: Missing Link, B: Natural Barrier, C: Improve the
connection, D: No influence, E: Averse effects on rest of network
10.Technical interoperability of network A: No interoperability problems, B: Minimal
interoperability problems, C: Tolerable Interoperability problems, D: Serious interoperability problems, E: Unsolvable interoperability problems

Quantification of Criteria -511.Border effects A: No border problems, B: Minimal border problems, C:
Tolerable border problems, D: Serious border problems, E: Unsolvable border problems
12.Political commitment A: Strong, B: High, C: Medium, D: Adequate, E: Low 13. Regional and international cooperation A: Satisfactory, B: Adequate, C: Medium, D:
Inadequate, E: Unsatisfactory

Quantification of Criteria -614. Historical/ heritage issues
A: No effects, B: Minimal effects, C: Tolerable/ Reversible effects, D: Serious effects, E: Irreversible effects
15. Economic impact
A: Strong impact, B: High impact, C: Medium impact, D: Low impact, E: No impact

Criteria Scores A value is 5 (the highest) in terms of score.
Respectively for value E, is 1 (the lowest).
Therefore: where:
J = A, B or C and i = 1,….,5
The template for criterions scores is TEMPLATE 3.
5,1JiC

TEMPLATE 3 Project Criteria Scores

Weighting/ Hierarchy of Criteria Country experts fill TEMPLATE 4 with
proposed set of weights, using Pair-wise Comparison Matrix.
The sum of criteria weights should be 1.
Therefore: and where: J= A, B or C and i = 1,….,5
1,0JiW 15
1
C
AJ iJiW

Pair- wise Comparison Pair-wise comparison approach is a scaling
approach. Only one question to be answered is “is this
criterion more important than the other?”. This means that the pair-wise comparison matrix
(see Table I next) can be filled with zeros and ones, where one represents “is more important”.
By adding these values over the column, a measure is obtained for the degree to which a criterion is important compared to all other criteria, if finally these measures are standardised (see Formula I next), a set of criteria weights is created.

W1 W2 … WN W1 W2 … WN
Table I An example of Pair-wise Comparison matrix
Standardised score wi = (I)
scoresraw
wscoreraw i
''
..''

TEMPLATE 4 Project Criteria Weights

Projects Total Score/ Performance -1 To derive the project’s total score in each
country we use the following relationship:
T.S.Project/Country =
where:CJi [1,5]WJi [0,1]J = A, B or C andi = 1,….,5
TSProject/Country [1,5]
C
AJ iJiJi WC
5
1
*

Projects Total Score/ Performance -2 For Total Score per Project, we use
Country/ Spatial Weights (SW).
SWCountry = % of projects length in the country/ total project’s length.
So the Total Score per project will be:
T.S.Project = T.S.Project/Country * SWCountry

Prioritization Phase Implementation of prioritization phase in three
levels: Technical (direct application of the
methodology, which provides the scores for projects)
Compliance with legal biding commitments that set priorities (e.g. TEN-T network for EU member states): then corrective actions are needed for the priorities
Financial capability of the country (comparison with 1,5% of GDP per year), which will force some projects to shift implementation over time

Technical Prioritization Phase of the TEM and TER Master Plan The combination of the criteria scores and
priorities places each project in one of the four priority categories.
If the project scores between 4-5 then it belongs to priority category I.
If the project scores 3-4 then it belongs to priority category II.
If the project scores 2-3 then it belongs to priority category III.
If the project scores 1-2 then it belongs to priority category IV.

TEM and TER Master Plan Priority Categories I: projects, which may be funded and implemented
rapidly, including on-going projects up to 2010. II: projects requiring some additional investigations
for final definition before likely financing, or planned for implementation up to 2015
III: projects requiring further investigations for final definition and scheduling before possible financing, or planned for implementation up to 2020.
IV: projects to be implemented in the long run, including the projects where insufficient data exists.
Example of Evaluation Methodology (Applied for a TEM project)
Greek Project: Egnatia MotorwaySection: Komotini - Vanianos.

Example steps Complete Project Fiche – see next Derive Criteria Scores Use default set of Criteria Weights Derive Project Total Score Prioritize Project

TEMPLATE 2A – Road and related infrastructure Project Fiche


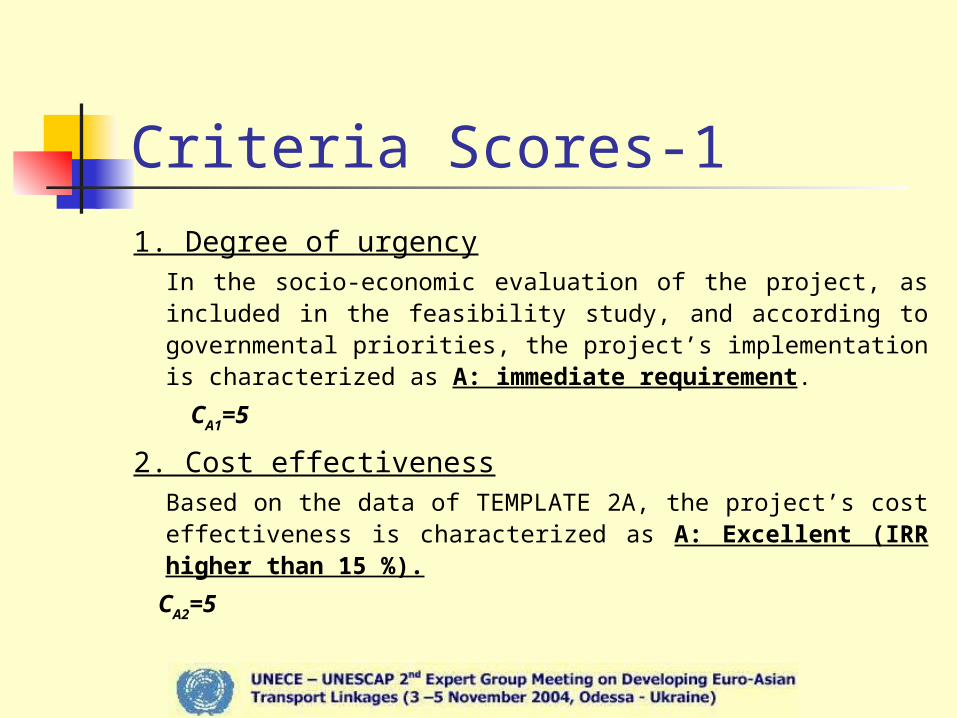
Criteria Scores-1
1. Degree of urgencyIn the socio-economic evaluation of the project, as included in the feasibility study, and according to governmental priorities, the project’s implementation is characterized as A: immediate requirement.
CA1=5
2. Cost effectivenessBased on the data of TEMPLATE 2A, the project’s cost effectiveness is characterized as A: Excellent (IRR higher than 15 %).
CA2=5

Criteria Scores-23. Relative investment costs (costs/GDP) Based on the data of TEMPLATE 2A, country’s GDP and Figure
1 the project’s relative investment cost is characterized as C.
CA3=3 (or 2,8 from Figure 1 directly -see example next)
4. Level of Transport DemandBased on the data of TEMPLATE 2A, the level of transport demand is 14000vdp, therefore the project’s level of transport demand is characterized as B: present traffic from 10000 to 14000 vpd.
CA4=4
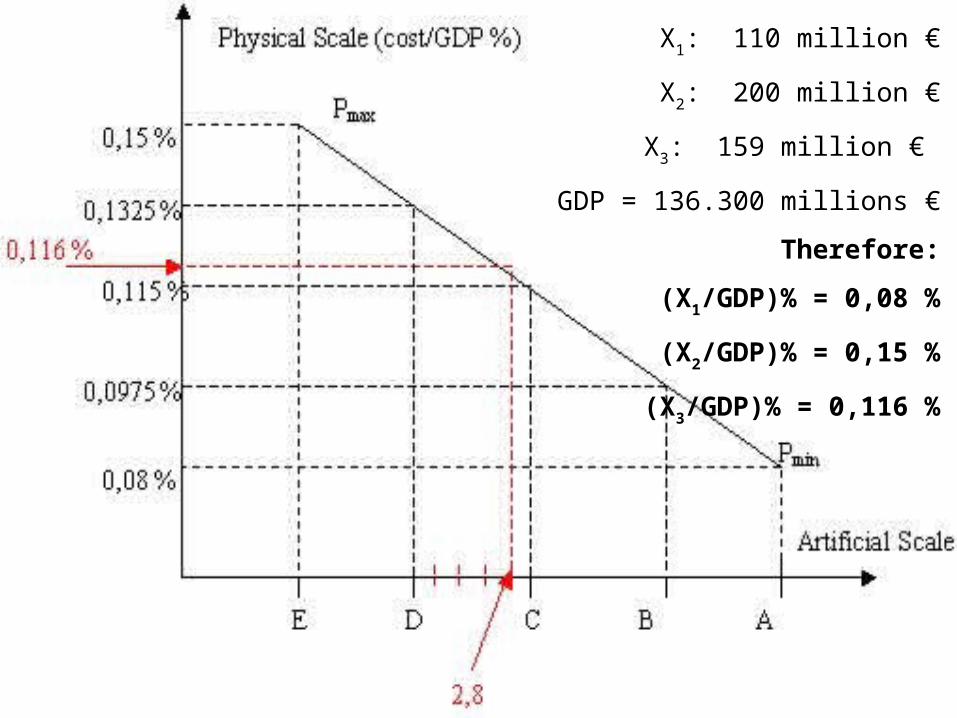
X1: 110 million €
X2: 200 million €
X3: 159 million €
GDP = 136.300 millions €
Therefore:
(X1/GDP)% = 0,08 %
(X2/GDP)% = 0,15 %
(X3/GDP)% = 0,116 %

Criteria Scores-35. Financing Feasibility In the viability study of the project, and according to expert’s
opinion, the project’s financing feasibility is characterized as B: Very Good.
CA5=4
6. Relative importance of international demand of traffic (passengers)Based on the data of section 1, the relative importance of international demand of passenger traffic is 5,2% (=500/9500) therefore the project’s relative importance of international demand of passenger traffic is characterized as E: less than 7 % of total traffic.
CB1=1
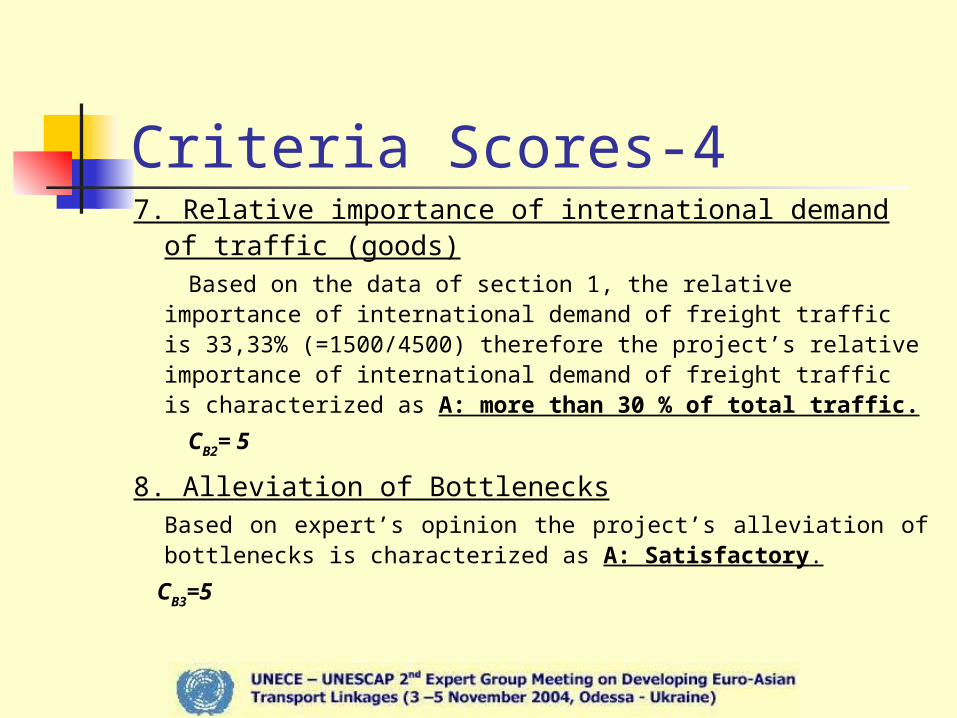
Criteria Scores-47. Relative importance of international demand of
traffic (goods) Based on the data of section 1, the relative importance of
international demand of freight traffic is 33,33% (=1500/4500) therefore the project’s relative importance of international demand of freight traffic is characterized as A: more than 30 % of total traffic.
CB2= 5
8. Alleviation of BottlenecksBased on expert’s opinion the project’s alleviation of bottlenecks is characterized as A: Satisfactory.
CB3=5

Criteria Scores-5
9. Interconnection of existing networks Based on expert’s opinion the project’s interconnection
of existing networks is characterized as A: Missing Link.
CB4= 5
10. Technical interoperability of networkBased on expert’s opinion the project’s technical interoperability in the network is characterized as A: No interoperability problems.
CB5=5

Criteria Scores-611. Border effects The project is a one-country one, therefore regarding the
border effects is characterized as A: No border problems. CC1= 5
12. Political CommitmentThe political commitment is characterized as A: Strong.
CC2=5
13. Regional and International Cooperation The regional cooperation (since there is no international
cooperation) is characterized as A: Satisfactory. CC3=5

Criteria Scores-7
14. Historical/ heritage Issues According to the Environmental Impacts Study of the
project, there are no effects on historical heritage, therefore the project scores A: No effects.
CC4= 5
15. Economic ImpactAccording to the socio-economic study of the project, it is expected to have a C: Medium Impact.
CC2=3
See TEMPLATE 3 completed next..

TEMPLATE 3 Criteria Scores

TEMPLATE 4 Criteria Weights

Project’s Total Score In this case, it is only one country so
spatial weighting was not necessary Based on methodology described
earlier the calculation of Total Score is presented in TEMPLATE 5. (It is the weighted sum of criteria scores or else TEMPLATE 5 is the result of multiplying TEMPLATES 3 and 4)

TEMPLATE 5 Project Total Score
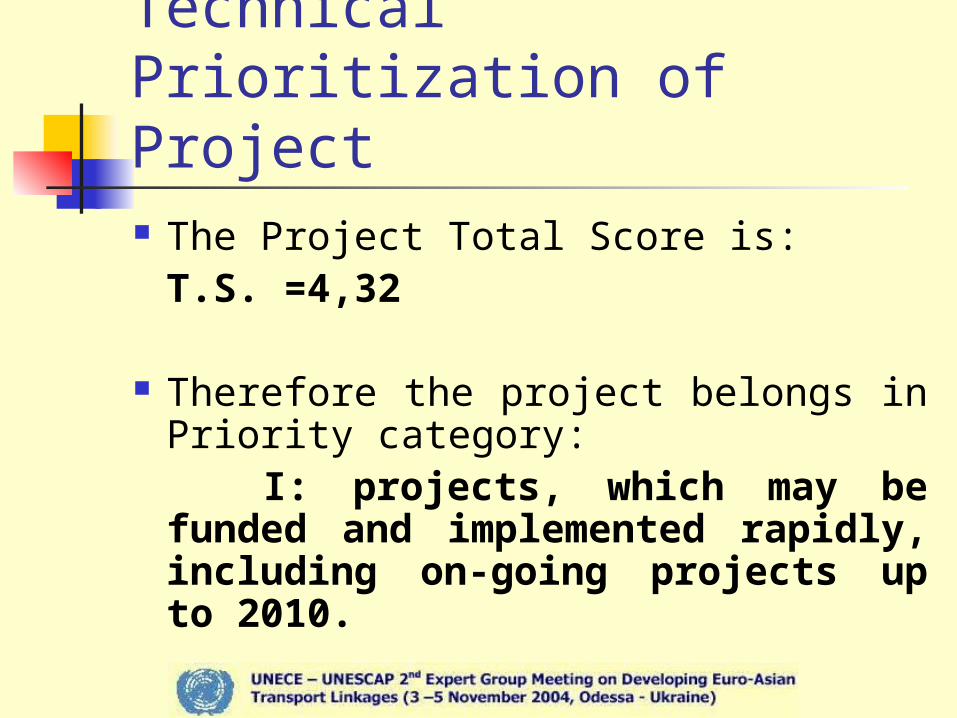
Technical Prioritization of Project The Project Total Score is:
T.S. =4,32
Therefore the project belongs in Priority category:
I: projects, which may be funded and implemented rapidly, including on-going projects up to 2010.

Advantages of the TEM and TER Master Plan Methodology “saves time and money” in project evaluation
procedure Identification phase excludes “weak” projects
from the beginning Uses readily available data
has the ability to measure a multinational project’s performance, shared by more than one region/country, by introducing spatial weights.
the easiness in each application, renders the methodology useful for the decision makers in countries with different levels of development.

How to use this methodology for the Euro-Asian Transport Linkages - 1
Adopt the same 4 phases and three levels (for Prioritization Phase - D) procedure, in more simplified form
Use a sub-set of the introduced criteria (depending on data availability and what it was collected from the requested information from the focal points in each country)
Employ the same method for scores and weights
Introduce additional criteria, that are related to objectives/guidelines of Euro-Asian Transport Linkages

How to use this methodology for the Euro-Asian Transport Linkages - 2 Additional criteria should be based on the
following: Projects considered constitute segments of the major
Euro-Asian corridors, within recognized UNECE/UNESCAP networks;
For projects to be considered, consensus exist from all countries that they contributed to improvement of specific Euro-Asian transport routes, as decided by the Euro-Asian Transport Linkages initiative;
Projects considered would enhance the quality of infrastructure to meet international standards;
projects would address needs to overcome time/cost bottlenecks.

How to use this methodology for the Euro-Asian Transport Linkages- 3
Projects will contribute to: Safe and environmental-friendly sustainable
conditions of transport operations Facilitation of international traffic Maximizing use of existing infrastructure

How to use this methodology for the Euro-Asian Transport Linkages- 4
Data needs: Already provided by countries (name and location of
projects, transport, mode, type of project, project status, expected starting date, expected completion date, project cost, IRR value, expected funding sources)
Existing technical status of project’s “corridor” Average annual daily traffic: for road (average
annual daily traffic for private cars, trucks, buses), for rail (trains/day for passengers/mixed trains and freight trains)

How to use this methodology for the Euro-Asian Transport Linkages- 5
Data needs: GDP of country Special infrastructure (terminals, freight
villages) along the agreed Euro-asian routes: names, location, technical and volume characteristics
Ports located at the agreed Euro-Asian routes: characteristics, volumes (in no. ships, TEUs, tons of general cargo)

How to use this methodology for the Euro-Asian Transport Linkages- 6
CRITERIA :CLUSTER A
Socio-economic return on investment (CA):
Degree of urgency (CA1),
Cost effectiveness (CA2),
Relative investment cost (CA3),
Level of transport demand (CA4),

How to use this methodology for the Euro-Asian Transport Linkages- 7
CRITERIA : CLUSTER B
Functionality and coherency of the network (CB):
Relative importance of international demand of traffic/ passengers (CB1),
Relative importance of international demand of traffic/ goods (CB2),
Alleviation of bottlenecks and missing links (CB3), Interconnection of existing networks
(international level) (CB4),

How to use this methodology for the Euro-Asian Transport Linkages- 8
CRITERIA : CLUSTER C
Strategic/ Political concerns regarding the network (CC):
Political commitment (CC2),
Regional and international cooperation (CC3),
Economic development impact (CC5).
Benefits from the usage of the TEM and TER methodology for the Euro-Asian Transport Linkages (I)
Increase of the capacity and output of the
existing infrastructure through cost-effective
technical and administrative means prior to
introducing major capital investments;
Promotion and facilitation of public-private
partnership (PPP) schemes for the development
of transport in the Euro-Asian context;

Benefits from the usage of the TEM and TER methodology for the Euro-Asian Transport Linkages (II)
Provide to countries another level to assist
decisions in prioritising their transport
investment plans: the strategic level, i.e
whether a project bears a priority for the
routes of Euro-Asian Transport linkages
It does not alter the national priorities
for transport infrastructure investments