Age-Friendly Chicago - City of Chicago · Age-Friendly Chicago . ... the city of Chicago was...
94
Age-Friendly Chicago Findings from a Community-Wide Baseline Assessment Funding support made possible by The Chicago Community Trust Submitted to: City of Chicago, Department of Family and Support Services Submitted by: Rebecca Johnson, PhD, MSc, Amy Eisenstein, PhD, MA, and Lara Boyken Buehler Center on Aging, Health & Society Northwestern University Feinberg School of Medicine
Transcript of Age-Friendly Chicago - City of Chicago · Age-Friendly Chicago . ... the city of Chicago was...

Age-Friendly Chicago Findings from a Community-Wide Baseline Assessment
Funding support made possible by
The Chicago Community Trust
Submitted to: City of Chicago, Department of Family and Support Services
Submitted by: Rebecca Johnson, PhD, MSc, Amy Eisenstein, PhD, MA, and Lara Boyken
Buehler Center on Aging, Health & Society
Northwestern University Feinberg School of Medicine


TABLE OF CONTENTS
Acknowledgements 1 List of Figures and Tables 2
List of Common Abbreviations 3 Executive Summary 4 Introduction 7 Methods: Creating a Baseline Assessment for the City of Chicago 7 Results and Discussion 11
Overall Summary of Findings 15 Age Friendly Domain 1: Outdoor Spaces and Buildings 17 Age Friendly Domain 2: Transportation 20 Age Friendly Domain 3: Housing 23 Age Friendly Domain 4: Respect and Social Inclusion 27 Age Friendly Domain 5: Social Participation 29 Age Friendly Domain 6: Communication and Information 31 Age Friendly Domain 7: Civic Participation and Employment 33 Age Friendly Domain 8: Community Support and Health Services 35
Discussion 40 Conclusion and Recommendations 40 Next Steps 41
Appendices
I. Stakeholder Organizations 42 II. Focus Group Guide 43
III. Stakeholder Interview Guide 48 IV. Prioritization Chart of Age Friendly Indicators 54 V. Walking Audit Tool 57
VI. Age-Friendly Chicago: A Community Survey 58 VII. Survey Data Tables 72
VIII. Map of Survey Regions 80 IX. A View from Chinatown: A Case Study 81 X. 14 Age-Friendly Initiatives 88
XI. References 90

1
ACKNOWLEDGEMENTS
The remarks of older Chicagoans given at focus groups and written as survey responses are presented in italics throughout this report. These remarks are in direct quotation from their anonymous sources. We thank all
participants in this project for their sincerity and candor.
We would like to thank the many people who have contributed to the Age-Friendly project. The community-based stakeholders supporting older adults and city department and agency heads whom we interviewed; members of the newsletter list who have been so helpful in disseminating news of the project and how to get involved; members of the city’s Advisory Council on Aging; and, above all, the older Chicagoans who have taken part in focus groups and completed the survey. It has been our privilege to listen to your lively and informative opinions about what it is like to age in Chicago, and your voices have been our guide in creating this baseline assessment for the city’s age-friendliness.
We would also like to thank the Department of Family and Support Services and The Chicago Community Trust for providing funding for focus groups in the city’s senior centers and for a community-wide online survey across all 77 community areas of the city. Thanks specifically to Joyce Gallagher, John Pfeiffer, Yolanda Curry, and Dawn Hughes and the team at the City, and to Michael Davidson and the team at the Trust, who have been supportive partners throughout. We also thank all the Chicago-area senior centers who made us feel so welcome throughout our partnership, and specifically for hosting focus groups and welcoming our distribution of the survey in their facilities. Thanks too to the members of the city’s Advisory Council on Aging who met with us at those centers to facilitate the distribution of the survey. Thanks to the Coalition for Limited English Speaking Elderly, who translated the survey into the Spanish and Polish languages, and to the Chinese American Service League (CASL), for their translation of the survey into the Chinese language, and for hosting a town hall version of the survey, as well as supporting a photovoice project in its neighborhood. Thanks also to the high school volunteers at CASL for their service in assisting community elders in completing the Chinese language version of the survey. In addition, the survey could not have been disseminated so widely without the support and enthusiasm of many older adults in the community, their aldermen, and key community organizations. We would also like to thank four Masters of Public Health students from the University of Illinois at Chicago, Jonathon Hofacker, Holly Michaels, Molly Paul, and Allison Rosenthal, who took this opportunity to contribute their time and energy and learn from this project at many different stages of its progress. Lastly, thanks are due to the staff at the Buehler Center on Aging, Health & Society, notably Brian Joyce and Caroline Taromino, who helped us to co-ordinate and administer this project, conduct focus groups, disseminate the survey, and code and analyze our findings.

2
LIST OF FIGURES/TABLES
Executive Summary Figure I: Age-Friendly City Domains Figure II: Age Friendly Satisfaction and Prioritization by Domain Report Figure 1: Q-Sort Methodology Figure 2: Process of Baseline Assessment Methods Figure 3: Top 50% of items from each domain prioritized by stakeholders. Figure 4: Where respondents heard about the survey. Figure 5: Total Age-Friendly Score by Region Figure 6: Age Friendly Satisfaction and Prioritization by Domain Figure 7: Outdoor Spaces and Buildings Figure 8: Transportation Figure 9: Housing Figure 10: Your Home Figure 11: Respect and Social Inclusion Figure 12: Social Participation Figure 13: Communication and Information Figure 14: Civic Participation and Employment Figure 15: Community Support and Health Services Figure 16: Services in Neighborhood Table 1: Comparison of Existing Age-Friendly Indicators Table 2: Demographics Table 3: Age-Friendly Total and Domain Specific Scores by Region. Table 4: Outdoor Spaces and Buildings Items Table 5: Transportation Items Table 6: Housing Items Table 7: Your Home Items Table 8: Respect and Social Inclusion Items Table 9: Social Participation Items Table 10: Communication and Information Items Table 11: Civic Participation and Employment Items Table 12: Community Support and Health Services Items Table 13: Services within 1 mile of a person’s home Table 14: Services less than a mile away by Region
3
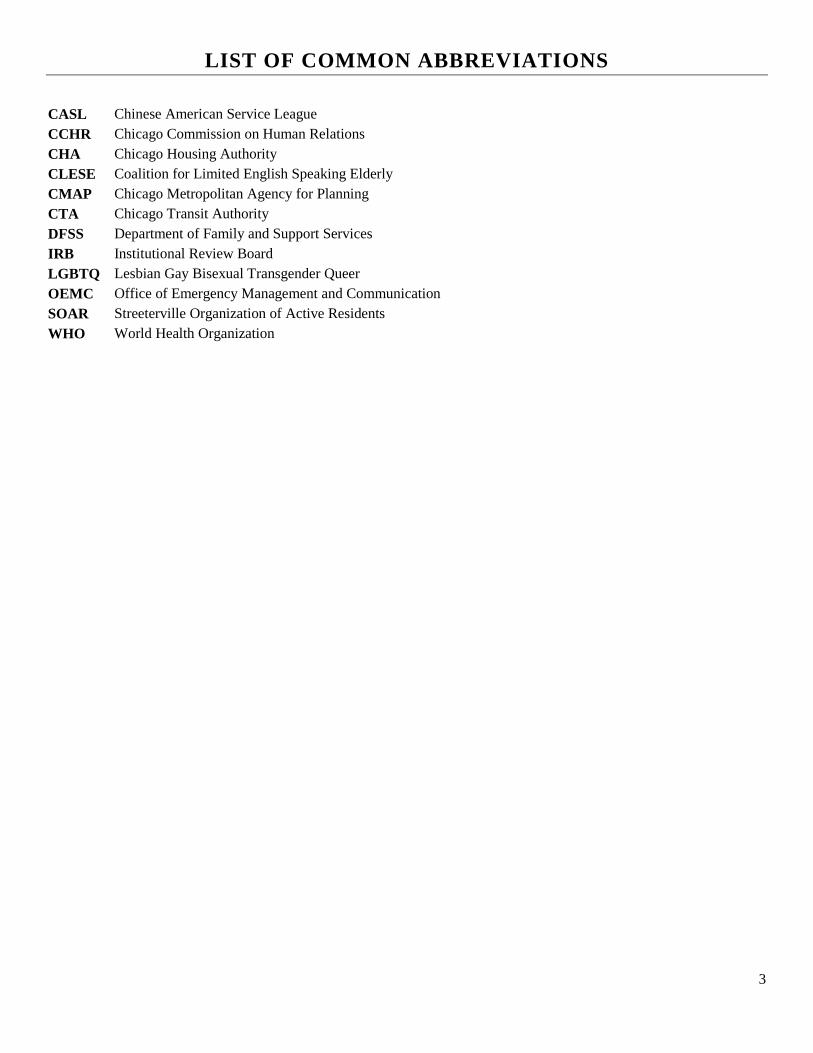
LIST OF COMMON ABBREVIATIONS CASL Chinese American Service League CCHR Chicago Commission on Human Relations CHA Chicago Housing Authority CLESE Coalition for Limited English Speaking Elderly CMAP Chicago Metropolitan Agency for Planning CTA Chicago Transit Authority DFSS Department of Family and Support Services IRB Institutional Review Board LGBTQ Lesbian Gay Bisexual Transgender Queer OEMC Office of Emergency Management and Communication SOAR Streeterville Organization of Active Residents WHO World Health Organization

4
Executive Summary Background
In July of 2012, the city of Chicago was designated as an Age-Friendly City by the World Health Organization. As part of this designation, the city recently completed a baseline assessment to help understand the current strengths, needs, and priorities for maintaining and improving its current Age-Friendliness in eight domains (see Figure 1).
The assessment included 1) a methodological assessment of other age-friendly programs and indicators world-wide, 2) identification and prioritization of age-friendly indicators most important to older Chicagoans, and 3) collection of qualitative and quantitative data from Chicago residents to assess the current age-friendliness of the city. Findings from this 3-phase assessment include information and opinions from over 2,600 participants in the form of both qualitative and quantitative data. Participants included community members, gerontologists, researchers, doctors, social workers, government agencies, business partners, community outreach and advocacy groups, and organizations serving minority and hard-to-reach populations. Methods
Forty-one professional and community stakeholders who possess direct experience with older adults in Chicago were asked to review a comprehensive list of indicators used to assess age-friendly cities and environments world-wide. From that exhaustive list, they were asked to rank them in the order of importance to older adults living in Chicago using a standard research methodology. Stakeholders included researchers, community workers, and government affiliates; they represented a diverse sample through their work or personal experience with disability, the LGBTQ community, and different racial, ethnic and/or religious groups.
After compilation of the indicators ranked as most important to older adults living in Chicago, a community survey was developed and widely disseminated in both an online and paper formats. The survey was open for 3 months, from June through August of 2014. Paper copies of the survey were distributed to all Chicago regional senior centers, key satellite centers, religious organizations, nursing homes and assisted living facilities, other facilities frequented by older adults, and at key community events. Links to the online survey were disseminated through aldermanic email groups, on-line community and educational newsletters, libraries, and community partner websites. Links to the survey were also shared through word-of-mouth by Chicagoans themselves. Surveys were available in English, Spanish, Polish, and Chinese languages. Questions in the survey reflected the prioritized indicators of age-friendliness within each age-friendly domain, as well as basic demographic and health questions and opportunities for open-ended comments. Results
Over 2,600 older adults, with representation from all geographic regions of Chicago, have taken the survey. The data from community respondents shows us how satisfied Chicago residents are with each Age-Friendly domain. The figure below compares the satisfaction ratings by Chicago residents to the priority rankings completed by stakeholders. Overall, Chicagoans rate the age-friendliness of Chicago highly. As a group, they are mostly satisfied or very satisfied with each of the indicators determined to contribute to the age-friendliness of Chicago. As illustrated in figure 2, the domain with the highest level of satisfaction scores by
Figure I: Age-Friendly City Domains (WHO)

5
survey respondents were Communication and Information, followed by Social Participation. While, the highest prioritized domains by stakeholders were Housing and Community Support and Health services. Both domains ranked as highest priorities by stakeholders correspond with low satisfaction ratings from older adults, suggesting that planning for these initiatives should take precedence. Transportation was the third highest priority area as ranked by stakeholders, and similarly the third highest domain in satisfaction scores by Chicago residents.
In addition to the survey data, findings from 8 earlier focus groups with over 100 participants total, stakeholder surveys taken by over 100 gerontology professionals (including government agency heads), neighborhood research audits, and qualitative analyses have helped to add depth and richness to the understanding of the current age-friendliness of Chicago. In combination, this information has pinpointed both Chicago’s strengths on which to build on as well as opportunities for growth and enhancement in order to support and sustain an aging population well into the future.
Findings indicate that all eight domains are interrelated. Affordable housing, health care resources and community assets all work together to create an age-friendly city. Many survey respondents were living in communities where they felt they would be able to stay in their current homes as they age. However several noted environmental and financial factors which could threaten this ability such as crime (particularly in the vicinity of homes and transit stations), pedestrian safety, few transit options, changes to commercial services (such as the closure of local grocery stores), uncertainty about healthcare and support service options for older adults (particularly amongst limited English speakers), and changes in property taxes. Conclusions
From the baseline assessment of Chicago’s age-friendliness, we have learned that based on international indicators, older Chicagoan’s feel their city is Age-Friendly. Two of the three domains that are most important to older Chicagoans are those to which the city is most responsive, transportation and social participation. We have learned that older adults take pride in their city and are supportive of efforts to continue living independently in their communities. Our recommendations for policy development are based on stakeholder prioritization of domains combined with satisfaction ratings of Chicago residents.
Figure II: Age-Friendly Satisfaction and Prioritization by Domain

6
Recommendations Based on these findings we recommend that the city continue to champion existing assets such as senior
centers, parks and outdoor spaces, transit choices, while considering initiatives to build capacity in the following areas:
• Caregiver recognition and support • Falls reduction (Safe accessible streets and conditions for walking) • Pedestrian street safety (including cycling proficiency) • Safety of neighborhoods and clean environments • Accessibility to public buildings • Age-Friendly businesses • Transport choices, transit accessibility and safety • Affordable housing and conditions to age in place at home • Access to information about health resources and community assets to support aging in place • Availability of opportunities for leadership and advocacy particularly among limited English speakers • Flexibility of volunteer opportunities and age friendly employment.
It is also recommended that the city look to novel approaches to Age-Friendly living, such as the Village model, which inclusively targets several of the above listed areas. An additional list of 14 suggested initiatives based on the findings is included in the appendix to the report.

7
Introduction “Because we are seniors. We are living longer. Yes we are living longer and they have to come up with a plan
for us. That is the price of living longer, yes.”
Chicagoland is the third largest metro area in the United States, with a population of over 9.7 million residents, 2.8 million of whom reside within city limits. Of these, 396,170 are over 60, and 10.3% of the population is aged 65 or over (Koff, 2008). Overall, the number of people aged 65 and older in Illinois is projected to increase by 18% by the year 2030 (US Census, 2010). Data suggests that the number of older Chicagoans is already beginning to increase, with the percentage of people aged 45-64 increasing from 19% to 22% between 2000 and 2010 (Yonek & Hasnain-Wynia, 2011). This report discusses efforts taken in Chicago to develop a baseline assessment of the city’s age-friendliness in order to create a targeted and meaningful action plan with clear indicators to show progress.
As the worldwide population ages, international efforts to accommodate the changing demographics are beginning to take place. The WHO has begun to conceptualize the notion of an ‘Age-Friendly City’ as a model to build capacity to support the health and well-being of older adults and sustain an integrated community. The concept of age-friendliness has been globally coined by the WHO to give value to the physical, social, and environmental factors that can promote or hinder older residents’ ability to age-in-place in cities. Age-friendly cities can benefit not only older adults, but also their families and their communities.
The global age-friendly city network is designed to help cities prepare for the impact of demographic change. Cities around the world have analyzed their communities and neighborhoods through the lens of the WHO’s active aging framework and exchanged findings, interventions, and plans. However, few cities have developed baseline measures specific to their cities for future evaluation purposes. Similar to other metropolitan cities, there is a need to raise awareness amongst communities and the city of Chicago as a whole to ensure the implications of demographic change remain at the forefront of future planning efforts. In order to attend to this need, the Mayor of Chicago recently applied for and received the designation of an Age-Friendly City for Chicago.
This report describes the process underpinning the baseline assessment of the city of Chicago, details the findings, and presents initiatives for consideration in a city-wide action plan. This action plan will be used by the City to maintain the designation of an Age-Friendly City and to improve the ability for Chicagoans of all ages to live healthy, independent lives in their communities.
Methods: Creating a Baseline Assessment for the City of Chicago
“I think Chicago is unique ... it is one of the few cities that offers so many … amenities for seniors and free of charge. We have concerts. We have … entertainment.”
In order to determine the age-friendly indicators most relevant to older adults living in Chicago, we
analyzed a combination of qualitative and quantitative data. Data triangulation was used to pull together findings from an environmental scan of current age-friendly indicators, focus groups with 106 older adults across the city, surveys with 99 government and professional stakeholders, and interviews using a Q-sort methodology with 41 stakeholders, including representatives who work in each age-friendly domain, as well those who work with hard-to-reach populations.
The environmental scan included a systematic literature review, online searches, and contact and discussion with key stakeholders and representatives from other age-friendly initiatives. The purpose of the scan was to learn about what other Age-Friendly Cities have done for the assessment and evaluation of their initiatives, with a goal of creating an exhaustive list of age-friendly indicators that have been used around the world.
Focus groups were conducted using the WHO-validated Vancouver Protocol (World Health Organization, 2007). They were conducted at the six regional senior centers in Chicago. We asked older Chicago residents to tell us about the eight domains that are specified as being the most important to age-friendliness by the WHO. Those eight domains are: outdoor spaces and buildings, transportation, housing,

8
respect and social inclusion, social participation, communication and information, civic participation and employment, and community support and health services. Focus groups were moderated by a researcher from Northwestern University. We obtained signed informed consent from all participants (IRB #STU00075634). Focus groups each lasted approximately 90 minutes. Refreshments were provided and participants received gift cards in recognition of their time and participation. Eight posters (one for each domain) with two or three prompt questions were displayed in large print around the room where the focus groups took place. Focus groups were audio-recorded and transcribed to allow for an in-depth analysis of each narrative. In order to ensure comprehensive sampling of Chicago’s diverse population, we conducted one focus group in Spanish and another in Polish. Once focus groups were transcribed, 3 research team members conducted qualitative coding and content analysis using the qualitative software package NVivo. Each participant was also asked to complete a demographics form, which was used to derive basic descriptive information.
Two online stakeholder surveys were sent out to community and professional stakeholders in the city of Chicago. The first survey was sent to self-identified stakeholders who came to a Chicago Age-Friendly Forum to learn about the Age-Friendly initiative, as well as a list of professional contacts in aging-related fields. This survey asked respondents for their professional specialty, work setting, and organization name; it then asked what age-friendly domain their work is most closely related to, and if they felt their work could help Chicago’s efforts to be more age-friendly. If yes, participants were asked to describe the work, research, or program. The second stakeholder survey was sent to all Chicago City agency and sister agency heads. It was sent out following a presentation at Chicago City Hall introducing the initiative. This survey asked similar questions as the above stakeholder survey, but also asked questions about the City department or sister agency’s interactions with older adults.
Next, we conducted semi-structured interviews with key stakeholders throughout the city. We identified these stakeholders from the existing Age-Friendly listserv, professional contacts and recommendations, respondents to the Chicago City agency survey referenced above, and research of key community service providers, advocates, and members. The final stakeholder group represented a diverse sample of populations within Chicago, including people with disability, the homeless, LGBTQ community members, informal caregivers, and different racial, ethnic, and religious groups. To determine which indicators generated in the environmental scan were most important to older adults living in Chicago, we used Q-sort methodology (Block, 2008). This is a prioritization technique in which each data point (in this case, each indicator) is written on a card. Respondents are asked to sort the cards into columns along a continuum of most to least important (in this case) to older adults living in Chicago. Pre-determined spaces for the columns create a “forced normal” distribution, requiring participants to place a specified number of cards into each column. Each card is only allowed to be used once (Figure 1). Those indicators most frequently placed in the “most important” columns were used to create the community-wide survey. After completion of the Q-sort, we elicited additional indicators from stakeholders not represented in the existing cards that they thought might be more specific to the older Chicagoans they served. While the Q-sort was a structured activity, research team members also engaged in a dialogue before and after the prioritization; conversation topics included ways that stakeholder’s work might contribute to the city’s age-friendliness, and what steps they felt would help the city become more age-friendly. Qualitative and quantitative material, including information on work setting and demographics, was noted in the interviews and used to add additional context to the analysis.

9
Figure 1: Q-Sort Methodology
Least Important Neutral Most Important
Using prioritized items from the stakeholder interviews and the accumulation of information collected through the focus groups and environmental scan, we created a survey specific to older adults living in Chicago (appendix VI). The survey included demographic items, a global health scale including scores for mental and physical health, and tailored items for each age-friendly domain.
Finally, we disseminated the community wide-survey in both online and paper formats. We obtained an exempt study status from our institution’s IRB (IRB #STU00098390). The survey was available in both formats in English, Spanish, Polish, and Chinese languages. With the help of our partners, we strove to attain a sample population representative of adults aged 60 and over in the city of Chicago. The survey was open for 3 months, from June through August of 2014. It was disseminated with the help of city and stakeholder partners. Paper copies of the survey were distributed to all Chicago regional senior centers, key satellite senior centers, religious organizations, nursing homes and assisted living facilities, other facilities frequented by older adults, and at key community events. Links to the online survey were disseminated through aldermanic email groups, online community and educational newsletters, at libraries, and on community partner websites. Links to the survey were also shared through word-of-mouth by Chicagoans themselves.
We made sampling African-American, Latino, LGBTQ community members, older adults with disability, and limited English-speaking elders a high priority to ensure these perspectives are included; we engaged key volunteer community members and leaders of minority populations to recommend this survey to their networks and communities, and secured commitment from our stakeholders representing minority or hard-to-reach populations to endorse the survey in their communities and service populations.
The survey deployment was adaptive and responsive to community feedback and need. We responded to requests to increase the number of paper copies of the survey available, particularly for the Spanish and Polish language versions. Many community centers and organizations also made additional paper copies of the survey available using their own resources. In tandem with this project, we developed an Age-Friendly listserv and an Age-Friendly newsletter. An invitation to join the listserv was added to both the online and paper copies of the survey, along with general contact information for the research team. In the Age-Friendly newsletter, distributed to this listserv, we welcomed invitations from readers to distribute the survey to community groups and service organizations we may not have already engaged. As a result, we received emails from community leaders and members asking for copies of the survey distributed to their housing complex, local neighborhood
0
0
-2 -1 0
-3 -2 -1 0
-4 -3 -2 -1 0
-5 -4 -3 -2 -1 0
-5 -4 -3 -2 -1 0 1 2 3 4 5
1 2 3 4 5
1 2 3 4
1 2 3
1 2
10
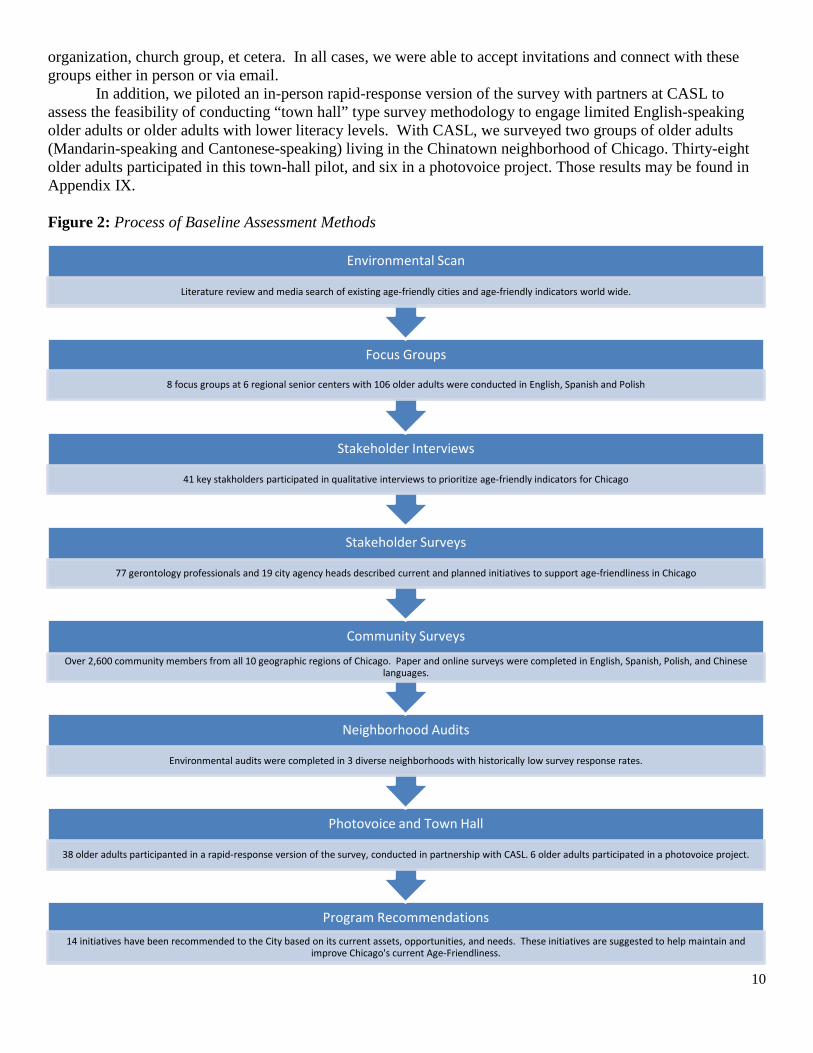
organization, church group, et cetera. In all cases, we were able to accept invitations and connect with these groups either in person or via email.
In addition, we piloted an in-person rapid-response version of the survey with partners at CASL to assess the feasibility of conducting “town hall” type survey methodology to engage limited English-speaking older adults or older adults with lower literacy levels. With CASL, we surveyed two groups of older adults (Mandarin-speaking and Cantonese-speaking) living in the Chinatown neighborhood of Chicago. Thirty-eight older adults participated in this town-hall pilot, and six in a photovoice project. Those results may be found in Appendix IX. Figure 2: Process of Baseline Assessment Methods
Program Recommendations 14 initiatives have been recommended to the City based on its current assets, opportunities, and needs. These initiatives are suggested to help maintain and
improve Chicago's current Age-Friendliness.
Photovoice and Town Hall
38 older adults participanted in a rapid-response version of the survey, conducted in partnership with CASL. 6 older adults participated in a photovoice project.
Neighborhood Audits
Environmental audits were completed in 3 diverse neighborhoods with historically low survey response rates.
Community Surveys
Over 2,600 community members from all 10 geographic regions of Chicago. Paper and online surveys were completed in English, Spanish, Polish, and Chinese languages.
Stakeholder Surveys
77 gerontology professionals and 19 city agency heads described current and planned initiatives to support age-friendliness in Chicago
Stakeholder Interviews
41 key stakholders participated in qualitative interviews to prioritize age-friendly indicators for Chicago
Focus Groups
8 focus groups at 6 regional senior centers with 106 older adults were conducted in English, Spanish and Polish
Environmental Scan
Literature review and media search of existing age-friendly cities and age-friendly indicators world wide.

11
Results
“I was simply delighted to see this study!!! It is overdue and much needed!”
Summary Focus Group Findings One hundred and six older adults participated in a total of 8 focus groups (Johnson, Eisenstein,
Taromino, McKohy, & Tulas, 2013). The majority of focus group participants were between the ages of 70-79 (53%) and 77% percent of participants were female. Older adults in the study were more likely to be widowed compared to national averages, with 32% reporting widow status compared to the national average of 28%. The proportion of adults living alone in this study was 52%, which is significantly higher than the national average. US census data shows older adults in Chicago reporting more incidents of caregiving compared to national averages: our sample showed 43% of older adults provided some type of caregiving.
Content analysis found social participation to be the most frequently coded domain. Transportation was also a salient topic, followed by housing. The positives of living in the city highlighted by the focus group discussions include the people of Chicago themselves and the opportunities for social participation, as well as a “neighborhood feel” supported by the public parks, block clubs, and neighborhood associations. Focus group participants also told us they valued the walkability of Chicago (closeness of stores, libraries and health centers, accessible parks and open spaces), available and accessible public transportation, and the large variety of choices for housing options. Participants also frequently discussed opportunities for volunteering and advocacy, benefits of participation at the senior centers, and differences between maintained and unmaintained neighborhoods. Participants openly discussed ways in which Chicago did not support independent living for older adults in the city. They spoke of the threat of isolation and loneliness in big cities, their feelings of insecurity, their fears of the cost of future healthcare, the stress of city living, and their perception of inequitable resource distribution throughout the city (Gibson, 2010). Participants also discussed the lack of respect for older adults on public transportation and lack of public transit options in some neighborhoods. While each focus group followed the same guide for discussion, there were unique differences in the coding by site, indicating regional inequalities in the perception of age-friendliness throughout the city.
Summary of Findings from the Environmental Scan We conducted a comprehensive environmental scan to elicit an exhaustive list of indicators used to
assess and evaluate age-friendly cities worldwide. Table 1 shows our main sources and their descriptions. After compiling all the indicators, we removed redundant items and added items on topics that were discussed in the focus groups but were not represented in the existing indicators, and grouped related items. The final list included 60 indicators falling within the WHO Age-Friendly framework. There were 6 indicators in each of the domains of outdoor spaces and buildings, transportation, and communication and information; 7 in housing, community support and social services, and social participation, 9 indicators reflecting the domain of respect and social inclusion, and 12 in civic participation and employment. These indicators were then carried forward to be ranked for importance by key stakeholders using the Q-sort.
Table 1: Comparison of Existing Age-Friendly Indicators
Source Description AdvantAge Initiative Indicator Chartbook: National Survey of Adults Aged 65 and Older (Center for Home Care Policy and Research, 2004)
Survey results from 10 US AdvantAge communities
Long-Term Care: An AARP Survey of New York Residents Age 50+ (Burton & Bridge, 2007; Pollard, 2000)
Survey results from New York state residents aged 50 and over
Finding the Right Fit: Age-Friendly Community Planning (Lewis, Denton, Groulx, & Ducak, 2013)
Report developed by the Ontario Seniors’ Secretariat (OSS), the Accessibility Directorate of Ontario (ADO), the

12
University of Waterloo and McMaster University Aging Texas Well: Community Assessment Toolkit (Aging Texas Well, 2009)
Information, resources, and tools developed by the Texas Department of Aging and Disability Services
Developing Indicators for Age-Friendly Cities (Prasad, Steels, Dagg, & Kano, 2007)
A report and guide prepared by the World Health Organization’s Centre for Health Development
Age-Friendly New York City (Age-Friendly NYC, 2014)
Review and recommendations prepared by the New York Academy of Medicine
What makes a city age-friendly? London’s contribution to the World Health Organization’s Age-Friendly Cities Project (Biggs & Tinker, 2007)
Report including focus groups in the city of London, United Kingdom, prepared by King’s College in London and Help the Aged
Focus on… Age-friendly cities (CARDI, 2012) Review and recommendations on Age-friendliness of Dublin, Ireland, prepared by Centre for Ageing Research and Development in Ireland (CARDI)
Age-Friendly Cities Project: Halifax Site (Keefe & Hattie, 2007)
Report including focus groups for city of Halifax, Nova Scotia, prepared by the Nova Scotia Centre on Aging
Action Plan for an Age-Friendly Portland (The Age-Friendly Portland Advisory Council, 2013)
Review and recommendations for the city of Portland, Oregon, prepared by The Age-Friendly Portland Advisory Council
Haliburton County Age-Friendly Survey (Haliburton County, 2013)
Survey prepared by the University of Waterloo
JAGES-HEART (World Health Organization, 2014) Japan Gerontological Evaluation Society Summary of Findings from Semi-Structured Interviews and Surveys with Key Stakeholders
Forty-one stakeholders were included in structured interviews and prioritization of the indicators. Key stakeholders included 13 city agency department heads, 21 community professionals, and 4 researchers. Stakeholders reported their work settings as: governmental (12), social service agency (9), not-for-profit (8), community-based care (2), university or academic program (2), hospital system (2), healthcare (1), and residential or home-based care (1). Each category of stakeholders identified similar priorities for the city of Chicago, with the highest prioritized indicators falling within the domains of community support and health services, housing, and communication and information. Stakeholders identified several gaps in the content of existing age-friendly indicators, including pet and service animal friendliness, nutrition and food options, education for bicycle safety, and accessible private transportation. Figure 3 shows the number of indicators from each domain that were prioritized among the top 50% of items. The full list of 60 items, along with their prioritization rankings by stakeholder group is included in Appendix IV.
Summary of Findings from the Community-Wide Survey
Outdoor spaces
14%
Tranportation
12%
Housing 17%
Respect 11%
Civic part. 3%
Services 17%
Information 17%
Socal part. 9%
Figure 3: Top 50% of items from each domain prioritized by stakeholders.

13
A total of 2,601 participants completed the survey. A majority of respondents completed it in English (n = 2,464), and 87 responded in Spanish, 26 in Polish, and 23 in Chinese. Forty-three percent of respondents were between the ages 65 and 74, 71% were female, and 57% were Caucasian (Table 2). Table 2: Demographics
Total (n) %
Respondents 2,601 100% Age Category
<55 106 4.08% 55-64 671 25.80% 65-74 1,122 43.14% 75-84 547 21.03%
>85 133 5.11% Missing 22 0.85%
Gender Identity Male 710 27.30%
Female 1,857 71.40% Transgender 10 0.38%
Missing 24 0.92% Race
White 1,484 57.05% Black 621 23.88%
Hispanic 209 8.04% Asian 173 6.65% Other 63 2.42%
Missing 51 1.96% Region*
North 483 18.57% North-West 385 14.80%
North-Central 369 14.19% Central 395 15.19%
Central-West 214 8.23% South-East 242 9.30%
South 290 11.15% Missing 223 8.57%
Marital Status Single 752 28.91%
Married 893 34.33% Other 935 35.95%
Missing 21 0.81%
Total %
(n)
Respondents 2,601 100% Housing
Rent 850 32.68% Own 1,619 62.25%
Missing 46 1.77% Live Alone (yes) 1308 50.29%
Missing 108 4.15% Caregiver (yes) 397 15.26%
Missing 70 2.29% Education
<12th grade 226 8.69% HS Degree/GED 327 12.57%
Some College 324 12.46%
College degree 733 28.18% Grad degree 744 28.60%
Missing 64 2.26% Employment
Employed 695 26.72% Retired 1,635 62.86%
Other 232 8.92% Missing 39 1.50%
English 1st Language (yes) 2,257 86.77% Missing 38 1.46%
Live Below Poverty Level 438 16.84% Missing 73 2.81%
Felt Isolated or Lonely (yes) 703 27.03%
Missing 49 2.27% Health**
Physical Health 2,280 Mean= 48.11
Mental Health 2,323 Mean= 50.91

14
*See map (Appendix VIII) North zip codes: 60626, 60640, 60645, 60659, 60660; North-West zip codes: 60625, 60630, 60631, 60646, 60656, 60634, 60639, 60641; North Central zip codes: 60613, 60614, 60618, 60647, 60657; Central zip codes: 60601, 60602, 60603, 60604, 60605, 60606, 60607, 60610, 60611, 60622, 60642, 60654, 60661; Central-West zip codes: 60608, 60612, 60624, 60644, 60651, 60609, 60623, 60629, 60632, 60638; South-East zip codes: 60615, 60616, 60637, 60649, 60653; South zip codes: 60617, 60619, 60628, 60633, 60620, 60621, 60636, 60643, 60652, 60655. **General population mean score = 50, Standard deviation = 10. The distribution of respondents suggests a good geographic spread across Chicago, with the highest rate of response in the northern most region (18%), and fewer in the South (11%). Thirty-five percent of the population is married, 62% own their own home, and 15% consider themselves a primary caregiver for another person. Seventeen percent of respondents indicated they live below the poverty level, and 27% reported feeling isolated or lonely. The mean physical health score of the population was slightly below that of the national average, and the mental health score was equal to the national average.
Survey respondents heard about the survey from a variety of dissemination partners and stakeholders (Figure 4). We asked respondents to let us know how they heard about the survey. Of the 2,600 respondents, 1,706 of them (65.6%) responded to that item. Five hundred and sixty-five (33%) of those respondents listed their alderman as the source of hearing about the survey; this included information in aldermanic newsletters, ward events, and block clubs, and other forms of information from the alderman. Senior centers were represented in 23% of responses; this included respondents completing the survey on paper during a visit to the center, or hearing about the survey at the center and completing it online from another location. A significant proportion of respondents (14%) indicated they heard about the survey from a community organization. Some of these organizations included Center on Halsted, Rush Generations, Forward Chicago, and Chicago-area Villages. Figure 4: Where respondents heard about the survey.
Alderman 33%
CASL 3%
CHA 10% Friend or family
8%
Mather Café's 9%
Senior Centers 23%
Other community Org 14%

15
Overall Summary of Age-Friendly Findings The following section pulls in cumulative findings from the Age-Friendly assessment to date to
summarize age friendly features and key areas for improvement recommended for each age-friendly domain. Findings come from focus groups, interviews, the environmental scan, audits, surveys, and adjunct projects. Following the summary of overall findings, detailed findings for each age-friendly domain are presented. Each section includes information on the items in the survey, a table showing each item, the number of respondents (n) to each item, as well as the mean response value for each item (lower numbers representing greater overall satisfaction). After the table is a figure which displays the spread of responses for each item on a scale 5 point scale representing levels of satisfaction with each item. Please note that the figures represent findings reflecting n=100%, where n is the total number of respondents to each individual item.
Overall, Chicagoans rate the age-friendliness of Chicago highly. As a group, they are mostly satisfied or very satisfied with each of the indicators determined to contribute to the age-friendliness of Chicago. In Table 3 and Figure 5 below, mean scores are represented for each region and each age-friendly domain. Scores are based on a 5 point Likert scale with lower scores representing greater satisfaction. Each domain index had high internal consistency (alpha > .90). Older Chicagoans are most satisfied with indicators of communication and information (m=2.04), and least satisfied with housing (m=3.21). Yet, there are significant differences in ratings of each domain by region, with the central region showing the greatest satisfaction with the age-friendliness of the city. In addition to significant differences by region there were significant differences in ratings between age, gender, health, and income. Table 3: Age-Friendly Total and Domain Specific Mean Scores by Region.
North North-West
North-Central
Central Central-West
South-East
South TOTAL
Age-Friendly Score
2.40 2.57 2.44 2.26 2.99 2.66 2.90 2.60
Outdoor Spaces and Buildings
2.70 2.76 2.67 2.62 3.17 2.77 3.17 2.84
Transportation 2.15 2.41 2.14 2.02 2.58 2.44 2.71 2.35
Housing 2.91 3.35 2.98 2.58 3.73 3.25 3.68 3.21
Community Services
2.54 2.83 2.62 2.10 3.35 2.85 3.31 2.80
Communication and information
1.92 1.97 1.86 1.85 2.43 2.16 2.11 2.04
Respect and Social Inclusion
2.29 2.34 2.40 2.38 2.78 2.51 2.66 2.50
Social Participation
2.04 2.29 2.13 1.95 2.70 2.35 2.45 2.27
Civic Participation
2.67 2.86 2.75 2.55 3.45 2.99 3.32 2.94
Safety 2.97 2.81 2.73 2.59 3.76 3.25 3.94 3.15
*Mean scores based on a 5 point Likert Scale with lowest score equal to greatest satisfaction

16
Figure 5: Total Age-Friendly Score by Region
*Mean scores based on a 5 point Likert Scale with lowest score equal to greatest satisfaction
The data from community respondents shows us how satisfied Chicago residents are with each Age-Friendly domain. Figure 6 compares the satisfaction ratings by Chicago residents to the priority rankings completed by stakeholders. Stakeholders were asked to rank the domains by importance to older Chicagoans. As illustrated in the figure, the highest prioritized domains by stakeholders were housing and community support and health services. Both domains correspond with low satisfaction ratings from older adults, suggesting that planning for these initiatives should take precedence. Transportation was the third highest priority area as ranked by stakeholders, and similarly the third highest domain in satisfaction scores by Chicago residents. Figure 6: Age Friendly Satisfaction and Prioritization by Domain
0
0.5
1
1.5
2
2.5
3
3.5
Central North North-Central North-West South-East South Central-West
0
1
2
3
4
5
6
7
8
9
Communicationand
information
socialparticipation
Transportation Respect CommunitySupport &
Health Services
Outdoor Spaces CivicEngagement
Housing
Community Satisfaction Stakeholder Priority

17
Age Friendly Domain 1: Outdoor Spaces and Buildings Satisfaction Rating by Chicagoans: 6 Priority Ranking by stakeholders: 8 (out of 8 domains)
“Being mobile in Chicago is my main problem. That of an older pedestrian is a constant concern.”
Outdoor spaces and buildings have a major impact on mobility, independence, and the quality of life of
older people, often affecting their choices of where to live. Age-friendly features of outdoor spaces and buildings include: conditions for walking; accessibility to public buildings; a clean environment; access to green spaces and parks; and safe accessible streets. The domain of outdoor spaces and buildings included 13 items in the survey related to the perceived availability, safety and accessibility of public buildings, parks and green spaces, and businesses (Table 4). It also included items on road conditions and safety of the physical environment, including walkability, sidewalks, bike lanes, and dog parks. Within this domain, the item with greatest satisfaction is ‘parks and green spaces are within easy walking distance from my home.’ Indicators showing the greatest need for improvement include, ‘bicycling conditions are safe for pedestrians,’ and ‘conditions for walking.’ In terms of overall satisfaction, compared to the other age-friendly domains, it is the 6th highest average score. There is significant variation in the satisfaction of outdoor spaces and buildings by region (Table 3). Table 4: Outdoor Spaces and Buildings Items
Indicator Total n
Mean Score*
1. Community buildings, including senior centers, libraries, post offices, and park districts, are accessible (have elevators or ramps, grab bars, are clear from ice and snow) 2,314 2.06
2. It is easy to use wheelchairs, walkers, and scooters on the sidewalks 1,846 2.67
3. Road conditions are safe for pedestrians 2,435 3.09
4. There is adequate time to cross the street 2,438 2.85
5. Businesses and organizations in my neighborhood, including grocery stores, religious centers, and shops, are accessible (have elevators or ramps, grab bars, are clear from ice and snow) 2,312 2.58
6. Restrooms are readily available and accessible in public and community buildings 2,280 2.62
7. Parks and green spaces are within easy walking distance from my home 2,457 2.03
8. Dog parks are within walking distance from my home 1,727 2.86
9. There are benches and resting areas in public spaces 2,364 2.47
10. Bicycling conditions are safe for pedestrians 2,273 3.34
11. Conditions for walking (presence of sidewalks, cracks, bumps, debris on the sidewalks, snow removal) 2,526 3.53
12. The ease of access to public and community buildings 2,392 2.88
13. The safety of your physical neighborhood environment (where feeling safe means being able to walk or exercise outside without worrying about crime) 2,511 3.21
*Mean scores based on a 5 point Likert Scale with lowest score equal to greatest satisfaction

18
Figure 7: Outdoor Spaces and Buildings
*Response options for items 11-13: Excellent, Very Good, Good, Fair, Poor Current age-friendly features of Outdoor Spaces and Buildings: Available green space and parks
• The City of Chicago devotes 8.5% of its total land acreage to parkland, which ranked it 13th among high-density population cities in the United States in 2012. Since the 1830s, the official motto of Chicago has been Urbs in horto, Latin for "City in a garden." (City of Chicago, 2014)
• There are 600 community gardens in Chicago (Chicago Department of Transportation, 2014). Available facilities
• The Chicago Park District manages 220 facilities in 570 parks covering more than 7,600 acres (3,100 ha) of land throughout the city. This includes 9 lakefront harbors, over 24 miles (39 km) of lakefront, 31 beaches, 17 historic lagoons, 86 pools, 90 playgrounds, 90 gardens, 66 fitness centers, 9ice skating rinks, 10 museums, and 2 conservatories (City of Chicago, 2014)
• Over 22,000 adults aged 60 and over have accessed over 1,000 activities and programs designed specifically for this population. Activities include senior club events, dances, concerts, lunches, holiday events, and trips. Programs include but are not limited to fitness, aquatic activities, line dancing, arts and programming, and the Senior Olympics. Additionally, many facilities serve as free lunch sites and as distribution sites for the Greater Chicago Food Depository food boxes (City of Chicago, 2014)
Accessible outdoor spaces • Seventy-five percent of survey participants strongly agreed or somewhat agreed that parks and green
spaces were within easy walking distance to them. Focus group participants also enjoyed Chicago’s walkability: “I have a good time walking to places and stores within four or five blocks from my house… I just walk.”
• There are 22 Neighborhood Farmers Markets in Chicago (City of Chicago, 2014). One survey participant observed: “Our local (North-West) neighborhood association is active with a new farmers' market. These new options enjoy a LOT of participation by seniors...”
0%
10%
20%
30%
40%
50%
60%
70%
80%
90%
100%
Item 1 Item 2 Item 3 Item 4 Item 5 Item 6 Item 7 Item 8 Item 9 Item 10 Item 11 Item 12 Item 13
Strongly Agree
Somewhat Agree
Neither
Somewhat Disagree
Strongly Disagree

19
Accessible public buildings • According to information obtained from key stakeholders, the City’s Public Building Commission uses
Universal Design when constructing all new facilities and environments. These guidelines seek to go beyond the requirements of the Americans with Disabilities Act to address all levels of disability; a Chicago-area example of this is the new library in Chinatown.
Conditions for walking • Chicago is the 4th most walkable city in the US (Walk Score, 2014). • A windshield audit of Rogers Park indicated that this community area highly supported walkability
amongst older adults. (Appendix V) Conditions for cycling
• Chicago currently has more than 200 miles of on-street protected, buffered, or shared bike lanes, many miles of off-street paths (including the 18.5-mile Lakefront Trail), more than 13,000 bike racks, and sheltered, high-capacity, bike parking areas at many CTA rail stations. The Chicago Streets for Cycling Plan 2020 calls for a 645-mile network of biking facilities to be in place by the year 2020 to provide a bicycle accommodation within a half-mile of every Chicagoan. Some older adults participating in the survey were “active cyclists who participate in the Active Transportation Alliance.”
• Sustainable Chicago 2015 includes goals for the city to become the most bike and pedestrian friendly city in the country (Sustainability Council, 2013)
Key areas for improvement in Outdoor Spaces and Buildings Safe accessible streets and conditions for walking
• The majority of research participants (80%) were physically active. Although the city has taken steps for safer streets, 55.3% of survey participants rated conditions for walking fair or poor (Chicago Department of Transportation, 2014).
• Survey participants explained that snow accumulations near bus stops and in disabled parking spots prevents older adults from accessing these services. “Walking in community can be hazardous in winter time when ice on sidewalks” and can “prevent us from going out for a walk or even to vendors in our neighborhood.”
• Research participants with disabilities commented on specific street features that hindered their mobility. These included high curbs, which meant they had to ride in wheelchairs in the road, and “orange breakable, freezable, fragile bumps” at intersections which they described as “trip traps.” In addition, they commented on “the molded fancy brick walks” and stated, “It is hard to use a thin-wheeled chair or other handicapped mobile device on.”
Falls reduction: According to the Center for Disease Control and Prevention, one out of three older adults who are 65 or older will fall (Centers for Disease Control and Prevention, 2014).
• According to information provided by research participants, particular features that lead to falls include “unevenness,” “unexpected square cuts in cross walks,” faded cross walks, and “medallions” in sidewalks. See, for example, images taken by residents for the Chinatown photovoice project (Appendix IX).
Pedestrian street safety • Research participants commented on the limited window of time to cross the road at red lights.
Intersections without lights or pedestrian crossing lights obscured by trees can also be difficult to negotiate.
Safety of the neighborhood environment • Evidence from research participants suggests that fear of crime keeps older adults inside their homes and
away from activities that benefit their health and well-being. “Before you would see people sitting outside in front of their house on a hot summer day, kids playing. Nowadays at 6 o’clock in the evening people don’t want to walk because there are no people. All you see is cars and they are shooting.”

20
• 44% of survey respondents rated the safety of the physical neighborhood environment (where feeling safe means being able to walk or exercise outside without worrying about crime) fair or poor. Fear of crime, coded across all focus groups, was highest in North-West, Central-West and South-West regions.
o Crimes that made research participants feel particularly unsafe included gun crime and muggings at bus stops. Many felt deterred from going out into their neighborhoods after 6pm and on their own. According to The Chicago Plan for Public Health System Improvement 2012-2016, the highest rates of homicide mortality are seen in Fuller Park, Riverdale, North Lawndale, Greater Grand Crossing, and Englewood (Chicago Department of Public Health, 2012). North Lawndale and Englewood are two community areas with a high proportion of the population aged 55 and above, whose health and safety may be particularly impacted by crime.
Clean environments • According to The Chicago Plan for Public Health System Improvement 2012-2016, Riverdale has the
largest percent of residential vacancies, at 32% of all residential structures, followed by Fuller Park at 18%, and South Chicago and Englewood at 15%. South Chicago and Englewood are two communities with high populations aged 55 and over whose health and safety may be particularly impacted by vacant lots.
• To “benefit our neighborhood as a whole” and deter crime, research participants suggested prompt attention to dilapidated buildings, garbage in the streets, graffiti and overgrown lots.
Accessibility to public buildings • According to research participants, building features that reduce accessibility include revolving doors,
“a death trap for older people;” older building stock without elevators; and doors not wide enough to accommodate wheelchairs. Features that improve accessibility included “electrical door access and doors wide enough for both scooters and wheelchairs.”
Age-friendly businesses • Survey participants commented that access to gas station, restaurant, and store washrooms is not always
available. Research participants praised businesses who they felt looked after their needs. For example, “kudos to McD's on Cicero for one of the few cleared sidewalks during harsh winter and nice landscaping during summer and accessible Wi-Fi.”
Bicycling proficiency • According to research participants, increased bicycle traffic, particularly on sidewalks, diminishes
pedestrian safety. Fifty-one percent of survey respondents disagreed or strongly disagreed that cycling conditions are safe for pedestrians. Typical comments made by survey respondents include: “I am very concerned about the bicyclists; they do not obey the traffic signs/signals in any of the neighborhoods I frequent.”
• More enforcement of traffic laws and bicycling proficiency education is needed. Age Friendly Domain 2: Transportation Satisfaction Rating by Chicagoans: 3, Priority Ranking by stakeholders: 3 (out of 8 domains)
“Public transportation is readily available and opens up so many opportunities downtown and elsewhere.”
Affordable and accessible public transportation is an essential part of an age-friendly city infrastructure. This domain elicited information from respondents regarding their satisfaction with public transportation options. This includes location of transportation stations, accessibility of various forms of transportation, availability of options for public transit, parking, signage, and safety of transit options. Transportation was the third highest ranked domain, suggesting that older Chicagoans are satisfied with public transit compared to the other domains. Items with the greatest levels of satisfaction included conveniently located CTA train and bus stations. Lower ranked items included availability of ride share programs and safety of transportation.

21
Table 5: Transportation Items
Indicators Total n
Mean score*
1. CTA stations are conveniently located 2,404 1.97
2. CTA stations and bus stops are accessible for wheel chairs 1,961 2.30
3. Bus stops are conveniently located 2,409 1.84
4. Taxi cabs are available and accessible to me 2,184 2.41
5. Door-to-door transportation services (like PACE or private services) are available and accessible to me 1,388 2.17
6. There are ride-share programs available in my neighborhood 1,012 2.92
7. Parking, including spaces for people with a disability, is available 2,045 2.67
8. Signs for transportation (like bus stops, CTA stations) are clearly posted and easy to understand 2,406 2.00
9. The availability of transportation (CTA, bus, Metra, PACE, taxi cabs) in the neighborhood 2,432 2.32
10. The safety of transportation in your neighborhood (where feeling safe means safe from crime when waiting at a designated public transportation station or while using public transportation)
2,415 2.91
*Mean scores based on a 5 point Likert Scale with lowest score equal to greatest satisfaction Figure 8: Transportation
*Response options for items 9-10: Excellent, Very Good, Good, Fair, Poor
0%
10%
20%
30%
40%
50%
60%
70%
80%
90%
100%
Item 1 Item 2 Item 3 Item 4 Item 5 Item 6 Iten 7 Item 8 Item 9 Item 10
Transportation
Strongly Agree
Somewhat Agee
Neither
Somewhat Disagree
Strongly Disagree

22
Current age-friendly features for Transportation Availability of transportation
• Research participants consistently rated transportation choices available to them highly, with 59% of survey participants rating them as excellent or very good. Focus group respondents who lived close to bus and train transit were particularly satisfied: “Where I live, I live close to the train, I’m close to the bus stop. So I have the blue line and the green line. .. And I have the Madison bus and the Jackson bus. So the transportation is the best.”
• According to research participants, CTA buses and Pace were core community level resources. Pace is an advance reservation ride-sharing service providing para-transit services to individuals with disabilities and senior citizens.
Accessibility of CTA bus and train stations • Survey respondents strongly agreed or agreed that CTA train (79%) and bus (84%) stations were
conveniently located. • Sustainable Chicago 2015 aims to create healthy communities and connected neighborhoods
(Sustainability Council, 2013). Goals include increasing daily transit ridership on CTA trains and buses and prioritizing development around transit stations to improve safety and facilitate more use of public transportation
Accessibility of transportation • The City of Chicago’s CTA and Pace bus fleets are 100% accessible. Special equipment like lifts,
ramps, wheelchair securement areas, priority seating, and visual display announcements have been installed on all CTA and Pace buses to make fixed route bus service accessible to people with disabilities. (RTA Chicago website)
• Priority seating is available on CTA buses and trains. • The CTA has 1,865 buses that operate over 127 routes and 1,354 route miles. Buses make about 19,000
trips a day and serve 11,104 bus stops. Twenty percent of the city’s bus stops have bus shelters with transit trackers.
• According to the Milken Best Cities for Successful Aging data report the Metro area of Chicago-Napier- Joliet is 1st in the nation for average fare (Chatterjee, DeVol, & Irving, 2012).
• The City of Chicago taxi ordinance aims to create a taxi system that is cleaner, safer, and more accessible. (City of Chicago, 2014). Currently there are 172 wheelchair-accessible cabs managed by Open Taxis, a centralized dispatch center.
Key areas for improvement for Transportation Transport choices
• According to the Transit Connectivity Index (TCI), areas to the north and northwest areas of Chicago have a higher transit connectivity index than communities that are more often served by bus routes and have much lower access to transit: the far south, southwest, and northwest.(Chicago Department of Public Health, 2012).
• Focus group participants in the South-West group felt they did not have a choice of transportation and that it was essential to own a car “to get around.” A focus group participant made the following comment, which exemplifies this concern: “If it was easy to get around people would do it. They would use it, but when it is so difficult then people drive and there are accidents.”
• Changes to parking regulations impact seniors who drive in a variety of ways. Research participants reported being unable to shop for groceries, attend activities at senior centers, or invite family or healthcare professionals to park outside their homes. One survey participant unable to walk 20 feet reported difficulty in paying at meters spaced 50ft apart on streets.
• Thirteen percent of survey participants disagreed or strongly disagreed that door-to-door transportation options such as Pace and private services were available to them. Comments showed that lack of choice and unreliable service impacts attendance at health appointments and reduces social connectedness.
23
Transit accessibility • Major reasons cited by research participants for not using the CTA trains included lack of escalators
and/or elevators in CTA stations. For example, participants commented that the elevated train stations at Morse, Argyle and in the Loop are not accessible.
• The CTA online tracker system appears underutilized by older adults, with several survey respondents requesting “a central communication site to find out what streets, expressways, CTA lines are being worked on with alternative route options to get around in the city” so that older adults can plan their routes in advance.
Accessible signage • Stakeholders and older adults told us that they would like to see bilingual priority seating signs on CTA
and bilingual signs at bus stops: “Sometimes I can't read the words on bus stop because of language barriers.” Older adults commented that they found the directions on CTA travel map “too small to decipher; you'll need a magnifying glass” and some of the loudspeaker announcements at elevated train stations uncomfortably loud.
• While 78.6% of older adults surveyed strongly agreed or agreed that CTA stations were conveniently located and that 83.9% that bus stops were, several requested public seating at bus and train stops, along with “sun shelters” and heaters for the winter cold.
• Survey respondents told us that buses start and stop too quickly for most seniors to easily manage without danger of losing balance. As one older adult told us, “Many seniors will not get up until buses are stopped [for their own safety].” They also asked that priority seating for seniors be enforced. One focus group participant suggested a ‘Get Up!’ campaign.
Safety of transportation • Older adults’ perception of the safety of transportation affects their use of it. Thirty-five percent of
survey respondents rated safety fair or poor and several commented that they would not use the system after 6pm. Focus groups respondents commented: “I don’t even carry a real purse when I ride transportation… And that’s what you have to do to be safe.”
Age Friendly Domain 3: Housing Satisfaction Rating by Chicagoans: 8, Priority Ranking by stakeholders: 1 (out of 8 domains)
“Most seniors are on a fixed income and they are having a hard time making ends meet.” “I would just like to say. I love living in my house. And most seniors would love to live in their own home.”
Chicagoans working to deliver services and support to older adults living in the community told us that affordable housing in a safe neighborhood is essential to the safety and well-being of older adults and an important part of the built environment, affecting quality of life. Key age-friendly features are affordability, universal design, housing options and choices including aging in place, supportive, and assistive living. The Chicago Plan for Public Health System Improvement 2012-2016 defines affordable housing in Chicago as housing that costs up to 35% of household income (Chicago Department of Public Health, 2012). As people get older and their needs change, they consider moving to new homes that can better support their needs. It is important to note that the majority of survey respondents were home owners (66%) or renting (34%). The satisfaction ratings of homeless older adults are therefore not covered by this report (George, 2008). It is also relevant to note that this domain was ranked as the most important domain to attend to by stakeholders and ranked with the lowest satisfaction rankings by Chicagoans.
Housing items were split into two categories 1) Housing, 2) Your home. The items on housing related to the availability of various housing options in a person’s neighborhood. As a domain, respondents were least satisfied with housing options in their neighborhood. These rankings indicated poor perceived availability of supportive housing options, affordable housing options, and housing options with important amenities in respondents’ neighborhoods. It is worthwhile noting that as a domain, these items had fewer respondents than

24
other domains; on average, 46% of the respondents left these items blank, indicating that many respondents might not have known answers to these items.
*For ranking purposes the items on “your home” were not included in the domain index.
Table 6: Housing Items
Indicators Total n Mean
Score*
1. The availability of supportive housing options in your neighborhood (for example, assisted living communities, village networks, co-operatives) 1,604 3.24
2. The availability of affordable housing options in your neighborhood (including subsidized housing options) 1,544 3.47
3. The availability of housing options with amenities that are important to you (for example, pet-friendly options, parking spaces, door staff, exercise rooms, in-building laundry facilities)
1,742 3.01
*Mean scores based on a 5 point Likert Scale with lowest score equal to greatest satisfaction Figure 9: Housing
Your home Next, there were 5 items related to the accessibility and comfort of respondents’ homes. This section included items on heat, air conditioning, stairs, and accessibility. Ninety percent of respondents indicated that their home is warm enough in the winter, and 87% responded that it is cool enough in the summer. Thirty-three percent of the sample indicated having stairs leading to the main entrance of their homes, and 44% indicated needing to use stairs in their homes on a daily basis.
0%
10%
20%
30%
40%
50%
60%
70%
80%
90%
100%
Item 1 Item 2 Item 3
Excellent
Very Good
Good
Fair
Poor

25
Table 7: Your Home Items
Indicators N Mean Score*
1. My home is warm enough in the winter 2,456 1.09
2. My home is cool enough in the summer 2,414 1.13
3. There are stairs leading to the main entrance of my home 2,431 1.67
4. I have to go up and down stairs in my home on a daily basis 2,422 1.56
5. The doorways both inside and outside my home are wide enough for a wheelchair to fit through 1,727 1.30
*Mean scores based on a 5 point Likert Scale with lowest score equal to greatest satisfaction Figure 10: Your Home
Current age-friendly features of Housing Choice of housing
• Focus group participants (of whom the majority were home owners) told us about a range of housing choices in the city, including more unconventional types of living such as housing co-ops and reverse mortgaged homes. Survey participants who rated the affordability of the housing choices available to them were mixed in their opinions, with 22% indicating they are excellent or very good, 24% good, 27% fair, and 24% poor.
• In further analysis of the survey data, race and income were both found to significant predictors of housing and home responses.
Subsidized and public housing resources • The CHA has nearly 9,400 senior units in dozens of buildings located throughout Chicago. • Chicago is responsive to its diversity. For example, the Center on Halsted, CASL, CJE SeniorLife and
the South East Asian Center offer culturally appropriate and LGBTQ services and resources for seniors.
0%
10%
20%
30%
40%
50%
60%
70%
80%
90%
100%
Item 1 Item 2 Item 3 Item 4 Item 5
Yes
No

26
• The Senior Letter for MeterSave: Letters are sent to non-metered Chicago water customers receiving the senior sewer exemption informing them of the MeterSave Program and the ability to save water and money by getting a free water meter.
• The Amplified Telephone Distribution from the Chicago Hearing Society offers free landline phones for hard-of-hearing individuals who cannot otherwise use the phone.
Supportive and assisted living • Chicago is responsive to its diversity. As examples, Casa Central, Chicago Commons, and The
Resurrection Project offer supportive and assisted living and resources for mainly Hispanic and African American older adults. Housing Opportunities & Maintenance for the Elderly (H.O.M.E) offers intergenerational living options.
Heat and cold • The majority of survey respondents reported that their homes were warm enough in the winter (91%)
and cool enough in the summer (87%). • During the winter and summer months, the city operates 113 warming and cooling stations (Stuehrk,
2014). • The Chicago Department of Buildings enforces building code violations where living conditions are
impacting an older adult’s quality of life. These include lack of heat, hot and cold water, and electricity.
Key areas for improvement in Housing Affordable housing
• Housing for the new demographic is an issue across the nation as was recently acknowledged in the report “Housing America’s Older Adults” (Joint Center for Housing Studies, 2014). Our key stakeholders from government agencies and nonprofits prioritized housing as the number one age-friendly domain the city needs to address for the needs of older adults.
• Survey respondents (17% of whom were living below the poverty line) were mixed in their rating of the availability of supportive housing options; 29% rated the choices excellent or very good, 29% good, 22% fair, and 20% poor.
• Poverty data for 2009 showed that 38% of women and 30.6% of men aged 65 and over live below the poverty line in the city (City Data, 2014). In 2009, the overall poverty rate for Chicago residents of 27.5%. Given these facts, it is likely that the demand for affordable housing will increase.
Aging in place at home • According to data from Public Policy and Aging, current nursing home provision across the US will be
insufficient to accommodate the baby boomer generation (Society, September 2014). Home modifications can reverse the nursing home trend and help people age in place. As one survey participant commented: “I don't think we have any accessible condo buildings in our community--most of the housing is older, and condos tend to be 3 or 6-flats with stairs. We really want to stay in this community but are wondering if it will be possible.”
• Thirty-three percent of survey respondents replied that they had to use stairs to enter their homes and 44% responded that they used stairs within their homes on a daily basis. If all of these respondents were to choose to age in place it is likely that they would need to adapt their homes in order to do so. The installation of ramps alone may not be sufficient to allow access to homes, as 30% of survey respondents reported that the doors to their homes were not wide enough to take a wheelchair.
• A majority of adults over the age of 65 live on fixed income (United States Department of Labor, 2008). Survey respondents told us that when property taxes or electricity and gas prices increase they struggle to make ends meet. Small changes can affect “the ability of older people to stay in their homes.”
• Accessible transportation was a key factor affecting the ratings of housing. For example, one survey respondent commented: “I’m in a senior building and the bus stops right in front of the building. An uh, everywhere you go, it almost takes you there.”

27
Hoarding • According to key stakeholders, hoarding due to an inability to care for one self is a growing problem
among older adults in Chicago. Enforcement of this building code violation can lead to eviction from the home and homelessness.
Heating and cooling • According to data from the Social Impact Research Center, 47% of the poorest seniors (where poverty is
below $12,000) do not have a cooling center within quarter of a mile of their home. On a hot day, walking or waiting for public transit can be unsafe (Stuehrk, 2014).
Age Friendly Domain 4: Respect and Social Inclusion Satisfaction Rating by Chicagoans: 4, Priority Ranking by stakeholders: 6 (out of 8 domains) ‘They [alderman’s office] sometimes drive by to see if the papers have been on the porch too long. The mailman does that too if the paper stay on the porch. They notify the post office. And the post office sometimes will notify
the alderman”
The WHO designates the availability of social networks and places to meet with people of all cultures, ethnicities, ages; the affordability of social, cultural, and religious activities; and opportunities for intergenerational interaction, as key features of respect and social inclusion. Of the 5 items on respect and social inclusion in the survey respondents were most satisfied with social networks in their neighborhoods, including block clubs, community centers, and social clubs. The North and North West regions had the greatest satisfaction with respect and social inclusion, and Central-West had the least.
Table 8: Respect and Social Inclusion Items
Indicators n Mean Score*
1. There are social networks in my neighborhood (including kinship, block clubs, social clubs, churches, community centers) 2,125 2.06
2. There are opportunities for intergenerational interaction (at schools, youth clubs, senior centers, family activities in the community) 1,866 2.38
3. The social activities in my neighborhood are for people of all age groups and cultures 1,951 2.41
4. Older adults living in my neighborhood feel isolated and lonely 1,565 2.88
5. Older adults in my neighborhood are respected 2,096 2.55
*Mean scores based on a 5 point Likert Scale with lowest score equal to greatest satisfaction

28
Figure 11: Respect and Social Inclusion
Current age-friendly features of Respect and Social Inclusion Social connectedness
• Compared to a study conducted by researchers from the University of California, San Francisco, which indicates 43% of seniors report feeling lonely on a regular basis (Perissonotto, 2012), only 27% of Chicagoans participating in the survey report having felt lonely or isolated in their home at some time, although they do report stronger agreement with the statement ‘older adults living in my neighborhood feel isolated and lonely.’
• Seventy-six percent of survey participants across the city strongly agreed or agreed that there are social networks in their neighborhood, including kinship, block clubs, social clubs, churches, and community centers. Information provided by focus groups showed that churches have a significant social networking role in the North-East, North-West, South-West and Central-West, while block clubs featured strongly in the South-East and senior centers in North-East and Central-West.
Social inclusion and diversity • The city of Chicago’s older population speaks a range of languages from a broad cultural spectrum. Data
from the 2012 ACS suggests that of the city’s 551,535 older Chicagoans aged 55 and over, 5% are of Asian ethnicity (29,506); 36% are African American (199,338) and 16% are Hispanic (87,874) (CLESE, 2012). Evidence from research participants suggests that older adults are aware of opportunities to engage with different age groups and cultures and that communities respect their senior citizens. For example, 62% strongly agreed or agreed that there are opportunities for intergenerational interaction at schools, youth clubs, senior centers, family activities in the community). Sixty-one percent strongly agreed or agreed that the social activities in their neighborhood are for people of all age groups and cultures.
• Information from a windshield audit of the Rogers Park neighborhood noted an abundance of signs acknowledging senior citizens and celebrating diversity, as well as advertising a range of available community services. (Appendix V)
• Fifty percent of survey respondents strongly agreed or agreed that older adults in their neighborhood are respected.
• Survey participants commented on a variety of community activities they had taken part in and enjoyed. For example, "My neighborhood is a very good place to live. There is involvement in community events and a respect for the elderly. Thank you 45th ward for the security I enjoy."
0%
10%
20%
30%
40%
50%
60%
70%
80%
90%
100%
Item 1 Item 2 Item 3 Item 4 Item 5
Strongly Agree
Somewhat Agree
Neither
Somewhat Disagree
Strongly Disagree
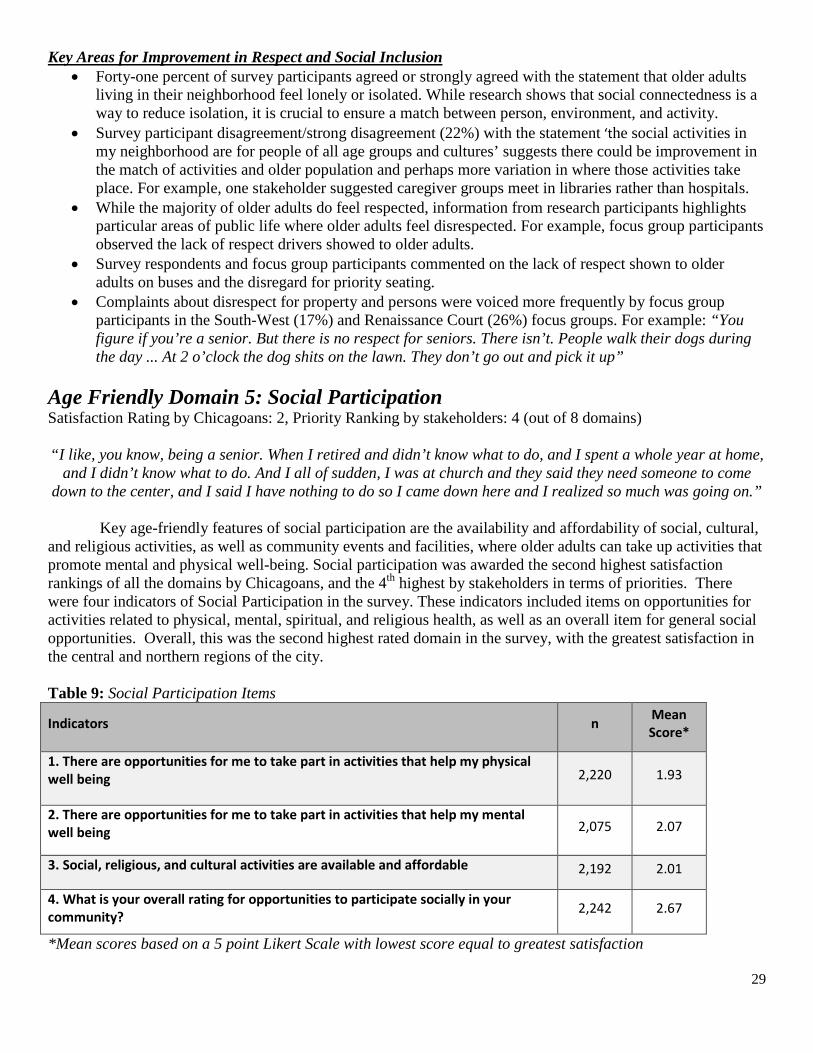
29
Key Areas for Improvement in Respect and Social Inclusion • Forty-one percent of survey participants agreed or strongly agreed with the statement that older adults
living in their neighborhood feel lonely or isolated. While research shows that social connectedness is a way to reduce isolation, it is crucial to ensure a match between person, environment, and activity.
• Survey participant disagreement/strong disagreement (22%) with the statement ‘the social activities in my neighborhood are for people of all age groups and cultures’ suggests there could be improvement in the match of activities and older population and perhaps more variation in where those activities take place. For example, one stakeholder suggested caregiver groups meet in libraries rather than hospitals.
• While the majority of older adults do feel respected, information from research participants highlights particular areas of public life where older adults feel disrespected. For example, focus group participants observed the lack of respect drivers showed to older adults.
• Survey respondents and focus group participants commented on the lack of respect shown to older adults on buses and the disregard for priority seating.
• Complaints about disrespect for property and persons were voiced more frequently by focus group participants in the South-West (17%) and Renaissance Court (26%) focus groups. For example: “You figure if you’re a senior. But there is no respect for seniors. There isn’t. People walk their dogs during the day ... At 2 o’clock the dog shits on the lawn. They don’t go out and pick it up”
Age Friendly Domain 5: Social Participation Satisfaction Rating by Chicagoans: 2, Priority Ranking by stakeholders: 4 (out of 8 domains) “I like, you know, being a senior. When I retired and didn’t know what to do, and I spent a whole year at home,
and I didn’t know what to do. And I all of sudden, I was at church and they said they need someone to come down to the center, and I said I have nothing to do so I came down here and I realized so much was going on.”
Key age-friendly features of social participation are the availability and affordability of social, cultural,
and religious activities, as well as community events and facilities, where older adults can take up activities that promote mental and physical well-being. Social participation was awarded the second highest satisfaction rankings of all the domains by Chicagoans, and the 4th highest by stakeholders in terms of priorities. There were four indicators of Social Participation in the survey. These indicators included items on opportunities for activities related to physical, mental, spiritual, and religious health, as well as an overall item for general social opportunities. Overall, this was the second highest rated domain in the survey, with the greatest satisfaction in the central and northern regions of the city.
Table 9: Social Participation Items
Indicators n Mean Score*
1. There are opportunities for me to take part in activities that help my physical well being 2,220 1.93
2. There are opportunities for me to take part in activities that help my mental well being 2,075 2.07
3. Social, religious, and cultural activities are available and affordable 2,192 2.01
4. What is your overall rating for opportunities to participate socially in your community? 2,242 2.67
*Mean scores based on a 5 point Likert Scale with lowest score equal to greatest satisfaction

30
Figure 12: Social Participation
*Response options for item 4: Excellent, Very Good, Good, Fair, Poor Current age-friendly features of Social Participation Availability and affordability
• Seventy-five percent of survey participants strongly agreed or agreed that social, cultural, and religious activities were available and affordable to them. For many focus group participants, where the activities took place was an important as the activity itself: “I have been coming here [a senior center] for 10 years. I am very happy. In my case I was very bored, I stressed out a lot, and I come here all the days and I’m very happy. I have very good friends and all activities I love.” Polling at a town hall event in Chinatown showed strong awareness of available social networks among limited English speakers, with 92% agreeing or strongly agreeing that there were opportunities for social participation.
• A large range of activities relating to health, social services, physical and mental well-being take place in the 21 senior centers run by the DFSS. Focus group participants told us how they benefitted from events and activities in DFSS senior centers. For example, “I have 17 years in this center, before I came to the center I was nervous really stressed. I often cried without knowing why… My life has changed because here I found a family. Here I’m happy.”
• Focus group participants told us about a range of neighborhood events and programs they attended to maintain physical and mental well-being. These included health fairs, YMCA programs, the Salvation Army Kroc Center, Niles Fitness Center, and Ping Tom Park; the warm therapy pool at the Rehabilitation Institute of Chicago and Chicago Park District swimming facilities; social events at church; and block clubs.
Key areas for improvement for Social Participation While information obtained from research participants shows the majority are aware that there are community-level activities to be engaged in, a sizable number of survey respondents rated opportunities to participate socially in their community as fair or poor (26%). Evidence from research participants suggests a number of reasons. For example:
• Older adults may not know what is available. One survey participant commented, “I am curious about activities/social gatherings for the older/aging gay community in my neighborhood.”
0%
10%
20%
30%
40%
50%
60%
70%
80%
90%
100%
Item 1 Item 2 Item 3 Item 4
Strongly Agree
Somewhat Agree
Neither
SomewhatDisagree
Strongly Disagree

31
• Survey participants with disabilities noted particular difficulty travelling by public transportation in winter. Others commented about the distances required to travel to access particular activities and preferred teachers. Crowded senior centers and restrictive parking options were also listed.
• Focus group participants observed the need to expand senior center outreach: “This is a magnificent center. But we older people need a system where … people can become aware of these centers... this is such a great big center paid for by the government and the city, [but] they are not aware.”
• Survey participants suggested broadening the appeal of senior centers to all older adults 55 and older. • Opportunities to take part in activities that help physical and mental well-being may be less accessible to
limited English speakers. For example, 17% of those completing the Spanish survey indicated that they strongly disagreed or did not know about activities that support physical well-being compared with 13% of respondents overall.
Age Friendly Domain 6: Communication and Information Satisfaction Rating by Chicagoans: 1, Priority Ranking by stakeholders: 5 (out of 8 domains) “I think everyone should have one of those [City Information Guide] hanging someplace where they can see it,
if an emergency comes up than you will know where to call. Just look at that sheet. It is right on there.”
The domain of communication and information showed greater satisfaction than any other domain included in the survey. There were six indicators related to communication and information in the survey. These indicators included content on ability to access information on healthcare services and health-related information, what to do in case of emergency, availability of access to computers, education on technology, and information in various languages. Overall, there was greatest satisfaction with the item, ‘I can access information I need in a language and format I easily understand,’ and least satisfaction with, ‘I know where I can go to learn about new technologies.’ Findings reveal that older adults are aware of services and opportunities, but may be lacking the education and knowledge to make use of them. Table 10: Communication and Information Items
Indicators n Mean Score*
1. If I need information on healthcare services and health-related support, I know where to find it (including disease-specific information, home care options, and caregiving)
2,235 2.00
2. I know what to do in case of an environmental emergency (including a flood, an electrical outage, extreme heat or cold, a fire) 2,313 2.18
3. I know what to do in case of a health-related emergency (including myself or someone nearby experiencing a heart attack, stroke, or fall) 2,349 1.87
4. There are places for me to go to access free computers, internet, and wireless services. 2,009 1.86
5. I know where I can go to learn about new technologies 1,973 2.25
6. I can access information I need in a language and format I easily understand 2,103 1.73
*Mean scores based on a 5 point Likert Scale with lowest score equal to greatest satisfaction

32
Figure 13: Communication and Information
Current age friendly features for Communication and Information Availability of information
• According to information collected from research participants, ‘go-to’ places for support at the local community level included Forward Chicago, CJE SeniorLife, Lincoln Park Village, SOAR, North Center Senior Campus, Mather More than a Cafes, senior centers, fitness centers, churches, community health centers, universities, aldermen, district meetings, community police, the Catholic Charities, and for CHA residents, their CHA resident supervisor.
• Seventy-six percent of survey participants strongly agreed or agreed that ‘If I need information on healthcare services and health-related support, I know where to find it (including disease-specific information, home care options, and caregiving). Eighty-three percent strongly agreed or agreed that they could access the information they needed in a language and format they understood. Of note, only 60% of Spanish survey participants agreed or strongly agreed with the latter item.
• Key stakeholders reported on the City’s initiatives to expand public computer access at the city's senior centers and deploy assistive technologies. Eighty-one percent of research participants strongly agreed or agreed that ‘there are places for me to go to access free computers, internet, and Wi-Fi.’
Emergency preparedness • Eighty-three percent of survey respondents strongly agreed or agreed that they knew what to do in case
of a health-related emergency, including if they or someone nearby was experiencing a heart attack, stroke, or fall.
• Seventy-three percent of survey respondents strongly agreed or agreed that they know what to do in case of an environmental emergency, including a flood, an electrical outage, extreme heat or cold, or a fire. This may be lower among non-English speakers. For example, 56% of those polled in Chinatown strongly agreed or agreed that they know what to do in case of an environmental or health emergency, and 66% of Spanish language survey respondents agreed or strongly agreed.
• During severe weather conditions, city police districts have contact lists and phone trees to ensure that seniors are safe and do not need additional assistance.
0%
10%
20%
30%
40%
50%
60%
70%
80%
90%
100%
Item 1 Item 2 Item 3 Item 4 Item 5 Item 6
Strongly Agree
Somewhat Agree
Neither
Somewhat Disagree
Strongly Disagree
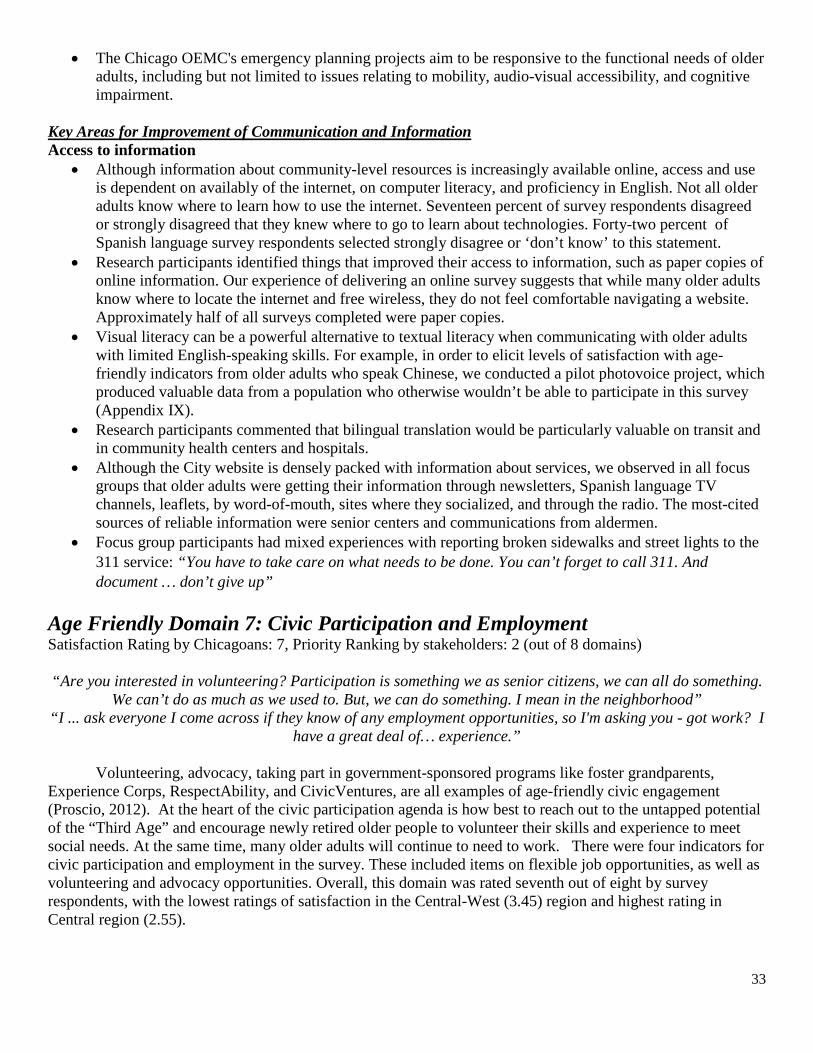
33
• The Chicago OEMC's emergency planning projects aim to be responsive to the functional needs of older adults, including but not limited to issues relating to mobility, audio-visual accessibility, and cognitive impairment.
Key Areas for Improvement of Communication and Information Access to information
• Although information about community-level resources is increasingly available online, access and use is dependent on availably of the internet, on computer literacy, and proficiency in English. Not all older adults know where to learn how to use the internet. Seventeen percent of survey respondents disagreed or strongly disagreed that they knew where to go to learn about technologies. Forty-two percent of Spanish language survey respondents selected strongly disagree or ‘don’t know’ to this statement.
• Research participants identified things that improved their access to information, such as paper copies of online information. Our experience of delivering an online survey suggests that while many older adults know where to locate the internet and free wireless, they do not feel comfortable navigating a website. Approximately half of all surveys completed were paper copies.
• Visual literacy can be a powerful alternative to textual literacy when communicating with older adults with limited English-speaking skills. For example, in order to elicit levels of satisfaction with age-friendly indicators from older adults who speak Chinese, we conducted a pilot photovoice project, which produced valuable data from a population who otherwise wouldn’t be able to participate in this survey (Appendix IX).
• Research participants commented that bilingual translation would be particularly valuable on transit and in community health centers and hospitals.
• Although the City website is densely packed with information about services, we observed in all focus groups that older adults were getting their information through newsletters, Spanish language TV channels, leaflets, by word-of-mouth, sites where they socialized, and through the radio. The most-cited sources of reliable information were senior centers and communications from aldermen.
• Focus group participants had mixed experiences with reporting broken sidewalks and street lights to the 311 service: “You have to take care on what needs to be done. You can’t forget to call 311. And document … don’t give up”
Age Friendly Domain 7: Civic Participation and Employment Satisfaction Rating by Chicagoans: 7, Priority Ranking by stakeholders: 2 (out of 8 domains) “Are you interested in volunteering? Participation is something we as senior citizens, we can all do something.
We can’t do as much as we used to. But, we can do something. I mean in the neighborhood” “I ... ask everyone I come across if they know of any employment opportunities, so I'm asking you - got work? I
have a great deal of… experience.”
Volunteering, advocacy, taking part in government-sponsored programs like foster grandparents, Experience Corps, RespectAbility, and CivicVentures, are all examples of age-friendly civic engagement (Proscio, 2012). At the heart of the civic participation agenda is how best to reach out to the untapped potential of the “Third Age” and encourage newly retired older people to volunteer their skills and experience to meet social needs. At the same time, many older adults will continue to need to work. There were four indicators for civic participation and employment in the survey. These included items on flexible job opportunities, as well as volunteering and advocacy opportunities. Overall, this domain was rated seventh out of eight by survey respondents, with the lowest ratings of satisfaction in the Central-West (3.45) region and highest rating in Central region (2.55).

34
Table 11: Civic Participation and Employment Items
Indicators n mean score*
1. There are flexible job opportunities for people aged 60 and over 1,443 3.83
2. There are opportunities for leadership and advocacy 1,657 2.90
3. There are opportunities for involvement in volunteer activities 2,014 2.15
4. What is your overall rating for civic participation in your community? 2,029 3.00
*Mean scores based on a 5 point Likert Scale with lowest score equal to greatest satisfaction Figure 14: Civic Participation and Employment
*Response options for item 4: Excellent, Very Good, Good, Fair, Poor Current age friendly features of Civic Participation and Employment Engagement
• Seventy-one percent of survey respondents strongly agreed or agreed that there were opportunities to volunteer in their neighborhood. Research participants told us that they volunteered at a range of settings, including senior centers, food distribution services, hospitals, aldermanic offices, and religious charity groups.
• Survey respondents reported a variety of civic engagement activities. For example, they reported membership in civic organizations such as housing watch dogs, Action Now, Can TV, Cease Fire, Forward Chicago, and SOAR.
• Many older adults are in contact with their aldermen. Over 500 survey respondents indicated that they had learned about the survey through communications from their aldermanic office.
Availability of volunteer options • Research participants who do volunteer find it rewarding. For example, one focus group participant in
the North-East commented: “We got all the names of the seniors and we checked them out, you know and got their vital signs and see what they need. We make sure their house is [alright]… it gave more pep to my life.”
0%
10%
20%
30%
40%
50%
60%
70%
80%
90%
100%
Item 1 Item 2 Item 3 Item 4
Strongly Agree
Somewhat Agree
Neither
SomewhatDisagree
Strongly Disagree

35
Key areas for improvement in Civic Participation and Employment Availability of opportunities for leadership and advocacy
• According to the AdvantAge survey, 90% of older adults in North-West Chicago voted in local elections, suggesting a high level of engagement with community-based civic activity and opportunities for leadership and advocacy. However, only 45% of survey respondents agreed or strongly agreed that there were opportunities for leadership and advocacy in their communities.
• Thirty-four percent of survey respondents rated the opportunities for civic engagement poor or fair in their community. Ratings for opportunities for civic participation were lower among limited English speakers, with 41% of Spanish and Polish language survey respondents choosing fair or poor, and 11% selecting ‘don’t know.’ Stakeholders commented that a lack of documentation deters civic engagement.
Flexibility of volunteer opportunities • The majority of survey research participants (64%) recorded that they were retired. The lowest rate of
retirement was in Central-West (9%) and the highest in the North (19%), suggesting it may be harder to recruit older volunteers in some regions.
• Several focus group and survey participants commented on the number of volunteer activities they were engaged in. Most were senior-related. Twenty percent of survey respondents disagreed or strongly disagreed that there were opportunities for intergenerational activity available to them.
• Satisfaction with the availability of volunteering opportunities was lowest amongst limited English speakers, with 40% of Spanish language survey respondents strongly agreeing or agreeing on the availability of volunteer opportunities, and 14% replying that they did not know about opportunities. Stakeholders commented that informal, culturally sensitive support networks are an alternative to formal volunteering networks, but are rarely measured for effectiveness. For example, one focus group participant living in a Section 8 building commented, “We help each other, we say hello when we see [each other], and it’s good there.”
Availability of flexible age-friendly employment • Fifteen percent of survey participants were employed, and this figure is likely to increase. According to
the Bureau of Labor Statistics, workers aged 55-64 are expected to climb by 36.5%,with a dramatic 80% growth of workers between the ages of 65 and 74, and those aged 75 and up (United States Department of Labor, 2008). By 2016, workers aged 65 and over are expected to account for 6.1% of the total labor force, up sharply from their 2006 share of 3.6%. However, 63% of survey participants disagreed or strongly disagreed that there are flexible job opportunities for people aged 60 and above in their neighborhood.
Celebrating caregivers • According to US National Alliance for Caregiving, 17% of American households include a caregiver for
an older adult aged 50 or over. Forty-three percent of focus group study participants and 16% of survey participants reported some caregiving (MetLife Foundation, 2009). Reports of caregiving ranged from 8% in the South-East region to 21% in the North region.
• A 2009 report by the AARP Public Policy Institute Family (Feinberg, 2011) calculated that caregivers provided the equivalent of 450 billion dollars’ worth of care to their adult parents and other loved ones, ‘an amount that makes caregivers one of the largest and most overlooked pillars of the U.S. healthcare system.’
Age Friendly Domain 8: Community Support and Health Services Satisfaction Rating by Chicagoans: 5, Priority Ranking by stakeholders: 7 (out of 8 domains)
“I have read about healthcare communities, in which home health visits, etc. are available to folks living at home within a certain radius. I think this is a good idea & am going to explore this.”
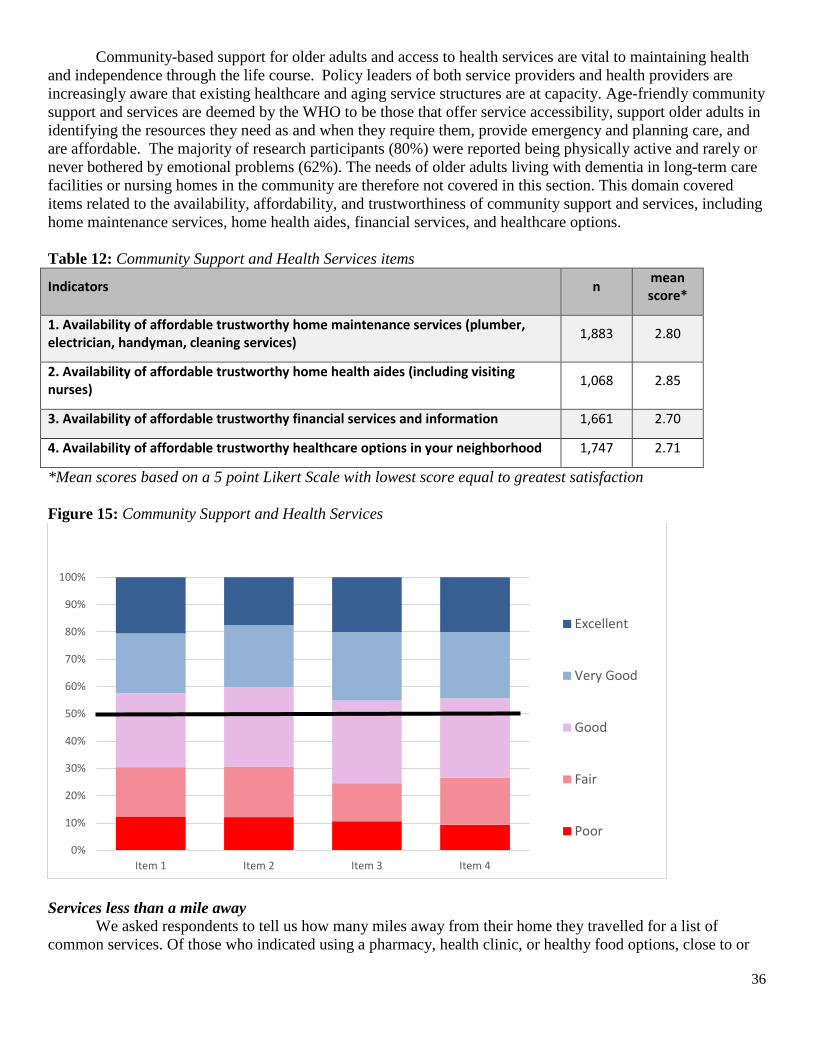
36
Community-based support for older adults and access to health services are vital to maintaining health and independence through the life course. Policy leaders of both service providers and health providers are increasingly aware that existing healthcare and aging service structures are at capacity. Age-friendly community support and services are deemed by the WHO to be those that offer service accessibility, support older adults in identifying the resources they need as and when they require them, provide emergency and planning care, and are affordable. The majority of research participants (80%) were reported being physically active and rarely or never bothered by emotional problems (62%). The needs of older adults living with dementia in long-term care facilities or nursing homes in the community are therefore not covered in this section. This domain covered items related to the availability, affordability, and trustworthiness of community support and services, including home maintenance services, home health aides, financial services, and healthcare options. Table 12: Community Support and Health Services items
Indicators n mean score*
1. Availability of affordable trustworthy home maintenance services (plumber, electrician, handyman, cleaning services) 1,883 2.80
2. Availability of affordable trustworthy home health aides (including visiting nurses) 1,068 2.85
3. Availability of affordable trustworthy financial services and information 1,661 2.70
4. Availability of affordable trustworthy healthcare options in your neighborhood 1,747 2.71
*Mean scores based on a 5 point Likert Scale with lowest score equal to greatest satisfaction Figure 15: Community Support and Health Services
Services less than a mile away We asked respondents to tell us how many miles away from their home they travelled for a list of common services. Of those who indicated using a pharmacy, health clinic, or healthy food options, close to or
0%
10%
20%
30%
40%
50%
60%
70%
80%
90%
100%
Item 1 Item 2 Item 3 Item 4
Excellent
Very Good
Good
Fair
Poor

37
more than half had those services within a mile of their homes. Almost all respondents stated that they go to a doctor, primary care physician, or nurse practitioner, but only 18% went to one within a mile of their homes. This finding underscores the importance of public transportation options in maintaining health. Less than 20% of respondents who go to an ophthalmologist, dentist, physical therapist, or mental health practitioner go to one that is less than a mile from their homes. Interestingly, only 25% of the sample stated that they go to a psychologist, psychiatrist, therapist, or other mental healthcare provider. Table 13: Services within 1 mile of a person’s home
Services Total who
use this service
Service is Less than a mile away
Percent
Doctor, primary care physician, or nurse practitioner 2,415 443 18.34%
Eye Doctor (ophthalmologist) 2,292 393 17.15%
Dentist 2,220 483 21.76%
Pharmacy 2,289 1399 61.12%
Physical Therapist 1,161 326 28.08%
Psychologist, psychiatrist, therapist, or other mental health services, including support groups 668 129 19.31%
Health clinic for preventive support (flu shots, vaccinations, blood pressure or blood sugar checks)
1,882 875 46.49%
Healthy food options (fresh fruit and vegetables, healthy menu options)
2,328 1361 58.46%
Figure 16: Services in Neighborhood
0
500
1000
1500
2000
2500
3000
Pharmacy Healthy Food Health Clinic Dentist Doctor Eye Doctor PhysicalTherapist
Mental Health
# who use # who have the service less than 1 mile away

38
Table 14: Services less than a mile away by Region Number of
Services North North-West
North-Central Central Central-
West South-
East South TOTAL
0 Services less than a mile away
109, 16.59%
123, 18.72%
51, 7.76%
39, 5.94%
110, 16.74%
78, 11.87%
147, 22.37%
657, 27.63%
1-3 services less than a mile away
316, 26.79%
209, 17.17%
228, 18.74%
160, 13.15%
80, 6.57%
105, 8.63%
119 9.78%
1,217, 51.18%
4-8 services less than a mile away
58, 11.51%
53, 10.52%
90, 17.86%
196, 38.89%
24, 4.76%
59, 11.71%
24, 4.76%
504, 21.19%
Current age-friendly features for Community Support and Health Services Aging in place support
• Aging in place is the preference of most older adults who can afford to do so. Those that do can expect to live into their 80s and 90s. Research participants and key informants identified supportive features of their environments that were enabling them to age comfortably and safely within their community of choice. For example, o According to information collected as part of a walking audit in one community area, Rogers Park,
community-level resources that support aging in place incorporate community health, mental health and well-being, and the physical environment.
o Older adults in Chinatown photographed the senior housing where they lived, Ping Tom Park where they exercised, and the CASL Center where they socialized (Appendix IX).
o Survey participants mentioned ‘village’ models. One asked, ”Is the city aware of this and do they help citizens start such programs in their neighborhood?”
Access to healthcare and healthy foods • Among survey respondents, 61% said that they travel less than a mile to visit their pharmacy and 41%
that they travelled less than a mile to their health clinic. • Fifty-eight percent of survey respondents said that they had access to healthy foods within less than a
mile. • The Greater Chicago Food Depository delivers food boxes to senior centers and CHA buildings and also
offers cooking guidance. • The Chicago Health Atlas provides citywide information about health trends and affordable local
resources (Chicago Health Atlas, 2014). Southsidehealth.org provides information about resources like healthcare, housing (including senior housing), food options, and gyms in some neighborhoods on the South Side of Chicago (MAPS Corps, 2014), .
• A profile of Health and Health Resources within Chicago’s 77 communities includes maps of available community assets and healthcare resources for four community areas in Chicago: Albany Park, Chicago Lawn, South Lawndale, and Auburn Gresham (Yonek & Hasnain-Wynia, 2011).
Safety and protection • The city provides several protective services for older adults in addition to 311 and 911. According to
information provided by research participants, these include: CCHR, focusing on age discrimination in the workplace, housing issues, and public accommodations, and community tensions; the Daly Center for Abuse; the Wellbeing Task Force; the Community Police Senior Ambassador program; and street safety seminars. Police also respond to medical bracelets data to track lost and confused older adults, and the fire department conducts home safety checks.
Key areas for improvement Aging in place support
• The majority of the older adults who participated in the survey were aging in place with the ability to undertake everyday physical activities such as carrying groceries and walking up stairs; 80% reported

39
being completely or mostly able, and 6% a little or not at all. Given that those being polled may be unaware of home services or unsure of their personal relevance, there seems to be uncertainty of the trustworthiness of the services currently on offer. For example,
• Thirty percent strongly disagreed or disagreed that affordable trustworthy home maintenance services (like a plumber, electrician, handyman, or cleaning services) and trustworthy home health aides (including visiting nurses) were available. This rate may be higher among non-English speakers and low income older adults unable to afford these services. For example, 48% of those polled in the Chinatown town hall rated choices of affordable healthcare options, home maintenance, and financial services fair or poor, and 25% reported being ‘undecided.’
• Twenty-three percent disagreed or strongly disagreed that affordable trustworthy financial services and information were available.
Access to affordable care • According to The Chicago Plan for Public Health System Improvement 2012-2016, a lack of available
locally-based healthcare options is a barrier to staying healthy (Chicago Department of Public Health, 2012).
• Twenty-seven percent of survey participants strongly disagreed or disagreed with the statement that affordable trustworthy healthcare options were available in their neighborhood. Analysis of research participant responses suggests a low local availability of some specific healthcare options for older adults. Thirty-two percent of respondents recorded that their doctor and dentist was over 5 miles away from their homes. Forty-eight percent told us that they had never used a physical therapist and of those that did, 23% travelled between 1 and 5 miles to access the service. Seventy-one percent said they had never used mental health services, including support groups. Of those that did, 23% had to travel over a mile to access these services.
• Survey respondents from South, South East, Central-West, North, and North-West regions recorded the lowest proximity to services less than a mile away (4.76% -11.71%) while those from the North-West (17.86%) and Central (39%) regions reported higher levels of proximity to services within a mile or less.
• Information from a windshield audit from the Rogers Park neighborhood and comments made during the survey suggest that older adults consider locally available healthcare services important community assets: "Lakeview is a pretty nice community. I do get a lot of senior services and recently had physical therapy in the home. Still have a nurse come and check me."
Neighborhood safety • Neighborhood security is a key issue for all research participants, with 43.8% rating it fair or poor. This
varies by neighborhood and whether respondents indicated that English was their first language. For example, 51% of participants at the Chinatown town hall participants rated neighborhood safety fair, poor, or undecided. This rating was in line with the top concerns identified by the Community Vision Plan for Chinatown study (Chicago Metropolitan Agency for Planning, 2014). Photovoice evidence suggests why this might be the case in Chinatown. (Appendix IX)
• According to the Chicago Public Health System report, homicide mortality rates vary by community areas. The highest rates are seen in Fuller Park, Riverdale, North Lawndale, Greater Grand Crossing, and Englewood. North Lawndale and Englewood are also areas with high numbers of older adults. Survey comments from these neighborhoods included, “Walking in my neighborhood can be quite dangerous. Could be more police presence.”
Additional resources • The three most likely chronic illnesses to affect an older adult aging in place are arthritis, diabetes, and
heart conditions. Survey participants commented on resources that would enhance their health and well-being. These included freely available aquatic facilities with warm water therapy sessions, more senior centers, a strong partnership with the aging and disability resource centers to ensure the city becomes a

40
leading place for older adults and individuals with disabilities to live, and more free disabled parking spaces on the streets.
Discussion
The response to the community-wide survey exceeded conservative estimates. Many older adults used the comments section of the survey to articulate how important they thought the survey was. A typical comment read: “Thanks for doing this survey; I hope we'll hear the results!” One challenge resulting from the large response rate was a corresponding increase in complexity of the analysis. To address this problem, we sourced additional funds for a statistician to consult for data quality control, data preparations, and further analyses. Enthusiasm from the research community also resulted in three students in the Masters of Public Health program at UIC joining the project for intern experience. Without these students, it would have been difficult to meet the demand for on-site visits (where project team members visited a site and set up a computer to allow online completion of the survey) and for paper copy distribution of the survey at large community events such as the Alderman’s Maifest Lunch organized by Forward Chicago and the Mather Edgewater Luncheon.
While being a community engaged project, the Age-Friendly initiative is nevertheless primarily a policy-building exercise, collecting data to enable government agencies to improve and develop services and an environment that sustains older adults as they age in place. The core elements of what constitutes an age-friendly community and its indicators are defined and described by the WHO for use by government agencies and community groups. Older adults of all ages, ethnicities, and education levels are surveyed. One lesson we learned is that the generic model of age-friendliness as defined by the WHO is not a one size fits all one. The one senior center that declined to partner with us in disseminating the survey did so because they had wanted to be included in the development of the survey from the outset, and because they felt the questions didn’t match the experience or needs of their mainly Hispanic members. At our town hall event with CASL, questions which attracted the most ‘don’t know’ responses were those focused on housing. We observed, for example, that respondents to questions about supportive housing polled 26% ‘don’t know’ answers, suggesting that they either hadn’t thought about these options, were uncertain what they might be, or did not understand the question. We plan to address the shortcomings of the generic approach by working further with communities interested in building on the survey data findings.
We received some feedback that the language used in the Spanish language survey was overly “formal” and not accessible to older adults taking the survey. In addition, we received anecdotal feedback that Polish language speakers are not familiar with Likert-scale survey design distinctions – response items in a range from strongly agree to strongly disagree, for instance. Some survey respondents felt the survey was long and time-intensive. Overall, however, response to the survey was very positive. Research team members were warmly received at in-person meetings and events, and many survey respondents expressed thanks to researchers at Northwestern, to the City of Chicago, and to the sponsors of this project in the comments section of the survey. Conclusion and Recommendations
The purpose of this report is twofold. First, it provides the City of Chicago with age-friendly indicators suited to the city.
Second, this report provides the city with evidence to generate policy initiatives for all older Chicagoans aged 55 and over. To deliver this, we have presented generic regional age-friendly and (un) friendly features that older adults have prioritized for us based on their satisfaction ratings of the indicators included in the survey. Further investigation is necessary to determine differences between neighborhoods.
Findings indicate that all eight domains are interrelated. Affordable housing, health care resources and community assets all work together to create an age-friendly city. Many survey respondents were living in communities where they felt they would be able to stay in their current homes as they age. However several noted environmental and financial factors which could threaten this ability such as crime (particularly in the vicinity of homes and transit stations), pedestrian safety, few transit options, changes to commercial services

41
(such as the closure of local grocery stores), uncertainty about healthcare and support service options for older adults (particularly amongst limited English speakers), and changes in property taxes.
Based on these findings we recommend that the city continue to champion existing assets such as senior centers, parks and outdoor spaces, transit choices, while considering initiatives to build capacity in the following areas:
• Caregiver recognition and support • Falls reduction (Safe accessible streets and conditions for walking) • Pedestrian street safety (including cycling proficiency) • Safety of neighborhoods and clean environments • Accessibility to public buildings • Age-Friendly businesses • Transport choices, transit accessibility and safety • Affordable housing and conditions to age in place at home • Access to information about health resources and community assets to support aging in place • Availability of opportunities for leadership and advocacy particularly among limited English speakers • Flexibility of volunteer opportunities and age friendly employment.
It is also recommended that the city look to novel approaches to Age-Friendly living, such as the Village model, which inclusively targets several of the above listed areas. An additional list of 14 suggested initiatives based on the findings is included in appendix X. Next Steps
• Presentation of this report to the DFSS, Mayor’s Office and The Chicago Community Trust. • Further analysis of community-level data for community-based organizations and City departments;
requests have been received from Forward Chicago, SOAR, the CHA, and CASL. Presentation of these findings by report, memorandum, or event.
• Dissemination of evidence underpinning Age-Friendly baseline assessment to City of Chicago departments and sister agencies, The Chicago Council on Aging, aldermen, and CMAP’s Chinatown Community Vision Plan Steering Committee, to support older adult policy building.
• Presentation of findings at research-based events via poster and presentation. Abstracts have already been accepted at the Gerontological Society of Aging, the American Public Health Association, and the American Society on Aging.
• Source additional funding for the development of initiatives that build the city’s capacity for age-friendliness, including community-based engagement programs.

42
Appendix I: Stakeholder Organizations
CCT Age-Friendly Stakeholder Interviews January - March 2014 Organization Name Title Access Living Executive Director Casa Central South Site Director Catholic Charities Senior Vice President Center on Halsted Senior Services Director Chicago Advisory Council on Aging Chair Chicago Commons Executive Director Chicago Fire Department Fire Commissioner Chicago Housing Authority Senior Affairs Chicago Metropolitan Agency for Planning Executive Director of Local Planning Chicago Park District Superintendent Chicago Police Department Commander, 20th District Chicago Read Mental Health Center Recovery Support Specialist Chicago Transit Authority President City of Chicago OEMC Policy Analyst City of Chicago, 47th Ward Office Senior Council CJE SeniorLife President CMS Chicago Vice President, Community Services Coalition of Limited English Speaking Elderly Executive Director Cook County Circuit Court Presiding Judge Department of Family and Support Services First Deputy Commissioner Department of Business Affairs and Consumer Protection Commissioner Department of Housing and Economic Development Commissioner Department of Public Health Chief Innovation and Strategy Officer Friendly Towers Program Director Greater Chicago Food Depository Executive Director H.O.M.E. Executive Director Healthcare Research Associates Director Heartland Housing, Inc. Associate Director of Real Estate Development Illinois Department on Aging Division Director for Planning and Research, Chief Policy
Advisor Life Matters Media Founder Lincoln Park Village Founding Executive Director Little Brothers – Friends of the Elderly Executive Director Mather Lifeways Manager, Mather More than a Café Southside Mayor’s Office of People with Disabilities Commissioner Metropolitan Planning Council Senior Advisor Office of the Governor Senior Policy Advisor Resurrection Project Senior Community Organizer Retirement Research Foundation Executive Director Rush Alzheimer’s Disease Center, Memory Clinic Advanced Practice Nurse Rush University Medical Center Director of Older Adult Programs Rush University Medical Center, Gerontology Professor Senior Services Area Agency on Aging, DFSS Executive Director Southeast Asia Center Executive Director University of Illinois at Chicago Department of Medicine Professor Urban Planning Senior Project Manager, MWH Americas; President,
Friends of Downtown

43
Appendix II: Focus Group Guide
Focus Group Questions
Topics and Open Questions
Prompts Example Questions
Ice Breaker
What is it like to live in Chicago as an older person?
Ask…
• Good features?
• Problems?
Tell me the good features that you see that make Chicago an age-friendly city.
Topic #1
Outdoor Spaces and Buildings
• What is it like to step outside of your home to go for a walk to get fresh air, run errands or visit?
• What is it like to go into buildings, such as public offices or stores?
Ask about...
• design and maintenance of
Side-walks and curbs?
• street intersections and crosswalks?
• traffic volume, noise?
• particular times of day, such as
Night-time?
• weather conditions?
• green spaces? walking areas?
• street lighting?
• protection from sun, rain or wind?
• benches, rest areas?
• sense of physical safety?
• sense of security from criminal
victimization?
• In buildings: stairs, doors, lift
devices, corridors, floors, lighting,
signage, toilets, rest areas
Do you think it is easy to get to grocery stores and other places to run errands?
Is it easy to get your wheelchair and walker through the entrances of some stores or other places?
Topic #2
Transportation
Ask about…
• Affordable?

44
• Describe your experience using public transportation – bus or train, in your community.
• What is it like to drive in your community?
• Easy to get to?
• Easy to board?
• Frequent enough when you want to travel
• On time?
• Extensive routes to go wherever
one wants?
• Waiting areas and stops with
benches, lighting, protection from
the elements?
• Secure from crime?
• Adapted transportation for disabled persons?
For drivers:
• Legible street signs
• Legible street numbers
• Lighting at intersections
• Easy to understand traffic signals
• Sufficient and close parking
• Handicapped reserved parking
• Drop off and pick up allowance
• Driver refresher courses
Do you feel like it is easy for you to travel using the CTA?
What other methods do you use in getting to places?
• Walk or drive?
Topic #3
Housing
• Tell me about the house or the apartment in which you live.
• If your needs change, what are your choices for housing
• Cost?
• Comfort?
• Physically safe?
• Security from crime?
• Proximity to services?
Mobility and independence in the
Do you feel that the sidewalk leading into your building is leveled and safe?
Do you feel that the streets signs by your home are large enough to read?
Are there any street lights by

45
in the community? home:
• move about easily?
• Reach and store things easily?
• do housework and chores?
your home brightly lit?
Topic #4
Respect and Social Inclusion
The next area deals with how the
community shows respect for, and includes older people.
• In what ways does your community show, or not show, respect for you as an older person?
• In what ways does your community include, or not include you as an older person in activities and events?
• Politeness?
• Listening?
• Helpfulness?
• Choices offered?
• Public recognition of the
contributions of older people?
• Intergenerational activities?
How do you think you can be more included in events that occur in the community?
Topic #5
Social Participation
• Let's now talk about social
Are social and leisure activities
• Affordable?
• What would you like to learn?
• what’s available to you in your area? Do you participate in any? If not, why?
• Do you feel like you

46
and leisure activities….
• How easily can you socialize in your community?
• Tell me about your participation in other activities, like education, culture, recreation, or spiritual activities?
• Accessible?
• Frequent?
• Convenient location?
• Convenient times?
• Offer choices?
• Interesting?
are missing out? • Do you feel like you
are a part of the community?
Topic #6
Communication and Information
• What is your experience getting the information you need in your community, for example, about services or events?
• This can be information you get by telephone, radio, TV, in print, internet, or in person.
Is information…
• Accessible? • Useful? • Timely? • Easy to understand? • Difficulties with automated • systems, print format and
size?
• Is technology part of your life?
• What role does it play?
• And if it doesn’t, Why not?
Topic #7
Civic Participation and Employment
• Tell me about your participation in volunteer work or any work at all?
• Tell me about your participation in paid work, if you are employed now or if you are looking for paid work?.
• Tell me about your participation in public
Ask about…
• Availability of information
about opportunities
• Accessible opportunities
• Variety of opportunities
• Attractiveness
• Recognition provided
• Remuneration (paid work)
• Adjustment to older persons'
abilities
• Adjustment to older persons'
Would you like to do any volunteer or paid work?
Yes- what would it be
No- why not?

47
community affairs, like community associations or municipal councils?
preferences
• Ways used to motivate older
persons' participation
Topic #8
Community Support and Health Services
I want to know more about the health and social services in your community that help Older people living at home.
Ask about…
• Types of services available
• Accessibility
• Affordability
• Responsiveness of services to
individual needs
Do you have clinics that serve the elderly in your community?
Are these clinics close by?
How long do you have to wait to be seen?
Is there enough seating for seniors?
Is there parking?
Is the signage in these clinics easily seen?

48
Appendix III: Stakeholder Interview Guide
Hello, thank you for agreeing to take part in this interview and contribute your expertise to the Age-friendly Chicago initiative. In July 2012, Mayor Emanuel secured Chicago’s membership in the World Health Organization’s Global Network of Age-Friendly Cities and directed the Department of Family and Support Services (DFSS) to take the lead in crafting an Age-Friendly Chicago Plan. Researchers at Northwestern University are conducting a baseline assessment of the Age-Friendliness of the City. As part of the assessment we aim to compile a list of age friendly city indicators that are relevant to Chicago and the older population living within the city limits. You have been identified as key stakeholder within the City of Chicago due to your expertise in the area of XXXX. The aim of this interview is to prioritize age-friendly indicators specific to older Chicagoans. We want to capture your opinions on what you believe are top priority indicators to making Chicago Age Friendly. Once we develop a comprehensive list of indicators specific to Chicago, we will ask older Chicagoan’s to rate each indicator in order to assess the age-friendliness of the City.
Firstly, we would like to gather some information about you
1. Which professional speciality best describes you? (Please select all that apply)
Caregiver Clergy, ministry Community development, education,
support, services Disability education, support, services Gerontology Grant maker Housing Marketing
Geriatric Medicine, dentistry, pharmacy Nursing Occupational, recreational, physical
therapy Policy analyst Researcher Social work, administration, counseling Transportation Urban planning, architecture, industrial
design Other (please specify)
2. Which of the following best describes your work setting? (Please select one)
Area Agency on Aging Community based support and health services Community based care Government Healthcare Not for profit
Religious organization Residential/home based care Senior center Social service agency University or academic program Hospital system
Other (please specify)
3. Which organization do you work for?

49
4. Please rank the age friendly domains listed below in the order in which you feel they are important to older adults living in Chicago. Place a number next to each domain where 1 is the most important domain and 8 is the least important.
Outdoor Spaces and
Buildings
Respect and Social Inclusion
Transportation Civic Participation and Engagement
Housing Communication and information
Social participation Community Support and Health Services
5. Which age-friendly domain does your work focus on the most? (research or programmatic)? (Please select only
one)
Outdoor spaces and buildings Transportation Housing Social Participation
Respect and social inclusion Civic participation and engagement Communication and information Community support and health services
6. Do you feel that your work (research or programmatic) could help Chicago in its efforts to be an Age –Friendly City?
yes no
7. If you answered yes to the above question, in what ways could your work help? Open ended response:

50
PART 2: INDICATORS
Please read the indicator list below. These items have been compiled from an exhaustive list of age-friendly indicators that are being used on a global level. Some of the items listed will be used to build the Chicago Age-Friendly Community Survey. The items on the community survey will be rated by older Chicagoans on a Likert-type scale (Excellent-Poor) to provide a baseline assessment of the cities age-friendliness. This same survey will be used 4 years from now as an evaluation to monitor improvement. As a stakeholder, we want you to tell us which of these indicators are important for us to include in our survey to community members. Please think about your own clientele when prioritizing these items.
Collecting the data using Q-Methodology
We will be collecting your responses using a research technique called the Q-Sort Methodology. Q-Sort Methodology is a way to capture the subjectivity, beliefs, and opinions of individuals in a systematic manner. By taking into account the individual’s subjectivity, we will be able to accurately reflect the viewpoints of key stakeholders like yourself, when it comes to determining which age-friendly indicators are most relevant for older adults living in Chicago.
How Q-Methodology Works
You will be presented with a series of cards, each with one of the below indicators printed on the front. First, I will ask you to sort the cards into three piles: Most Important , Neutral, and Least important . Second, I will ask that you place each card on the provided Q-table ranking each statement on the continuum of Least Important to Most Important.
Please feel free to take some time to familiarize yourself with the indicators which you will need to sort.
Outdoor Spaces & Buildings
1. Walkability within neighborhoods (sidewalks are not cracked, sidewalks have ample space for wheelchairs, ramps are available, curbs are a feasible distance from the road, etc.)
2. Pathways dedicated to cyclists. 3. Availability of outdoor public spaces in the neighborhood (Parks, green spaces, dog parks) 4. Availability of outdoor public facilities in the neighborhood (Public toilets, outdoor resting areas, benches,
lighting) 5. Safety of physical neighborhood environment (Feeling safe from crime to step outside to go for a walk, go to the
store, or exercise regardless of weather) 6. The accessibility of public buildings in the neighborhood (Wheelchair access, steps, resting areas inside buildings,
elevators, ramps in all weathers)
Transportation
1. Availability of public transportation in your neighborhood (CTA and Metra in all weathers) 2. Accessibility of public transportation (Bus stops and subway stations are conveniently located with clear signage) 3. Safety of public transportation (Feeling safe from crime to ride on the CTA and Metra) 4. Safety of the road conditions in my neighborhood for driving (street signs are clearly labeled, there is no debris
in the streets, there is adequate parking, adequate snow clearance and gritting). 5. Safety of the road conditions in my neighborhood for bike riding. 6. Affordability of public transportation
Housing
1. Availability of different housing options (rent, own, co-op, high rise , apartment, stand alone house) 2. Affordable quality housing (heating and cooling are working properly)

51
3. Homes are livable and safe (feeling safe within the home and stepping outside into private areas such as the yard or garden, housing is modified to accommodate mobility, elevators are working)
4. Affordable accessible housing (housing that includes no step entrance, wider doorways, grab bars in bathrooms, first floor bedrooms and bathrooms)
5. Availability of services in the neighborhood (handy man, home repair services options, pharmacies, access grocery stores)
6. Diversity of housing communities (intergenerational, different cultures, male and female, varying income levels, different religious affiliations)
7. Basic resources are in proximity to housing (grocery stores, pharmacy, medical center)
Respect and Social Inclusion
1. Older adults feel respected (in their neighborhoods, on public transportation, fast responses to 311, fire, police and city agencies calls)
2. Older adults do not feel isolated or lonely in their homes 3. Older adults do not feel alienated from their neighbors/neighborhoods 4. Inclusivity of media representation of older adults (are older adults represented equally in things such as
newspapers, magazine stands, advertisements) 5. Inclusivity of public information about services and activities for all age groups and cultures ( are older adults
included in brochures for family events, college courses, 311 services, police and fire flyers) 6. Opportunities for intergenerational interaction (at schools, youth clubs senior centers, family activities in the
community) 7. Accessibility of venues for entertainment and community activity 8. Availability of social networks beyond family (kinship, block club, social clubs) 9. Availability of social and cultural activities for diverse populations
Civic Participation and Employment
1. Availability of volunteer activities 2. Availability of volunteer training opportunities that enable older adults to volunteer 3. Availability of flexible job opportunities for people aged 60 and over 4. Accessibility of workplaces to meet the needs of older adults in employment 5. Inclusivity of older adults in job advertisements 6. Availability of re-training programs for older adults wanting to continue in employment beyond retirement 7. Availability of knowledge about age discrimination in the workplace 8. Availability of leadership roles for older adults within the community 9. Availability of advocacy opportunities in your neighborhood 10. Conveniently located and accessible venues for voting 11. Opportunities to inform planning and implementation of policy and services for older adults (accessing
aldermen, using 311, becoming advocates) 12. Availability of meaningful unpaid service in a wide range of civic and educational settings
Community Support Services & Health
1. Availability of private home based care services ( respite services, caregivers, home health aides, nurses senior centers, physical fitness)

52
2. Affordability of private home based care services ( respite services, caregivers, home health aides, nurses senior centers, physical fitness)
3. Availability of primary care physicians/community health centers 4. Availability of public community support/ home based care ( respite services, caregivers, home health aides,
nurses senior centers, physical fitness) 5. Affordable of public community support/ home based care (respite services, caregivers, home health aides,
nurses senior centers, physical fitness) 6. Affordable health care services 7. Conveniently located emergency centers
Communication and Information
1. Availability of information about leisure activities 2. Availability of information about community support and health services in your neighborhood (easy to find and
in diverse formats – hard copy, telephone, TV etc) 3. Accessibility of information about community support and health services in your neighborhood in various
languages, on free TV, using local media as well as national, using social media, large print, hearing loop, literacy aware)
4. Visibility/Audibility of health promotion activities (automated phones are clear, large print is used, options in different languages)
5. Accessibility of 311 and 911 (always get through, automated systems are clear) 6. Availability of free computers and internet in public facilities (library, senior center, church, hospitals)
Social Participation
1. Affordability of sport, cultural, religious and leisure events 2. Diversity of sport, cultural, religious and leisure events 3. Conveniently located activities that promote social cohesion (block parties, neighborhood festivals) 4. Initiatives that promote recognition of older adults contribution to your neighborhood (hall of fame) 5. Activities that support independent living (block clubs, social club, church, senior center) 6. Availability of activities that promote physical wellbeing (senior center programs) 7. Availability of activities that promote mental wellbeing (senior center, church)
PART 3: INDICATOR SUGGESTIONS
At this point we want to give you a chance to provide feedback and suggest any indicators that you believe we have not already captured in the list above. If there was anything you believe we missed, would you mind sharing that with me now? This piece is very important in trying to make sure there aren’t any indicators specific to the populations of older adults that are represented in Chicago that were missed in the above indicator list (ie, any indicators that are relevant to the population that you work with that you would like to see represented here?)

53
Any final thoughts that you would like to leave us with today?
Thank you for participating in the interview today. We greatly appreciate your time and input! We hope to continue working with you as we move forward with this project. In a few months, once we have the survey finalized, we will be asking you to help us distribute the survey broadly to older adults living in Chicago.

54
Appendix IV: Prioritization Chart of Age-Friendly Indicators
Legend
1st Quartile
2nd Quartile
3rd Quartile
4th Quartile
Item Domain Text Avg Rank
Gov Rank
Comm Rank
Research Rank
5 out Safety of physical neighborhood environment
11.4211 11.0769 11.5238 12.0000
16 hous Affordable accessible housing 10.7895 10.3846 11.0476 10.7500
19 hous Basic resources are in proximity to housing
10.3421 10.4615 10.0952 11.2500
45 com Affordability of public community support/ home based care
9.6842 9.6154 9.7143 9.7500
7 tran Availability of public transportation in your neighborhood
9.6579 9.2308 10.0952 8.7500
1 out Walkability within neighborhoods 9.5526 10.4615 8.6667 11.2500
43 com Availability of primary care physicians/community health centers
9.4474 9.6923 9.1429 10.2500
14 hous Affordable quality housing 9.3684 8.6154 9.8571 9.2500
46 com Affordable health care services 9.3158 9.3077 9.2857 9.5000
9 tran Safety of public transportation 9.2632 8.8462 9.2857 10.5000
44 com Availability of public community support/ home based care
9.2368 9.2308 9.2857 9.0000
8 tran Accessibility of public transportation 9.1316 9.3077 8.9048 9.7500
15 hous Homes are livable and safe 8.8947 8.2308 9.0000 10.5000
21 res Older adults do not feel isolated or lonely in their homes
8.8947 8.6154 9.1429 8.5000
60 soc Availability of activities that promote mental wellbeing
8.5526 8.0000 8.9524 8.2500
12 tran Affordability of public transportation
8.5263 8.1538 8.5714 9.5000
6 out The accessibility of public buildings in the neighborhood
8.4474 8.7692 8.1429 9.0000
58 soc Activities that support independent living
8.1053 8.3077 8.0476 7.7500
59 soc Availability of activities that promote physical wellbeing
8.0789 8.6923 7.7619 7.7500
17 hous Availability of services in the neighborhood
8.0000 7.7692 7.9524 9.0000
27 res Availability of social networks beyond family
7.9211 7.2308 8.3333 8.0000

55
3 out Availability of outdoor public spaces in the neighborhood
7.5789 8.0769 7.1905 8.0000
42 com Affordability of private home based care services
7.5263 7.6923 7.1905 8.7500
4 out Availability of outdoor public facilities in the neighborhood
7.2895 7.6923 6.8571 8.2500
22 res Older adults do not feel alienated from their neighbors/neighborhoods
7.2895 6.6923 7.3333 9.0000
20 res Older adults feel respected 7.2895 7.3846 7.5714 5.5000
13 hous Availability of different housing options
7.2632 6.6923 7.5238 7.7500
31 civ Availability of flexible job opportunities for people aged 60 and over
7.1842 6.6154 7.5238 7.2500
49 info Availability of information about community support and health services in your neighborhood
7.1316 7.6923 6.9048 6.5000
41 com Availability of private home based care services
7.0789 6.3846 7.3810 7.7500
50 info Accessibility of information about community support and health services in your neighborhood
7.0526 7.2308 6.8095 7.7500
25 res Opportunities for intergenerational interaction
6.8158 6.6923 6.8095 7.2500
34 civ Availability of re-training programs for older adults wanting to continue in employment beyond retirement
6.6842 6.9231 6.6667 6.0000
52 info Accessibility of 311 and 911 6.6316 6.8462 6.7143 5.5000
39 civ Opportunities to inform planning and implementation of policy and services for older adults
6.3158 5.8462 6.8571 5.0000
53 info Availability of free computers and internet in public facilities
6.2368 6.6154 6.6667 2.7500
36 civ Availability of leadership roles for older adults within the community
6.2105 5.3846 7.0000 4.7500
47 com Conveniently located emergency centers
6.2105 5.3846 6.8571 5.5000
56 soc Conveniently located activities that promote social cohesion
6.1842 6.5385 5.7619 7.2500
18 hous Diversity of housing communities 6.1316 5.7692 6.0952 7.5000
30 civ Availability of volunteer training opportunities that enable older adults to volunteer
6.0789 6.4615 5.8571 6.0000
51 info Visibility/Audibility of health promotion activities
6.0789 6.6923 5.9048 5.0000

56
24 res Inclusivity of public information about services and activities for all age groups and cultures
6.0263 7.1538 5.6190 4.5000
32 civ Accessibility of workplaces to meet the needs of older adults in employment
6.0000 5.8462 6.1905 5.5000
40 civ Availability of meaningful unpaid service in a wide range of civic and educational settings
5.9211 6.4615 5.7143 5.2500
26 res Accessibility of venues for entertainment and community activity
5.7632 6.4615 5.0476 7.2500
10 tran Safety of the road conditions in my neighborhood for driving
5.7105 5.9231 5.4762 6.2500
29 civ Availability of volunteer activities 5.6053 5.9231 5.2381 6.5000
28 res Availability of social and cultural activities for diverse populations
5.3421 5.5385 4.9524 6.7500
37 civ Availability of advocacy opportunities in your neighborhood
5.3158 4.7692 5.6190 5.5000
38 civ Conveniently located and accessible venues for voting
5.0000 5.9231 4.7619 3.2500
54 soc Affordability of sport, cultural, religious and leisure events
4.6316 4.9231 4.5714 4.0000
35 civ Availability of knowledge about age discrimination in the workplace
4.1053 4.1538 4.3810 2.5000
48 info Availability of information about leisure activities
4.0789 4.9231 3.5714 4.0000
33 civ Inclusivity of older adults in job advertisements
4.0526 3.8462 4.2857 3.5000
23 res Inclusivity of media representation of older adults
4.0263 4.0000 4.4762 1.7500
57 soc Initiatives that promote recognition of older adults contribution to your neighborhood
3.9474 4.1538 4.1429 2.2500
11 tran Safety of the road conditions in my neighborhood for bike riding
3.5263 3.6154 3.4762 3.5000
55 soc Diversity of sport, cultural, religious and leisure events
3.2105 2.6923 3.2381 4.7500
2 out Pathways dedicated to cyclists 2.8421 2.3846 2.9524 3.7500

57
Appendix V: Walking Audit Tool
1. Physical Environment: Outdoor spaces & buildings, Transportation, Housing
2. Mental Health & Well-being: Social Participation, Respect & Social Inclusion, Civic Participation & Employment
Item
Specify
Y/N
Count
Subjective assessment
/ Description
Item
Specify
Y/N
Count
Subjective assessment
/ Description
Green space or
Small Medium Large Community
senior center Office/Institutions farmer's
Restaurant/Cafe Fast Food Chain
Faith-based
what faiths? Recreation (ex. fitness centers)
Social interactions (older adults with others)
Intergen. same gener.
Retail/Business Types? Older adults on street
Hotel/Lodging Chain Local job/volunteer
OA's as
Empty
Amenities Garbage cans
3. Community Health & Resources: Communication & Information, Community Support & Health
water fountains benches street/sidewalk lights Aesthetics Trees/flowers None A few A Lot Street signs street names Clear/Large Small Community art None A few A Lot Disability Litter/dumping None A few A Lot Directional sign
graffiti None A few A Lot Numbers on
Noise pollution None A few A Lot Information
CTA stops condition Poor Fair Good* Aids for low
Bus stops bench w/cover none Information in
languages what language Metra station condition Poor Fair Good Hospital/Health
alternative
What types? Dentist Bike lane - coverage in community
Little Some A Lot Pharmacy
Parking Street parking Mental Health Lot Food Options Grocery store Healthy food ads? Garage Corner store Healthy food ads? Handicap sign Advertisements Type
Sidewalk condition Poor Fair Good* 4. Additional Observations Size Narrow Standard
Ex. Safety, quality of parks, presence
Curb cuts Attach photos
Debris None A Few A Lot Traffic volume Little Some A Lot* lanes per side 1-L 2-L Over 2-L crossing aids/walks Mid block
Residential
single-family home
apartments/condos senior housing * denotes descriptions in
procedures

58
Appendix VI: Age-Friendly Chicago: A Community Survey
Age-Friendly Chicago: A Community Survey
About the Survey Dear Survey Participant,
In July 2012, Mayor Emanuel secured Chicago’s membership in the World Health Organization’s Global Network of Age-Friendly Cities. Researchers at Northwestern University are working with the city to find out how “Age-Friendly” older Chicagoans think their city is.
We value your opinion as an older adult living in the City of Chicago.
This survey should take between 10 and 15 minutes to complete. You may skip any questions you don’t want to answer, and your responses will be kept anonymous.
Thank you in advance for your participation.
Best wishes from, The Buehler Center on Aging, Health & Society at Northwestern University
The Survey About you
1. What is your age category (please choose only one answer) a. ___ Under 55 b. ___ 55-64 c. ___ 65-74
d. ___75-84 e. ___Over 85
2. What is your current gender identity? (please choose only one answer)
a. ___ Male b. ___ Female c. ___ Transgender d. ___ Male to Female
e. ___ Female to Male f. ___ Other, if other, please specify:
_________________________
3. What is your current relationship status (please choose only one answer)
a. ___ Single b. ___ Married c. ___ Partnered and living
together
d. ___ Partnered and living separately
e. ___ Separated f. ___ Divorced

59
g. ___ Widowed
4. Do you own or rent your primary residence? (Please choose only one answer) a. ___ Rent b. ___ Own c. ___ Not applicable
5. Besides you, do you have any of the following people living in your household (Please choose all that apply)
a. ___ A child or children under 18 b. ___ A child or Children 18 or over c. ___ Adult relative or friend 18 or over (besides a spouse) d. ___Spouse or partner e. ___ None f. ___ Other, if other, please specify:____________________________
6. Do you have any kind of healthcare coverage, including employer-provided health insurance, private health insurance, or government plans such as Medicare or Medicaid? (Please choose only one answer)
a. ___ Yes b. ___ No c. ___ Not sure
7. What is your race or ethnicity? (please choose all that apply) a. ___ White or Caucasian b. ___ Black or African American c. ___ Asian d. ___ American Indian or Alaskan Native e. ___ Native Hawaiian or other Pacific Islander f. ___ Hispanic, Spanish or Latino g. ___ Other, if other, please specify:____________________________
8. What is the highest level of education you have completed? (only one answer) a. ___ K-12th grade (no degree) b. ___ High school degree or GED c. ___ Post-high school education or training (no degree) d. ___ 2-year college degree e. ___ 4-year college degree f. ___ Post-graduate study g. ___ Graduate or professional degree
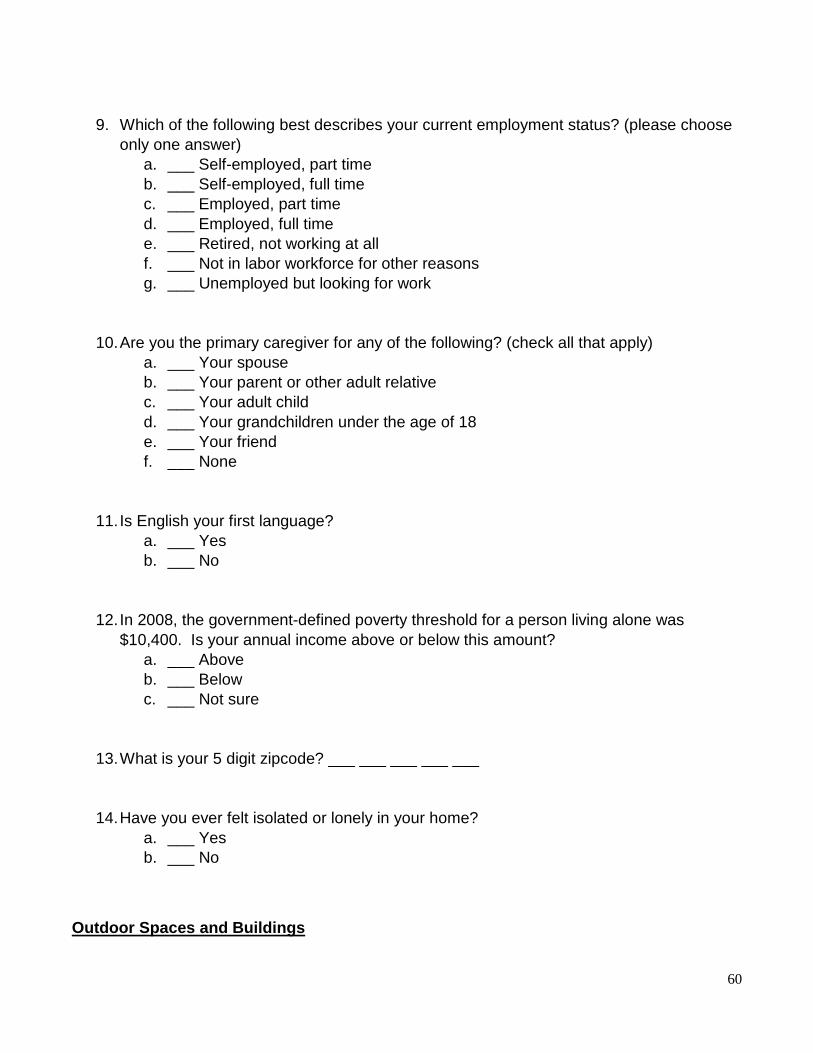
60
9. Which of the following best describes your current employment status? (please choose
only one answer) a. ___ Self-employed, part time b. ___ Self-employed, full time c. ___ Employed, part time d. ___ Employed, full time e. ___ Retired, not working at all f. ___ Not in labor workforce for other reasons g. ___ Unemployed but looking for work
10. Are you the primary caregiver for any of the following? (check all that apply) a. ___ Your spouse b. ___ Your parent or other adult relative c. ___ Your adult child d. ___ Your grandchildren under the age of 18 e. ___ Your friend f. ___ None
11. Is English your first language? a. ___ Yes b. ___ No
12. In 2008, the government-defined poverty threshold for a person living alone was $10,400. Is your annual income above or below this amount?
a. ___ Above b. ___ Below c. ___ Not sure
13. What is your 5 digit zipcode? ___ ___ ___ ___ ___
14. Have you ever felt isolated or lonely in your home? a. ___ Yes b. ___ No
Outdoor Spaces and Buildings
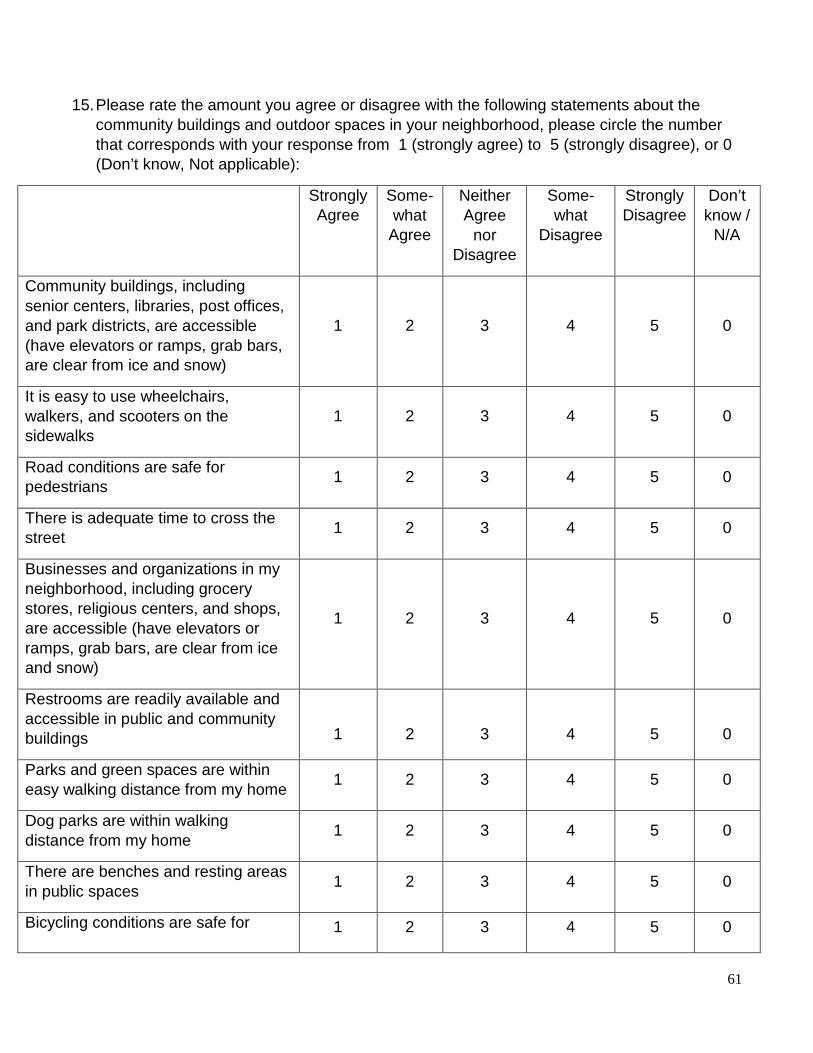
61
15. Please rate the amount you agree or disagree with the following statements about the community buildings and outdoor spaces in your neighborhood, please circle the number that corresponds with your response from 1 (strongly agree) to 5 (strongly disagree), or 0 (Don’t know, Not applicable):
Strongly Agree
Some- what
Agree
Neither Agree
nor Disagree
Some- what
Disagree
Strongly Disagree
Don’t know /
N/A
Community buildings, including senior centers, libraries, post offices, and park districts, are accessible (have elevators or ramps, grab bars, are clear from ice and snow)
1 2 3 4 5 0
It is easy to use wheelchairs, walkers, and scooters on the sidewalks
1 2 3 4 5 0
Road conditions are safe for pedestrians 1 2 3 4 5 0
There is adequate time to cross the street 1 2 3 4 5 0
Businesses and organizations in my neighborhood, including grocery stores, religious centers, and shops, are accessible (have elevators or ramps, grab bars, are clear from ice and snow)
1 2 3 4 5 0
Restrooms are readily available and accessible in public and community buildings
1
2
3
4
5
0
Parks and green spaces are within easy walking distance from my home 1 2 3 4 5 0
Dog parks are within walking distance from my home 1 2 3 4 5 0
There are benches and resting areas in public spaces 1 2 3 4 5 0
Bicycling conditions are safe for 1 2 3 4 5 0

62
pedestrians
16. Please rate the following items in your neighborhood for older adults, please circle the number that corresponds with your response from 1 (Excellent) to 5 (Poor):
Excellent Very
good Good Fair Poor Don’t know/ N/A
Conditions for walking (presence of sidewalks, cracks, bumps, debris on the sidewalks, snow removal)
1 2 3 4 5 0
The ease of access to public and community buildings 1 2 3 4 5 0
The safety of your physical neighborhood environment (where feeling safe means being able to walk or exercise outside without worrying about crime)
1 2 3 4 5 0
Transportation 17. Please rate the amount you agree or disagree with the following statements about transportation in your neighborhood, please circle the number that corresponds with your response from 1 (strongly agree) to 5 (strongly disagree):
Strongly agree
Some- what
Agree
Neither Agree nor Disagree
Some- what
Disagree
Strongly Disagree
Don’t Know/
N/A
CTA stations are conveniently located 1 2 3 4 5 0
CTA stations and bus stops are accessible for wheel chairs 1 2 3 4 5 0
Bus stops are conveniently located 1 2 3 4 5 0
Taxi cabs are available and accessible to me 1 2 3 4 5 0
Door-to-door transportation services (like PACE or private services) are available and
1 2 3 4 5 0

63
accessible to me
There are ride-share programs available in my neighborhood 1 2 3 4 5 0
Parking, including spaces for people with a disability, is available
1 2 3 4 5 0
Signs for transportation (like bus stops, CTA stations) are clearly posted and easy to understand
1 2 3 4 5 0
18. Please rate the following items in your neighborhood for older adults, please circle the number that corresponds with your response from 1 (Excellent) to 5 (Poor):
Excellent Very Good
Good Fair Poor Don’t Know/
N/A
The availability of transportation (CTA, bus, Metra, PACE, taxi cabs) in the neighborhood 1 2 3 4 5 0
The safety of transportation in your neighborhood (where feeling safe means safe from crime when waiting at a designated public transportation station or while using public transportation)
1 2 3 4 5 0
Housing 19. Please rate the following items in your neighborhood for older adults, please circle the number that corresponds with your response from 1 (Excellent) to 5 (Poor):
Excellent Very
Good Good Fair Poor Don’t know/ N/A
The availability of supportive housing options in your neighborhood (for example, assisted living communities, village networks, co-operatives)
1 2 3 4 5 0
The availability of affordable housing options in your neighborhood (including subsidized housing options)
1 2 3 4 5 0
The availability of housing options with amenities that are important to you (for example,
1 2 3 4 5 0

64
pet-friendly options, parking spaces, door staff, exercise rooms, in-building laundry facilities)
Your Home 20. Please answer the following questions about your own home:
Yes No Not Sure
My home is warm enough in the winter 1 2 0
My home is cool enough in the summer 1 2 0
There are stairs leading to the main entrance of my home 1 2 0
I have to go up and down stairs in my home on a daily basis 1 2 0
The doorways both inside and outside my home are wide enough for a wheelchair to fit through 1 2 0
Community Support and Health Services 21. Please indicate the approximate distance you travel for the following services:
Less than
1 mile
Approx-imately
1-5 miles
Over 5
miles away
I have never used this
service
My doctor, primary care physician, or nurse practitioner 1 2 3 4
My eye doctor (ophthalmologist) 1 2 3 4
My dentist 1 2 3 4
My pharmacy 1 2 3 4
My physical therapist 1 2 3 4
My psychologist, psychiatrist, therapist, or other mental health services, including support groups 1 2 3 4
A health clinic for preventative support (like flu shots, other vaccinations, blood pressure or blood sugar checks) 1 2 3 4
Healthy food options (fresh fruits and vegetables, healthy 1 2 3 4

65
menu options)
22. Please rate the following items in your neighborhood for older adults, please circle the number that corresponds with your response from 1 (Excellent) to 5 (Poor):
Excellent Very Good Good Fair Poor
Don’t Know /
Not Applicable
Availability of affordable trustworthy home maintenance services (plumber, electrician, handyman, cleaning services)
1 2 3 4 5 0
Availability of affordable trustworthy home health aides (including visiting nurses) 1 2 3 4 5 0
Availability of affordable trustworthy financial services and information 1 2 3 4 5 0
Availability of affordable trustworthy healthcare options in your neighborhood 1 2 3 4 5 0
Communication and Information 23. Please rate the amount you agree or disagree with the following statements about communication and information for older adults, please circle the number that corresponds with your response from 1 (strongly agree) to 5 (strongly disagree):
Strongly Agree
Some- what
Agree
Neither Agree
nor Disagree
Some- what
Disagree
Strongly Disagree
Don’t know/ N/A
If I need information on
healthcare services and health-related support, I know where to find it
(including disease-specific information, home care options, and caregiving)
1 2 3 4 5 0
I know what to do in case of 1 2 3 4 5 0

66
an environmental
emergency (including a flood, an electrical outage, extreme heat or cold, a fire)
I know what to do in case of a health-related emergency
(including myself or
someone nearby
experiencing a heart attack, stroke, or fall)
1 2 3 4 5 0
There are places for me to go to access free computers, internet, and wifi
1 2 3 4 5 0
I know where I can go to learn about new technologies 1 2 3 4 5 0
I can access information I need in a language and
format I easily understand 1 2 3 4 5 0
Respect and Social Inclusion
24. Please rate the amount you agree or disagree with the following statements about respect and social inclusion in your neighborhood, please circle the number that corresponds with your response from 1 (strongly agree) to 5 (strongly disagree):
Strongly Agree
Some- what
Agree
Neither Agree
nor Disagree
Some- what
Disagree
Strongly Disagree
Don’t know/ N/A
There are social networks in
my neighborhood
(including kinship, block
clubs, social clubs,
1 2 3 4 5 0

67
churches, community
centers)
There are opportunities for
intergenerational
interaction (at schools,
youth clubs, senior centers,
family activities in the
community)
1 2 3 4 5 0
The social activities in my
neighborhood are for
people of all age groups
and cultures
1 2 3 4 5 0
Older adults living in my
neighborhood feel isolated
and lonely
1 2 3 4 5 0
Older adults in my
neighborhood are respected 1 2 3 4 5 0
Social Participation 25. Please rate the amount you agree or disagree with the following statements about social participation in your neighborhood, please circle the number that corresponds with your response from 1 (strongly agree) to 5 (strongly disagree):
Strongly Agree
Some- what
Agree
Neither Agree
nor Disagree
Some- what
Disagree
Strongly Disagree
Don’t know/ N/A
There are opportunities for me to take part in activities that help my physical well being
1 2 3 4 5 0
There are opportunities for me to take part in activities that
1 2 3 4 5 0
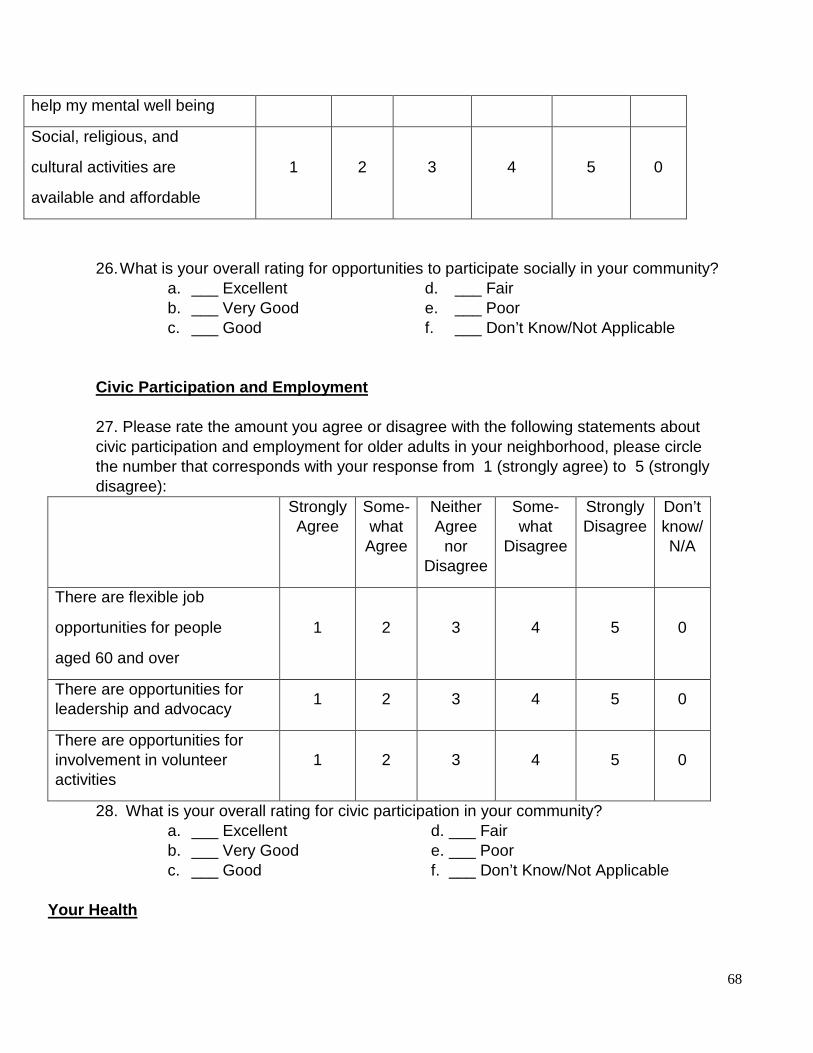
68
help my mental well being
Social, religious, and
cultural activities are
available and affordable
1 2 3 4 5 0
26. What is your overall rating for opportunities to participate socially in your community? a. ___ Excellent b. ___ Very Good c. ___ Good
d. ___ Fair e. ___ Poor f. ___ Don’t Know/Not Applicable
Civic Participation and Employment 27. Please rate the amount you agree or disagree with the following statements about civic participation and employment for older adults in your neighborhood, please circle the number that corresponds with your response from 1 (strongly agree) to 5 (strongly disagree):
Strongly Agree
Some- what
Agree
Neither Agree
nor Disagree
Some- what
Disagree
Strongly Disagree
Don’t know/ N/A
There are flexible job
opportunities for people
aged 60 and over
1 2 3 4 5 0
There are opportunities for leadership and advocacy 1 2 3 4 5 0
There are opportunities for involvement in volunteer activities
1 2 3 4 5 0
28. What is your overall rating for civic participation in your community? a. ___ Excellent b. ___ Very Good c. ___ Good
d. ___ Fair e. ___ Poor f. ___ Don’t Know/Not Applicable
Your Health

69
29. Please rate the following items about yourself, please circle the number that corresponds with your response from 1 (Excellent) to 5 (Poor):
30. To what extent have you been able to carry out your everyday physical activities, such as walking, climbing stairs, carrying groceries, or moving a chair?
a. ___ Completely b. ___Mostly c. ___ Moderately d. ___ A Little e. ___Not at All
31. How often have you been bothered by emotional problems, such as feeling anxious,
depressed, or irritable, in the last seven days? a. ___ Never b. ___Rarely c. ___ Sometimes d. ___ Often e. ___Always
32. How would you rate your fatigue on average? a. ___ None
Excellent Very
Good Good Fair Poor Don’t Know/
N/A
In general, would you say your health is: 1 2 3 4 5 0
In general, would you say your quality of life is: 1 2 3 4 5 0
In general, how would you rate your physical health? 1 2 3 4 5 0
In general, how would you rate your mental health, including your mood and your ability to think?
1 2 3 4 5 0
In general, how would you rate your satisfaction with your social activities and
relationships? 1 2 3 4 5 0
In general, please rate how well you carry out your usual social activities and roles (This includes activities at home, at work,
in your community, and responsibilities as a parent, child, spouse, employee, friend, etc)
1 2 3 4 5 0

70
b. ___Mild c. ___ Moderate d. ___Severe e. ___Very Severe
33. How would you rate your pain on average? Please circle the number that corresponds with your response from 0 (no pain) to 10 (worst pain):
0 (no pain) 1 2 3 4 5 6 7 8 9
10 (worst pain)
Your Thoughts
34. How did you hear about us? _______________________________________
35. Do you have any other comments or questions that you would like to share?
________________________________________________________________________________
________________________________________________________________________________
________________________________________________________________________________
_______________________________________________________________________________
End of survey

71
This page is to be left with the participant Dear Participant, Many thanks for completing this survey. Your thoughts and selections are very important to us. For more information about the Buehler Center’s Age Friendly research and preliminary findings, please visit our website at www.aging.northwestern.edu/science.php If you would like to be added to our age friendly listserv, please email [email protected] with "age friendly" in the subject line or message. Listserv participants receive a quarterly update on research in progress and notification of Age Friendly Chicago related events. If you know of other members of your community or friends who would like to take this survey, please feel free to forward the link to them. If you would like posters and bookmarks to advertise the survey in your community, or paper copies to distribute to citizens with limited access to computers, please email a request to [email protected] and we would be happy to contact you. Many best wishes from, The Buehler Center on Aging, Health & Society Dr. Rebecca Johnson & Dr. Amy Eisenstein 750 North Lake Shore Drive, Suite 601 Chicago, Illinois 60611 Email: [email protected]

72
Appendix VII: Survey Data Tables Demographics by Region
North North-West
North-Central
Central Central-
West South-
East South Total
Respondents
n, % 480,
20.33% 382,
16.18% 367,
15.54% 395,
16.73% 214,
9.06% 240,
10.17% 283,
11.99% 2361,
90.77%
Age Category
<55 23, 24.47%
13, 13.83%
10, 10.64%
11, 11.70%
14, 14.89%
8, 8.51%
15, 15.96%
94, 3.98%
55-64 138, 22.66%
122, 20.03%
75, 12.32%
105, 17.24%
57, 9.36%
34, 5.58%
78, 12.81%
609, 25.79%
65-74 190, 18.57%
164, 16.13%
184, 17.99%
175, 17.11%
95, 9.29%
100, 9.78%
115, 11.24%
1023, 43.33%
75-84 106, 20.83%
65, 12.77%
84, 16.50%
81, 15.91%
38, 7.47%
73, 14.34%
62, 12.18%
509, 21.56%
>85 23, 18.25%
18, 14.29%
14, 11.11%
23, 18.25%
10, 7.94%
25, 19.84%
13, 10.32%
126, 5.34%
Gender Identity
Male 131, 20.29%
109, 16.87%
109, 16.87%
105, 16.25%
70, 10.84%
64, 9.91%
58, 8.98%
646, 27.40%
Female 348, 20.41%
270, 15.84%
256, 15.01%
285, 16.72%
143, 8.39%
176, 10.32%
227, 13.31%
1705, 72.31%
Transgender 1, 14.29%
3, 42.86%
1, 14.29%
2, 28.57%
0, 0.00% 0,
0.00% 0,
0.00% 7,
3.27% Race
White 363, 26.40%
274, 19.93%
296, 21.53%
332, 24.15%
34, 2.47%
60, 4.36%
16, 1.16%
1375, 58.79%
Black 40, 7.11%
13, 2.31%
18, 3.20%
22, 3.91%
127, 22.56%
116, 20.60%
227, 40.32%
563, 24.07%
Hispanic 15, 8.11%
64, 34.60%
24, 12.97%
19, 10.27%
3, 1.62% 32,
17.30% 28,
15.14% 185,
7.91% Asian 41,
25.95% 17,
10.76% 19,
12.03% 14,
8.86% 14,
8.86% 52,
32.92% 1,
0.63% 158,
6.76% Other 16,
27.59% 8,
13.79% 6,
10.35% 7,
12.07% 1, 1.72%
8, 13.79%
12, 1.72%
58, 2.48%
Marital Status
Single 155, 20.61%
79, 11.52%
111, 16.18%
99, 14.43%
86, 12.54%
79, 11.52%
77, 11.22%
686, 29.06%
North
North-West
North-Central
Central Central-
West South-
East South Total

73
Married 160, 19.61%
162, 19.85%
124, 15.20%
177, 21.69%
47, 5.76%
61, 7.48%
85, 10.42%
816, 34.56%
Other 164, 19.09%
140, 16.30%
127, 14.44%
119, 13.85%
79, 9.20%
102, 11.87%
125, 14.55%
859, 36.38%
Housing
Rent 163, 20.79%
93, 11.86%
95, 12.12%
99, 12.63%
109, 13.90%
138, 17.60%
87, 11.10%
784, 33.50%
Own 300, 20.18%
274, 18.43%
258, 17.35%
287, 19.30%
89, 5.99%
96, 6.46%
183, 12.31%
1487, 65.55%
Live Alone
238, 19.59%
172, 14.16%
207, 17.04%
208, 17.12%
96, 7.90%
157, 12.92%
137, 11.28%
1215, 52.92%
Caregiver
74, 20.61%
62, 17.27%
47, 13.09%
56, 15.60%
39, 10.86%
29, 8.08%
52, 14.49%
359, 15.45%
Education
<12th grade 13, 6.40%
40, 19.70%
7, 3.45%
15, 7.39%
53, 26.11%
43, 21.18%
32, 15.76%
203, 8.70%
HS Degree/GED
37, 12.21%
62, 22.44%
41, 13.53%
21, 6.93%
51, 16.83%
40, 13.20%
51, 16.83%
303, 12.99%
Some College 73, 24.42%
51, 17.06%
36, 12.04%
35, 11.71%
31, 10.37%
21, 7.02%
52, 17.39%
299, 12.82%
College Degree
152, 22.69%
103, 15.37%
100, 14.93%
108, 16.12%
70, 10.45%
50, 7.46%
87, 12.99%
670, 28.47%
Grad Degree 161, 23.27%
88, 12.72%
151, 21.82%
174, 25.15%
16, 2.31%
55, 7.95%
47, 6.79%
692, 29.66%
Employment
Employed 78, 22.47%
53, 15.27%
61, 17.59%
74, 21.33%
24, 6.92%
25, 7.20%
32, 9.22%
347, 14.75%
Retired 285, 18.99%
238, 15.82%
240, 15.96%
234, 15.56%
141, 9.38%
167, 11.10%
199, 13.23%
1504, 63.92%
Other 46, 20.81%
43, 19.46%
23, 10.41%
23, 10.41%
28, 12.67%
30, 13.57%
28, 12.67%
221, 9.39%
English 1st Language
440, 91.48%
311, 82.06%
329, 90.14%
356, 91.28%
178, 84.76%
184, 76.67%
279, 96.54%
2077, 88.23%
North
North-West
North-Central
Central Central-
West South-
East South Total

74
Outdoor Spaces and Buildings
Total (Mean Score)
Strongly Agree
Somewhat Agee
Neither Somewhat Disagree
Strongly Disagree
1. Community buildings, including senior centers, libraries, post offices, and park districts, are accessible (have elevators or ramps, grab bars, are clear from ice and snow)
2314
(2.06)
35.65% (825)
40.92% (947)
9.20% (213)
9.81% (227)
4.41% (102)
2. It is easy to use wheelchairs, walkers, and scooters on the sidewalks
1846
(2.67)
20.96% (387)
35.10% (648)
12.89% (238)
18.31% (338)
12.73% (235)
3. Road conditions are safe for pedestrians
2435
(3.09)
12.85% (313)
29.36% (715)
13.06% (318)
25.59% (623)
19.14% (466)
4. There is adequate time to cross the street
2438 (2.85)
17.23% (420)
34.04% (830)
10.71% (261)
22.76% (555)
15.26% (372)
5. Businesses and organizations in my neighborhood, including grocery stores, religious centers, and shops, are accessible (have elevators or ramps, grab bars, are clear from ice and snow)
2312 (2.58)
20.59% (476)
38.62% (893)
13.96% (318)
15.96% (369)
11.07% (256)
6. Restrooms are readily available and accessible in public and community buildings
2280 (2.62)
20.04% (457)
35.53% (810)
17.85% (407)
15.22% (347)
11.36% (259)
7. Parks and green spaces are within easy walking distance from my home
2457 (2.03)
46.40% (1140)
28.82% (708)
7.81% (192)
9.36% (230)
7.61% (187)
8. Dog parks are within walking distance from my home
1727 (2.86)
27.10% (468)
18.59% (321)
17.83% (308)
14.48% (250)
22.00% (380)
Live Below Poverty Level
55, 11.53%
47, 12.57%
42, 11.48%
36, 9.21%
79, 38.73%
92, 38.98%
54, 19.22%
405, 17.39%
Felt Isolated or Lonely
136, 28.45%
120, 31.83%
106, 29.20%
68, 17.39%
79, 37.80%
69, 28.63%
64, 22.54%
642, 27.40%

75
9. There are benches and resting areas in public spaces
2364 (2.47)
28.55% (675)
33.59% (794)
11.76% (278)
14.34% (339)
11.76% (278)
10. Bicycling conditions are safe for pedestrians
2273 (3.34)
12.01% (273)
21.95% (499)
14.69% (334)
23.01% (523)
28.33% (644)
Excellent Very Good Good Fair Poor
11. Conditions for walking (presence of sidewalks, cracks, bumps, debris on the sidewalks, snow removal)
2526 (3.53)
6.25% (158)
13.58% (343)
24.86% (628)
31.51% (796)
23.79% (601)
12. The ease of access to public and community buildings
2392 (2.88)
12.04% (288)
23.62% (565)
35.58% (851)
21.95% (525)
6.81% (163)
13. The safety of your physical neighborhood environment (where feeling safe means being able to walk or exercise outside without worrying about crime)
2511 (3.21)
11.07% (278)
18.84% (473)
26.32% (661)
25.97% (652)
17.80% (447)
Transportation
Total (Mean Score)
Strongly Agree
Somewhat Agee
Neither Somewhat Disagree
Strongly Disagree
1. CTA stations are conveniently located
2404 (1.97)
42.30% (1017)
36.31% (873)
8.36% (201)
7.95% (191(
5.07% (122)
2. CTA stations and bus stops are accessible for wheel chairs
1961 (2.30)
32.79% (643)
34.63% (679)
11.68% (229)
11.63% (228)
9.28% (182)
3. Bus stops are conveniently located 2409 (1.84)
47.03% (1133)
36.16% (871)
6.89% (166)
5.89% (142)
4.03% (97)
4. Taxi cabs are available and accessible to me
2184 (2.41)
33.70% (736)
29.12% (636)
12.45% (272)
11.90% (260)
12.82% (280)
5. Door-to-door transportation services (like PACE or private services) are available and accessible to me
1388 (2.17)
36.24% (503)
29.83% (414)
21.11% (293)
6.56% (91) 6.27% (87)
6. There are ride-share programs available in my neighborhood
1012 (2.92)
19.27% (195)
20.36% (206)
29.25% (296)
11.36% (115)
19.76% (200)
7. Parking, including spaces for people with a disability, is available
2045 (2.67)
22.69% (464)
32.03% (655)
15.70% (321)
15.16% (310)
14.43% (295)
8. Signs for transportation (like bus stops, CTA stations) are clearly posted and easy to understand
2406 (2.00)
38.78% (933)
38.45% (925)
10.76% (259)
7.81% (188)
4.20% (101)

76
Excellent Very Good Good Fair Poor
9. The availability of transportation (CTA, bus, Metra, PACE, taxi cabs) in the neighborhood
2432 (2.32)
31.66% (770)
27.30% (664)
23.30% (572)
12.75% (310)
4.77% (116)
10. The safety of transportation in your neighborhood (where feeling safe means safe from crime when waiting at a designated public transportation station or while using public transportation)
2415 (2.91)
15.20% (367)
24.93% (602)
25.22% (609)
22.90% (553)
11.76% (284)
Housing
Total (Mean Score)
Excellent Very Good Good Fair Poor
1. The availability of supportive housing options in your neighborhood (for example, assisted living communities, village networks, co-operatives)
1604 (3.24)
9.85% (158)
19.08% (306)
28.68% (460)
22.19% (356)
20.20% (324)
2. The availability of affordable housing options in your neighborhood (including subsidized housing options)
1544 (3.47)
8.35% (129)
14.70% (227)
24.22% (374)
27.01% (417)
25.71% (397)
3. The availability of housing options with amenities that are important to you (for example, pet-friendly options, parking spaces, door staff, exercise rooms, in-building laundry facilities)
1742 (3.01)
17.22% (300)
20.15% (351)
24.97% (435)
20.15% (351)
17.51% (305)
Your Home
Total (Mean Score)
Yes No
1. My home is warm enough in the winter 2456 (1.09)
90.84% (2231)
9.16% (225)
2. My home is cool enough in the summer 2414 (1.13)
86.70% (2093)
13.30% (321)
3. There are stairs leading to the main entrance of my home
2431 (1.67)
33.16% (806)
66.84% (1625)
4. I have to go up and down stairs in my home on a 2422 44.01% 55.99%

77
daily basis (1.56) (1066) (1356)
5. The doorways both inside and outside my home are wide enough for a wheelchair to fit through
1727 (1.30)
70.35% (1215)
29.65% (512)
Respect and Social Inclusion
Total (Mean Score)
Strongly Agree
Somewhat Agee
Neither Somewhat Disagree
Strongly Disagree
1. There are social networks in my neighborhood (including kinship, block clubs, social clubs, churches, community centers)
2125 (2.06)
37.88% (805)
37.60% (799)
11.72% (249)
6.35% (135)
6.45% (137)
2. There are opportunities for intergenerational interaction (at schools, youth clubs, senior centers, family activities in the community)
1866 (2.38)
28.72% (536)
33.49% (625)
18.17% (339)
10.72% (200)
8.90% (166)
3. The social activities in my neighborhood are for people of all age groups and cultures
1951 (2.41)
29.47% (575)
31.68% (618)
17.48% (341)
11.58% (226)
9.79% (191)
4. Older adults living in my neighborhood feel isolated and lonely
1565 (2.88)
11.95% (187)
28.75% (450)
31.05% (486)
15.40% (241)
12.84% (201)
5. Older adults in my neighborhood are respected
2096 (2.55)
19.08% (400)
37.45% (785)
21.66% (454)
13.17% (276)
8.64% (181)
Social Participation
Total (Mean Score)
Strongly Agree
Somewhat Agee
Neither Somewhat Disagree
Strongly Disagree
1. There are opportunities for me to take part in activities that help my physical well being
2220 (1.93)
44.37% (985)
34.77% (772)
9.37% (208)
6.67% (148)
4.82% (107)
2. There are opportunities for me to take part in activities that help my mental well being
2075 (2.07)
39.08% (811)
33.64% (698)
14.27% (296)
6.99% (145)
6.02% (125)
3. Social, religious, and cultural activities are available and
2192 (2.01)
40.74% (893)
35.13% (770)
12.09% (265)
6.89% (151)
5.16% (113)

78
affordable
Excellent Very Good Good Fair Poor
4. What is your overall rating for opportunities to participate socially in your community?
2242 (2.67)
19.80% (444)
27.52% (617)
26.32% (590)
18.42% (413)
7.94% (178)
Communication and Information
Total (Mean Score)
Strongly Agree
Somewhat Agee
Neither Somewhat Disagree
Strongly Disagree
1. If I need information on healthcare services and health-related support, I know where to find it(including disease-specific information, home care options, and caregiving)
2235 (2.00)
40.98% (916)
35.21% (787)
11.05% (247)
8.23% (184)
4.52% (101)
2. I know what to do in case of an environmental emergency (including a flood, an electrical outage, extreme heat or cold, a fire)
2313 (2.18)
32.56% (753)
40.29% (932)
9.99% (231)
11.11% (257)
6.05% (140)
3. I know what to do in case of a health-related emergency (including myself or someone nearby experiencing a heart attack, stroke, or fall)
2349 (1.87)
42.87% (1007)
40.02% (940)
7.96% (187)
6.00% (141)
3.15% (74)
4. There are places for me to go to access free computers, internet, and wifi
2009 (1.86)
48.18% (968)
33.05% (664)
8.31% (167)
5.03% (101)
5.43% (109)
5. I know where I can go to learn about new technologies
1973 (2.25)
35.48% (700)
32.08% (633)
13.84% (273)
8.67% (171)
9.93% (196)
6. I can access information I need in a language and format I easily understand
2103 (1.73)
54.78% (1152)
28.25% (594)
9.27% (195)
4.18% (88) 3.52% (74)
Civic Participation and Employment
Total
(mean score)
Strongly Agree
Somewhat Agee
Neither Somewhat Disagree
Strongly Disagree

79
1. There are flexible job opportunities for people aged 60 and over
1443 (3.83)
5.54% (80)
11.50% (166)
19.82% (286)
20.58% (297)
42.55% (614)
2. There are opportunities for leadership and advocacy
1657 (2.90)
14.85% (246)
30.05% (498)
22.81% (378)
15.03% (249)
17.26% (286)
3. There are opportunities for involvement in volunteer activities
2014 (2.15)
34.56% (696)
36.69% (739)
14.50% (292)
7.45% (150)
6.80% (137)
Excellent Very Good Good Fair Poor
4. What is your overall rating for civic participation in your community?
2029 (3.00)
11.19% (227)
23.56% (478)
30.90% (627)
23.26% (472)
11.09% (225)
Community Support and Health Services
Total
(mean score)
Excellent Very Good Good Fair Poor
1. Availability of affordable trustworthy home maintenance services (plumber, electrician, handyman, cleaning services)
1883 (2.80)
20.55% (387)
21.88% (412)
27.14% (511)
18.06% (340)
12.37% (233)
2. Availability of affordable trustworthy home health aides (including visiting nurses)
1068 (2.85)
17.60% (188)
22.66% (242)
29.12% (311)
18.45% (197)
12.17% (130)
3. Availability of affordable trustworthy financial services and information
1661 (2.70)
20.11% (334)
24.98% (415)
30.34% (504)
13.91% (231)
10.66% (177)
4. Availability of affordable trustworthy healthcare options in your neighborhood
1747 (2.71)
20.03% (350)
24.33% (425)
29.08% (508)
17.23% (301)
9.33% (163)

80
Appendix VIII: Map of Survey Regions
Zip Codes North-East: 60626, 60640, 60645, 60659, 60660 North-West: 60625, 60630, 60631, 60646, 60656, 60634, 60639, 60641 North-Central: 60613, 60614, 60618, 60647, 60657 Central: 60601, 60602, 60603, 60604, 60605, 60606, 60607, 60610, 60611, 60622, 60642, 60654, 60661 Central-West: 60608, 60612, 60624, 60644, 60651, 60609, 60623, 60629, 60632, 60638 South-East: 60615, 60616, 60637, 60649, 60653 South: 60617, 60619, 60628, 60633, 60620, 60621, 60636, 60643, 60652, 60655.

81
Appendix IX: A View from Chinatown
Introduction and Overview
The City of Chicago’s older population speaks a range of languages and has a broad spectrum of educational qualifications and cognitive abilities. Data from the 2012 ACS suggests that of the city’s 551,535 older Chicagoans of 55 and above, 5% are of Asian ethnicity (29,506); 36% are African American (199,338) and 16% are Hispanic (87,874). We knew from our environmental scan that most age-friendly community surveys have been conducted in English and that none have captured participation rates equivalent to Chicago’s minority population numbers. The AdvantAge Initiative 2003 National Survey, a random digit dial (RDD) telephone survey of a nationally representative sample of 1,512 non-institutionalized adults age 65 and over had achieved the following levels of participation by race and ethnicity: White non-Hispanic (82%), Black non-Hispanic (8%), Other (3%) and Race unknown (1%) (Center for Home Care Policy and Research, 2004). Research literature also suggests that minority and hard-to-reach older adults are less likely to complete online surveys than their Non-Hispanic White contemporaries. Another age-friendly project in Denver has found it necessary to focus separately on the Hispanic experience of growing older (Latino Community Foundation of Colorado, 2014). Several stakeholders advised us that some of the generic, policy-sourced age-friendly questions might prove culturally ambiguous. Civic participation in policy creation, for example, was one category considered largely irrelevant for non-white Hispanic groups, particularly for those who were undocumented. Volunteering was another contested term for non-whites and people of Asian descent. Much of what the literature considers ‘voluntary’ is hidden within these groups and is rather associated with helping out family and community in a personal capacity, not as an organized activity. Given these limitations, we knew that the policy orientation of the survey questions, coupled with the project’s choice of survey delivery, might make the task of achieving a representative sample of Chicagoans challenging.
‘’Bottom up “community engagement is key component of the WHO’s Age-Friendly project. To address survey limitations, we worked with CLESE to provide a Spanish and Polish language translation of the survey and with CASL to provide a Chinese language version. We also created flyers, posters, and paper copy versions in English, Spanish, Polish and Chinese languages, which our partners could disseminate to older adults without either access to computers or necessary computer skills. Project team members, with the help of stakeholders including the City of Chicago’s Council on Aging, senior center directors, the CHA, young volunteers, and many other nonprofits, disseminated and collected these surveys at a range of venues across the 77 community areas that comprise the city of Chicago. Following additional feedback from CASL translators that many older Chinese adults prefer visual rather than textual literacy, we also arranged a “deep-dive” community engagement event to present an abridged version of the survey in a visual format using an audio response polling system, as well as to pilot a small photovoice project to document what age (un) friendly city looks like to neighborhood residents.
Table 1: Chinese speaking participation in the age friendly baseline assessment methods
Public input opportunity Number of participants
Online Community Survey : Chinese responses 23
Town Hall survey event: Mandarin 19
Town Hall survey event : Cantonese 19
Photovoice : CASL 6
Total 67

82
Deep dive community engagement in Chinatown
CASL is located in the heart of Chinatown, approximately 1.3 miles to the south of the Chicago Loop, within the Armour Square community area. Adjacent neighborhoods include the Near South Side to the north and east, Bridgeport to the south, and Pilsen to the west. According to The Chinatown Community Vision Plan, CASL has developed into Chinatown’s primary community organization since its inception in 1978 (Chicago Metropolitan Agency for Planning, 2014). The largest employer in Chinatown, CASL provides services to approximately 17,000 clients and their families each year. Its reach extends out of Chinatown’s core neighborhood and through Chicago, the region, and the Midwest, making it the largest and “most comprehensive social services agency dedicated to serving the needs of Chinese Americans.” CASL was chosen as a partner for a deep dive community age-friendly engagement project for several reasons, including:
• Opportunity for the DFSS to contribute to the CMAP Chinatown Community Vision Plan (2013). • A long history of delivering culturally appropriate services, including housing, to older adults. • The location of CASL within an area with a statistically higher population of adults over the age of 65 than the
rest of the city. According to US census data, 18% of the population is over the age of 65, compared to 10.7% and 10.3% in the Greater Chinatown and Chicago areas, respectively.
• While many community areas are made up of a diversity of minority groups, residents of Chinatown are predominantly of Asian descent, providing cultural insight into the opinions and experiences of one particular cultural group in a particular geographic location.
The following information provides a detailed look at the deep dive engagement tools used to gather additional input from older adult consumers of a social service agency dedicated to the needs of Chinese Americans.
Online and paper copy Community Survey: Chinese language version
In order to encourage all older members of CASL to complete the online or paper copy survey, the project team reached out to CASL‘s Department of Older Adults. Their staff translated the survey into the Chinese language and posted information about it and links to it on CASL’s online newsletter. School-aged student volunteers were briefed to aid residents in CASL’s senior housing in completing the survey online; they assisted with both computer skills and survey comprehension. The student team collected 23 surveys. An additional 31 survey respondents independently cited CASL as their source of information for the English version of the survey. The young volunteers received an Age-Friendly “certificate of appreciation” for their help.

83
Town Hall
This event, which had 38 attendees in total (63% aged 65-74) was intended to introduce the Age- Friendly project to CASL members and enable limited or non-English speaking Chinese older adults to take an abridged version of the survey in a visual format. A PowerPoint presentation in both English and Chinese languages was simultaneously translated into Mandarin, and then Cantonese, by two members of CASL staff. Using an audio response system (Turning Point), participants were invited to poll their levels of agreement to a number of statements and questions.
Table 2: Abridged survey questions for Chinese Town Hall by domains.
Age-Friendly Domain Town Hall Question
Age-Friendliness Is Chicago an age-friendly city?
Outdoor Spaces and Building How do you rate the conditions for walking in your neighborhood? How do you rate the access to community buildings in your neighborhood? How do you rate the safety of your neighborhood?’
Transportation How do you rate the choices of transportation in your neighborhood? How do you rate the safety of transportation in your neighborhood?
Housing How do you rate the choices of affordable housing in your neighborhood? How do you rate the choices of supportive housing in your neighborhood?’
Community Support and Health Services
How do rate the choice of affordable health care options in your neighborhood?’ ‘How do you rate the choice of affordable trustworthy home maintenance services in your neighborhood?’ ‘How do you rate affordable trustworthy financial services and information in your neighborhood?’
Communication and Information ‘How strongly do you agree or disagree with the statement ‘I know where to find information about health care services and support?’ ‘Can you get information about services which support your health in a language and format you can easily understand? ‘I know what to do in case of an environmental emergency’; ‘I know what to do in case of health-related emergency?’
Social participation and ‘There are social groups I can join in my neighborhood’ ‘ I can take part in activities which help my physical and mental wellbeing’
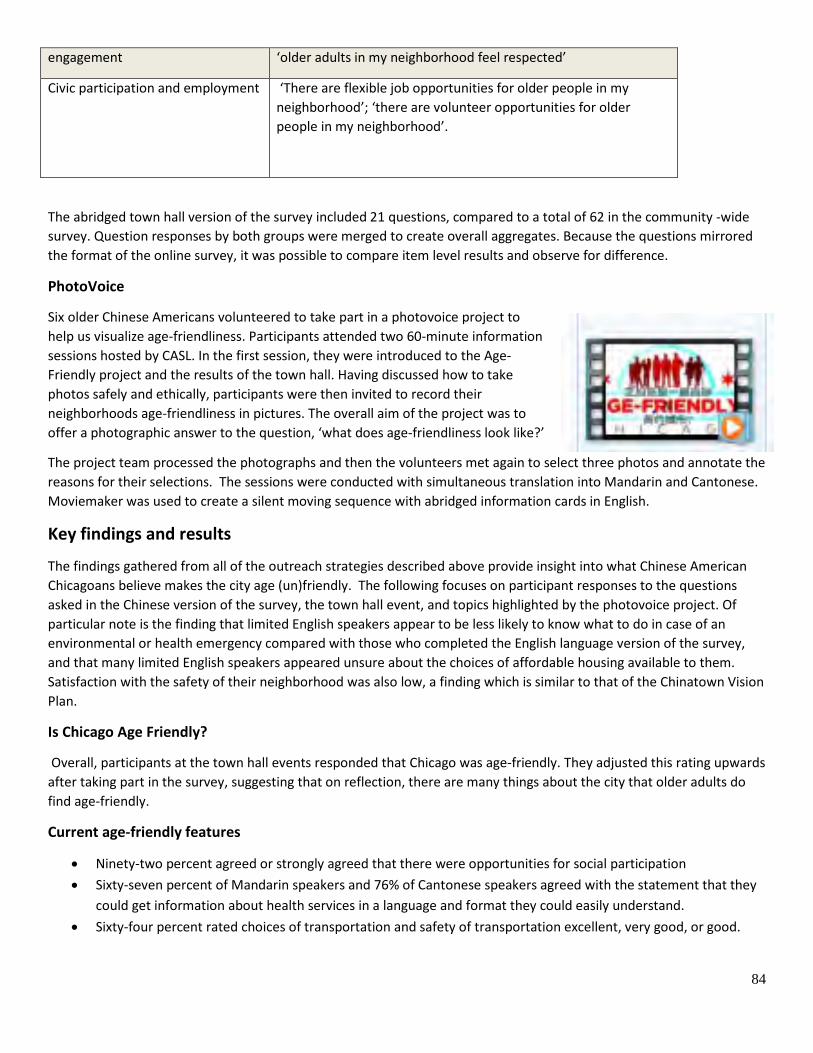
84
engagement ‘older adults in my neighborhood feel respected’
Civic participation and employment ‘There are flexible job opportunities for older people in my neighborhood’; ‘there are volunteer opportunities for older people in my neighborhood’.
The abridged town hall version of the survey included 21 questions, compared to a total of 62 in the community -wide survey. Question responses by both groups were merged to create overall aggregates. Because the questions mirrored the format of the online survey, it was possible to compare item level results and observe for difference.
PhotoVoice
Six older Chinese Americans volunteered to take part in a photovoice project to help us visualize age-friendliness. Participants attended two 60-minute information sessions hosted by CASL. In the first session, they were introduced to the Age-Friendly project and the results of the town hall. Having discussed how to take photos safely and ethically, participants were then invited to record their neighborhoods age-friendliness in pictures. The overall aim of the project was to offer a photographic answer to the question, ‘what does age-friendliness look like?’
The project team processed the photographs and then the volunteers met again to select three photos and annotate the reasons for their selections. The sessions were conducted with simultaneous translation into Mandarin and Cantonese. Moviemaker was used to create a silent moving sequence with abridged information cards in English.
Key findings and results
The findings gathered from all of the outreach strategies described above provide insight into what Chinese American Chicagoans believe makes the city age (un)friendly. The following focuses on participant responses to the questions asked in the Chinese version of the survey, the town hall event, and topics highlighted by the photovoice project. Of particular note is the finding that limited English speakers appear to be less likely to know what to do in case of an environmental or health emergency compared with those who completed the English language version of the survey, and that many limited English speakers appeared unsure about the choices of affordable housing available to them. Satisfaction with the safety of their neighborhood was also low, a finding which is similar to that of the Chinatown Vision Plan.
Is Chicago Age Friendly?
Overall, participants at the town hall events responded that Chicago was age-friendly. They adjusted this rating upwards after taking part in the survey, suggesting that on reflection, there are many things about the city that older adults do find age-friendly.
Current age-friendly features
• Ninety-two percent agreed or strongly agreed that there were opportunities for social participation • Sixty-seven percent of Mandarin speakers and 76% of Cantonese speakers agreed with the statement that they
could get information about health services in a language and format they could easily understand. • Sixty-four percent rated choices of transportation and safety of transportation excellent, very good, or good.

85
• Fifty-six percent agreed or strongly agreed that they knew what to do in case of environmental or health emergency. However, 20% were undecided and 9 % disagreed or strongly disagreed; the remainder either did not respond or responded that they did not understand the question. Polling suggests older adults were more knowledgeable about what to do in a health emergency than what to do in the case of environmental one.
• Fifty-nine percent rated access to outdoor spaces and buildings excellent, very good, or good.
Areas for improvement
• Fifty-eight percent were undecided, disagreed, or strongly disagreed that there were opportunities for civic engagement and employment for older adults.
• Forty-eight percent rated choices of affordable healthcare options, home maintenance, and financial services fair or poor. A particular note here is that 25% responded as undecided. This suggests that those being polled may have been unaware of these services or unsure of their relevance, or uncertain of the question.
• Ratings for safety of transportation were mixed (see figure 1). Forty-seven percent rated the safety of transportation as fair. Photovoice evidence suggests why this might be the case in Chinatown.
• Safety of the neighborhood was rated least favorably, with 51% of respondents rating this fair, poor, or undecided. This rating was in line with the top concerns identified by the CMAP study. Photovoice evidence suggests why this might be the case in Chinatown.
• Forty-nine percent rated choices of affordable housing fair or poor. Fifty percent were undecided about the choices of supportive housing. This suggests that those being polled may have been unaware of these services, unsure of their relevance, or uncertain of the question.
Figure 1: Combined Mandarin and Cantonese language responses for Transportation
What does Age-Friendliness look like?
Working with older adults as photographers, the photovoice project helped the project team visualize features that are precious to older adults living in their neighborhood, such as the Ping Tom Memorial Garden and Center, CASL, as well as better understand the reasons for some of the lower ratings given by town hall participants, such as those relating to transportation safety. Seven older adults took photos, and six attended the follow up session to select and discuss those photos. We present a selection of photos which also illustrate points made by other older adults across Chicago in the community-based survey. A full-size movie version of the complete project will be made available.
02468
101214161820
Excellent
VeryGood
Good Fair Poor Undecided
Choice of transportation 5 7 19 8 0 0Safety of transportation 3 5 10 18 0 0
Polli
ng N
umbe
rs
Transportation

86
Summary of photos
Many older adults who participated in the Age-Friendly survey talked about the places where they went to meet friends and engage in physical and social activities. The photos to the left, for example, are of one photographer’s visit to a
Korean grocery for fresh food and vegetables.
Ping Tom Park was also popular for physical activity and the Ping Tom Center for swimming by all ages. Particular features photovoice participants liked included the free swimming lessons for older adults.
The concerns photographers registered included pedestrian safety, such as uneven sidewalks, no sidewalks, and difficulty crossing the road or driving to get to CASL. For example, the panel below illustrates one photographer’s record of her concerns about going out. The photograph to the far right is of the pavement in Chinatown Square.
It is not flat and in winter becomes “like a skating rink.” The photos to the near right are of Ping Tom Park. She and her friends used to go there to exercise until one day they had their videos and recorded music stolen.
Pedestrian safety was a recurring theme among all survey participants. Photovoice participants were also concerned about this. The photos on the left document pedestrian crossing lights obscured by trees and the multiple lanes the photographer has to cross to reach her pharmacy and grocery stores.
The photos on the right record another participant’s daily journey to the Ping Tom Center to swim. The photographer was concerned that the cracked sidewalk outside her housing (detailed in the topmost photo) might lead to a fall since this has happened to friends. She explained that the roads approaching the center do not have sidewalks and many are busy with traffic. As the photograph on the right illustrates, the last road she has to cross to reach CASL has no pedestrian crossing.
Housing was a recurrent theme among photographers and survey respondents. The photographers were all living in CASL senior housing (see the photograph at the bottom left of the page). They were very aware that this was not an option available to all. Common to all their photovoice records was the central role that the resources near to their homes played in their lives and the importance of their access to them. These resources were enabling them to age in place. The photographers were concerned to illustrate things they saw as deterrents to their use of those resources, such as crime on

87
the main commercial streets, as well as public smoking and littering.
Transportation matters to the Chicagoans who took the survey and was a topic discussed and visually documented by the photovoice participants as well. Many survey respondents talked about the difficulty of waiting for buses at bus stops without shelter against the summer sun and against rain, wind, and snow in the winter.
Photographers recorded the reality of this on two bus routes popular with Chinese older adults. The photo to the bottom right is on bus route 24. Below left is on bus route 62. Neither have shelters.
The photographers were also concerned about older adults
using the dark secluded bus stop (above) before 7am and after 7pm. One suggested that transit options be increased by building a CTA Orange line top in Chinatown on the piece of vacant land shown in the image (left).
Conclusion
Both the town hall and the photovoice pilot projects provided invaluable insight into the way in which older adults with limited English think about the age-friendliness of the places they call home. The methods used can also be easily replicated by community groups to further understand the unique age-friendly resources, services, and environmental features of individual community areas. We have created a short film version of the photos project participants have taken. Those taking part wanted urban planning and policy-makers to understand their experiences as older adults and to take these experiences into consideration when putting together the Age-Friendly plan. They thank you for considering their thoughts and ideas.
For more information about photovoice, please visit:
Photovoice. Contra Costa Health Services. http://cchealth.org/topics/community/photovoice/
Photovoice: Reframing the World. http://www.photovoice.org/
Age-Friendly Communities. City of Thunder Bay. Centre for Education and Research on Aging and Health (CERAH). http://afc.uwaterloo.ca/PDF/Kenora%20-%20AFC%20CERAH.pdf

88
Appendix X: 14 Chicago Age Friendly Initiatives
These 14 initiatives build on the existing strengths and opportunities within the City of Chicago. Implementing any of these initiatives will help to support an Age-Friendly Chicago.
1) Corporate challenge: How many businesses in each neighborhood could become age friendly? a. Apply online for age friendly decal b. Display decal in the window
i. Allow older adults to use restrooms ii. Keep outdoor walkway clear from ice and snow
iii. Maintain good lighting iv. Always maintain courtesy and respect with your older clientele v. Assure accessibility to all patrons (non-slip rugs, door and aisles wide enough for wheelchairs
and motorized scooters, ramps where needed, if revolving door – signage to use door slowly: website for further info on making space accessible)
vi. Find resources for older adults at: (website) 2) Vertical villages
a. Enhance emergency preparedness b. Socialization between neighbors c. Opportunity for social participation & additional health & education programming.
3) Senior Ambassadors in the Police Departments (cross department initiative with Community Police) a. Train older adult volunteers to be ambassadors to go into senior centers or other locations (libraries,
villages, etc) and talk about safety of neighborhoods, what to do in extreme weather, cycling rules of the road, safety checklists for homes, etc.
4) Education and training for agency departments (fire fighters, transportation, police) a. Train agency service providers on common issues they may work with older adults: dementia (what to
do with someone who is wondering), neglect or abuse (financial, emotional), other common conditions in aging (difficulties with vision, hearing impairment, manifestation of medication mismanagement).
5) Design challenge: a. Benches: Accept bench designs for accessibility & comfort for residents of all ages. Winners benches are
created. b. Intergenerational Murals – contest for painting murals around the city with intergenerational themes.
6) Respect campaign a. Stand up for Seniors on buses b. Check in on your older neighbors
7) Replicate forward Chicago and other village models in diverse communities across Chicago. 8) Create a caregiver-friendly city
a. Caregiver timebanks programs b. Savvy caregiver program and powerful tools for caregivers available across Chicagoland at senior
centers, Alzheimer’s associations and other community organizations (train the trainer programs) 9) Invite high schoolers to senior centers and other locations for skills exchange & volunteer hours for students.
a. Kids teach seniors technology (how to skype to talk to grandchildren, send email, find recipes, etc) b. Seniors help kids with homework, 1-on-1 history lessons, or friendly visiting. Kids could help seniors
create life history portfolios. c. Kids practice for solo & ensemble contests, musicals, etc., at senior homes and centers.
10) Improvements in Accessibility (cross-department initiative) a. CTA maps to indicate elevator/lift access b. Aim to make taxi cabs 100% wheelchair accessible – accessible dispatch

89
11) Cross department initiatives with CDPH a. Extend play streets to encourage participation of older adults (e.g. benches and chess boards) b. Encourage senior center involvement in the Million Hearts Challenge c. Extend CPR training to senior centers and encourage it as a caregiver program d. Partner services for newly diagnosed HIV program to extend to take full advantage of the increasing
numbers of older adults living with HIV to partner them with newly diagnosed individuals. e. Expand the oral health plan to senior centers f. Home based interventions for healthy homes with CFD have already targeted older adults for fire safety
education and installing fire detectors. 12) Silver Alert – Partnership with CFD – public notification system for missing persons with dementia (adapted from
NY) 13) Innovative Senior Centers - Pilot innovative models in 3-5 senior centers across the city to re-invent the senior
center (adapted from NY). 14) Create an up-to-date Age-Friendly website and quarterly newsletter compiling information on events,
education, classes, cultural discounts, villages, etc., for all of Chicago.

90
Appendix XI: References
Age-Friendly NYC. (2014). Tools and Resources. Retrieved October 23, 2014, from http://www.nyam.org/agefriendlynyc/tools-and-resources
Aging Texas Well. (2009). Aging Texas Well Community Assessment Toolkit: Texas Department of Aging and Disability Services
Biggs, S., & Tinker, A. (2007). What makes a city age-friendly? London’s contribution to the World Health Organization’s Age-Friendly Cities Project. In P. Rosall (Ed.): Institute of Gerontology, King’s College London, Help the Aged.
Block, J. (2008). Q-sort methodology The Q-sort in character appraisal: Encoding subjective impressions of persons quantitatively (pp. 45-53). Washington, DC, US: American Psychological Association.
Burton, C. C., & Bridge, K. (2007). Long-Term Care: An AARP Survey of New York Residents Age 50+: AARP. CARDI. (2012). Focus On… Age-Friendly Cities. from http://www.cardi.ie/userfiles/July%20Age%20Friendly%20Cities.pdf Center for Home Care Policy and Research. (2004). The AdvantageAge Initiative National Survey of Adults Aged 65 and
Older. Indicator Chartbook. Retrieved October 23, 2014, from http://www.vnsny.org/advantage/resources.html#report
Centers for Disease Control and Prevention. (2014). Falls Among Older Adults: An Overview. Retrieved October 23
2014, from http://www.cdc.gov/homeandrecreationalsafety/falls/adultfalls.html Chatterjee, A., DeVol, R., & Irving, P. (2012). Best Cities For Successful Aging. Retrieved October 23, 2014, from
www.successfulaging.milkeninstitute.org/bcsa.taf?page=large-metros&category=transportation Chicago Department of Public Health. (2012). The Chicago Plan for Public Health System Improvement 2012-2016.
Retrieved October 15, 2014 Chicago Department of Transportation. (2014). Green Alley Project and Shared Sidewalks Project. Chicago Complete
Streets. Retrieved October 15, 2014, from http://chicagocompletestreets.org Chicago Health Atlas. (2014). Retrieved October 23, 2014, from http://www.chicagohealthatlas.org/ Chicago Metropolitan Agency for Planning. (2014). A Community Vision Plan for Chinatown. Retrieved October 23,
2014, from www.cmap.illinois.gov/programs-and-resources/lta/chinatown City Data. (2014). Chicago, Illinois (IL) Poverty Rate Data - Information about poor and low income residents. Retrieved
October 23, 2014, from www.city-data.com/poverty/poverty-Chicago-Illinois.html City of Chicago. (2014). Data Portal. Retrieved October 15, 2014, from https://data.cityofchicago.org/ CLESE. (2012). A Profile of Limited English Speaking Older Adults in Metropolitan Chicago. Feinberg, L., Reinhard, S., Houser, A., Choula, R. (2011). Valuing the Invaluable: 2011 Update The Growing Contributions
and Costs of Family Caregiving. Retrieved October 28, 2014, from http://assets.aarp.org/rgcenter/ppi/ltc/i51-caregiving.pdf
George, C. C. (2008). Homeless Over 50: The Graying of Chicago’s Homeless Population: Loyola University, Center for Urban Research and Learning.
Gibson, L. (2010). The Nature of Loneliness. http://magazine.uchicago.edu/1012/features/the-nature-of-loneliness.shtml
Haliburton County. (2013). Age-Friendly Communities: Tools for Building Strong Communities. Retrieved October 23, 2014, from http://afc.uwaterloo.ca/Community%20Stories/Haliburton%20updated.html
Johnson, R., Eisenstein, A., Taromino, C., McKohy, J., & Tulas, K. M. (2013). Age-Friendly Chicago Phase 1: Findings from focus groups with older adults in Chicago’s senior centers: Northwestern University, Buehler Center on Aging, Health, & Society.
Joint Center for Housing Studies. (2014). Housing America's Older Adults: Meeting the Needs of an Aging Population: Harvard University.
Keefe, J., & Hattie, B. (2007). Age-Friendly Cities Project: Halifax Site. Nova Scotia Centre on Aging. Koff, R. (2008). Developing a LivableChicago for All Ages. Retrieved October 23, 2014, from
http://www.aarp.org/content/dam/aarp/livable-communities/learn/civic/developing-a-livable-chicago-for-all-ages-engaging-older-adults-through-arts-and-culture-2008-aarp.pdf
Latino Community Foundation of Colorado. (2014). Colorado Latino Age Wave. from http://latinocfc.org/latino-age-wave

91
Lewis, J., Denton, M., Groulx, M., & Ducak, K. (2013). Finding the Right Fit: Age-Friendly Community Planning. Queen’s Printer for Ontario: University of Waterloo, McMaster University.
MAPS Corps. (2014). Southside Health. Retrieved October 23, 2014, from www.southsidehealth.uchicago.edu/index.html
MetLife Foundation. (2009). Caregiving in the U.S.: National Alliance for Caregiving, AARP. Perissonotto, C., Stijacic C., Covinsky, K. . (2012). Loneliness in Older Persons: A Predictor of Functional Decline and
Death. Archives of Internal Medicine, 172(14), 1078-1084. doi: 10.1001/archinternmed.2012.1993 Pollard, P. (2000). Livable Communities: An Evaluation Guide for the AARP Public Policy Institute: AARP. Prasad, A., Steels, S., Dagg, K., & Kano, M. (2007). Developing Indicators for Age Friendly Cities. Proscio, T. (2012). The Atlantic Philanthropies’ Effort to Expand Civic Engagement Among Older Americans 2001–2010 A
New Story About Later Life. http://www.atlanticphilanthropies.org/sites/default/files/uploads/AP-Civic-Engagement%20Report.pdf: Duke University, Sanford School of Public Policy.
Society, N. A. o. a. A. (September 2014). Public Policy & Aging E-Newsletter (Vol. 8). Stuehrk, K. (2014). How Cool are Senior in Your Neighborhood Data Matters. Social Impact Research Center: Heartland
Alliance. Sustainability Council. (2013). Sustainable Chicago 2015. Retrieved October 15, 2014, from
http://www.cityofchicago.org/content/dam/city/progs/env/SCYear1Report.pdf The Age-Friendly Portland Advisory Council. (2013). Action Plan for an Age-Friendly Portland. United States Department of Labor. (2008). Older Workers. from Bureau of Labor Statistics
www.bls.gov/spotlight/2008/older_workers Walk Score. (2014). Retrieved October 23, 2014, from www.walkscore.com World Health Organization. (2007). Global Age-Friendly Cities: Guide. World Health Organization. (2014). JAGES HEART. Retrieved October 23, 2014, from
http://www.who.int/kobe_centre/ageing/j_ages_heart/en/ Yonek, J., & Hasnain-Wynia, R. (2011). A Profile of Health and Health Resources within Chicago’s 77 Communities:
Northwestern University, Center for Healthcare Equity/Institute for Healthcare Studies.