Age determination of Atlantic halibut - Universitetet i Bergenfolk.uib.no/nfiaf/Karlson et al...
24
Title: Age determination of Atlantic halibut (Hippoglossus hippoglossus L.) along the 1 coast of Norway - status, and future potentials 2 3 Authors: Stine Karlson 1,2 , Kathrine Michalsen 1 , Arild Folkvord 2 4 5 Author addresses: 6 1 Institute of Marine Research, Nordnes, 5817 Bergen, Norway 7 2 Dept. of Biology, University of Bergen, Thormøhlensgate 53B, 5020 Bergen, Norway 8 9 Abstract 10 11 The Atlantic halibut, Hippoglossus hippoglossus, is known as the largest of the teleost fishes 12 inhabiting North-Atlantic waters, and its ability to attain great ages is well known. Because the 13 halibut is highly vulnerable to exploitation, and accurate age estimates are fundamental in the 14 understanding of fish biology and the management of fish populations, this study re-evaluates the 15 current aging methodology. The traditional method for estimating age of Atlantic halibut is through 16 surface readings of otoliths. Previous studies have not been compared to find the best practice for 17 surface reading techniques. Based on experiments with different preparation treatments and 18 techniques, this study establishes an updated procedure for the age determination of Atlantic 19 halibut. The present study suggests significant underestimation of ages have occurred using 20 previous protocols. The potential for using age determination to investigate spatial population 21 structure parameters such as size- and sex differences is also shown. 22 23 Keywords: aging methodology, Atlantic halibut, Hippoglossus hippoglossus, otoliths, size at age 24 25 26 27
Transcript of Age determination of Atlantic halibut - Universitetet i Bergenfolk.uib.no/nfiaf/Karlson et al...

Title: Age determination of Atlantic halibut (Hippoglossus hippoglossus L.) along the 1
coast of Norway - status, and future potentials 2
3
Authors: Stine Karlson1,2, Kathrine Michalsen1, Arild Folkvord2 4
5
Author addresses: 6
1 Institute of Marine Research, Nordnes, 5817 Bergen, Norway 7
2 Dept. of Biology, University of Bergen, Thormøhlensgate 53B, 5020 Bergen, Norway 8
9
Abstract 10
11
The Atlantic halibut, Hippoglossus hippoglossus, is known as the largest of the teleost fishes 12
inhabiting North-Atlantic waters, and its ability to attain great ages is well known. Because the 13
halibut is highly vulnerable to exploitation, and accurate age estimates are fundamental in the 14
understanding of fish biology and the management of fish populations, this study re-evaluates the 15
current aging methodology. The traditional method for estimating age of Atlantic halibut is through 16
surface readings of otoliths. Previous studies have not been compared to find the best practice for 17
surface reading techniques. Based on experiments with different preparation treatments and 18
techniques, this study establishes an updated procedure for the age determination of Atlantic 19
halibut. The present study suggests significant underestimation of ages have occurred using 20
previous protocols. The potential for using age determination to investigate spatial population 21
structure parameters such as size- and sex differences is also shown. 22
23
Keywords: aging methodology, Atlantic halibut, Hippoglossus hippoglossus, otoliths, size at age 24
25
26
27
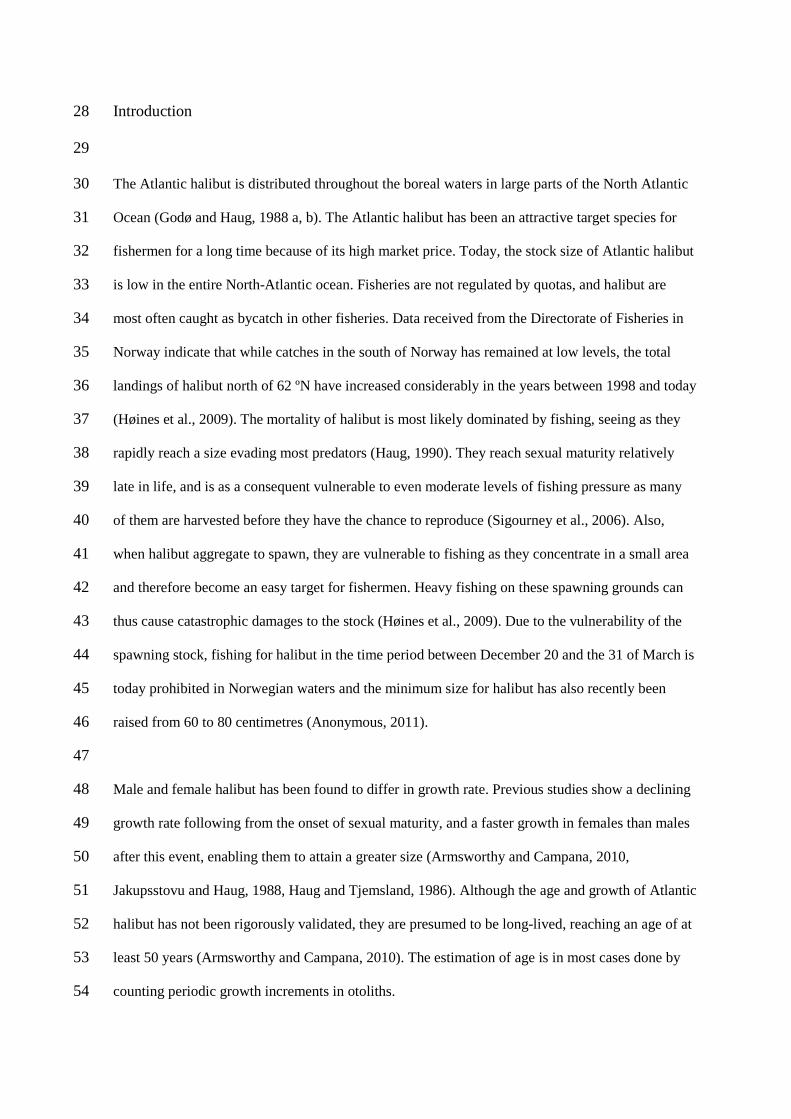
Introduction 28
29
The Atlantic halibut is distributed throughout the boreal waters in large parts of the North Atlantic 30
Ocean (Godø and Haug, 1988 a, b). The Atlantic halibut has been an attractive target species for 31
fishermen for a long time because of its high market price. Today, the stock size of Atlantic halibut 32
is low in the entire North-Atlantic ocean. Fisheries are not regulated by quotas, and halibut are 33
most often caught as bycatch in other fisheries. Data received from the Directorate of Fisheries in 34
Norway indicate that while catches in the south of Norway has remained at low levels, the total 35
landings of halibut north of 62 ºN have increased considerably in the years between 1998 and today 36
(Høines et al., 2009). The mortality of halibut is most likely dominated by fishing, seeing as they 37
rapidly reach a size evading most predators (Haug, 1990). They reach sexual maturity relatively 38
late in life, and is as a consequent vulnerable to even moderate levels of fishing pressure as many 39
of them are harvested before they have the chance to reproduce (Sigourney et al., 2006). Also, 40
when halibut aggregate to spawn, they are vulnerable to fishing as they concentrate in a small area 41
and therefore become an easy target for fishermen. Heavy fishing on these spawning grounds can 42
thus cause catastrophic damages to the stock (Høines et al., 2009). Due to the vulnerability of the 43
spawning stock, fishing for halibut in the time period between December 20 and the 31 of March is 44
today prohibited in Norwegian waters and the minimum size for halibut has also recently been 45
raised from 60 to 80 centimetres (Anonymous, 2011). 46
47
Male and female halibut has been found to differ in growth rate. Previous studies show a declining 48
growth rate following from the onset of sexual maturity, and a faster growth in females than males 49
after this event, enabling them to attain a greater size (Armsworthy and Campana, 2010, 50
Jakupsstovu and Haug, 1988, Haug and Tjemsland, 1986). Although the age and growth of Atlantic 51
halibut has not been rigorously validated, they are presumed to be long-lived, reaching an age of at 52
least 50 years (Armsworthy and Campana, 2010). The estimation of age is in most cases done by 53
counting periodic growth increments in otoliths. 54

In the management of fish stocks and stock assessment, invalid age estimation can lead to severe 55
implications (Høie, 2003, Bermejo, 2007) and knowledge of age is therefore one of the most 56
important issues to consider in order to construct efficient management plans and strengthen the 57
basis for recovery strategies. Information regarding age is a prerequisite for calculations of 58
numerous biological variables such as growth rate, productivity and mortality rate. Because all rate 59
calculations demand an elapsed time term or age, the need for age data is found in everything from 60
simple growth rate calculations to more complex analysis such as virtual population analysis 61
(Campana, 2001). Different methods have been tested and used for aging Atlantic halibut in recent 62
years. The procedure commonly used today e.g. by the Institute of Marine Research in Bergen 63
(IMR), involves reading whole otoliths, immersing both left and right otolith in water and 64
photographing both using transmitted light. The method is basically the same as the one used for 65
Greenland halibut, Reinhardtius hippoglossoides, where the right otoliths (from the dark side of the 66
fish) is interpreted because it is the one with the longest readable axis (Kvalsund and Solbakken, 67
2008). Previously the otoliths from the left (white) side was used for age determination on halibut ( 68
(Haug and Tjemsland, 1986). Given the characteristic differences between Atlantic and Greenland 69
halibut otoliths, there is some uncertainty whether or not the same interpretation approach can be 70
applied for the Atlantic halibut. It is suspected that the former method underestimates the true age 71
of halibut and the method for aging Greenland halibut is also currently under re-evaluation. 72
73
The main objective of this study was thus to compare different approaches of age determination for 74
the Atlantic halibut, and to establish a new and improved procedure for aging Atlantic halibut. In 75
order to improve the utilization of the information that the otoliths can provide in future 76
management of the species, we also describe the relationship between age, length and weight, 77
spatial size variations, and provide a preliminary age-length key. 78
79
Materials and methods 80
81

Material 82
Halibut were sampled in the years 2004-2006 and 2008-2010 along the coast of Norway (Figure 1, 83
Table 1). All otoliths collected between 2004 and 2006 had been stored dry in paper envelopes and 84
been aged either directly through a stereomicroscope or from digital images. 85
86
Additional sampling 87
Halibut were sampled on board the research vessel “Johan Hjort” during the annual coastal cruise 88
in October 2010. The procedure for collecting otoliths has remained the same for all samples 89
collected in all years included in this study. Trawl hauls were mainly performed on regular stations 90
along the coast using the Campelen 1800 shrimp trawl. All trawling procedures were carried out 91
according to standard procedures (Anonymous, 2008). The halibut caught in each haul were 92
weighed, and both individual and total weights of halibut were recorded. The total length was 93
measured on an electronic fish measuring board, the fish meter (Scantrol). The left and right 94
saggital otoliths were removed from their position directly behind the brain by making a frontal 95
section of the skull of the halibut. The otoliths were immediately put into small lidded cups, and 96
partly filled with seawater to prevent them from drying out. After marking the cups with station 97
number and fish number, they were put into plastic bags and frozen. 98
99
Digital images 100
Otoliths were photographed using a NIKON Stereoscopic Zoom Microscope SMZ 1500, objective 101
HR Plan Apo 0.5x. Otoliths collected in the years prior to 2008 had been stored in paper envelopes. 102
To determine what method of photographing gave the clearest view of increments, the otoliths 103
collected in the years between 2004 and 2006 were photographed after receiving different 104
treatments, using Eclipse net Software®. The otoliths were first photographed directly by placing 105
them with their concave side facing the objective, in a Petri dish filled with water. The same 106
otoliths were also photographed after a 24 hour immersion in water and after storage in 60% 107
glycerol for 24 hours. The otoliths were photographed using both transmitted and reflected light. 108
109
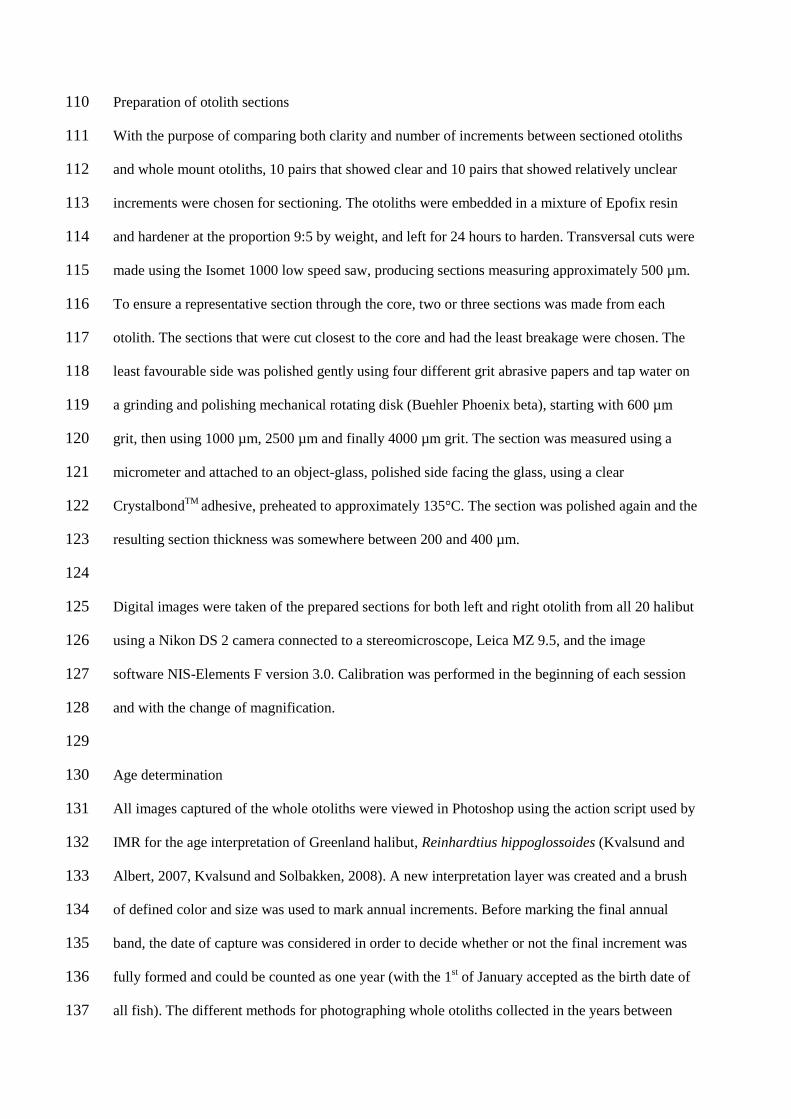
Preparation of otolith sections 110
With the purpose of comparing both clarity and number of increments between sectioned otoliths 111
and whole mount otoliths, 10 pairs that showed clear and 10 pairs that showed relatively unclear 112
increments were chosen for sectioning. The otoliths were embedded in a mixture of Epofix resin 113
and hardener at the proportion 9:5 by weight, and left for 24 hours to harden. Transversal cuts were 114
made using the Isomet 1000 low speed saw, producing sections measuring approximately 500 µm. 115
To ensure a representative section through the core, two or three sections was made from each 116
otolith. The sections that were cut closest to the core and had the least breakage were chosen. The 117
least favourable side was polished gently using four different grit abrasive papers and tap water on 118
a grinding and polishing mechanical rotating disk (Buehler Phoenix beta), starting with 600 µm 119
grit, then using 1000 µm, 2500 µm and finally 4000 µm grit. The section was measured using a 120
micrometer and attached to an object-glass, polished side facing the glass, using a clear 121
CrystalbondTM adhesive, preheated to approximately 135°C. The section was polished again and the 122
resulting section thickness was somewhere between 200 and 400 µm. 123
124
Digital images were taken of the prepared sections for both left and right otolith from all 20 halibut 125
using a Nikon DS 2 camera connected to a stereomicroscope, Leica MZ 9.5, and the image 126
software NIS-Elements F version 3.0. Calibration was performed in the beginning of each session 127
and with the change of magnification. 128
129
Age determination 130
All images captured of the whole otoliths were viewed in Photoshop using the action script used by 131
IMR for the age interpretation of Greenland halibut, Reinhardtius hippoglossoides (Kvalsund and 132
Albert, 2007, Kvalsund and Solbakken, 2008). A new interpretation layer was created and a brush 133
of defined color and size was used to mark annual increments. Before marking the final annual 134
band, the date of capture was considered in order to decide whether or not the final increment was 135
fully formed and could be counted as one year (with the 1st of January accepted as the birth date of 136
all fish). The different methods for photographing whole otoliths collected in the years between 137

2004 and 2006 were compared by studying the clarity of increments achieved either by 138
photographing the otoliths directly, after 24 hour immersion in water or after 24 hours in 60% 139
glycerol, using both transmitted and reflected light. Ages were interpreted for all otoliths 140
photographed by counting the marked increments on both left and right otolith, using transmitted 141
and reflected light, and on sectioned otoliths. All otoliths were assigned an age and a readability 142
ranging from 1-4, depending on the quality of the otolith. The results were compared across 143
treatments and light sources. 144
145
The choice of light source was based upon which of the two otoliths that consistently revealed the 146
highest number of distinct increments, and the preferred otolith was the one that revealed more and 147
clearer increments. Comparing sections and whole mount images of both left and right otolith gave 148
an indication of coherence of interpretation between the two methods. Comparisons 149
between the different methods gave a preferred approach for reading the otoliths, and this approach 150
was performed on all otoliths collected in the years between 2008 and 2010. 151
152
Statistical Analysis 153
The data analysis software system Statistica, version 10 (StatSoft inc., 2010), was used for all 154
graphical illustrations and statistical analyses. 155
The regression of the relationship between length and weight, as well as length and weight at age, 156
were analyzed using generalized linear models (GLM) analysis (StatSoft inc., 2010). The effects of 157
sex were tested by including sex as a factor in these analyses, and excluded if the interactions or 158
main effects were insignificant. 159
160
Results 161
162
Effect of otolith treatment and source of light on numbers and quality of increments 163
When comparing the images of otoliths exposed to different treatments (Figure 2), photographing 164
after a 24 hour immersion in water proved to be the best approach for achieving the most defined 165
increments (Figure 2b and e). Otoliths photographed directly after dry storage gave a matt surface 166
(Figure 2a and d), whereas otoliths photographed after 24 hours in glycerol produced a refringent 167
surface (Figure 2c and f). The otoliths in Figure 2a, b and c are photographed using transmitted 168
light, while the ones in Figure 2d, e and f are photographed with the use of reflected light. 169
Separating true increments from false increments (non-annual additional opaque or translucent 170
increments) was found to be more difficult on images captured using transmitted light. Using 171
reflected light revealed a higher number of distinct increments, as well as more equivalence 172
between left and right otolith interpretation. There was no significant difference between the 173
numbers of increments counted for the two light sources (paired t-test, Table 2, p > 0.05). 174
175
The ages interpreted on the left and right otolith were in most cases the same. In a few cases the 176
age was interpreted as being higher on the right otolith, but mostly it was the other way around. 177
The most common difference between left and right otolith was one increment (year) but in some 178
cases it was even more. There were a higher number of increments on the left than on the right 179
otoliths (paired t-test, Table 2, Figure 3, p < 0.001). The left otolith also showed the better 180
readability. 181
182
Interpreting whole otoliths and their sections gave the same ages in most cases. For otolith pairs 183
where the age estimated differed between left and right whole mount otolith, their sections showed 184
equivalence in 69.2 % of the cases. The interpretation was also more comparable with the left 185
whole otolith. However, comparing the age interpreted for the left and right whole otolith with the 186
sections revealed no significant difference (paired t-test, Table 2, p > 0.05). 187
188
Comparing former and current estimates of age 189
The ages estimated for halibut in this study were higher in almost all cases compared to former 190
estimates of the same otoliths. Both the left and right otolith resulted in higher age estimates in this 191
study compared to previous estimates (paired t-test, Table 2, p << 0.001, Figure 4). This difference 192
increased with age and was also in a magnitude of several years for many of the cases. 193

194
Size and growth of Atlantic halibut 195
The relationship between log total length and log wet-weight for Atlantic halibut was close to 196
allometric (Figure 5). The slope (3.21) was significantly different from 3 (GLM, p << 0.001), 197
indicating a non-isometric relationship. There were no differences in the length-weight relationship 198
between male and female halibut in the size range studied (GLM, p > 0.05). 199
200
The measured length at age was found to differ for males and females. The weight and length 201
appeared to increase continuously for both sexes as they grew older, and females were generally 202
heavier and longer at a given age than males (Figure 6, GLM, p < 0.05). 203
204
Spatial variation in sizes and in sizes at age for males and females 205
Dividing our sampling sites into northern and southern regions gave us latitudinal locations ranging 206
from 62.9°N to 71.2°N with 66.5°N as the north/south boundary. The halibut caught in northern 207
latitudes were larger in size than the ones sampled further south (GLM, p < 0.05). The lengths and 208
weights at age in the northern latitudes were also significantly greater than those in southern (GLM, 209
p < 0.05, Figure 7). 210
211
Discussion 212
213
Aging procedure for Atlantic halibut 214
The traditional method for aging halibut is by otolith surface readings (Armsworthy and Campana, 215
2010). In the present study, surface readings after different treatments were performed. Glycerol 216
was expected to enhance the contrast of the growth increments (Forsberg, 2001). After 24 hours 217
storage in 60% glycerol the results showed otoliths with a certain transparency, where increments 218
were almost erased. It was found that a 24 hour immersion in water is the best approach for 219
enhancing the incremental structure of the otoliths. The choice of reflected light over transmitted 220
light also proved to be preferable. The choice of left or right otolith has previously been determined 221

based on which of the two that has the longest readable axis (Kvalsund and Albert, 2007). Even 222
though the right otoliths have the longest readable axis in halibut, this study concluded that the left 223
otolith showed clearer growth increments, as well as a significantly higher number of distinct 224
increments than the corresponding right otolith. This is in accordance with (Haug and Tjemsland, 225
1986), which also found that the otoliths collected from the left side of the fish show clearer growth 226
increments. Sectioning of otoliths reinforced the conclusion that the left otolith is preferable, also 227
the left whole otolith was more comparable with the section than the interpretation when using the 228
right otolith. 229
230
No significant differences were found between the surface readings and the cross section readings 231
in this study. Sectioning of otoliths was found to be a useful tool in cases where the whole otoliths 232
are damaged above or below the core as it can still be interpreted. Previous aging studies performed 233
for a number of species have found that otolith surface readings underestimate age (Albert et al., 234
2009, Blood, 2003, Lee et al., 2009). Although no evidence of underestimation was found in our 235
study, this might be a result of the lacking number of older individuals. If the fish is old it can be 236
difficult to interpret the outer most increments of the otolith. A cross section reveal greater detail 237
and can then give a more reliable estimate of the age. A study comparing surface reading and break 238
and burn methods for Pacific halibut, found a divergence of the two aging methods beginning at 239
age 7, with the break and burn method yielding a higher age (Blood, 2003). From images captured 240
in this study, it is clear that the quality of the otoliths vary greatly. When the interpretation of 241
annual increments exceeds nine, the difference between left and right otolith sometimes become 242
more than one. In cases where this difference occurs, it is often related to the readability of the 243
otolith. In this study, otoliths that were given a readability of three or four, meaning either very 244
difficult to read or broken respectively, occasionally had age differences between right and left of 245
more than one year. With poor readability, sectioning was found to be a preferable method for age 246
interpretation as the visibility of increments was improved and the difference between the otoliths 247
were reduced. 248
249
The current study showed that the number of increments recorded for both left and right otolith was 250
significantly higher than the number of increments recorded by the method previously used by 251
IMR, indicating a possible previous underestimation of the age in Atlantic halibut. The severity of 252
underestimation is related to the resulting overestimation of growth rates, mortality rates and 253
reduction in stock abundances (Bertignac, 2007). Long term management and recovery plans will 254
therefore be hampered. The current study also found that aging became more difficult for presumed 255
older individuals. Errors related to accurate aging of older fish are not random and are biased 256
towards younger ages. Subjectivity is an element that is difficult to avoid in age interpretation, and 257
therefore a possible source of error (Haug and Tjemsland, 1986). The only way to prove that an age 258
is accurate is through validation (Beamish and McFarlane, 1983). It is therefore not possible to 259
conclude with absolute certainty which of the two methods give the correct estimates of age 260
without proper validation. However the occurrence of the opaque character of the outer increment 261
for halibut caught during summer and translucent increment for individuals caught during winter, 262
indicate annual increment deposition in halibut otoliths. Recently developed validation methods 263
that have proven to be rigorous include bomb-radiocarbon assays (Armsworthy and Campana, 264
2010) and chemical tagging of otoliths using oxytetracycline (OTC) followed by recapture (Treble 265
et al., 2008). 266
267
Size and age relationships 268
This study found a similar relationship between length and weight for males and females for the 269
size range studied. The relative growth appeared greater at younger ages and decreased with age. 270
During the first 4-6 years there was no pronounced difference in length or weight between the 271
sexes. Male sizes at age appeared to level out some at an age of 10-12, while female growth 272
seemed to accelerate at this point. Females were found to become significantly longer and heavier 273
with age than males. These observations are consistent with previous findings (Jakupsstovu and 274
Haug, 1988, Haug and Tjemsland, 1986, Sigourney et al., 2006, Devold, 1938, Armsworthy and 275
Campana, 2010). 276

The possible effects of environmental variation on fish size should be considered as the halibut 277
included in this study was sampled at different times of the year. Evidence of the occurrence of 278
post-spawning recovery growth in cod, Gadus morhua, has been established, and the condition of 279
fish has been found to have an influence on size and growth (Pedersen and Jobling, 1989). Previous 280
studies have found that the mean relative liver weight is reduced throughout the spawning season in 281
Atlantic halibut, and depending on their state of maturity, both male and female halibut gonads had 282
different weight proportions, affecting the total weight of the fish. In spite of these findings, the 283
general body weight loss has been found to be low during spawning (Haug and Gulliksen, 1988). 284
The use of relative weight measurements as indices of growth, should perhaps be reconsidered, as 285
it might be a more robust predictor of fecundity 286
287
Size distribution of halibut along the Norwegian coast 288
This study found latitudinal differences in the size distribution of Atlantic halibut along the 289
Norwegian coast where both males and females collected in the more northern latitudes were 290
significantly larger. Also, the lengths and weights at age were significantly greater in the ones 291
collected at the higher latitudes. Distinct variations in life history strategies and biological 292
characteristics have been documented in species inhabiting wide latitudinal ranges (Boehlert and 293
Kappenman, 1980). The Atlantic halibut has a large north - south distribution range in the North 294
Atlantic Ocean. For several species, it has been shown that northern fish populations can have a 295
higher growth potential than populations further south (Conover and Present, 1990). In a study 296
performed on geographic variation in growth of juvenile Atlantic halibut, it was found that high 297
latitude populations of juvenile halibut displayed a higher growth rate at all temperatures compared 298
to lower latitude populations (Jonassen et al., 1999). Whether the observed growth patterns are due 299
to genetic population differences among northern and southern halibut populations along the 300
Norwegian coast remains to be documented. 301
302
Age-length-weight keys 303

Given the established differences in growth rates between males and females, an age key has to be 304
separate for the sexes. The scarcity of material available in the different age groups sampled in this 305
study prevents the construction of a valid age-length-weight key, and leave us with a very rough 306
overview of what ages to expect for the different length classes (Table 3 and 4). The primary 307
determinant of weight for fish is length (Anderson and Neumann, 1996). The allometric 308
relationship that was found to exist between length and weight, indicate a change in body shape 309
with increasing age. Halibut included in the current study were sampled at various times of the 310
year, and weight has been shown to vary with condition, which again vary with season (Pedersen 311
and Jobling, 1989). For this reason, including weight in an age key may introduce certain potential 312
problems since weight (and condition), fluctuates seasonally, making it a less suitable indicator of 313
age. Mean length in combination with age are often used by fisheries biologists to assess fish 314
growth (Bettoli and Miranda, 2001). The expenses and difficulties related to age determination of 315
fish, makes the application of length distributions for age estimation an attractive choice (Kimura 316
and Chikuni, 1987). Also, measuring the length of a large number of individuals is relatively easy 317
compared to the rather tedious assessment of the ages of each and every individual (Ogle, 2008). In 318
our preliminary age-length key, a halibut of 50 cm is around 5 years of age (5.0 and 5.4 for females 319
and males respectively). At this size there is a large overlap in age-at-size between males and 320
females, but a further divergence in age-at-size for older individuals is indicated (e.g. on average 321
8.3 and 9.1 years of age for 80 cm females and males). However, more data is required for the 322
larger size classes to construct a reliable age-length key. 323
324
A new aging procedure is proposed for Atlantic halibut, and comparison with previous age 325
estimates, indicate that a significant age-underestimation has taken place for older individuals. 326
Regional comparisons further indicate a faster growth of halibut caught in the northernmost areas 327
along the Norwegian coast compared to further south. 328
329
Acknowledgements 330

We would like to thank Lisbet Solbakken and Merete Kvalsund for all their help and comments 331
related to otolith reading. We are also grateful to all the people who have participated in the 332
surveys collecting material for this study. This paper was financially supported by the Institute of 333
Marine Research and the University of Bergen, Norway. 334
335
References 336
ALBERT, O. T., KVALSUND, M., VOLLEN, T. & SALBERG, A. 2009. Towards 337
accurate age determination of Greenland halibut. Journal of Northwest Atlantic 338
Fishery Science, 40, 81-95. 339
ANDERSON, R. O. & NEUMANN, R. M. 1996. Length, weight, and associated structural 340
indices. Fisheries techniques, 2nd edition. American Fisheries Society, Bethesda, 341
Maryland, 5, 447-482. 342
ANONYMOUS 2008. Håndbok for vitenskapelig tråling, versjon 3.0. p1-94. 343
ANONYMOUS 2011. Kysten er din- regler for fritidsfiske i sjøen. Bergen 344
Fiskeridirektoratet. 345
ARMSWORTHY, S. L. & CAMPANA, S. E. 2010. Age determination, bomb-radiocarbon 346
validation and growth of Atlantic halibut (Hippoglossus hippoglossus) from the 347
Northwest Atlantic. Environmental Biology of Fishes, 89, 279-295. 348
BEAMISH, R. J. & MCFARLANE, G. A. 1983. The forgotten requirements for age 349
validation in fisheries biology. Transactions of the American Fisheries Society, 350
112, 735-743. 351
BERMEJO, S. 2007. Fish age classification based on length, weight, sex and otolith 352
morphological features. Fisheries Research, 84, 270-274. 353
BERTIGNAC, M. D. P., H. 2007. Consequences of bias in age estimation on assessment 354
of the northern stock of Eurpoean hake (Merluccius merluccius) and on the 355
management advice. ICES Jornal of Marine Science 64, 981-988. 356
BETTOLI, P. W. & MIRANDA, L. E. 2001. Cautionary note about estimating mean 357
length at age with subsampled data. North American Journal of Fisheries, 21, 425-358
428. 359
BLOOD, C. L. 2003. Comparison of surface and break- and -burn otolith methods of aging 360
Pacific halibut. Technical report, 20-31. 361
BOEHLERT, G. W. & KAPPENMAN, R. F. 1980. Variation of growth with latitude in 362
two species of Rockfish (Sebastes pinniger and S. diploproa) from the Northeast 363
Pacific Ocean. Marine Ecology-Progress Series, 3, 1-10. 364
CAMPANA, S. 2001. Accuracy, precision and quality control in age determination, 365
including a review of the use and abuse of age validation methods. Journal of Fish 366
Biology, 59, 197-242. 367
CONOVER, D. O. & PRESENT, T. M. C. 1990. Countergradient variation in growth rate: 368
compensation for length of the growing season among Atlantic silversides from 369
different latitudes. Oecologia, 83, 316-324. 370
DEVOLD, F. 1938. The North Atlantic halibut and net fishing. Fiskeridirektoratets 371
skrifter, HavUndersøkelser 5, 1-47. 372
FORSBERG, J. E. 2001. Aging manual for Pacific halibut: procedure and methods used at 373
the International Pacific Commission (IPHC). Technical report, 46. 374
GODØ, O. R. & HAUG, T. 1988a. Tagging and recapture of Atlantic halibut 375
(Hippoglossus hippoglossus) in continental shelves off eastern Canada, and off 376
western and eastern Greenland. Journal of Northwest Atlantic Fishery Science, 8, 377
25-31. 378
GODØ, O. R. & HAUG, T. 1988b. Tagging and recapture of Atlantic halibut 379
(Hippoglossus hippoglossus) in Norwegian waters. Journal Du Conseil 380
International Pour I`Exploration de la Mer, 44, 169-179. 381

HAUG, T. 1990. Biology of the Atlantic halibut, Hippoglossus hippoglossus (L, 1758). 382
Advances in Marine Biology, 26, 1-70. 383
HAUG, T. & GULLIKSEN, B. 1988. Variations in Liver and Body Condition During 384
Gonad Developmentof Atlantic Halibut, Hipoglossus Hipoglossus (L.). 385
Fiskeridirektoratets skrifter, 18, 351-363. 386
HAUG, T. & TJEMSLAND, J. 1986. Changes in size-distributions and age-distributions 387
and age at sexual maturity in Atlantic halibut, Hippoglossus hippoglossus, caught 388
in Norwegian waters. Fisheries Research, 4, 145-155. 389
HØIE, H. 2003. Stable oxygen and carbon isotopes in fish otoliths as environmental 390
recorders. Dr. Scient. thesis, University of Bergen. 391
HØINES, Å., BJELLAND, O., MICHALSEN, K., VØLSTAD, J. H., HELLE, K., 392
VOLLEN, T., K, N. & ALBERT, O. T. 2009. Kveite i norske farvann, status og 393
utfordringer for forvaltning og forskning. Rapport fra havforskningen, 1, 1-15. 394
JAKUPSSTOVU, S. H. & HAUG, T. 1988. Growth, sexual maturation, and spawning 395
season of Atlantic halibut, Hippoglossus hippoglossus, in Faroese waters. Fisheries 396
Research, 6, 201-215. 397
JONASSEN, T. M., IMSLAND, A. K., FITZGERALD, R., BONGA, S. W., HAM, E. V., 398
NÆVDAL, G., STEFANSSON, M. O. & STEFANSSON, S. O. 1999. Geographic 399
variation in growth and food conversion efficiency of juvenile Atlantic halibut 400
related to latitude. Journal of Fish Biology, 56, 279-294. 401
KIMURA, D. K. & CHIKUNI, S. 1987. Mixtures of empirical distributions: an iterative 402
application of the age-length key. Biometrics, 43, 23-35. 403
KVALSUND, M. & ALBERT, O. T. 2007. Age estimation of Greenland halibut 404
(Reinhardtius hippoglossoides). Technical report, Institute of Marine Research, 1-9. 405
KVALSUND, M. & SOLBAKKEN, L. 2008. Prosedyre for aldersbestemmelse av kveite 406
(Hippoglossus hippoglossus). Technical report, Institute of Marine Research, 2-8. 407
LEE, J. H., KODAMA, K., KUME, G., OYAMA, M., KATAYAMA, S., TAKAO, Y. & 408
HORIGUCHI, T. 2009. Comparison between surface-reading and cross-section 409
methods using sagittal otoliths for age determination of the marbled sole 410
Pseudopleuronectes yokohamae. Fisheries Science, 75, 379-385. 411
OGLE, D. 2008. Assigning individual ages with an age-length key. assessment, 1-8. 412
PEDERSEN, T. & JOBLING, M. 1989. Growth rates of large, sexually mature cod, Gadus 413
morhua, in relation to condition and temperature during an annual cycle. 414
Aquaculture 81, 161-168. 415
SCANTROL, A. Scantrol AS [Online]. Bergen. Available: 416
www.scantrol.no/marineresearchproductguide.cfm?pArticleId=8945&pArticleColl417
evtionId=447 [Accessed March 2011]. 418
SIGOURNEY, D. B., ROSS, M. R., BRODZIAK, J. & BURNETT, J. 2006. Length at age, 419
sexual maturity and distribution of Atlantic Halibut, Hippoglossus hipoglossus L., 420
off thee Northeast USA. Journal of Northwest Atlantic Fishery Science, 36, 81-90. 421
TREBLE, M. A., CAMPANA, S. E., WASTLE, R. J., JONES, C. M. & BOJE, J. 2008. 422
Growth analyses and age validation of a deepwater Arctic fish, the Greenland 423
halibut (Reinhardtius hippoglossoides) Canadian Journal of Fisheries and Aquatic 424
Sciences, 65, 1047-1059. 425
426
427
428
429

Table 1. Halibut otoliths collected in the years 2004-2006 and 2008-2010, indicating how many 430
pairs of otoliths that have been collected and how many of these which are available for further 431
study. 432
Year Source/ vessel Date No. Otolith pairs Available for the study *
2004 RV Johan Hjort 14.10-10.11 31 0
RV Jan Mayen 22.10-07.11 16 0
FV Førde Jr 19.09-03.10 48 44
Fishermen 10 1
2005 Fishermen 24.02-25.02 8 0
RV G.O. Sars 27.02-17.08 7 2
Reference fleet 27.04-22.08 10 2
RV Johan Hjort 23.10-04.11 17 17
RV Jan Mayen 26.10-07.11 11 11
FV Amigo 26.11-30.11 6 6
2006 RV Johan Hjort 12.02-16.11 23 23
FV Amigo 1.08 22 22
2008 RV Johan Hjort 03.10-14.11 21 21
NIFES** 20.02-11.12 23 23
2009 NIFES** 21.01 1 1
RV Johan Hjort 06.10-25.10 17 17
RV Jan Mayen 04.10-24.10 17 17
2010 RV G.O. Sars 24.08 1 1
RV Johan Hjort 03.04-03.11 56 56
Total 345 264
* Some otoliths were not available due to prior sectioning 433
** National Institute of Nutrition and Seafood research 434
435
436
437

Table 2. Overview of mean increment number counted when comparing across methods. 438
Gr 1 Mean Gr 2 Mean p-value
Left otolith, Reflected light vs. Transmitted light 8.16 7.99 0.054
Right otolith, Reflected light vs. Transmitted light 7.70 7.54 0.077
Left whole otolith vs. Right whole otolith 7.45 7.19 < 0.001
Left section vs. Left whole 8.79 8.88 0.571
Right section vs. Right whole 8.91 8.68 0.128
New age estimate vs Previous age estimate 8.09 6.08 <<0.001
439
Table 3. Distribution of Females within each age and length class. Because of low numbers of large 440
halibut, individuals estimated to an age of 12 years old or older, and 100cm long or longer are 441
pooled together. 442
443
Age
LClass 1 2 3 4 5 6 7 8 9 10 11 12+ Row
20 1 0 0 0 0 0 0 0 0 0 0 0 1
30 0 0 0 0 0 0 0 0 0 0 0 0 0
40 0 0 1 5 3 0 0 0 0 0 0 0 9
50 0 0 2 13 14 4 6 0 0 0 0 0 39
60 0 0 0 1 4 6 2 2 2 0 0 0 17
70 0 0 0 0 1 3 1 1 3 0 0 0 9
80 0 0 0 0 0 1 2 2 2 1 1 0 9
90 0 0 0 0 0 0 1 1 2 1 0 0 5
100+ 0 0 0 0 0 0 0 0 0 2 3 4 9
All Grps 1 0 3 19 22 14 12 6 9 4 4 4 98
444
445
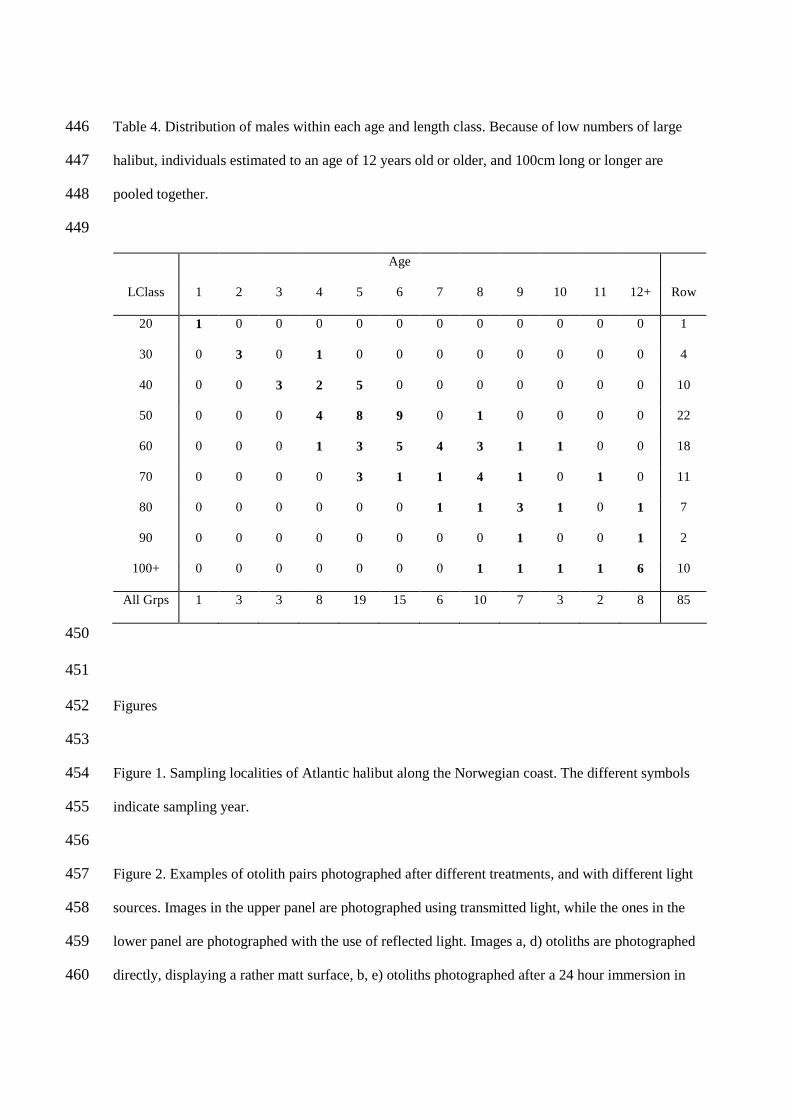
Table 4. Distribution of males within each age and length class. Because of low numbers of large 446
halibut, individuals estimated to an age of 12 years old or older, and 100cm long or longer are 447
pooled together. 448
449
Age
LClass 1 2 3 4 5 6 7 8 9 10 11 12+ Row
20 1 0 0 0 0 0 0 0 0 0 0 0 1
30 0 3 0 1 0 0 0 0 0 0 0 0 4
40 0 0 3 2 5 0 0 0 0 0 0 0 10
50 0 0 0 4 8 9 0 1 0 0 0 0 22
60 0 0 0 1 3 5 4 3 1 1 0 0 18
70 0 0 0 0 3 1 1 4 1 0 1 0 11
80 0 0 0 0 0 0 1 1 3 1 0 1 7
90 0 0 0 0 0 0 0 0 1 0 0 1 2
100+ 0 0 0 0 0 0 0 1 1 1 1 6 10
All Grps 1 3 3 8 19 15 6 10 7 3 2 8 85
450
451
Figures 452
453
Figure 1. Sampling localities of Atlantic halibut along the Norwegian coast. The different symbols 454
indicate sampling year. 455
456
Figure 2. Examples of otolith pairs photographed after different treatments, and with different light 457
sources. Images in the upper panel are photographed using transmitted light, while the ones in the 458
lower panel are photographed with the use of reflected light. Images a, d) otoliths are photographed 459
directly, displaying a rather matt surface, b, e) otoliths photographed after a 24 hour immersion in 460

water, were increments are pronounced and clear, and in c, f) otoliths are photographed after 24 461
hours in glycerol, producing a refringent surface. 462
463
Figure 3. The relationship between ages of the left and right otolith photographed using reflected 464
light. The regression line, confidence interval and the y = x line are indicated by different shape 465
and thickness. The size of the dots indicate frequency of age observations. 466
467
Figure 4. The difference in age interpreted for the same otoliths using the former and current 468
method (regression line (solid line), confidence interval (dashed line) and the y=x line (thick solid 469
line)).The size of the dots indicate frequency of age observations. 470
471
Figure 5. Regression of the relationship between log transformed length in cm and log transformed 472
weight in grams. N= 247 473
474
Figure 6. Regression of the relationship between length and age, categorized by sex. Males and 475
females are indicated by different color and symbols. N= 183 476
477
Figure 7. Regression of the relationship between length and age observed for male and female 478
halibut caught at different latitudes. N=174 479
480
481
482
483
484
485
486
487
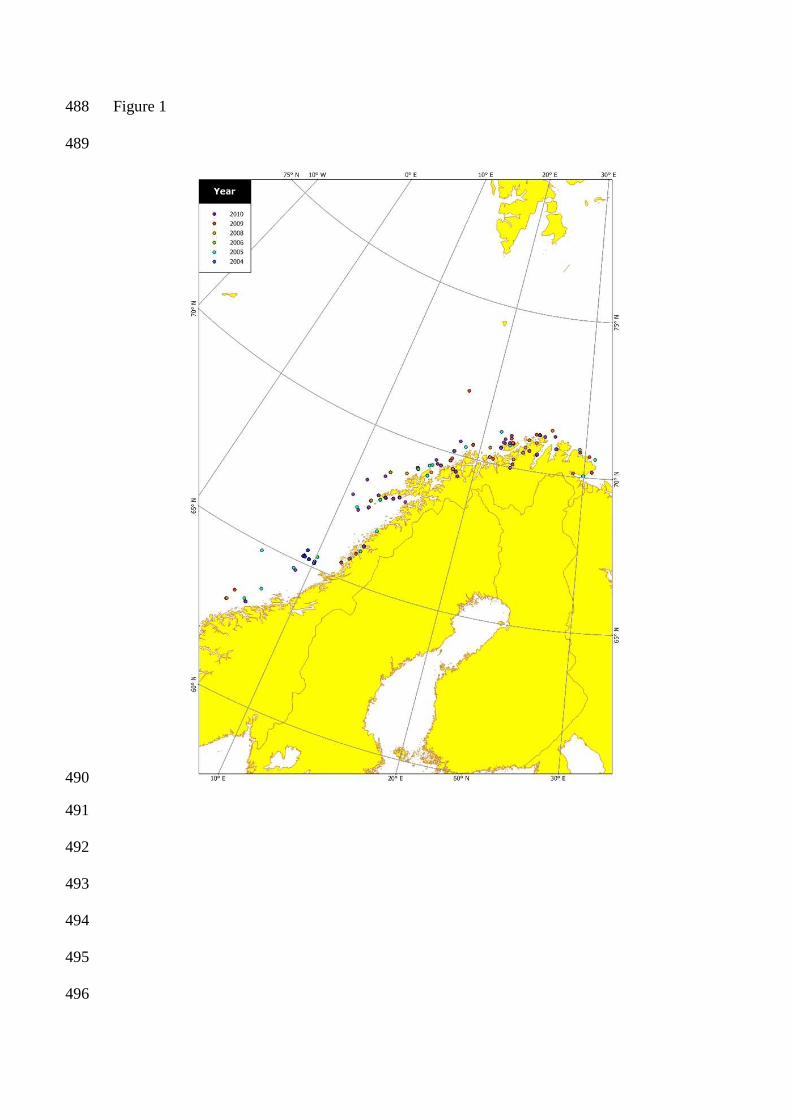
Figure 1 488
489
490
491
492
493
494
495
496
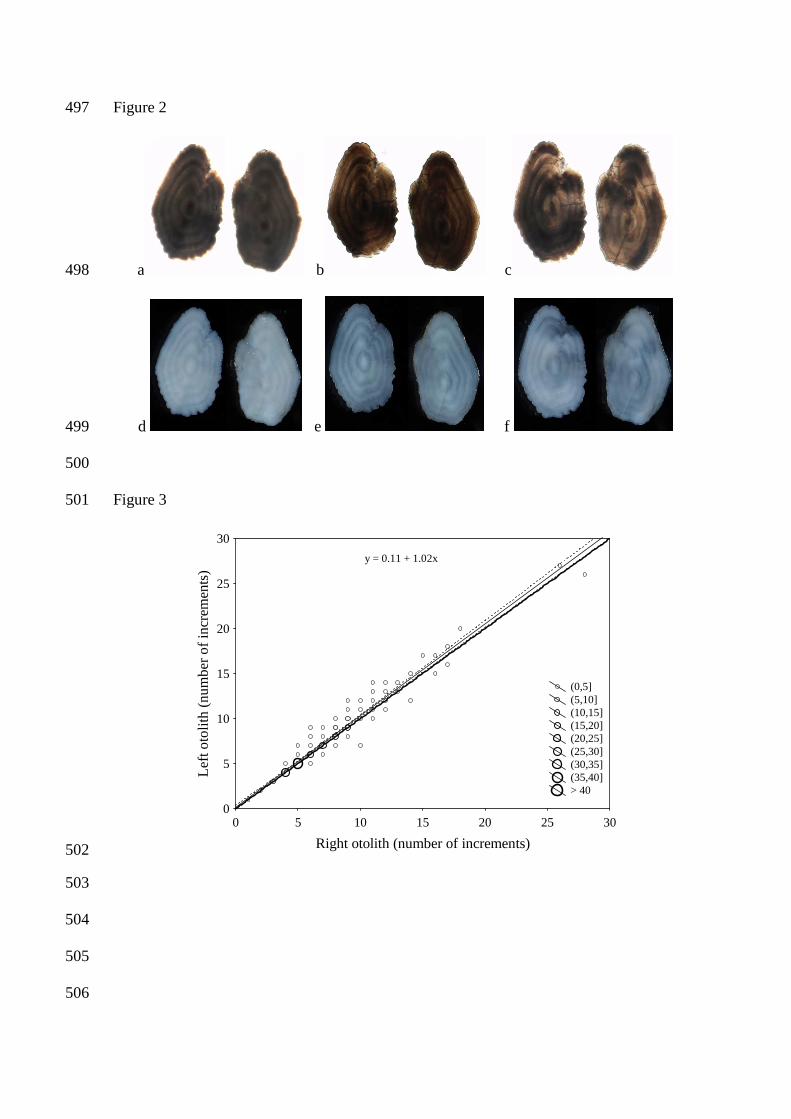
Figure 2 497
a b c 498
d e f 499
500
Figure 3 501
0 5 10 15 20 25 30
Right otolith (number of increments)
0
5
10
15
20
25
30
Lef
t oto
lith
(n
um
be
r o
f in
crem
ents
) y = 0.11 + 1.02x
(0,5] (5,10] (10,15] (15,20] (20,25] (25,30] (30,35] (35,40] > 40
502
503
504
505
506
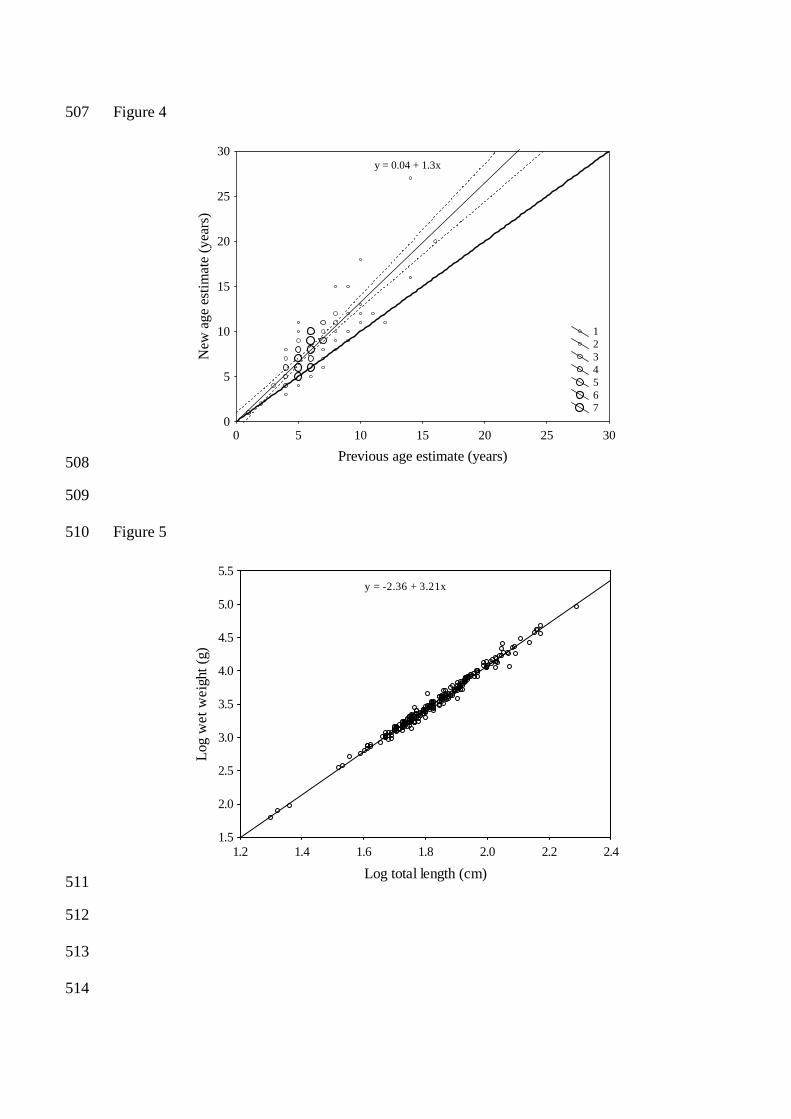
Figure 4 507
0 5 10 15 20 25 30
Previous age estimate (years)
0
5
10
15
20
25
30
New
ag
e es
tima
te (
year
s)
1 2 3 4 5 6 7
y = 0.04 + 1.3x
508
509
Figure 5 510
1.2 1.4 1.6 1.8 2.0 2.2 2.4
Log total length (cm)
1.5
2.0
2.5
3.0
3.5
4.0
4.5
5.0
5.5
Log
we
t w
eig
ht (
g)
y = -2.36 + 3.21x
511
512
513
514

Figure 6 515
Age (years)
Le
ngth
(cm
)
0 2 4 6 8 10 12 14 16 18 200
20
40
60
80
100
120
140
160F, y = 16.64 + 8.08xM, y = 23.10 + 6.38x
Sex: FSex: M
516
517
Figure 7 518
519
520
521
522
523
524