aflatoxins - IARC Monographs on the Evaluation of Carcinogenic
24
225 1. Exposure Data 1.1 Identification of the agents 1.1.1 Aflatoxin B1 Chem. Abstr. Serv. Reg. No. : 1162-65-8 Chem. Abstr. Serv. Name: (6aR,9aS)-2,3,6a,9a-Tetrahydro-4- methoxycyclopenta[ c ]furo-(3′ ,2′ :4,5) furo[2,3-h ][ l]benzopyran-1,11-dione O O O O O OCH 3 H H C 17 H 12 O 6 Relative molecular mass: 312.3 1.1.2 Aflatoxin B2 Chem. Abstr. Serv. Reg. No. : 7220-81-7 Chem. Abstr. Serv. Name: (6aR,9aS)-2,3,6a,8,9,9a-Hexahydro- 4-methoxycyclopenta[ c ]-furo[3′ ,2′ :4,5] furo[2,3-h ][ l]benzopyran-1,11-dione O O O O O OCH 3 H H C 17 H 14 O 6 Relative molecular mass: 314.3 AFLATOXINS Aflatoxins were considered by previous IARC Working Groups in 1971, 1975, 1987, 1992 and 2002 (IARC, 1972, 1976, 1987 , 1993 and 2002). Since that time new data have become avail- able, which have been incorporated in this Monograph, and taken into consideration in the present evaluation.
Transcript of aflatoxins - IARC Monographs on the Evaluation of Carcinogenic
225
1. Exposure Data
1.1 Identification of the agents
1.1.1 Aflatoxin B1
Chem. Abstr. Serv. Reg. No.: 1162-65-8Chem. Abstr. Serv. Name: (6aR,9aS)-2,3,6a,9a-Tetrahydro-4-methoxycyclopenta[c]furo-(3′,2′:4,5)furo[2,3-h][l]benzopyran-1,11-dione
OO
O
O O
OCH3
H
H
C17H12O6Relative molecular mass: 312.3
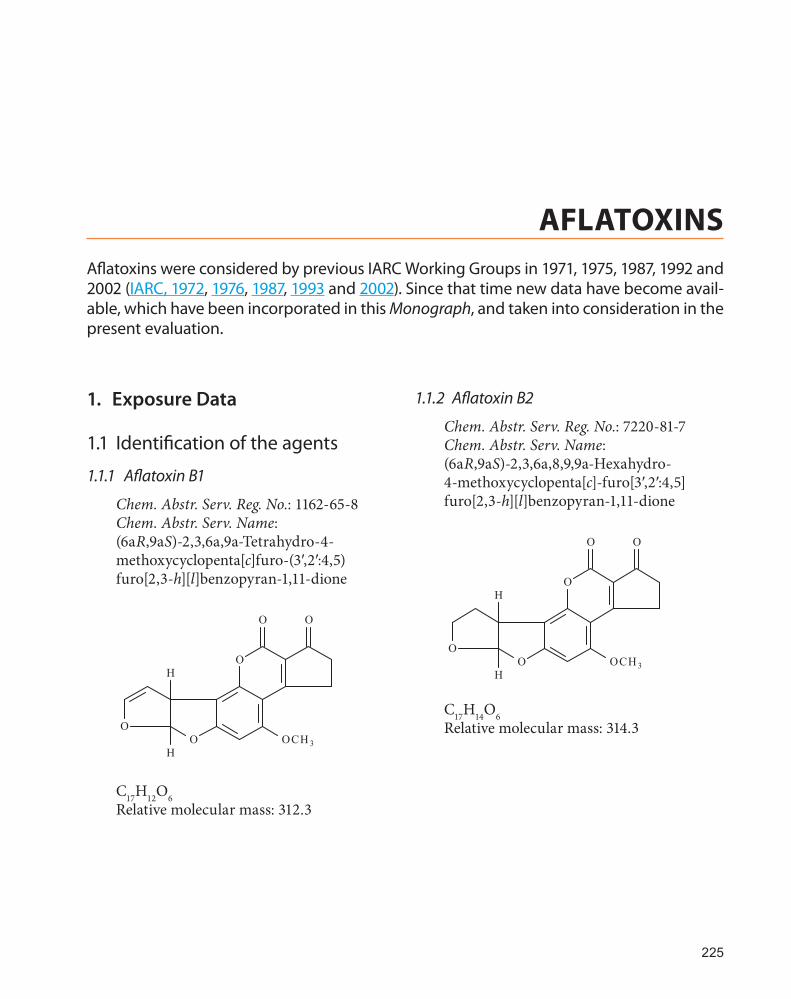
1.1.2 Aflatoxin B2
Chem. Abstr. Serv. Reg. No.: 7220-81-7Chem. Abstr. Serv. Name: (6aR,9aS)-2,3,6a,8,9,9a-Hexahydro-4-methoxycyclopenta[c]-furo[3′,2′:4,5]furo[2,3-h][l]benzopyran-1,11-dione
OO
O
O O
OCH3
H
H
C17H14O6Relative molecular mass: 314.3
AFLATOXINSAflatoxins were considered by previous IARC Working Groups in 1971, 1975, 1987, 1992 and 2002 (IARC, 1972, 1976, 1987, 1993 and 2002). Since that time new data have become avail-able, which have been incorporated in this Monograph, and taken into consideration in the present evaluation.
IARC MONOGRAPHS – 100F
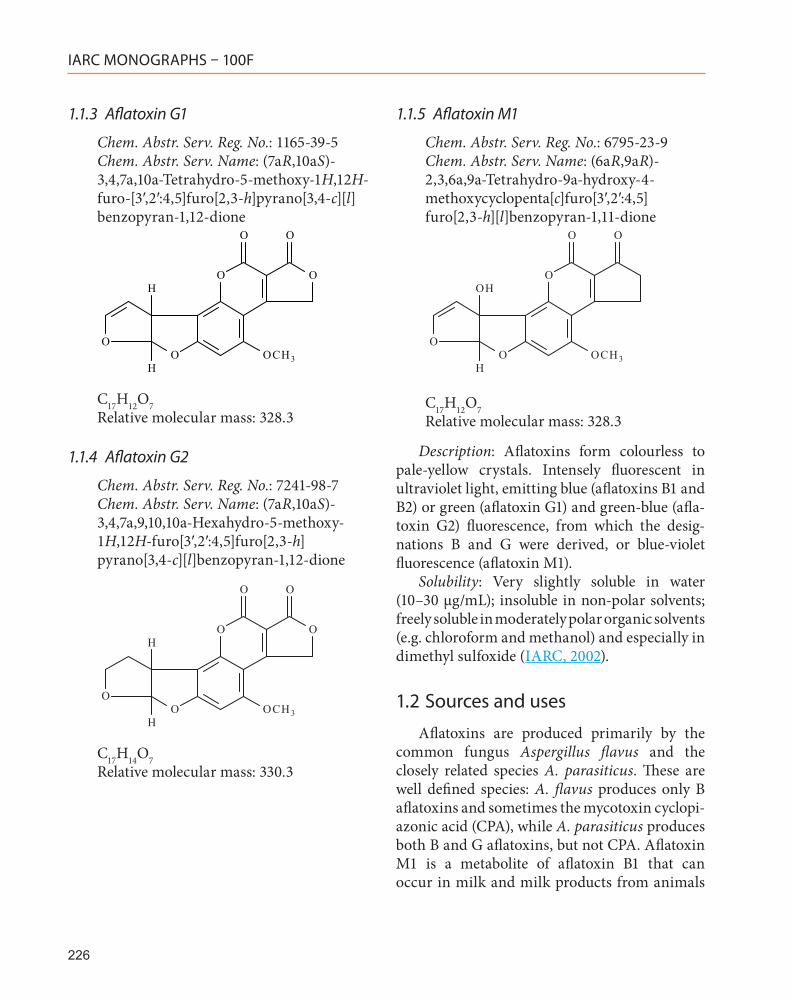
1.1.3 Aflatoxin G1
Chem. Abstr. Serv. Reg. No.: 1165-39-5Chem. Abstr. Serv. Name: (7aR,10aS)-3,4,7a,10a-Tetrahydro-5-methoxy-1H,12H-furo-[3′,2′:4,5]furo[2,3-h]pyrano[3,4-c][l]benzopyran-1,12-dione
OO
O O
O O
OCH3
H
H
C17H12O7Relative molecular mass: 328.3
1.1.4 Aflatoxin G2
Chem. Abstr. Serv. Reg. No.: 7241-98-7Chem. Abstr. Serv. Name: (7aR,10aS)-3,4,7a,9,10,10a-Hexahydro-5-methoxy-1H,12H-furo[3′,2′:4,5]furo[2,3-h]pyrano[3,4-c][l]benzopyran-1,12-dione
OO
O O
O O
OCH3
H
H
C17H14O7Relative molecular mass: 330.3
1.1.5 Aflatoxin M1
Chem. Abstr. Serv. Reg. No.: 6795-23-9Chem. Abstr. Serv. Name: (6aR,9aR)-2,3,6a,9a-Tetrahydro-9a-hydroxy-4-methoxycyclopenta[c]furo[3′,2′:4,5]furo[2,3-h][l]benzopyran-1,11-dione
OO
O
O O
OCH3
OH
H
C17H12O7Relative molecular mass: 328.3
Description: Aflatoxins form colourless to pale-yellow crystals. Intensely fluorescent in ultraviolet light, emitting blue (aflatoxins B1 and B2) or green (aflatoxin G1) and green-blue (afla-toxin G2) fluorescence, from which the desig-nations B and G were derived, or blue-violet fluorescence (aflatoxin M1).
Solubility: Very slightly soluble in water (10–30 μg/mL); insoluble in non-polar solvents; freely soluble in moderately polar organic solvents (e.g. chloroform and methanol) and especially in dimethyl sulfoxide (IARC, 2002).
1.2 Sources and uses
Aflatoxins are produced primarily by the common fungus Aspergillus flavus and the closely related species A. parasiticus. These are well defined species: A. flavus produces only B aflatoxins and sometimes the mycotoxin cyclopi-azonic acid (CPA), while A. parasiticus produces both B and G aflatoxins, but not CPA. Aflatoxin M1 is a metabolite of aflatoxin B1 that can occur in milk and milk products from animals
226
Aflatoxins
consuming feed contaminated with B aflatoxins (IARC, 2002).
Aspergillus species capable of producing afla-toxins include A. flavus, A. parasiticus, A. nomius, A. pseudotamarii, A. bombycis, A. ochraceoroseus, and A. australis (IARC, 2002). A. flavus and A. parasiticus are responsible for the largest propor-tion of aflatoxins found in foodstuffs throughout the world. Of the other species, only A. australis, which appears to be widespread in the southern hemisphere and is common in Australian peanut soils, may also be an important source of afla-toxins in some countries (IARC, 2002).
Because of the importance of aflatoxins, A. flavus has become the most widely reported foodborne fungus – even with the proviso that A. parasiticus is sometimes not differentiated from A. flavus in general mycological studies. A. flavus is especially abundant in the tropics. Levels of A. flavus in warm temperate climates such as in the USA and Australia are generally much lower, while the occurrence of A. flavus is uncommon in cool temperate climates, except in foods and feeds imported from tropical countries (IARC, 2002).
The major hosts of A. flavus among food and feed commodities are maize, peanuts, and cottonseed [Note: the terms maize and peanuts will be used throughout this Volume for corn and groundnuts, respectively]. In addition, various spices sometimes contain aflatoxins, while tree nuts are contaminated less frequently. Small amounts of aflatoxins may be found in a wide range of other foods (IARC, 2002).
It seems probable that although A. parasiti-cus occurs in the same geographical range as A. flavus, it is less widely distributed. In particular, it has been found only rarely in south-eastern Asia. The food-related hosts of A. parasiticus are similar to those of A. flavus, except that A. para-siticus is very uncommon in maize (IARC, 2002).
With maize, peanuts, and cottonseed, inva-sion of plants and developing seed or nut by Aspergillus spp. may occur before harvest,
resulting in potentially high levels of aflatoxins in these commodities and the continuing diffi-culty to eliminate aflatoxins from these products. With other crops, prevention of the formation of aflatoxins relies mainly on avoidance of contam-ination after harvest by use of rapid drying and good storage practice (IARC, 2002).
Apart from natural formation, aflatoxins are produced only in small quantities for research purposes, by fermentation of A. flavus or A. parasiticus on solid substrates or media in the laboratory. Aflatoxins are extracted by solvents and purified by chromatography (IARC, 1993).
1.3 Human exposure
1.3.1 Exposure of the general population
Dietary intake is the primary non-occupa-tional source of human exposure to aflatoxins. Intakes in the range of nanograms to micrograms per day occur mainly through consumption of maize and peanuts, which are dietary staples in some tropical countries (IARC, 2002).
Aflatoxins have been found in a variety of agri-cultural commodities, but the most pronounced contamination has been encountered in maize, peanuts, cottonseed, and tree nuts. An extensive review of the amounts of aflatoxins in commodi-ties in North America, South America, Europe, Asia and Africa was included in IARC Monograph Volume 56 (IARC, 1993). More recent data were compiled in IARC Monograph Volume 82 (IARC, 2002).
Surveys of selected foods for the presence of aflatoxins in many countries have continued to detect some level of contamination; the amounts are highly variable, ranging from < 0.1 µg/kg to hundreds of µg/kg depending on source, food type, climate, storage conditions, and other factors (IARC, 2002). The fraction of samples with detectable levels of aflatoxin B1 or total aflatoxins (B1, B2, G1 and G2) can range from a few percent (e.g. 6.9% of imported peanuts
227
IARC MONOGRAPHS – 100F
in Japan, 1999–2000; Okano et al., 2003) to as much as 30% or more (e.g. maize in some parts of Latin America and Asia (IARC, 2002). Data on the occurrence of aflatoxin M1 in milk were summarized in the previous IARC Monograph (IARC, 1993).
From the point of view of dietary intake, afla-toxins in staple foods such as maize are almost all pervading. This contamination poses a far greater problem in the tropics than in temperate zones of the world. However, because of the movement of agricultural commodities around the globe, no region of the world is free from aflatoxins (IARC, 2002).
International exposure estimates on the intake of aflatoxins were summarized in IARC Monograph Volume 82 (IARC, 2002). These esti-mates include data from the 1995 compendium, Worldwide Regulations for Mycotoxins and the 1998 and 2001 reports of the Joint FAO/WHO Expert Committee on Food Additives (JECFA, 1998, 2001). The occurrence and assessment of aflatoxins in human biological fluids and tissues (e.g. cord blood, cord serum, and breast milk) were summarized in the previous IARC Monograph (IARC, 2002).
Several recent studies have addressed the early detection, prevention and control of afla-toxins in the food and feed chain around the world (Williams et al., 2004; Kabak et al., 2006; Magan, 2006; Strosnider et al., 2006; Bryden, 2007; Kendra & Dyer, 2007; Magan & Aldred,
2007; Wagacha & Muthomi, 2008). These publi-cations described pre- and post- harvest strate-gies (such as field management, use of biological and chemical agents, improved drying and storage conditions, irradiation, moisture control, biocompetitiveness and biotechnology (e.g. transgenic expression of maize-specific genes)) and early detection methods (such as molecular imprinted polymers, lateral-flow devices, and molecular-based technology).
1.3.2 Occupational exposure
Occupational exposure to aflatoxins can occur during processing and handling of contam-inated grains, particularly animal feed. Airborne concentrations at the workplace are typically in the ng/m3-range, but higher concentrations (up to µg/m3) have been reported.
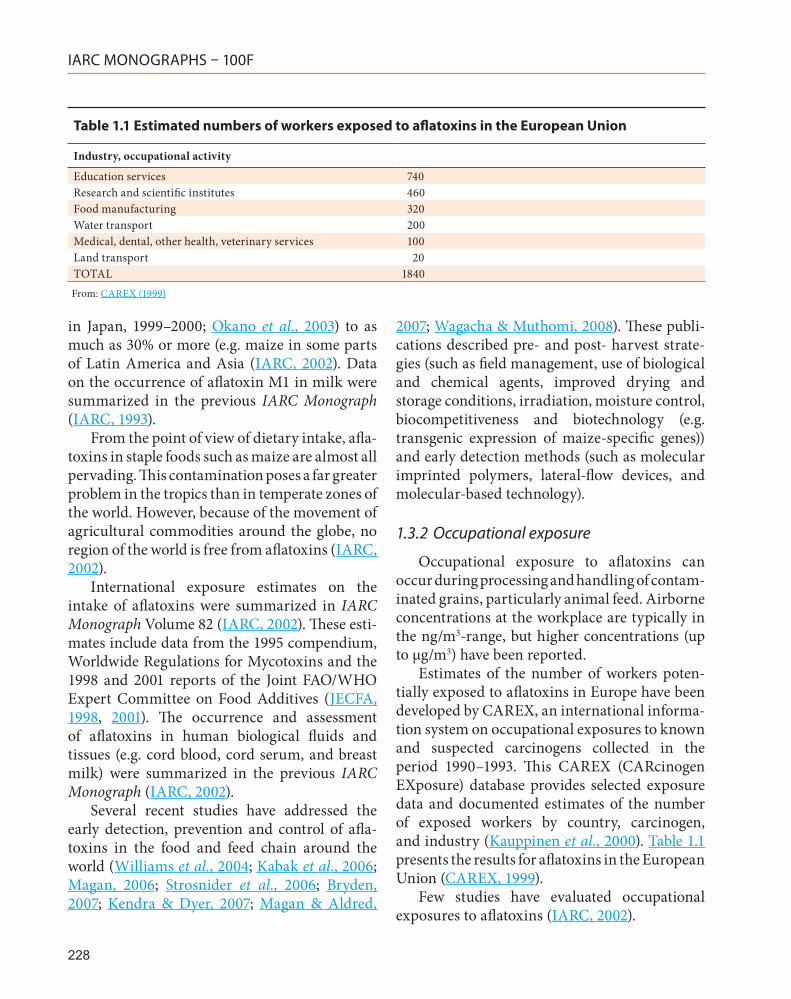
Estimates of the number of workers poten-tially exposed to aflatoxins in Europe have been developed by CAREX, an international informa-tion system on occupational exposures to known and suspected carcinogens collected in the period 1990–1993. This CAREX (CARcinogen EXposure) database provides selected exposure data and documented estimates of the number of exposed workers by country, carcinogen, and industry (Kauppinen et al., 2000). Table 1.1 presents the results for aflatoxins in the European Union (CAREX, 1999).
Few studies have evaluated occupational exposures to aflatoxins (IARC, 2002).
228
Table 1.1 Estimated numbers of workers exposed to aflatoxins in the European Union
Industry, occupational activity
Education services 740Research and scientific institutes 460Food manufacturing 320Water transport 200Medical, dental, other health, veterinary services 100Land transport 20TOTAL 1840From: CAREX (1999)
Aflatoxins
Selim et al. (1998) collected dust samples from 28 farms in the United States during harvest and unloading, animal feeding, and bin cleaning. Aflatoxin concentrations ranged from 0.00004 to 4.8 μg/m3. The lowest concentrations were detected during harvest and unloading, the highest during bin cleaning.
Brera et al. (2002) collected and analysed a total of 44 full-shift samples (26 personal samples, 18 ambient-air samples) to determine airborne concentrations of aflatoxins B1, B2, G1, and G2 in dust collected at three food-processing plants (cocoa, coffee, and spices) in Tuscany, Italy. Concentrations ranged from below the detection limit (< 0.002 ng/m3), to 0.130 ng/m3.
2. Cancer in Humans
2.1 Hepatocellular carcinoma
2.1.1 Previous evaluation
Aflatoxins were last evaluated in IARC Monograph Volume 82 (2002) and confirmed as a Group-1 agent. The weight of evidence for the classification of the aflatoxins as Group-1 carcin-ogens was driven by statistically significantly increased risks for hepatocellular carcinoma (HCC) in individuals exposed to aflatoxins, as measured by aflatoxin-specific biomarkers in cohort studies in Shanghai and Taiwan, China (Ross et al., 1992; Qian et al., 1994; Wang et al., 1996). This effect was independent of exposure to hepatitis B virus (HBV); however, when HBV status was included in the analysis, a greater than multiplicative interaction between aflatoxin exposure and HBV infection was found.
2.1.2 Cohort studies
See Table 2.1 available at http://monog r aphs . ia rc . f r/ ENG/Monog r aphs/vol100F/100F-18-Table2.1.pdf
There has been no recent update of the cohort studied by Ross et al. (1992) and Qian et al. (1994). However, the cohort of Wang et al. (1996) has been extensively updated in three subsequent reports (Wu et al. 2007a, b, 2009). In these studies, the risk for HCC was significantly elevated for subjects with high concentrations of aflatoxin metabolites in the urine. Subjects who were seropositive for the hepatitis-B surface antigen (HBsAg) and had high aflatoxin expo-sure were at higher risk than those with high aflatoxin exposure only, or HBsAg-seropositivity only. There seemed to be no correlation with poly-cyclic aromatic hydrocarbon(PAH)-albumin-adduct formation (Wu et al. 2007a). The risk was elevated in those with urinary concentrations of the biomarker 8-oxodeoxyguanosine (8-oxodG) above the median, who were also HBsAg-positive (Wu et al., 2007b). In one small cohort the risk for HCC from aflatoxin exposure was also elevated (Ming et al. 2002).
2.1.3 Case-series and case–control studies
(a) Aflatoxin-specific TP53 mutations
In recent years, epidemiological and experi-mental studies have linked exposures to afla-toxin with the formation of a specific mutation in codon 249 in the TP53 tumour-suppressor gene, which has provided an important biolog-ical target for risk assessment. The identification of a strong mechanistic link between exposure to aflatoxin and mutation in TP53 has triggered analyses of this codon-249 mutation in tumour tissues and blood samples in populations at high risk for HCC. In case-series of HCC patients in China, the prevalence of this mutation ranged from 36–54% (Jackson et al., 2001, 2003; Stern et al., 2001; Ming et al., 2002). In the one case–control study in China, Huang et al. (2003) found an adjusted odds ratio of 22.1 (95%CI: 3.2–91.7) for the presence of a codon-249 TP53 mutation among HCC cases compared with controls. In contrast, case-series in Africa found a much
229
IARC MONOGRAPHS – 100F
lower prevalence of this type of mutation in some populations, ranging from 1% in one study in Egypt to 35% in The Gambia, West Africa.
(b) Metabolic polymorphisms and HCC risk from aflatoxin
See Table 2.2 available at http://monog r aphs . ia rc . f r/ ENG/Monog r aphs/vol100F/100F-18-Table2.2.pdf.
The availability of aflatoxin-specific biomar-kers has enhanced the possibility to monitor individual exposure to this agent. In three case–control studies (two nested within cohorts) an analysis of a variety of genetic polymorphisms as probable modifiers of risk from aflatoxin, has been undertaken in regions of high HCC inci-dence (Sun et al., 2001; McGlynn et al., 2003; Kirk et al., 2005). These polymorphisms are predi-cated on the hypothesis that enhanced detoxica-tion or activation pathways of aflatoxin exposure will be a surrogate biomarker of exposure. All studies were limited because of small numbers of subjects in high-risk strata, but two studies were consistent in finding an increased risk for HCC among those with the GSTM1-null genotype, and in one of these studies the risk was elevated among those with the highest consumption of peanuts (an index of consumption of aflatoxin-contaminated food).
(c) Aflatoxin biomarkers of exposure
See Table 2.3 available at http://monog r aphs . ia rc . f r/ ENG/Monog r aphs/vol100F/100F-18-Table2.3.pdf.
Biomarkers of exposure to aflatoxin have been evaluated for association with risk for HCC in two case–control studies. The risk was significantly higher in those who were HBAsG-positive (Omer et al., 2001, 2004; Liu et al., 2008), in those who carried the GSTM1-null genotype (Omer et al., 2001), and in those with oxidative stress (Liu et al., 2008). In one study, it was deter-mined that the attributable risk for the effects of
exposure to aflatoxin and HBsAg-positivity was of the order of 80% (Omer et al., 2004).
2.2 Synthesis
Geographically distinct cohort studies in Shanghai and Taiwan, China have independ-ently found statistically significant effects of exposure to aflatoxin on the development of HCC. These results, buttressed by the informa-tion from several case-series and case–control studies also confirm that in the presence of HBV exposure, as judged by HBsAg status, there is a greater than multiplicative interaction between aflatoxin and HBV, increasing the risk for HCC. Further evidence of the role of aflatoxins in the development of HCC was gained from studies that demonstrated the ability of aflatoxins to induce a specific mutation in codon 249 of the TP53 tumour-suppressor gene.
3. Cancer in Experimental Animals
3.1 Previous evaluations
Carcinogenicity studies in experimental animals, with administration of aflatoxin mixtures and aflatoxin B1, B2, M1, G1, or G2 to rats, mice, hamsters, salmon, trout, ducks, tree shrews, woodchucks and monkeys by several routes of exposure have been previously reviewed (IARC, 1993, 2002).
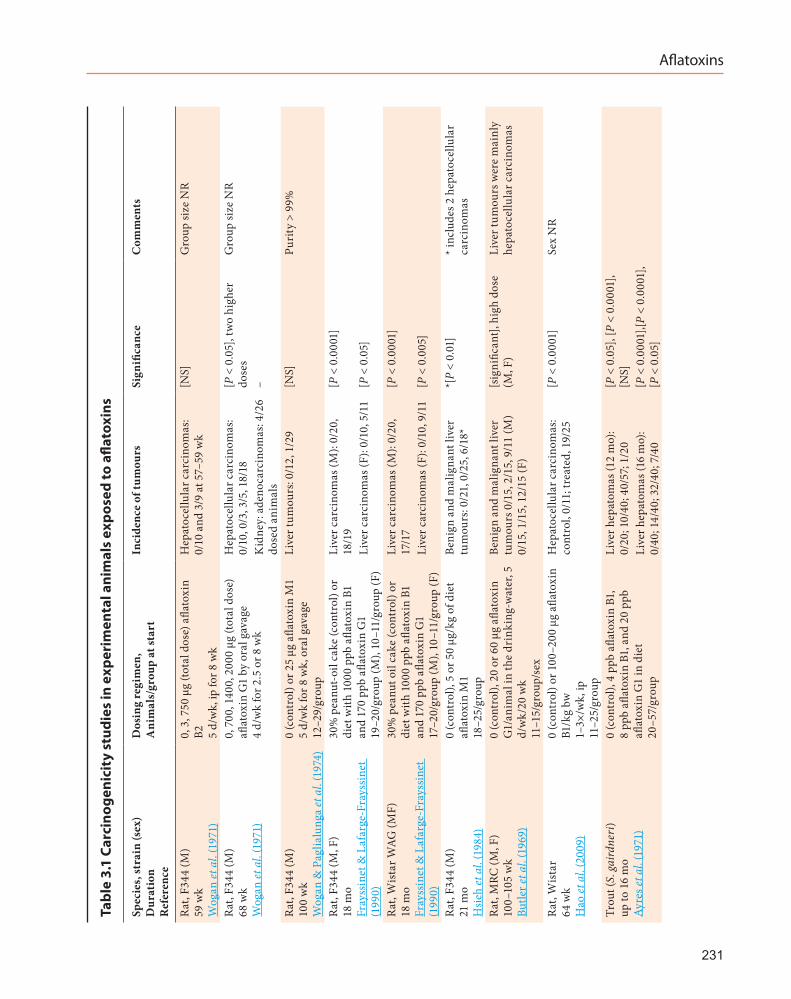
See Table 3.1.The two previous IARC evaluations
concluded that there was sufficient evidence for the carcinogenicity in experimental animals of naturally occurring mixtures of aflatoxins and of the individual aflatoxins B1, G1, and M1; there was limited evidence for aflatoxin B2, and inadequate evidence for aflatoxin G2. This Monograph reviews relevant carcinogenicity studies published since 2002.
230
Aflatoxins
231
Tabl
e 3.
1 Ca
rcin
ogen
icit
y st
udie
s in
exp
erim
enta
l ani
mal
s ex
pose
d to
afla
toxi
ns
Spec
ies,
stra
in (s
ex)
Dur
atio
n R
efer
ence
Dos
ing
regi
men
, A
nim
als/
grou
p at
star
tIn
cide
nce
of tu
mou
rsSi
gnifi
canc
eC
omm
ents
Rat,
F344
(M)
59 w
k W
ogan
et a
l. (1
971)
0, 3
, 750
µg
(tota
l dos
e) a
flato
xin
B2
5 d/
wk,
ip fo
r 8 w
k
Hep
atoc
ellu
lar c
arci
nom
as:
0/10
and
3/9
at 5
7–59
wk
[NS]
Gro
up si
ze N
R
Rat,
F344
(M)
68 w
k W
ogan
et a
l. (1
971)
0, 7
00, 1
400,
200
0 µg
(tot
al d
ose)
afl
atox
in G
1 by
ora
l gav
age
4
d/w
k fo
r 2.5
or 8
wk
Hep
atoc
ellu
lar c
arci
nom
as:
0/10
, 0/3
, 3/5
, 18/
18[P
< 0
.05]
, tw
o hi
gher
do
ses
Gro
up si
ze N
R
Kid
ney:
ade
noca
rcin
omas
: 4/2
6 do
sed
anim
als
–
Rat,
F344
(M)
100
wk
Wog
an &
Pag
lialu
nga
et a
l. (1
974)
0 (c
ontr
ol) o
r 25
µg a
flato
xin
M1
5
d/w
k fo
r 8 w
k, o
ral g
avag
e
12–2
9/gr
oup
Live
r tum
ours
: 0/1
2, 1
/29
[NS]
Puri
ty >
99%
Rat,
F344
(M, F
) 18
mo
Fray
ssin
et &
Laf
arge
-Fra
yssi
net
(199
0)
30%
pea
nut-
oil c
ake
(con
trol
) or
diet
with
100
0 pp
b afl
atox
in B
1 an
d 17
0 pp
b afl
atox
in G
1
19–2
0/gr
oup
(M),
10–1
1/gr
oup
(F)
Live
r car
cino
mas
(M):
0/20
, 18
/19
[P <
0.0
001]
Live
r car
cino
mas
(F):
0/10
, 5/1
1[P
< 0
.05]
Rat,
Wis
tar W
AG
(MF)
18
mo
Fray
ssin
et &
Laf
arge
-Fra
yssi
net
(199
0)
30%
pea
nut o
il ca
ke (c
ontr
ol) o
r di
et w
ith 1
000
ppb
aflat
oxin
B1
and
170
ppb
aflat
oxin
G1
17–2
0/gr
oup
(M),
10–1
1/gr
oup
(F)
Live
r car
cino
mas
(M):
0/20
, 17
/17
[P <
0.0
001]
Live
r car
cino
mas
(F):
0/10
, 9/1
1[P
< 0
.005
]
Rat,
F344
(M)
21 m
o H
sieh
et a
l. (1
984)
0 (c
ontr
ol),
5 or
50
µg/k
g of
die
t afl
atox
in M
1
18–2
5/gr
oup
Beni
gn a
nd m
alig
nant
live
r tu
mou
rs: 0
/21,
0/2
5, 6
/18*
*[P
< 0.
01]
* inc
lude
s 2 h
epat
ocel
lula
r ca
rcin
omas
Rat,
MRC
(M, F
) 10
0–10
5 w
k Bu
tler e
t al.
(196
9)
0 (c
ontr
ol),
20 o
r 60
μg a
flato
xin
G1/
anim
al in
the
drin
king
-wat
er, 5
d/
wk/
20 w
k 11
–15/
grou
p/se
x
Beni
gn a
nd m
alig
nant
live
r tu
mou
rs 0
/15,
2/1
5, 9
/11
(M)
0/15
, 1/1
5, 1
2/15
(F)
[sig
nific
ant],
hig
h do
se
(M, F
)Li
ver t
umou
rs w
ere
mai
nly
hepa
toce
llula
r car
cino
mas
Rat,
Wis
tar
64 w
k H
ao et
al.
(200
9)
0 (c
ontr
ol) o
r 100
–200
µg
aflat
oxin
B1
/kg
bw
1–3×
/wk,
ip
11–2
5/gr
oup
Hep
atoc
ellu
lar c
arci
nom
as:
cont
rol,
0/11
; tre
ated
, 19/
25[P
< 0
.000
1]Se
x N
R
Trou
t (S.
gai
rdne
ri)
up to
16
mo
Ayre
s et a
l. (1
971)
0 (c
ontr
ol),
4 pp
b afl
atox
in B
1,
8 pp
b afl
atox
in B
1, a
nd 2
0 pp
b afl
atox
in G
1 in
die
t 20
–57/
grou
p
Live
r hep
atom
as (1
2 m
o):
0/20
; 10/
40; 4
0/57
; 1/2
0[P
< 0
.05]
, [P
< 0.
0001
], [N
S]Li
ver h
epat
omas
(16
mo)
: 0/
40; 1
4/40
; 32/
40; 7
/40
[P <
0.0
001]
,[P <
0.0
001]
, [P
< 0
.05]
IARC MONOGRAPHS – 100F
232
Spec
ies,
stra
in (s
ex)
Dur
atio
n R
efer
ence
Dos
ing
regi
men
, A
nim
als/
grou
p at
star
tIn
cide
nce
of tu
mou
rsSi
gnifi
canc
eC
omm
ents
Trou
t (fr
y)
up to
12
mo
Baile
y et
al.
(199
4a)
Posit
ive
cont
rols
rece
ived
4 µ
g/kg
afla
toxi
n B1
in d
iet f
or 1
2 m
o.
Posit
ive
cont
rols
rece
ived
20
µg/k
g afl
atox
in B
1 in
die
t for
2 w
k.
Posit
ive
cont
rols
rece
ived
afla
toxi
n M
1 (8
0 or
800
µg/
kg) f
or 2
wk.
Po
sitiv
e co
ntro
ls re
ceiv
ed 6
4 µg
/kg
aflat
oxin
B1
for 2
wk
Con
trol
and
trea
ted
grou
ps
rece
ived
a m
axim
um o
f 8 µ
g/kg
afl
atox
in M
1 fo
r 2 w
k (n
= 1
10,
tota
l)
Live
r: 34
% (3
9/11
6) tu
mou
rs a
t 12
mo
[sig
nific
ant]
Stud
y w
as d
esig
ned
to lo
ok
at tr
eatm
ent o
f foo
d so
urce
to
redu
ce e
ffect
of a
flato
xin
cont
amin
atio
n of
feed
. Li
ver-
tum
our d
ata
show
n he
re a
re o
nly
for t
he ‘p
ositi
ve
cont
rols’
giv
en a
flato
xins
in
the
diet
. Liv
er tu
mou
rs
wer
e pr
edom
inan
tly
hepa
toce
llula
r car
cino
mas
an
d m
ixed
car
cino
mas
(>
70%
).
Live
r: 37
% (6
8/18
6) tu
mou
rs
at 9
mo
[sig
nific
ant]
Live
r: 5.
7% (1
1/19
3) a
nd 5
0%
tum
ours
, res
pect
ivel
y at
9 m
o[s
igni
fican
t]
Live
r: 29
% (8
0/27
8) tu
mou
rs a
t 12
mo
[sig
nific
ant]
Live
r: no
tum
ours
(0/1
10) a
t 12
mo
in b
oth
grou
ps–
Trou
t (O
. myk
iss,
Shas
ta st
rain
) (fr
y)
9 m
o Ba
iley
et a
l. (1
994b
)
0, 4
, 8, 1
6, 3
2, 6
4 ng
afla
toxi
n B1
or
aflat
oxic
ol in
die
t for
two
wk
200
cont
rols/
grou
p; 4
00 tr
eate
d/gr
oup
Live
r tum
ours
: 0/1
92, 2
5/38
2,
98/3
87, 1
94/3
89, 2
87/3
89,
302/
383
for a
flato
xin
B1.
Afla
toxi
col a
lso c
ause
d liv
er
tum
ours
.
[sig
nific
ant]
Live
r tum
ours
wer
e pr
edom
inan
tly
hepa
toce
llula
r car
cino
mas
an
d m
ixed
car
cino
mas
(>
80%
).Tr
out (
O. m
ykis
s, Sh
asta
stra
in)
(fry)
13
mo
Baile
y et
al.
(199
4b)
0, 0
.01,
0.0
25, 0
.05,
0.1
, 0.2
5, 0
.5
µg/m
l afla
toxi
n B1
or a
flato
xico
l so
lutio
n ex
posu
re o
f em
bryo
for
1 h
and
diet
exp
osur
e at
swim
up
for 1
3 m
o 40
0 tr
eate
d/gr
oup
Live
r tum
ours
: 1/3
49, 1
5/34
6,
59/3
48, 1
31/3
43, 1
91/3
43,
254/
347,
252/
313
for a
flato
xin
B1
Afla
toxi
col a
lso c
ause
d liv
er
tum
ours
[sig
nific
ant]
Die
t exp
osur
e un
clea
r. Li
ver t
umou
rs w
ere
pred
omin
antly
he
pato
cellu
lar c
arci
nom
as
and
mix
ed c
arci
nom
as
(> 7
0%).
Trou
t (fr
y)
up to
12
mo
Baile
y et
al.
(199
8)
4–64
µg/
kg o
f afla
toxi
n B1
, afl
atox
icol
, afla
toxi
n M
1,
aflat
oxic
ol M
1 in
die
t for
2 w
k
120
trea
ted/
grou
p
Live
r tum
our r
espo
nse:
afl
atox
in B
1 (1
.000
); afl
atox
icol
(0
.936
); afl
atox
in M
1 (0
.086
); afl
atox
icol
M1
(0.0
41)
Tum
our r
espo
nse
is
rela
tive
to a
flato
xin
B1,
1.00
0. L
iver
tum
ours
wer
e pr
edom
inan
tly m
alig
nant
(>
80%
).Tr
out (
fry)
13
mo
Tilto
n et
al.
(200
5)
0 (c
ontr
ol) o
r 0.5
µg/
mL
aflat
oxin
B1
in 0
.01%
eth
anol
for 3
0 m
in
(exp
osur
e in
tank
), ≈4
00/g
roup
Live
r tum
ours
: con
trol
0/
~400
; tre
ated
, 20/
~400
(30%
he
pato
cellu
lar c
arci
nom
as,
70%
mix
ed c
arci
nom
as)
[sig
nific
ant]
Lim
ited
repo
rtin
g of
stud
y
Tabl
e 3.
1 (c
onti
nued
)
Aflatoxins
233
Spec
ies,
stra
in (s
ex)
Dur
atio
n R
efer
ence
Dos
ing
regi
men
, A
nim
als/
grou
p at
star
tIn
cide
nce
of tu
mou
rsSi
gnifi
canc
eC
omm
ents
Tran
sgen
ic m
ouse
TG
F-β1
and
wild
type
(C57
Bl/6
J x
CBA
) 12
mo
Sc
hnur
et a
l. (1
999)
Afla
toxi
n B1
(6 µ
g/kg
bw
) giv
en a
s a
sing
le ip
inje
ctio
n to
wild
type
an
d tr
ansg
enic
mic
e 11
wild
type
, 12
tran
sgen
ic
(exp
osed
) 9
wild
type
, 19
tran
sgen
ic
(con
trol
s)
Live
r neo
plas
ms:
0/9
wild
type
an
d 0/
19 tr
ansg
enic
con
trol
s; 3/
11 w
ild ty
pe a
nd 3
/12*
ex
pose
d tr
ansg
enic
ani
mal
s
*[P
< 0.
05]
Lim
ited
repo
rtin
g of
stud
y. Tr
ansg
enic
mic
e ov
erex
pres
s TG
F-β1
. Liv
er tu
mou
rs
wer
e m
ainl
y ad
enom
as. S
ex
unsp
ecifi
ed.
Tran
sgen
ic m
ouse
(+/–
) FV
B/N
(wild
type
), p5
3 (+
/–),
HBV
Tg, a
nd H
BVTg
-p53
(+/–
) (M
, F)
12–1
3 m
o C
ulle
n et
al.
(200
9)
FVB/
N; F
VB/
N +
1 m
g/kg
bw
afl
atox
in B
1, si
ngle
inje
ctio
n, ip
; H
BVTg
, HBV
Tg +
afla
toxi
n B1
; p5
3 (+
/–);
p53
(+/–
) + a
flato
xin
B1;
HBV
Tg-p
53 (+
/–);
HBV
Tg-p
53
(+/–
) + a
flato
xin
B1
15–3
0/gr
oup
Live
r neo
plas
ms (
M):
0/19
, 2/
21, 0
/32,
3/2
0, 1
/30,
1/1
5,
0/29
, 5/2
4*
Live
r neo
plas
ms (
F): 0
/21,
0/2
0,
0/23
, 0/1
9, 0
/19,
0/1
7, 0/
22, 2
/29
*P <
0.0
1Li
ver n
eopl
asm
onl
y in
gr
oups
exp
osed
to a
flato
xin
B1. A
flato
xin
B1 in
crea
sed
the
inci
denc
e in
HBV
Tg a
nd
p53
(+/–
) mic
e.
Tran
sgen
ic m
ouse
w
ith C
3H/H
eN b
ackg
roun
d 11
mo
Taka
hash
i et a
l. (2
002)
XPA
+/–,
+/–
, −/−
with
0.6
or 1
.5
mg/
kg b
w a
flato
xin
B1 a
s sin
gle
inje
ctio
n, ip
11
–30/
grou
p
Live
r car
cino
mas
0.
6 m
g/kg
: 0%
, 13%
, 50%
* 1.
5 m
g/kg
: 6%
, 6%
, 38%
*
*P <
0.0
5A
lso
sign
ifica
nt fo
r ben
ign
liver
tum
ours
and
tum
our
mul
tiplic
ity a
t 0.6
mg/
kg.
Als
o si
gnifi
cant
for l
iver
tu
mou
r mul
tiplic
ity a
t 1.5
m
g/kg
.Tr
ansg
enic
mou
se
Hup
ki (h
uman
TP5
3 kn
ock-
in)
18 m
o To
ng et
al.
(200
6)
Wild
type
(129
/Sv
back
grou
nd);
Hup
ki; W
ild ty
pe +
6 µ
g afl
atox
in
B1, a
s sin
gle
ip in
ject
ion;
Hup
ki
+ 6
μg a
flato
xin
B1, a
s sin
gle
ip
inje
ctio
n
21–4
6/gr
oup
Hep
atoc
ellu
lar a
deno
mas
: 0/
30, 0
/46,
9/2
1, 6
/34
P =
0.04
1 in
Hup
ki w
ith
aflat
oxin
B1
com
pare
d w
ith w
ild ty
pe w
ith
aflat
oxin
B1
Sex
NR
Hep
atoc
ellu
lar c
arci
nom
as:
0/30
, 0/4
6, 4
/21,
15/
34P
= 0.
057
in H
upki
with
afl
atox
in B
1 co
mpa
red
with
wild
type
with
afl
atox
in B
1M
ouse
N
IH
58–7
4 w
k H
uang
et a
l. (2
004)
Afla
toxi
n G
1: 0
(con
trol
), 3
µg/k
g bw
or 3
0 µg
/kg
bw b
y ga
vage
3x
/wk
for 2
4 w
k 10
–14/
grou
p
Lung
ade
noca
rcin
omas
: 0%
(0
/11)
, 30%
(3/1
0), a
nd 4
3%
(6/1
4)
Hig
h do
se, P
= 0
.02
Sex
NR
Tree
shre
w
160
wk
Su
, et a
l. (2
004)
Die
tary
(milk
) dos
e of
0 (c
ontr
ol)
or 2
00–4
00 µ
g afl
atox
in B
1/kg
bw
/d
20–2
9/gr
oup
Hep
atoc
ellu
lar c
arci
nom
as:
cont
rol,
0/20
; afla
toxi
n B1
-tr
eate
d, 6
/29
[P <
0.0
5]Se
x N
R
Tabl
e 3.
1 (c
onti
nued
)
IARC MONOGRAPHS – 100F
234
Spec
ies,
stra
in (s
ex)
Dur
atio
n R
efer
ence
Dos
ing
regi
men
, A
nim
als/
grou
p at
star
tIn
cide
nce
of tu
mou
rsSi
gnifi
canc
eC
omm
ents
Tree
shre
w (M
, F)
160
wk
Li et
al.
(199
9)
Con
trol
, HBV
+, a
flato
xin
B1-
trea
ted,
HBV
+/afl
atox
in B
1-tr
eate
d A
flato
xin
B1 (1
50 µ
g/kg
bw
/d) i
n fe
ed fo
r 105
wk
4–11
/sex
/gro
up
Hep
atoc
ellu
lar c
arci
nom
as
in 6
7% (1
4/21
) of m
ales
and
fe
mal
es (c
ombi
ned)
that
w
ere
inje
cted
with
HBV
and
fe
d afl
atox
in B
1. A
flato
xin
alon
e re
sulte
d in
30%
(3/1
0)
hepa
toce
llula
r car
cino
mas
(m
ale
and
fem
ale
com
bine
d).
No
tum
ours
in th
e tw
o ot
her
grou
ps
P <
0.01
(H
BV a
nd a
flato
xin
B1
grou
p co
mpa
red
with
afl
atox
in B
1 gr
oup)
.
Age
NR
Tree
shre
w
150
wk
Dua
n et
al.
(200
5)
Die
tary
(milk
) dos
e of
0 (c
ontr
ol)
or 1
50 µ
g/kg
bw
/d, 5
x/w
k fo
r 105
w
k 13
–48/
grou
p
Hep
atoc
ellu
lar c
arci
nom
as:
cont
rol,
0/13
; afla
toxi
n B1
, 35
/48
[P <
0.0
001]
Age
and
sex
NR
Tree
shre
w (M
, F)
90 w
k Li
et a
l. (2
008)
Die
tary
(milk
) dos
e of
0 (c
ontr
ol)
or 4
00 µ
g/kg
bw
/d
12–1
5/gr
oup
Hep
atoc
ellu
lar c
arci
nom
as:
cont
rol,
0/12
; afla
toxi
n B1
, 11
/15
[P <
0.0
001]
Age
NR
Woo
dchu
ck (M
, F)
25 w
k Ba
nnas
ch et
al.
(199
5)
Con
trol
, WH
V+, a
flato
xin
B1
(20–
40 µ
g/kg
bw
in d
iet)
and
WH
V+/a
flato
xin
B1 tr
eate
d 6/
grou
p
Live
r tum
ours
: 0/9
, 5/9
, 0/5
, 2/5
Ani
mal
s wer
e 10
mo
of a
ge
bw, b
ody
wei
ght;
d, d
ay o
r day
s; H
CC
, hep
atoc
ellu
lar c
arci
nom
a; ip
, int
rape
rito
neal
; min
, min
ute
or m
inut
es; m
o, m
onth
or m
onth
s; N
R, n
ot re
port
ed; N
S, n
ot si
gnifi
cant
; WH
V,
woo
dchu
ck h
epat
itis v
irus
; wk,
wee
k or
wee
ks; X
PA, X
erod
erm
a pi
gmen
tosu
m (a
pro
tein
, inv
olve
d in
nuc
leot
ide
exci
sion-
repa
ir)
Tabl
e 3.
1 (c
onti
nued
)
Aflatoxins
3.2 Aflatoxin B1
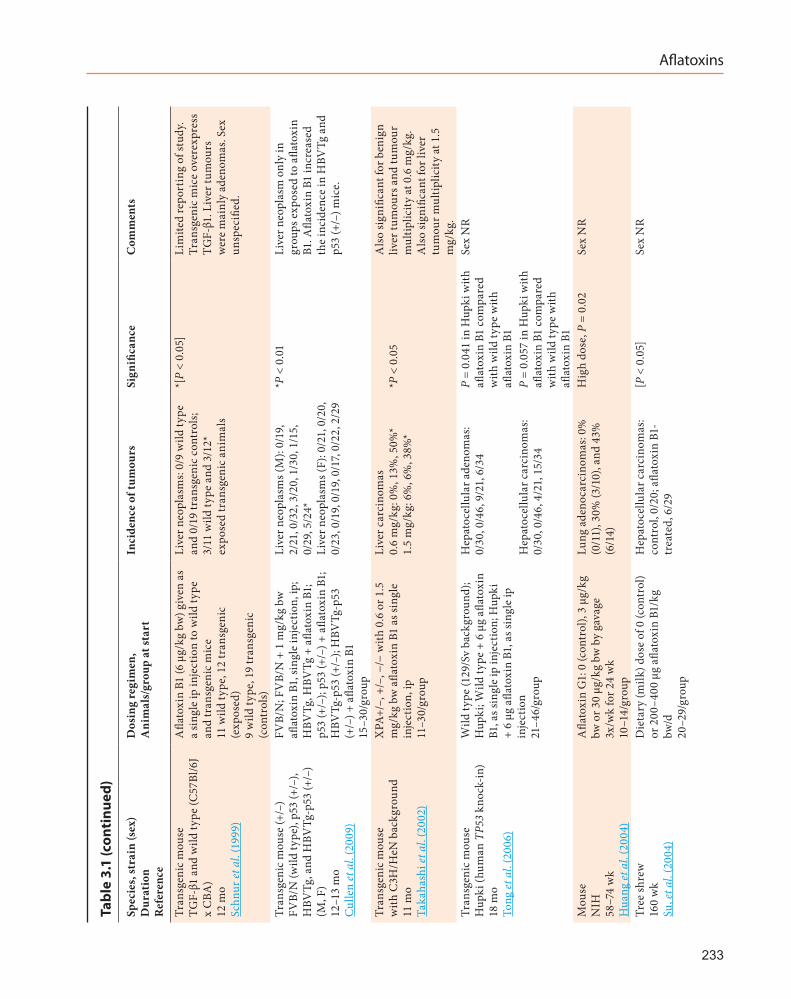
3.2.1 Transgenic mouse
An 11-month study was conducted with transgenic mice deficient in the XPA (Xeroderma pigmentosum A) protein. This protein recognizes various types of DNA damage, binds to the damaged DNA region and functions in the first step of the nucleotide excision-repair process. Treatment of these XPA–/– mice with a single dose of aflatoxin B1 given by intraperitoneal injection resulted in an increased incidence of liver carcinomas compared with the incidence in wild-type mice (Takahashi et al., 2002). An 18-month study in Hupki (human TP53 knock-in) transgenic mice that received a single dose of aflatoxin B1 by intraperitoneal injection, showed increased incidences of hepatocellular adenomas (P = 0.041) and carcinomas (P = 0.057) (Tong et al., 2006). A 12–13 month study in FVB/N and p53+/– mice (with or without transgenic hepatitis-B virus expression) exposed to a single dose of aflatoxin B1 by intraperitoneal injection, showed liver tumours (hepatocellular adenomas and carcinomas combined) in p53+/– HBV-transgenic male mice (Cullen et al., 2009).
These three studies in mice confirm earlier findings of Schnur et al. (1999) of an increased incidence of liver tumours (mainly adenomas) in TGF-β1-transgenic mice given aflatoxin B1.
3.2.2 Rat
An intraperitoneal study in Wistar rats confirmed that aflatoxin B1 is a liver carcinogen in this species (Hao et al., 2009).
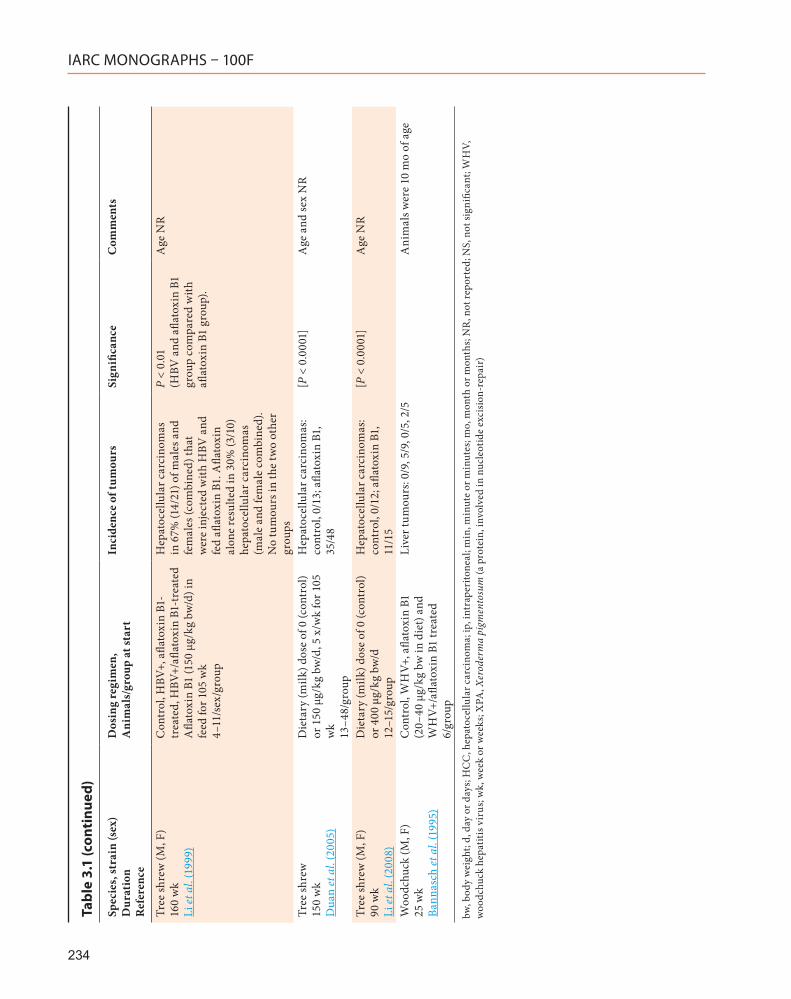
3.2.3 Tree shrew
A carcinogenicity study to detect alterations in the p53 and p21 genes in hepatocellular carci-nomas in tree shrews infected with HBV showed an increased incidence of hepatocellular carci-nomas in animals that had received aflatoxin
by the oral route (Su et al., 2004). This finding was confirmed by Duan et al. (2005) and Li et al. (2008) in similar studies.
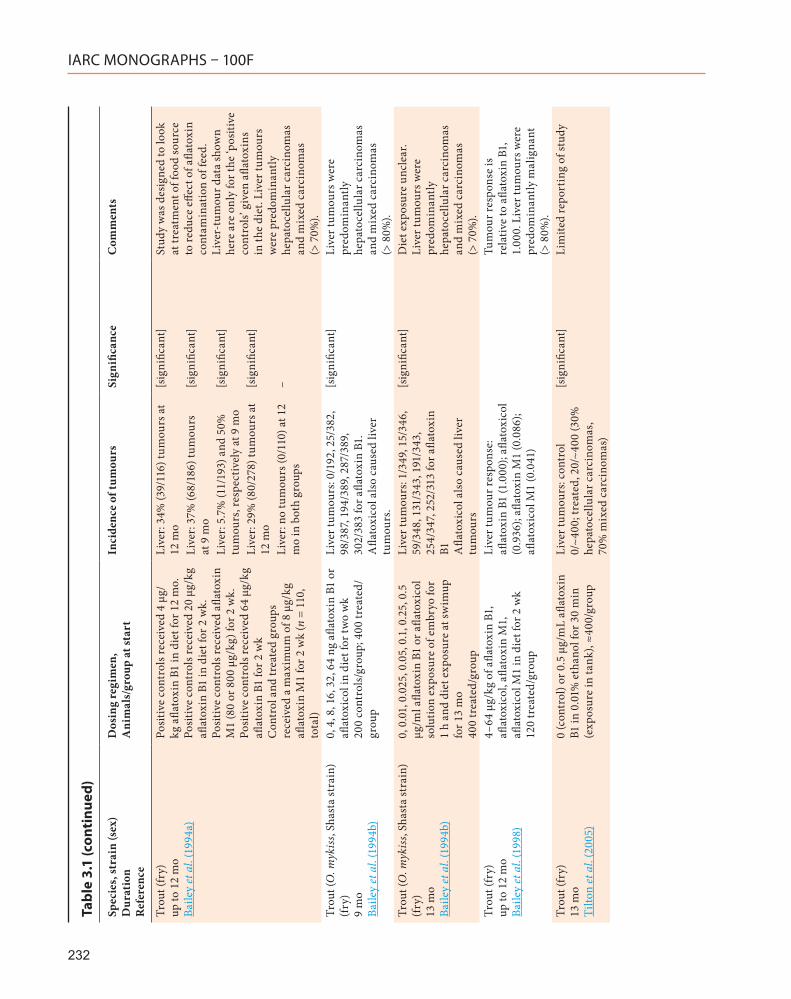
3.2.4 Trout
A study by Tilton et al. (2005) confirmed that aflatoxin B1 is a liver carcinogen in trout. In this study, trout embryos were exposed for 30 minutes to water containing 50 ppb aflatoxin F1, and kept for a further 13 months.
3.3 Aflatoxin G1
3.3.1 Mouse
A 58–74-week study in NIH mice given afla-toxin G1 by gavage resulted in an increased inci-dence in lung adenocarcinomas (Huang et al., 2004).
3.4 Synthesis
Table 3.1 lists the more recent studies described above and also summarizes several of the previously evaluated studies.
Results of additional carcinogenicity studies in animals reported since the previous IARC evaluations are consistent with the conclusions of previous Working Groups. Studies performed with trouts (whole-body exposure), in transgenic mouse models (by intraperitoneal injection), in mice (by gavage), and in tree shrews (via the diet) strengthen the original conclusions of sufficient evidence for carcinogenicity in experimental animals of aflatoxin B1 and G1. Aflatoxin B1 increases the incidence of liver cancer in rats, tree shrews, trouts, and transgenic mice. Aflatoxin G1 increases the incidence of liver cancer in rats.
235
IARC MONOGRAPHS – 100F
4. Other Relevant Data
Experimental studies on aflatoxins have been reviewed in previous IARC Monographs (IARC, 1993, 2002). There is an extensive body of infor-mation related to the mechanism of aflatoxin-induced carcinogenicity, encompassing data on toxicokinetics, metabolism, genotoxicity, molecular biology, interactive effects with HBV, and human susceptibility factors. Aflatoxins are naturally occurring mycotoxins that are well documented hepatocarcinogens in humans (IARC, 1993, 2002; Gomaa et al., 2008). At least 13 different types of aflatoxin are found natu-rally. Aflatoxin B1 is considered the most potent of the aflatoxins and is produced by Aspergillus flavus and Aspergillus parasiticus. Aflatoxin B1 is genotoxic in prokaryotic and eukaryotic systems in vitro, including cultured human cells, and in vivo in humans and in a variety of animal species. Exposure to aflatoxin B1 induces adducts to DNA and albumin, gene mutations and chromosomal alterations including micronuclei and sister chromatid exchange, and mitotic recombina-tion. Exposure to aflatoxin B1 is mechanistically associated with a specific AGG→AGT transver-sion mutation in codon 249 of the TP53 gene in human hepatocellular carcinoma, providing mechanistic support for a causal link between exposure and disease (Gomaa et al., 2008).
The key steps in the mechanism of carcino-genicity of aflatoxins involve metabolism to the reactive exo-epoxide, binding of the exo-epoxide to DNA resulting in formation of DNA adducts, and miscoding in replicating DNA, which leads to development of mutations with eventual progression to tumours. Biological interactions with HBV also play a role in the hepatic carcino-genicity of aflatoxins in humans (IARC, 2002).
4.1 Toxicokinetics
Rigorous quantitative comparisons of dietary intakes and the amount of aflatoxin metabolites in body fluids following absorption and distribu-tion are lacking. As noted in previous Monographs (IARC, 1993, 2002), aflatoxin M1 concentrations in human urine and human breast milk have been correlated with dietary aflatoxin intake (Gan et al., 1988; JECFA, 2001). Using aflatoxin-specific monoclonal antibody-based immu-noaffinity chromatography, Wild et al. (1992) measured aflatoxin concentrations in cooked foods in a village in The Gambia. Estimated intakes of aflatoxins were less than those derived from the levels of aflatoxin–serum adducts and the concentrations in urine of the same individ-uals (Wild et al., 1992). In humans, as in other species, the DNA binding and carcinogenicity of aflatoxin B1 result from its conversion to the 8,9-epoxide by cytochrome P450 (CYP) enzymes (Essigmann et al., 1982; Guengerich, et al., 1998). There is interindividual variation in the rate of activation of aflatoxins, including differences between children and adults. These differences may be relevant to the pharmacokinetics of afla-toxins, which in humans have still not been fully elucidated (Ramsdell & Eaton, 1990; Wild et al., 1990).
Factors that explain differences in the response to aflatoxin between human indi-viduals and animal species and strains include the proportion of aflatoxin metabolized to the 8,9-exo-epoxide (mainly by CYP enzymes) relative to other, much less toxic metabolites, and the prevalence of pathways that lead to the formation of non-toxic conjugates with reduced mutagenicity and cytotoxicity (Guengerich et al., 1998).
After dermal application, aflatoxin B1 is absorbed via the skin in rats (Wei et al., 1970). Aflatoxins are absorbed from the gut of sheep (Wilson et al., 1985) and rats (Kumagai, 1989) and distributed via the blood, not by the lymphatic
236
Aflatoxins
system. In rats, absorption after intratracheal instillation is more rapid than after an oral dose, but the body distribution and excretion patterns are not different for these two routes of admin-istration (Coulombe & Sharma, 1985). When a tracheally administered dose was first adsorbed onto dust, the binding of aflatoxin B1 to lung and tracheal DNA was increased and retention in the trachea was prolonged, compared with admin-istration of microcrystalline aflatoxin B1 alone (Coulombe et al., 1991). Aflatoxin is also rapidly absorbed after inhalation by the rat, resulting in the formation of hepatic DNA adducts (Zarba et al., 1992). Aflatoxin B1 as weIl as aflatoxin M1 are concentrated in the liver of rats 30 minutes after an intraperitoneal or oral dose of 7 mg/kg bw 14C-aflatoxin B1; at 24 hours, both aflatoxins were detected only as traces (Wogan, 1969). In-vitro studies with bovine melanin have shown that unmetabolized aflatoxin B1 binds reversibly to this pigment (Larsson et al., 1988).
More aflatoxin-B1 metabolites are usually excreted in rat faeces than in urine after intra-peritoneal injection of [14C]-ring-labelled aflatoxin B1 (Wogan, 1969). Intraperitoneal co-injection of [3H]-glutathione and aflatoxin B1 (AFB1) in rats showed that the excretion of [3H]-GSH–AFB1conjugates proceeds almost exclu-sively through the bile: 14% of the radioactivity was excreted as the conjugate by this route, and only traces were found in urine (Emerole, 1981). Degradation of aflatoxin B1–glutathione conju-gate by enzymes of the mercapturic-acid pathway has been described in rat-kidney preparations in vitro (Moss et al., 1985). The extent of urinary excretion of aflatoxin B1–mercapturate, together with the sulfate and glucuronide conjugates, correlates with species-sensitivity to aflatoxin B1 (Raj & Lotlikar, 1984).
In a more recent study, aflatoxin B1 (AFB1) was administered to rats by gavage for nine consecutive days at eight dose levels ranging from 50 pg/kg bw to 55 μg/kg bw (Scholl et al., 2006). The dose–response relationship was
linear-quadratic, with an upward curvature at higher doses. The adduct yield [(pg Lys-AFB1/mg albumin)/(μg AFB1/kg body wt)] increased sixfold, nonlinearly with the dose between the 0.05- and 55-μg AFB1/kg bw groups, and showed the onset of saturation in the highest dose group, where the adduct yield was approximately 2%.
A recent study by Jubert et al. (2009) investi-gated aflatoxin-B1 pharmacokinetics in human volunteers by use of microdosing techniques and Accelerator Mass Spectrometry (AMS). The kinetics of low-dose aflatoxin B1 were investi-gated in three volunteers who received an oral dose of 30 ng [14C]-labelled aflatoxin. AMS was used to measure the levels of aflatoxin equiva-lents in plasma and urine. Pharmacokinetic modelling of absorption and disposition showed that excretion was rapid, with 95% of the total urinary aflatoxin-B1 equivalents produced within the first 24 hours. Absorption of aflatoxin-B1 equivalents into the systemic circulation was also rapid, with peak concentrations being reached within approximately 1 hour. Changes in plasma concentrations of aflatoxin-B1 equiv-alents following intervention in each subject mirrored those seen in urine. The authors did not discriminate between free aflatoxin B1 and its various metabolites or conjugates. Based on total [14C] equivalents, aflatoxin B1 was rapidly absorbed into plasma in all volunteers, with first-order kinetics.
4.2 Metabolism
The metabolism of aflatoxin B1 in humans and laboratory animals has been well character-ized (Essigmann et al., 1982; Eaton & Gallagher, 1994; McLean & Dutton, 1995; Gallagher et al., 1996; Code et al., 1997; Guengerich et al., 1998; Ueng et al., 1998; IARC, 2002). CYP1A2, 2B6, 3A4, 3A5, 3A7 and GSTM1 are enzymes that mediate aflatoxin metabolism in humans. The overall contribution of these enzymes to afla-toxin-B1 metabolism in vivo will depend not
237
IARC MONOGRAPHS – 100F
only on their affinity but also on their expression level in human liver, where CYP3A4 is predomi-nant. This enzyme mediates the formation of the exo-epoxide and aflatoxin Q1, while CYP1A2 can generate some exo-epoxide but also a high proportion of endo-epoxide and aflatoxin M1. In vitro evidence that both these enzymes are responsible for aflatoxin metabolism in humans has been substantiated by biomarker studies. Aflatoxins M1 and Q1, produced by CYP1A2 and 3A4, respectively, are present in the urine of individuals exposed to aflatoxin (Ross et al., 1992; Qian et al., 1994). In humans, as in other species, the DNA-binding and carcinogenicity of aflatoxin B1 result from its conversion to the afla-toxin B1 8,9-exo-epoxide by CYP3A4 (Essigmann et al., 1982). This epoxide is highly reactive and is the main mediator of cellular injury (McLean & Dutton, 1995).
CYP3A5, in contrast to CYP3A4, metabo-lizes aflatoxin B1 mainly to the exo-8,9-epoxide but is about 100-fold less efficient in catalysing 3-hydroxylation of aflatoxin B1 to yield the afla-toxin Q1 metabolite (Wang et al., 1998). Hepatic CYP3A5 expression differs markedly between individuals. Factors that explain the variation in response to aflatoxin among human individuals, animal species and strains include the proportion of aflatoxin metabolized to the 8,9-exo and endo-epoxide relative to other, much less toxic meta-bolites and the prevalence of pathways forming non-toxic conjugates with reduced mutagen-icity and cytotoxicity (Eaton & Gallagher, 1994; McLean & Dutton, 1995; Guengerich et al., 1998).
The expression of enzymes involved in af latoxin metabolism can be modulated with chemopreventive agents, resulting in inhibi-tion of DNA-adduct formation and hepato-carcinogenesis, as has been demonstrated in rats. Oltipraz is a chemopreventive agent that increases glutathione conjugation and inhibits the activity of some cytochrome P450 enzymes (e.g. CYP1A2). Results from clinical trials with oltipraz in the People’s Republic of China are
consistent with experimental data in showing that, following dietary exposure to aflatoxins, modulation of the metabolism of aflatoxins can lead to reduced levels of DNA adducts (IARC, 2002; Kensler et al., 2005).
There are marked interspecies differences in sensitivity to aflatoxin-induced carcinogenesis (Gorelick, 1990; Eaton & Gallagher, 1994; Eaton & Groopman, 1994). For example, the adult mouse is almost completely refractory to tumour formation except under conditions of partial hepatectomy, or as a result of liver injury through expression of transgenically induced hepatitis-B virus antigens. In contrast, the rat is extremely sensitive. A considerable part of this interspe-cies variation is understood in terms of differ-ences in activation and detoxification activities of aflatoxin-metabolizing enzymes in the path-ways described above (IARC, 2002). Microsomal preparations from mice show a higher specific activity for aflatoxin-B1 8,9-epoxide production than those from the rat (Ramsdell & Eaton, 1990). However, in the mouse, the resistance to afla-toxin carcinogenesis is largely, if not exclusively, explained by the constitutive hepatic expression of an α-class GST, mGSTA3–3, a detoxifying enzyme with a high affinity for aflatoxin B1 8,9-epoxide (Buetler & Eaton, 1992; Hayes et al., 1992). In contrast, rats do not constitutively express a GST isoform with high epoxide-conju-gating activity, but they do express an inducible α-class GST (rGSTA5–5) with high activity. The induction of this enzyme plays a major role in the resistance of rats to aflatoxin-B1-induced hepatocarcinogenicity following treatment with enzyme inducers including oltipraz, ethoxyquin and butylated hydroxyanisole (Kensler et al., 1986, 1987; Hayes et al., 1991, 1994; Pulford & Hayes, 1996).
Current knowledge of the molecular mechan-isms of aflatoxin-induced carcinogenesis contributes to the understanding of the nature of the biological interaction between hepatitis B virus (HBV) and aflatoxins in determining the
238
Aflatoxins
risk for hepatocellular carcinoma (IARC, 2002). In Asia and Africa, where the majority of cases are found, aflatoxins and hepatitis viruses (HBV and HCV) are important factors giving rise to extraordinarily high incidence rates (24.2–35.5/100000) of hepatocellular carcinoma. In these areas, HBV-induced chronic active hepa-titis and cirrhosis constitute major risk factors for liver cancer.
Infection with HBV may increase aflatoxin metabolism. In HBV-infected children in The Gambia there was a higher level of aflatoxin–albumin adducts than in non-infected children, an observation consistent with altered aflatoxin metabolism (Allen et al., 1992; Turner et al., 2000). However, similar studies in adults did not show such differences (Groopman et al., 1992; Wild et al., 2000). Glutathione S-transferase activity is reduced in human liver in the presence of HBV infection (Zhou et al., 1997). In HBV-transgenic mice, liver injury is associated with increased expression of cytochrome P450 enzymes (Kirby et al., 1994).
4.3 Aflatoxin–albumin adducts
4.3.1 Aflatoxin–albumin adducts as biomarkers of exposure in children
Gong et al. (2003) conducted a cross-sectional study in Benin and Togo to investigate aflatoxin exposure in children around the time of weaning and correlated these data with food consumption, socioeconomic status, agro-ecological zone of residence, and anthropometric measures. Blood samples from 479 children (age, 9 months to 5 years) from 16 villages in four agro-ecological zones were assayed for aflatoxin–albumin adducts as a measure of recent (2–3 months) past expo-sure. Aflatoxin–albumin adducts were detected in 475/479 (99%) children (geometric mean 32.8 pg/mg, 95%CI: 25.3–42.5). Adduct levels varied markedly across agro-ecological zones, with mean values being approximately four times
higher in the central than in the northern region. The aflatoxin–albumin adduct level increased with age up to three years, and was significantly (P = 0.0001) related to weaning status of the 1–3-year age group: weaned children had approx-imately twofold higher mean aflatoxin–albumin adduct levels (38 pg aflatoxin–lysine equivalents per mg of albumin [pg/mg]) than those receiving a mixture of breast milk and solid foods, after adjustment for age, sex, agro-ecological zone, and socioeconomic status. A higher intake of maize, but not peanuts, in the preceding week was correlated with higher aflatoxin–albumin adduct levels in the children. The prevalence of stunted growth (height for age Z-score, HAZ) and being underweight (weight for age Z-score, WAZ) were 33% and 29%, respectively, by World Health Organization criteria. Children in these two categories had 30–40% higher mean afla-toxin–albumin levels than the remainder of the children, and strong dose–response relationships were observed between aflatoxin–albumin levels and the extent of stunting and being under-weight. Polychronaki et al. (2008) investigated aflatoxin exposure in Egyptian children (n = 50; age, 1–2.5 years) by assessing urinary aflatoxin metabolites (AFM1, AFB1, AFB2, AFG1, AFG2). Samples from Guinean children (n = 50; age, 2–4 years) were analysed in parallel, providing a comparison with a region of established, frequent exposure to aflatoxin. Overall, aflatoxins were less frequently present in Egyptian (38%) than in Guinean urine samples (86%) (P < 0.001). For AFM1, the geometric mean level in Guinea (16.3 pg/ml; 95%CI: 10.1–26.6 pg/ml) was six times higher (P < 0.001) than in Egypt (2.7 pg/ml; 95%CI: 2.5–2.8 pg/ml).
239
IARC MONOGRAPHS – 100F
4.3.2 Aflatoxin–albumin adducts as biomarkers of exposure in intervention trials
The aflatoxin-biomarker studies in popula-tions at high risk for HCC have stimulated the development of interventions to reduce exposure to aflatoxins. In the study by Turner et al. (2005), aflatoxin biomarkers were used to assess whether post-harvest measures to restrict aflatoxin contamination of peanut crops could reduce exposure in the lower Kindia region of Guinea. Farms from 20 villages were included, ten of which implemented a package of post-harvest measures to restrict aflatoxin contamination of the peanut crops; ten controls followed usual post-harvest practices. The concentrations of aflatoxin–albumin adducts from 600 people were measured immediately after harvest, and three and five months later, to monitor the effectiveness of the intervention. In control villages the mean aflatoxin–albumin concentration increased from 5.5 pg/mg (95%CI: 4.7–6.1) immediately after harvest to 18.7 pg/mg (17.0–20.6) five months later. By contrast, the mean aflatoxin–albumin concentration in intervention villages after five months of peanuts storage was similar to that immediately post-harvest (7.2 pg/mg [6.2–8.4] vs 8.0 pg/mg [7.0–9.2]). At five months, the mean adduct concentration in intervention villages was less than 50% of the values in control villages (8.0 vs 18.7 pg/mg; P < 0.0001). About a third of the people had non-detectable aflatoxin–albumin concentrations at harvest. At five months, five persons (2%) in the control villages had non-detectable adduct concentrations, compared with 47 (20%) of the subjects in the intervention group (P < 0.0001).
4.4 Aflatoxin–DNA adducts
Formation of DNA adducts through reac-tion with metabolically activated aflatoxin is well characterized. The primary site of adduct
formation in DNA is the N7 position of the guanine base (Guengerich et al., 1998). Aflatoxin B1 is activated to its 8,9-exo-epoxide, which reacts with DNA to form the 8,9-dihydro-8-(N7-guanosinyl)-9-hydroxy aflatoxin B1 (AFB1–N7-Guo) adduct. This adduct represents more than 98% of the total adducts formed by the 8,9-exo-epoxide (Guengerich et al., 1998).
The positively charged imidazole ring of the guanosine adduct promotes depurination and consequently, apurinic site formation. As a result, the purine-adduct aflatoxin-N7-guanine can be measured in the urine (see below). Under slightly alkaline conditions, the imidazole ring of AFB1–N7-Guo is opened and forms the more stable – not depurinating – ring-open aflatoxin B1–formamidopyrimidine adduct (Groopman et al., 1981).
DNA and protein adducts of aflatoxin have been detected in many studies in human liver and in body fluids. Some studies related the level of adducts to polymorphisms in metabolizing enzymes, to investigate interindividual suscepti-bility to aflatoxin (IARC, 1993, 2002).
4.4.1 Aflatoxin–DNA adducts as biomarkers in intervention trials
Egner et al. (2001) reported on a clinical trial with chlorophyllin in Qidong County, People’s Republic China. Chlorophyllin is a mixture of semisynthetic, water-soluble derivatives of chlo-rophyll that has been shown in animal models to be an effective inhibitor of aflatoxin-induced hepatocarcinogenesis by blocking the bioavail-ability of the carcinogen. A total of 180 adults from Qidong were randomly assigned to ingest 100 mg of chlorophyllin or a placebo three times a day for four months. The primary endpoint was modulation of levels of aflatoxin-N7-guanine adducts in urine samples collected three months into the intervention. Chlorophyllin consump-tion at each meal led to an overall 55% reduc-tion (P = 0.036) in median urinary levels of this
240
Aflatoxins
aflatoxin biomarker compared with concentra-tions in the urine of those taking the placebo.
Kensler et al. (2005) described a randomized, placebo-controlled chemoprevention trial aimed at testing whether drinking hot-water infusions of three-day-old broccoli sprouts, containing defined concentrations of glucosinolates, could alter the disposition of aflatoxin. Two hundred healthy adults drank infusions containing either 400 μmol or < 3 μmol glucoraphanin (control value) nightly for two weeks. An inverse asso-ciation was observed for excretion of dithiocar-bamates and aflatoxin-DNA adducts (P = 0.002; R = 0.31) in individuals who consumed broccoli-sprout glucosinolates.
4.5 Mutagenicity
Aflatoxin B1 induces mutations in Salmonella typhimurium strains TA98 and TA100, and causes unscheduled DNA synthesis, chromo-somal aberrations, sister chromatid exchange, micronucleus formation and cell transforma-tion in various in vivo and in vitro mamma-lian systems. For its mutagenicity, aflatoxin B1 is strongly dependent on metabolic activation with a rat-liver S9 fraction: the mutagenicity in Salmonella tester strains TA98 and TA100 without S9 was approximately 1000 times lower than in the presence of S9 (IARC, 1993, 2002).
Aflatoxin B1 can induce mitotic recombina-tion in addition to point mutations (IARC, 2002). This has been demonstrated in both yeast and mammalian cells. In human lymphoblastoid cells, aflatoxin B1 treatment resulted in mitotic recombination and loss of heterozygosity. A rever-sion assay demonstrated aflatoxin B1-induced intrachromosomal recombination in a mutant cell-line derived from V79 cells that harbour an inactivating tandem-duplication in the Hprt gene. Aflatoxin B1 also induced recombination in minisatellite sequences in yeast expressing recombinant human CYP1A2. Liver tumours in HBV-transgenic mice – accumulating hepatitis-B
surface antigen in the endoplasmic reticulum of the hepatocytes – treated with aflatoxin B1 trans-placentally contained rearrangements in mini-satellite sequences after transplacental exposure to aflatoxin B1; no such alterations were seen in non-treated animals (Kaplanski et al., 1997). These findings suggest that aflatoxin can induce genetic instability in addition to point mutations. Mitotic recombination and genetic instability may therefore be two mechanisms by which aflatoxin may contribute to genetic alterations, such as loss of heterozygosity, in hepatocollular carcinoma.
Efforts to correlate biomarkers of aflatoxin exposure (i.e. adduct levels) with mutation indiction have given mixed results. In human subjects from Qidong County, People’s Republic of China, aflatoxin exposure was determined as high or low by measuring aflatoxin–albumin adduct levels in serum in comparison with the HPRT mutant frequency in lymphocytes. A higher HPRT mutant frequency was observed in subjects with high compared with low aflatoxin exposure (Wang et al., 1999). In a study in The Gambia, chromosomal aberrations, micronuclei and sister chromatid exchange were studied in 35 adults, 32 of whom had measurable concentra-tions of aflatoxin–albumin adducts. There was no correlation within this group between the cytoge-netic alterations and aflatoxin–albumin adducts in peripheral blood at the individual level. In a further study, blood samples of 29 individuals of the same group were tested for DNA damage in the single-cell gel electrophoresis (comet) assay, but no correlation was observed with aflatoxin–albumin adducts or GSTM1 genotype (Anderson et al., 1999).
4.6 Molecular lesions
It has been suggested that exposure to afla-toxin B1 can lead to hepatocellular carcinoma through induction of a specific mutation in codon 249 of the TP53 tumour-suppressor gene (Gomaa
241
IARC MONOGRAPHS – 100F
et al., 2008). Indeed, molecular analyses of human hepatocellular carcinomas have revealed a high prevalence of an AGG→AGT (Arg → Ser) transversion at codon 249 of the TP53 tumour-suppressor gene (249ser mutation) in tumours from areas of the world where aflatoxin exposure was reported to be high (Montesano et al., 1997). A large number of studies have been published on aflatoxin exposure and TP53 mutations; two meta-analyses examined the relationship between aflatoxin exposure, HBV infection and TP53 mutations in 20 (Lasky & Magder, 1997) and in 48 published studies (Stern et al., 2001).
In geographical correlation studies, expo-sure to aflatoxin was associated with a specific G→T transversion in codon 249 of the TP53 gene in human hepatocellular carcinoma. This alteration is consistent with the formation of the major aflatoxin B1–N7-guanine adduct and the observation that G→T mutations are predomi-nant in cell culture and animal model systems. The high prevalence of the codon-249 mutation in human hepatocellular carcinoma, however, is only partly explained in experimental studies by sequence-specific binding and mutation induced by aflatoxin B1, or by an altered function of the p53 protein in studies of hepatocyte growth and transformation.
Preneoplastic lesions have been examined to define the time point in the natural history of hepatocellular carcinoma when the TP53 mutation occurs. Hulla et al. (1993) examined six hyperplastic nodules from rat liver that had developed three weeks after intraperitoneal injection with aflatoxin B1 followed by partial hepatectomy. No mutations at the codon-249 equivalent were found. In other studies mice received intraperitoneal injections of aflatoxin B1 and were examined for tumours six to 14 months later (Tam et al., 1999). Of the 71 lung tumours examined, 79% showed positive nuclear p53-staining. Analysis of microdissected tumour samples revealed mutations in different codons in exons 5, 6 and 7. Direct sequencing showed 26
mutations, which included nine G:C to A:T tran-sitions, 11 A:T to G:C transitions and five trans-versions (two G:C to T:A, two T:A to A:T and one A:T to C:G). The high mutation frequency and heterogeneous staining pattern suggested that TP53 mutations occur relatively late in aflatoxin-B1-induced mouse lung tumorigenesis.
Investigations have been conducted to establish which DNA adduct is the most likely precursor of the mutations induced by aflatoxin B1. In several experimental systems these muta-tions are certainly consistent with the main carcinogen-binding occurring at guanine in DNA, leading to G→T transversions (IARC, 1993, 2002). When a pS189 shuttle vector was modified by aflatoxin B1 and then replicated in human Ad293 cells, predominantly G→T trans-versions were detected (Trottier et al., 1992). However, other types of mutation have also been observed with aflatoxin B1. For example, Levy et al. (1992) transfected an aflatoxin-B1-modified shuttle vector into DNA repair-deficient (XP) or -proficient human (GM0637) fibroblasts, and examined mutations in the SUP-F marker gene. Higher mutation frequencies were observed in the DNA repair-deficient cells and the location of mutations was significantly affected by repair proficiency. The majority of mutations were at GC base pairs: 50–70% were G →T transversions, but G→C transversions and G→A transitions were also frequent. A polymerase stop-assay was used to examine the of aflatoxin-B1-binding site within the shuttle vector: no strong correla-tion was found between initial binding sites and subsequent hotspots for mutation. This suggests that processing of adducts, e.g. during DNA replication and repair, can influence not only the overall mutation frequency but also the distribu-tion of mutations within a gene.
A host-mediated assay was used to determine the pattern of mutagenesis induced by aflatoxin B1 in the lacI gene of E. coli bacteria recovered from rat liver. Most of the 281 forward muta-tions analysed were base substitutions at GC base
242
Aflatoxins
pairs; over half were GC→TA transversions, with other mutations evenly divided between GC→AT transitions and GC→CG transversions (Prieto-Alamo et al., 1996).
In a human lymphoblastoid cell line (h1A2v2) expressing the human recombinant CYP1A1 enzyme, aflatoxin B1 (4 ng/mL; 25 hours) produced a hotspot GC→TA transversion muta-tion at base pair 209 in exon 3 of the HPRT gene in 10–17% of all mutants. This hotspot occurred at a GGGGGG sequence (target base underlined) (Cariello et al., 1994).
Bailey et al. (1996) studied the induction of mutations resulting from two of the principal forms of DNA damage induced by aflatoxin B1, namely the AFB1–N7-Guo adduct and the ensuing apurinic sites, by site-directed mutagen-esis. Single-stranded M13 bacteriophage DNA containing a unique AFB1–N7-Guo adduct or an apurinic site was used to transform E. coli. The predominant mutations with AFB1–N7-Guo were G→T transversions targeted to the site of the original adduct (approximately 74%), with lower frequencies of G→A transitions (13–18%) and G→C transversions (1–3%). Using E. coli strains differing in biochemical activity of the UmuDC- and MucAB proteins – involved in processing of apurinic sites by insertion of dAMP – the authors showed that the mutations observed with AFB1–N7-Guo were not predominantly a simple result of depurination of the initial adduct. A signifi-cant number of base substitutions were located at the base 5′ to the site of the original adduct, representing around 13% of the total mutations. This induction of mutation at the base adjacent to the original site of damage was not observed with apurinic sites as the mutagenic lesion. It was suggested that this reflects interference with DNA replication following the intercalation of aflatoxin-B1–8,9-epoxide (Gopalakrishnan et al., 1990).
4.7 Synthesis
Several key steps in the development of hepa-tocellular carcinoma induced by exposure to aflatoxin are well accepted (Wild & Montesano, 2009), and provide strong evidence that the mech-anism of action of this agent involves metabolic activation to a genotoxic metabolite, formation of DNA adducts, and modification of the TP53 gene. The concurrent presence of hepatitis B virus increases the incidence of hepatic tumours in humans. Aflatoxin B1 is the most common and potent of the aflatoxins. It is metabolized predominantly in the liver to an AFB1–8,9-exo-epoxide, which forms a promutagenic AFB1-N7-guanine DNA adduct that results in G→T transversion mutations. In human hepatocel-lular cancers in areas where aflatoxin exposure is high, up to 50% of tumours have been shown to harbour a specific AGG→AGT point mutation in codon 249 of the TP53 tumour-suppressor gene (codon 249Ser mutation) (Hussain et al., 2007; Wild & Montesano, 2009).
5. Evaluation
There is sufficient evidence in humans for the carcinogenicity of aflatoxins. Aflatoxins cause cancer of the liver (hepatocellular carcinoma).
There is sufficient evidence in experimental animals for the carcinogenicity of naturally occurring mixtures of aflatoxins, and of afla-toxin B1, G1 and M1.
There is limited evidence in experimental animals for the carcinogenicity of aflatoxin B2.
There is inadequate evidence in experimental animals for the carcinogenicity of aflatoxin G2.
There is strong evidence that the carcino-genicity of aflatoxins operates by a genotoxic mechanism of action that involves metabolic activation to a genotoxic epoxide metabolite, formation of DNA adducts, and modification of the TP53 gene. In human hepatocellular
243
IARC MONOGRAPHS – 100F
carcinoma from areas where exposure to afla-toxins is high, up to 50% of tumours have been shown to harbour a specific point mutation in the TP53 tumour-suppressor gene.
Aflatoxins are carcinogenic to humans (Group 1).
References
Allen SJ, Wild CP, Wheeler JG et al. (1992). Aflatoxin expo-sure, malaria and hepatitis B infection in rural Gambian children. Trans R Soc Trop Med Hyg, 86: 426–430. doi:10.1016/0035-9203(92)90253-9 PMID:1440826
Anderson D, Yu T-W, Hambly RJ et al. (1999). Aflatoxin exposure and DNA damage in the comet assay in individuals from the Gambia, West Africa. Teratog Carcinog Mutagen, 19: 147–155. doi:10.1002/(SICI)1520-6 8 6 6(19 9 9)19 :2<147: : A I D -TCM7>3.0 .CO ; 2-Z PMID:10332811
Ayres J.L., Lee D.J., Wales J.H., Sinnhuber RO. (1971). Afatoxin structure and hepatocarcinogenicity in rainbow trout (Salmo gairdneri). J natl Cancer lnst., 46:561–564.
Bailey EA, Iyer RS, Stone MP et al. (1996). Mutational properties of the primary aflatoxin B1-DNA adduct. Proc Natl Acad Sci USA, 93: 1535–1539. doi:10.1073/pnas.93.4.1535 PMID:8643667
Bailey GS, Dashwood R, Loveland PM et al. (1998). Molecular dosimetry in fish: quantitative target organ DNA adduction and hepatocarcinogenicity for four aflatoxins by two exposure routes in rainbow trout. Mutat Res, 399: 233–244. PMID:9672662
Bailey GS, Loveland PM, Pereira C et al. (1994b). Quantitative carcinogenesis and dosimetry in rainbow trout for aflatoxin B1 and aflatoxicol, two aflatoxins that form the same DNA adduct. Mutat Res, 313: 25–38. PMID:7519308
Bailey GS, Price RL, Park DL, Hendricks JD (1994a). Effect of ammoniation of aflatoxin B1-contaminated cottonseed feedstock on the aflatoxin M1 content of cows’ milk and hepatocarcinogenicity in the trout bioassay. Food Chem Toxicol, 32: 707–715. doi:10.1016/S0278-6915(09)80003-3 PMID:8070735
Bannasch P, Khoshkhou NI, Hacker HJ et al. (1995). Synergistic hepatocarcinogenic effect of hepadnaviral infection and dietary aflatoxin B1 in woodchucks. Cancer Res, 55: 3318–3330. PMID:7614467
Brera C, Caputi R, Miraglia M et al. (2002). Exposure assessment to mycotoxins in workplaces: aflatoxins and ochratoxin A occurrence in airborne dusts and human sera. Microchemical Journal, 73: 167–173. doi:10.1016/S0026-265X(02)00061-9
Bryden WL (2007). Mycotoxins in the food chain: human health implications. Asia Pac J Clin Nutr, 16: Suppl 195–101. PMID:17392084
Buetler TM & Eaton DL (1992). Complementary DNA cloning, messenger RNA expression, and induction of alpha-class glutathione S-transferases in mouse tissues. Cancer Res, 52: 314–318. PMID:1728405
Butler WH, Greenblatt M, Lijinsky W (1969). Carcinogenesis in rats by aflatoxins Bi, Gi, and B2. Cancer Res, 29: 2202211
CAREX (1999). Carex: industry specific estimates – Summary. Available at http://www.ttl.fi/en/chemical_safety/carex/Documents/5_exposures_by_agent_and_industry.pdf.
Cariello NF, Cui L, Skopek TR (1994). In vitro mutational spectrum of aflatoxin B1 in the human hypoxanthine guanine phosphoribosyltransferase gene. Cancer Res, 54: 4436–4441. PMID:8044792
Code EL, Crespi CL, Penman BW et al. (1997). Human cytochrome P4502B6: interindividual hepatic expression, substrate specificity, and role in procar-cinogen activation. Drug Metab Dispos, 25: 985–993. PMID:9280407
Coulombe RA, Huie JM, Ball RW et al. (1991). Pharmacokinetics of intratracheally administered aflatoxin B1. Toxicol Appl Pharmacol, 109: 196–206. doi:10.1016/0041-008X(91)90168-E PMID:1906203
Coulombe RA Jr & Sharma RP (1985). Clearance and excretion of intratracheally and orally administered aflatoxin B1 in the rat. Food Chem Toxicol, 23: 827–830. doi:10.1016/0278-6915(85)90283-2 PMID:3930357
Cullen JM, Brown DL, Kissling GE et al. (2009). Aflatoxin B1 and/or hepatitis B virus induced tumor spectrum in a genetically engineered hepatitis B virus expression and Trp53 haploinsufficient mouse model system for hepa-tocarcinogenesis. Toxicologic Pathology, 37: 333–342. doi:10.1177/0192623309333137 PMID:19258306
Duan XX, Ou JS, Li Y et al. (2005). Dynamic expres-sion of apoptosis-related genes during development of laboratory hepatocellular carcinoma and its relation to apoptosis. World J Gastroenterol, 11: 4740–4744. PMID:16094721
Eaton DL & Gallagher EP (1994). Mechanisms of afla-toxin carcinogenesis. Annu Rev Pharmacol Toxicol, 34: 135–172. doi:10.1146/annurev.pa.34.040194.001031 PMID:8042848
Eaton DL, Groopman JD, editors (1994). The Toxicology of Aflatoxins: Human Health, Veterinary, and Agricultural Significance. San Diego, CA: Academic Press.
Egner PA, Wang JB, Zhu YR et al. (2001). Chlorophyllin intervention reduces aflatoxin-DNA adducts in indi-viduals at high risk for liver cancer. Proc Natl Acad Sci U S A, 98: 14601–14606. PMID:11724948
Emerole GO (1981). Excretion of aflatoxin Bi as a glutath-ione conjugate. Eur. J Drug Metab., Pharmacokin., 6: 265–268.
244
Aflatoxins
Essigmann JM, Croy RG, Bennett RA, Wogan GN (1982). Metabolic activation of aflatoxin B1: patterns of DNA adduct formation, removal, and excretion in rela-tion to carcinogenesis. Drug Metab Rev, 13: 581–602. doi:10.3109/03602538209011088 PMID:6813091
Frayssinet C & Lafarge-Frayssinet C (1990). Effect of ammoniation on the carcinogenicity of aflatoxin-contaminated groundnut oil cakes: long-term feeding study in the rat. Food Addit Contam, 7: 63–68. PMID:2307268
Gallagher EP, Kunze KL, Stapleton PL, Eaton DL (1996). The kinetics of aflatoxin B1 oxidation by human cDNA-expressed and human liver microsomal cytochromes P450 1A2 and 3A4. Toxicol Appl Pharmacol, 141: 595–606. doi:10.1006/taap.1996.0326 PMID:8975785
Gan LS, Skipper PL, Peng XC et al. (1988). Serum albumin adducts in the molecular epidemiology of aflatoxin carcinogenesis: correlation with aflatoxin B1 intake and urinary excretion of aflatoxin M1. Carcinogenesis, 9: 1323–1325. doi:10.1093/carcin/9.7.1323 PMID:3133131
Gomaa AI, Khan SA, Toledano MB et al. (2008). Hepatocellular carcinoma: epidemiology, risk factors and pathogenesis. World J Gastroenterol, 14: 4300–4308. doi:10.3748/wjg.14.4300 PMID:18666317
Gong YY, Egal S, Hounsa A et al. (2003). Determinants of aflatoxin exposure in young children from Benin and Togo, West Africa: the critical role of weaning. Int J Epidemiol, 32: 556–562. PMID:12913029
Gopalakrishnan S, Harris TM, Stone MP (1990). Intercalation of aflatoxin B1 in two oligodeoxynu-cleotide adducts: comparative 1H NMR analysis of d(ATCAFBGAT).d(ATCGAT) and d(ATAFBGCAT)2. Biochemistry, 29: 10438–10448. doi:10.1021/bi00498a002 PMID:2125491
Gorelick NJ (1990). Risk assessment for aflatoxin: I. Metabolism of aflatoxin B1 by different species. Risk Anal, 10: 539–559. doi:10.1111/j.1539-6924.1990.tb00538.x PMID:2287782
Groopman JD, Croy RG, Wogan GN (1981). In vitro reac-tions of aflatoxin B1-adducted DNA. Proc Natl Acad Sci USA, 78: 5445–5449. doi:10.1073/pnas.78.9.5445 PMID:6795633
Groopman JD, Hall AJ, Whittle H et al. (1992). Molecular dosimetry of aflatoxin-N7-guanine in human urine obtained in The Gambia, West Africa. Cancer Epidemiol Biomarkers Prev, 1: 221–227. PMID:1339082
Guengerich FP, Johnson WW, Shimada T et al. (1998). Activation and detoxication of aflatoxin B1. Mutat Res, 402: 121–128. doi:10.1016/S0027-5107(97)00289-3 PMID:9675258
Hao YR, Yang F, Cao J et al. (2009). Ginkgo biloba extracts (EGb761) inhibits aflatoxin B1-induced hepatocar-cinogenesis in Wistar rats Zhong Yao Cai, 32: 92–96. PMID:19445131
Hayes JD, Judah DJ, McLellan LI et al. (1991). Ethoxyquin-induced resistance to aflatoxin B1 in the rat is associated
with the expression of a novel alpha-class glutathione S-transferase subunit, Yc2, which possesses high cata-lytic activity for aflatoxin B1–8,9-epoxide. Biochem J, 279: 385–398. PMID:1953636
Hayes JD, Judah DJ, Neal GE, Nguyen T (1992). Molecular cloning and heterologous expression of a cDNA encoding a mouse glutathione S-transferase Yc subunit possessing high catalytic activity for aflatoxin B1–8,9-epoxide. Biochem J, 285: 173–180. PMID:1637297
Hayes JD, Nguyen T, Judah DJ et al. (1994). Cloning of cDNAs from fetal rat liver encoding glutathione S-transferase Yc polypeptides. The Yc2 subunit is expressed in adult rat liver resistant to the hepatocar-cinogen aflatoxin B1. J Biol Chem, 269: 20707–20717. PMID:8051171
Hsieh DPH, Cullen JM, Ruebner BH (1984). Comparative hepatocarcinogenicity of aflatoxins B1 and M1 in the rat. Food Chem Toxicol, 22: 1027–1028. doi:10.1016/0278-6915(84)90160-1 PMID:6439612
Huang XH, Sun LH, Lu DD et al. (2003). Codon 249 muta-tion in exon 7 of p53 gene in plasma DNA: maybe a new early diagnostic marker of hepatocellular carcinoma in Qidong risk area, China. World J Gastroenterol, 9: 692–695. PMID:12679912
Huang XH, Zhang XH, Li YH et al. (2004). Experimental lung carcinogenic in vivo study of aflatoxin G1 in NIH mice Zhonghua Bing Li Xue Za Zhi, 33: 260–263. PMID:15256122
Hulla JE, Chen ZY, Eaton DL (1993). Aflatoxin B1-induced rat hepatic hyperplastic nodules do not exhibit a site-specific mutation within the p53 gene. Cancer Res, 53: 9–11. PMID:8380129
Hussain SP, Schwank J, Staib F et al. (2007). TP53 muta-tions and hepatocellular carcinoma: insights into the etiology and pathogenesis of liver cancer. Oncogene, 26: 2166–2176. doi:10.1038/sj.onc.1210279 PMID:17401425
IARC (1972). Some inorganic substances, chlorinated hydrocarbons, aromatic amines, N-nitroso compounds and natural products. IARC Monogr Eval Carcinog Risk Chem Man, 1: 1–184.
IARC (1976). Some naturally occurring substances. IARC Monogr Eval Carcinog Risk Chem Man, 10: 1–342. PMID:992652
IARC (1987). Overall evaluations of carcinogenicity: an updating of IARC Monographs volumes 1 to 42. IARC Monogr Eval Carcinog Risks Hum Suppl, 7: 1–440. PMID:3482203
IARC (1993). Some naturally occurring substances: food items and constituents, heterocyclic aromatic amines and mycotoxins. IARC Monogr Eval Carcinog Risks Hum, 56: 1–599.
IARC (2002). Some traditional herbal medicines, some mycotoxins, naphthalene and styrene. IARC Monogr Eval Carcinog Risks Hum, 82: 1–556. PMID:12687954
Jackson PE, Kuang S-Y , Wang J-B et al. (2003). Specific p53 mutations detected in plasma and tumors of
245
IARC MONOGRAPHS – 100F
hepatocellular carcinoma patients by electrospray ionization mass spectrometry. Cancer Res, 61: 33–35. PMID:11196182
Jackson PE, Qian GS, Friesen MD et al. (2001). Prospective detection of codon p53 mutations in plasma of hepa-tocellular carcinoma patients. Carcinogenesis. , 241657166–3.
JECFA (1998) Safety Evaluation of Certain Food Additives and Contaminants (WHO Food Additives Series No. 40), 49th Meeting of the Joint FAO/WHO Expert Committee on Food Additives (JECFA), Geneva: International Programme on Chemical Safety, World Health Organization
JECFA (2001) Safety Evaluation of Certain Mycotoxins in Food (WHO Food Additives Series No. 47), 56th Meeting of the Joint FAO/WHO Expert Committee on Food Additives (JECFA), Geneva: International Programme on Chemical Safety, World Health Organization
Jubert C, Mata J, Bench G et al. (2009). Effects of chlo-rophyll and chlorophyllin on low-dose aflatoxin B(1) pharmacokinetics in human volunteers. Cancer Prev Res (Phila), 2: 1015–1022. doi:10.1158/1940-6207.CAPR-09-0099 PMID:19952359
Kabak B, Dobson ADW, Var I (2006). Strategies to prevent mycotoxin contamination of food and animal feed: a review. Crit Rev Food Sci Nutr, 46: 593–619. PMID:17092826
Kaplanski C, Chisari FV, Wild CP (1997). Minisatellite rearrangements are increased in liver tumours induced by transplacental aflatoxin B1 treatment of hepatitis B virus transgenic mice, but not in spontaneously arising tumours. Carcinogenesis, 18: 633–639. doi:10.1093/carcin/18.4.633 PMID:9111192
Kauppinen T, Toikkanen J, Pedersen D et al. (2000). Occupational exposure to carcinogens in the European Union. Occup. and Environ. Med, 57: 10–18. doi:10.1136/oem.57.1.10 PMID:10711264
Kendra DF & Dyer RB (2007). Opportunities for biotech-nology and policy regarding mycotoxin issues in international trade. International Journal of Food Microbiology, 119: 147–151. doi:10.1016/j.ijfood-micro.2007.07.036 PMID:17727996
Kensler TW, Chen JG, Egner PA et al. (2005). Effects of glucosinolate-rich broccoli sprouts on urinary levels of aflatoxin-DNA adducts and phenanthrene tetraols in a randomized clinical trial in He Zuo township, Qidong, People’s Republic of China. Cancer Epidemiol Biomarkers Prev, 14: 2605–2613. doi:10.1158/1055-9965.EPI-05-0368 PMID:16284385
Kensler TW, Egner PA, Davidson NE et al. (1986). Modulation of aflatoxin metabolism, aflatoxin-N7-guanine formation, and hepatic tumorigenesis in rats fed ethoxyquin: role of induction of glutath-ione S-transferases. Cancer Res, 46: 3924–3931. PMID:2873884
Kensler TW, Egner PA, Dolan PM et al. (1987). Mechanism of protection against aflatoxin tumorigenicity in rats fed 5-(2-pyrazinyl)-4-methyl-1,2-dithiol-3-thione (olti-praz) and related 1,2-dithiol-3-thiones and 1,2-dithiol-3-ones. Cancer Res, 47: 4271–4277. PMID:2886217
Kirby GM, Chemin I, Montesano R et al. (1994). Induction of specific cytochrome P450s involved in aflatoxin B1 metabolism in hepatitis B virus transgenic mice. Mol Carcinog, 11: 74–80. doi:10.1002/mc.2940110204 PMID:7916995
Kirk GD, Turner PC, Gong Y et al. (2005). Hepatocellular cancinoma and polymorphisms in carcinogen-metab-olizing and DNA repair enzymes in a population with aflatoxin exposure and hepatitis B virus endemicity. Cancer Epidemiology, Biomarkers & Prevention, 14: 373–379. PMID:15734960
Kumagai S (1989). Intestinal absorption and excretion of aflatoxin in rats. Toxicol Appl Pharmacol, 97: 88–97. doi:10.1016/0041-008X(89)90057-4 PMID:2492684
Larsson P, Larsson BS, Tjälve H (1988). Binding of afla-toxin B1 to melanin. Food Chem Toxicol, 26: 579–586. doi:10.1016/0278-6915(88)90228-1 PMID:3141255
Lasky T & Magder L (1997). Hepatocellular carcinoma p53 G > T transversions at codon 249: the fingerprint of aflatoxin exposure? Environ Health Perspect, 105: 392–397. doi:10.2307/3433335 PMID:9189703
Levy DD, Groopman JD, Lim SE et al. (1992). Sequence specificity of aflatoxin B1-induced mutations in a plasmid replicated in xeroderma pigmentosum and DNA repair proficient human cells. Cancer Res, 52: 5668–5673. PMID:1394191
Li Y, Qin X, Cui J et al. (2008). Proteome analysis of aflatoxin B1-induced hepatocarcinogenesis in tree shrew (Tupaia belangeri chinensis) and functional identification of candidate protein peroxiredoxin II. Proteomics, 8: 1490–1501. doi:10.1002/pmic.200700229 PMID:18318006
Li Y, Su JJ, Qin LL et al. (1999). Synergistic effect of hepa-titis B virus and aflatoxin B1 in hepatocarcinogenesis in tree shrews. Ann Acad Med Singapore, 28: 67–71. PMID:10374028
Liu ZM, Li LQ, Peng MH et al. (2008). Hepatitis B virus infection contributes to oxidative stress in a population exposed to aflatoxin B1 and high-risk for hepatocellular carcinoma. Cancer Lett, 263: 212–222. PMID:18280645
Magan N (2006). Mycotoxin contamination of food in Europe: early detection and prevention strategies. Mycopathologia, 162: 245–253. doi:10.1007/s11046-006-0057-2 PMID:16944291
Magan N & Aldred D (2007). Post-harvest control strat-egies: minimizing mycotoxins in the food chain. International Journal of Food Microbiology, 119: 131–139. doi:10.1016/j.ijfoodmicro.2007.07.034 PMID:17764773
McGlynn KA, Hunter K, LeVoyer T et al. (2003). Susceptibility to aflatoxin B1-related primary hepato-
246
Aflatoxins
cellular carcinoma in mice and humans. Cancer Res, 63: 4594–4601. PMID:12907637
McLean M & Dutton MF (1995). Cellular interactions and metabolism of aflatoxin: an update. Pharmacol Ther, 65: 163–192. doi:10.1016/0163-7258(94)00054-7 PMID:7540767
Ming L, Thorgeirsson SS, Gail MH et al. (2002). Dominant role of hepatitis B virus and cofactor role of aflatoxin in hepatocarcinogenesis in Qidong, China. Hepatology, 36: 1214–1220. PMID:12395332
Montesano R, Hainaut P, Wild CP (1997). Hepatocellular carcinoma: from gene to public health. J Natl Cancer Inst, 89: 1844–1851. doi:10.1093/jnci/89.24.1844 PMID:9414172
Moss EJ, Neal GE, Judah DJ (1985). The mercapturic acid pathway metabolites of a glutathione conjugate of afla-toxin B1. Chem Biol Interact, 55: 139–155. doi:10.1016/S0009-2797(85)80124-1 PMID:3933841
Okano K, Tomita T, Chonan M (2003). Aflatoxins inspec-tion in groundnuts imported into Japan in 1994–2000. Mycotoxins, 53: 25–29.
Omer RE, Kuijsten A, Kadaru AM et al. (2004). Population-attributable risk of dietary aflatoxins and hepatitis B virus infection with respect to hepatocel-lular carcinoma. Nutr Cancer, 48: 15–21. doi:10.1207/s15327914nc4801_3 PMID:15203373
Omer RE, Verhoef L, Van’t Veer P et al. (2001). Peanut butter intake, GSTM1 genotype and hepatocellular carcinoma: a case-control study in Sudan. Cancer Causes Control, 12: 23–32. PMID:11227922
Polychronaki N, Wild CP, Mykkänen H et al. (2008). Urinary biomarkers of aflatoxin exposure in young children from Egypt and Guinea. Food Chem Toxicol, 46: 519–526. PMID:17920747
Prieto-Alamo M-J, Jurado J, Abril N et al. (1996). Mutational specificity of aflatoxin B1. Comparison of in vivo host-mediated assay with in vitro S9 metabolic activation. Carcinogenesis, 17: 1997–2002. doi:10.1093/carcin/17.9.1997 PMID:8824526
Pulford DJ & Hayes JD (1996). Characterization of the rat glutathione S-transferase Yc2 subunit gene, GSTA5: identification of a putative antioxidant-responsive element in the 5′-flanking region of rat GSTA5 that may mediate chemoprotection against aflatoxin B1. Biochem J, 318: 75–84. PMID:8761455
Qian GS, Ross RK, Yu MC et al. (1994). A follow-up study of urinary markers of aflatoxin exposure and liver cancer risk in Shanghai, People’s Republic of China. Cancer Epidemiol Biomarkers Prev, 3: 3–10. PMID:8118382
Raj HG & Lotlikar PD (1984). Urinary excretion of thiol conjugates of aflatoxin B1 in rats and hamsters. Cancer Lett, 22: 125–133. doi:10.1016/0304-3835(84)90109-5 PMID:6423269
Ramsdell HS & Eaton DL (1990). Species susceptibility to aflatoxin B1 carcinogenesis: comparative kinetics
of microsomal biotransformation. Cancer Res, 50: 615–620. PMID:2105159
Ross RK, Yuan J-M, Yu MC et al. (1992). Urinary aflatoxin biomarkers and risk of hepatocellular carcinoma. Lancet, 339: 943–946. doi:10.1016/0140-6736(92)91528-G PMID:1348796
Schnur J, Nagy P, Sebestyén A et al. (1999). Chemical hepa-tocarcinogenesis in transgenic mice overexpressing mature TGF beta-1 in liver. Eur J Cancer, 35: 1842–1845. doi:10.1016/S0959-8049(99)00224-5 PMID:10674001
Scholl PF, McCoy L, Kensler TW, Groopman JD (2006). Quantitative analysis and chronic dosimetry of the aflatoxin B1 plasma albumin adduct Lys-AFB1 in rats by isotope dilution mass spectrometry. Chem Res Toxicol, 19: 44–49.
Selim MI, Juchems AM, Popendorf W (1998). Assessing airborne aflatoxin B1 during on-farm grain handling activities. Am Ind Hyg Assoc J, 59: 252–256. doi:10.1080/15428119891010514 PMID:9586200
Stern MC, Umbach DM, Yu MC et al. (2001). Hepatitis B, aflatoxin B(1), and p53 codon 249 mutation in hepato-cellular carcinomas from Guangxi, People’s Republic of China, and a meta-analysis of existing studies. Cancer Epidemiol Biomarkers Prev, 10: 617–625. PMID:11401911
Strosnider H, Azziz-Baumgartner E, Banziger M et al. (2006). Workgroup report: public health strate-gies for reducing aflatoxin exposure in developing countries. Environ Health Perspect, 114: 1898–1903. PMID:17185282
Su JJ, Ban KC, Li Y et al. (2004). Alteration of p53 and p21 during hepatocarcinogenesis in tree shrews. World J Gastroenterol, 10: 3559–3563. PMID:15534906
Sun CA, Wang LY, Chen CJ et al. (2001). Genetic poly-morphisms of glutathione S-transferases M1 and T1 associated with susceptibility to aflatoxin-related hepa-tocarcinogenesis among chronic hepatitis B carriers: a nested case-control study in Taiwan. Carcinogenesis, 22: 1289–1294. PMID:11470760
Takahashi Y, Nakatsuru Y, Zhang S et al. (2002). Enhanced spontaneous and aflatoxin-induced liver tumorigen-esis in xeroderma pigmentosum group A gene-defi-cient mice. Carcinogenesis, 23: 627–633. doi:10.1093/carcin/23.4.627 PMID:11960916
Tam AS, Foley JF, Devereux TR et al. (1999). High frequency and heterogeneous distribution of p53 mutations in aflatoxin B1-induced mouse lung tumors. Cancer Res, 59: 3634–3640. PMID:10446974
Tilton SC, Gerwick LG, Hendricks JD et al. (2005). Use of a rainbow trout oligonucleotide microarray to deter-mine transcriptional patterns in aflatoxin B1-induced hepatocellular carcinoma compared to adjacent liver. Toxicological Sciences, 88: 319–330. doi:10.1093/toxsci/kfi309 PMID:16141433
Tong W-M, Lee M-K, Galendo D et al. (2006). Aflatoxin-B exposure does not lead to p53 mutations but results in
247
IARC MONOGRAPHS – 100F
enhanced liver cancer of Hupki (human p53 knock-in) mice. International Journal of Cancer, 119: 745–749. doi:10.1002/ijc.21890 PMID:16557586
Trottier Y, Waithe WI, Anderson A (1992). Kinds of mutations induced by aflatoxin B1 in a shuttle vector replicating in human cells transiently expressing cyto-chrome P4501A2 cDNA. Mol Carcinog, 6: 140–147. doi:10.1002/mc.2940060209 PMID:1326989
Turner PC, Mendy M, Whittle H et al. (2000). Hepatitis B infection and aflatoxin biomarker levels in Gambian children. Trop Med Int Health, 5: 837–841. doi:10.1046/j.1365-3156.2000.00664.x PMID:11169271
Turner PC, Sylla A, Gong YY et al. (2005). Reduction in exposure to carcinogenic aflatoxins by postharvest intervention measures in west Africa: a community-based intervention study. Lancet, 365: 1950–1956. PMID:15936422
Ueng Y-F, Shimada T, Yamazaki H, Peterguengerich F (1998). Aflatoxin B1 oxidation by human cytochrome P450s. J Toxicol Sci, 23: Suppl 2132–135. doi:10.2131/jts.23.SupplementII_132 PMID:9760449
Wagacha JM & Muthomi JW (2008). Mycotoxin problem in Africa: current status, implications to food safety and health and possible management strategies. International Journal of Food Microbiology, 124: 1–12. doi:10.1016/j.ijfoodmicro.2008.01.008 PMID:18258326
Wang H, Dick R, Yin H et al. (1998). Structure-function relationships of human liver cytochromes P450 3A: aflatoxin B1 metabolism as a probe. Biochemistry, 37: 12536–12545. doi:10.1021/bi980895g PMID:9730826
Wang LY, Hatch M, Chen CJ et al. (1996). Aflatoxin exposure and risk of hepatocellular carcinoma in Taiwan. International Journal of Cancer, 67: 620–625. PMID:8782648
Wang SS, O’Neill JP, Qian G-S et al. (1999). Elevated HPRT mutation frequencies in aflatoxin-exposed residents of daxin, Qidong county, People’s Republic of China. Carcinogenesis, 20: 2181–2184. doi:10.1093/carcin/20.11.2181 PMID:10545423
Wei RD, Liu GX, Lee SS (1970). Uptake of aflatoxin B1 by the skin of rats. Experientia, 26: 82–83. doi:10.1007/BF01900406 PMID:5413964
Wild CP, Hudson GJ, Sabbioni G et al. (1992). Dietary intake of aflatoxins and the level of albumin-bound aflatoxin in peripheral blood in The Gambia, West Africa. Cancer Epidemiol Biomarkers Prev, 1: 229–234. PMID:1339083
Wild CP, Jiang YZ, Allen SJ et al. (1990). Aflatoxin-albumin adducts in human sera from different regions of the world. Carcinogenesis, 11: 2271–2274. doi:10.1093/carcin/11.12.2271 PMID:2265478
Wild CP & Montesano R (2009). A model of interaction: aflatoxins and hepatitis viruses in liver cancer aetiology and prevention. Cancer Lett, 286: 22–28. doi:10.1016/j.canlet.2009.02.053 PMID:19345001
Wild CP, Yin F, Turner PC et al. (2000). Environmental and genetic determinants of aflatoxin-albumin adducts in the Gambia. Int J Cancer, 86: 1–7. doi:10.1002/(SICI)1097-0215(20000401)86:1<1::AID-IJC1>3.0.CO;2-I PMID:10728587
Williams JH, Phillips TD, Jolly PE et al. (2004). Human aflatoxicosis in developing countries: a review of toxicology, exposure, potential health consequences, and interventions. Am J Clin Nutr, 80: 1106–1122. PMID:15531656
Wilson R, Ziprin R, Ragsdale S, Busbee D (1985). Uptake and vascular transport of ingested aflatoxin. Toxicol Lett, 29: 169–176. doi:10.1016/0378-4274(85)90038-4 PMID:3937298
Wogan GN (1969). Metabolism and biochemIcal effects of aflatoxins. In: Aflatoxin. Scientific Background, Control and Implications. Goldblatt LA, editor. New York: Academic Press, pp. 151–186
Wogan GN, Edwards GS, Newberne PM (1971). Structure-activity relationships in toxicity and carcinogenicity of aflatoxins and analogs. Cancer Res, 31: 1936–1942. PMID:4330435
Wogan GN, Paglialunga S, Newberne PM (1974). Carcinogenic effects of low dietary levels of afla-toxin B1 in rats. Food Cosmet Toxicol, 12: 681–685. doi:10.1016/0015-6264(74)90239-9 PMID:4375655
Wu HC, Wang Q, Wang LW et al. (2007a). Polycyclic aromatic hydrocarbon- and aflatoxin-albumin adducts, hepatitis B virus infection and hepatocel-lular carcinoma in Taiwan. Cancer Lett, 252: 104–114. PMID:17250958
Wu HC, Wang Q, Wang LW et al. (2007b). Urinary 8-oxodeoxyguanosine, aflatoxin B1 exposure and hepa-titis B virus infection and hepatocellular carcinoma in Taiwan. Carcinogenesis, 28: 995–999. PMID:17127712
Wu HC, Wang Q, Yang HI et al. (2009). Aflatoxin B1 exposure, hepatitis B virus infection, and hepatocel-lular carcinoma in Taiwan. Cancer Epidemiology, Biomarkers & Prevention, 18: 846–853. PMID:19273485
Zarba A, Hmieleski R, Hemenway DR et al. (1992). Aflatoxin B1–DNA adduct formation in rat liver following expo-sure by aerosol inhalation. Carcinogenesis, 13: 1031–1033. doi:10.1093/carcin/13.6.1031 PMID:1600607
Zhou T, Evans AA, London WT et al. (1997). Glutathione S-transferase expression in hepatitis B virus-associated human hepatocellular carcinogenesis. Cancer Res, 57: 2749–2753. PMID:9205086
248