Aerosol airmass type mapping over the Urban Mexico City region ...
17
Atmos. Chem. Phys., 13, 9525–9541, 2013 www.atmos-chem-phys.net/13/9525/2013/ doi:10.5194/acp-13-9525-2013 © Author(s) 2013. CC Attribution 3.0 License. Atmospheric Chemistry and Physics Open Access Aerosol airmass type mapping over the Urban Mexico City region from space-based multi-angle imaging F. Patadia 1,2 , R. A. Kahn 2 , J. A. Limbacher 2,3 , S. P. Burton 4 , R. A. Ferrare 4 , C. A. Hostetler 4 , and J. W. Hair 4 1 GESTAR, Morgan State University, Baltimore, MD 21251, USA 2 Climate & Radiation Laboratory, NASA Goddard Space Flight Center, Greenbelt, MD 20771, USA 3 Science Systems and Applications, Inc., Lanham, MD 20706, USA 4 NASA Langley Research Center, Hampton VA, 23681, USA Correspondence to: F. Patadia ([email protected]) Received: 6 January 2013 – Published in Atmos. Chem. Phys. Discuss.: 22 March 2013 Revised: 30 July 2013 – Accepted: 31 July 2013 – Published: 27 September 2013 Abstract. Using Multi-angle Imaging SpectroRadiome- ter (MISR) and sub-orbital measurements from the 2006 INTEX-B/MILAGRO field campaign, in this study we ex- plore MISR’s ability to map different aerosol air mass types over the Mexico City metropolitan area. The aerosol air mass distinctions are based on shape, size and single scattering albedo retrievals from the MISR Research Aerosol Retrieval algorithm. In this region, the research algorithm identifies dust-dominated aerosol mixtures based on non-spherical par- ticle shape, whereas spherical biomass burning and urban pollution particles are distinguished by particle size. Two dis- tinct aerosol air mass types based on retrieved particle mi- crophysical properties, and four spatially distributed aerosol air masses, are identified in the MISR data on 6 March 2006. The aerosol air mass type identification results are sup- ported by coincident, airborne high-spectral-resolution lidar (HSRL) measurements. Aerosol optical depth (AOD) gradi- ents are also consistent between the MISR and sub-orbital measurements, but particles having single-scattering albedo of ≈ 0.7 at 558 nm must be included in the retrieval algorithm to produce good absolute AOD comparisons over pollution- dominated aerosol air masses. The MISR standard V22 AOD product, at 17.6 km resolution, captures the observed AOD gradients qualitatively, but retrievals at this coarse spatial scale and with limited spherical absorbing particle options underestimate AOD and do not retrieve particle properties adequately over this complex urban region. However, we demonstrate how AOD and aerosol type mapping can be accomplished with MISR data over complex urban regions, provided the retrieval is performed at sufficiently high spatial resolution, and with a rich enough set of aerosol components and mixtures. 1 Introduction Aerosols play an important role in global climate forcing through their direct and indirect effects. They also have significant regional impacts on both climate and air qual- ity (IPCC, 2007). Information on aerosol type is crucial for improving our understanding and assessment of anthro- pogenic influences of aerosols on climate. Particulate mat- ter (PM), especially particles with aerodynamic diameter < 2.5 μm, have known health impacts, such as cardiopul- monary diseases (Schwartz and Marcus, 1990; Saldiva et al., 1995; Krewski et al., 2000). More generally, aerosol size in- formation is of value for particulate matter air quality assess- ment. The spatial and temporal distribution of aerosol mi- crophysical and optical properties is heterogeneous in na- ture and is caused by the wide variety of aerosol sources around the globe and relatively short atmospheric lifetime. In urban regions such as Mexico City, aerosols originate most commonly from industrial and domestic emissions, biomass burning, local transportation, and local wind-driven dust (Moffet et al., 2008; Stone et al., 2008; Aiken et al., 2010). Aerosol sources and aerosol types can vary on short spatial scales (∼ few km) in this region. Air quality stan- dards are frequently violated by high PM concentrations in the Mexico City area (Molina and Molina, 2004), and the aerosols also have the potential to affect the air quality and Published by Copernicus Publications on behalf of the European Geosciences Union.
Transcript of Aerosol airmass type mapping over the Urban Mexico City region ...

Atmos. Chem. Phys., 13, 9525–9541, 2013www.atmos-chem-phys.net/13/9525/2013/doi:10.5194/acp-13-9525-2013© Author(s) 2013. CC Attribution 3.0 License.
Atmospheric Chemistry
and PhysicsO
pen Access
Aerosol airmass type mapping over the Urban Mexico City regionfrom space-based multi-angle imaging
F. Patadia1,2, R. A. Kahn2, J. A. Limbacher2,3, S. P. Burton4, R. A. Ferrare4, C. A. Hostetler4, and J. W. Hair4
1GESTAR, Morgan State University, Baltimore, MD 21251, USA2Climate & Radiation Laboratory, NASA Goddard Space Flight Center, Greenbelt, MD 20771, USA3Science Systems and Applications, Inc., Lanham, MD 20706, USA4NASA Langley Research Center, Hampton VA, 23681, USA
Correspondence to:F. Patadia ([email protected])
Received: 6 January 2013 – Published in Atmos. Chem. Phys. Discuss.: 22 March 2013Revised: 30 July 2013 – Accepted: 31 July 2013 – Published: 27 September 2013
Abstract. Using Multi-angle Imaging SpectroRadiome-ter (MISR) and sub-orbital measurements from the 2006INTEX-B/MILAGRO field campaign, in this study we ex-plore MISR’s ability to map different aerosol air mass typesover the Mexico City metropolitan area. The aerosol air massdistinctions are based on shape, size and single scatteringalbedo retrievals from the MISR Research Aerosol Retrievalalgorithm. In this region, the research algorithm identifiesdust-dominated aerosol mixtures based on non-spherical par-ticle shape, whereas spherical biomass burning and urbanpollution particles are distinguished by particle size. Two dis-tinct aerosol air mass types based on retrieved particle mi-crophysical properties, and four spatially distributed aerosolair masses, are identified in the MISR data on 6 March2006. The aerosol air mass type identification results are sup-ported by coincident, airborne high-spectral-resolution lidar(HSRL) measurements. Aerosol optical depth (AOD) gradi-ents are also consistent between the MISR and sub-orbitalmeasurements, but particles having single-scattering albedoof ≈ 0.7 at 558 nm must be included in the retrieval algorithmto produce good absolute AOD comparisons over pollution-dominated aerosol air masses. The MISR standard V22 AODproduct, at 17.6 km resolution, captures the observed AODgradients qualitatively, but retrievals at this coarse spatialscale and with limited spherical absorbing particle optionsunderestimate AOD and do not retrieve particle propertiesadequately over this complex urban region. However, wedemonstrate how AOD and aerosol type mapping can beaccomplished with MISR data over complex urban regions,provided the retrieval is performed at sufficiently high spatial
resolution, and with a rich enough set of aerosol componentsand mixtures.
1 Introduction
Aerosols play an important role in global climate forcingthrough their direct and indirect effects. They also havesignificant regional impacts on both climate and air qual-ity (IPCC, 2007). Information on aerosol type is crucialfor improving our understanding and assessment of anthro-pogenic influences of aerosols on climate. Particulate mat-ter (PM), especially particles with aerodynamic diameter< 2.5 µm, have known health impacts, such as cardiopul-monary diseases (Schwartz and Marcus, 1990; Saldiva et al.,1995; Krewski et al., 2000). More generally, aerosol size in-formation is of value for particulate matter air quality assess-ment. The spatial and temporal distribution of aerosol mi-crophysical and optical properties is heterogeneous in na-ture and is caused by the wide variety of aerosol sourcesaround the globe and relatively short atmospheric lifetime.In urban regions such as Mexico City, aerosols originatemost commonly from industrial and domestic emissions,biomass burning, local transportation, and local wind-drivendust (Moffet et al., 2008; Stone et al., 2008; Aiken et al.,2010). Aerosol sources and aerosol types can vary on shortspatial scales (∼ few km) in this region. Air quality stan-dards are frequently violated by high PM concentrations inthe Mexico City area (Molina and Molina, 2004), and theaerosols also have the potential to affect the air quality and
Published by Copernicus Publications on behalf of the European Geosciences Union.

9526 F. Patadia et al.: Aerosol airmass type mapping over the Urban Mexico City
climate of surrounding areas. For example, during the dryseason, regional winds can transport aerosols from Mexicoto the southeast United States (Wang et al., 2006; Voss etal., 2010). The study of aerosols therefore warrants contin-uous synoptic-scale monitoring, which can best be achievedthrough satellite measurements.
Although satellites provide global monitoring of aerosoloptical depth (AOD), few space-borne sensors have the ca-pability to distinguish different aerosol types. The Multi-angle Imaging SpectroRadiometer (MISR) aboard the Terrasatellite is one instrument that can retrieve some informa-tion about aerosol shape, size and single scattering albedo(SSA) under good retrieval conditions (Kahn et al., 2005,2010). Particle type represents a constraint on particle ori-gin and composition, and can contribute to mapping aerosolevolution and transport. Under good retrieval conditions anddepending on the aerosol type, the Version 22 MISR Stan-dard Aerosol Retrieval algorithm can distinguish two or threeaerosol size groupings, about two SSA categories (absorbingvs. non-absorbing) and spherical vs. non-spherical particles.Over urban areas, Kahn et al. (2010) showed with MISR datathat the aerosols are localized and vary over small spatialscales. This suggests the necessity for high-resolution AODretrievals over urban areas.
Comparisons of satellite aerosol property retrievals againstsuborbital measurements, such as those collected during fieldcampaigns, provide unique opportunities to refine and assessthe quality of the satellite retrievals. Using a combination ofMISR standard aerosol retrievals (Martonchik et al., 1998,2009) and MISR research algorithm retrievals (Kahn et al.,2001; Kahn and Limbacher 2012), along with ground andaircraft data from the Intercontinental Chemistry TransportExperiment-B (INTEX-B) field campaign, we analyze MISRaerosol retrievals in detail over the Mexico City area in thisstudy. Although the MISR operational algorithm attempts toretrieve aerosol properties globally, and computational con-straints limit the range of aerosol models that can be consid-ered, the research algorithm allows us to explore the infor-mation content of the MISR data for a much broader rangeof particle types, and at significantly higher spatial resolutionfor this application.
Our validation data comes from the host of instrumentsthat obtained aerosol physical and optical property mea-surements during the INTEX-B field campaign. Our studyadds information about the performance of MISR’s Standardaerosol retrieval algorithm to the existing literature, and alsouses the satellite data to map AOD and aerosol type overthe Mexico City Metropolitan area (MCMA) in more detailwith the MISR research algorithm, providing regional con-text for the aerosol measurements made by multiple, subor-bital sensors. We focus on identifying different aerosol typesin the complex Mexico City urban setting, and on mappingAOD gradients and aerosol air mass types to the extent pos-sible, using MISR data in the MCMA study region. Pre-vious studies relating to MISR aerosol-type sensitivity fo-
cused on biomass burning and dust-dominated regions (Chenet al., 2008; Kalashnikova and Kahn, 2006; Kahn et al.,2009a), and locations affected by thin cirrus (Pierce et al.,2010), whereas this study focuses on the aerosols over theurban Mexico City basin. The paper is organized as follows:Sect. 2 briefly describes the datasets used, Sect. 3 discussesthe sub-orbital constraints on aerosol properties for our studydays, results from MISR research algorithm are discussed inSect. 4, Sect. 5 presents notes on the sensitivity of MISR re-trievals over our study area and a summary of this study isgiven in Sect. 6.
2 Study area and data used
The Mexico City Metropolitan area, consisting of the heavilypopulated Mexico City basin, is our study region (see Fig. 1).Mexico City is one of the world’s largest megacities, and hasundergone rapid urban development. We analyze data for twogolden days, 6 and 15 March 2006, defined as days duringwhich (1) MISR observations were made over the study re-gion, (2) coincident ground and air observations are avail-able, and (3) the key observational requirements of relativelycloud-free conditions and the presence of aerosols from dif-ferent sources are met. The ground-based and aircraft dataused in this study are described briefly in this section, alongwith the Version 22 MISR Level 2 standard aerosol product.
2.1 Ground-based and aircraft measurements
During the field campaign, Aerosol Robotic Network(AERONET) CIMEL sun photometers were deployed at siteslabeled as T0, T1 in Fig. 1, and a third at Tampico, about500 km northeast of Mexico City (not shown), and five Mi-crotops II sun photometers were deployed, one at each of theHidalgo, UNAM, Corena, TEC, and UAMI sites (de AlmeidaCastanho et al., 2007; Molina et al., 2008), also shown inFig. 1. The AERONET is a global, ground-based network ofwell-calibrated sun photometers that measure spectral AODat 340, 380, 440, 500, 670, 870, 1020 and 1640 nm with anaccuracy of about±0.015 (Holben et al., 1998, 2001; Eck etal., 1999). AERONET also retrieves other column-effectiveaerosol properties, such as size distribution, refractive in-dex, single-scattering albedo (SSA), asymmetry parameter(g) and phase function, with varying frequency and degreesof accuracy (Dubovik and King, 2000). We use version-2level-2 AOD and Angstrom Exponent (AE) data from the T0,T1 and Tampico stations for the two golden study days. TheMicrotops II are handheld sun photometers that measure so-lar radiance at five spectral wavelengths and provide AOD towithin ±0.03 (Ichoku et al., 2002). We use the AOD at vis-ible wavelengths from all five ground-based Microtops sitesto evaluate the corresponding values from both the MISR L2aerosol product and the MISR research algorithm. For eachground-based site, Table S1 summarizes all the available
Atmos. Chem. Phys., 13, 9525–9541, 2013 www.atmos-chem-phys.net/13/9525/2013/

F. Patadia et al.: Aerosol airmass type mapping over the Urban Mexico City 9527
70˚aft
Nadir
70˚ fwd Mexico City
MISR L1B Image from March 06, 2006 Orbit 33062 Path 26 Block 75
~100 km
~6
0 k
m
(a)
Figure 1a
70˚aft
Nadir
70˚ fwd Mexico City
MISR L1B Image from March 15, 2006 Orbit 33193 Path 25 Block 75
~100 km
~6
0 k
m
(b)
Figure 1b Fig. 1. (a)Nadir, 70◦ forward and 70◦ aft ward view of Mexico Cityfrom MISR (L1B RGB image) on 6 March 2006. Overlaid are loca-tions of ground-based instruments and the J31 (pink) and B200 (red)flight tracks (bottom right image). Names of the ground based sta-tions are indicated in the Figure. These also include the AERONETstations at supersites T0 and T1. The 70◦ forward view image showsfires burning at atleast 2 different locations on the mountains to theeast of Mexico City and the transport of smoke from these fires overthe MCMA study area.(b) Same as(a), except, it is for 15 March2006. More burning activity can be seen on this day (see top rightimage) compared to(a) for 6 March 2006. Also, notice the presenceof clouds around T0 supersite (top right image) and around centralMexico City (bottom right image).
ground and aircraft instruments, the aerosol properties used,geographic location and the availability of different observa-tions on 6 and 15 March 2006.
During the MILAGRO/INTEX-B field campaign, eight in-strumented research aircraft from the United States mademeasurements. Details on the principal airborne platformsthat participated in the INTEX-B campaign and the scientificpayloads on each aircraft can be found in Singh et al. (2009)and Molina et al. (2010). Rogers et al. (2009) describe theHigh Spectral Resolution Lidar (HSRL) carried by the B200aircraft. Only the J-31 and B200 aircraft acquired coinci-dent aerosol property measurements on both our case studydays. For these days, we use primarily the vertical profiles ofaerosol extinction, backscatter and depolarization, along with
aerosol classification products, from the HSRL onboard theB200 to evaluate aerosol retrievals from the MISR standardand research algorithms.
2.2 The MISR L2 aerosol product
The Multi-angle Imaging SpectroRadiometer (MISR) is onboard Terra, one of the NASA Earth Observing System(EOS) of satellites. Terra was launched on 18 December1999 into a sun-synchronous orbit at an altitude of 704 km,and has an equatorial crossing time of 10:30 a.m. LT (northto south). MISR images earth in four spectral bands centeredat 446, 558, 672, 867 nm, and has nine push-broom camerasviewing at nine different angles, 0,±26.1,±45.6,±60.0, and±70.5 degrees, covering the nadir, forward, and aft directionsalong the line-of-flight. The MISR level 2 aerosol data prod-uct (MIL2ASAE) contains: (1) aerosol optical depth (AOD)in 4 spectral channels, (2) fraction of AOD for three differ-ent particle size ranges, (3) fraction AOD assigned to non-spherical particles, (4) spectral single-scattering albedo, (5)angstrom exponent, other parameters related to aerosol re-trieval quality, and geographical information. In this paper,we use the MIL2ASAE Version 22 data product. The L2aerosol optical depth is reported at 17.6×17.6 km resolution.A detailed description of the MISR aerosol retrieval is givenin Martonchik et al. (1998, 2009) and Kahn et al. (2009b).
Validation of MISR AOD (558 nm) against AERONETshows that about 70–75 % of MISR AOD retrievals fallwithin 0.05 or 20 % of AERONET AOD and about50–55 % are within 0.03 or 10 % of AERONET AODfor globally distributed sites (Kahn et al., 2010). TheAOD is designated as Stage 3 validated, whereas otheraerosol properties such as SSA, AE and fractionalAOD are Stage 2 validated, as described in the MISRData Quality Statement distributed with the data prod-ucts (http://eosweb.larc.nasa.gov/PRODOCS/misr/Quality_Summaries/misr_qual_stmts_new.html). The MISR researchalgorithm used in this study is described in Sect. 3.3.
3 Suborbital constraints on aerosol properties for theMISR golden days
Figure 1a shows the MISR L1B RGB images (Nadir, 70◦
Forward and 70◦ Aftward cameras) from 6 March 2006 forour study region. The B200 flight track (with the HSRL in-strument) for the same day is superposed as a red line on the70◦ forward camera image. The J31 flight track is shown asa pink line on this figure, as this aircraft carried the AATS14 instrument (Redemann et al., 2009), from which a fewmeasurements coincident with the MISR overpass were alsoobtained. The key ground-based sites are also marked on thesame image. Figure 1b is similar to Fig. 1a, except it is for 15March 2006. In the following section, we use the data fromall these ground-based and airborne instruments to assess
www.atmos-chem-phys.net/13/9525/2013/ Atmos. Chem. Phys., 13, 9525–9541, 2013
9528 F. Patadia et al.: Aerosol airmass type mapping over the Urban Mexico City
aerosol characteristics, and spatial and temporal variability,on the two case study days. These results are then used tovalidate and test the limits of the MISR retrievals in the sub-sequent section. AOD from the J31 and the ground-based in-struments used in this study are interpolated to MISR mid-visible wavelength (558 nm) using the Ångström formula,and is reported at 558 nm throughout this paper.
3.1 Suborbital constraints on the aerosol environmentfor 6 March 2006
On 6 March 2006, AOD is available over four of the Mi-crotops ground stations and over three AERONET stations(Tables S1b and S1c). In Fig. 2, the lines in different col-ors depict the AOD variations over different ground stations(mapped in Fig. 1) in the field campaign area. Aerosol opti-cal depth (Fig. 2a) shows diurnal variation with average AOD(558 nm) of 0.1 in the forenoon (16:00 UTC) and∼ 0.4 in theafternoon hours (by 21:00 UTC) over central Mexico City.Lower AOD observations spaced about 30 km apart at theT1 and Tampico sites to the northeast of Mexico City sug-gest gradients in AOD in the Mexico City basin. From theMISR RGB image for 6 March (Fig. 1a), we find at least twobiomass-burning fires, one each to the northeast and south-east of Mexico City. The clockwise wind circulation (Fastet al., 2007) on this day explains the transport of aerosolsfrom the fire locations into the field campaign region, pos-sibly missing the AERONET supersites farther north at T1and Tampico. Basin scale wind pattern on this day falls intothe O3-South category (de Foy et al., 2008) that is character-ized by east–west convergence zones and southwest venting,which explains AOD pattern over the above AERONET su-persites.
We can infer the type of aerosols in the study area by an-alyzing the vertical distribution of aerosol intensive proper-ties from the HSRL measurements (Burton et al., 2012). Fig-ure 3 shows the vertical distribution of aerosol properties on6 March 2006 as measured by the HSRL instrument on B200Flight 10. The HSRL made several observations around theMexico City area from 16:75 to 17:75 UTC, and in the dis-cussion below we concentrate on this time window, as MISRpassed over the area at 17:25 UTC. The aerosol extinctionprofiles at 532 nm (Fig. 3a) show high extinction at the sur-face and at 3.5 to 5 km a.s.l. (see red colors). This shows thehigh aerosol concentrations both in the boundary layer andhigher in the atmosphere. During the MILAGRO campaign,the maximum daily mixing layer depths always reached4.2 km a.s.l. and frequently extended to 6.2 km a.s.l. (Shaw etal., 2007). Mexico City is at an elevation of∼ 2.24 km a.s.l.Figure 3b, c and d, respectively, present the aerosol extinc-tion to backscatter ratio (532 nm), aerosol wavelength depen-dence (1064 nm/532 nm) or the backscatter related Angstromexponent, and the aerosol depolarization ratio (532 nm). Theaerosol extinction to backscatter ratio (Fig. 3b) has high val-ues near the surface at some locations (e.g., see values corre-
(a)
(b)
s
s
DD
Figure 2Fig. 2. (a) Diurnal variation of AOD (558 nm) on 6 March2006, over the ground based stations (shown in Fig. 1) inMILAGRO/INTEX-B field campaign area around Mexico City.Aerosol optical depth from AERONET stations at supersites T0,T1 and Tampico are also shown.(b) Same as(a) but for 15 March2006.
sponding to 17:20–17:25 UTC). In this time window, aerosolwavelength dependence (1064/532 nm) shows a similar pat-tern (Fig. 3c) whereas the aerosol depolarization ratio is low(Fig. 3d). High extinction-to-backscatter ratio, high wave-length dependence and low depolarization values can indi-cate the presence of urban aerosol, as shown in the HSRLclassification result in Fig. 3e. On the other hand, high de-polarization values (e.g., below∼ 3 km and between 17:35–17:40 UTC in Fig. 3d) are indicative of the presence of dustparticles (see Fig. 3e) (Burton et al., 2012). Qualitative classi-fication of aerosol intensive parameters measured by HSRL(Burton et al., 2012), shown in Fig. 3e, indicates the pres-ence of three distinct aerosol types (dusty mix, smoke and ur-ban pollution particles) on 6 March. It is noteworthy that thedusty mix type identified by HSRL here is not pure dust. Thisidentification occurs when depolarization measurements in-dicate the presence of dust along with other components (par-ticularly smoke or pollution) that are not distinguishable bythe HSRL (see Burton et al., 2012 for details). Several otherstudies that analyzed the aerosol optical and chemical proper-ties during the field campaign (e.g., Marr et al., 2006; Marley
Atmos. Chem. Phys., 13, 9525–9541, 2013 www.atmos-chem-phys.net/13/9525/2013/

F. Patadia et al.: Aerosol airmass type mapping over the Urban Mexico City 9529
(a) (b)
(c) (d)
(e) (f)
Air massA1A2A3A4
Figure 3Fig. 3. HSRL observation on 6 March 2006:(a) aerosol extinction(b) aerosol extinction to back-scatter (Lidar) ratio(c) aerosol wavelengthdependence(d) aerosol depolarization ratio(e) vertical distribution of aerosol types identified by HSRL(f) AOD attributed to aerosol typesidentified by HSRL. The approximate intersections of HSRL observations with the four aerosol air masses, as identified by MISR, are markedin (e) and(f). The legend for the air mass is shown in(f). Note that air masses over some region were observed multiple times by HSRL asthe B200 aircraft circled in the study region (see Fig. 1a for B200 flight path). The elevations shown are above sea level (a.s.l.).
et al., 2007, 2009a; Stone et al., 2008; Querol et al., 2008;Corr et al., 2009; Paredes-Miranda et al., 2009; Bergstrom etal., 2010; De Foy et al., 2011) corroborate the aerosol typeresults from the HSRL and add detail, suggesting that thestudy area contained urban aerosols, including black carbonand organic matter, and mineral dust aerosols during the cam-paign period. Ground-based instruments also observed three-to-four aerosol size modes that are likely from these differentaerosol types in the study area.
3.2 Suborbital constraints on the aerosol environmentfor 15 March 2006
In contrast to 6 March, the AOD from ground stations ishigher in the study area on 15 March and there is not muchvariation in the AOD throughout the day (Fig. 2b). How-ever, similar to 6 March, a spatial AOD gradient betweencentral Mexico City and its surrounding region is observedin Fig. 2b. The lack of diurnal variation on 15 March can
be attributed to locally uniform spatial mixing of aerosolsdue to high winds (15 m s−1) associated with a cold surgeevent in the study area (Fast et al., 2007). Cold Surge eventsvent in the southwest to north to southeast direction, withless southward venting (de Foy et al., 2008). Kleinman etal. (2009) analyzed the DMA and PCASP aircraft measure-ments of aerosol size distribution and found three-to-fourmodes in MCMA on 15 March. This aerosol size distribu-tion is produced by multiple aerosol sources in the region.Moffet et al. (2008) and Stone et al. (2008) suggest that thesubmicron-mode aerosols are comprised of industrial emis-sions, biomass and biofuel burning and aged organic carbon(OC). Aiken et al. (2010) show that the dominant source ofBB OC aerosols found in the Mexico City area are from for-est fires burning in the surrounding mountains. The coarsemode was dominated by inorganic dust particles, 50 % ofwhich were coated with OC (Moffet et al., 2008). Wang etal. (2010) suggest traffic emissions, aging of aerosols, lo-cal photochemical production of secondary aerosol species
www.atmos-chem-phys.net/13/9525/2013/ Atmos. Chem. Phys., 13, 9525–9541, 2013
9530 F. Patadia et al.: Aerosol airmass type mapping over the Urban Mexico City
(a) (b)
(c) (d)
(e) (f)
Mexico City
Mexico City
NW Quadrant NW Quadrant
Figure 4
Fig. 4.HSRL observation on 15 March 2006:(a) aerosol extinction(b) aerosol extinction to back-scatter (Lidar) ratio(c) aerosol wavelengthdependence(d) aerosol depolarization ratio(e) vertical distribution of aerosol types identified by HSRL(f) AOD attributed to aerosol typesidentified by HSRL. Blue box in(e)and(f) depicts the flight path over Mexico City.
and wind-blown dust as other sources of aerosols in MCMA.Analysis of the HSRL-measured intensive aerosol propertiesover our study area between 17:05 and 17:35 UTC on thisday (Fig. 4) also shows that urban aerosols accounted fornearly 80 % (median value) of the total AOD.
Based on the analysis of aerosol properties measured byground-based and aircraft instruments on our case studydays, the aerosol types found in the study area are againcomprised of smoke, urban pollution and dust aerosols. How-ever, the meteorology of the region is different on these days,which leads to differences in the spatial and temporal distri-butions of aerosols. Wang et al. (2010) suggest that duringthe daytime, over the Mexico City area, changes in aerosolsize and composition occur over time scales of about a fewhours. Spatial gradients in AOD and size distribution mea-sured at various surface sites also suggest aerosol variabilityat small spatial scales. The selection of aerosol models forMISR research retrievals (discussed in Sect. 4) is based onpublished literature and the analysis of suborbital informa-tion on aerosol type presented in Sects. 3.1 and 3.2.
4 The MISR aerosol research retrievals with inputsfrom field campaign data
4.1 Research retrieval details
4.1.1 Research retrieval theory
In the MISR Research Aerosol Retrieval algorithm (Kahn etal., 2001; Kahn and Limbacher, 2012), the TOA radiation issimulated using a radiative transfer (RT) code developed bythe MISR Team (Martonchik et al., 1998) that is based onthe matrix operator method (Grant and Hunt, 1968). For agiven aerosol particle analog, vertical distribution, sun andviewing geometry and surface reflectance properties, the RTcode simulates the TOA radiances as would be observed bythe MISR instrument. The radiances produced by up to fourcomponent aerosol particles are then weighted by their frac-tional contributions to the AOD to obtain the radiance ofthe aerosol mixture (Abdou et al., 1997). The over-land re-trievals use all four MISR wavelengths. In the present study,MISR observations are simulated over MCMA. We assume
Atmos. Chem. Phys., 13, 9525–9541, 2013 www.atmos-chem-phys.net/13/9525/2013/

F. Patadia et al.: Aerosol airmass type mapping over the Urban Mexico City 9531
a Rayleigh-scattering atmosphere with a surface pressure of776 mb (Mexico City is at an elevation of∼ 2200 m), anda standard mid-latitude temperature profile. The ozone abun-dance in the study area was obtained from Ozone MonitoringInstrument (OMI) data (Ahmad et al., 2003). The aerosols areassumed to be concentrated in a near-surface layer, except formedium-mode dust aerosols. The surface reflectance param-eters are prescribed from the MISR Land Surface Product ateach of the four MISR wavelengths, based on an analysis ofthe MISR surface retrieval record on low-AOD days, for thesame viewing geometry and location of interest. In this case,the atmosphere is relatively cloud-free, the surface is reason-ably well characterized, and the AOD is sufficient to providea good atmospheric signal. These are reasonably good atmo-spheric conditions for remote-sensing aerosol retrievals.
The TOA simulated radiances are converted to TOA re-flectance and compared to the MISR observed reflectanceto determine the AOD and aerosol type. The agreement be-tween simulated and observed TOA reflectance at all fourwavelengths and at 9 viewing angles is assessed using threedifferent Chi-Squared (χ2
abs, χ2geom, χ2
spec,) tests (Kahn et al.,
2001). The largest of (χ2abs, χ2
geom, χ2spec) for a given mixture
is designated asχ2max−3. The comparisons are made for all
possible combinations of aerosol particles in different pro-portions (from 0 to 100 % in increments of 5 %) within eachfour-component mixing group. In our study, the AOD foreach combination is varied from 0.0 to 1.0, in steps of 0.05.We examined a hierarchy of relative and absolute acceptancecriteria applied to ChiMin (the minimum value ofχ2
max−3for all mixtures in a retrieval region), and looked for con-vergence toward a consistent result as more stringent crite-ria were applied. Kahn and Limbacher (2012) used similarcriteria and provide further details on this approach. Unlessspecified otherwise, values shown in this paper are basedon those retrievals meeting theχ2
max−3 < ChiMin+ 0.1 cri-terion. For a given HR region, the mean values of aerosolproperties (e.g., total AOD, small/medium/large mode andspherical/non-spherical AOD fractions, SSA, AE) from allmixtures that satisfy ourχ2
max−3 acceptance criteria are re-ported as successful retrievals and used in our analysis.
4.1.2 Aerosol components and mixing groups
Table 1 presents the four-component aerosol mixing groups.Table S2 lists the aerosol component particles that definethe aerosol mixtures used in this study. Each of the 45 dis-tinct aerosol components in Table S2 is defined by spec-tral real and imaginary indices of refraction and a lognormalsize distribution, given as the particle geometric mean radius(rpg,N) and geometric standard deviation (σg). The opticalproperties for each spherical component are derived using astandard Mie scattering code, with the exception of the dustgrains. The component particles represent biomass burning,urban pollution and dust aerosol particles that span five par-ticles size ranges (very very small (VVS), very small (VS),
small (S), medium (M) and large (L) particles) and four sin-gle scattering albedo ranges (very absorbing (VA), absorb-ing (A), less absorbing (LA) and weakly absorbing (WA)particles). For biomass burning particle analogs in Table S2,the sizes are: VVS (rpg,N = 0.04 µm), VS (rpg,N = 0.07 µm),S (rpg,N = 0.13 µm) and S2 (rpg,N = 0.16 µm) and the mid-visible SSA values are: A (ωo558= 0.84), LA (ωo558= 0.90)and WA (ωo558= 0.94). The sizes of the other spherical par-ticle types that represent both pollution and biomass burningparticle analogs (Table S2) are: VVS (rpg,N = 0.06 µm), VS(rpg,N = 0.12 µm), S (rpg,N = 0.24 µm), M (rpg,N = 0.24 µm)and L (rpg,N = 0.5 µm) and the mid-visible SSA valuesare: VA (ωo558= 0.8), A (ωo558= 0.85), LA (ωo558= 0.9)and WA (ωo558= 0.95). Strong spectral dependence ofaerosol absorption defines the “steep” particles that repre-sent biomass burning aerosols, whereas the “flat” particlesthat represent pollution aerosols have spectrally independentabsorption (Bond and Bergstrom, 2006).
Table 1 lists the 23 mixing groups used in this study. Thesemixtures are created to test the ability of the MISR algorithmto distinguish between sizes (M1–M4), steep and flat SSAspectral slope (M6, M7, M21), spherical and non-spherical(M10–M13), absorbing and non-absorbing (M14–M17) par-ticles (Kahn et al., 2001). Based on the targeted tests, themixing groups are collected into 10 larger groupings listed incolumn 1 of Table 1. The last column in Table 1 provides adetailed description of the objective for each grouping. Themixing groups are created such that they span the range ofsizes and optical properties of biomass burning, pollutionand dust particles that were found in the MCMA during theINTEX-B field campaign.
4.1.3 Research retrieval regions
Figure 5 shows the area over which MISR research re-trievals are performed in this study for 6 March. Thereare more than 400 individual retrieval regions in the re-trieval area in Fig. 5. Research retrievals are performed over825 m× 825 m areas (3× 3 275 m MISR Local Mode radi-ance pixels) and this defines the retrieval regions in our case.We call these “high-resolution” retrievals when compared tothe 17.6 km× 17.6 km retrieval regions of the L2 MISR Stan-dard aerosol product, and refer to them as HR regions in thepaper. Note that the MISR instrument can be configured toprovide high-resolution (275×275 m) images in all 36 chan-nels for targets and observation times selected several weeksin advance of the overpass. This capability is referred to asLocal Mode. In the default Global Mode, all nadir camerasand all off nadir cameras for Red channels (Band 3) are keptat high resolution (275 m) whereas observations in the re-maining 24 cameras are down-sampled onboard to 1.1 km(http://www-misr.jpl.nasa.gov/getData/localMode/). The lo-cations of ground-based Microtops and AERONET stationsare indicated as small white circles in Fig. 5. If ground ob-servations of AOD are available at satellite overpass time,
www.atmos-chem-phys.net/13/9525/2013/ Atmos. Chem. Phys., 13, 9525–9541, 2013

9532 F. Patadia et al.: Aerosol airmass type mapping over the Urban Mexico City
Table 1.Aerosol Mixing Groups.
Groups MixingGroups
Component1∗ Component2 Component3 Component4 Mixture Description
Group 1
M1 p19 p29 p33 p37 These 4 mixtures have particles with a constant SSA butdifferent particles sizes. This group of mixtures (M1-M4) tests the sensitivity of MISR algorithm to particlesize for our study and the most likely SSA in the studyarea. The sizes are VVS, VS, S, M in the 4 mixturesand the SSA of each mixture is LA, WA, LA, and Non-absorbing respectively.
M2 p16 p20 p30 p34M3 p2 p4 p7 p10M4 p38 p39 p40 p41
Group 2 M5 p31 p32 p35 p36 This mixture of VA and A type of S and M steep parti-cles tests if a combination of size and SSA yields betterresults compared to above group of mixtures with con-stant SSA
Group 3 M6 p17 p18 p19 p20 Mixture of Flat Small or Medium particles with differ-ent SSA is used to test the sensitivity to distinguish pol-lution from smoke particles
M7 p21 p22 p23 p24
Group 4 M8 p13 p27 p29 p15 These mixing groups test the likely SSA of parti-cle sizes that produce acceptable results. Sensitivity tosteep and flat particles is also tested.
M9 p14 p20 p29 p33
Group 5 M10 p18 p22 p32 p43 Same as the above group of mixtures but with a dustcomponent (2 different sizes) added to the flat and steepparticles of different sizes (S, M).
M11 p19 p33 p45 –
Group 6 M12 p19 p33 p37 p43 This group tests if dust can be replaced by a non-absorbing medium sized particle. M12 consists of dustand M13 has a medium non-absorbing particle.
M13 p25 p29 p33 p41
Group 7 M14 p12 p15 p33 p41 This group of mixtures consists of particles with differ-ent sizes and SSA and tests MISR algorithm’s sensitiv-ity to absorbing vs non-absorbing particles.
M15 p25 p29 p42 p43M16 p19 p40 p41 p42M17 p33 p37 p42 p43
Group 8 M18 p2 p4 p7 p9 This group of mixtures consists of biomass burning(BB) particles used by Chen et al. (2008). They areused to test if the retrieval algorithm favors these par-ticles over their spherical absorbing counterparts usedin groups 1–7. The sensitivity to size and SSA of BB isalso tested in this group.
M19 p2 p4 p6 p10M20 p3 p5 p8 p26
Group 9 M21 p2 p6 p11 p18 Mixture of BB and pollution like VVS and S particleswith LA and A SSA. Similar to group 3, this group teststhe algorithm’s sensitivity to distinguish pollution fromsmoke particles
Group 10 M22 p2 p9 p44 – Same as the group 5 but BB particles.M23 p1 p2 p7 p43
∗ The aerosol particle components (p1–p45) in columns 3–6 are described in Table S2.
their locations are indicated as red circles in Figs. 5a and 6afor 6 and 15 March, respectively. The HR region closest tothe ground station having a valid AOD observation is indi-cated by a red-black circled dot in Figs. 5a and 6a. HSRLAOD along the flight track is also shown for 6 and 15 Marchin Figs. 5a and 6a, respectively. AOD comparisons are tabu-lated in Table 2. The following section discusses the MISRresearch retrieval results.
4.2 MISR research retrievals over Mexico City Basin on6 March 2006
An analysis of the AOD and aerosol properties (shape, size,and SSA) from the MISR research retrieval algorithm, iden-tifying aerosol air mass type, is presented here. Unless spec-ified otherwise, the aerosol air mass and associated prop-erties refer to MISR Research Algorithm retrievals. Fig-ure 5a shows the spatial distribution of 558 nm AOD from theMISR research algorithm, overlaid with 558 nm AOD fromground-based observations and 532 nm HSRL AOD. AOD
Atmos. Chem. Phys., 13, 9525–9541, 2013 www.atmos-chem-phys.net/13/9525/2013/

F. Patadia et al.: Aerosol airmass type mapping over the Urban Mexico City 9533
NE FIRE
SE FIRE
NE
SE
NW
SW
(a)
I
II
(b) (c)
A1
A2
A3
A4
A1
A2
A3
A4
A1
A2
A3
A4
A1 A2
A3
A4
(d) (e) (f)
Figure 5 Fig. 5. Aerosol properties from MISR research retrieval algorithm over MCMA for 6 March 2006:(a) aerosol optical depth at 558 nm TheHSRL 532 nm AOD along the flight path is superposed in panel(a). For HSRL, black color indicates missing data.(b) Non-spherical fractionof total AOD (c) Single Scattering Albedo at 558 nm(d) fraction of AOD by 0.06 µm particles(e) fraction of AOD by 0.12 µm particles(f)fraction of AOD by 0.2–0.28 µm particles.(d, e, f) represent the small mode fraction of AOD. Distribution of large mode fraction of AOD issimilar to(b). The 4 aerosol air masses identified by MISR are shown in(c, d, e, f).
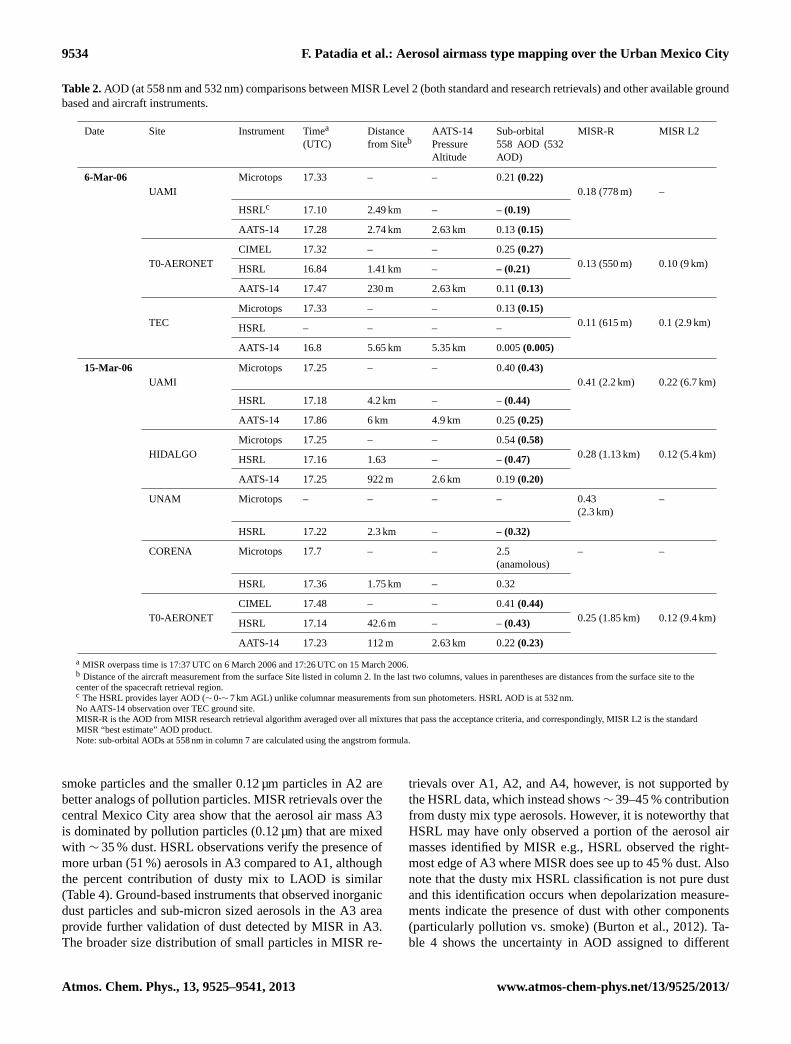
from available coincident measurements are tabulated in Ta-ble 2. MISR AOD agrees to within 0.03 of Microtops AODat UAMI and TEC. However, MISR AOD (0.13) is abouthalf that at the T0 supersite (0.25) in the central city. Giventhe low AOD (0.25) condition on this day, MISR researchretrievals show ambiguity in the choice of particle size andSSA over the T0 site. This results in a large number of ac-ceptable AOD retrievals that range from 0.05–0.3, the meanof which is 0.13. The higher AOD retrievals, however, cor-respond to mixtures comprising of VVS, VS and S particlesand lower SSA (≤ 0.80). HSRL AODs (532 nm) are within0.05 of all ground-based AODs (532 nm shown in bold inTable 2). Note that the HSRL extinction measurement startsat 300 m above ground level. The extinction from 300 m toground is extrapolated assuming constant mixing ratio in theboundary layer, and then used to calculate the total columnAOD. In this paper (e.g., in Table 2) we call this the HSRLAOD. AOD is also calculated at each of the vertical layers(30 m) using HSRL extinction measurements. We call the in-tegrated layer AOD (without the AOD extrapolated below300 m) as LAOD in this paper. The LAOD is apportionedinto different aerosol classes.
Figure 5b shows the spatial distribution of the fraction ofnon-spherical particles in the aerosol mixtures that producesuccessful MISR AOD retrievals. The spatial distribution of
SSA and fraction of AOD attributable to 0.06, 0.12 and 0.22–0.26 µm sized particles in the aerosol mixtures are shownin Fig. 5c, d, e and f, respectively. The regions marked asI and II in Fig. 5b are dominated by spherical absorbing par-ticles (analogs of smoke and pollution particles) uniformly,whereas other regions in the retrieval area consist of bothspherical and non-spherical (dust analog) particles. The otheraerosol properties (AOD, SSA and sizes) are less uniform inregions I and II and elsewhere. We identify four spatiallydistributed aerosol air masses that appear to have distinctaerosol properties in the MISR retrievals and for which coin-cident HSRL observations are available for evaluation. Theseaerosol air masses are marked in Fig. 5c–f, and their char-acteristics from MISR and HSRL are tabulated in Tables 3and 4, respectively. According to MISR, aerosol air mass A1,which is downwind of the NE fires, consists predominantlyof spherical, absorbing smoke particles from biomass burn-ing. From Table 3 we see that A2, A3 and A4 are similar interms of their SSA range and the percent contribution from0.12 and 0.26 size particles, and the differences are withinthe range of measurement uncertainties. Aerosol type clas-sifications from HSRL (see Table 4) also show more smoke(∼ 55 %) in A1 and more urban pollution particles in A2,A3 and A4 (41–52 %). HSRL data imply that the prevalent0.26 µm particles observed by MISR in A1 are analogs of
www.atmos-chem-phys.net/13/9525/2013/ Atmos. Chem. Phys., 13, 9525–9541, 2013
9534 F. Patadia et al.: Aerosol airmass type mapping over the Urban Mexico City
Table 2.AOD (at 558 nm and 532 nm) comparisons between MISR Level 2 (both standard and research retrievals) and other available groundbased and aircraft instruments.
Date Site Instrument Timea
(UTC)Distancefrom Siteb
AATS-14PressureAltitude
Sub-orbital558 AOD (532AOD)
MISR-R MISR L2
6-Mar-06UAMI
Microtops 17.33 – – 0.21(0.22)0.18 (778 m) –
HSRLc 17.10 2.49 km – – (0.19)
AATS-14 17.28 2.74 km 2.63 km 0.13(0.15)
T0-AERONETCIMEL 17.32 – – 0.25(0.27)
0.13 (550 m) 0.10 (9 km)HSRL 16.84 1.41 km – – (0.21)
AATS-14 17.47 230 m 2.63 km 0.11(0.13)
TECMicrotops 17.33 – – 0.13(0.15)
0.11 (615 m) 0.1 (2.9 km)HSRL – – – –
AATS-14 16.8 5.65 km 5.35 km 0.005(0.005)
15-Mar-06UAMI
Microtops 17.25 – – 0.40(0.43)0.41 (2.2 km) 0.22 (6.7 km)
HSRL 17.18 4.2 km – –(0.44)
AATS-14 17.86 6 km 4.9 km 0.25(0.25)
HIDALGOMicrotops 17.25 – – 0.54(0.58)
0.28 (1.13 km) 0.12 (5.4 km)HSRL 17.16 1.63 – –(0.47)
AATS-14 17.25 922 m 2.6 km 0.19(0.20)
UNAM Microtops – – – – 0.43(2.3 km)
–
HSRL 17.22 2.3 km – – (0.32)
CORENA Microtops 17.7 – – 2.5(anamolous)
– –
HSRL 17.36 1.75 km – 0.32
T0-AERONETCIMEL 17.48 – – 0.41(0.44)
0.25 (1.85 km) 0.12 (9.4 km)HSRL 17.14 42.6 m – –(0.43)
AATS-14 17.23 112 m 2.63 km 0.22(0.23)
a MISR overpass time is 17:37 UTC on 6 March 2006 and 17:26 UTC on 15 March 2006.b Distance of the aircraft measurement from the surface Site listed in column 2. In the last two columns, values in parentheses are distances from the surface site to thecenter of the spacecraft retrieval region.c The HSRL provides layer AOD (∼ 0-∼ 7 km AGL) unlike columnar measurements from sun photometers. HSRL AOD is at 532 nm.No AATS-14 observation over TEC ground site.MISR-R is the AOD from MISR research retrieval algorithm averaged over all mixtures that pass the acceptance criteria, and correspondingly, MISR L2 is the standardMISR “best estimate” AOD product.Note: sub-orbital AODs at 558 nm in column 7 are calculated using the angstrom formula.
smoke particles and the smaller 0.12 µm particles in A2 arebetter analogs of pollution particles. MISR retrievals over thecentral Mexico City area show that the aerosol air mass A3is dominated by pollution particles (0.12 µm) that are mixedwith ∼ 35 % dust. HSRL observations verify the presence ofmore urban (51 %) aerosols in A3 compared to A1, althoughthe percent contribution of dusty mix to LAOD is similar(Table 4). Ground-based instruments that observed inorganicdust particles and sub-micron sized aerosols in the A3 areaprovide further validation of dust detected by MISR in A3.The broader size distribution of small particles in MISR re-
trievals over A1, A2, and A4, however, is not supported bythe HSRL data, which instead shows∼ 39–45 % contributionfrom dusty mix type aerosols. However, it is noteworthy thatHSRL may have only observed a portion of the aerosol airmasses identified by MISR e.g., HSRL observed the right-most edge of A3 where MISR does see up to 45 % dust. Alsonote that the dusty mix HSRL classification is not pure dustand this identification occurs when depolarization measure-ments indicate the presence of dust with other components(particularly pollution vs. smoke) (Burton et al., 2012). Ta-ble 4 shows the uncertainty in AOD assigned to different
Atmos. Chem. Phys., 13, 9525–9541, 2013 www.atmos-chem-phys.net/13/9525/2013/

F. Patadia et al.: Aerosol airmass type mapping over the Urban Mexico City 9535
Table 3.Characteristics of aerosol air masses based on shape, size and single scattering albedo as identified from the MISR research retrievalsover the Mexico City metropolitan area.
Air Mass(size)a
Shape AOD(558 nm)
Size (reff in µm) %Contribution SSA(558 nm)
Date Range 0.06 0.12 0.22–0.26 0.57 0.75 Comment
6-Mar-06 A1(∼ 75 km2)
Spherical 0.25–0.35 < 25 10–30 30–80 – – 0.85–0.9
Region comprised of smallmode particles (reff < 0.26 µm)
A2(∼ 50 km2)
Spherical 0.1–0.25 5–35 15–50 35–45 < 20 – 0.9–0.95
Region comprised of small (reff≤ 0.26 µm) and medium (reff=0.57 µm) mode particles
A3/MCb
(∼ 35 km2)
Spherical+ Non-spherical/Dust
0.1–0.18 < 25 15–50 25–35 – 10–40 0.9–0.95
Region comprised of small (reff≤ 0.26 µm) and large (reff=0.75 µm) mode particles
A4(∼ 25 km2)
Spherical 0.1–0.18 < 25 20–40 15–35 < 30 – 0.9–0.95
Region comprised of small (reff≤ 0.26 µm) and medium (reff=0.57 µm) mode particles
15-Mar-06 NE Quad Spherical 0.2–0.45 < 25 10–50 10–45 5–55 – 0.9–1.0 Region comprised of small (reff< 0.26 µm) and medium (reff=0.57 µm) mode particles
NW Quad Spherical 0.2–0.35 5–40 5–50 10–45 < 40 – 0.9–0.95
Region comprised of small (reff≤ 0.26 µm) and medium (reff=0.57 µm) mode particles
SE Quad Spherical 0.1–0.3 15–60 < 25 < 30 < 50 – 0.88–0.95
Region comprised of small(reff ≤ 0.26 µm) and (reff< 0.26 µm)mode particlesNote that the AODs closer toMexico City are cloud contam-inated
SW Quad Spherical+ Non-spherical/Cirrus
Cloud Con-taminated
– – – – – – Cirrus clouds found in this area
a This is the approximate size of the aerosol air mass. The aerosol air mass sizes were estimated based on visual reading of the number of pixels (that fell within each airmass we identified) multiplied by size of single retrieval pixel.b MC = Mexico City.Note: numbers in bold highlight the particle sizes in each mixture that makes highest % contribution to the total AOD.
Table 4.Characteristics of aerosol air masses from HSRL data over the Mexico City metropolitan area. These air masses correspond to theair masses identified by MISR in Table 5.
Air mass HSRL-AOD Range %DUST- AOD %Smoke-AOD %Urban-AODover each air mass (Uncertainty) (Uncertainty) (Uncertainty)
A1 0.14–0.30 37 % (7 %) 55 % (10 %) 4 % (1 %)A2 0.21–0.25 45 % (19 %) 3 % (1.5 %) 52 % (22 %)A3 0.19–0.25 38 % (15 %) 10 % (4 %) 50 % (20 %)A4 0.18–0.25 39 % (9 %) 14 % (3 %) 41 % (9 %)
Note: (1) The DUST in column 3 pertains to both “dusty mix” and pure dust. The dusty mix identification occurswhen depolarization measurements indicate the presence of dust with other components (particularly pollution vs.smoke) (Burton et al., 2012). (2) Smoke pertains to both smoke and fresh smoke classes (3) % Contribution ofSmoke, Dust and Urban AOD values are weighted mean values (weighted by AOD). The percentage in bracketsindicate the uncertainty in %contribution for the given aerosol type. This is the uncertainty due to the fraction oftotal AOD that remains unclassified from extinction measurements below 300 m.
aerosol classes. We calculate the uncertainty value by consid-ering HSRL AOD as the total AOD instead of the LAOD; thisaccounts for unclassified near-surface AOD and provides thelower limit on the calculations. However, as this location isa source region for pollution particles, the near-surface com-ponent is likely to contain a larger fraction of such particles
than the total column. Also, note that MISR is generally notsensitive to the properties of aerosol components that con-tribute < 20 % to the total AOD (Kahn et al., 2001), which inthis case could include the dust component reported by theHSRL over A2 and A4, where MISR detects up to 20 and30 % medium sized particles but no dust.
www.atmos-chem-phys.net/13/9525/2013/ Atmos. Chem. Phys., 13, 9525–9541, 2013

9536 F. Patadia et al.: Aerosol airmass type mapping over the Urban Mexico City
NE
SE
NW
SW
(a)
(b) (c)
(e) (f)(d)NW
NE
SW SE
Figure 6Fig. 6.Aerosol properties from MISR research retrieval algorithm over MCMA on 15 March 2006:(a) aerosol optical depth at 558 nm. TheHSRL 532 nm AOD along the flight path is superposed in panel(a). For HSRL, black color indicates missing data(b) non-spherical fractionof AOD (c) Single Scattering Albedo at 558 nm(d) fraction of AOD by size 0.06 µm(e) fraction of AOD by size 0.12 µm(f) fraction of AODby size 0.26 µm.(d, e, f) represent the small mode fraction of AOD. Distribution of large mode fraction of AOD is similar to(b).
The comparison of aerosol properties from MISR againstsub-orbital HSRL observations illustrates the capability ofMISR to qualitatively distinguish aerosol air masses in theMCMA, and suggests that the relative differences in smallvs. coarse mode particles in the four aerosol air masses arerobust. From the comparisons with HSRL we find that on thisday, of the four air masses (A1–A4), MISR is able to distin-guish two air mass types in the study region based solely onparticle microphysical properties – one dominated by smokeparticles (A1) and the others that are mixtures of smoke, pol-lution and/or dust particles (A2–A4). And as expected, theaerosol type information from MISR, although significant,must be viewed as qualitative.
4.3 MISR research retrievals over Mexico City basin on15 March 2006
Figure 6a shows the mid-visible AOD retrieved by the MISRresearch algorithm in our study region on 15 March 2006.AOD ranges between 0.15 and 0.5, higher than that on 6March (Fig. 5a). The MISR L1B true-color image in Fig. 1bshows more smoke from fires surrounding the Mexico Citybasin on this day than on 6 March (compare Fig. 1a, b),and a mixture of clouds and fires in the western half of thestudy region. Note that MISR cannot perform aerosol re-trievals over cloud-covered regions. A gradient can be seen
in both AOD and MISR particle property maps in Fig. 6. Inthe northern half of the figure, there is an east–west gra-dient in the AOD that is likely due to varying concentra-tions of biomass burning aerosols from the fires on the NEside of the Mexico City basin. Northerly winds as high as15 m s−1 were observed in the area on 15 March (Fast et al.,2007). Gradients in AOD in the SE quadrant also corrobo-rate the gradient in smoke concentration seen qualitativelyin Fig. 1b. Where available, the retrieved AOD comparisonto ground-based AOD is shown in Fig. 6a (red circles). AtMISR overpass time (17:26 UTC), a gradient in AOD is alsoreflected in the surface measurements, with higher AOD atHidalgo (0.54) than at the T0 (0.4) or UAMI (0.41) sites. Hi-dalgo is closer to Mexico City, whereas T0 is to the north,and UAMI is to the southeast, as shown in Fig. 6, providingqualitative verification of the MISR-retrieved AOD pattern.Near-coincident HSRL observations provide further valida-tion, with higher AOD (0.47) in the city (near Hidalgo) andlower AOD outside the city (AOD= 0.43 at T0 and 0.32 atTEC and UNAM/Corena) (see Table 2 for AOD compar-isons). At UAMI, the MISR AOD (0.41) is in good agree-ment with the Microtops and HSRL AODs (0.40, 0.44 re-spectively), whereas at other ground sites, MISR AOD iscloud contaminated (see Fig. 1b. Notice the differences inthe locations of clouds relative to the surface in the forward
Atmos. Chem. Phys., 13, 9525–9541, 2013 www.atmos-chem-phys.net/13/9525/2013/

F. Patadia et al.: Aerosol airmass type mapping over the Urban Mexico City 9537
and aft camera views that resulted in the cloud-contaminatedretrievals).
Returning to Fig. 6b, the fraction AOD non-spherical ishigher (50–80 %) around central Mexico City and lower(generally < 10 %) elsewhere. This is due to the presence ofthe thin patchy cirrus clouds at high altitudes (> 9.5 km a.s.l.)in the region, as confirmed by the J31 and B200 aircraft fieldcatalogs (http://catalog.eol.ucar.edu/cgi-bin/milagro/report/index). Examination of cirrus reflectance from MODIS alsoindicates the presence of thin localized cirrus clouds over thecentral city. However, the HSRL aerosol classification in theSW quadrant indicates that urban aerosols made the great-est contribution to AOD over the city, whereas a mixture ofdust and urban aerosols were the dominant retrieved AODcomponents outside the city (Fig. 4). In other parts of thestudy area (NW, NE and SE quadrants), the particle proper-ties agree qualitatively with the presence of smoke, as ob-served by MISR (see Fig. 1b). The research algorithm favors∼ 50 % VVS and∼ 30 % VS sized biomass burning aerosolsin the NE quadrant. The HSRL transect to the north alsoshows > 55 % smoke in this region (classification in this re-gion not shown in Fig. 4). SSA co-varies with AOD, similarto 6 March. However, the aerosol air masses in the study areaare, in general brighter (higher SSA) on 15 March. Regionsdominated by biomass burning aerosols (e.g., NW quadrant)might have different SSA values due to the burning of dif-ferent fuel types or the presence of biomass burning aerosolsfrom different fire stages (e.g., flaming vs. smoldering) (Reiet al., 2005) on the two days. Aiken et al. (2010) mention thatthe fires were somewhat more intense in early March. Also,during the first 13 days of the field campaign (1–13 March2006) the surface conditions in MCMA were usually dry,with less than 10 % relative humidity (RH) in the afternoon.A cold surge during 14–15 March increased the RH to 40 %at the surface and 60 % at∼ 3 km (Fast et al., 2007) wheresmoke aerosols were found. Higher RH at the altitude withsmoke (3 and 4 km) can also result in hygroscopic growth ofthe aerosols, contributing to higher SSA on 15 March.
Based on the comparisons of MISR research retrievalsagainst sub-orbital data, we confirm that MISR can distin-guish aerosol air masses qualitatively, based on shape, sizeand SSA. From MISR research retrievals, the following con-clusions are drawn about the two case study days. We see dif-ferent aerosol air masses on each day. On both days, spher-ical absorbing particles dominate over non-absorbing ones,although there is regional variation in this. The size of thedominant absorbing (SSA= 0.85) particles is smaller (reff =
0.06 µm) on 6 March compared to 15 March (reff = 0.12 µm).Except for the central Mexico City area (SW quadrant), thereis more dust on 6 March relative to 15 March. This resultis confirmed by HSRL observations. Drier conditions on 6March favor the presence of more dust. Spherical absorbingparticles having steeply sloping spectral absorption (smoke-like) are favored more than their flat (pollution-like) counter-parts on both the days. Smoke and pollution particles are dis-
tinguished based on particle size. SSA from both AERONETand MISR research retrievals suggest that, on an average, theaerosol air masses are brighter (higher SSA) on 15 March.
4.4 Analysis of MISR L2 standard aerosol product overour study region
The MISR L2 standard AOD in the MCMA (our study area)was higher than the surrounding regions on both 6 and 15March 2006. AOD in MCMA is higher on 15 March than on6 March, all in agreement with sub-orbital and research re-trievals. However, the AOD on both days is lower than all thein-situ observations used in this study. AOD was not retrievedover a few regions within MCMA that resulted in either fillvalues (from neighboring retrievals) or no reported AOD val-ues. We further investigated the performance of the MISRstandard aerosol retrieval algorithm over MCMA by look-ing closely at the retrieval diagnostic parameters and indica-tors reported for each 17.6× 17.6 km retrieval region in theL2 Aerosol product. Successful aerosol retrievals identifiedprimarily large and small/medium spherical non-absorbingparticle mixtures. Mixtures containing dust were selectedin few other instances. In one instance, the standard algo-rithm picked dust mixtures on 15 March in regions wherethin cirrus clouds were present. When the retrieved AODwas very low (< 0.05), a large number of successful mix-tures (> 50) contributed towards the regional best estimateAOD. As discussed by Kahn et al. (2010), we find that in theurban environment of Mexico City, the standard MISR al-gorithm tends to pick mixtures with high single scatteringalbedo (SSA558 = 1.0), resulting in an underestimation ofAOD. The Regional Class Indicator flag shows that retrievalswere not attempted over regions flagged as topographicallycomplex. Retrieval flags (RetrAppMask) for regions with noL2 AOD retrievals also show that over most of these regions,retrievals failed due to poor correlation of the equivalent re-flectance spatial distribution from one MISR view angle toanother. Poor angle-to-angle correlation can result from fea-tures such a complex terrain, aerosol plume edges, cloudedges, cloud shadows, and unscreened glint regions. We fur-ther investigated the diagnostic flags for six months of MISRL2 data for the same spacecraft paths (P026, P025) as the 6and 15 March observations, and find the above patterns tohold true for all L2 retrievals over our study region havingsimilar viewing geometry. The feasibility of retrieving AODusing the research retrieval algorithm and better agreementof AOD and aerosol properties with validation data indicatesthat the heterogeneity in aerosol particle type and aerosolloading over the 17.6×17.6 km retrieval regions of the MISRstandard algorithm, the presence of very dark pollution parti-cles (SSA558 = 0.7) in MCMA, complex topography and thevertical distribution of aerosols (smoke at∼ 4 km) limit theretrieval results from the MISR standard algorithm. This sug-gests the need to include darker pollution-like particles and
www.atmos-chem-phys.net/13/9525/2013/ Atmos. Chem. Phys., 13, 9525–9541, 2013

9538 F. Patadia et al.: Aerosol airmass type mapping over the Urban Mexico City
to perform higher spatial resolution retrievals with the MISRobservations for urban regions such as Mexico City.
5 Summary and conclusions
In this study, we have assessed the ability of the MISRResearch aerosol retrieval algorithm to distinguish differentaerosol air mass types in the Mexico City Metropolitan Areaon two days, 6 and 15 March 2006, during the INTEX-Bfield campaign for which we have coincident, ground-basedand aircraft observations. Additionally, the MISR Researchretrieval results were used to evaluate the performance of theMISR V22 Standard aerosol retrieval algorithm in our studyarea. Comparison of aerosol properties retrieved from MISRagainst the sub-orbital HSRL verify the ability of MISR todistinguish qualitatively between different aerosol air massesin MCMA. Both MISR and sub-orbital observations suggestthe presence of mixtures of dust, biomass burning and urbanaerosols in the study area. We summarize the findings fromthe MISR Research retrieval algorithm here.
– In MCMA, MISR AOD shows regional variability at< 17.6 km scales on both 6 and 15 March 2006. TheAOD and its variability are lower on 6 March than on15 March. Sub-orbital measurements confirm these re-sults and also provide qualitative verification of theMISR retrieved AOD pattern in the study area. Lo-cal meteorology governs the distribution of aerosols inMCMA. The basin-scale circulations on our case studydays are found to be climatologically representative.
– On the two study days, the MISR research algorithmcannot distinguish between weakly absorbing and non-absorbing particles. The weakly absorbing (ωo558=
0.95) spherical particles in mixtures were found to bereplaceable by non-absorbing (ωo558= 1.0) sphericalparticles in the retrievals. In regions where dust parti-cles were picked more frequently by the research algo-rithm, the dust particle (reff = 0.75 µm;ωo558= 0.97)could be substituted by a larger non-spherical red-dust(ellipsoidal) particle (reff = 1.18 µm) with a lower SSA(0.88). Based on earlier sensitivity studies (Kahn et al.,2001; Kalashnikova and Kahn, 2006), this is expected,though this detail is specific to a complex urban envi-ronment such as MCMA.
– In situations such as on 6 and 15 March 2006, whenaerosols from local pollution mix with transportedbiomass burning aerosol from fires on adjacent moun-tains, the MISR research algorithm could not distin-guish between particles that show steep vs. flat spec-tral behavior of aerosol absorption or SSA (i.e., smokevs. pollution). However, urban and smoke aerosols aredistinguished based on particle size, as confirmed bysuborbital validation data.
– For HR retrievals in this study, obtaining robust re-sults from the research algorithm over the fire plumesto the east of Mexico City was difficult, because theplume appeared to move relative to the ground as thecamera angle changed due to plume height, and theplumes were too small to co-register consistently athigher elevations. This also made the relative abun-dance of spherical vs. non-spherical particles diffi-cult to constrain at locations where discrete, elevatedsmoke plumes features were in the FOV of some ofthe MISR cameras. High-altitude cirrus clouds posedsimilar challenges on 15 March (as also discussed byPierce et al., 2010).
– Detailed analysis of MISR research retrieval resultssuggests that two distinct aerosol air mass types wereidentified based solely on particle microphysical prop-erties, over the Mexico City metropolitan area: onedominated by smoke and another consisting of a mix-ture of smoke, dust and pollution particles. In gen-eral, > 70 % of the AOD was attributed to spheri-cal absorbing particles and up to 15 % to sphericalnon-absorbing particles. Non-spherical particle dustanalogs contributed up to 30 %. The gradients in theparticle properties agree qualitatively with HSRL inmost cases.
In summary, over an urban area, surface heterogeneity, lackof specific knowledge about particle microphysical proper-ties, limited angular sampling, poorly constrained aerosolvertical distribution, coupled with low AOD conditions (ason 6 March) can make it difficult to constrain particle prop-erties. MISR research retrievals from this study demonstratethat over MCMA, MISR can distinguish at least two aerosolmodes (fine and medium/coarse), and that fine mode (< 0.26micron) spherical absorbing aerosols are dominant in the re-gion during our study period. MISR retrievals cannot tellwith confidence the difference between medium mode andcoarse mode aerosol types in relatively low AOD situationsover bright and varying urban surfaces. The distinction be-tween urban and biomass burning aerosols under these cir-cumstances is made based on particle size, though not on par-ticle SSA or its spectral slope, though such distinctions maybe possible under more favorable retrieval conditions. Takentogether, MISR was able to aptly distinguish regions dom-inated by dust, smoke and/or urban aerosols for our studydays. Taking advantage of over 13 yr of global observationsfrom MISR, our future work will focus on mapping the sea-sonal and inter-annual history of aerosol air mass type andAOD gradients for mega-city environments globally.
Supplementary material related to this article isavailable online athttp://www.atmos-chem-phys.net/13/9525/2013/acp-13-9525-2013-supplement.pdf.
Atmos. Chem. Phys., 13, 9525–9541, 2013 www.atmos-chem-phys.net/13/9525/2013/

F. Patadia et al.: Aerosol airmass type mapping over the Urban Mexico City 9539
Acknowledgements.We acknowledge the collaborative effortof a large number of participants and multi-national agenciesthat contributed to the MILAGRO/INTEX-B Campaign. Wegratefully acknowledge the NASA Langley Flight ResearchService Directorate for their support of B200 flight operationsduring MILAGRO. Support for the HSRL deployment duringMILAGRO and the analyses of these data was provided bythe NASA Science Mission Directorate, the NASA CALIPSOproject, and the Office of Science (BER), US Department ofEnergy (Atmospheric Science Program), Interagency AgreementNo. DE-AI02-05ER6398. We also acknowledge AERONET sitemanagers at Mexico City A. Leyva, Technician H. R. Estèvezfrom the Institute of Geophysics at UNAM and the AERONETglobal PI, B. Holben, for making available an extensive and highquality aerosol data set, and the AATS-14 instrument team, led byJens Redemann. We thank the PIs of various instruments at the fiveground sites (Hidalgo, Mexico City, UNAM, UAMI and Corena).Size distribution, meteorological, and aerosol optical depth datafrom these sites were used to evaluate MISR retrievals. Specialthanks to Bob Yokelson for helpful discussions about the firesduring our study period, and to B. De Foy for insights about therelative humidity data. Thanks also to S. Madronich, L. Molina, andJ. Meitin for their dedication in making the MILAGRO campaigna success for all. The work of R. Kahn is supported in part byNASA’s Climate and Radiation Research and Analysis Programunder H. Maring, NASA’s Atmospheric Composition Programunder R. Eckman, which also supported F. Patadia, and the NASAEarth Observing System MISR instrument project.
Edited by: E. Gerasopoulos
References
Abdou, W. A., Diner, D. J., Martonchik, J. V., Bruegge, C. J., Kahn,R. A., Gaitley, B. J., Crean, K. A., Remer, L. A., and Holben, B.:Comparison of coincident Multiangle Imaging Spectroradiome-ter and Moderate Resolution Imaging Spectroradiometer aerosoloptical depths over land and ocean scenes containing AerosolRobotic Network sites, J. Geophys. Res.-Atmos., 110, D10S07,doi:10.1029/2004JD004693, 2005.
Ahmad, S. P., Levelt, P. F., Bhartia, P. K., Hilsenrath, E., Lep-pelmeier, G. W., and Johnson, J. E.: Atmospheric products fromthe ozone monitoring instrument (OMI), Proc. SPIE 5151, 619,doi:10.1117/12.506042, 2003.
Aiken, A. C., de Foy, B., Wiedinmyer, C., DeCarlo, P. F., Ulbrich, I.M., Wehrli, M. N., Szidat, S., Prevot, A. S. H., Noda, J., Wacker,L., Volkamer, R., Fortner, E., Wang, J., Laskin, A., Shutthanan-dan, V., Zheng, J., Zhang, R., Paredes-Miranda, G., Arnott, W.P., Molina, L. T., Sosa, G., Querol, X., and Jimenez, J. L.: Mex-ico city aerosol analysis during MILAGRO using high resolu-tion aerosol mass spectrometry at the urban supersite (T0) –Part 2: Analysis of the biomass burning contribution and thenon-fossil carbon fraction, Atmos. Chem. Phys., 10, 5315–5341,doi:10.5194/acp-10-5315-2010, 2010.
Bergstrom, R. W., Schmidt, K. S., Coddington, O., Pilewskie, P.,Guan, H., Livingston, J. M., Redemann, J., and Russell, P. B.:Aerosol spectral absorption in the Mexico City area: resultsfrom airborne measurements during MILAGRO/INTEX B, At-
mos. Chem. Phys., 10, 6333–6343, doi:10.5194/acp-10-6333-2010, 2010.
Bond, T. C. and Bergstrom, R. W.: Light Absorption by Carbona-ceous Particles: An Investigative Review, Aerosol Sci. Technol.,40, 27–67, doi:10.1080/02786820500421521, 2006.
Burton, S. P., Ferrare, R. A., Hostetler, C. A., Hair, J. W., Rogers, R.R., Obland, M. D., Butler, C. F., Cook, A. L., Harper, D. B., andFroyd, K. D.: Aerosol classification using airborne High Spec-tral Resolution Lidar measurements – methodology and exam-ples, Atmos. Meas. Tech., 5, 73–98, doi:10.5194/amt-5-73-2012,2012.
Chen, W. T., Kahn, R. A., Nelson, D., Yau, K., and Seinfeld, J. H.:Sensitivity of multiangle imaging to the optical and microphys-ical properties of biomass burning aerosols. J. Geophys. Res.,113, D10203, doi:10.1029/2007JD009414, 2008.
Corr, C. A., Krotkov, N., Madronich, S., Slusser, J. R., Holben, B.,Gao, W., Flynn, J., Lefer, B., and Kreidenweis, S. M.: Retrievalof aerosol single scattering albedo at ultraviolet wavelengths atthe T1 site during MILAGRO, Atmos. Chem. Phys., 9, 5813–5827, doi:10.5194/acp-9-5813-2009, 2009.
de Almeida Castanho, A. D., Prinn, R., Martins, V., Herold, M.,Ichoku, C., and Molina, L. T.: Analysis of Visible/SWIR sur-face reflectance ratios for aerosol retrievals from satellite inMexico City urban area, Atmos. Chem. Phys., 7, 5467–5477,doi:10.5194/acp-7-5467-2007, 2007.
de Foy, B., Fast, J. D., Paech, S. J., Phillips, D., Walters, J. T.,Coulter, R. L., Martin, T. J., Pekour, M. S., Shaw, W. J., Kasten-deuch, P. P., Marley, N. A., Retama, A., and Molina, L. T.: Basin-scale wind transport during the MILAGRO field campaign andcomparison to climatology using cluster analysis, Atmos. Chem.Phys., 8, 1209–1224, doi:10.5194/acp-8-1209-2008, 2008
de Foy, B., Burton, S. P., Ferrare, R. A., Hostetler, C. A., Hair, J.W., Wiedinmyer, C., and Molina, L. T.: Aerosol plume trans-port and transformation in high spectral resolution lidar mea-surements and WRF-Flexpart simulations during the MILA-GRO Field Campaign, Atmos. Chem. Phys., 11, 3543–3563,doi:10.5194/acp-11-3543-2011, 2011.
Dubovik, O. and King, M. D.: A flexible inversion algorithm forretrieval of aerosol optical properties from Sun and sky radiancemeasurements, J. Geophys. Res., 105, 20673–20696, 2000.
Eck, T. F., Holben, B. N., Reid, J. S., Dubovik, O., Smirnov,A., O’Neill, N. T., Slutsker, I., and Kinne, S.: Wavelengthdependence of the optical depth of biomass burning, urban,and desert dust aerosols, J. Geophys. Res., 104, 31333–31349,doi:10.1029/1999JD900923, 1999.
Fast, J. D., de Foy, B., Acevedo Rosas, F., Caetano, E., Carmichael,G., Emmons, L., McKenna, D., Mena, M., Skamarock, W.,Tie, X., Coulter, R. L., Barnard, J. C., Wiedinmyer, C., andMadronich, S.: A meteorological overview of the MILA-GRO field campaigns, Atmos. Chem. Phys., 7, 2233–2257,doi:10.5194/acp-7-2233-2007, 2007.
Grant, I. P. and Hunt, G. E.: Descrete space theory of radiative trans-fer – I. Fundamentals, Proc. Roy. Soc. Lond.A, 313, 183–197,1969.
Holben, B. N., Eck, T. F., Slutsker, I., Tanre, D., Buis, J. P., Set-zer, A., Vermote, E., Reagan, J. A., Kaufman, Y. J., Nakajima,T., Lavenu, F., Jankowiak, I., and Smirnov, A.: AERONET – Afederated instrument network and data archive for aerosol char-acterization, Remote Sens. Environ., 66, 1–16, 1998.
www.atmos-chem-phys.net/13/9525/2013/ Atmos. Chem. Phys., 13, 9525–9541, 2013

9540 F. Patadia et al.: Aerosol airmass type mapping over the Urban Mexico City
Holben, B. N., Tanre, D., Smirnov, A., Eck, T. F., Slutsker, I.,Abuhassan, N., Newcomb, W. W., Schafer, J., Chatenet, B., Lav-enue, F., Kaufman, Y. J., Vande Castle, J., Setzer, A., Markham,B., Clark, D., Frouin, R., Halthore, R., Karnieli, A., O’Neill, N.T., Pietras, C., Pinker, R. T., Voss, K., and Zibordi, G.: An emerg-ing ground-based aerosol climatology: Aerosol Optical Depthfrom AERONET, J. Geophys. Res., 106, 12067–12097, 2001.
Ichoku C., Levy, R., Kaufman, Y. J., Remer, L. A., Li, R. -R., Mar-tins, V. J., Holben, B. N., Abuhassan, N., Slutsker, I., Eck, T. F.,and Pietras, C.: Analysis of the performance characteristics of thefive-channel Microtops II sun photometer for measuring aerosoloptical thickness and precipitable water vapor, J. Geophys. Res.,107, doi:10.1029/2001JD001302, 2002.
IPCC, 2007: Climate Change 2007: The Physical Science Basis.Contribution of Working Group I to the Fourth Assessment Re-port of the Intergovernmental Panel on Climate Change, editedby: Solomon, S., Qin, D., Manning, M., Chen, Z., Marquis, M.,Averyt, K. B., Tignor, M., and Miller, H. L., Cambridge Uni-versity Press, Cambridge, United Kingdom and New York, NY,USA, 2007.
Kahn, R. A. and Limbacher, J.: Eyjafjallajökull volcano plumeparticle-type characterization from space-based multi-angleimaging, Atmos. Chem. Phys., 12, 9459–9477, doi:10.5194/acp-12-9459-2012, 2012.
Kahn, R., Banerjee, P., and McDonald, D.: Sensitivity of multiangleimaging to natural mixtures of aerosols over ocean, J. Geophys.Res., 106, 18219–18238, doi:10.1029/2000JD900497, 2001.
Kahn, R. A., Gaitley, B. J., Martonchik, J. V., Diner, D. J.,Crean, K. A., and Holben, B. N.: Multiangle Imaging Spec-troradiometer (MISR) global aerosol optical depth validationbased on 2 years of coincident Aerosol Robotic Network(AERONET) observations, J. Geophys. Res., 110, D10S04,doi:10.1029/2004JD004706, 2005.
Kahn, R., Petzold, A., Wendisch, M., Bierwirth, E., Dinter, T.,Esselborn, M., Fiebig, M., Heese, B., Knippertz, P., Muller,D., Schladitz, A., and von Hoyningen-Huene, W.: Desert DustAerosol Air Mass Mapping in the western Sahara, Using particleproperties derived from space-based multi-angle imaging, Tellus,61B, 239–251, doi:10.1111/j.1600-0889.2008.00398.x, 2009a.
Kahn, R. A., Nelson, D. L., Garay, M., Levy, R. C., Bull, M. A.,Diner, D. J., Martonchik, J. V., Paradise, S. R., and Hansen, E.G., and Remer, L. A.: MISR Aerosol product attributes, and sta-tistical comparisons with MODIS, IEEE Trans. Geosci. Remt.Sens., 47, 4095–4114, 2009b.
Kahn, R. A., Gaitley, B. J., Garay, M. J., Diner, D. J., Eck, T. F.,Smirnov, A., and Holben B. N.: Multiangle Imaging SpectroRa-diometer global aerosol product assessment by comparison withthe Aerosol Robotic Network, J. Geophys. Res., 115, D23209,doi:10.1029/2010JD014601, 2010.
Kalashnikova, O. V. and Kahn R. A.: Ability of multiangle remotesensing observations to identify and distinguish mineral dusttypes: 2. Sensitivity over dark water, J. Geophys. Res.-Atmos.,111, D11207, doi:10.1029/2008JD010083, 2006.
Kleinman, L. I., Springston, S. R., Wang, J., Daum, P. H., Lee,Y.-N., Nunnermacker, L. J., Senum, G. I., Weinstein-Lloyd, J.,Alexander, M. L., Hubbe, J., Ortega, J., Zaveri, R. A., Cana-garatna, M. R., and Jayne, J.: The time evolution of aerosol sizedistribution over the Mexico City plateau, Atmos. Chem. Phys.,9, 4261–4278, doi:10.5194/acp-9-4261-2009, 2009.
Krewski, D., Burnett, R. T., Goldberg, M. S., Hoover, K., Siemi-atycki, J., Jerrett, M., Abrahamowicz, A., and White, W. H.: Re-analysis of the Harvard six cities study and the American CancerSociety study of particulate air pollution and mortality, A specialreport of the institute’s particle epidemiology reanalysis project,97 pp., Health Effects Inst., Cambridge, Mass., 2000.
Marley, N. A., Gaffney, J. S., Ramos-Villegas, R., and CárdenasGonzález, B.: Comparison of measurements of peroxyacyl ni-trates and primary carbonaceous aerosol concentrations in Mex-ico City determined in 1997 and 2003, Atmos. Chem. Phys., 7,2277–2285, doi:10.5194/acp-7-2277-2007, 2007.
Marley, N. A., Gaffney, J. S., Tackett, M., Sturchio, N. C., Heraty,L., Martinez, N., Hardy, K. D., Marchany-Rivera, A., Guilderson,T., MacMillan, A., and Steelman, K.: The impact of biogenic car-bon sources on aerosol absorption in Mexico City, Atmos. Chem.Phys., 9, 1537–1549, doi:10.5194/acp-9-1537-2009, 2009a.
Marr, L. C., Dzepina, K., Jimenez, J. L., Reisen, F., Bethel, H. L.,Arey, J., Gaffney, J. S., Marley, N. A., Molina, L. T., and Molina,M. J.: Sources and transformations of particle-bound polycyclicaromatic hydrocarbons in Mexico City, Atmos. Chem. Phys., 6,1733–1745, doi:10.5194/acp-6-1733-2006, 2006.
Martonchik, J. V., Diner, D. J., Kahn, R. A., Ackerman, T. P., Ver-straete, M. M., Pinty, B., and Gordon, H. R.: Techniques for theretrieval of aerosol properties over land and ocean using multian-gle imaging, IEEE Trans. Geosci. Remote Sens., 36, 1212–1227,1998.
Martonchik, J. V., Diner, D. J., Kahn, R. A., Gaitley, B., and Hol-ben, B. N.: Comparison of MISR and AERONET aerosol op-tical depths over desert sites, Geophys. Res. Lett., 31, L16102,doi:10.1029/2004GL019807, 2004.
Martonchik, J. V., Kahn, R. A., and Diner, D. J.: Retrieval of aerosolproperties over land using MISR observations, in: SatelliteAerosol Remote Sensing Over Land, edited by: Kokhanovsky,A. A. and de Leeuw, G., Berlin: Springer, 267–291, 2009.
Moffet, R. C., de Foy, B., Molina, L. T., Molina, M. J., and Prather,K. A.: Measurement of ambient aerosols in northern Mexico Cityby single particle mass spectrometry, Atmos. Chem. Phys., 8,4499–4516, doi:10.5194/acp-8-4499-2008, 2008.
Molina, M. J. and Molina, L. T.: Critical Review: Megacities andatmospheric pollution, J. Air Waste Manage. Assoc., 54, 644–680, 2004.
Molina, L. T., MaDronich, S., Gaffney, J. S., and Singh, H. B.:Overview of MILAGRO/INTEX-B Campaign, IGAC Newslet-ter, 38, 2–15, 2008.
Molina, L. T., Madronich, S., Gaffney, J. S., Apel, E., de Foy,B., Fast, J., Ferrare, R., Herndon, S., Jimenez, J. L., Lamb, B.,Osornio-Vargas, A. R., Russell, P., Schauer, J. J., Stevens, P.S., Volkamer, R., and Zavala, M.: An overview of the MILA-GRO 2006 Campaign: Mexico City emissions and their trans-port and transformation, Atmos. Chem. Phys., 10, 8697–8760,doi:10.5194/acp-10-8697-2010, 2010.
Paredes-Miranda, G., Arnott, W. P., Jimenez, J. L., Aiken, A. C.,Gaffney, J. S., and Marley, N. A.: Primary and secondary contri-butions to aerosol light scattering and absorption in Mexico Cityduring the MILAGRO 2006 campaign, Atmos. Chem. Phys., 9,3721–3730, doi:10.5194/acp-9-3721-2009, 2009.
Pierce, J. R., Kahn, R. A., Davis, M. R., and Comstock J.M.: Detecting thin cirrus in Multiangle Imaging Spectrora-diometer aerosol retrievals, J. Geophys. Res., 115, D08201,
Atmos. Chem. Phys., 13, 9525–9541, 2013 www.atmos-chem-phys.net/13/9525/2013/

F. Patadia et al.: Aerosol airmass type mapping over the Urban Mexico City 9541
doi:10.1029/2009JD013019, 2010.Querol, X., Pey, J., Minguillón, M. C., Pérez, N., Alastuey, A.,
Viana, M., Moreno, T., Bernabé, R. M., Blanco, S., Cárdenas, B.,Vega, E., Sosa, G., Escalona, S., Ruiz, H., and Artíñano, B.: PMspeciation and sources in Mexico during the MILAGRO-2006Campaign, Atmos. Chem. Phys., 8, 111–128, doi:10.5194/acp-8-111-2008, 2008.
Redemann, J., Zhang, Q., Livingston, J., Russell, P., Shinozuka, Y.,Clarke, A., Johnson, R., and Levy, R.: Testing aerosol proper-ties in MODIS Collection 4 and 5 using airborne sunphotometerobservations in INTEX-B/MILAGRO, Atmos. Chem. Phys., 9,8159–8172, doi:10.5194/acp-9-8159-2009, 2009.
Reid, J. S., Koppmann, R., Eck, T. F., and Eleuterio, D. P.: A reviewof biomass burning emissions part II: intensive physical proper-ties of biomass burning particles, Atmos. Chem. Phys., 5, 799–825, doi:10.5194/acp-5-799-2005, 2005.
Rogers, R. R., Hair, J. W., Hostetler, C. A., Ferrare, R. A., Obland,M. D., Cook, A. L., Harper, D. B., Burton, S. P., Shinozuka, Y.,McNaughton, C. S., Clarke, A. D., Redemann, J., Russell, P. B.,Livingston, J. M., and Kleinman, L. I.: NASA LaRC airbornehigh spectral resolution lidar aerosol measurements during MI-LAGRO: observations and validation, Atmos. Chem. Phys., 9,4811–4826, doi:10.5194/acp-9-4811-2009, 2009.
Saldiva, P. H., Pope, C. A., Schwartz, J., Dockery, D. W., Lichten-fels, H. J., Salge, J. M., Barone, I., and Bohm, G. M.: Air pol-lution and mortality in elderly people: a time series study in SaoPaulo, Brazil, Arch. Environ. Health, 50, 159–163, 1995.
Schmid B., Redemann, J., Russell, P. B., Hobbs, P. V., Hlavka, D.L., McGill, M. J., Holben, B. N., Welton, E. J., Campbell, J. R.,Torres, O., Kahn, R. A., Diner, D. J., Helmlinger, M. C., Chu,D. A., Gonzalez, C. R., and de Leeuw G.: Coordinated airborne,spaceborne, and ground-based measurements of massive, thickaerosol layers during the dry season in southern Africa, J. Geo-phys. Res., 108, 8496, doi:10.1029/2002JD002297, 2003.
Schwartz, J. and Marcus, A.: Mortality and air pollution in London:a time series analysis, Am. J. Epidemiol., 131, 185–94, 1990.
Shaw, W. J., Pekour, M. S., Coulter, R. L., Martin, T. J., and Walters,J. T.: The daytime mixing layer observed by radiosonde, profiler,and lidar during MILAGRO, Atmos. Chem. Phys. Discuss., 7,15025–15065, doi:10.5194/acpd-7-15025-2007, 2007.
Singh, H. B., Brune, W. H., Crawford, J. H., Flocke, F., and Ja-cob, D. J.: Chemistry and transport of pollution over the Gulfof Mexico and the Pacific: spring 2006 INTEX-B campaignoverview and first results, Atmos. Chem. Phys., 9, 2301–2318,doi:10.5194/acp-9-2301-2009, 2009.
Stone, E. A., Snyder, D. C., Sheesley, R. J., Sullivan, A. P., We-ber, R. J., and Schauer, J. J.: Source apportionment of fine or-ganic aerosol in Mexico City during the MILAGRO experiment2006, Atmos. Chem. Phys., 8, 1249–1259, doi:10.5194/acp-8-1249-2008, 2008.
Voss, P. B., Zaveri, R. A., Flocke, F. M., Mao, H., Hartley, T. P.,DeAmicis, P., Deonandan, I., Contreras-Jiménez, G., Martínez-Antonio, O., Figueroa Estrada, M., Greenberg, D., Campos, T.L., Weinheimer, A. J., Knapp, D. J., Montzka, D. D., Crounse,J. D., Wennberg, P. O., Apel, E., Madronich, S., and de Foy, B.:Long-range pollution transport during the MILAGRO-2006 cam-paign: a case study of a major Mexico City outflow event usingfree-floating altitude-controlled balloons, Atmos. Chem. Phys.,10, 7137–7159, doi:10.5194/acp-10-7137-2010, 2010.
Wang, J., Christopher, S. A., Nair, U. S., Reid, J. S., Prins, E. M.,Szykman, J., and Hand, J. L.: Mesoscale modeling of CentralAmerican smoke transport to the United States: 1. “Top-down”assessment of emission strength and diurnal variation impacts, J.Geophys. Res., 111, D05S17, doi:10.1029/2005JD006416, 2006.
Wang, J., Cubison, M. J., Aiken, A. C., Jimenez, J. L., and Collins,D. R.: The importance of aerosol mixing state and size-resolvedcomposition on CCN concentration and the variation of the im-portance with atmospheric aging of aerosols, Atmos. Chem.Phys., 10, 7267–7283, doi:10.5194/acp-10-7267-2010, 2010.
www.atmos-chem-phys.net/13/9525/2013/ Atmos. Chem. Phys., 13, 9525–9541, 2013


![arXiv:0904.2020v2 [astro-ph.SR] 8 May 2009 · after sunset at airmass 1.93 (4.1 hours east of the meridian, so the initially large airmass decreased quickly) when it was magnified](https://static.fdocuments.in/doc/165x107/5e1b71ce16c33b7e110de503/arxiv09042020v2-astro-phsr-8-may-2009-after-sunset-at-airmass-193-41-hours.jpg)