AERO-ENGINE EXHAUST GAS TEMPERATURE PREDICTION …
14
Li, D., et al.: Aero-Engine Exhaust Gas Temperature Prediction Based ... THERMAL SCIENCE: Year 2021, Vol. 25, No. 2A, pp. 845-858 845 AERO-ENGINE EXHAUST GAS TEMPERATURE PREDICTION BASED ON LightGBM OPTIMIZED BY IMPROVED BAT ALGORITHM by Dingzhe LI * , Jingbo PENG, and Dawei HE Aeronautical Engineering College, Air Force Engineering University, Xi’an, China Original scientific paper https://doi.org/10.2298/TSCI200520246L In this paper, an aero-engine exhaust gas temperature prediction model based on LightGBM optimized by the chaotic rate bat algorithm is proposed to monitor ae- ro-engine performance effectively. By introducing chaotic rate, the convergence speed and precision of bat algorithm are improved, which chaotic rate bat algo- rithm is obtained. The LightGBM is optimized by chaotic rate bat algorithm and it is used to predict exhaust gas temperature. Taking a type of aero-engine for example, some relevant performance parameters from the flight data measured by airborne sensors were selected as input variables and exhaust gas temperature as output variables. The data set is divided into training and test sets, and the CRBA- LightGBM model is trained and tested, and compared with ensemble algorithms such as RF, XGBoost, GBDT, LightGBM, and BA-LightGBM. The results show that the mean absolute error of this method in the prediction of exhaust gas temperature (after normalization) is 0.0065, the mean absolute percentage error is 0.77% and goodness of fit R 2 has reached to 0.9469. The prediction effect of CRBA-LightGBM is better than other comparison algorithms and it is suitable for aero-engine con- dition monitoring. Key words: aero-engine, exhaust gas temperature prediction, LightGBM, improved bat algorithm, flight data Introduction The exhaust gas temperature (EGT) of aero-engine is one of the main indicators of the aero-engine condition monitoring. As the service time increases, the performance of the aero-engine will decline and the EGT will rise accordingly. When the EGT exceeds a certain threshold, it may seriously affect the normal operation of the aero-engine and the flight safety of the aircraft [1]. Therefore, the prediction of EGT can effectively monitor engine performance degradation and reduce aircraft failure rates. Aero-engine is a complex non-linear time-varying system, the EGT varies with the different aero-engine working condition. Up to now, there is no definite mathematical model to describe the change law [2]. It is an effective method to predict the EGT by data mining the historical flying parameter data collected based on the airborne sensors. In the past few years, a series of data-driven methods based on machine learning have been proposed for the prediction of EGT [3-7], and have achieved certain results. Artificial neural networks [3] was applied to predict the EGT of CFM56-7B engines. Zhong et al. [4] and Ding et al. [5] introduced time aggregation operators and used process neural networks to predict EGT. Kumar et al. [6] used auto-regression and moving average technology to predict engine exhaust temperature. On the * Corresponding author, e-mail: [email protected]
Transcript of AERO-ENGINE EXHAUST GAS TEMPERATURE PREDICTION …

Li, D., et al.: Aero-Engine Exhaust Gas Temperature Prediction Based ... THERMAL SCIENCE: Year 2021, Vol. 25, No. 2A, pp. 845-858 845
AERO-ENGINE EXHAUST GAS TEMPERATURE PREDICTION BASED ON LightGBM OPTIMIZED BY IMPROVED BAT ALGORITHM
by
Dingzhe LI *, Jingbo PENG, and Dawei HE
Aeronautical Engineering College, Air Force Engineering University, Xi’an, ChinaOriginal scientific paper
https://doi.org/10.2298/TSCI200520246L
In this paper, an aero-engine exhaust gas temperature prediction model based on LightGBM optimized by the chaotic rate bat algorithm is proposed to monitor ae-ro-engine performance effectively. By introducing chaotic rate, the convergence speed and precision of bat algorithm are improved, which chaotic rate bat algo-rithm is obtained. The LightGBM is optimized by chaotic rate bat algorithm and it is used to predict exhaust gas temperature. Taking a type of aero-engine for example, some relevant performance parameters from the flight data measured by airborne sensors were selected as input variables and exhaust gas temperature as output variables. The data set is divided into training and test sets, and the CRBA-LightGBM model is trained and tested, and compared with ensemble algorithms such as RF, XGBoost, GBDT, LightGBM, and BA-LightGBM. The results show that the mean absolute error of this method in the prediction of exhaust gas temperature (after normalization) is 0.0065, the mean absolute percentage error is 0.77% and goodness of fit R2 has reached to 0.9469. The prediction effect of CRBA-LightGBM is better than other comparison algorithms and it is suitable for aero-engine con-dition monitoring.Key words: aero-engine, exhaust gas temperature prediction, LightGBM,
improved bat algorithm, flight data
Introduction
The exhaust gas temperature (EGT) of aero-engine is one of the main indicators of the aero-engine condition monitoring. As the service time increases, the performance of the aero-engine will decline and the EGT will rise accordingly. When the EGT exceeds a certain threshold, it may seriously affect the normal operation of the aero-engine and the flight safety of the aircraft [1]. Therefore, the prediction of EGT can effectively monitor engine performance degradation and reduce aircraft failure rates.
Aero-engine is a complex non-linear time-varying system, the EGT varies with the different aero-engine working condition. Up to now, there is no definite mathematical model to describe the change law [2]. It is an effective method to predict the EGT by data mining the historical flying parameter data collected based on the airborne sensors. In the past few years, a series of data-driven methods based on machine learning have been proposed for the prediction of EGT [3-7], and have achieved certain results. Artificial neural networks [3] was applied to predict the EGT of CFM56-7B engines. Zhong et al. [4] and Ding et al. [5] introduced time aggregation operators and used process neural networks to predict EGT. Kumar et al. [6] used auto-regression and moving average technology to predict engine exhaust temperature. On the * Corresponding author, e-mail: [email protected]

Li, D., et al.: Aero-Engine Exhaust Gas Temperature Prediction Based ... 846 THERMAL SCIENCE: Year 2021, Vol. 25, No. 2A, pp. 845-858
basis of the process neural network, Jun et al. [7] used the improved drosophila optimization algorithm to optimize the relevant parameters and improved the prediction effect. However, there are still problems such as low accuracy and low prediction efficiency, and the prediction performance of neural network has a great correlation with the number of samples and the set-ting of hyper parameters.
On account of excellent performance of higher accuracy and shorter running time than individual learner [8, 9]. Ensemble learning has been widely used in classification and regression in the field of machine learning in the past 20 years. However, the new achievements of ensem-ble learning are very limited in the research of aero-engine. An improved Adaboost model [10] was used to aero-engine PHM, and an improved random forest algorithm [11] was applied to the aero-engine maintenance level decision. The LightGBM is an ensemble algorithm based on deci-sion tree published by Microsoft Research Asia [12], which has unique advantages in processing non-linear models, supports efficient parallel training, and has high accuracy and efficiency in regression and classification. In the past two years, research results can be found in the fields of medicine [13], economy [14], agriculture [15], and meteorology [16]. It is worth noting that the prediction effect of LightGBM is related to its own adjustment parameters. The selection of parameters such as Learning_rate and Max_depth directly affects the prediction accuracy and training speed of the model. At the same time, manual adjustment of parameters takes a long time and may still not be able to make LightGBM has the best predictive performance.
In this paper, the chaotic rate bat algorithm (CRBA) is studied. To further improve the prediction performance, the mean absolute error (MAE) of the predicted value is used as the objective function optimize the Learning_rate and Max_depth of LightGBM. The LightGBM prediction model optimized by CRBA is established. The prediction results of several ensemble learning methods are compared. The study provides an application reference for aero-engine condition monitoring.
Theory
The LightGBM model
Decision tree
As a method of classification and regression, decision tree has a tree structure, and mostly uses binary trees [14]. On each leaf node, according to the test results of the judgment condition, the data set is distributed to two or more child nodes, and the child nodes continue to split until the leaf nodes are generated, including the final data category [17].
However, the problem of overfitting will be caused by the transition of decision tree growth, and the classification performance of unbalanced samples is poor, and the informa-tion gain tends to be biased to the feature of large sample size. Figure 1 shows the basic structure of a decision tree.
Gradient boosting
Gradient boosting is a machine learning technique used for regression and classification problems. And it produces a prediction model in the form of a collection of weak prediction Figure 1. The basic structure of the decision tree
T11 T
12T
21 T22
S
A1 A
2
S1
S2
S3 S
4
Li, D., et al.: Aero-Engine Exhaust Gas Temperature Prediction Based ... THERMAL SCIENCE: Year 2021, Vol. 25, No. 2A, pp. 845-858 847
models (usually decision trees). The idea of gradient boosting is to iterate the variables at one time. During the iteration process, the sub-models are added one by one [17, 18], and at the same time the cost function is continuously reduced.
The model can be represented by the following expression:
0 0 1 1( ) ( ) ( ) ( )m m mF x f x f x f x= ∂ + ∂ + ⋅⋅⋅ + ∂ (1)
where fi(X) is the sub-model in each iteration and L[Fm(x), Y] – the cost function, and Y – the observed value. With the gradual addition of the sub-model, the cost function will decrease along the variable gradient with the second highest information content:
1[ ( ), ] [ ( ), ]m mL F x Y L F x Y−< (2)
Gradient boosting decision tree
Gradient boosting decision rete (GBDT) is an algorithm for data classification or re-gression by using a linear combination of primary functions and continuously reducing the residuals generated during training process. In brief, GBDT is equivalent to a decision tree al-gorithm using gradient boosting. It is a decision tree algorithm with boosting iteration process, which has the advantages of not easy overfitting and good training effect. The GBDT produces a weak classifier in each round of iterations, and each classifier is trained on the basis of the re-sidual of the previous round [12]. In multiple rounds of iterations, the accuracy is continuously improved by reducing the deviation.
The LightGBM
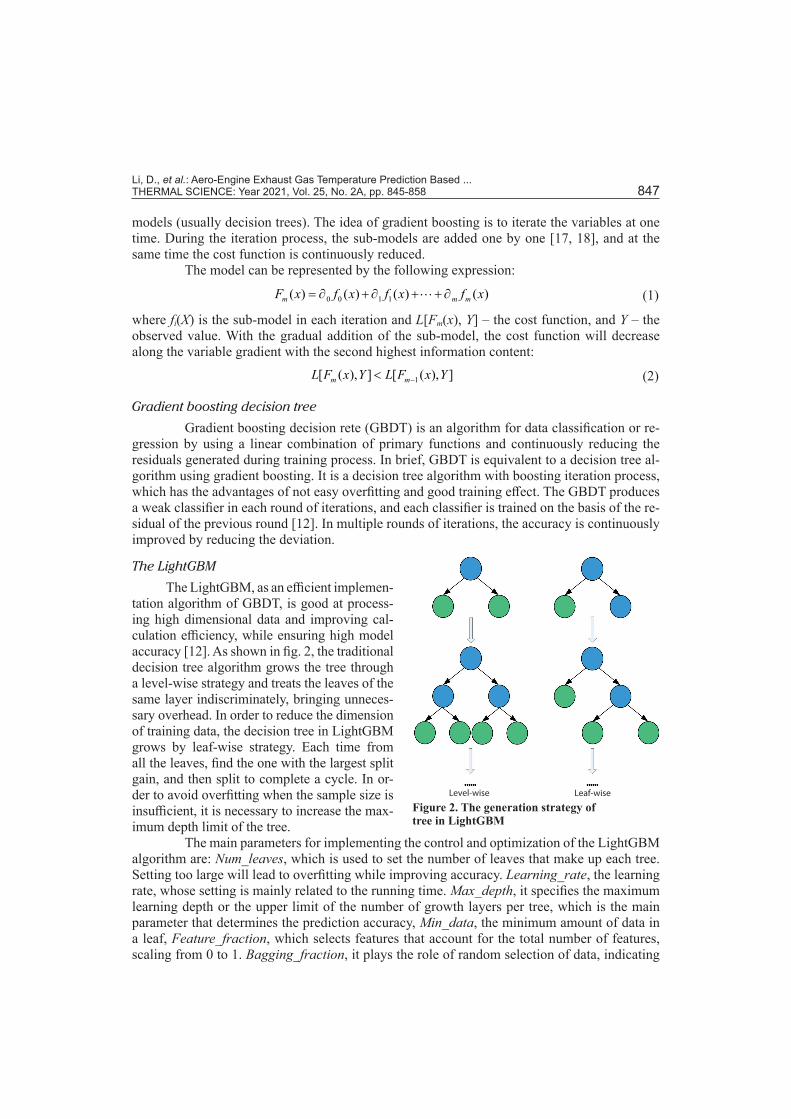
The LightGBM, as an efficient implemen-tation algorithm of GBDT, is good at process-ing high dimensional data and improving cal-culation efficiency, while ensuring high model accuracy [12]. As shown in fig. 2, the traditional decision tree algorithm grows the tree through a level-wise strategy and treats the leaves of the same layer indiscriminately, bringing unneces-sary overhead. In order to reduce the dimension of training data, the decision tree in LightGBM grows by leaf-wise strategy. Each time from all the leaves, find the one with the largest split gain, and then split to complete a cycle. In or-der to avoid overfitting when the sample size is insufficient, it is necessary to increase the max-imum depth limit of the tree.
The main parameters for implementing the control and optimization of the LightGBM algorithm are: Num_leaves, which is used to set the number of leaves that make up each tree. Setting too large will lead to overfitting while improving accuracy. Learning_rate, the learning rate, whose setting is mainly related to the running time. Max_depth, it specifies the maximum learning depth or the upper limit of the number of growth layers per tree, which is the main parameter that determines the prediction accuracy, Min_data, the minimum amount of data in a leaf, Feature_fraction, which selects features that account for the total number of features, scaling from 0 to 1. Bagging_fraction, it plays the role of random selection of data, indicating
Figure 2. The generation strategy of tree in LightGBM
Level-wise Leaf-wise

Li, D., et al.: Aero-Engine Exhaust Gas Temperature Prediction Based ... 848 THERMAL SCIENCE: Year 2021, Vol. 25, No. 2A, pp. 845-858
the proportion of selected data in the total data volume, and the value is also between 0 and 1. Otherwise, Max_depth and Min_data are used to prevent overfitting, and Feature_fraction and Bagging_fraction are used to control the ratio of the selected total feature number.
Although the LightGBM framework performs very well in all aspects, if the param-eters of the model are not properly selected by the user, it will lead to problems such as over-fitting or underfitting and insufficient prediction accuracy. It is necessary to select the global optimal hyper parameter combination in a short time.
Chaotic rate bat algorithm
Bat algorithm
Cambridge University scholar Yang [19] proposed a new heuristic swarm intelli-gence optimization algorithm – the bat algorithm (BA) in 2010. The algorithm idealizes the echolocation of bats. By simulating the biological behavior of bat populations using ultra-sonic reflection in space to avoid obstacles and search and capture targets. Iteratively updates the speed, position, and optimal fitness function of bat population value [19, 20], and then choose the optimal solution until the target stops or the conditions are met, and finally the best solution is obtained.
The position of each bat in the search space corresponds to a solution in the solution space, with corresponding speed and fitness function. The bat population generates a new solu-tion set by updating the emission frequency, pulse rate and loudness, and gradually evolves to a state includes a global or near-optimal solution. The mathematical expression of the iteration process can be written:
min max min( ) [0, ,1]if f f f ζ ζ= + + ∈ (3)
1 1best( )l l l
i i i iV V X X f− −= + − (4)
1 1l l li i iX X V− −= + (5)
where fi is the emission frequency of the bat, i, fmin, and fmax are to the minimum and maximum emission frequency of the entire population, respectively, ξ – the random variable and its range is limited to [0,1], X li and V li – the position and speed of the bat i in search space in the lth itera-tion ( i = 1, 2,..., N), and Xbest – the optimal global position in the ith iteration.
When the algorithm converges to the optimal solution area, the optimal position is perturbed to achieve the purpose of local search again and ensure the ergodicity of the optimal solution. The update equation:
new bestlX X Aα= + (6)
where α is a random number in the interval [–1, 1] and Al – the average loudness of this bat population [21].
On the basis of eq. (6), the pulse rate Ri and the loudness Ai are updated as the iteration progress. The update equation:
1l li iA Aω+ = (7)
[ ]1 0 1 exp( )li iR R tβ+ = − − (8)
where β is constant as well as ω, and β >0, 0 < ω < 1.

Li, D., et al.: Aero-Engine Exhaust Gas Temperature Prediction Based ... THERMAL SCIENCE: Year 2021, Vol. 25, No. 2A, pp. 845-858 849
In summary, BA has the advantages of simple structure, few input parameters, and good readability. It realizes the conversion between global search and local search of dynamic control [22], and has been shown to perform better than unconstrained optimization Genetic algorithms and particle swarm optimization algorithms [21] and it have a wide range of appli-cations to expand [23, 24]. However, the algorithm is easy to reach local optimum and it has disadvantages of low convergence accuracy as well as slow convergence speed.
In view of these shortcomings, scholars have studied and improved them. For exam-ple, Rahimi et al. [25] proposed an adaptive learning heuristic bat algorithm to enhance the convergence accuracy of BA. Dinh et al. [26] merged uniform mutation and Gaussian mutation mechanism to perform selective mutation update on the bat position, which improves the opti-mization accuracy and convergence speed of the improved algorithm. Ye [27] proposed to use chaos optimization help BA achieve better ergodicity and avoid local optimization. Although the aforementioned literatures have improved BA to some extent, they are all optimizations to update the equation of bat position and speed, without considering the impact of pulse rate and loudness on optimization of model. However, these two parameters are the trigger condition and important measurement parameters for eq. (6) to perform local traversal optimization. The ability of the bat population locate the echo is controlled by the pulse rate and loudness [28]. Thus, the optimization of pulse rate and loudness is significant and valuable to increase the overall efficiency of the algorithm.
Optimization strategy of chaotic pulse rate
Equations (7) and (8) are used to update and iterate the pulse rate in BA, that is Ril+1 ≤ R0
i, Ai
l+1 ≤ A0i. The initial value selection of R0
i and A0i will directly affect the ergodicity of the local
search of the algorithm. However, due to the manual selection of the initial value, it has some randomness, which may also cause time-consuming and laborious troubles, which is not con-ducive to the optimal performance of the algorithm. In order to avoid the previous problems and improve the optimization performance of the algorithm, this paper improves the pulse rate Rl+1 and the loudness Ai
l+1.1 2
0
0
( ) sin( )2.3
0.70.9
l l li i iR R R
RA
ττ
+ = π
=
= =
(9)
where Ril+1 is the chaotic pulse rate, τ – the it-
eration parameter of the pulse rate, and R0 and A0 are the pulse loudness value and the initial loudness, respectively.
Figure 3 shows that the chaotic pulse rate Ri
l+1 varies from 0.5-1 and is controlled by sinu-soidal inverse mapping, therefore, it has chaot-ic ergodicity. Equation (9) makes the pulse rate have both sensitivity to the initial value and certainty of the chaotic variation range, and can avoid falling into a local optimal value. Mean-while, the global search ability of the algorithm can be improved. Figure 3. Value range of chaotic pulse rate
Ch
ao
tic
pu
lse
ra
te
Iterations
0 50 100 150 200 250 300
1
0.8
0.6
0.4
0.2
0

Li, D., et al.: Aero-Engine Exhaust Gas Temperature Prediction Based ... 850 THERMAL SCIENCE: Year 2021, Vol. 25, No. 2A, pp. 845-858
Confirmatory analysis
Genetic algorithm (GA), particle swarm optimization algorithm (PSO), glowworm swarm algorithm (GSO), and BA are selected as contrast function, and the test functions are used for comparative simulation test the optimization performance of CRBA. Table 1 lists the three test functions.
Table 1. Function expressions and their characteristics
Function Expression Search space Global minimum
Sphere 2
1( )
n
ii
f x x=
= ∑ [–100, 100]d xi = 0, f(x) = 0
Griewank ( ) ( ){ }2
1100 100cos 2 10
n
i ii
f x x x=
= − π + ∑ [–600, 600]d xi = 0, f(x) = 0
Rastrigin ( ) 2
1 1
1 cos 14000
nni
ii i
xf x x
i= =
= − +
∑ ∏ [–5.12, 5.12]d xi = 0, f(x) = 0
In order to test the effectiveness of the improved algorithm and compare it with the optimization performance of other algorithms, the experimental algorithms have been stan-dardized. Set the maximum number of iterations i to 1000 and the population size N to 50. The test function and search space are determined according to the range of each test function in tab. 1, in order to reduce the influence of the setting of the population parameters on the performance of BA and other algorithms. Set the pulse rate and loudness of BA and CRBA to
Figure 4. Convergence curves of test function; (a) Sphere function, (b) Griewank function, and (c) Rastrigin function (for color image see journal web site)
(a) (b)
CRBA
GSO
GA
BA
PSO
16
14
12
10
8
6
4
2
0
Fit
ne
ss v
alu
e
0 100 200 300 400 500 600 700 800 900 1000
Iterations
Fit
ne
ss v
alu
e CRBA
GSO
GA
BA
PSO
0 100 200 300 400 500 600 700 800 900 1000
8
7
6
5
4
3
2
1
0
Iterations
(c)
CRBA
GSO
GA
BA
PSO
6000
5000
4000
3000
2000
1000
0
Fit
ne
ss v
alu
e
Iterations
0 100 200 300 400 500 600 700 800 900 1000
Li, D., et al.: Aero-Engine Exhaust Gas Temperature Prediction Based ... THERMAL SCIENCE: Year 2021, Vol. 25, No. 2A, pp. 845-858 851
be consistent to avoid the influence of parameter setting on the optimization performance, as shown in eq. (7), R0 = 0.7, A0 = 0.9. The initial position of each algorithm is set as: the maximum Pop_Max = 15 and the minimum Pop_Min = –15, and the initial speed is a random value which generates randomly on the basis of the initial position.
Figure 4 shows the test results of each algorithm. As can be seen from fig. 4, the GA and BA have faster convergence speed among all the algorithms tested, but the convergence accuracy of the two algorithms is not as good as that shown in fig. 4(a). From the results of fig. 4(b), it can be found that the convergence accuracy of PSO and GSO is slightly inferior. The analysis of results in fig. 4(c) reflect that the convergence speed of CRBA is the fastest when the convergence accuracy is roughly the same. Therefore, compared with other four algorithms, CRBA has both higher convergence accuracy and faster convergence speed, and has the best comprehensive performance.
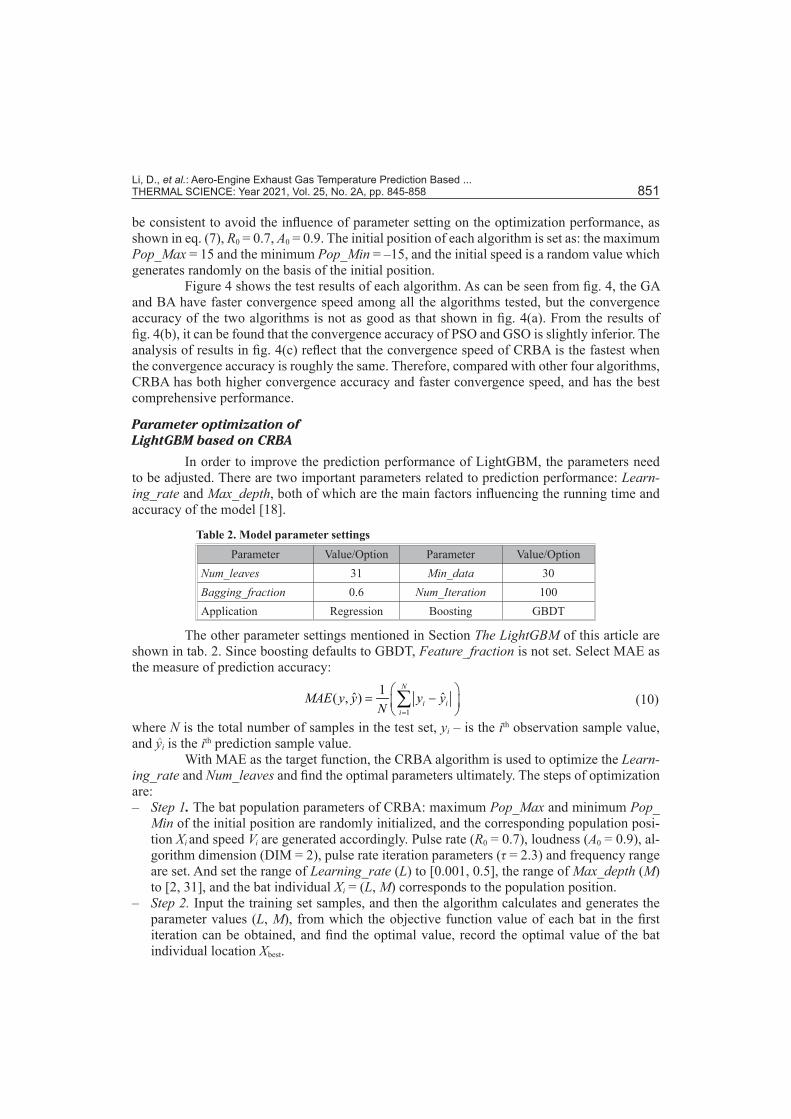
Parameter optimization of LightGBM based on CRBA
In order to improve the prediction performance of LightGBM, the parameters need to be adjusted. There are two important parameters related to prediction performance: Learn-ing_rate and Max_depth, both of which are the main factors influencing the running time and accuracy of the model [18].
Table 2. Model parameter settingsParameter Value/Option Parameter Value/Option
Num_leaves 31 Min_data 30Bagging_fraction 0.6 Num_Iteration 100Application Regression Boosting GBDT
The other parameter settings mentioned in Section The LightGBM of this article are shown in tab. 2. Since boosting defaults to GBDT, Feature_fraction is not set. Select MAE as the measure of prediction accuracy:
1
1ˆ ˆ( , )N
i ii
MAE y y y yN =
= − ∑ (10)
where N is the total number of samples in the test set, yi – is the ith observation sample value, and yi is the ith prediction sample value.
With MAE as the target function, the CRBA algorithm is used to optimize the Learn-ing_rate and Num_leaves and find the optimal parameters ultimately. The steps of optimization are: – Step 1. The bat population parameters of CRBA: maximum Pop_Max and minimum Pop_
Min of the initial position are randomly initialized, and the corresponding population posi-tion Xi and speed Vi are generated accordingly. Pulse rate (R0 = 0.7), loudness (A0 = 0.9), al-gorithm dimension (DIM = 2), pulse rate iteration parameters (τ = 2.3) and frequency range are set. And set the range of Learning_rate (L) to [0.001, 0.5], the range of Max_depth (M) to [2, 31], and the bat individual Xi = (L, M) corresponds to the population position.
– Step 2. Input the training set samples, and then the algorithm calculates and generates the parameter values (L, M), from which the objective function value of each bat in the first iteration can be obtained, and find the optimal value, record the optimal value of the bat individual location Xbest.

Li, D., et al.: Aero-Engine Exhaust Gas Temperature Prediction Based ... 852 THERMAL SCIENCE: Year 2021, Vol. 25, No. 2A, pp. 845-858
– Step 3. The bat population calculates the emission frequency fi of each bat within the number of iterations by eq. (3). The motion speed a is obtained by eq. (4), and the position b in the search space is updated according to eq. (5), and perform out-of-bounds processing on speed and position.
– Step 4. Generate uniformly distributed random numbers rand and ε. If rand > Ri, a new global optimal solution is needed, which is generated by ε perturbing the current solution. And perform out-of-bounds processing on it and then calculates the new objective function value.
– Step 5. Generate a uniformly distributed random number rand. If the random number rand < Ai and f(X) < f(Xbest), accept the new solution generated in Step 4, and update the loudness and chaotic pulse rate according to eqs. (7) and (9).
– Step 6. Sort the objective function values of all bat individuals, find the optimal value in the current population, and record the position of the optimal value.
– Step 7. Repeat Steps 4-6 until the set optimal solution conditions are satisfied or the algo-rithm reaches the maximum iterations.
– Step 8. Output global optimal value (i. e. minimum MAE value) and optimal solution (i. e. optimal CRBA-LightGBM parameter value).
Experiments and discussion
Flight data selection and preprocessing
Since the change of aero-engine EGT depends on the working condition of the ae-ro-engine and external conditions, it is necessary to select flight data that can characterize the EGT. The data format and its source is shown in tab. 3.
Table 3. Flight parameter format of a type of aero-engine
Parameters Contents Parameters Contents
N1 [%] Low compressor rotor speed PLA [°] Throttle angle
N2 [%] High compressor rotor speed Wf [kg] Fuel flow
T6 [°C] Gas temperature after turbine Pm [MPa] Oil pressure
T9 [°C] Exhaust gas temperature T1 [°C] Inlet temperature
P6 [kPa] Pressure after turbine
The statistical product and service solu-tions software is used for factor analysis, and the most influential factors are selected accord-ing to the decreasing condition of the eigenvalue and the cumulative variance contribution rate, as shown in fig. 5. After analysis, the first five factors with cumulative variance contribution rate of 95.98% are selected for EGT prediction.
Finally, high compressor rotor speed, N2, low compressor rotor speed, N1, fuel flow, Wf, and inlet temperature, T1, are selected as input parameters. Figure 5. Scree plot
Eig
en
va
lue
Factor number
1 2 3 4 5 6 7 8 9
5
4
3
2
1
0

Li, D., et al.: Aero-Engine Exhaust Gas Temperature Prediction Based ... THERMAL SCIENCE: Year 2021, Vol. 25, No. 2A, pp. 845-858 853
When extracting the aforementioned characteristic parameters, the following prepro-cessing is performed: – Outlier rejection. In order to avoid affecting the classification effect, for points that deviate
significantly from the normal range of the parameters and the remaining parameters are normal at the same time point should be eliminated.
– Synchronous processing. The flight data recorder records 4 frames of flight data in 1 second, but due to the different sampling frequency of different parameters, they are not synchro-nized in time, which requires synchronization processing. The processing method is to av-erage the parameters within 1 second.
– Data normalization. Due to the different measurement accuracy and dimension of the selected parameters, as well as the need for data confidentiality, all parameters are normalized to 0 and 1.
Table 4. Processed sample dataData points N1 N2 T1 Wf T9
1 0.9828 0.9939 0.4820 0.8133 0.95752 0.9802 0.9927 0.4740 0.8130 0.9550
⋮500 0.0495 0.0992 0.8599 0.0240 0.4325501 0.0513 0.1034 0.8556 0.248 0.4325
⋮
999 0.1880 0.2186 0.6113 0.2982 0.57501000 0.1830 0.2126 0.6108 0.2902 0.5736
According to the aforemen-tioned principles and processing methods, a total of 1000 sample data are obtained from 5 sorties. Part of the data has been shown in tab. 4. Divide the previous data into training set and test set in a ratio of 4:1. And the prediction flow chart of the prediction model is shown in fig. 6.
Model evaluation index
The MAE value can directly describe the error between predicted value and observed value, thus MAE could be introduced as one of the evaluation indexes. However, since the pre-dicted value is normalized, the MAE value will be too small, and there will be small difference between MAE value of different model. Therefore, the mean absolute percentage error (MAPE) is introduced in order to intuitively reflect the actual prediction error:
1
ˆ1ˆ( , ) 100%N
i i
i i
y yMAPE y y
N y=
−= ×∑ (11)
Figure 6. The CRBA-LightGBM EGT prediction flow chart
Flight data collecting Data preprocess Data prediction
Parameter
optimizationFlight data measured
by airborne sensors
Offloading and archieving
Outliers
removing
Data visualization
Data
synchronizing
Data
normalization
Processed data
Test set Training set
Light GBM
optimized
by CRBA
EGT
prediction
CRBA
optimization
algorithm
Li, D., et al.: Aero-Engine Exhaust Gas Temperature Prediction Based ... 854 THERMAL SCIENCE: Year 2021, Vol. 25, No. 2A, pp. 845-858
Goodness of fit R2 is an effective index to measure the degree of fit between regression curves and observed values. This paper also introduces goodness of fit to analyze the perfor-mance of each prediction model. The calculation equation of goodness of fit R2 is shown:
2
2 1
2
1
ˆ( )
( )
N
iiN
ii
y yR
y y
=
=
−=
−
∑
∑(12)
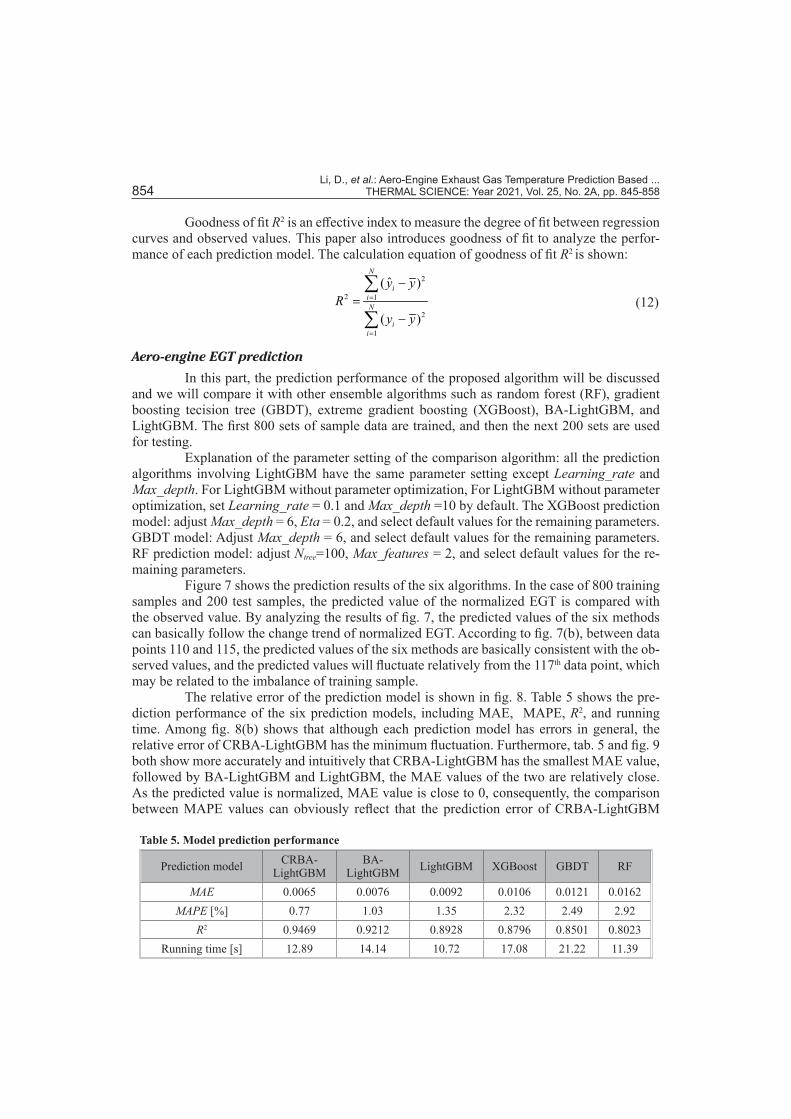
Aero-engine EGT prediction
In this part, the prediction performance of the proposed algorithm will be discussed and we will compare it with other ensemble algorithms such as random forest (RF), gradient boosting tecision tree (GBDT), extreme gradient boosting (XGBoost), BA-LightGBM, and LightGBM. The first 800 sets of sample data are trained, and then the next 200 sets are used for testing.
Explanation of the parameter setting of the comparison algorithm: all the prediction algorithms involving LightGBM have the same parameter setting except Learning_rate and Max_depth. For LightGBM without parameter optimization, For LightGBM without parameter optimization, set Learning_rate = 0.1 and Max_depth =10 by default. The XGBoost prediction model: adjust Max_depth = 6, Eta = 0.2, and select default values for the remaining parameters. GBDT model: Adjust Max_depth = 6, and select default values for the remaining parameters. RF prediction model: adjust Ntree=100, Max_features = 2, and select default values for the re-maining parameters.
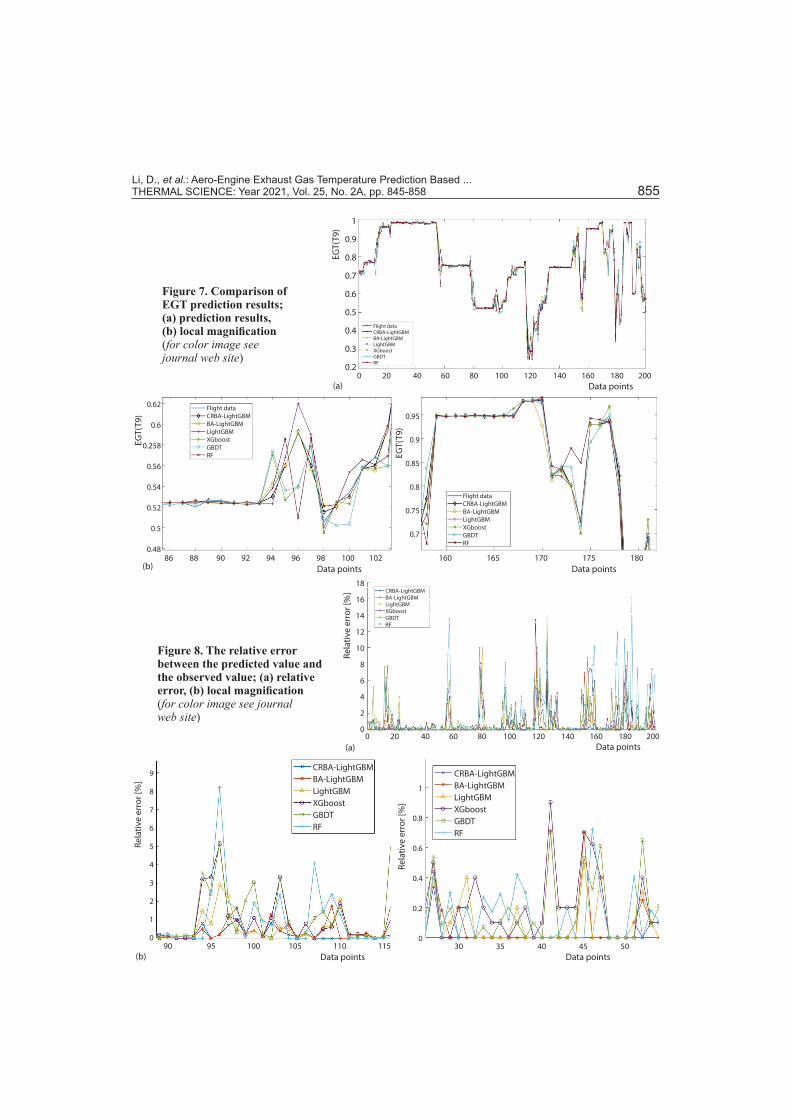
Figure 7 shows the prediction results of the six algorithms. In the case of 800 training samples and 200 test samples, the predicted value of the normalized EGT is compared with the observed value. By analyzing the results of fig. 7, the predicted values of the six methods can basically follow the change trend of normalized EGT. According to fig. 7(b), between data points 110 and 115, the predicted values of the six methods are basically consistent with the ob-served values, and the predicted values will fluctuate relatively from the 117th data point, which may be related to the imbalance of training sample.
The relative error of the prediction model is shown in fig. 8. Table 5 shows the pre-diction performance of the six prediction models, including MAE, MAPE, R2, and running time. Among fig. 8(b) shows that although each prediction model has errors in general, the relative error of CRBA-LightGBM has the minimum fluctuation. Furthermore, tab. 5 and fig. 9 both show more accurately and intuitively that CRBA-LightGBM has the smallest MAE value, followed by BA-LightGBM and LightGBM, the MAE values of the two are relatively close. As the predicted value is normalized, MAE value is close to 0, consequently, the comparison between MAPE values can obviously reflect that the prediction error of CRBA-LightGBM
Table 5. Model prediction performance
Prediction model CRBA-LightGBM
BA-LightGBM LightGBM XGBoost GBDT RF
MAE 0.0065 0.0076 0.0092 0.0106 0.0121 0.0162MAPE [%] 0.77 1.03 1.35 2.32 2.49 2.92
R2 0.9469 0.9212 0.8928 0.8796 0.8501 0.8023Running time [s] 12.89 14.14 10.72 17.08 21.22 11.39
Li, D., et al.: Aero-Engine Exhaust Gas Temperature Prediction Based ... THERMAL SCIENCE: Year 2021, Vol. 25, No. 2A, pp. 845-858 855
Figure 7. Comparison of EGT prediction results; (a) prediction results, (b) local magnification (for color image see journal web site)
(b)
Flight data
CRBA-LightGBM
BA-LightGBM
LightGBM
XGboost
GBDT
RF
Data points Data points
EG
T(T
9)
EG
T(T
9)
0.62
0.6
0.258
0.56
0.54
0.52
0.5
0.48
86 88 90 92 94 96 98 100 102
Flight data
CRBA-LightGBM
BA-LightGBM
LightGBM
XGboost
GBDT
RF
160 165 170 175 180
0.95
0.9
0.85
0.8
0.75
0.7
(a)
1
0.9
0.8
0.7
0.6
0.5
0.4
0.3
0.2
EG
T(T
9)
Flight data
CRBA-LightGBM
BA-LightGBM
LightGBM
XGboost
GBDT
RF
0 20 40 60 80 100 120 140 160 180 200
Data points
Figure 8. The relative error between the predicted value and the observed value; (a) relative error, (b) local magnification (for color image see journal web site)
(a)
18
16
14
12
10
8
6
4
2
0
Re
lati
ve
err
or
[%] CRBA-LightGBM
BA-LightGBM
LightGBM
XGboost
GBDT
RF
0 20 40 60 80 100 120 140 160 180 200
Data points
(b) Data points Data points
Re
lati
ve
err
or
[%]
9
8
7
6
5
4
3
2
1
0
90 95 100 105 110 115 30 35 40 45 50
1
0.8
0.6
0.4
0.2
0
CRBA-LightGBM
BA-LightGBM
LightGBM
XGboost
GBDT
RF
CRBA-LightGBM
BA-LightGBM
LightGBM
XGboost
GBDT
RF
Re
lati
ve
err
or
[%]

Li, D., et al.: Aero-Engine Exhaust Gas Temperature Prediction Based ... 856 THERMAL SCIENCE: Year 2021, Vol. 25, No. 2A, pp. 845-858
model is the smallest, which indi-cating that CRBA-LightGBM has the highest prediction accuracy. Fur-thermore, the prediction accuracy of LightGBM is generally higher in the ensemble algorithm. Meanwhile, CRBA-LightGBM has the largest R2 value, which is closest to 1, indicat-ing that it fits the observations best overall. From the perspective of run-ning time, LightGBM has the short-est running time, followed by RF. The running time of CRBA-LightGBM is
close to RF. In summary, CRBA-LightGBM maintains a high prediction accuracy, while also has a short running time. Therefore, it can be concluded that LightGBM optimized by CRBA is suitable for EGT prediction.
Conclusion
In this paper, we propose an aero-engine EGT prediction model based on LightGBM optimized by CRBA algorithm, which can predict the EGT based on the flight data from the airborne sensors.
By introducing sinusoidal inverse mapping to improve the pulse rate, the BA is op-timized. The optimized BA has higher optimization accuracy and faster optimization speed. The MAE is used as the objective function, and the improved BA is used to optimize two important parameters in LightGBM. Compared with BA-LightGBM, LightGBM, XGBoost, GBDT, and RF, the prediction effect of LightGBM has been better than XGBoost, GBDT, and RF models, and the LightGBM optimized by BA and CRBA can further reduce MAE, and CRBA-LightGBM can reach the minimum MAE and MAPE, and it has the best fit to observed values as well as a higher efficiency. Consequently, it can be concluded that CRBA-LightGBM is applicable to aero-engine EGT prediction.
Acknowledgment
This research was funded by the National Natural Science Foundation of China (No. 51506221).
Nomenclature
Figure 9. Model prediction performance comparison
0 0.005 0.01 0.015 0.02
MAE
0.0065
0.0162
0.0121
0.0106
0.0092
0.0076
RF
GBDT
XGBOOST
LIGHTGBM
BA-LIGHTGBM
CRBA-LIGHTGBM 0.9469
0.8023
0.8501
0.8796
0.8928
0.9212
0.7 0.75 0.8 0.85 0.9 0.95 1
R2
RF
GBDT
XGBOOST
LIGHTGBM
BA-LIGHTGBM
CRBA-LIGHTGBM
RF
GBDT
XGBOOST
LIGHTGBM
BA-LIGHTGBM
CRBA-LIGHTGBM
RF
GBDT
XGBOOST
LIGHTGBM
BA-LIGHTGBM
CRBA-LIGHTGBM0.77
2.92
2.49
2.32
1.35
1.03
12.89
11.39
21.22
17.08
10.72
14.14
0 0.5 1 1.5 2 2.5 3 3.5 0 5 10 15 20 25
MAPE Running time
Al – loudnessA0 – initial loudnessBagging_fraction – proportion of selected data in
total data volumeEta – learning rate in XGBoostfi – emission frequency of the bat i,fmin – minimum emission frequencyfmax – maximum emission frequencyfi (X) – sub-model in each iterationL[Fm(x), Y] – cost functionFeature_fraction – proportion of selected
features in each iterationLearning_rate – learning rate
Max_depth – maximum learning depthMax_depth – maximum depth of treeMax_features – numbers of features in subsetMin_data– minimum amount per treeMin_data – minimum amount of dataN – total number of samples in the test setN1 – low compressor rotor speedN2 – high compressor rotor speedNtree – numbers of decision tree in RFNum_leaves – number of leavesPm – oil pressureP6 – pressure after turbinePop_Max – maximum initial position

Li, D., et al.: Aero-Engine Exhaust Gas Temperature Prediction Based ... THERMAL SCIENCE: Year 2021, Vol. 25, No. 2A, pp. 845-858 857
References[1] Zolghadri, A., et al., Fault Diagnosis and Fault-Tolerant Control and Guidance for Aerospace Vehicles:
From Theory to Application, Springer, New York, USA, 2013[2] Yilmaz, O., et al., A Repair and Overhaul Methodology for Aeroengine Components, Robotics and Com-
puter-Integrated Manufacturing, 26 (2010), 2, pp. 190-201[3] Ilbas, M., Mahmut T., Estimation of Exhaust Gas Temperature Using Artificial Neural Network in Turbo-
fan Engines, Journal of Thermal Sciences and Technology, 32 (2012), 2, pp. 11-18[4] Zhong, S., et al., Convolution Sum Discrete Process Neural Network and Its Application in Aeroen-
gine Exhausted Gas Temperature Prediction, Acta Aeronautica et Astronautica Sinica, 33 (2012), 3, pp. 438-445
[5] Ding, G., et al., Prediction of Aeroengine Exhaust Gas Temperature Using Process Neural Network, Jour-nal of Aerospace Power, 24 (2009), 5, pp.1035-1039
[6] Kumar, A., et al., Exhaust Gas Temperature Data Prediction by Autoregressive Models, Proceedings, 28th IEEE Canadian Conference on Electrical and Computer Engineering (CCECE), Nova Scotia, Canada, 2015, pp. 976-981
[7] Jun, P., et al., Aero-Engine Exhaust Gas Temperature Prediction Model Based on IFOA-GRNN, Journal of Aerospace Power, 34 (2019), 1, pp. 8-17
[8] Maragoudakis, M., Loukis, E., Using Ensemble Random Forests for the Extraction and Exploitation of Knowledge on Gas Turbine Blading Faults Identification, Or Insight, 25 (2012), 2, pp. 80-104
[9] Pan, B., Application of XGBoost Algorithm in Hourly PM2.5 Concentration Prediction, IOP Conference Series: Earth and Environmental Science, 113 (2012), 1, 012127
[10] Huang, Q., et al., A Prediction Method for Aero-Engine Health Management Based on Non-Linear Time Series Analysis, Proceedings, IEEE International Conference on Prognostics and Health Management, Otawa, Canada, 2016, pp. 1-8
[11] Zhou, Y., et al., Research on Aero-Engine Maintenance Level Decision Based on Improved Artificial Fish-Swarm Optimization Random Forest Algorithm, Proceedings, International Conference on Sensing, Diagnostics, Prognostics, and Control (SDPC), Xi’an, China, 2018, pp. 606-610
[12] Ke, G. et al., The LightGBM: a Highly Efficient Gradient Boosting Decision Tree, Proceedings, 31st
Coference on Neural Information Processing Systems, Long Beach, Cal. USA, 2017, pp. 3146-3154[13] Wang, D., et al., The LightGBM: An Effective miRNA Classification Method in Breast Cancer Patients,
Proceedings, International Conference on Computational Biology and Bioinformatics, Newark, N. J., USA, 2017, pp. 7-11
[14] Ma. X, et al., Study on A Prediction of P2P Network Loan Default Based on the Machine Learning LightGBM and XGboost Algorithms according to Different High Dimensional Data Cleaning, Electronic Commerce Research and Applications, 31 (2018), Sept.-Oct., pp. 24-39
[15] Ustuner, M., Sanli, F., Polarimetric Target Decompositions and Light Gradient Boosting Machine for Crop Classification: A Comparative Evaluation, Isprs International Journal of Geo Information, 8 (2019), 2, 97
[16] Ju, Y., et al., A Model Combining Convolutional Neural Network and LightGBM Algorithm for Ultra-Short-Term Wind Power Forecasting, IEEE Access, 7 (2019), Feb., pp. 28309-28318
[17] Tan, P.-N., et al., Introduction Data Mining, Addison Wesley, Boston, Mass., USA, 2015[18] Elith, J., et al., A Working Guide to Boosted Regression Trees, Journal of Animal Ecology, 77 (2008), 4,
pp. 802-813.[19] Yang, X., A New Metaheuristic Bat-Inspired Algorithm, Computer Knowledge & Technology, 284 (2010),
Apr., pp. 65-74
Pop_Min – minimum initial positionPLA – throttle angleRi – pulse rateRi
l+1 – chaotic pulse rateR0 – pulse loudness valueT1 – inlet temperatureT6 – gas temperature after turbineT9 – exhaust gas temperatureV li – speed of bat i in the lth iterationWf – fuel flowX li – position of bat i in the lth iteration
Xbest – optimal global position in the ith iterationY – observed value yi – ith observation sample valueyi – ith prediction sample value
Greek symbols
α – a random number in the interval [–1, 1]ξ – random variable limited to [0, 1]τ – iteration parameter of the pulse rate
[Wh/year]

Li, D., et al.: Aero-Engine Exhaust Gas Temperature Prediction Based ... 858 THERMAL SCIENCE: Year 2021, Vol. 25, No. 2A, pp. 845-858
[20] Wang, Y., et al., Study on Improved Singular Value Decomposition Denoising Method Applied to UAV Flight Parameter Data, Proceedings, 20th IEEE International Conference on High Performance Switching and Routing (HPSR), Hi'an, China, 2019, pp. 1-6
[21] Yang, X., Nature-Inspired Metaheuristic Algorithms, Luniver press, London, UK, 2008, pp. 97-104[22] Yang, X., Bat Algorithm and Cuckoo Search: A Tutorial, Artificial Intelligence, Evolutionary Computing
and Metaheuristics, 427 (2013), Jan., pp. 421-434[23] Adarsh, B., et al., Economic Dispatch Using Chaotic Bat Algorithm, Energy, 96 (2016), Feb., pp. 666-675[24] Karri, C., Jena, U., Fast Vector Quantization Using a Bat Algorithm for Image Compression, Engineering
Science & Technology An International Journal, 19 (2015), 2, pp. 769-781[25] Rahimi, A., et al., The Online Parameter Identification of Chaotic Behaviour in Permanent Magnet Syn-
chronous Motor by Self-Adaptive Learning Bat-Inspired Algorithm, International Journal of Electrical Power and Energy Systems, 78 (2016), June, pp. 285-291
[26] Dinh, B., et al., Bat Optimal Algorithm Combined Uniform Mutation with Gaussian Mutation, Control and Decision, 32 (2017), 10, pp. 1775-1781
[27] Ye. C., Bat Algorithm with Chaotic Search Strategy and Analysis of Its Property, Computer Simulation, 25 (2013), 1, pp. 1183-1188
[28] Hamidzadeh, J., et al., Weighted Support Vector Data Description Based on Chaotic Bat Algorithm, Ap-plied Soft Computing, 60 (2017), Nov., pp. 540-551
Paper submitted: May 20, 2020Paper revised: June 27, 2020Paper accepted: July 8, 2020
© 2021 Society of Thermal Engineers of SerbiaPublished by the Vinča Institute of Nuclear Sciences, Belgrade, Serbia.
This is an open access article distributed under the CC BY-NC-ND 4.0 terms and conditions