Advisory Experience QUARTER INSIGHT - Citadel...
4
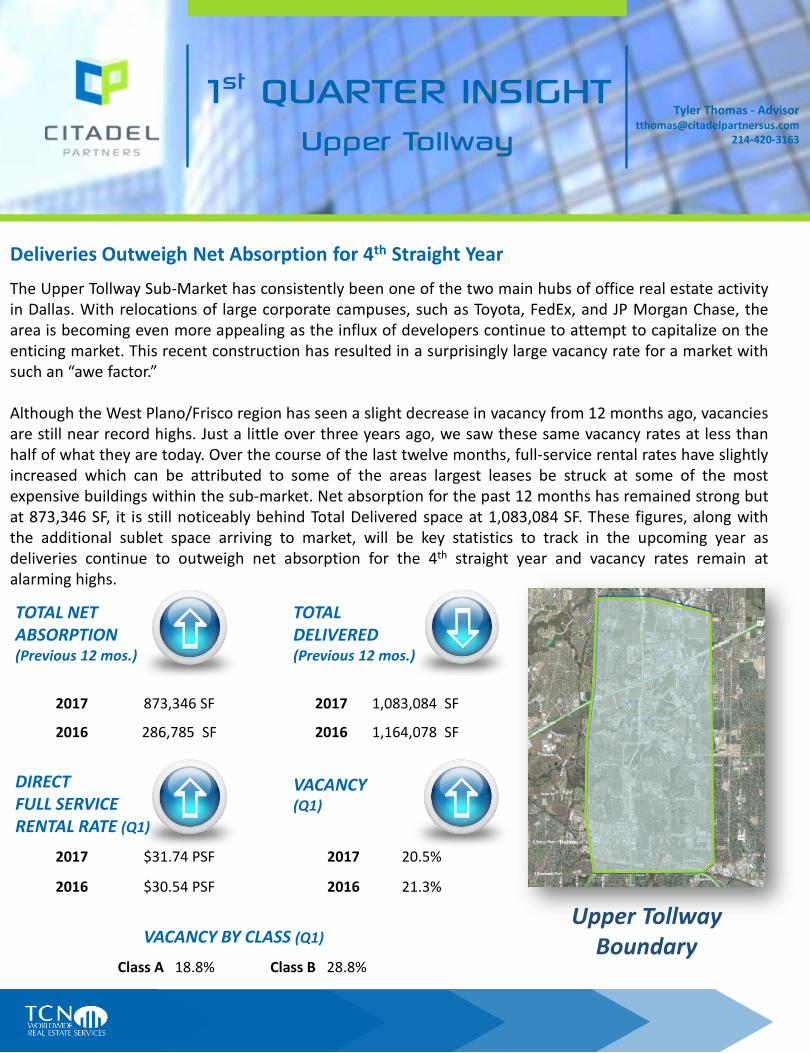
Deliveries Outweigh Net Absorption for 4 th Straight Year The Upper Tollway Sub-Market has consistently been one of the two main hubs of office real estate activity in Dallas. With relocations of large corporate campuses, such as Toyota, FedEx, and JP Morgan Chase, the area is becoming even more appealing as the influx of developers continue to attempt to capitalize on the enticing market. This recent construction has resulted in a surprisingly large vacancy rate for a market with such an “awe factor.” Although the West Plano/Frisco region has seen a slight decrease in vacancy from 12 months ago, vacancies are still near record highs. Just a little over three years ago, we saw these same vacancy rates at less than half of what they are today. Over the course of the last twelve months, full-service rental rates have slightly increased which can be attributed to some of the areas largest leases be struck at some of the most expensive buildings within the sub-market. Net absorption for the past 12 months has remained strong but at 873,346 SF, it is still noticeably behind Total Delivered space at 1,083,084 SF. These figures, along with the additional sublet space arriving to market, will be key statistics to track in the upcoming year as deliveries continue to outweigh net absorption for the 4 th straight year and vacancy rates remain at alarming highs. TOTAL NET ABSORPTION (Previous 12 mos.) TOTAL DELIVERED (Previous 12 mos.) 2017 873,346 SF 2017 1,083,084 SF 2016 286,785 SF 2016 1,164,078 SF DIRECT FULL SERVICE RENTAL RATE (Q1) VACANCY (Q1) 2017 $31.74 PSF 2017 20.5% 2016 $30.54 PSF 2016 21.3% VACANCY BY CLASS (Q1) Class A 18.8% Class B 28.8% Upper Tollway Boundary Tyler Thomas - Advisor [email protected] 214-420-3163 1 st QUARTER INSIGHT Upper Tollway
-
Upload
nguyenkien -
Category
Documents
-
view
214 -
download
0
Transcript of Advisory Experience QUARTER INSIGHT - Citadel...
Deliveries Outweigh Net Absorption for 4th Straight Year
Advisory Experience
Maxim – 700,000 SF
The Domain, Austin, TX – 70 Acres Weaver – 58,000 SF
Knoll Trail Plaza – 120,000 SF Build-to-Suit
Weaver – 171,000 SF Multi-marketTexas Instruments – 1,200,000 SF
Invensys – 45,000 SF Sublease
Texas Instruments – 70.537 Acres with a 441,362 SF Semiconductor
Flextronics – 1,500,000 SF
ESI – 70,000 SF
MULTIPLE TRANSACTIONS
The Upper Tollway Sub-Market has consistently been one of the two main hubs of office real estate activityin Dallas. With relocations of large corporate campuses, such as Toyota, FedEx, and JP Morgan Chase, thearea is becoming even more appealing as the influx of developers continue to attempt to capitalize on theenticing market. This recent construction has resulted in a surprisingly large vacancy rate for a market withsuch an “awe factor.”
Although the West Plano/Frisco region has seen a slight decrease in vacancy from 12 months ago, vacanciesare still near record highs. Just a little over three years ago, we saw these same vacancy rates at less thanhalf of what they are today. Over the course of the last twelve months, full-service rental rates have slightlyincreased which can be attributed to some of the areas largest leases be struck at some of the mostexpensive buildings within the sub-market. Net absorption for the past 12 months has remained strong butat 873,346 SF, it is still noticeably behind Total Delivered space at 1,083,084 SF. These figures, along withthe additional sublet space arriving to market, will be key statistics to track in the upcoming year asdeliveries continue to outweigh net absorption for the 4th straight year and vacancy rates remain atalarming highs.
This document has been prepared by Citadel Partners, LLC. for advertising and general information only. Citadel Partners, LL C. makes no guarantees, representations or warranties of any kind, expressed or implied,
regarding the information including, but not limited to, warranties of content, accuracy and reliability. Any interested party should undertake their own inquiries as to the accuracy of the information. Citadel Partners, LLC.
excludes unequivocally all inferred or implied terms, conditions and warranties arising out of this document and excludes all liability for loss and damages arising there from. This
publication is the copyrighted property of Citadel Partners, LLC. and/or their licensor(s). All rights reserved.
TOTAL NET ABSORPTION(Previous 12 mos.)
TOTALDELIVERED(Previous 12 mos.)
2017 873,346 SF 2017 1,083,084 SF
2016 286,785 SF 2016 1,164,078 SF
DIRECT FULL SERVICE RENTAL RATE (Q1)
VACANCY(Q1)
2017 $31.74 PSF 2017 20.5%
2016 $30.54 PSF 2016 21.3%
VACANCY BY CLASS (Q1)
Class A 18.8% Class B 28.8%
Upper Tollway Boundary
Tyler Thomas - [email protected]
214-420-3163
1st QUARTER INSIGHTUpper TollwayOFFICE LEASEADAPTIVE REUSE
TECHNOLOGY LEASEDISPOSITION
Plano's Legacy West reaches new heights with addition of Liberty Mutual's $325M campus
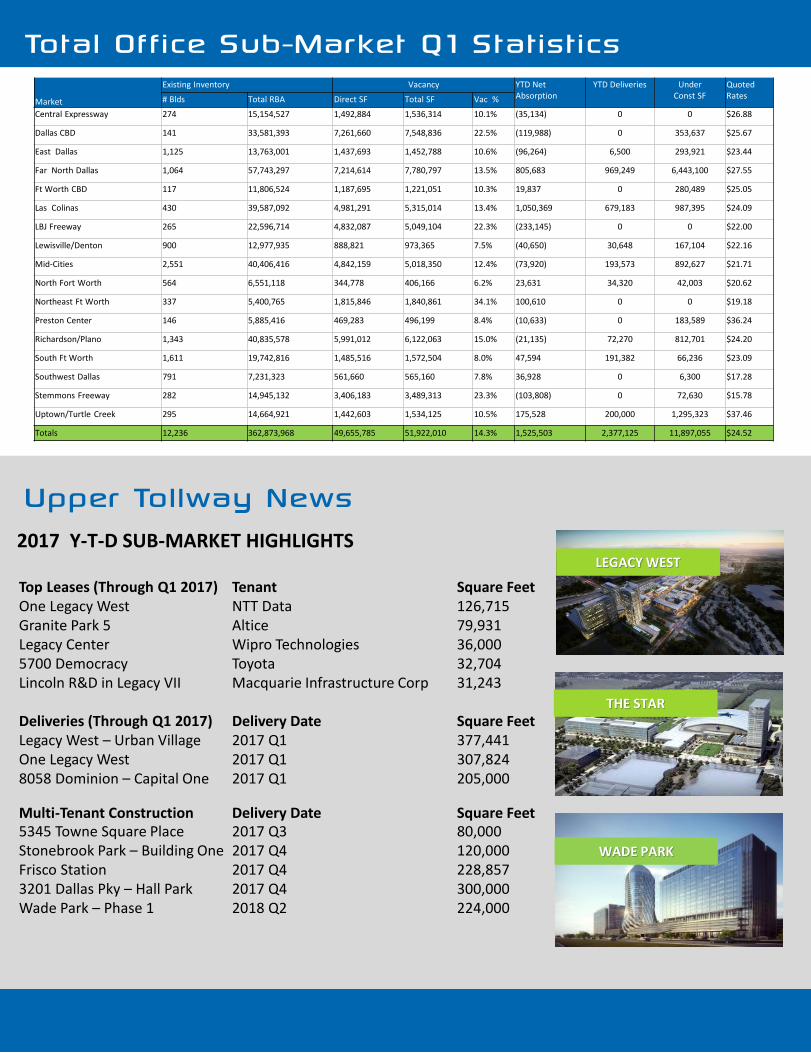
Total Office Sub-Market Q1 Statistics
As Q1 of 2017 concludes, the Upper Tollway Sub-Marketcontinues to show counterintuitive signs throughout. It is ourbelief that the rental rate spikes continue to mostly be aproduct of record high construction costs within these newdevelopments, more so than true tenant demand. WestPlano/Frisco continues to have a strong tenant interest in the1,000-15,000 SF range, but seems to be lacking the largegroups needed to backfill the 1 million plus square feet beingdelivered each year in speculative office buildings.
Owner/user properties continue to be highly sought after bylarge corporations putting more and more stress on thesenew speculative developments throughout the region. Thelarge relocations will continue to bring ancillarybusinesses/jobs to the area but with an abundance of newdevelopments, it may not be enough to backfill the largeamount of space currently on the market or arriving to themarket in the next 12-24 months. As mentioned in our Q3report, we believe more and more opportunities for tenantswill continue to arise over the next couple years as thenumber of large blocks of space continue to rise in this sub-market
LEASE RATES – FULL SERVICE(ALL CLASSES)
ABSORPTION / DELIVERIES / VACANCY(ALL CLASSES)
2017 Y-T-D SUB-MARKET HIGHLIGHTS
Office Sub-Market Momentum & Forecast
Upper Tollway News
Top Leases (Through Q1 2017) Tenant Square FeetOne Legacy West NTT Data 126,715Granite Park 5 Altice 79,931Legacy Center Wipro Technologies 36,0005700 Democracy Toyota 32,704Lincoln R&D in Legacy VII Macquarie Infrastructure Corp 31,243
Deliveries (Through Q1 2017) Delivery Date Square FeetLegacy West – Urban Village 2017 Q1 377,441One Legacy West 2017 Q1 307,8248058 Dominion – Capital One 2017 Q1 205,000
Multi-Tenant Construction Delivery Date Square Feet5345 Towne Square Place 2017 Q3 80,000Stonebrook Park – Building One 2017 Q4 120,000Frisco Station 2017 Q4 228,8573201 Dallas Pky – Hall Park 2017 Q4 300,000Wade Park – Phase 1 2018 Q2 224,000
THE STAR
WADE PARK
LEGACY WEST
The new Liberty Mutual regional campus will elevate Plano's Legacy West development — bringing the tallest structure, so far, to the $3.2 billion mixed-use project.
But it certainly won't be the tallest structure yet for Legacy West, with Palladium USA expected to soon begin its 30-story apartment tower on May 2 adjacent to the Boston-based insurance company's new regional hub. The milestone on the 19-story campus totaling 1.1 million square feet was quite pleasing for Liberty Mutual, said Sean Murphy, Liberty Mutual's director of design and construction. Murphy spoke with the Dallas Business Journal about the insurance company's plans to hire thousands of workers before the campus opens by the end of the year.
Liberty Mutual's new campus — having reached its
upper-most height — is one of the tallest structures in this part of the region and, symbolically, means the city is reaching new heights, said Mayor Harry LaRosiliere. "We want to create an environment for people that they want to work in and be part of this community," he said, adding this represents the citywide growth phase of Plano.
Liberty Mutual's campus will act like a beacon for the Plano community, giving yet another corporate endorsement to the city, said Sally Bane, the city's economic development director. "What has drawn people to this community is the world class business park and development," Bane said. "Companies are able to find the labor they need and access to the amenities their employees and customers want with great restaurants for dining and entertainment."
Dallas Business Journal 4.13.17
citadelpartnersus.com
Market
Existing Inventory Vacancy YTD NetAbsorption
YTD Deliveries UnderConst SF
QuotedRates# Blds Total RBA Direct SF Total SF Vac %
Central Expressway 274 15,154,527 1,492,884 1,536,314 10.1% (35,134) 0 0 $26.88
Dallas CBD 141 33,581,393 7,261,660 7,548,836 22.5% (119,988) 0 353,637 $25.67
East Dallas 1,125 13,763,001 1,437,693 1,452,788 10.6% (96,264) 6,500 293,921 $23.44
Far North Dallas 1,064 57,743,297 7,214,614 7,780,797 13.5% 805,683 969,249 6,443,100 $27.55
Ft Worth CBD 117 11,806,524 1,187,695 1,221,051 10.3% 19,837 0 280,489 $25.05
Las Colinas 430 39,587,092 4,981,291 5,315,014 13.4% 1,050,369 679,183 987,395 $24.09
LBJ Freeway 265 22,596,714 4,832,087 5,049,104 22.3% (233,145) 0 0 $22.00
Lewisville/Denton 900 12,977,935 888,821 973,365 7.5% (40,650) 30,648 167,104 $22.16
Mid-Cities 2,551 40,406,416 4,842,159 5,018,350 12.4% (73,920) 193,573 892,627 $21.71
North Fort Worth 564 6,551,118 344,778 406,166 6.2% 23,631 34,320 42,003 $20.62
Northeast Ft Worth 337 5,400,765 1,815,846 1,840,861 34.1% 100,610 0 0 $19.18
Preston Center 146 5,885,416 469,283 496,199 8.4% (10,633) 0 183,589 $36.24
Richardson/Plano 1,343 40,835,578 5,991,012 6,122,063 15.0% (21,135) 72,270 812,701 $24.20
South Ft Worth 1,611 19,742,816 1,485,516 1,572,504 8.0% 47,594 191,382 66,236 $23.09
Southwest Dallas 791 7,231,323 561,660 565,160 7.8% 36,928 0 6,300 $17.28
Stemmons Freeway 282 14,945,132 3,406,183 3,489,313 23.3% (103,808) 0 72,630 $15.78
Uptown/Turtle Creek 295 14,664,921 1,442,603 1,534,125 10.5% 175,528 200,000 1,295,323 $37.46
Totals 12,236 362,873,968 49,655,785 51,922,010 14.3% 1,525,503 2,377,125 11,897,055 $24.52
$19.00$21.00$23.00$25.00$27.00$29.00$31.00$33.00
2006 2008 2010 2012 2014 2016Q1 2017
Direct Rental Rate
5.00%
10.00%
15.00%
20.00%
25.00%
-300,000
100,000
500,000
2006 2008 2010 2012 2014 20162017
Total Net Absorption (sf) RBA Delivered (sf)Direct Vacant %

Plano's Legacy West reaches new heights with addition of Liberty Mutual's $325M campus
Total Office Sub-Market Q1 Statistics
As Q1 of 2017 concludes, the Upper Tollway Sub-Marketcontinues to show counterintuitive signs throughout. It is ourbelief that the rental rate spikes continue to mostly be aproduct of record high construction costs within these newdevelopments, more so than true tenant demand. WestPlano/Frisco continues to have a strong tenant interest in the1,000-15,000 SF range, but seems to be lacking the largegroups needed to backfill the 1 million plus square feet beingdelivered each year in speculative office buildings.
Owner/user properties continue to be highly sought after bylarge corporations putting more and more stress on thesenew speculative developments throughout the region. Thelarge relocations will continue to bring ancillarybusinesses/jobs to the area but with an abundance of newdevelopments, it may not be enough to backfill the largeamount of space currently on the market or arriving to themarket in the next 12-24 months. As mentioned in our Q3report, we believe more and more opportunities for tenantswill continue to arise over the next couple years as thenumber of large blocks of space continue to rise in this sub-market
LEASE RATES – FULL SERVICE(ALL CLASSES)
ABSORPTION / DELIVERIES / VACANCY(ALL CLASSES)
2017 Y-T-D SUB-MARKET HIGHLIGHTS
Office Sub-Market Momentum & Forecast
Upper Tollway News
Top Leases (Through Q1 2017) Tenant Square FeetOne Legacy West NTT Data 126,715Granite Park 5 Altice 79,931Legacy Center Wipro Technologies 36,0005700 Democracy Toyota 32,704Lincoln R&D in Legacy VII Macquarie Infrastructure Corp 31,243
Deliveries (Through Q1 2017) Delivery Date Square FeetLegacy West – Urban Village 2017 Q1 377,441One Legacy West 2017 Q1 307,8248058 Dominion – Capital One 2017 Q1 205,000
Multi-Tenant Construction Delivery Date Square Feet5345 Towne Square Place 2017 Q3 80,000Stonebrook Park – Building One 2017 Q4 120,000Frisco Station 2017 Q4 228,8573201 Dallas Pky – Hall Park 2017 Q4 300,000Wade Park – Phase 1 2018 Q2 224,000
THE STAR
WADE PARK
LEGACY WEST
The new Liberty Mutual regional campus will elevate Plano's Legacy West development — bringing the tallest structure, so far, to the $3.2 billion mixed-use project.
But it certainly won't be the tallest structure yet for Legacy West, with Palladium USA expected to soon begin its 30-story apartment tower on May 2 adjacent to the Boston-based insurance company's new regional hub. The milestone on the 19-story campus totaling 1.1 million square feet was quite pleasing for Liberty Mutual, said Sean Murphy, Liberty Mutual's director of design and construction. Murphy spoke with the Dallas Business Journal about the insurance company's plans to hire thousands of workers before the campus opens by the end of the year.
Liberty Mutual's new campus — having reached its
upper-most height — is one of the tallest structures in this part of the region and, symbolically, means the city is reaching new heights, said Mayor Harry LaRosiliere. "We want to create an environment for people that they want to work in and be part of this community," he said, adding this represents the citywide growth phase of Plano.
Liberty Mutual's campus will act like a beacon for the Plano community, giving yet another corporate endorsement to the city, said Sally Bane, the city's economic development director. "What has drawn people to this community is the world class business park and development," Bane said. "Companies are able to find the labor they need and access to the amenities their employees and customers want with great restaurants for dining and entertainment."
Dallas Business Journal 4.13.17
citadelpartnersus.com
Market
Existing Inventory Vacancy YTD NetAbsorption
YTD Deliveries UnderConst SF
QuotedRates# Blds Total RBA Direct SF Total SF Vac %
Central Expressway 274 15,154,527 1,492,884 1,536,314 10.1% (35,134) 0 0 $26.88
Dallas CBD 141 33,581,393 7,261,660 7,548,836 22.5% (119,988) 0 353,637 $25.67
East Dallas 1,125 13,763,001 1,437,693 1,452,788 10.6% (96,264) 6,500 293,921 $23.44
Far North Dallas 1,064 57,743,297 7,214,614 7,780,797 13.5% 805,683 969,249 6,443,100 $27.55
Ft Worth CBD 117 11,806,524 1,187,695 1,221,051 10.3% 19,837 0 280,489 $25.05
Las Colinas 430 39,587,092 4,981,291 5,315,014 13.4% 1,050,369 679,183 987,395 $24.09
LBJ Freeway 265 22,596,714 4,832,087 5,049,104 22.3% (233,145) 0 0 $22.00
Lewisville/Denton 900 12,977,935 888,821 973,365 7.5% (40,650) 30,648 167,104 $22.16
Mid-Cities 2,551 40,406,416 4,842,159 5,018,350 12.4% (73,920) 193,573 892,627 $21.71
North Fort Worth 564 6,551,118 344,778 406,166 6.2% 23,631 34,320 42,003 $20.62
Northeast Ft Worth 337 5,400,765 1,815,846 1,840,861 34.1% 100,610 0 0 $19.18
Preston Center 146 5,885,416 469,283 496,199 8.4% (10,633) 0 183,589 $36.24
Richardson/Plano 1,343 40,835,578 5,991,012 6,122,063 15.0% (21,135) 72,270 812,701 $24.20
South Ft Worth 1,611 19,742,816 1,485,516 1,572,504 8.0% 47,594 191,382 66,236 $23.09
Southwest Dallas 791 7,231,323 561,660 565,160 7.8% 36,928 0 6,300 $17.28
Stemmons Freeway 282 14,945,132 3,406,183 3,489,313 23.3% (103,808) 0 72,630 $15.78
Uptown/Turtle Creek 295 14,664,921 1,442,603 1,534,125 10.5% 175,528 200,000 1,295,323 $37.46
Totals 12,236 362,873,968 49,655,785 51,922,010 14.3% 1,525,503 2,377,125 11,897,055 $24.52
$19.00$21.00$23.00$25.00$27.00$29.00$31.00$33.00
2006 2008 2010 2012 2014 2016Q1 2017
Direct Rental Rate
5.00%
10.00%
15.00%
20.00%
25.00%
-300,000
100,000
500,000
2006 2008 2010 2012 2014 20162017
Total Net Absorption (sf) RBA Delivered (sf)Direct Vacant %

Deliveries Outweigh Net Absorption for 4th Straight Year
Advisory Experience
Maxim – 700,000 SF
The Domain, Austin, TX – 70 Acres Weaver – 58,000 SF
Knoll Trail Plaza – 120,000 SF Build-to-Suit
Weaver – 171,000 SF Multi-marketTexas Instruments – 1,200,000 SF
Invensys – 45,000 SF Sublease
Texas Instruments – 70.537 Acres with a 441,362 SF Semiconductor
Flextronics – 1,500,000 SF
ESI – 70,000 SF
MULTIPLE TRANSACTIONS
The Upper Tollway Sub-Market has consistently been one of the two main hubs of office real estate activityin Dallas. With relocations of large corporate campuses, such as Toyota, FedEx, and JP Morgan Chase, thearea is becoming even more appealing as the influx of developers continue to attempt to capitalize on theenticing market. This recent construction has resulted in a surprisingly large vacancy rate for a market withsuch an “awe factor.”
Although the West Plano/Frisco region has seen a slight decrease in vacancy from 12 months ago, vacanciesare still near record highs. Just a little over three years ago, we saw these same vacancy rates at less thanhalf of what they are today. Over the course of the last twelve months, full-service rental rates have slightlyincreased which can be attributed to some of the areas largest leases be struck at some of the mostexpensive buildings within the sub-market. Net absorption for the past 12 months has remained strong butat 873,346 SF, it is still noticeably behind Total Delivered space at 1,083,084 SF. These figures, along withthe additional sublet space arriving to market, will be key statistics to track in the upcoming year asdeliveries continue to outweigh net absorption for the 4th straight year and vacancy rates remain atalarming highs.
This document has been prepared by Citadel Partners, LLC. for advertising and general information only. Citadel Partners, LL C. makes no guarantees, representations or warranties of any kind, expressed or implied,
regarding the information including, but not limited to, warranties of content, accuracy and reliability. Any interested party should undertake their own inquiries as to the accuracy of the information. Citadel Partners, LLC.
excludes unequivocally all inferred or implied terms, conditions and warranties arising out of this document and excludes all liability for loss and damages arising there from. This
publication is the copyrighted property of Citadel Partners, LLC. and/or their licensor(s). All rights reserved.
TOTAL NET ABSORPTION(Previous 12 mos.)
TOTALDELIVERED(Previous 12 mos.)
2017 873,346 SF 2017 1,083,084 SF
2016 286,785 SF 2016 1,164,078 SF
DIRECT FULL SERVICE RENTAL RATE (Q1)
VACANCY(Q1)
2017 $31.74 PSF 2017 20.5%
2016 $30.54 PSF 2016 21.3%
VACANCY BY CLASS (Q1)
Class A 18.8% Class B 28.8%
Upper Tollway Boundary
Tyler Thomas - [email protected]
214-420-3163
1st QUARTER INSIGHTUpper TollwayOFFICE LEASEADAPTIVE REUSE
TECHNOLOGY LEASEDISPOSITION