ADVANCES IN YEAST AND MOLD MONODRUG AND …
252
ADVANCES IN YEAST AND MOLD MONODRUG AND COMBINATION DRUG ANTIFUNGAL SUSCEPTIBILITY TESTING by Tracy Jane Wetter A dissertation submitted in partial fulfillment of the requirements for the degree of Doctor of Philosophy in Microbiology MONTANA STATE UNIVERSITY Bozeman, Montana April 2004
Transcript of ADVANCES IN YEAST AND MOLD MONODRUG AND …

ADVANCES IN YEAST AND MOLD MONODRUG AND COMBINATION DRUG ANTIFUNGAL SUSCEPTIBILITY TESTING
by
Tracy Jane Wetter
A dissertation submitted in partial fulfillment of the requirements for the degree
of
Doctor of Philosophy
in
Microbiology
MONTANA STATE UNIVERSITY Bozeman, Montana
April 2004

© COPYRIGHT
by
Tracy Jane Wetter
2004
All Rights Reserved
ii
APPROVAL
of a dissertation submitted by
Tracy Jane Wetter
This dissertation has been read by each member of the dissertation committee and has been found to be satisfactory regarding content, English usage, format, citations, bibliographic style, and consistency, and is ready for submission to the College of Graduate Studies. Dr. Rick Morrison, Ph.D
Approved for the Department of Microbiology
Dr. Tim Ford, Ph.D.
Approved for the College of Graduate Studies
Dr. Bruce McLeod, Ph.D.

iii
STATEMENT OF PERMISSION TO USE
In presenting this dissertation in partial fulfillment of the requirements for a doctoral
degree at Montana State University, I agree that the Library shall make it available to
borrowers under the rules of the Library. I further agree that copying of this dissertation
is allowable only for scholarly purposes, consistent with “fair use” as prescribed in the
U.S. Copyright Law. Requests for extensive copying or reproduction of this dissertation
should be referred to Bell & Howell Information and Learning, 300 North Zeeb Road,
Ann Arbor, Michigan 48106, to whom I have granted “the exclusive right to reproduce
and distribute my dissertation in and from microform along with the non-exclusive right
to reproduce and distribute my abstract in any format in whole or in part.”
Tracy Jane Wetter
April 15, 2004

iv
ACKNOWLEDGMENTS
I would first like to thank my parents, Linda and Ron, husband, Travis, and sister,
Sarah, for the unselfish support and love that you have provided me during my graduate
studies. Your support and guidance are the reasons I continue to reach my goals and I am
eternally grateful. I would next like to thank my mentor, Dr. Jim Cutler, for introducing
me to mycology and providing me with all of the necessary tools to become a “budding”
mycologist. I have been extraordinarily fortunate in having you as my mentor and being
given the many opportunities that the Pre-doctoral Medical Mycology Training Grant has
provided. I would like to thank my other committee members, Dr. Rick Morrison, Dr.
Cliff Bond, Dr. Ramona Marotz-Baden, Dr. Marty Hamilton, and Dr. Kevin Hazen. I
would like to thank Dr. Hazen for allowing me to visit the University of Virginia in the
summer of 2001 for medical mycology laboratory training.
I would also like to thank the many members of the Cutler laboratory both in
Montana and Louisiana – your friendship and assistance has been invaluable. Last but
not least, my thanks go out to the Microbiology Department staff, especially Joanne
Schons, who have done all of the foot work in Montana necessary to allow me to
complete my graduate work in Louisiana.

v
TABLE OF CONTENTS
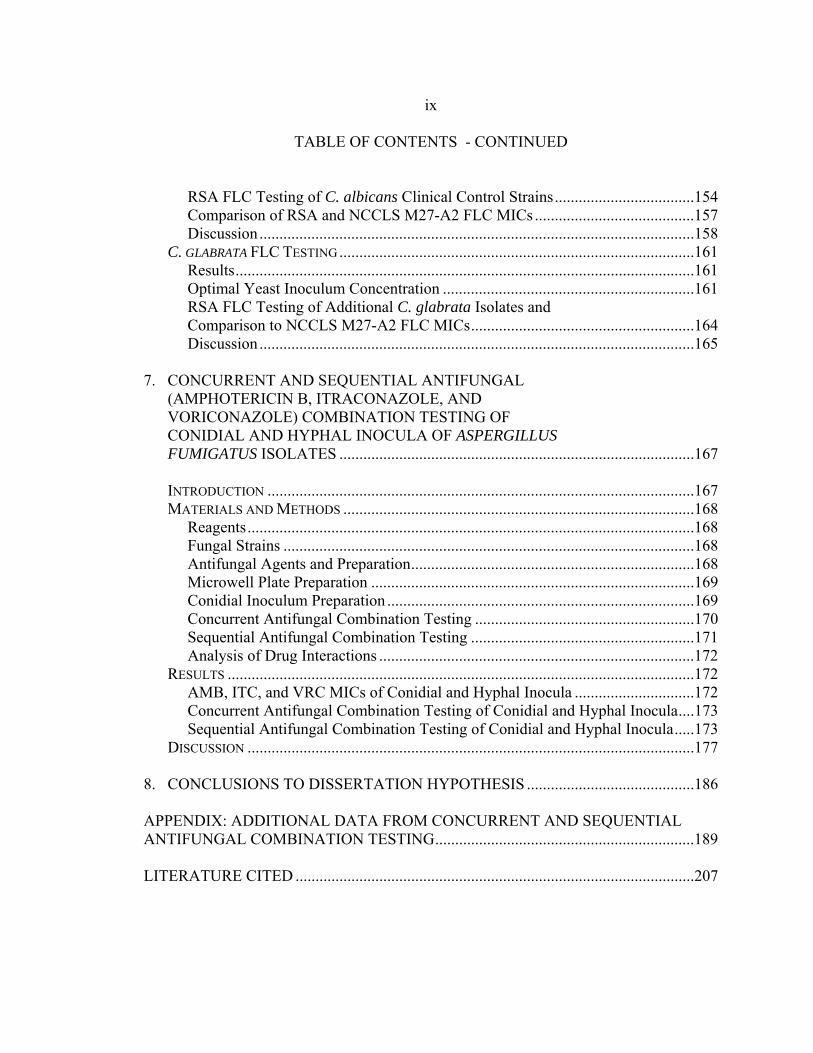
1. INTRODUCTION .........................................................................................................1 EPIDEMIOLOGY OF MEDICALLY SIGNIFICANT MYCOSES ................................................1 ANTIFUNGAL DRUGS AND THERAPY...............................................................................8 Evolution of Antifungal Drug Development and Therapy .......................................8 Antifungal Drug Classes and Targets in the Fungal Cell .......................................12 Cell Wall Synthesis.............................................................................................12 Cell Membrane Function ....................................................................................13 Ergosterol Synthesis ...........................................................................................14 Amphotericin B and Azole Resistance in Aspergillus spp. ....................................17 Amphotericin B Resistance.................................................................................18 Azole Resistance.................................................................................................19 MONODRUG ANTIFUNGAL SUSCEPTIBILITY TESTING....................................................21 In Vitro Susceptibility Testing Factors ...................................................................23 In Vitro-In Vivo Correlation of Current Antifungal ASTs.....................................27 In Vitro Susceptibility Testing Methodologies.......................................................29 NCCLS M27-A2 and M38-A Methods ..............................................................30 Rapid Susceptibility Assay .................................................................................32 Etest.....................................................................................................................34 Other colorimetric Methods................................................................................35 Optimal Antifungal Susceptibility and/or Resistance Testing................................37 CONCURRENT AND SEQUENTIAL ANTIFUNGAL COMBINATION SUSCEPTIBILITY TESTING OF ASPERGILLUS FUMIGATUS...........................................................................40 Introduction.............................................................................................................40 In Vitro Combination Susceptibility Testing Methods...........................................43 Checkerboard Combination Testing ...................................................................43 Time-kill Combination Testing...........................................................................48 Concurrent Combination Therapy and In Vitro Susceptibility Testing..................49 Amphotericin B and Itraconazole .......................................................................49 Amphotericin B and Voriconazole .....................................................................50 Itraconazole and Voriconazole ...........................................................................50 Sequential Combination Therapy and In Vitro Susceptibility Testing...................50 Amphotericin B Followed by Itraconazole or Voriconazole..............................50 Itraconazole or Voriconazole Followed by Amphotericin B..............................51 Itraconazole Followed by Voriconazole and Voriconazole Followed by Itraconazole....................................................................................................51 DISSERTATION HYPOTHESES.........................................................................................53 Hypothesis 1............................................................................................................53 Hypothesis 2............................................................................................................53 Hypothesis 3............................................................................................................54

vi
TABLE OF CONTENTS - CONTINUED Hypothesis 4............................................................................................................54 Hypothesis 5............................................................................................................54 Hypothesis 6............................................................................................................55 2. MODIFICATION OF THE YEAST RAPID SUSCEPTIBILITY ASSAY FOR ANTIFUNGAL SUSCEPTIBILITY TESTING OF ASPERGILLUS FUMIGATUS ...............................................................................................................56 INTRODUCTION .............................................................................................................56 MATERIALS AND METHODS ..........................................................................................57 Reagents..................................................................................................................57 Fungal Strains .........................................................................................................58 Antifungal Agents and Dilutions ............................................................................58 Microwell Plate Preparation ...................................................................................59 Inoculum Preparation..............................................................................................59 RSA.........................................................................................................................60 RSA Antifungal Susceptibility Curves and MIC Endpoint Determination ............60 NCCLS M38-P Testing and MIC Endpoint Determination ...................................61 Statistics ..................................................................................................................62 RESULTS .......................................................................................................................62 Optimal Glucose Utilization Conditions.................................................................62 Conidial Growth and Glucose Utilization...............................................................65 Antifungal Effect on Conidial Development and Glucose Utilization ...................68 Optimization of RSA Conditions............................................................................70 A. terreus RSA Testing...........................................................................................74 DISCUSSION..................................................................................................................75 3. EXPANSION AND VALIDATION OF MOLD RAPID SUSCEPTIBILITY ASSAY ........................................................................................................................81 INTRODUCTION .............................................................................................................81 mRSA Testing of Non-A. fumigatus Mold Species ................................................81 Introduction of VRC to mRSA Testing ..................................................................82 Validation of mRSA ...............................................................................................83 Optimization of A. flavus AMB, ITC, and VRC mRSA Testing Conditions .........83 MATERIALS AND METHODS ..........................................................................................84 Reagents..................................................................................................................84 Fungal Strains .........................................................................................................84 Antifungal Drugs and Preparation ..........................................................................85 Microwell Plate Preparation ...................................................................................85 Inoculum Preparation..............................................................................................86

vii
TABLE OF CONTENTS - CONTINUED Glucose Utilization of Conidial or Hyphal Inocula of Non-A. fumigatus Molds in Presence or Absence of AMB and ITC ......................................................................................86 mRSA Assay and MIC Determination ...................................................................87 NCCLS M38-A Testing and MIC Determination ..................................................89 PRELIMINARY MRSA TESTING OF NON-A. FUMIGATUS MOLD SPECIES RESULTS AND DISCUSSION ............................................................................................89 INTRODUCTION OF VORICONAZOLE TO MRSA TESTING RESULTS AND DISCUSSION .........................................................................................................102 VRC Effect on A. fumigatus Conidial Germination and Glucose Utilization ...............................................................................................102 Optimization of VRC Conditions in mRSA Testing ............................................103 VALIDATION OF MRSA ITC TESTING RESULTS AND DISCUSSION ..............................106 OPTIMIZATION OF A. FLAVUS AMB, ITC, AND VRC MRSA TESTING CONDITIONS RESULTS AND DISCUSSION ......................................................107 VRC Effect on Conidial Development and Glucose Utilization ..........................107 mRSA AMB, ITC, and VRC Susceptibility Curves.............................................109 Comparison of mRSA and NCCLS M38-A AMB, ITC, and VRC MICs............109 4. MODIFICATION OF MOLD RAPID SUSCEPTIBILITY ASSAY TO DETERMINE SUSCEPTIBILITY OF ASPERGILLUS FUMIGATUS HYPHAE TO AMPHOTERICIN B, ITRACONAZOLE, AND VORICONAZOLE ....................................................................................................115 INTRODUCTION ...........................................................................................................115 MATERIALS AND METHODS ........................................................................................117 Reagents................................................................................................................117 Fungal Strains .......................................................................................................117 Antifungal Agents.................................................................................................117 mRSA and NCCLS M38-A Testing .....................................................................118 Antifungal Drug Preparation.............................................................................118 Microwell Plate Preparation .............................................................................118 Conidial Inoculum Preparation .........................................................................118 mRSA Assay.....................................................................................................119 mRSA Antifungal Susceptibility Curves and MIC Endpoint Determination...119 NCCLS M38-A Assay and MIC Endpoint Definition......................................120 hRSA Testing........................................................................................................121 Antifungal Drug Preparation.............................................................................121 Microwell Plate Preparation .............................................................................121 Hyphal Inoculum Preparation ...........................................................................121 hRSA Drug Application Control ......................................................................121

viii
TABLE OF CONTENTS - CONTINUED hRSA.................................................................................................................122 hRSA Antifungal Susceptibility Curves and MIC Endpoint Determination ....122 Statistics ............................................................................................................123 RESULTS .....................................................................................................................123 Optimal Hyphal Inoculum Conditions..................................................................123 Incubation Period for Hyphal Development .........................................................123 Conidial Inoculum Concentration.........................................................................124 Comparison of Conidial and Hyphal MICs ..........................................................127 DISCUSSION ................................................................................................................127 5. SIDE-BY-SIDE COMPARISON OF AMPHOTERICIN B, ITRACONAZOLE, AND VORICONAZOLE MINIMUM INHIBITORY CONCENTRATION VALUES OBTAINED BY MOLD RSA AND ETEST ANTIFUNGAL SUSCEPTIBILITY TESTING ..................................................................................133 INTRODUCTION ...........................................................................................................133 MATERIALS AND METHODS ........................................................................................134 Reagents................................................................................................................134 Fungal Strains .......................................................................................................134 Antifungal Drugs and Preparation ........................................................................134 Inoculum Preparation............................................................................................135 Etest Assay and MIC Determination ....................................................................135 mRSA Assay and MIC Determination .................................................................137 Percent Agreement Between Etest and mRSA MICs ...........................................137 RESULTS AND DISCUSSION..........................................................................................138 6. VALIDATION AND EXPANSION OF YEAST RSA.............................................145 INTRODUCTION ...........................................................................................................145 MATERIALS AND METHODS ........................................................................................147 Reagents................................................................................................................147 Fungal Strains .......................................................................................................148 Fluconazole Stock and Preparation.......................................................................149 Microwell Plate Preparation .................................................................................149 Inoculum Preparation............................................................................................149 RSA Testing and MIC Determination ..................................................................150 NCCLS M27-A2 Testing and MIC Determination ..............................................151 C. ALBICANS FLC TESTING ..........................................................................................151 Results...................................................................................................................151 Use of RSA Color Mix to Improve Objectivity of NCCLS M27-A2 FLC MICs ................................................................................151
ix
TABLE OF CONTENTS - CONTINUED RSA FLC Testing of C. albicans Clinical Control Strains...................................154 Comparison of RSA and NCCLS M27-A2 FLC MICs ........................................157 Discussion.............................................................................................................158 C. GLABRATA FLC TESTING .........................................................................................161 Results...................................................................................................................161 Optimal Yeast Inoculum Concentration ...............................................................161 RSA FLC Testing of Additional C. glabrata Isolates and Comparison to NCCLS M27-A2 FLC MICs........................................................164 Discussion.............................................................................................................165 7. CONCURRENT AND SEQUENTIAL ANTIFUNGAL (AMPHOTERICIN B, ITRACONAZOLE, AND VORICONAZOLE) COMBINATION TESTING OF CONIDIAL AND HYPHAL INOCULA OF ASPERGILLUS FUMIGATUS ISOLATES .........................................................................................167 INTRODUCTION ...........................................................................................................167 MATERIALS AND METHODS ........................................................................................168 Reagents................................................................................................................168 Fungal Strains .......................................................................................................168 Antifungal Agents and Preparation.......................................................................168 Microwell Plate Preparation .................................................................................169 Conidial Inoculum Preparation .............................................................................169 Concurrent Antifungal Combination Testing .......................................................170 Sequential Antifungal Combination Testing ........................................................171 Analysis of Drug Interactions ...............................................................................172 RESULTS .....................................................................................................................172 AMB, ITC, and VRC MICs of Conidial and Hyphal Inocula ..............................172 Concurrent Antifungal Combination Testing of Conidial and Hyphal Inocula....173 Sequential Antifungal Combination Testing of Conidial and Hyphal Inocula.....173 DISCUSSION ................................................................................................................177 8. CONCLUSIONS TO DISSERTATION HYPOTHESIS ..........................................186 APPENDIX: ADDITIONAL DATA FROM CONCURRENT AND SEQUENTIAL ANTIFUNGAL COMBINATION TESTING.................................................................189 LITERATURE CITED ....................................................................................................207
x
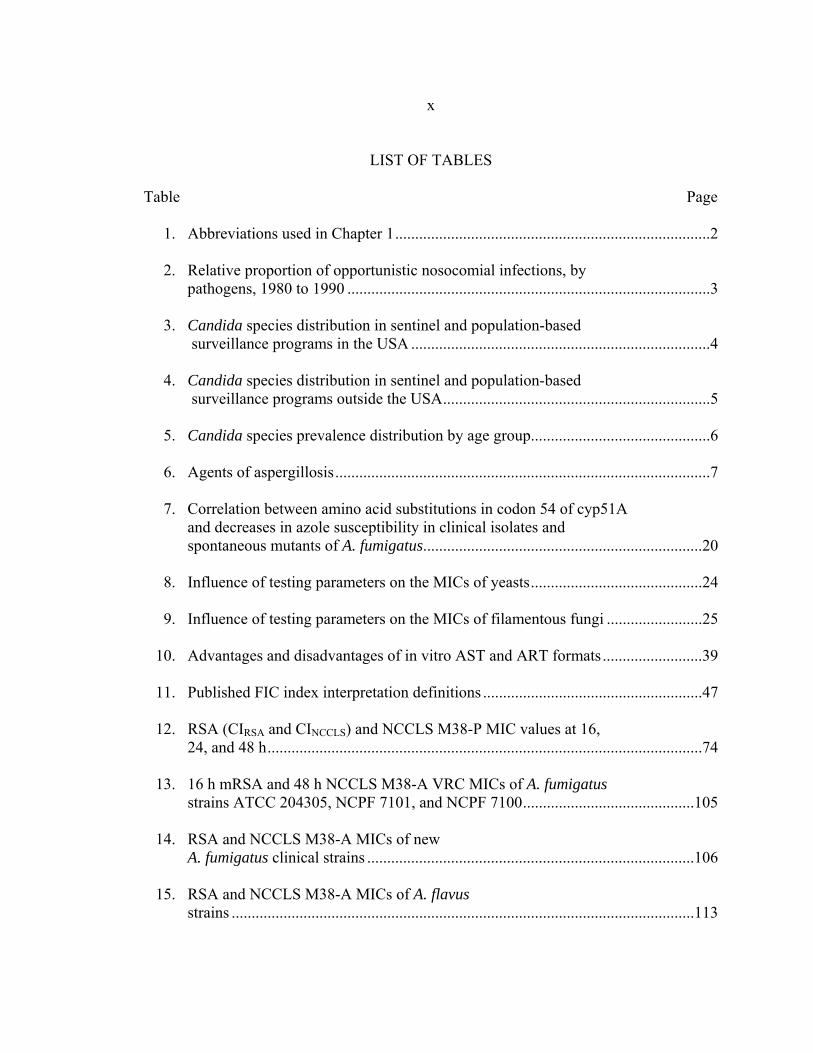
LIST OF TABLES
Table Page 1. Abbreviations used in Chapter 1...............................................................................2 2. Relative proportion of opportunistic nosocomial infections, by pathogens, 1980 to 1990 ...........................................................................................3 3. Candida species distribution in sentinel and population-based surveillance programs in the USA ...........................................................................4 4. Candida species distribution in sentinel and population-based surveillance programs outside the USA...................................................................5 5. Candida species prevalence distribution by age group.............................................6 6. Agents of aspergillosis..............................................................................................7 7. Correlation between amino acid substitutions in codon 54 of cyp51A and decreases in azole susceptibility in clinical isolates and spontaneous mutants of A. fumigatus......................................................................20 8. Influence of testing parameters on the MICs of yeasts...........................................24 9. Influence of testing parameters on the MICs of filamentous fungi ........................25 10. Advantages and disadvantages of in vitro AST and ART formats.........................39 11. Published FIC index interpretation definitions .......................................................47 12. RSA (CIRSA and CINCCLS) and NCCLS M38-P MIC values at 16, 24, and 48 h.............................................................................................................74 13. 16 h mRSA and 48 h NCCLS M38-A VRC MICs of A. fumigatus strains ATCC 204305, NCPF 7101, and NCPF 7100...........................................105 14. RSA and NCCLS M38-A MICs of new A. fumigatus clinical strains ..................................................................................106 15. RSA and NCCLS M38-A MICs of A. flavus strains ....................................................................................................................113
xi
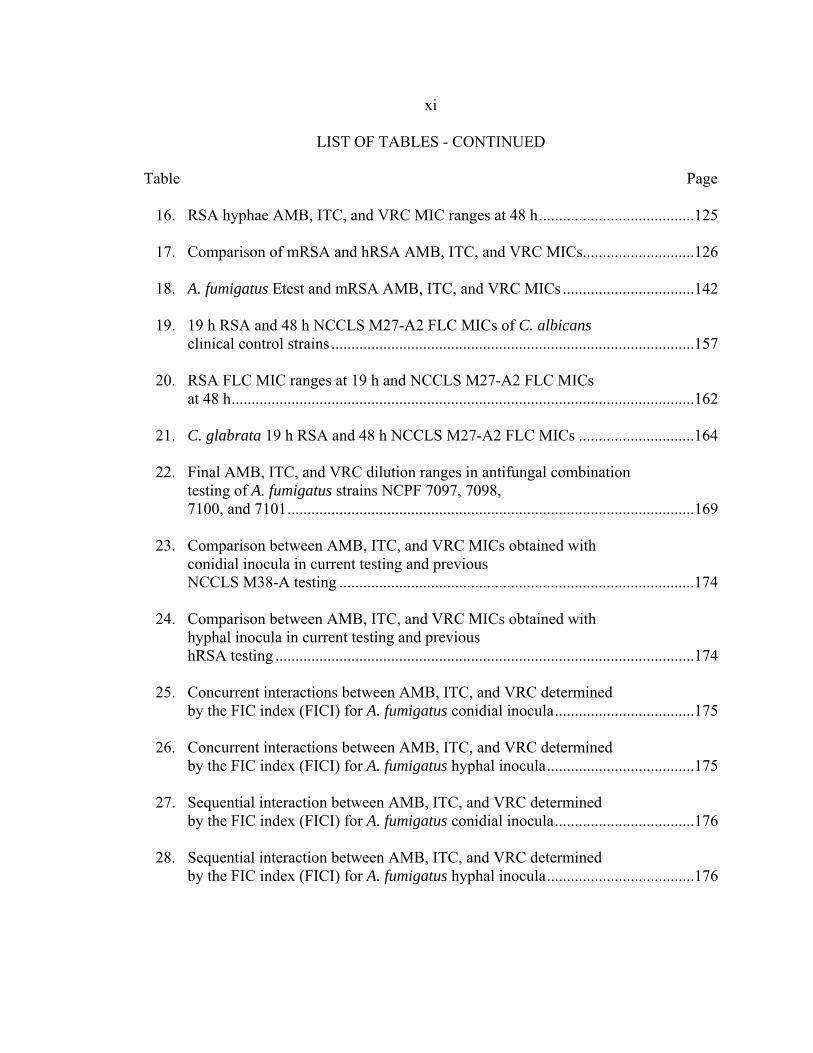
LIST OF TABLES - CONTINUED
Table Page 16. RSA hyphae AMB, ITC, and VRC MIC ranges at 48 h.......................................125 17. Comparison of mRSA and hRSA AMB, ITC, and VRC MICs............................126 18. A. fumigatus Etest and mRSA AMB, ITC, and VRC MICs .................................142 19. 19 h RSA and 48 h NCCLS M27-A2 FLC MICs of C. albicans clinical control strains ...........................................................................................157 20. RSA FLC MIC ranges at 19 h and NCCLS M27-A2 FLC MICs at 48 h....................................................................................................................162 21. C. glabrata 19 h RSA and 48 h NCCLS M27-A2 FLC MICs .............................164 22. Final AMB, ITC, and VRC dilution ranges in antifungal combination testing of A. fumigatus strains NCPF 7097, 7098, 7100, and 7101......................................................................................................169 23. Comparison between AMB, ITC, and VRC MICs obtained with conidial inocula in current testing and previous NCCLS M38-A testing .........................................................................................174 24. Comparison between AMB, ITC, and VRC MICs obtained with hyphal inocula in current testing and previous hRSA testing .........................................................................................................174 25. Concurrent interactions between AMB, ITC, and VRC determined by the FIC index (FICI) for A. fumigatus conidial inocula...................................175 26. Concurrent interactions between AMB, ITC, and VRC determined by the FIC index (FICI) for A. fumigatus hyphal inocula.....................................175 27. Sequential interaction between AMB, ITC, and VRC determined by the FIC index (FICI) for A. fumigatus conidial inocula...................................176 28. Sequential interaction between AMB, ITC, and VRC determined by the FIC index (FICI) for A. fumigatus hyphal inocula.....................................176
xii
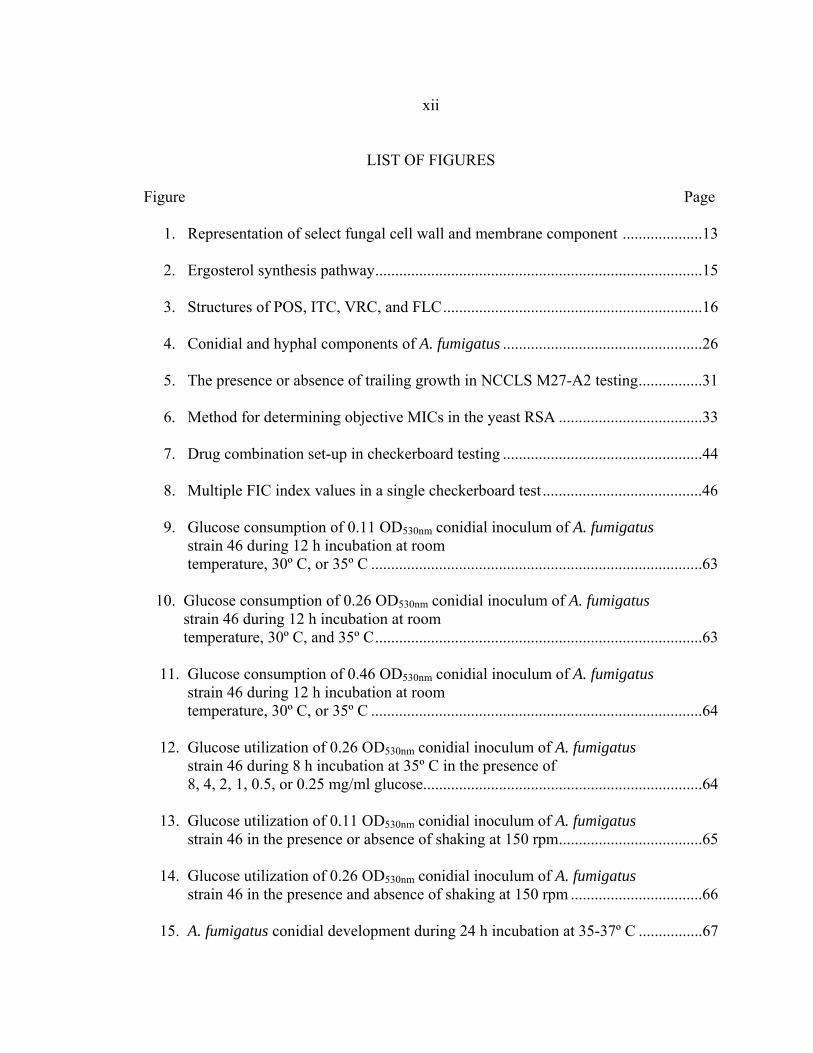
LIST OF FIGURES
Figure Page 1. Representation of select fungal cell wall and membrane component ....................13 2. Ergosterol synthesis pathway..................................................................................15 3. Structures of POS, ITC, VRC, and FLC.................................................................16 4. Conidial and hyphal components of A. fumigatus ..................................................26 5. The presence or absence of trailing growth in NCCLS M27-A2 testing................31 6. Method for determining objective MICs in the yeast RSA ....................................33 7. Drug combination set-up in checkerboard testing ..................................................44 8. Multiple FIC index values in a single checkerboard test ........................................46 9. Glucose consumption of 0.11 OD530nm conidial inoculum of A. fumigatus strain 46 during 12 h incubation at room temperature, 30º C, or 35º C ...................................................................................63 10. Glucose consumption of 0.26 OD530nm conidial inoculum of A. fumigatus strain 46 during 12 h incubation at room temperature, 30º C, and 35º C..................................................................................63 11. Glucose consumption of 0.46 OD530nm conidial inoculum of A. fumigatus strain 46 during 12 h incubation at room temperature, 30º C, or 35º C ...................................................................................64 12. Glucose utilization of 0.26 OD530nm conidial inoculum of A. fumigatus strain 46 during 8 h incubation at 35º C in the presence of 8, 4, 2, 1, 0.5, or 0.25 mg/ml glucose......................................................................64 13. Glucose utilization of 0.11 OD530nm conidial inoculum of A. fumigatus strain 46 in the presence or absence of shaking at 150 rpm....................................65 14. Glucose utilization of 0.26 OD530nm conidial inoculum of A. fumigatus strain 46 in the presence and absence of shaking at 150 rpm .................................66 15. A. fumigatus conidial development during 24 h incubation at 35-37º C ................67
xiii
LIST OF FIGURES-CONTINUED
Figure Page 16. Glucose utilization of A. fumigatus strains during 24 h incubation at 35-37º C ..............................................................................................................68 17. Glucose utilization of A. fumigatus strains during 24 h incubation at 37º C in the presence of no antifungal drug, 16 µg/ml AMB, or 16 µg/ml ITC ......................................................................................................69 18. RSA AMB susceptibility curves for strains 7101 and 7100 at 16, 24, and 48 h in the presence of 0.03-16 µg/ml AMB ..........................................................72 19. RSA ITC susceptibility curves for strains 7101 and 7100 at 16, 24, and 48 h in the presence of 0.03-16 µg/ml AMB ..........................................................73 20. A. flavus AFL1 conidial development before and after a 48 h incubation at 35-37º C in the presence or absence of AMB or ITC .......................................................................................................90 21. Glucose utilization by A. flavus AFL1 0.11 OD530nm conidial inoculum during 48 h incubation at 35-37º C in the presence of no antifungal drug, 16 µg/ml AMB, or 16 µg/ml ITC ......................................................................................................90 22. A. flavus AFL2 conidial development before and after a 48 h incubation at 35-37º C in the presence or absence of AMB or ITC .......................................................................................................91 23. Glucose utilization by A. flavus AFL2 0.11 OD530nm conidial inoculum during 48 h incubation at 35-37º C in the presence of no antifungal drug, 16 µg/ml AMB, or 16 µg/ml ITC ..........................................................................................................91 24. A. flavus AFL3 conidial development before and after a 48 h incubation at 35-37º C in the presence or absence of AMB or ITC .......................................................................................................92 25. Glucose utilization by A. flavus AFL3 0.11 OD530nm conidial inoculum during 48 h incubation at 35-37º C in the presence of no antifungal drug, 16 µg/ml AMB, or 16 µg/ml ITC ..........................................................................................................92

xiv
LIST OF FIGURES-CONTINUED
Figure Page 26. A. sydowii AS1 conidial development before and after a 48 h incubation at 35-37º C in the presence or absence of AMB or ITC .......................................................................................................94 27. Glucose utilization by A. sydowii AS1 0.11 OD530nm conidial inoculum during 48 h incubation at 35-37º C in the presence of no antifungal drug, 16 µg/ml AMB, or 16 µg/ml ITC ..........................................................................................................94 28. A. sydowii AS2 conidial development before and after a 48 h incubation at 35-37º C in the presence or absence of AMB or ITC .......................................................................................................95 29. Glucose utilization by A. sydowii AS2 0.11 OD530nm conidial inoculum during 48 h incubation at 35-37º C in the presence of no antifungal drug, 16 µg/ml AMB, or 16 µg/ml ITC ..........................................................................................................95 30. A. terreus AT1 conidial development before and after a 48 h incubation at 35-37º C in the presence or absence of AMB or ITC .......................................................................................................97 31. Glucose utilization by A. terreus AT1 0.11 OD530nm conidial inoculum during 48 h incubation at 35-37º C in the presence of no antifungal drug, 16 µg/ml AMB, or 16 µg/ml ITC ..........................................................................................................97 32. S. angiospermum SA1 conidial development before and after a 48 h incubation at 35-37º C in the presence or absence of AMB or ITC .......................................................................................................99 33. Glucose utilization by S. angiospermum SA1 0.11 OD530nm conidial inoculum during 48 h incubation at 35-37º C in the presence of no antifungal drug, 16 µg/ml AMB, or 16 µg/ml ITC ..........................................................................................................99 34. F. oxysporum FO1 hyphal appearance before and after a 48 h incubation at 35-37º C in the presence or absence of AMB or ITC .....................................................................................................101
xv
LIST OF FIGURES-CONTINUED
Figure Page 35. Glucose utilization by F. oxysporum FO1 0.13 OD530nm hyphal inoculum during 48 h incubation at 35-37º C in the presence of no antifungal drug, 16 µg/ml AMB, or 16 µg/ml ITC ........................................................................................................101 36. Appearance of A. fumigatus ATCC 204305 conidia at 400x after a 16 h, 35-37º C incubation in the presence or absence of 16 µg/m VRC .......................103 37. Glucose utilization of 0.11 OD530nm conidial inoculum of A. fumigatus strain ATCC 204305 during 16 h incubation in the presence or absence of 16 µg/ml VRC .................................................................104 38. A. flavus conidial development after 16 h in the presence or absence of 16 µg/ml VRC ..................................................................................................108 39. Glucose utilization of A. flavus 0.11 OD530nm and 1:50 0.11 OD530nm conidial inocula during 16 h incubation in the presence or absence of 16 µg/ml VRC ................................................................................108 40. AMB, ITC, and VRC mRSA susceptibility curves corresponding to the 0.11 OD530nm and 1:50 0.11 OD530nm conidial inocula of A. flavus strain AFL1...........................................................................110 41. AMB, ITC, and VRC mRSA susceptibility curves corresponding to the 0.11 OD530nm and 1:50 0.11 OD530nm conidial inocula of A. flavus strain AFL2...........................................................................111 42. AMB, ITC, and VRC mRSA susceptibility curves corresponding to the 0.11 OD530nm and 1:50 0.11 OD530nm conidial inocula of A. flavus strain AFL3...........................................................................112 43. A. fumigatus hyphal growth during 25 h incubation at 35-37º C..........................125 44. Correct placement of Etest strips on surface of 90 mm and 150 mm 2.0% glucose RPMI agar plates ............................................................................136 45. Designation of Etest MICs....................................................................................138 46. Differences in 24 h and 48 h Etest AMB MICs of AMB-resistant A. fumigatus strain NCPF 7097 ............................................................................139
xvi
LIST OF FIGURES-CONTINUED
Figure Page 47. Differences in 24 h and 48 h Etest AMB MICs of AMB-sensitive A. fumigatus strain NCPF 7101 ............................................................................140 48. Comparison of 48 h AMB, ITC, and VRC inhibition ellipse sizes ......................141 49. 48 h NCCLS M27-A2 microwell testing plate before and 30 min after addition of RSA color mix............................................................................152 50. 48 h NCCLS M27-A2 microwell testing plate before and 30 min after addition of RSA color mix............................................................................153 51. RSA FLC susceptibility curves of C. albicans 1, 17, FH1, FH5, 95-68, and 95-142 .................................................................................................155 52. Comparison of FLC MICs using different definitions of the RSA detection interval upper limit ................................................................................159 53. Susceptibility curves corresponding to the 1:8, 1:32, 1:128, and 1:1000 0.11 OD530nm yeast inocula of FLC-resistant C. glabrata strains 6938 and 6999........................................................................163 54. Illustration of antifungal drug checkerboard set-up in a testing plate ..................170 55. Effects of different RSA MIC endpoint definitions for conidial sequential antifungal testing (I→A) of A. fumigatus NCPF 7097 ........................................181 56. Effects of different RSA MIC endpoint definitions for conidial concurrent antifungal testing (V+A) of A. fumigatus NCPF 7097 .......................................182
xvii
ABSTRACT
Advances were made in both yeast and mold rapid susceptibility assay (RSA) testing. The yeast RSA was modified to facilitate amphotericin B (AMB), itraconazole (ITC), and voriconazole (VRC) testing of Aspergillus fumigatus, A. terreus, and A. flavus clinical isolates. 16 h mold RSA AMB, ITC, and VRC RSA minimum inhibitory concentration (MIC) values were equal to or within a single, two-fold dilution of MICs obtained in 48 h with the National Committee for Clinical Laboratory Standards (NCCLS) M38-A assay and in 24 or 48 h with the mold Etest. Preliminary testing with A. sydowii, Scedosporium angiospermum, and Fusarium oxysporum suggests that the mold RSA would also be a suitable AMB and ITC susceptibility testing format for these opportunistic filamentous fungi. The AMB, ITC, and VRC susceptibilities of A. fumigatus conidia and hyphae were compared by modifying the mold RSA, with conidia and hyphae demonstrating similar susceptibilities to drug. The yeast RSA was validated by testing clinical control strains that were obtained from patients with known clinical outcome. Yeast RSA conditions were also optimized to facilitate FLC testing of C. glabrata isolates. The effects of concurrent and sequential amphotericin B, itraconazole, and voriconazole two-drug combinations on the conidial and hyphal inocula of A. fumigatus were determined using a checkerboard testing format, with drug interaction effects interpreted by calculating fractional inhibitory concentration indices. Our interpretations of the in vitro effects of concurrent and sequential antifungal combinations on A. fumigatus closely matched the reported outcomes of invasive aspergillosis patients treated with concurrent and sequential antifungal therapies. Importantly, both concurrent and sequential antifungal combinations had differential effects on conidial and hyphal inocula, suggesting that all combination testing be performed with hyphal inocula.

1
INTRODUCTION
Epidemiology of Medically Significant Mycoses
Fungal pathogens can be divided into two categories: 1) primary pathogens, that
cause disease in immunocompetent or immunocompromised individuals; and 2)
opportunistic pathogens, which primarily cause disease in immunocompromised
individuals (1). Five fungi are classified as primary pathogens: Coccidioides immitis,
Paracoccidioides brasiliensis, Blastomyces dermatitidis, Penicillium marneffei, and
Histoplasma capsulatum spp. (2, 3). Susceptibility to these pathogens has traditionally
been correlated with geographic location (4). While mycoses caused by primary
pathogens are medically significant and worthy of a more detailed discussion, they are
not the focus of this thesis and will therefore not be discussed in greater detail. This
thesis will instead focus on the opportunistic pathogens, namely Aspergillus and Candida
spp.
Opportunistic fungal infections can be caused by an almost unlimited number of
yeast and filamentous fungal pathogens (5), with the most prevalent etiologic agents
being: Aspergillus fumigatus, A. flavus, A. niger, A. terreus, Candida albicans, C.
glabrata, C. tropicalis, C. krusei, C. parapsilosis, Cryptococcus neoformans,
hyalohyphomycetes, phaeohyphomycetes, and zygomycetes. The incidence rates of
infection caused by these pathogens have greatly increased since the early 1980’s when
both the onset of AIDS and advancements made in the fields of chemotherapy and organ
transplantation resulted in increased numbers of immunocompromised patients (6-10).

2
Term Abbreviation
Allergic Bronchopulmonary Aspergillosis Amphotericin B 5-Fluorocytosine Fluconazole Itraconazole Amphotericin B Colloidal Dispersion Amphotericin B Lipid Complex Caspofungin Acetate Voriconazole P450 14α-demethylase Ravuconazole Posaconazole Antifungal Susceptibility Testing Antifungal Resistance Testing National Committee for Clinical Laboratory Standards Polymerase Chain Reaction Minimum Inhibitory Concentration Nikkomycin Z Colony Forming Units American Type Culture Collection Optical Density Elipsometer Test Rapid Susceptibility Assay Invasive Aspergillosis Fractional Inhibitory Concentration Amphotericin B and Itraconazole Amphotericin B and Voriconazole Itraconazole and Voriconazole Amphotericin B followed by Itraconazole Amphotericin B followed by Voriconazole Itraconazole followed by Amphotericin B Itraconazole followed by Voriconazole Voriconazole followed by Amphotericin B Voriconazole followed by Itraconazole
ABPA AMB 5-FC FLC ITC ABCD ABLC CAS VRC P45014αdm RCZ PCZ AST ART NCCLS PCR MIC NKZ CFU ATCC OD Etest RSA IA FIC AMB+ITC AMB+VRC ITC+VRC AMB→ITC AMB→VRC ITC→AMB ITC→VRC VRC→AMB VRC→ITC
Table 1. Abbreviations used in Chapter 1.
3
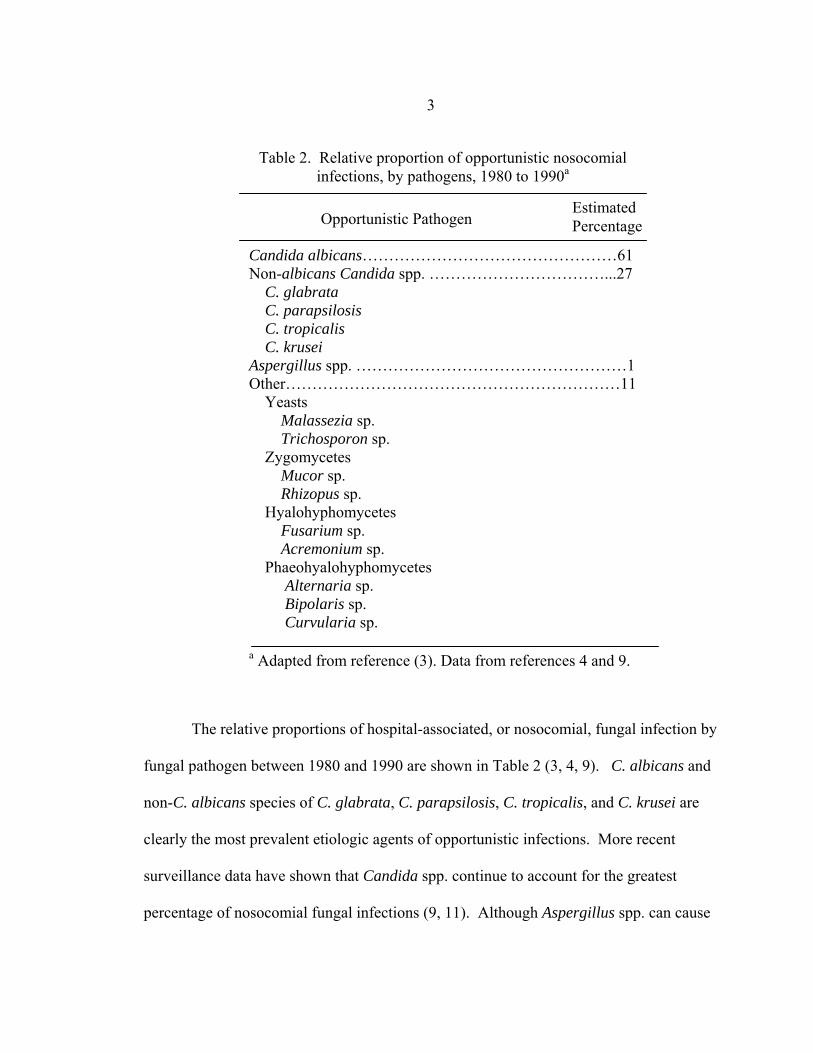
The relative proportions of hospital-associated, or nosocomial, fungal infection by
fungal pathogen between 1980 and 1990 are shown in Table 2 (3, 4, 9). C. albicans and
non-C. albicans species of C. glabrata, C. parapsilosis, C. tropicalis, and C. krusei are
clearly the most prevalent etiologic agents of opportunistic infections. More recent
surveillance data have shown that Candida spp. continue to account for the greatest
percentage of nosocomial fungal infections (9, 11). Although Aspergillus spp. can cause
Opportunistic Pathogen Estimated Percentage
Candida albicans…………………………………………61 Non-albicans Candida spp. ……………………………...27 C. glabrata C. parapsilosis C. tropicalis C. krusei Aspergillus spp. ……………………………………………1 Other………………………………………………………11 Yeasts Malassezia sp. Trichosporon sp. Zygomycetes Mucor sp. Rhizopus sp. Hyalohyphomycetes Fusarium sp. Acremonium sp. Phaeohyalohyphomycetes Alternaria sp. Bipolaris sp. Curvularia sp.
Table 2. Relative proportion of opportunistic nosocomial infections, by pathogens, 1980 to 1990a
a Adapted from reference (3). Data from references 4 and 9.

4
devastating infections in specialized immunocompromised populations, the overall
percentage of nosocomial infections attributable to Aspergillus has remained low, at
approximately 1%. Of increasing importance are the nosocomial infections caused by a
rising number of “other” fungi, with the most prevalent pathogens including non-C.
albicans yeasts, such as Malassezia and Trichosporon spp., and filamentous fungi such as
zygomycetes, hyalohyphomycetes, and phaeohyphomycetes (3).
Although morbidity rates have continued to increase since the 1980’s, trends in
mortality rates appear to be pathogen-specific. Mortality due to Candida spp. increased
during the 1980’s, but began to decrease in the 1990’s. This decline in mortality rates has
been attributed to improvements in both early detection and management of invasive
infection. In contrast, mortality due to Aspergillus spp. has continued to increase since
the 1980’s, now surpassing the mortality rate of Candida infections (12).
While over 100 species of Candida have been identified, only those listed in
Table 1 are significant pathogens of nosocomial infections. Candida species are
ubiquitous colonizers of humans and can often be isolated from the gastrointestinal tract,
C. albicans C. glabrata C. parapsilosis C. tropicalis C. krusei Other
1987-1988 1989-1993 1990-1994 1992-1993 1992-1993 1995-1996 1995-1998 1997-2000
Years
5 15 16 17 18 11 19 20
References
No. Isolates
137 232 427 394 428 379 934 2047
% of total isolates
47 56 52 46 51 52 53 54
14 13 16 15 12 20 20 16
16 10 11 21 22 8
10 15
20 17 15 12 8
11 12 10
0 2 4 3 - 5 3 2
3 2 2 3 7 4 2 3
Table 3. Candida species distribution in sentinel and population-based candidiasis surveillance programs in the USA

5
vagina, urethra, or skin (13). These pathogens cause a wide spectrum of diseases that
affect the gastrointestinal tract, genitalia, skin, nails, and deep tissues. Candida
infections in deep tissues are usually the result of hematogenous spread of Candida from
an endogenous, or less frequently, an exogenous site (13). Development of candidiasis is
dependent on the underlying host factors of the immunocompromised patient, with
specific predisposing factors putting the patient at risk for developing particular
manifestations of disease. The attributable mortality rate due to candidiasis is
approximately 38% (14), with infections most frequently occurring in medical and
surgical hospital services (3, 9). While C. albicans has consistently caused the highest
proportion of Candida spp. nosocomial fungal infections since the 1980’s, the
distribution of infections caused by non-C. albicans species may have shifted during this
time. The majority of recent sentinel and population-based surveillance studies conducted
in the United States show that C. glabrata is beginning to replace C. tropicalis as the
second most prevalent nosocomial Candida pathogen (Table 3) (5,11,15-20).
C. albicans C. glabrata C. parapsilosis C. tropicalis C. krusei Other
1980-199 1991-1996 1992-1994 1992-1994 1994-1994 1996-1998 1996-2001 1997-1998 1997-1998
Years
21 22 23 24 25 26 27 28 29
References
No. Isolates
177 576 249 367 293 442 218 579
20900
% of total isolates
64 66 49 71 53 54 42 50 69
12 13 10 9 7 15 12 6 10
10 8 11 8 12 12 22 17 4
6 6 11 7 11 9 16 15 4
<1 2 9 1 1 3 6 2 2
8 6 10 4 15 6 2 10 12
Table 4. Candida species distribution in sentinel and population-based candidiasis surveillance programs outside the USA
Location
Iceland Norway multiple
Canada Israel
Belgium Spain
Phillipines multiple

6 Surveillance studies conducted outside the Unites States are less clear, with the increased
prevalence of C. glabrata appearing to be site specific (Table 4) (21-29). The changing
distributions of non-C. albicans species has also been found to be age specific (17, 20,
30, 31), with data of one representative study (20) shown in Table 5. C. albicans and C.
parapsilosis are predominant in neonatal and pediatric infections while C. albicans and
C. glabrata infections predominate in adult infections. Within the adult population, the
proportion of C. albicans infections decrease while the proportion of C. glabrata
infections increase with increasing patient age (20, 32).
While over 200 species of Aspergillus have been identified, only a limited number
have been associated with disease (Table 6) (33, 34). Aspergillus spp. can cause a variety
of manifestations including pulmonary aspergilloma, allergic bronchopulmonary
aspergillosis (ABPA), and invasive aspergillosis (20). A. fumigatus is the most
commonly isolated species in invasive and noninvasive aspergillosis (35). A. flavus is
the second most common species isolated in invasive aspergillosis and nasal sinus lesions
(35, 36). A. niger is the second most common agent of pulmonary aspergilloma and third
Table 5. Candida species prevalence distribution by age groupa
Age Group C. albicans C. glabrata C. parapsilosis C. tropicalis C. krusei Other spp.
≤1 2-15 16-64 ≥64
60 55 55 50
3 3 17 23
24 21 12 12
7 10 11 10
0 4 2 2
5 7 3 3
% Total
a Reference 20
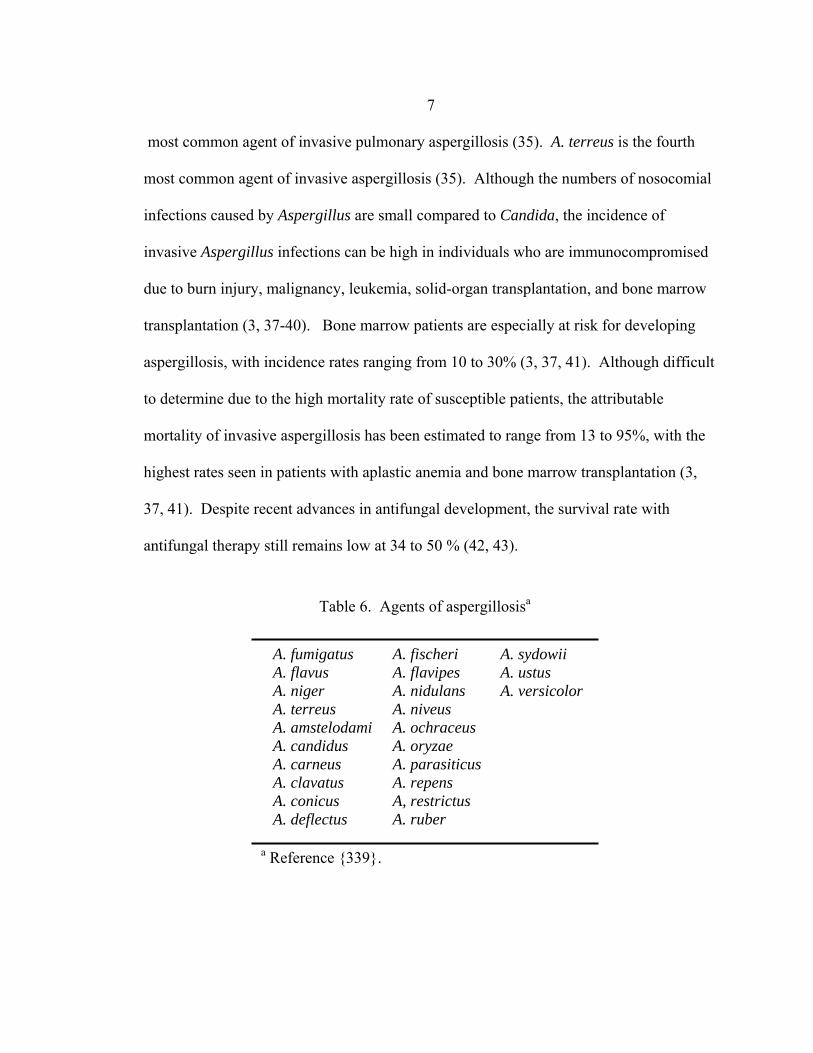
7 most common agent of invasive pulmonary aspergillosis (35). A. terreus is the fourth
most common agent of invasive aspergillosis (35). Although the numbers of nosocomial
infections caused by Aspergillus are small compared to Candida, the incidence of
invasive Aspergillus infections can be high in individuals who are immunocompromised
due to burn injury, malignancy, leukemia, solid-organ transplantation, and bone marrow
transplantation (3, 37-40). Bone marrow patients are especially at risk for developing
aspergillosis, with incidence rates ranging from 10 to 30% (3, 37, 41). Although difficult
to determine due to the high mortality rate of susceptible patients, the attributable
mortality of invasive aspergillosis has been estimated to range from 13 to 95%, with the
highest rates seen in patients with aplastic anemia and bone marrow transplantation (3,
37, 41). Despite recent advances in antifungal development, the survival rate with
antifungal therapy still remains low at 34 to 50 % (42, 43).
Table 6. Agents of aspergillosisa
A. fumigatus A. flavus A. niger A. terreus A. amstelodami A. candidus A. carneus A. clavatus A. conicus A. deflectus
A. fischeri A. flavipes A. nidulans A. niveus A. ochraceus A. oryzae A. parasiticus A. repens A, restrictus A. ruber
A. sydowii A. ustus A. versicolor
a Reference {339}.

8
Antifungal Drugs and Therapy
Evolution of Antifungal Drug Development and Therapy
Until the 1950’s, the only antifungal therapy available was the oral administration
of a saturated solution of potassium iodide for cutaneous sporotrichosis (44). A broader
spectrum antifungal drug was not discovered until 1951, when Brown and Hazen isolated
the polyenes nystatin, hamycin, and amphotericin B (AMB) from the actinomycete
Streptomyces nodosus (45,46). One of the earliest successful applications of AMB
therapy was the treatment of coccidioidal meningitis, a universally fatal manifestation of
coccidioidomycosis (47, 48). Once demonstrated with coccidioidomycosis, AMB was
soon successfully tested and used as a therapy for aspergillosis, cryptococcosis,
candidiasis, and other fungal infections (47, 49-51). Unfortunately, AMB’s greatest
limitation is its induction of nephrotoxicity in patients. Treatment with AMB usually
results in some degree of renal dysfunction, with severity correlating to the total AMB
dose (49, 52). Despite this limitation, AMB continues to be the mainstay of management
for many fungal infections.
5-Fluorocytosine (5-FC) was next developed in the late 1950’s, originally as an
anti-tumor agent (53). Although 5-FC has demonstrated antifungal activity in vitro and
in vivo, its use as an antifungal monotherapy has been limited due to a spectrum of
activity limited to Candida and Cryptococcus (54), bone marrow toxicity (55), and the
rapid development of resistance in vivo (56, 57). While 5-FC is no longer used as a
monotherapy, clinical trials and case studies have demonstrated the effectiveness of 5-FC
9
in combination with AMB or fluconazole (FLC) for treating cryptococcal meningitis (58-
64) or chromoblastomycosis (65, 66).
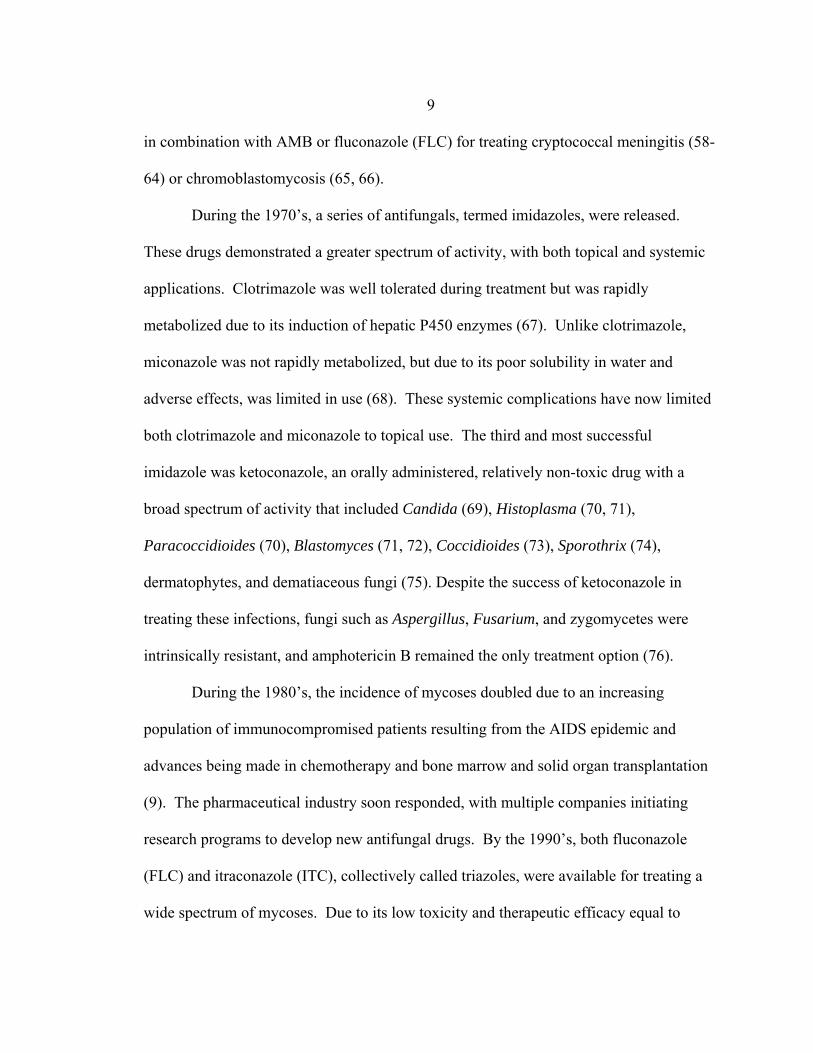
During the 1970’s, a series of antifungals, termed imidazoles, were released.
These drugs demonstrated a greater spectrum of activity, with both topical and systemic
applications. Clotrimazole was well tolerated during treatment but was rapidly
metabolized due to its induction of hepatic P450 enzymes (67). Unlike clotrimazole,
miconazole was not rapidly metabolized, but due to its poor solubility in water and
adverse effects, was limited in use (68). These systemic complications have now limited
both clotrimazole and miconazole to topical use. The third and most successful
imidazole was ketoconazole, an orally administered, relatively non-toxic drug with a
broad spectrum of activity that included Candida (69), Histoplasma (70, 71),
Paracoccidioides (70), Blastomyces (71, 72), Coccidioides (73), Sporothrix (74),
dermatophytes, and dematiaceous fungi (75). Despite the success of ketoconazole in
treating these infections, fungi such as Aspergillus, Fusarium, and zygomycetes were
intrinsically resistant, and amphotericin B remained the only treatment option (76).
During the 1980’s, the incidence of mycoses doubled due to an increasing
population of immunocompromised patients resulting from the AIDS epidemic and
advances being made in chemotherapy and bone marrow and solid organ transplantation
(9). The pharmaceutical industry soon responded, with multiple companies initiating
research programs to develop new antifungal drugs. By the 1990’s, both fluconazole
(FLC) and itraconazole (ITC), collectively called triazoles, were available for treating a
wide spectrum of mycoses. Due to its low toxicity and therapeutic efficacy equal to
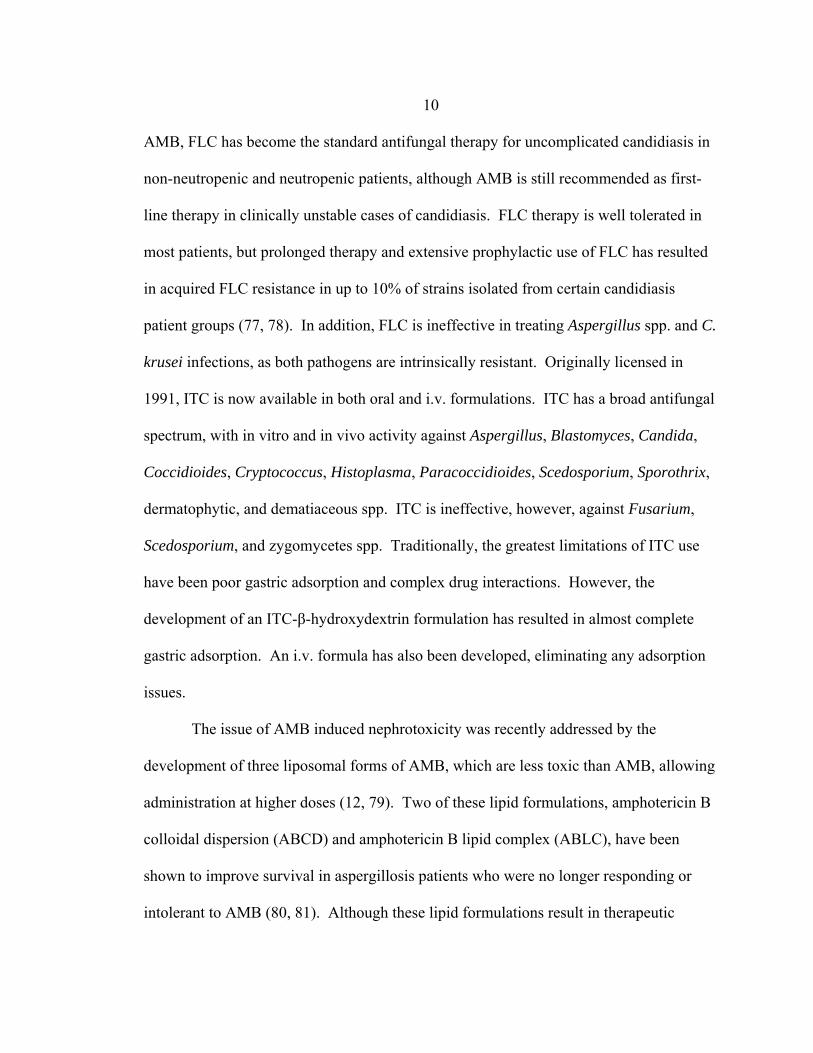
10
AMB, FLC has become the standard antifungal therapy for uncomplicated candidiasis in
non-neutropenic and neutropenic patients, although AMB is still recommended as first-
line therapy in clinically unstable cases of candidiasis. FLC therapy is well tolerated in
most patients, but prolonged therapy and extensive prophylactic use of FLC has resulted
in acquired FLC resistance in up to 10% of strains isolated from certain candidiasis
patient groups (77, 78). In addition, FLC is ineffective in treating Aspergillus spp. and C.
krusei infections, as both pathogens are intrinsically resistant. Originally licensed in
1991, ITC is now available in both oral and i.v. formulations. ITC has a broad antifungal
spectrum, with in vitro and in vivo activity against Aspergillus, Blastomyces, Candida,
Coccidioides, Cryptococcus, Histoplasma, Paracoccidioides, Scedosporium, Sporothrix,
dermatophytic, and dematiaceous spp. ITC is ineffective, however, against Fusarium,
Scedosporium, and zygomycetes spp. Traditionally, the greatest limitations of ITC use
have been poor gastric adsorption and complex drug interactions. However, the
development of an ITC-β-hydroxydextrin formulation has resulted in almost complete
gastric adsorption. An i.v. formula has also been developed, eliminating any adsorption
issues.
The issue of AMB induced nephrotoxicity was recently addressed by the
development of three liposomal forms of AMB, which are less toxic than AMB, allowing
administration at higher doses (12, 79). Two of these lipid formulations, amphotericin B
colloidal dispersion (ABCD) and amphotericin B lipid complex (ABLC), have been
shown to improve survival in aspergillosis patients who were no longer responding or
intolerant to AMB (80, 81). Although these lipid formulations result in therapeutic
11
efficacy equal to AMB in first-line aspergillosis therapy (82), increased doses are not
associated with improved outcome (83). Unfortunately, the greatest limitation of using
these drugs has been the cost, with newer formulations of AMB costing approximately 40
to 50 times more than AMB (84).
Caspofungin acetate (CAS), an echinocandin, was approved by the U.S. Food and
Drug Administration (FDA) in 2001 for the treatment of Aspergillus infection refractory
to conventional therapy (85). Randomized clinical trials have demonstrated that CAS has
equal efficacy but less toxicity than AMB in treating esophageal and oropharyngeal
candidiasis (86, 87). Although CAS has been shown to be effect against both Aspergillus
and Candida spp., both Cryptococcus neoformans and zygomycetes are intrinsically
resistant (88).
Voriconazole (VRC), a second generation triazole approved by the FDA in 2002,
has been shown to be effective as either a rescue (89) or first-line therapy for invasive
aspergillosis (43, 90). Importantly, Herbrecht et al. showed that VRC therapy resulted in
better rates of response and survival compared to AMB therapy (43). Although VRC
therapy causes photopsia, a transient enhanced light perception or blindness, in up to 45%
of patients, the effect is temporary and does not require discontinuation of therapy (43).
VRC has also been approved for treating serious fungal infections caused by
Scedosporium angiospermum and Fusarium that are intolerant or refractory to other
therapy (91).
Other drugs such as posaconazole (PCZ, derivative of ITC), ravuconazole (RCZ,
derivative of FLC), nikkomycin Z, micafungin, liposomal nystatin, and anidulafungin are

12
currently in development or clinical trials and will hopefully be released in the next few
years.
Antifungal Drug Classes and Targets in the Fungal Cell
As both mammalian and fungal cells are eukaryotic, the greatest challenge in
antifungal drug development has been identification of fungal cell specific targets and
restriction of the antifungal drug’s inhibitory action(s) to fungal and not mammalian
cells. Although there are several major fungal targets, we will limit our discussion to
antifungal targeting of fungal cell wall synthesis and ergosterol production.
Cell Wall Synthesis. Components of the cell wall of fungi are ideal antifungal
drug targets as they are both essential to the fungal cell and absent from mammalian cells
(84). The most notable classes of antifungal drugs targeting components in the cell wall
include the echinocandins and nikkomycins. Echinocandins, which include CAS,
micafungin, and anidulafungin (74), are noncompetitive inhibitors of the cell membrane
enzyme β-(1,3)-glucan synthase, which catalyzes the polymerization of uridine
diphosphate-glucose into β-(1,3)-glucan, a structural component of the fungal cell wall
partially responsible for maintaining integrity and rigidity (84) (Fig. 1). Inhibition of β-
(1,3)-glucan synthesis leads to a weakened cell wall, increased osmotic pressure, and
ultimately lysis. Nikkomycin Z is structurally similar to a substrate precursor for chitin
and acts as a competitive inhibitor of chitin synthase enzymes (Fig. 1), leading to osmotic
swelling, chaining, and inhibition of septation (53).
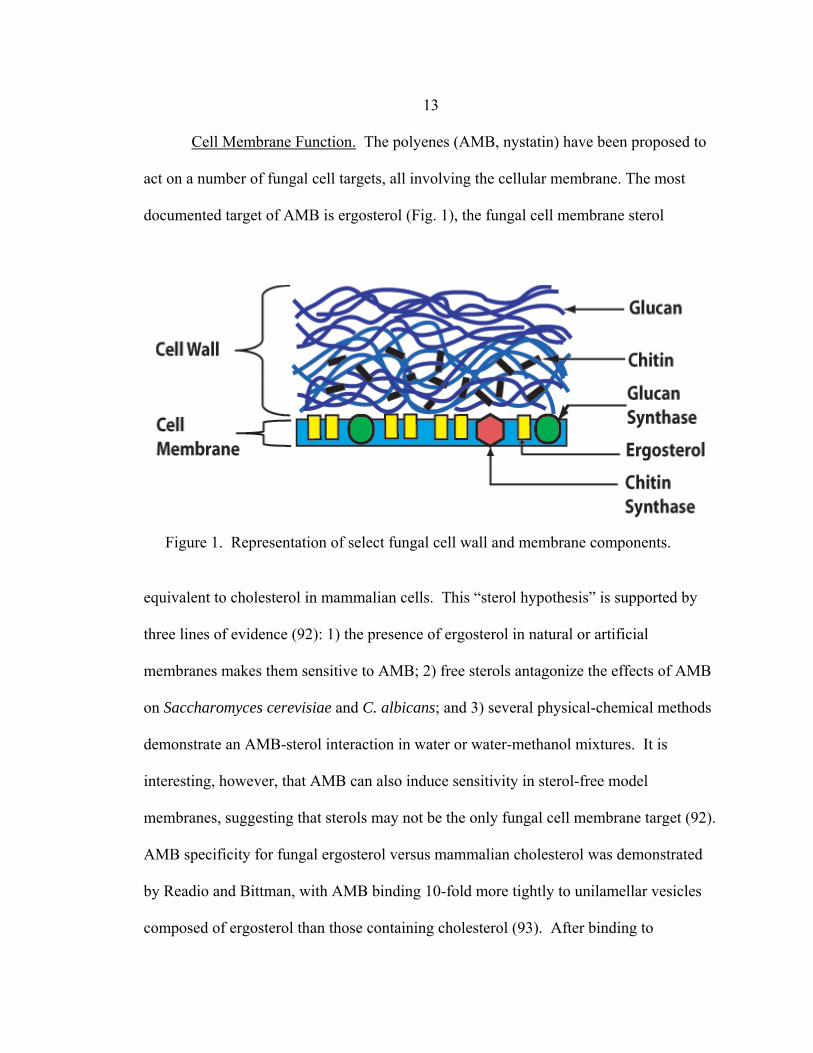
13 Cell Membrane Function. The polyenes (AMB, nystatin) have been proposed to
act on a number of fungal cell targets, all involving the cellular membrane. The most
documented target of AMB is ergosterol (Fig. 1), the fungal cell membrane sterol
equivalent to cholesterol in mammalian cells. This “sterol hypothesis” is supported by
three lines of evidence (92): 1) the presence of ergosterol in natural or artificial
membranes makes them sensitive to AMB; 2) free sterols antagonize the effects of AMB
on Saccharomyces cerevisiae and C. albicans; and 3) several physical-chemical methods
demonstrate an AMB-sterol interaction in water or water-methanol mixtures. It is
interesting, however, that AMB can also induce sensitivity in sterol-free model
membranes, suggesting that sterols may not be the only fungal cell membrane target (92).
AMB specificity for fungal ergosterol versus mammalian cholesterol was demonstrated
by Readio and Bittman, with AMB binding 10-fold more tightly to unilamellar vesicles
composed of ergosterol than those containing cholesterol (93). After binding to
Figure 1. Representation of select fungal cell wall and membrane components.

14 ergosterol via its two hydrophobic chains (77), AMB induces formation of minute pores,
causing leakage of K+ and influx of Na+ which results in an ionic imbalance (92, 94, 95).
This permeability has been hypothesized to cause leakage of additional intracellular
components, resulting in the subsequent death of the fungal cell (96).
AMB has also been proposed to have both immunostimulatory and
immunosuppressive effects on the host. AMB has an immunostimulatory effect on
macrophages by increasing oxidative bursts (97) and killing of A. fumigatus conidia (98).
AMB causes immunosuppression by disrupting the cell membranes of
polymorphonuclear lymphocytes (PMN), thereby preventing the PMN’s oxidative burst
(99). Another immunosuppressive property of AMB is that it can induce lipid
peroxidation of the mammalian cell membranes, causing fragility in the membrane that
may lead to increased permeability (100, 101).
Ergosterol Synthesis The ergosterol synthesis pathway and proposed azole target are
shown in Figure 2. The primary mode of azole action has been demonstrated to be
inhibition of ergosterol biosynthesis (102) through the selective inhibition of the enzyme,
P450 14α-demethylase (P45014αdm ) following the stochiometric interaction of the N-3
(imidazole) or the N-4 (triazoles) substituents of the azole ring with the heme of
P45014αdm (103, 104). This interaction prevents P45014αdm’s ability to remove the C-14
methyl group from lanosterol, resulting in the accumulation of 14α methylsterols in the
cell membrane instead of ergosterol (53). While physiochemical similarities exist
between ergosterol and many of its precursors, few of these intermediates are able to
replace ergosterol as a fluidity regulator within the cell membrane (103, 105, 106).

15
Figure 2. Ergosterol synthesis pathway and target of azoles.
16
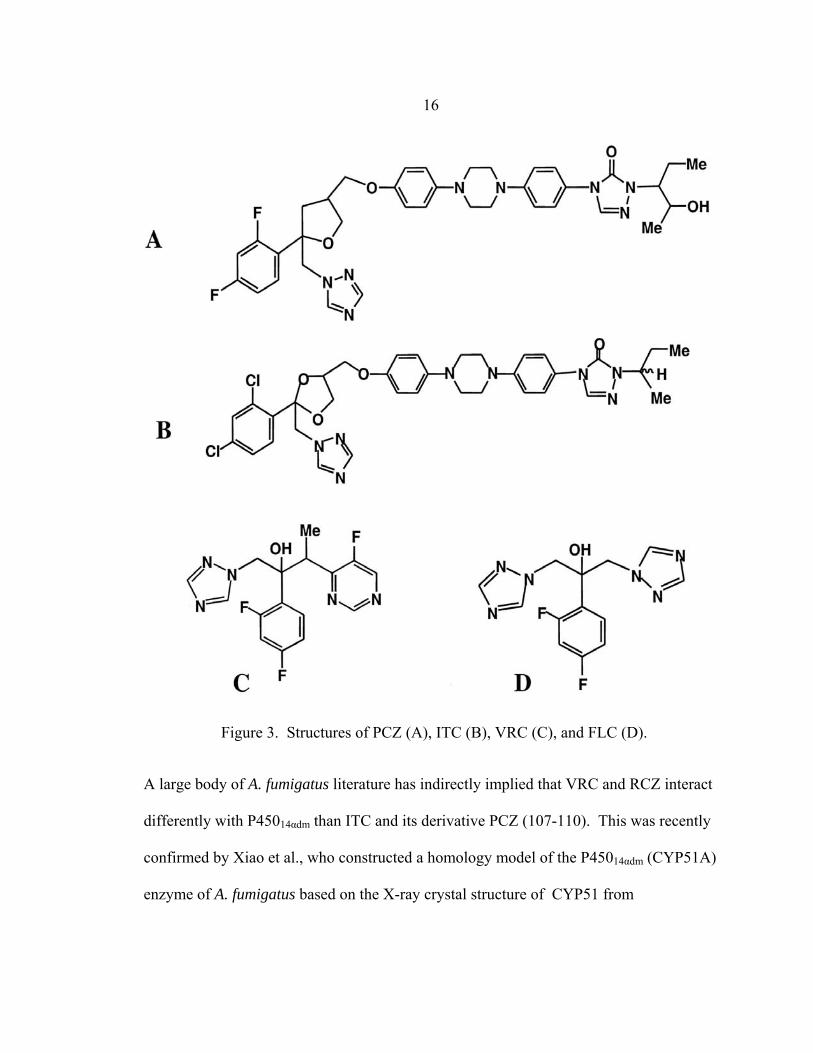
Figure 3. Structures of PCZ (A), ITC (B), VRC (C), and FLC (D).
A large body of A. fumigatus literature has indirectly implied that VRC and RCZ interact
differently with P45014αdm than ITC and its derivative PCZ (107-110). This was recently
confirmed by Xiao et al., who constructed a homology model of the P45014αdm (CYP51A)
enzyme of A. fumigatus based on the X-ray crystal structure of CYP51 from

17 Mycobacterium tuberculosis (109). According to the model, triazoles with (Fig. 3A, B)
and without (Fig. 3C, D) long chains enter CYP51A via a channel and bind to both heme
and nearby channel proteins at the bottom. Interestingly, VRC and PCZ having similar
interactions with the channel proteins near the heme. Although VRC occupies a small
portion of the channel, the long chains of both ITC and PCZ occupy its full length,
forming numerous hydrophobic interactions with channel proteins that are not observed
with VRC. The only marked difference between ITC and PCZ binding is that the two
chlorine atoms on the steric ring of ITC may contribute to steric crowding near the drug
channel entry. Although Xiao and others have developed C. albicans homolog models
(111, 112), this is the first A. fumigatus homolog model, whose success relies greatly on
its ability to explain the inconsistency of triazole cross-resistance between ITC/PCZ and
VRC in A. fumigatus clinical isolates (discussed below).
Amphotericin B and Azole Resistance in Aspergillus spp.
The term “resistance” is used to describe the insensitivity of a fungus to an
antifungal drug in vitro or in vivo. In contrast, clinical failure describes the failure of an
antifungal therapy to result in a clinical response in vivo. Clinical failure can be due to
antifungal resistance, but may also be due to host or pharmacodynamic causes such as
impaired immune status, poor availability of drug, and accelerated metabolism of the
antifungal drug. Resistance can be further classified into three categories: primary or
intrinsic resistance, when all isolates of one species are resistant to a particular antifungal
drug; secondary or acquired resistance, when a fungus becomes resistant after exposure
18 to antifungal drug; and clinical resistance, when failure of therapy is due to host factors
unrelated to in vitro resistance (113).
Amphotericin B Resistance. The proposed mechanism(s) of AMB resistance
among fungi are varied and often conflicting, adding support to the argument that AMB
has more than one target and/or that host factors may influence the efficacy of AMB in
vivo. AMB resistance is either acquired during prolonged AMB therapy or intrinsic,
depending on the fungal species. As ergosterol is proposed to be the primary target of
AMB, many investigators have hypothesized that AMB resistance is associated with
either increased or decreased ergosterol content in the cellular membrane. However,
these alterations in ergosterol content have not consistently correlated with AMB
resistance. For example, ergosterol levels in the cell membrane of A. terreus, a fungus
intrinsically resistant to AMB in vivo, are either decreased (114) or no different than
(114-116) ergosterol levels in AMB-sensitive strains of A. fumigatus. Ergosterol levels in
the membranes of other intrinsically resistant fungi such as Scedosporium prolificans and
Fusarium spp. should be determined to help clarify the relationship between ergosterol
content in fungal membranes and AMB sensitivity.
As AMB must first cross the cell wall to reach ergosterol in the cell membrane, an
alternative hypothesis for AMB resistance is that constituent(s) in the cell wall, namely
glucan and/or chitin, interfere with AMB-ergosterol binding by interacting with or
altering the permeability of AMB. Using AMB-sensitive and resistant strains of A.
flavus, Seo et al. found that spheroplasts derived from resistant mycelia were as
susceptible to AMB as wild-type hyphae, suggesting that alterations in the cell wall lead

19
to AMB resistance (117). The role of glucan/chitin-AMB interactions in AMB resistance
has been investigated in greater detail with AMB-sensitive C. albicans and AMB-
sensitive and –resistant Schizosaccharomyces sp. and Kluyveromyces sp. The increased
AMB sensitivity of yeast spheroplasts, which lack cell walls, also supports the role of the
cell wall as a chemical barrier around the fungal cell (116). However, Bahmed et al.
found that chitin content was proportional to AMB susceptibility, with increased levels of
chitin, induced by addition of chitin synthase activator α-factor, correlating with
increased AMB sensitivity, and decreased levels of chitin, caused by addition of the
nikkomycin Z, correlating with decreased AMB sensitivity (116). In addition to AMB-
chitin interactions, Gale has demonstrated that phenotypic AMB resistance in C. albicans
can be mediated by alterations in β-(1,3) glucan (118). Although these results suggest a
role for the cell wall in determining AMB sensitivity, the mechanism(s) of glucan- or
chitin-AMB interactions in AMB cell wall penetration of C. albicans have not been
elucidated.
Azole Resistance Resistance mechanisms observed in ITC, VRC, or PCZ-
resistant laboratory and clinical strains of Aspergillus include mutations of the azole
target, cyp51A (108, 110, 119) and reduction of intracellular drug levels (120) by efflux
pumps AfuMDR3 and AfuMDR4 (121), Plasmid-mediated overexpression of the P-450
14α-sterol demethylase target, cyp51A has also been shown to increase azole resistance
(122), but there have been no in vitro or in vivo reports crediting cyp51A overexpression
as the cause for resistance.

20
Unlike C. albicans, where FLC-resistant strains consistently exhibit cross-
resistance with ITC and VRC, azole cross-resistance in Aspergillus is more complicated
(Table 7). ITC-resistant A. fumigatus strains are not consistently resistant to either VRC
or PCZ (107-110, 123) while PCZ-resistant A. fumigatus strains have thus far been
consistently resistant to ITC but not to VRC (108). This pattern of resistance may be
explained by again returning to the A. fumigatus CYP51A homolog model developed by
Xiao et al (109). The cyp51A gene of ITC and PCZ, but not VRC, -resistant A. fumigatus
strains has been shown to have a point mutation in codon 54, changing the amino acid
from glycine, a small hydrophophic amino acid, to valine, glutamate, or arginine in ITC-
resistant strains and to tryptophan in PCZ-resistant strains. According to Xiao’s
ITC
Table 7. Correlation between amino acid substitutions in codon 54 of cyp51A and decreases in azole susceptibility in clinical isolates and spontaneous mutants of A. fumigatus
0.25 1
0.12 0.12
1
0.25
0.25 0.12
16 8
A. fumigatus strain
Substitution in CYP51A
NCCLS M38-A MIC (µg/ml)a VRC PCZ
ND158 AF-71 MS6 ND223 AF-72 R4-1 R7-1 ND202 F10 F33
References
None None G54R G54R G54E G54E G54W G54W G138R G138S
0.12 1
>16 >16
>8 >16
>16 >16
2 0.5
0.03 0.25
1 1
0.5 1
>8 >8
0.25 0.25
108, 109 107 108,109 108 107, 110 108, 109 108 108 109 109
a MIC values indicating in vitro resistance are printed in bold.

21 homology model, codon 54 is located at the entrance of the CYP51A azole docking
channel. A substitution of glycine with a larger amino acid could therefore interfere with
entry of the long side chains of ITC and PCZ into the channel without affecting VRC
entry. As the two chlorine atoms on the phenyl ring of ITC already cause steric crowding
at the channel entrance in the absence of a substitution of codon 54, the substitution of a
small (valine) or medium (glutamate) amino acid would be sufficient to inhibit ITC
channel entry. In contrast, PCZ does not have Cl atoms on its phenyl ring, implying that
the glycine must be substituted with a larger amino acid, such as tryptophan, to prevent
PCZ channel entry. In contrast, VRC resistance is dependent on amino acid substitution
occurring at the base of the docking channel, near the heme binding site. While these
substitutions would also affect ITC and PCZ binding, Xiao proposes that the high-affinity
binding of ITC and VRC long chains to hydrophobic amino acid along the length of the
channel wall compensates for these substitutions, thus preventing ITC and VRC
resistance.
Monodrug Antifungal Susceptibility Testing
In vitro antifungal susceptibility testing is used to determine the susceptibility of a
clinical fungal isolate to antifungal drug in vitro. The ultimate goal of this testing is to
use the resulting in vitro minimum inhibitory concentration (MIC) of antifungal drug as a
predictor of antifungal efficacy in the patient (i.e. in vivo). In addition to its clinical use,
susceptibility testing can also be used in both drug development, as a screening tool, and

22 epidemiological studies, to determine and/or monitor patterns of susceptibility or
resistance in defined populations.
Until new antifungal agents were introduced in the 1980’s, antifungal
susceptibility testing was not considered necessary as there was only one therapeutic
option available for most mycoses. Susceptibility testing has since become necessary due
to increasing numbers of available antifungal drugs, antifungal resistance, numbers of
opportunistic fungal pathogens, and incidence of fungal infections (124).
There has been some debate as to whether antimicrobial susceptibility testing is
the best testing format for determining the effect of antifungal drugs on fungi in vitro.
While susceptibility testing has been used traditionally for both bacteria and fungi to
determine the minimum inhibitory concentration (MIC) of drug, it may not detect low
level resistance or resistance mechanisms expressed under certain conditions (i.e. in
vivo). The alternative to susceptibility testing is antimicrobial resistance testing, a testing
format designed to detect phenotypic resistance. The ultimate goal of both testing formats
is to extrapolate the results to predict clinical efficacy in the patient. In other words, a
successful in vitro test will result in an in vitro-in vivo correlation. The consensus from
studies comparing the vitro-in vivo correlation success of bacterial susceptibility and
resistance testing is that resistance carries a stronger prediction of failure while
susceptibility carries no guarantee of success (125). As previously discussed, this is not
surprising as clinical success often depends on the appropriateness of therapy as well as
host and/or infection factors (125). Despite the apparent advantages of resistance testing,
the majority of antifungal susceptibility tests have been developed in the susceptibility
23 testing format. Antifungal resistance tests are starting to be developed, however, as
molecular mechanisms of resistance, i.e. phenotypic resistance, can now be determined
by polymerase chain reaction (PCR) and real-time PCR based techniques (108, 110, 121).
Regardless of the development of these resistance tests, investigators developing new or
modifying old antifungal susceptibility tests need to optimize testing conditions to
facilitate detection of both antifungal susceptibility and resistance.
In Vitro Susceptibility Testing Factors
The accuracy and standardization of any in vitro susceptibility test is dependent
on factors such as incubation time, incubation temperature, buffer, light, inoculum
preparation, inoculum size, medium composition, and MIC endpoint definitions (124,
126, 127). The effect of each of these factors on yeast and mold MICs are shown in
Tables 8 and 9, respectively (124).
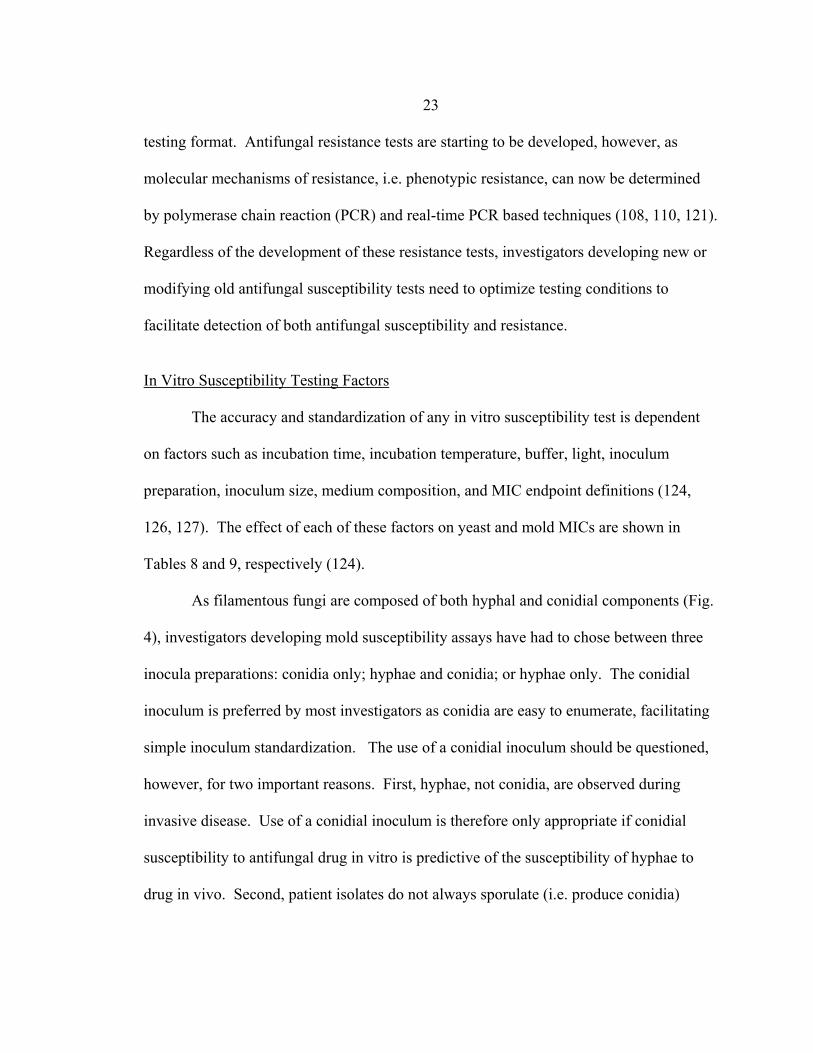
As filamentous fungi are composed of both hyphal and conidial components (Fig.
4), investigators developing mold susceptibility assays have had to chose between three
inocula preparations: conidia only; hyphae and conidia; or hyphae only. The conidial
inoculum is preferred by most investigators as conidia are easy to enumerate, facilitating
simple inoculum standardization. The use of a conidial inoculum should be questioned,
however, for two important reasons. First, hyphae, not conidia, are observed during
invasive disease. Use of a conidial inoculum is therefore only appropriate if conidial
susceptibility to antifungal drug in vitro is predictive of the susceptibility of hyphae to
drug in vivo. Second, patient isolates do not always sporulate (i.e. produce conidia)

24
Table 8. Influence of testing parameters on the MICs of yeastsa
Factor Polyene Testing (AMB) Azoles Testing (FLC)
Incubation Time Incubation Temperature Buffer, if not present Light Inoculum Size Medium MIC Endpoint Definition
MIC may increase with increased incubation time No uniform effects on MIC MIC is increased Prolonged light degrades AMB, increasing MIC Increased inoculum size increases MIC Possible antagonism with sterol or sterol-like substances in medium Uncommon growth trailing and -cidal action make MIC definition clear-cut
MIC may increase with increased incubation time Lower temperatures may result in lower MIC MIC is increased No effect on MIC Increased inoculum size increases MIC RPMI best medium for detecting azole resistance Common growth trailing due to static action makes MIC definition variable
a Adapted from reference 124.
when cultured in vitro. While one may presume that use of a hyphal inoculum would
resolve both of these issues, controversy exists as to the best way to obtain a standardized
hyphal inoculum. Hyphae can be obtained in three ways: 1) by scraping the surface of a
mature fungal colony and removing conidia by filter or gauze; 2) inoculating a broth
medium with conidia inoculum, incubating until mature hyphae are produced and
centrifuging to obtain a stock hyphal inoculum; and 3) inoculating conidia inoculum
directly into each well or tube of a susceptibility test (in the absence of drug) and

25
incubating until hyphae develop, at which time drug would be added. Although the first
two methods are most commonly used by investigators, it is important to point out that
while these hyphal inocula are standardized on the basis of optical density, they are
composed of randomly fragmented hyphae of varied lengths. These methods therefore
provide no standardization of hyphal condition. The third method of hyphal inoculum
preparation seems the most effective way of preparing a hyphal inoculum because every
Table 9. Influence of testing parameters on the MICs of filamentous fungi
Factor Polyene Testing (AMB) Azoles Testing (ITC)
Incubation Time Incubation Temperature Light Inoculum Preparation Inoculum Size Medium MIC Endpoint Definition
MIC may increase with increased incubation time No uniform effects on MIC Prolonged light degrades AMB, increasing MIC Hyphae may have higher MIC values than conidia Increased inoculum size increases MIC Am3 medium may allow detection of AMB resistance while RPMI does not Uncommon growth trailing and -cidal action make MIC definition clear-cut
MIC may increase with increased incubation time Lower temperatures may result in lower MIC No effect on MIC Hyphae may have higher MICs than conidia Increased inoculum size increases MIC RPMI best medium for detecting azole resistance Common growth trailing due to static action makes MIC definition variable
26 susceptibility test well is inoculated with the same concentration of conidia, resulting in
similar hyphal growth in each well or tube (i.e. standardized hyphal
inoculum) and the resulting hyphae remain undisturbed (non-fragmented) during
subsequent drug addition. Unfortunately, an important disadvantage of the second and
third methods of hyphal inoculum preparation is that they require conidia for well/tube or
broth inoculation, respectively, which is impractical for non-sporulating isolates. In vitro
susceptibility studies comparing conidial and hyphal MIC values have been limited in
number, with varied results. Manavathu (128), Pujol (129), and Espinel-Ingroff (130)
Figure 4. Conidial and hyphal components of A. fumigatus. An arrow indicates conidia in (A). Arrows indicate hyphae in (B). Bar represents 100 µm.
27 reported no significant differences between the conidial and hyphal MIC values while
Lass-Florl (131, 132) and Guarro (133) reported significant differences. However,
according to both Lass-Florl (134) and Pujol (129), this discrepancy may be due to an
inoculum concentration effect, with excessively concentrated or diluted hyphal inocula
concentrations resulting in erroneously high or low MIC values, respectively.
Testing factors of any susceptibility testing format can be optimized by using
appropriate yeast or mold control strains. These controls must be clinical isolates,
originally obtained from patients with confirmed mycoses and a documented history of
antifungal therapy and clinical outcome. As both pharmacokinetic effects (poor drug
penetration or distribution, unexpected interaction with additional drug, etc.) and
underlying disease in the host may be responsible for an unsuccessful clinical outcome,
strains obtained from patients with clinical failure (i.e. in vivo resistant) must be
reconfirmed as in vivo resistant by testing the strain sensitivity to drug in an appropriate
animal mycosis model. Assuming clinical response is directly related to the in vivo
susceptibility of a fungus to antifungal therapy, strains isolated from patients with
unsuccessful or successful clinical outcomes should have elevated or non-elevated in
vitro MIC values, respectively. Optimal susceptibility testing factors will therefore
facilitate an MIC reflective of the strain’s in vivo susceptibility.
In Vitro-In Vivo Correlation of Current Antifungal ASTs
As stated previously, the ultimate goal of antifungal AST’s is the ability to use in
vitro MICs as predictors of in vivo clinical outcome. This in vitro – in vivo correlation
can only be demonstrated by the ability to establish in vitro MIC breakpoint values. A
28
breakpoint value is a µg/ml concentration of drug that can be used as a cutoff for MIC
interpretation. A MIC greater or less than the breakpoint value predicts clinical
resistance or susceptibility, respectively. Breakpoint values can be established by
analyzing either the in vitro MICs of isolates obtained from random case study and
clinical trial patients with documented therapeutic outcomes or the serum drug
concentrations in patients. According to the former method, the final µg/ml breakpoint
value will be greater than the µg/ml MICs of isolates obtained from patients with
successful clinical outcomes (in vivo-sensitive) and equal to or less than the µg/ml MICs
of isolates obtained from patients with unsuccessful clinical outcomes (in vivo-resistant).
In the latter method the final µg/ml breakpoint value will be equal to the concentration of
drug in serum, with MICs greater than or equal to or less than the breakpoint value
indicating resistance or susceptibility, respectively. Unfortunately, caveats of the latter
method are that 1) drug concentrations in patient sera continually fluctuate, and 2) drug
concentrations are often different in tissue versus serum, with no standardized method of
detecting tissue drug levels. Breakpoint values were recently published for FLC, ITC,
and 5-FC NCCLS M27-A2 testing of Candida spp. (135). However, the NCCLS M38-A
assay does not yet provide azole breakpoint values for molds. In addition, no AMB
breakpoint values have been unanimously agreed upon for either yeast or molds. The
primary reason that AMB breakpoint values have not been defined is that the MICs of in
vivo-AMB resistant strains are not consistently greater than MICs of in vivo-AMB
sensitive strains (136-139). One could hypothesize that this is due to the pharmacokinetic
and/or underlying disease factors present in vivo but not in vitro. However, testing by

29 Johnson et al. has demonstrated that an in-vivo AMB resistant strain (NCPF 7097),
verified as in-vivo AMB resistant using a mouse aspergillosis model, does not produce
elevated AMB MICs in vitro (136). This suggests that either NCPF 7097’s AMB
resistance can only be detected in vivo or that current testing factors and/or methods of in
vitro susceptibility testing are not optimized for detection of AMB resistance.
The fact that breakpoint values are only available for FLC, ITC, and 5-FC testing
of Candida spp. greatly impacts the value of antifungal susceptibility assay in the clinical
setting. Without breakpoint values, susceptibility testing should not be performed, as the
physician can not justifiably utilize the MIC result in determining the most efficacious
antifungal therapy for the patient. Unfortunately, this has not been the case in recent
years, with many physicians ordering susceptibility testing and attempting to interpret
their results. This is alarming, as misinterpretation of MIC results may result in selection
of an antifungal drug for life-threatening infections that does not provide optimal efficacy
or toleration. In cases where breakpoint values have not yet been determined in
prospective clinical trials, appropriate therapy and antifungal resistance can often be
guided by species identification and careful monitoring of the patient’s overall condition,
respectively.
In Vitro Susceptibility Testing Methodologies
Early attempts in antifungal ASTs were unstandardized, with comparisons
between different assays resulting in MIC results varying as much as 50,000-fold (140,
141). By 1983, the National Committee for Clinical Laboratory Standards (NCCLS)
recognized the need for standardization and established a subcommittee to develop

30
standardized susceptibility testing procedures. The NCCLS developed a yeast
susceptibility test in 1992, currently designated as the NCCLS M27-A2 (135). This was
followed in 1998 by the development of a mold susceptibility assay, currently designated
as the NCCLS M38-A (142). Although NCCLS testing introduced standardization, it has
major weaknesses, including the subjectivity or observer-bias of MIC determinations and
the inability to detect AMB resistance. Despite these weaknesses, and the development
of improved ASTs and ARTs, the NCCLS M27-A2 and M38-A assays remain gold-
standards for in vitro susceptibility testing of yeast and molds, respectively.
A number of alternative ASTs and ARTs have recently been developed to
overcome the shortcomings of NCCLS testing, with improvements in one or more of the
following areas: added convenience (reduced initial set-up time, eliminate need for
antifungal drug dilutions, etc.; decreased testing time; generation of quantitative (i.e.
objective) MICs; and phenotypic detection of azole resistance. These tests employ a
number of techniques including NCCLS-based colorimetric assays, agar-diffusion, flow
cytometry, and polymerase chain reaction (PCR) based technologies. Only those testing
methods relevant to this thesis will be discussed in detail.
NCCLS M27-A and M38-A Methods Both NCCLS M27-A2 and M38-A testing
can be performed in either macrodilution or microdilution format. The more accepted
microdilution format requires 12 wells in a 96-well microtiter plate to test the
susceptibility of an organism to a two-fold dilution series of drug. The highest
concentration of drug in well one (64 µg/ml FLC or 16 µg/ml AMB, ITC, VRC, CAS) is
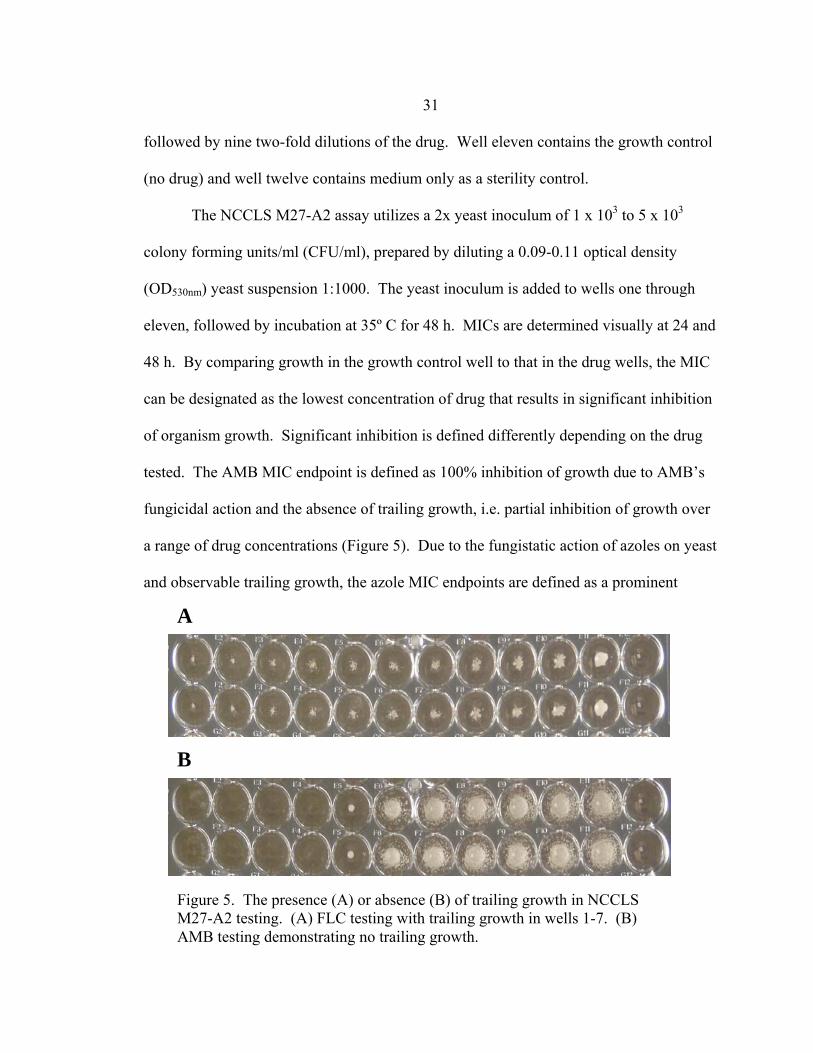
31
A
B
Figure 5. The presence (A) or absence (B) of trailing growth in NCCLS M27-A2 testing. (A) FLC testing with trailing growth in wells 1-7. (B) AMB testing demonstrating no trailing growth.
followed by nine two-fold dilutions of the drug. Well eleven contains the growth control
(no drug) and well twelve contains medium only as a sterility control.
The NCCLS M27-A2 assay utilizes a 2x yeast inoculum of 1 x 10³ to 5 x 10³
colony forming units/ml (CFU/ml), prepared by diluting a 0.09-0.11 optical density
(OD530nm) yeast suspension 1:1000. The yeast inoculum is added to wells one through
eleven, followed by incubation at 35º C for 48 h. MICs are determined visually at 24 and
48 h. By comparing growth in the growth control well to that in the drug wells, the MIC
can be designated as the lowest concentration of drug that results in significant inhibition
of organism growth. Significant inhibition is defined differently depending on the drug
tested. The AMB MIC endpoint is defined as 100% inhibition of growth due to AMB’s
fungicidal action and the absence of trailing growth, i.e. partial inhibition of growth over
a range of drug concentrations (Figure 5). Due to the fungistatic action of azoles on yeast
and observable trailing growth, the azole MIC endpoints are defined as a prominent
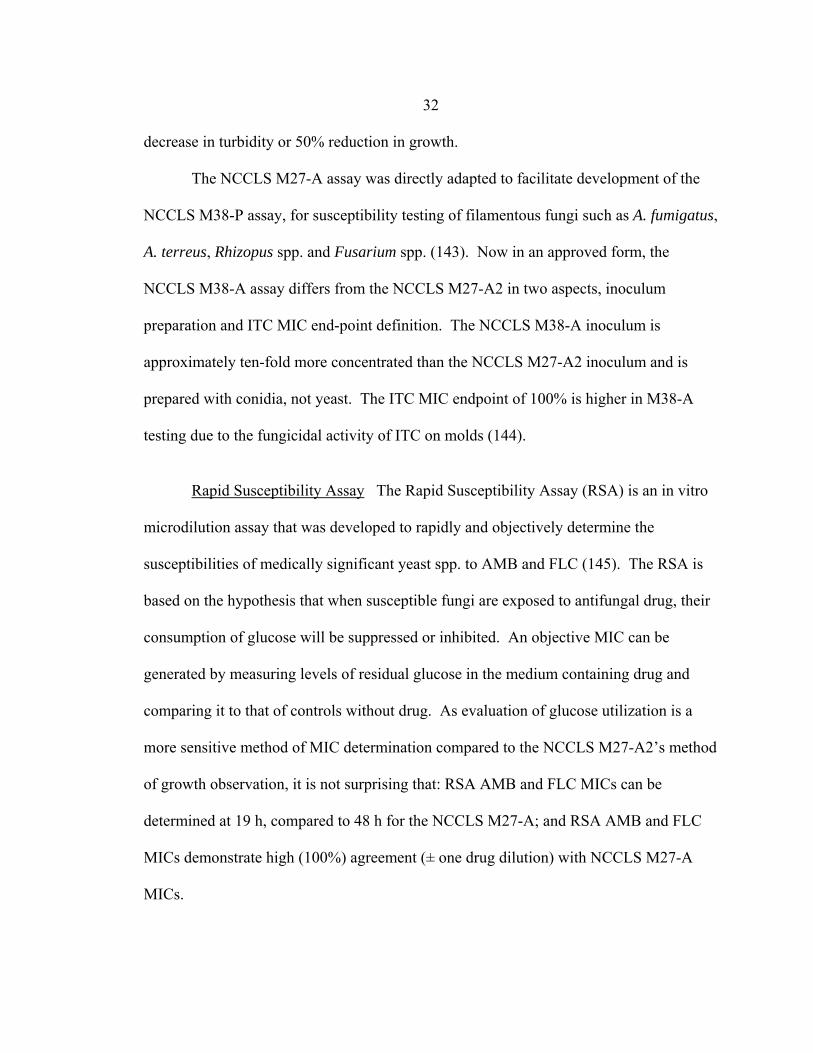
32 decrease in turbidity or 50% reduction in growth.
The NCCLS M27-A assay was directly adapted to facilitate development of the
NCCLS M38-P assay, for susceptibility testing of filamentous fungi such as A. fumigatus,
A. terreus, Rhizopus spp. and Fusarium spp. (143). Now in an approved form, the
NCCLS M38-A assay differs from the NCCLS M27-A2 in two aspects, inoculum
preparation and ITC MIC end-point definition. The NCCLS M38-A inoculum is
approximately ten-fold more concentrated than the NCCLS M27-A2 inoculum and is
prepared with conidia, not yeast. The ITC MIC endpoint of 100% is higher in M38-A
testing due to the fungicidal activity of ITC on molds (144).
Rapid Susceptibility Assay The Rapid Susceptibility Assay (RSA) is an in vitro
microdilution assay that was developed to rapidly and objectively determine the
susceptibilities of medically significant yeast spp. to AMB and FLC (145). The RSA is
based on the hypothesis that when susceptible fungi are exposed to antifungal drug, their
consumption of glucose will be suppressed or inhibited. An objective MIC can be
generated by measuring levels of residual glucose in the medium containing drug and
comparing it to that of controls without drug. As evaluation of glucose utilization is a
more sensitive method of MIC determination compared to the NCCLS M27-A2’s method
of growth observation, it is not surprising that: RSA AMB and FLC MICs can be
determined at 19 h, compared to 48 h for the NCCLS M27-A; and RSA AMB and FLC
MICs demonstrate high (100%) agreement (± one drug dilution) with NCCLS M27-A
MICs.
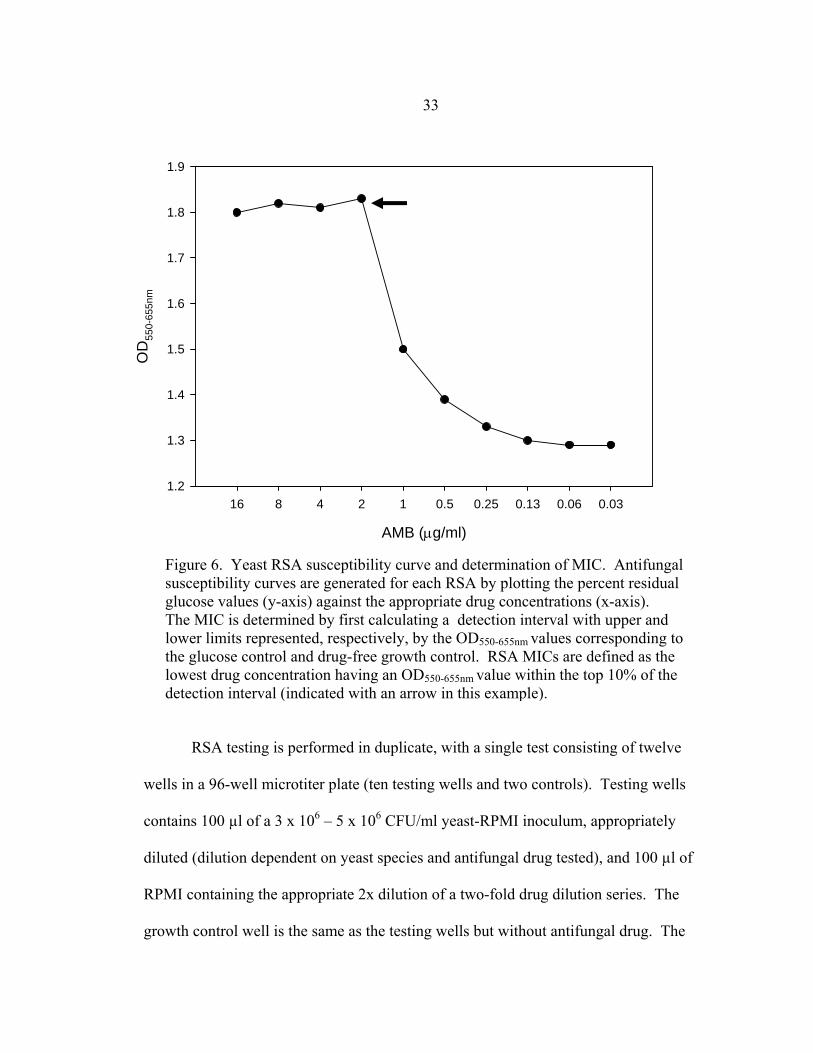
33
AMB (µg/ml)
16 8 4 2 1 0.5 0.25 0.13 0.06 0.03
OD
550-
655n
m
1.2
1.3
1.4
1.5
1.6
1.7
1.8
1.9
Figure 6. Yeast RSA susceptibility curve and determination of MIC. Antifungal susceptibility curves are generated for each RSA by plotting the percent residual glucose values (y-axis) against the appropriate drug concentrations (x-axis). The MIC is determined by first calculating a detection interval with upper and lower limits represented, respectively, by the OD550-655nm values corresponding to the glucose control and drug-free growth control. RSA MICs are defined as the lowest drug concentration having an OD550-655nm value within the top 10% of the detection interval (indicated with an arrow in this example).
RSA testing is performed in duplicate, with a single test consisting of twelve
wells in a 96-well microtiter plate (ten testing wells and two controls). Testing wells
contains 100 µl of a 3 x 10⁶ – 5 x 10⁶ CFU/ml yeast-RPMI inoculum, appropriately
diluted (dilution dependent on yeast species and antifungal drug tested), and 100 µl of
RPMI containing the appropriate 2x dilution of a two-fold drug dilution series. The
growth control well is the same as the testing wells but without antifungal drug. The

34
glucose control well contains neither yeast nor drug. After incubating for 19 h at 35-37º
C, residual glucose values are determined colorimetrically by adding 50 µl of a glucose
oxidase enzymatic mix (146, 147), incubating at room temperature for 20-30 min, and
reading at OD550-655nm in a spectrophotometer. Objective MICs are obtained by plotting
residual glucose values against the corresponding concentration of drug and analyzing the
resulting susceptibility curve (Fig. 6).
AMB and FLC RSA conditions were optimized for C. albicans, C. parapsilosis,
C. krusei, and C. tropicalis using NCCLS M27-A quality control strains: ATCC 24433
(C. albicans); ATCC 90028 (C. albicans); ATCC 750 (C. tropicalis); ATCC 6258 (C.
krusei); ATCC 22019 (C. parapsilosis); and ATCC 90018 (C. parapsilosis). Although
these are clinical strains, there is no documentation as to the therapeutic outcomes of the
patients from which they were obtained. Until such clinical strains are tested, the ability
of RSA MICs to predict in vivo clinical outcome must be questioned. The RSA can also
be improved by optimizing conditions for C. glabrata testing, introducing testing of new
antifungal agents such as VRC and CAS, and modifying conditions to facilitate rapid and
objective MIC determination for filamentous fungi.
Elipsometer Test The Elipsometer test (Etest) is an agar-diffusion form of
susceptibility testing that is attractive due to its simplicity, reproducibility, and lack of
requirement for specialized equipment (143). An Etest plastic strip, impregnated with 15
dilutions of drug, is placed on an RPMI agar plate (2% glucose) previously streaked with
a yeast or mold inoculum, with diffusion of drug from the strip into the agar. A zone of
growth inhibition, in the shape of an ellipse, can be observed at 24-48 h, with the vertical

35
length of the ellipse dependent on the organism’s susceptibility to drug and the horizontal
width dependent on the diffusion properties of the drug in the strip. The MIC is read as
the lowest drug concentration at which the border of the elliptical inhibition zone
intercepts the scale on the strip. Overall, yeast and mold Etest MIC values have
compared favorably (± 1 to 2 drug dilutions) with MIC values obtained with NCCLS
M27-A2 and M38-A testing, respectively. The percent agreement between the E-test and
NCCLS M38-A MICs of filamentous fungi such as A. fumigatus, A. terreus, A. flavus,
Fusarium spp., and Scedosporium spp., ranges from 20 to 100%, depending on antifungal
drug (148-151). The percent agreement between the Etest and NCCLS M27-A2 MICs of
yeasts such as Candida spp. and C. neoformans ranges from 0 to 100%, with again, the
percentage dependent on antifungal drug (152-155). For both yeasts and mold, the
lowest percent agreement always corresponds to AMB testing. This difference in AMB
MIC values between Etest and NCCLS testing may be explained in two ways: first, the
use of a higher conidial or yeast inoculum concentration in the E-test method results in
erroneously high MICs by 48 h incubation, requiring that AMB MICs be read at 24 h
(151, 156); and second, comparisons of Etest and NCCLS M27-A2 AMB MICs of in
vivo-AMB resistant clinical isolates of Candida spp. and Cryptococcus neoformans
suggest that the Etest may facilitate detection of AMB resistance while the NCCLS M27-
A2 does not (157-160). It is important to point out, however, that the Etest has not yet
been demonstrated to detect AMB resistance in filamentous fungi.
Other Colorimetric Methods MTT (3-(4,5-dimethyl-2-thiazolyl)-2,5-diprenyl-
2H-tetrazolium bromide) and XTT (2,3-bis(2-methoxy-4-nitro-5-dulfophenyl)-5-

36
[(phenylamino) carbonyl]-2H-tetrazolium hydroxide) have been used as colorimetric
markers in microdilution susceptibility testing of Candida spp. (161-165), C. neoformans
(162, 163), and mold spp. such as Aspergillus, Fusarium, and Scedosporium (165-168).
Both MTT and XTT are reduced by mitochondrial dehydrogenases of metabolically
active fungi to a formazan derivative (169). The only difference between the assays is
that the MTT assay requires an additional extraction step to solubilize the formazan
derivatives. Both assays utilize a NCCLS-based testing format (i.e. identical growth
medium, inoculum procedure, incubation conditions, etc.), with XTT and MTT addition
occurring immediately after the 24 or 48 h incubation at 35º C. The percent agreement
between XTT/MTT and NCCLS testing MICs is excellent (>90%).
The Sensititre Yeast One colorimetric antifungal susceptibility panel utilizes the
colorimetric marker Alamar Blue, another oxidation-reduction indicator, which changes
color from deep blue to bright pink in the presence of growing organisms or cells (170).
The application of Alamar Blue in antifungal susceptibility testing has been demonstrated
with Candida spp. (165, 171-174), Cryptococcus spp. (172, 173), and Aspergillus spp.
(156, 165, 175). The azole and polyene MICs of Candida spp. obtained using Alamar
Blue have a high percentage agreement (≥ 90%) with those obtained in NCCLS M27
testing. In contrast to Candida, percent agreement between Alamar Blue and NCCLS
M38 testing azole and/or polyene MICs of Aspergillus spp. are highly variable, often due
to differences in incubation time and endpoint definitions between studies.
37 Optimal Antifungal Susceptibility and/or Resistance Testing
Although antimicrobial susceptibility or resistance testing can be performed in
hospital and reference laboratories, most antifungal testing is currently performed in
references laboratories. This is unfortunate as the advantage of testing in a hospital
laboratory is that it can be initiated on-site as soon as the fungus is identified (ART) and
isolated (AST) from a patient sample. The turnaround time for testing results can be
much slower when performed at a reference laboratory, as the isolated fungus must first
be sent from the hospital laboratory to the reference laboratory. As the chance of a
successful clinical outcome inversely correlates with the time it takes to administer an
effective antifungal regimen, it is critical to generate MIC data as rapidly as possible. If
reference laboratories are to continue as the primary setting for antifungal susceptibility
and/or resistance testing, it is important that they begin to use and/or develop testing
formats that facilitate MIC determinations in a more rapid manner than would be possible
in a hospital laboratory setting. If this is not possible, an appropriate testing format
should be introduced to and routinely performed in the hospital laboratory.
Determining the optimal susceptibility and/or resistance testing format for a
hospital or reference laboratory requires identification of each method’s advantages and
disadvantages (Table 10). An ideal testing format in the hospital laboratory would be one
that: 1) limits instrument use, as most hospitals can not afford to buy expensive
equipment that is used only a small portion of the time; 2) requires limited technical
training, as it may be difficult and/or expensive to train all personnel in the hospital
laboratory; 3) produces objective MICs, to eliminate the subjectivity of MIC

38
interpretations between personnel; and 4) requires the least amount of time, to ensure
optimal therapy for the patient. Based on Table 10, resistance testing such as PCR and
real-time PCR, and susceptibility testing such as flow cytometry are not optimal due to
expensive instrumentation and extensive technical training. Although ASTs like NCCLS
M27-A2, NCCLS M38-A, and Etest require little instrumentation and technical training,
MIC determination can be subjective (especially azole drug testing) and may require ≥ 48
h. The optimal testing format would therefore be one of the colorimetric assays, such as
the RSA, XTT, Alamar Blue, which require little instrumentation and provide objective
MICs in less than 48 h. Of the three, the RSA is the least time-consuming, generating
MICs in the shortest period of time.
As reference laboratories employee a limited number of trained personnel to
repeatedly perform the same test daily with large numbers of fungal isolates, an ideal
testing format would be one that has the high thorough-put and provides objective MICs.
ART testing such as PCR and real-time PCR would be logical in this setting as resistance
can be detected in a short period of time, with most PCR and real-time equipment
facilitating simultaneous testing of multiple isolates. However, because PCR-based
testing may not detect all types of resistance, reference labs should also perform AST
testing. Although currently used in reference laboratories, ASTs such as NCCLS M27-
A2. NCCLS M38-A, and E-test are still suboptimal due to prolonged incubation times
and subjective MIC determinations. Again, a colorimetric assay, such as the RSA, would
be the optimal AST format for the reference laboratory.
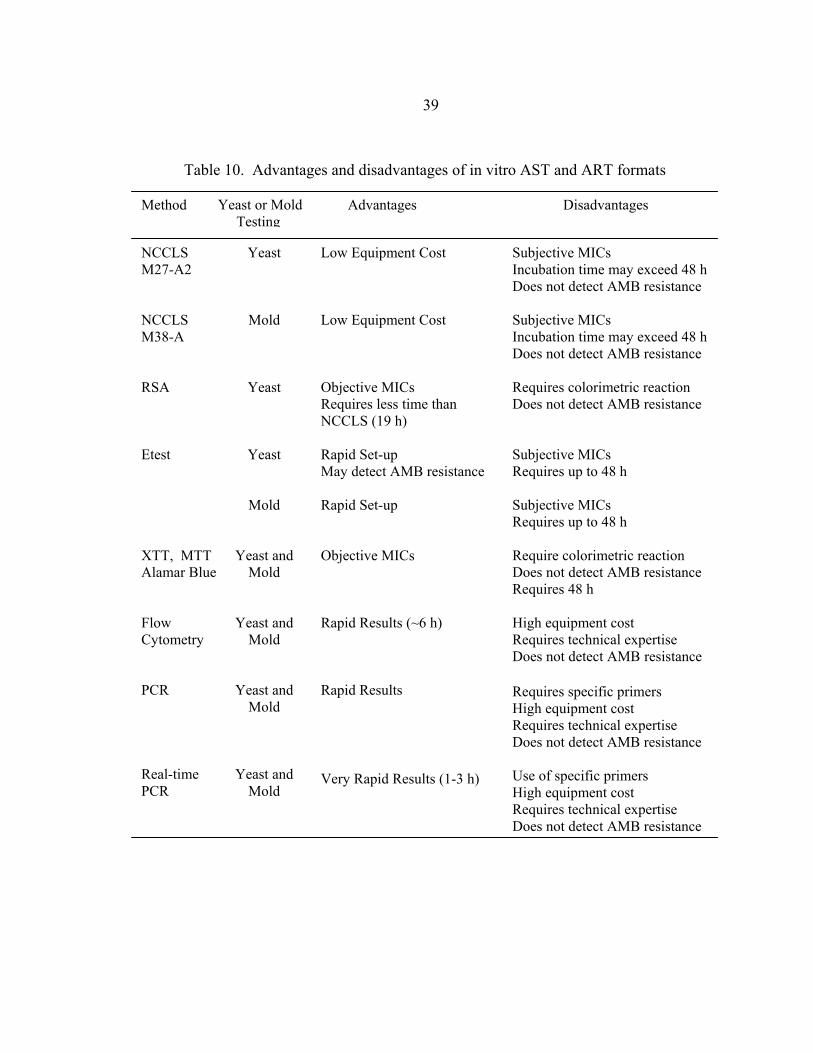
39
Method Advantages Disadvantages
Low Equipment Cost Low Equipment Cost Objective MICs Requires less time than NCCLS (19 h) Rapid Set-up May detect AMB resistance Rapid Set-up Objective MICs Rapid Results (~6 h) Rapid Results Very Rapid Results (1-3 h)
NCCLS M27-A2 NCCLS M38-A RSA Etest XTT, MTT Alamar Blue Flow Cytometry PCR Real-time PCR
Yeast
Mold
Yeast
Yeast
Mold
Yeast and Mold
Yeast and Mold
Yeast and Mold
Yeast and Mold
Subjective MICs Incubation time may exceed 48 h Does not detect AMB resistance Subjective MICs Incubation time may exceed 48 h Does not detect AMB resistance Requires colorimetric reaction Does not detect AMB resistance Subjective MICs Requires up to 48 h Subjective MICs Requires up to 48 h Require colorimetric reaction Does not detect AMB resistance Requires 48 h High equipment cost Requires technical expertise Does not detect AMB resistance Requires specific primers High equipment cost Requires technical expertise Does not detect AMB resistance Use of specific primers High equipment cost Requires technical expertise Does not detect AMB resistance
Yeast or Mold Testing
Table 10. Advantages and disadvantages of in vitro AST and ART formats

40
Concurrent and Sequential Antifungal Combination
Susceptibility Testing of Aspergillus fumigatus
Introduction
With the rapidly increasing incidence, high mortality rates, and antifungal
resistance of fungal infections, the development of new concurrent antifungal
combination regimens have advantages as they may 1) enhance the rate and extent of
fungicidal effect through drug additivity or synergism, 2) increase the spectrum of
antifungal activity, 3) facilitate a more rapid antifungal effect; 4) decrease antifungal
toxicity, and 5) prevent antifungal resistance (176). While combination therapy has
become routine in treating bacterial infections such as tuberculosis, Q fever, and
enterococcal bacteremia (177), advances in antifungal combination therapy lag behind,
with the only routine combination therapy being the treatment of cryptococcal meningitis
with AMB and 5-FC (60, 62, 178).
Sequential antifungal therapy has recently become an important issue due to the
advent of new antifungals, regular use of antifungal prophylaxis, and emergence of
antifungal resistance. Patients not responding to primary IA therapy, due to host factors
or antifungal resistance, can now be treated with secondary or even tertiary antifungal
regimens. In addition, patients on antifungal prophylaxis that develop breakthrough IA
will also be given secondary and sometimes tertiary antifungal regimens. To confound
matters, sequential therapy is often considered combination therapy, as the most common
first-line IA therapy, AMB, has a long half-life (≤15 days), resulting in residual levels of
primary drug in tissue during subsequent antifungal regimens (50, 53). Therefore, the

41
greatest concern in sequential therapy is determining the most appropriate and safe
sequence of antifungal agents.
Antifungals currently approved to treat the majority of A. fumigatus invasive
aspergillosis (IA) infections target three cell functions: ergosterol production (VRC,
ITC), cell membrane integrity (AMB), and cell wall integrity (CAS). If one also
considers the antifungal drugs currently in clinical trials and improved medications of
traditional drugs (liposomal AMB and oral and i.v. formulations of ITC), there are a large
number of possible concurrent and sequential antifungal combinations that could be used
to treat IA. This discussion will be limited to concurrent and sequential antifungal
combination therapy and susceptibility testing involving AMB, ITC, and VRC, as the
experiments discussed in this thesis were restricted to the use of these three antifungal
agents.
Combination therapy may result in pharmacokinetic or pharmacodynamic
interactions (176). Pharmacokinetic interactions are those affecting the amount, rate,
and ratio of drug concentration at the infection site in vivo. Indirect pharmacokinetic
interactions occur when addition of a second drug results in improved penetration or
accumulation at the site of infection over a single drug. Direct pharmacokinetic
interactions occur when one drug enhances or attenuates the activity of the other by
interfering with its adsorption, metabolism, or elimination. Pharmacodynamic
interactions can be classified into four groups: 1) those affecting the spectrum of
antifungal activity; 2) the rate or extent of killing though synergistic or antagonistic
effects; 3) the selection of resistant organisms; and 4) antifungal toxicity. Combining

42
antifungal drugs to increase the spectrum of antifungal activity may be most suitable in
prophylactic antifungal therapy, where a variety of fungi, with varying susceptibilities to
any one drug, could potentially cause disease. For example, bone marrow transplant
recipients are routinely treated prophylactically with fluconazole to prevent candidiasis
(179), yet up to 30% of these patients become infected with Aspergillus, a mold refractive
to fluconazole therapy (3). The development of a prophylactic regimen of fluconazole
combined with a drug effective against Aspergillus spp. should perhaps be considered for
patients in this high risk group. Combination therapy is usually administered to get a
synergistic effect. Synergism is a positive interaction, where the combined effect of the
drugs in vivo is significantly greater than the effects of the drugs when used
independently. When combination therapy does not result in a significantly greater or
less effect than the independent effects of the drugs, the combination effect is termed
additive or indifferent. The worst type of combination therapy is one that results in
antagonism, a negative interaction in which the combined effect of the drugs in vivo is
significantly less than the effects of the drugs when used independently. Combination
therapy may also reduce the emergence of resistant strains that cause clinical failure. By
administering antifungal drugs in combination, the chance of an invasive Aspergillus
species becoming resistant to both antifungals is theoretically very low. Combination
therapy can also decrease antifungal toxicity by permitting administration of lower doses
of toxic drugs like AMB.
Although limited in number, the efficacies of concurrent and sequential antifungal
combinations against Aspergillus fumigatus have been investigated and/or demonstrated

43
in three formats: in vitro susceptibility testing with Aspergillus clinical or laboratory
isolates, in vivo combination therapy in animal IA models; and clinical combination
therapy in random IA case studies. Clinical applications of antifungal therapy have been
anecdotal, using combinations that have a theoretical advantage (180). While most of
these cases involved desperately ill patients who were refractory to standard
monotherapy, this practice should be discouraged at this time as preclinical investigations
followed by appropriately designed clinical trials are necessary to determine the safety
and efficacy of any antifungal combination therapy (180, 181).
In Vitro Antifungal Combination Susceptibility Testing Methods
In vitro antifungal combination susceptibility testing has been developed to
rapidly determine the pharmacokinetic interactions between antifungals in vitro (176,
182, 183). It is important to point out that in vitro testing only determines the interactions
between drugs at the level of the fungal cell and that interpretation of the results of these
interactions do not necessarily correlate with clinical outcome as most cases of
antimicrobial synergism in vitro have not been predictive of superior clinical efficacy
(184).
Checkerboard Combination Testing Due to its convenience, checkerboard
testing is the most common method used to test antifungal combinations in vitro. A
dilution series of one drug is tested against the dilution series of a second drug in a
microwell or tube “checkerboard” format, with each well or tube containing a unique
combination of antifungal drugs. The concentrations of drug in each dilution series range
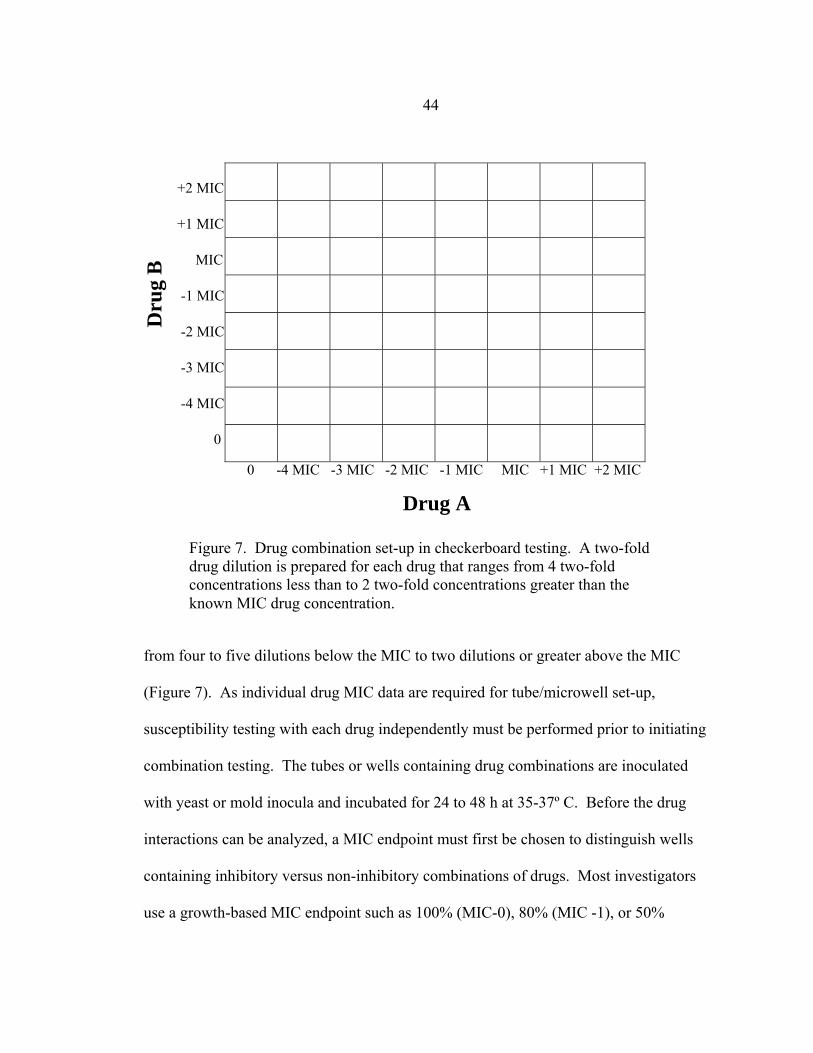
44
from four to five dilutions below the MIC to two dilutions or greater above the MIC
(Figure 7). As individual drug MIC data are required for tube/microwell set-up,
susceptibility testing with each drug independently must be performed prior to initiating
combination testing. The tubes or wells containing drug combinations are inoculated
with yeast or mold inocula and incubated for 24 to 48 h at 35-37º C. Before the drug
interactions can be analyzed, a MIC endpoint must first be chosen to distinguish wells
containing inhibitory versus non-inhibitory combinations of drugs. Most investigators
use a growth-based MIC endpoint such as 100% (MIC-0), 80% (MIC -1), or 50%
Figure 7. Drug combination set-up in checkerboard testing. A two-fold drug dilution is prepared for each drug that ranges from 4 two-fold concentrations less than to 2 two-fold concentrations greater than the known MIC drug concentration.
0 -4 MIC -3 MIC -2 MIC -1 MIC MIC +1 MIC +2 MIC
+2 MIC
+1 MIC
MIC
-1 MIC
-2 MIC
-3 MIC
-4 MIC
0
Drug A
Dru
g B
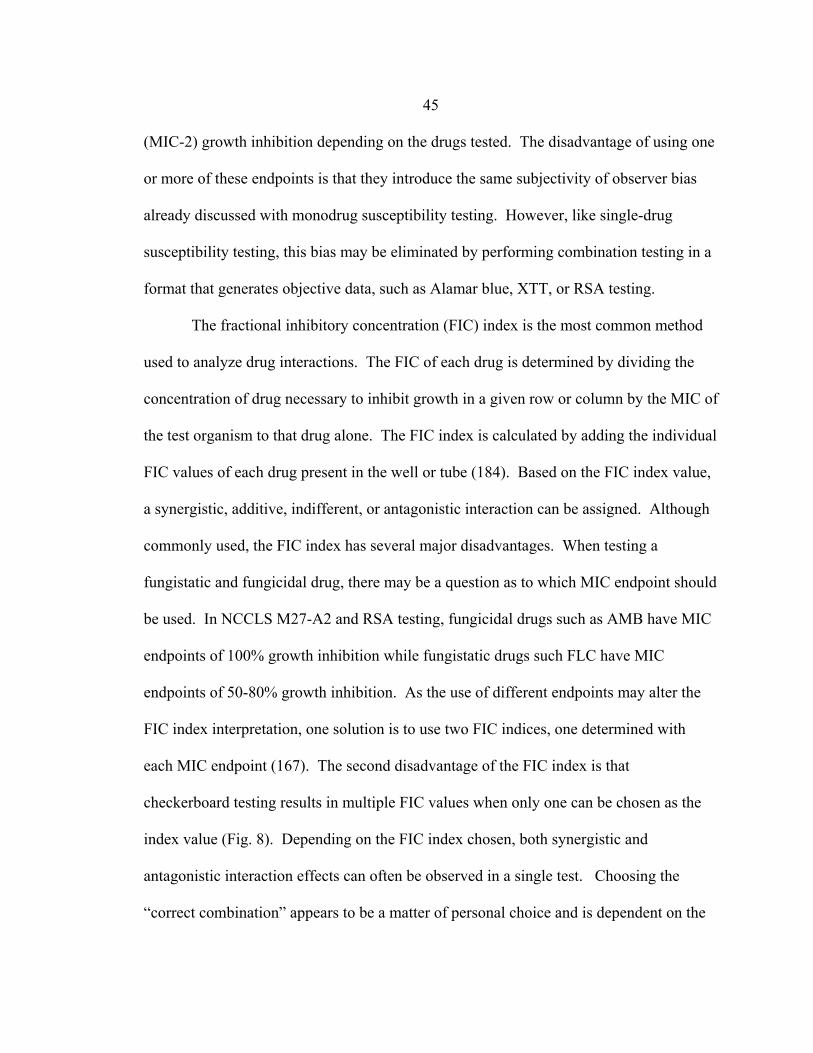
45 (MIC-2) growth inhibition depending on the drugs tested. The disadvantage of using one
or more of these endpoints is that they introduce the same subjectivity of observer bias
already discussed with monodrug susceptibility testing. However, like single-drug
susceptibility testing, this bias may be eliminated by performing combination testing in a
format that generates objective data, such as Alamar blue, XTT, or RSA testing.
The fractional inhibitory concentration (FIC) index is the most common method
used to analyze drug interactions. The FIC of each drug is determined by dividing the
concentration of drug necessary to inhibit growth in a given row or column by the MIC of
the test organism to that drug alone. The FIC index is calculated by adding the individual
FIC values of each drug present in the well or tube (184). Based on the FIC index value,
a synergistic, additive, indifferent, or antagonistic interaction can be assigned. Although
commonly used, the FIC index has several major disadvantages. When testing a
fungistatic and fungicidal drug, there may be a question as to which MIC endpoint should
be used. In NCCLS M27-A2 and RSA testing, fungicidal drugs such as AMB have MIC
endpoints of 100% growth inhibition while fungistatic drugs such FLC have MIC
endpoints of 50-80% growth inhibition. As the use of different endpoints may alter the
FIC index interpretation, one solution is to use two FIC indices, one determined with
each MIC endpoint (167). The second disadvantage of the FIC index is that
checkerboard testing results in multiple FIC values when only one can be chosen as the
index value (Fig. 8). Depending on the FIC index chosen, both synergistic and
antagonistic interaction effects can often be observed in a single test. Choosing the
“correct combination” appears to be a matter of personal choice and is dependent on the

46 goals of the study. Many investigators use the mean FIC value from the entire range of
FIC values as their FIC index (185). Others designate the FIC index as the highest or
lowest FIC value from a range of FIC values within clinically relevant concentrations of
each drug. A third option is to use the lowest FIC value if none of the other FIC values
indicate antagonism or chose the highest FIC value if one or more FIC values indicate
antagonism (167). The third disadvantage of the FIC index is that there are numerous
definitions described in the literature for its interpretation (Table 11) (167, 185-199).
X X X X
X
X
X
Dru
g B
(µg/
ml)
Drug A (µg/ml)
0 0.03 0.06 0.13 0.25 0.5 1.0 2.0
4.0
2.0
1.0
0.5 0.25
0.13
0.06
0
Figure 8. Multiple FIC index values in a single checkerboard test. Grey wells correspond to fungal growth greater than the MIC endpoint definition while white wells correspond to fungal growth equal to or less than the MIC endpoint definition. FIC index values would be determined in wells indicated with an X.

47 The first set of FIC index definitions shown in Table 10, originally described by
Berenbaum in 1978, has been used extensively in assessing both antibacterial and
antifungal drug interactions (200). Although widely used, this set of definitions may be
too restrictive as it does not recognize indifferent interactions. The second set of FIC
index definitions is preferable over Berenbaum’s as it includes indifferent interactions
and takes into consideration the experimental error of ±1 dilution that is often observed in
checkerboard testing (183, 201). The remaining FIC index definitions have been used
sparingly in random antifungal combination studies.
<1.0
≤0.5
<1.0
≤0.5
<1.0
≤0.5
≤0.5
1.0
>0.5 - ≤1.0
1.0
>0.5 - <1.0
≥1.0 - ≤2.0
> 0.5 – 2.0 -
-
>1.0 - ≤4.0
>1.0 - ≤2.0
≥1.0 - <4.0
2.0 -
>0.5 - ≤2.0
>1.0
>4.0
>2.0
≥4.0
>2.0
>2.0
>4.0
146, 112, 191, 140 162, 37, 116, 114, 183, 209 187, 210 141 117 147 206
Synergy Additivity Indifference Antagonism FIC Index Interpretation
Definition number
References
1 2 3 4 5 6 7
Table 11. Published FIC index interpretation definitions

48 Response surface statistical analysis is an alternative method for analyzing drug
interactions (202). Originally utilized in antiviral combination studies (203, 204), the
response surface approach considers the results in every well, fits a model to the whole
response surface, and provides a quantitative interaction value with 95% confidence
intervals. The E-max based, fully parametric Greco model is a response surface model
that fits the entire data set with a nonlinear regression analysis and calculates an objective
interaction coefficient alpha (ICα) that represents the drug interaction. If the ICα is zero,
greater than zero, or less than zero, the drug interaction is interpreted as additive,
synergistic, or antagonistic, respectively. Statistical significance of the ICα is determined
by analyzing its 95% confidence interval (CI). If the CI includes zero, the drug
interaction is not significant and should be considered additive. If the interval does not
include zero, the drug interaction is considered significant and the original ICα
interpretation is upheld. The one limitation of the Greco model, at least to investigators
using a NCCLS-based endpoint, is that the model requires quantitative input data for each
well. Observer-based endpoints (NCCLS) are therefore not permitted due to their
subjectivity. This limitation has been addressed by the use of colorimetric assays such as
MTT to objectively quantify the level of growth (167).
Time-Kill Combination Testing Time-kill combination testing is another method
used to test antifungal combinations in vitro. Unlike the checkerboard method, which
can only show fungistatic activity, time-kill testing measures the fungicidal activity of the
combination being tested. This makes the time-kill testing format more relevant for
clinical situations in which fungicidal therapy is desired. Another advantage is that time-

49
kill testing provides a dynamic picture of antifungal interaction and interaction over time
(based in CFU/ml), as opposed to the checkerboard, which is examined at one time point.
Unfortunately, the constant CFU/ml determinations are tedious and greatly limit the
number of antifungal concentrations and combinations that can be tested (184).
Concurrent Antifungal Combination Therapy and In Vitro Susceptibility Testing
Amphotericin B and Itraconazole The most controversial concurrent antifungal
combination is an azole with AMB (azole/AMB). The greatest debate has been whether
the azole inhibits ergosterol production, thereby eliminating AMB’s target and resulting
in antagonism. While this would be a major concern if the azole acted on the fungal cell
prior to AMB, it is in reality the opposite, with AMB acting on the fungal cell before the
azole (176). Other hypotheses for azole/AMB antagonism involve the rapid
accumulation of lipophilic azoles on the fungal cell surface, inhibiting AMB binding to
ergosterol (205) or that the early effects of AMB on the cell membrane interferes with
azole entry into the cell (206).
In an excellent review of 249 cases of concurrent combination therapy, Denning
et al. reported 41 cases of patients treated with AMB and ITC (AMB+ITC). While the 21
deaths may have occurred due to antagonism, the remaining patients all demonstrated
clinical improvement. Results of AMB+ITC therapy in mouse and guinea pig IA models
have resulted in predominantly indifferent effects. The results of in vitro AMB+ITC
susceptibility testing are just as confusing, with 1, 4, and 2 studies indicating synergy,
additivity, and antagonistic effects, respectively (207). Clearly, the current results of both

50
in vivo and in vitro AMB+ITC studies are too inconsistent to make a statement regarding
the true effects of AMB+ITC.
Amphotericin B and Voriconazole Little has been documented regarding the in
vivo and in vitro effects of combining AMB and VRC (AMB+VRC). We could not
locate any literature reporting AMB/VRC clinical use or the results of in vivo AMB/VRC
animal studies. Manavathu et al. demonstrated an indifferent AMB/VRC effect in vitro
by a checkerboard technique that measured 14C-amino acid incorporation by mycelia for
determination of fungal growth (208).
Itraconazole and Voriconazole We were unable to locate any literature in which
the in vivo or in vitro effects of concurrent ITC and VRC were presented. This was
expected as ITC and VRC are proposed to have the same fungal target.
Sequential Antifungal Combination Therapy and In Vitro Susceptibility Testing
Amphotericin followed by Itraconazole or Voriconazole The most documented
sequential therapy is AMB followed by ITC (A→I). This is not surprising as AMB has,
until recently, been the primary therapy for patients with IA. As ITC was the only other
antifungal regimen available, it was administered as the secondary therapy if AMB
therapy failed or was terminated due to toxicity issues. In fact, a widely accepted
regimen uses AMB until neutropenia resolves followed by ITC maintenance therapy
(207, 209). This sequence of therapy has been repeatedly documented as causing no harm
and in some cases being more efficacious than either AMB or ITC monotherapy (209-

51
212). As VRC is a relatively new drug, information regarding its use after AMB (A→V)
has been limited to a few case studies. However, these examples demonstrate patient
improvement when VRC is initiated following discontinuation of AMB (213-215).
Reports of A→I and A→V in vitro susceptibility testing are very limited. Using
checkerboard testing, Maesaki et al. showed that a 1 h pretreatment of A. fumigatus
conidia with AMB, followed by 24 h incubation with ITC, resulted in greater synergistic
effects than those obtained when the drugs were administered concurrently (216).
Maesaki et al. later performed additional A→I in vitro susceptibility testing, this time
using mycelial weight as an indicator of inhibition, and found no synergistic effect by
pretreating with AMB (217). Importantly, no antagonistic effects were noted in either
study.
Itraconazole or Voriconazole followed by Amphotericin B The most
controversial sequence of antifungal therapies is an azole followed by AMB. Although
some case studies have described patients improving with primary and secondary
regimens of ITC and AMB (ITC→AMB), most patients receiving ITC→AMB therapy
either die or are given a tertiary therapeutic regimen (218-225). There have been no
clinical reports of failed VRC therapy followed by AMB therapy.
Both in vivo and in vitro studies have investigated the effect of ITC→AMB.
Lewis et al. used a mouse model of sinopulmonary aspergillosis to determine the effect of
ITC→AMB therapy in vivo. Antagonism was demonstrated using four different
endpoints: CFU/ml in lung tissue; whole-lung chitin assay; mortality at 96 h; and
histopathology of lung sections (226). Using both in vitro checkerboard and mycelial
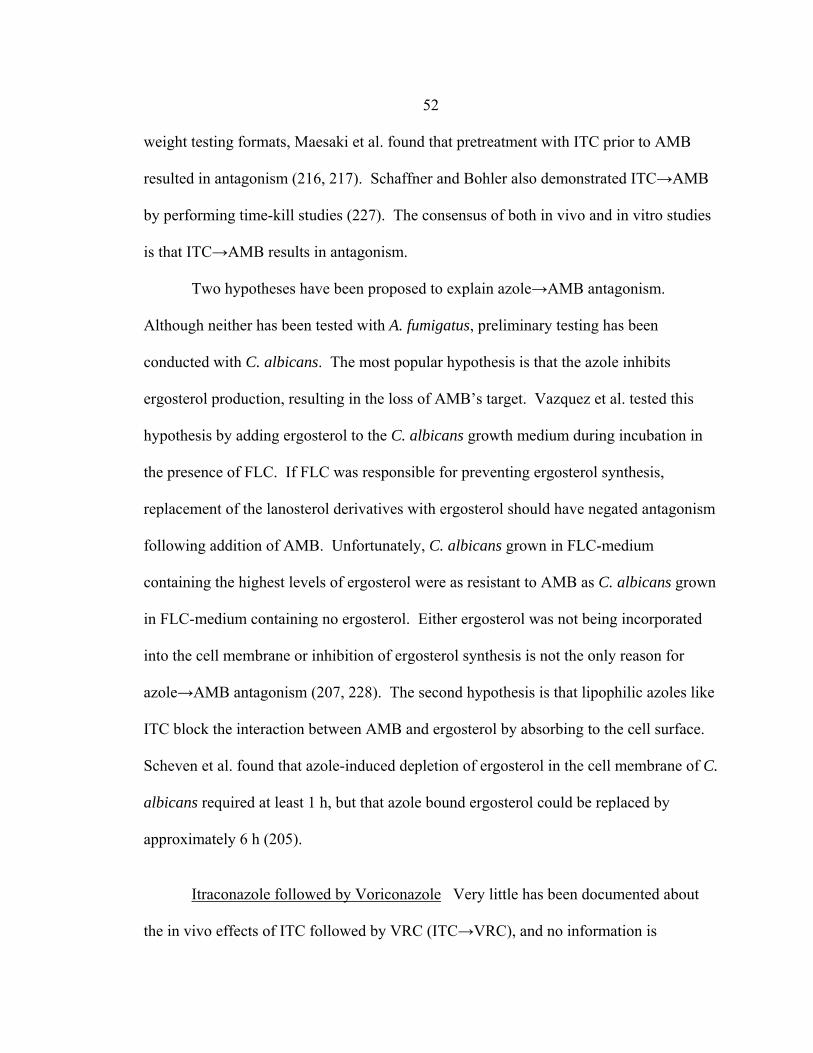
52
weight testing formats, Maesaki et al. found that pretreatment with ITC prior to AMB
resulted in antagonism (216, 217). Schaffner and Bohler also demonstrated ITC→AMB
by performing time-kill studies (227). The consensus of both in vivo and in vitro studies
is that ITC→AMB results in antagonism.
Two hypotheses have been proposed to explain azole→AMB antagonism.
Although neither has been tested with A. fumigatus, preliminary testing has been
conducted with C. albicans. The most popular hypothesis is that the azole inhibits
ergosterol production, resulting in the loss of AMB’s target. Vazquez et al. tested this
hypothesis by adding ergosterol to the C. albicans growth medium during incubation in
the presence of FLC. If FLC was responsible for preventing ergosterol synthesis,
replacement of the lanosterol derivatives with ergosterol should have negated antagonism
following addition of AMB. Unfortunately, C. albicans grown in FLC-medium
containing the highest levels of ergosterol were as resistant to AMB as C. albicans grown
in FLC-medium containing no ergosterol. Either ergosterol was not being incorporated
into the cell membrane or inhibition of ergosterol synthesis is not the only reason for
azole→AMB antagonism (207, 228). The second hypothesis is that lipophilic azoles like
ITC block the interaction between AMB and ergosterol by absorbing to the cell surface.
Scheven et al. found that azole-induced depletion of ergosterol in the cell membrane of C.
albicans required at least 1 h, but that azole bound ergosterol could be replaced by
approximately 6 h (205).
Itraconazole followed by Voriconazole Very little has been documented about
the in vivo effects of ITC followed by VRC (ITC→VRC), and no information is
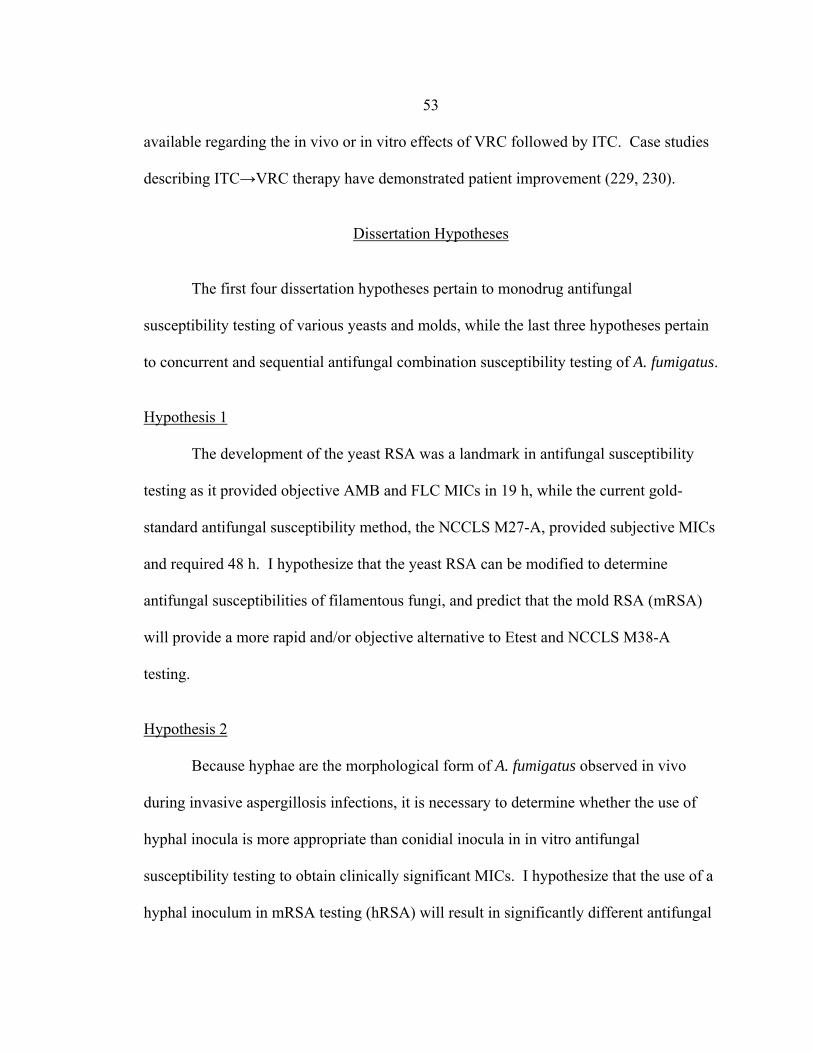
53
available regarding the in vivo or in vitro effects of VRC followed by ITC. Case studies
describing ITC→VRC therapy have demonstrated patient improvement (229, 230).
Dissertation Hypotheses
The first four dissertation hypotheses pertain to monodrug antifungal
susceptibility testing of various yeasts and molds, while the last three hypotheses pertain
to concurrent and sequential antifungal combination susceptibility testing of A. fumigatus.
Hypothesis 1
The development of the yeast RSA was a landmark in antifungal susceptibility
testing as it provided objective AMB and FLC MICs in 19 h, while the current gold-
standard antifungal susceptibility method, the NCCLS M27-A, provided subjective MICs
and required 48 h. I hypothesize that the yeast RSA can be modified to determine
antifungal susceptibilities of filamentous fungi, and predict that the mold RSA (mRSA)
will provide a more rapid and/or objective alternative to Etest and NCCLS M38-A
testing.
Hypothesis 2
Because hyphae are the morphological form of A. fumigatus observed in vivo
during invasive aspergillosis infections, it is necessary to determine whether the use of
hyphal inocula is more appropriate than conidial inocula in in vitro antifungal
susceptibility testing to obtain clinically significant MICs. I hypothesize that the use of a
hyphal inoculum in mRSA testing (hRSA) will result in significantly different antifungal
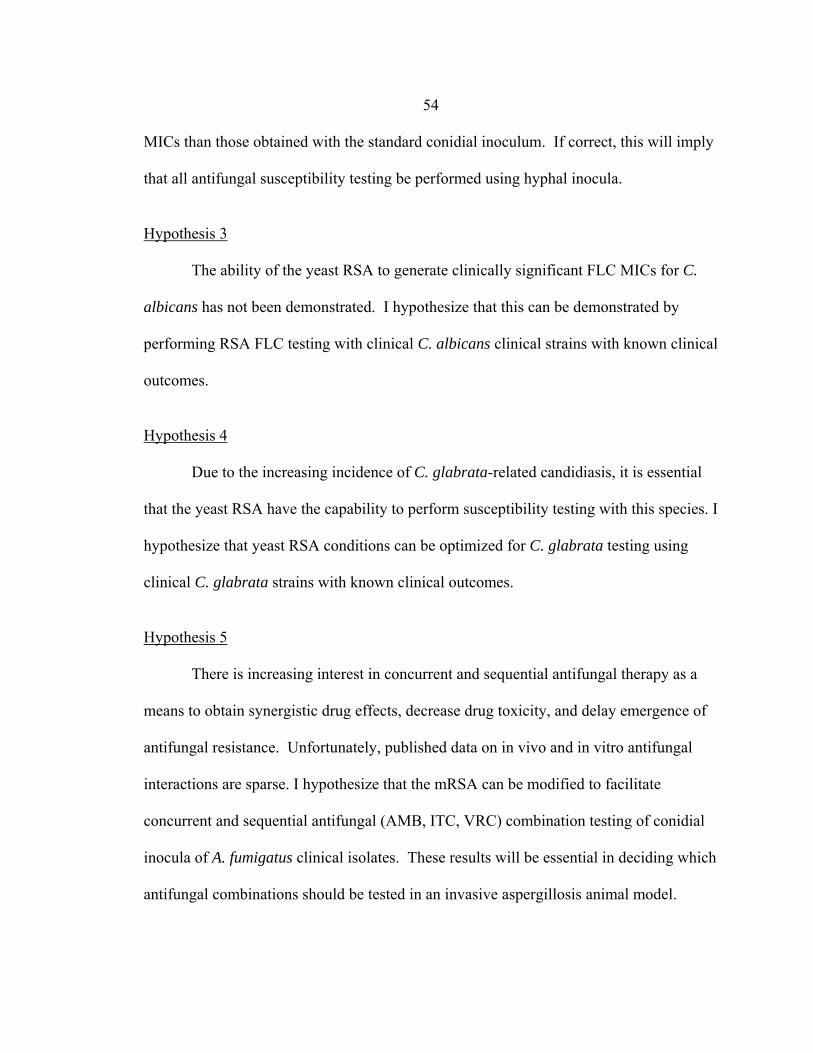
54
MICs than those obtained with the standard conidial inoculum. If correct, this will imply
that all antifungal susceptibility testing be performed using hyphal inocula.
Hypothesis 3
The ability of the yeast RSA to generate clinically significant FLC MICs for C.
albicans has not been demonstrated. I hypothesize that this can be demonstrated by
performing RSA FLC testing with clinical C. albicans clinical strains with known clinical
outcomes.
Hypothesis 4
Due to the increasing incidence of C. glabrata-related candidiasis, it is essential
that the yeast RSA have the capability to perform susceptibility testing with this species. I
hypothesize that yeast RSA conditions can be optimized for C. glabrata testing using
clinical C. glabrata strains with known clinical outcomes.
Hypothesis 5
There is increasing interest in concurrent and sequential antifungal therapy as a
means to obtain synergistic drug effects, decrease drug toxicity, and delay emergence of
antifungal resistance. Unfortunately, published data on in vivo and in vitro antifungal
interactions are sparse. I hypothesize that the mRSA can be modified to facilitate
concurrent and sequential antifungal (AMB, ITC, VRC) combination testing of conidial
inocula of A. fumigatus clinical isolates. These results will be essential in deciding which
antifungal combinations should be tested in an invasive aspergillosis animal model.
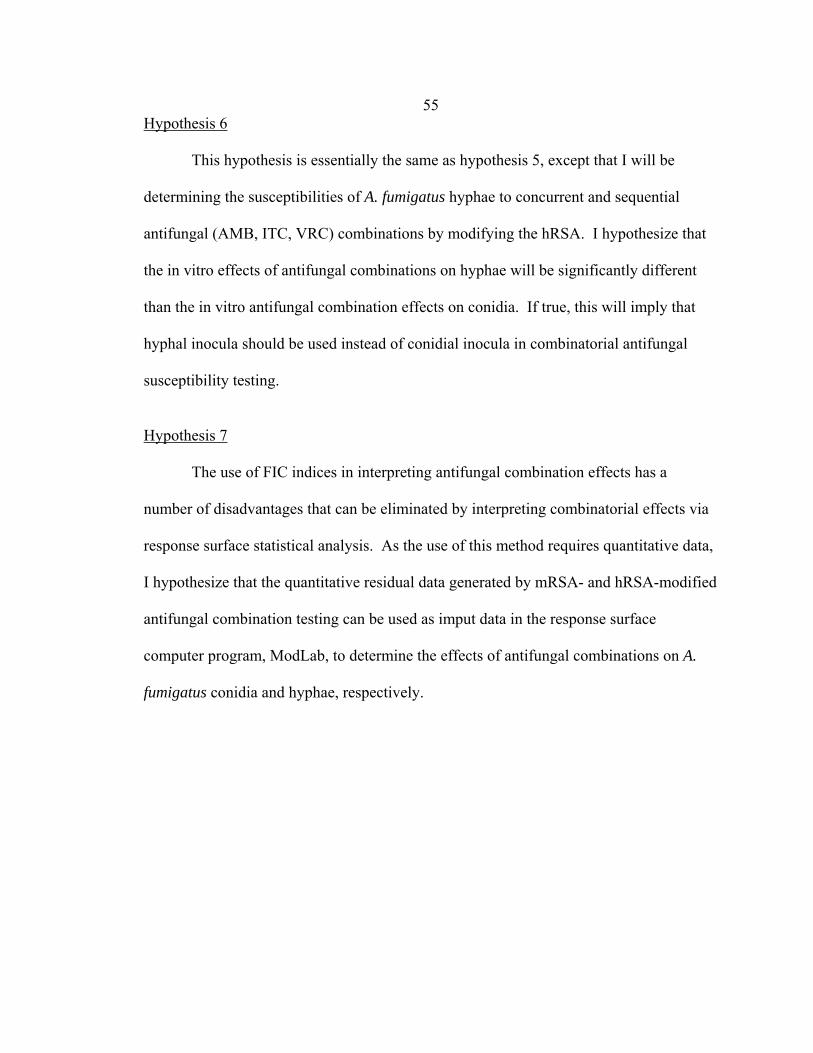
55Hypothesis 6
This hypothesis is essentially the same as hypothesis 5, except that I will be
determining the susceptibilities of A. fumigatus hyphae to concurrent and sequential
antifungal (AMB, ITC, VRC) combinations by modifying the hRSA. I hypothesize that
the in vitro effects of antifungal combinations on hyphae will be significantly different
than the in vitro antifungal combination effects on conidia. If true, this will imply that
hyphal inocula should be used instead of conidial inocula in combinatorial antifungal
susceptibility testing.
Hypothesis 7
The use of FIC indices in interpreting antifungal combination effects has a
number of disadvantages that can be eliminated by interpreting combinatorial effects via
response surface statistical analysis. As the use of this method requires quantitative data,
I hypothesize that the quantitative residual data generated by mRSA- and hRSA-modified
antifungal combination testing can be used as imput data in the response surface
computer program, ModLab, to determine the effects of antifungal combinations on A.
fumigatus conidia and hyphae, respectively.

56
CHAPTER 2
MODIFICATION OF THE YEAST RAPID SUSCEPTIBILITY ASSAY FOR ANTIFUNGAL SUSCEPTIBILITY TESTING OF ASPERGILLUS FUMIGATUS
Introduction
The rapid susceptibility assay (RSA) was previously developed by Riesselman et
al. for antifungal susceptibility testing of yeasts such as Candida albicans (145). The
assay is based on the assumption that when fungi are exposed to an inhibitory
concentration of antifungal drug, their uptake of nutrients, such as glucose, is suppressed.
A minimum inhibitory concentration (MICRSA) value is determined by comparing the
residual glucose levels in the medium following incubation of the fungus with and
without drug. This approach provides objective, quantitative MIC values. The MICRSA
values for yeast compare favorably with the National Committee for Clinical Laboratory
Standards (NCCLS) M27-A antifungal susceptibility assay, but the latter uses a
subjective endpoint of growth inhibition and requires more time (231).
Several compelling reasons favor adapting the RSA for use in mold susceptibility
testing. First, the incidence of morbidity and mortality due to infections caused by
opportunistic filamentous fungi, such as Aspergillus fumigatus, is increasing (232).
Second, emergence of resistance during antifungal therapy has been documented (206,
233). Third, the introduction of voriconazole (90), caspofungin acetate (84), and
liposomal formulations of amphotericin B has increased therapy options. Fourth, current
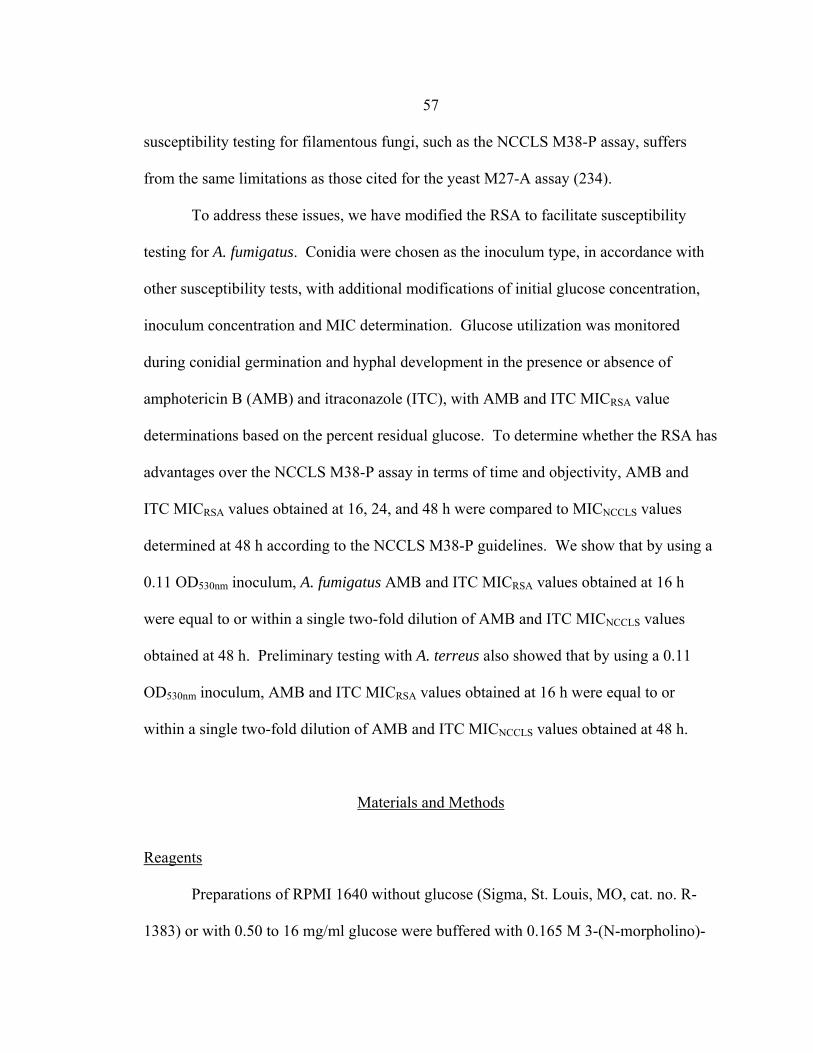
57
susceptibility testing for filamentous fungi, such as the NCCLS M38-P assay, suffers
from the same limitations as those cited for the yeast M27-A assay (234).
To address these issues, we have modified the RSA to facilitate susceptibility
testing for A. fumigatus. Conidia were chosen as the inoculum type, in accordance with
other susceptibility tests, with additional modifications of initial glucose concentration,
inoculum concentration and MIC determination. Glucose utilization was monitored
during conidial germination and hyphal development in the presence or absence of
amphotericin B (AMB) and itraconazole (ITC), with AMB and ITC MICRSA value
determinations based on the percent residual glucose. To determine whether the RSA has
advantages over the NCCLS M38-P assay in terms of time and objectivity, AMB and
ITC MICRSA values obtained at 16, 24, and 48 h were compared to MICNCCLS values
determined at 48 h according to the NCCLS M38-P guidelines. We show that by using a
0.11 OD530nm inoculum, A. fumigatus AMB and ITC MICRSA values obtained at 16 h
were equal to or within a single two-fold dilution of AMB and ITC MICNCCLS values
obtained at 48 h. Preliminary testing with A. terreus also showed that by using a 0.11
OD530nm inoculum, AMB and ITC MICRSA values obtained at 16 h were equal to or
within a single two-fold dilution of AMB and ITC MICNCCLS values obtained at 48 h.
Materials and Methods
Reagents
Preparations of RPMI 1640 without glucose (Sigma, St. Louis, MO, cat. no. R-
1383) or with 0.50 to 16 mg/ml glucose were buffered with 0.165 M 3-(N-morpholino)-

58
propanesulfonic acid (MOPS) (USB, Cleveland, OH, cat. no. 19256) and adjusted to pH
7.0 with 10 N NaOH.
Fungal Strains
A. fumigatus strains NCPF 7102, 7101, 7100, 7098, and 7097 were purchased
from the National Collection of Pathogenic Fungi (Mycology Reference Laboratory,
Bristol). These strains were isolated from aspergillosis patients with known clinical
outcomes. A. terreus 55 and A. fumigatus 46 were clinical strains donated by the
University of Virginia Health System. Species designations of A. fumigatus and A.
terreus strains were confirmed by observations of macroscopic and microscopic
characteristics during growth on Czapek-Dox agar (35). All stocks were maintained in
vials of sterile water at 4º C.
Antifungal Agents and Dilutions
Amphotericin B (AMB) (Sigma A-9528) and itraconazole (ITC) (Research
Diagnostics Inc., Flanders, NJ, cat. no. R51211) were purchased in powdered form.
Stocks of 3200 µg/ml were prepared in dimethyl sulfoxide (DMSO) (Sigma D-2650) and
stored at -20º C for up to 6 months. For both RSA and NCCLS M38-P testing, serial
twofold dilutions were prepared following NCCLS M38-P guidelines (234), except that
the final 2x concentration range of 0.06 to 32 µg/ml AMB and ITC was prepared in 0.4%
glucose RPMI 1640. Both drug-free growth and glucose controls were also prepared,
containing the same ratio of DMSO to 0.4% RPMI 1640 as the 2x drug dilutions.
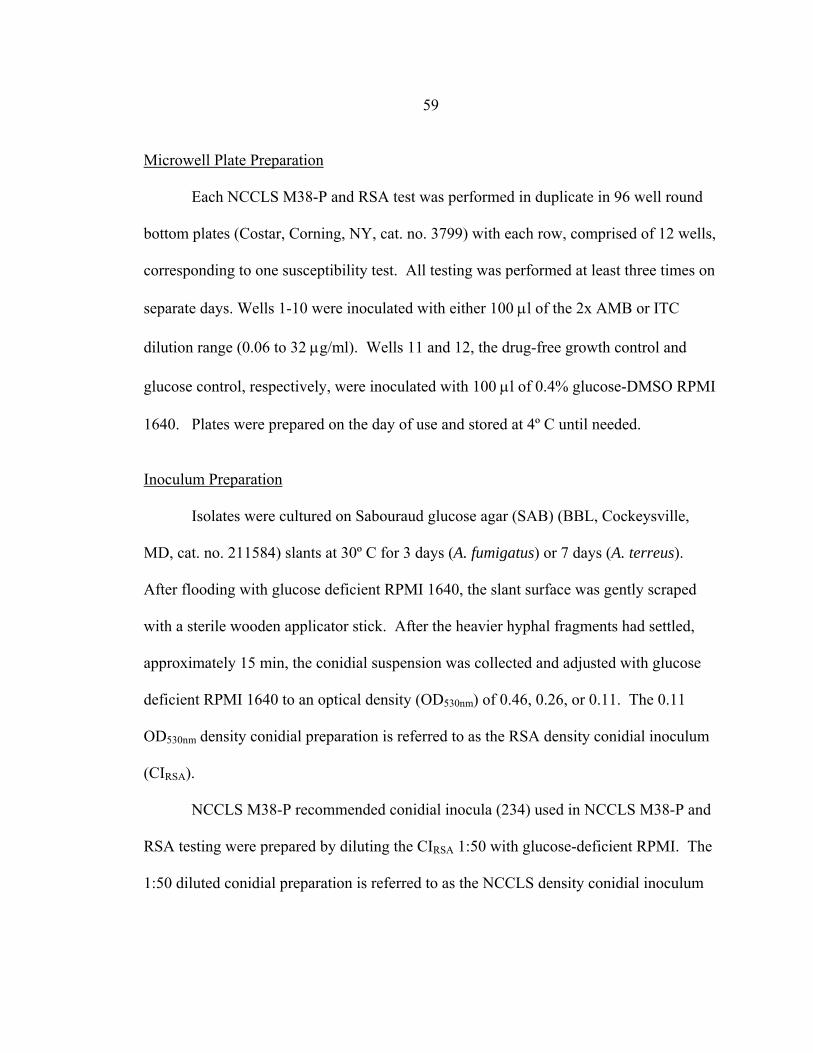
59 Microwell Plate Preparation
Each NCCLS M38-P and RSA test was performed in duplicate in 96 well round
bottom plates (Costar, Corning, NY, cat. no. 3799) with each row, comprised of 12 wells,
corresponding to one susceptibility test. All testing was performed at least three times on
separate days. Wells 1-10 were inoculated with either 100 µl of the 2x AMB or ITC
dilution range (0.06 to 32 µg/ml). Wells 11 and 12, the drug-free growth control and
glucose control, respectively, were inoculated with 100 µl of 0.4% glucose-DMSO RPMI
1640. Plates were prepared on the day of use and stored at 4º C until needed.
Inoculum Preparation
Isolates were cultured on Sabouraud glucose agar (SAB) (BBL, Cockeysville,
MD, cat. no. 211584) slants at 30º C for 3 days (A. fumigatus) or 7 days (A. terreus).
After flooding with glucose deficient RPMI 1640, the slant surface was gently scraped
with a sterile wooden applicator stick. After the heavier hyphal fragments had settled,
approximately 15 min, the conidial suspension was collected and adjusted with glucose
deficient RPMI 1640 to an optical density (OD530nm) of 0.46, 0.26, or 0.11. The 0.11
OD530nm density conidial preparation is referred to as the RSA density conidial inoculum
(CIRSA).
NCCLS M38-P recommended conidial inocula (234) used in NCCLS M38-P and
RSA testing were prepared by diluting the CIRSA 1:50 with glucose-deficient RPMI. The
1:50 diluted conidial preparation is referred to as the NCCLS density conidial inoculum

60
(CINCCLS). All conidial inocula were kept on ice after preparation and used within three
hours.
RSA
The RSA was initiated by inoculating wells 1-11 with 100 µl of CIRSA or CINCCLS,
well 12 with 100 µl glucose deficient RPMI and incubating at 35-37º C. Residual
glucose levels were detected by addition of 50 µl of an enzyme color mix comprised of
0.6 M sodium phosphate buffer (pH 6.0), 360 µg/ml of 4-amino antipyrine (4-AAP)
(Sigma A4382) , 490 µg/ml of N-ethyl-N-sulfopropyl-m-toluidine (TOPS) (Sigma
E8506), 0.68 U/ml horseradish peroxidase (Sigma P8415), and 0.4 U/ml glucose oxidase
(ICN Biochemicals, Aurora, OH, cat. no. 195196) to each well. At 20 min, the color
intensity was measured at OD550nm with a reference reading of OD655nm in a plate reader
(Benchmark Plus, Biorad, Hercules, CA).
RSA Antifungal Susceptibility Curves and MIC Endpoint Determination
The percent residual glucose of each test well was calculated by comparing the
OD550nm value of the test well with the OD550nm of the glucose control well based on the
following equation: (OD550nm of test well / OD550nm of glucose control well) X 100. The
percent inhibition of glucose utilization due to AMB or ITC was determined by the
following equation: 1- [(100% - % residual glucose in well containing antifungal drug) /
(100% - % residual glucose of growth control)] X 100. Antifungal susceptibility curves
were generated for each RSA by plotting the percent residual glucose values (y-axis)
against the appropriate AMB or ITC concentrations (x-axis). The resulting detection
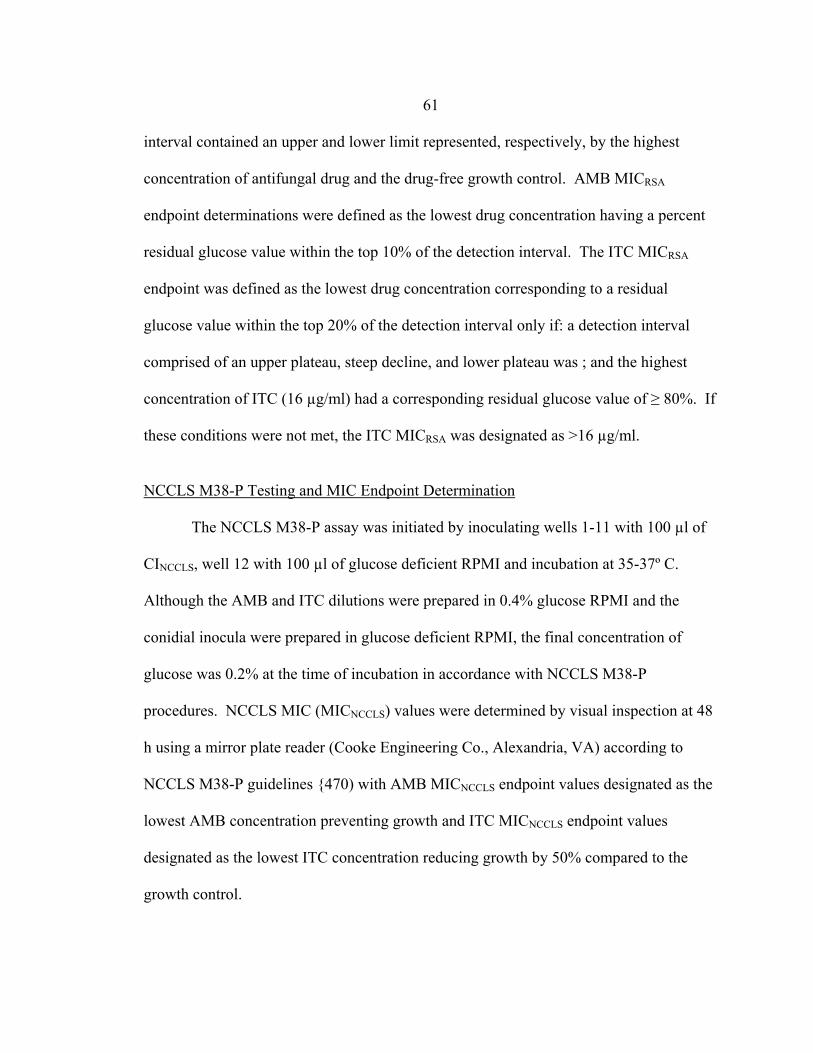
61 interval contained an upper and lower limit represented, respectively, by the highest
concentration of antifungal drug and the drug-free growth control. AMB MICRSA
endpoint determinations were defined as the lowest drug concentration having a percent
residual glucose value within the top 10% of the detection interval. The ITC MICRSA
endpoint was defined as the lowest drug concentration corresponding to a residual
glucose value within the top 20% of the detection interval only if: a detection interval
comprised of an upper plateau, steep decline, and lower plateau was ; and the highest
concentration of ITC (16 µg/ml) had a corresponding residual glucose value of ≥ 80%. If
these conditions were not met, the ITC MICRSA was designated as >16 µg/ml.
NCCLS M38-P Testing and MIC Endpoint Determination
The NCCLS M38-P assay was initiated by inoculating wells 1-11 with 100 µl of
CINCCLS, well 12 with 100 µl of glucose deficient RPMI and incubation at 35-37º C.
Although the AMB and ITC dilutions were prepared in 0.4% glucose RPMI and the
conidial inocula were prepared in glucose deficient RPMI, the final concentration of
glucose was 0.2% at the time of incubation in accordance with NCCLS M38-P
procedures. NCCLS MIC (MICNCCLS) values were determined by visual inspection at 48
h using a mirror plate reader (Cooke Engineering Co., Alexandria, VA) according to
NCCLS M38-P guidelines {470) with AMB MICNCCLS endpoint values designated as the
lowest AMB concentration preventing growth and ITC MICNCCLS endpoint values
designated as the lowest ITC concentration reducing growth by 50% compared to the
growth control.

62 Statistics
Analysis of variance was used for comparison of residual glucose values
determined after conidial inocula incubations with 16 µg/ml AMB or ITC for 24 h. A P
value <0.05 was considered significant.
Results
Optimal Glucose Utilization Conditions
The incubation temperature, initial glucose concentration, and plate shaking
conditions facilitating optimal glucose utilization were determined by monitoring the
glucose utilization of 0.11, 0.26, and 0.46 0.11 OD530nm conidial inocula of A. fumigatus
strain 46 during a 12 h incubation. Figures 9, 10, and 11 show the effect of incubation
temperature on the glucose utilization of each conidial inoculum concentration.
Incubation at room temperature did not result in detectable glucose utilization during the
12 h, while incubation at 30º C and 35º C resulted in detectable glucose utilization after 3
h. The greatest glucose utilization was observed during the 12 h, 35º C incubation,
regardless of conidial inoculum concentration.
The glucose concentration facilitating the greatest percentage of glucose
consumption by a conidial inoculum in the shortest period of time was considered
optimal. A 0.26 OD530nm conidial inoculum of A. fumigatus strain 46 was incubated for 8
h at 35º C in the presence of 8, 4, 2, 1, 0.5, or 0.25 mg/ml glucose. The greatest
percentage of glucose utilization was observed in the presence of 1 mg/ml
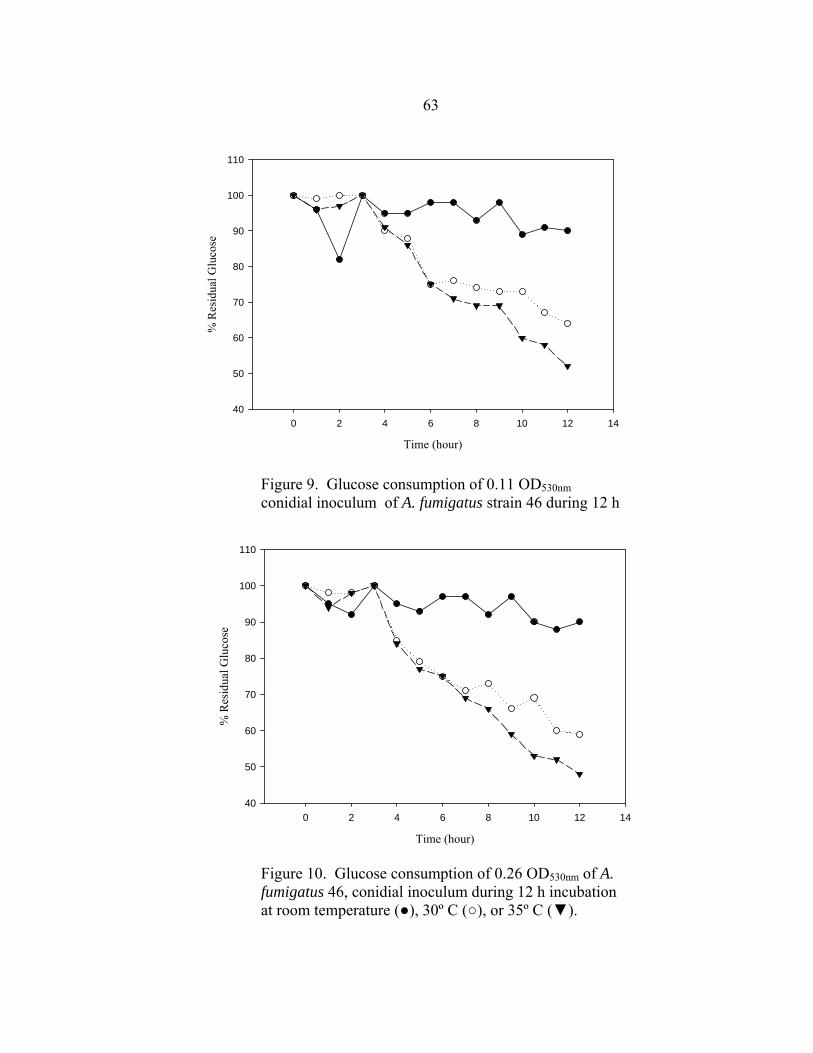
63
Time (hour)
0 2 4 6 8 10 12 14
% R
esid
ual G
luco
se
40
50
60
70
80
90
100
110
Figure 9. Glucose consumption of 0.11 OD530nm conidial inoculum of A. fumigatus strain 46 during 12 h incubation at room temperature (●), 30º C (○), or 35º C (▼).
Time (hour)
0 2 4 6 8 10 12 14
% R
esid
ual G
luco
se
40
50
60
70
80
90
100
110
Figure 10. Glucose consumption of 0.26 OD530nm of A. fumigatus 46, conidial inoculum during 12 h incubation at room temperature (●), 30º C (○), or 35º C (▼).

64
Figure 11. Glucose consumption of 0.46 OD530nm of A. fumigatus 46, conidial inoculum during 12 h incubation at room temperature (●), 30º C (○), or 35º C (▼).
Time (hour)
0 2 4 6 8 10 12 14
% R
esid
ual G
luco
se
40
50
60
70
80
90
100
110
Time (hour)
0 2 4 6 8 10
% R
esid
ual G
luco
se
65
70
75
80
85
90
95
100
105
Figure 12. Glucose utilization of 0.26 OD530nm conidial inocula of A. fumigatus 46 during 8 h incubation at 35º C in the presence of 8 (●), 4 (○), 2 (▼), 1 ( ), 0.5 (■), or 0.25 mg/ml ( ) glucose.
65 glucose, followed closely by 2 mg/ml glucose (Figure 12).
The influence of shaking on conidial glucose consumption was determined by
comparing the glucose utilization of 0.11 or 0.26 OD530nm conidial inocula of A.
fumigatus strain 46 in the presence and absence of shaking (150 rpm), during a 24 h, 35º
C incubation (Figure 13 and 14). Shaking significantly increased the glucose
consumption of both 0.11 and 0.26 OD530nm conidial inocula between 12 and 24 h (P <
0.05).
Conidial Growth and Glucose Utilization
To determine the relationship of conidial development to glucose utilization in the
absence of antifungal agents, CIRSA were prepared from A. fumigatus NCPF strains 7102,
Time (hour)
0 5 10 15 20 25 30
% R
esid
ual G
luco
se
0
20
40
60
80
100
120
*
Figure 13. Glucose utilization of 0.11 OD530nm conidial inoculum of A. fumigatus strain 46 in the presence (●) or absence (○) of shaking at 150 rpm. Asterisk indicates a significant difference (P<0.05) between % residual glucose values in the presence and absence of shaking at that time period.
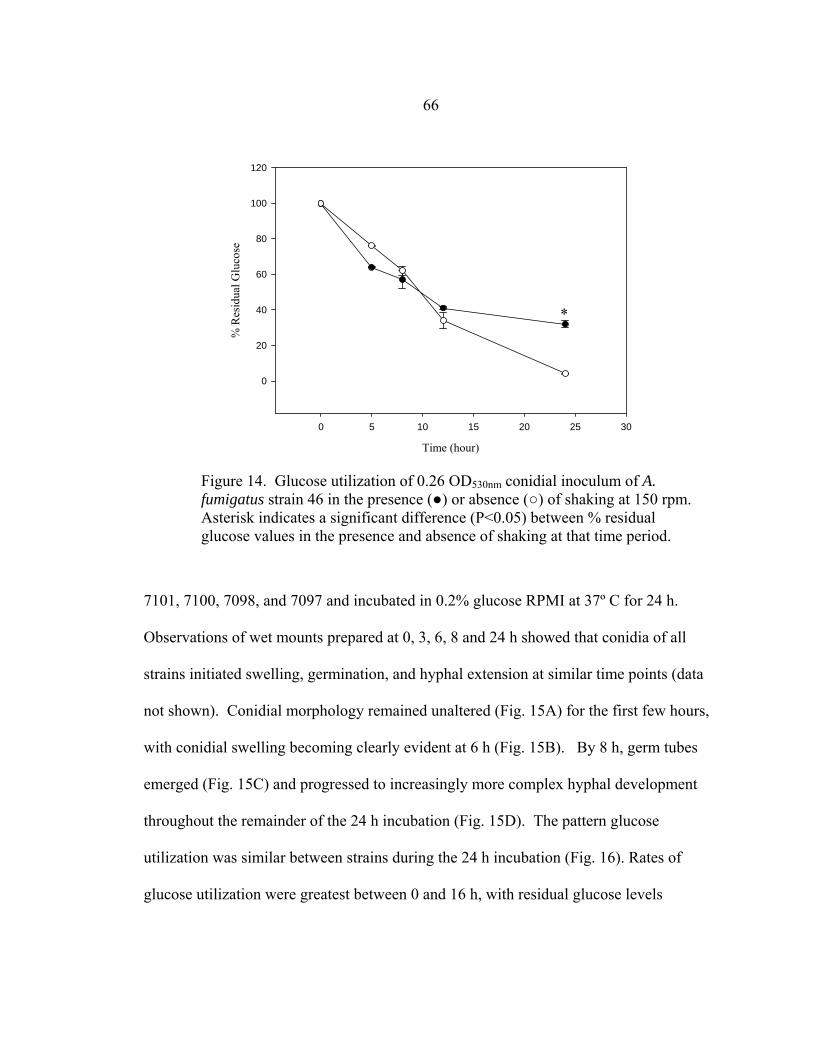
66
7101, 7100, 7098, and 7097 and incubated in 0.2% glucose RPMI at 37º C for 24 h.
Observations of wet mounts prepared at 0, 3, 6, 8 and 24 h showed that conidia of all
strains initiated swelling, germination, and hyphal extension at similar time points (data
not shown). Conidial morphology remained unaltered (Fig. 15A) for the first few hours,
with conidial swelling becoming clearly evident at 6 h (Fig. 15B). By 8 h, germ tubes
emerged (Fig. 15C) and progressed to increasingly more complex hyphal development
throughout the remainder of the 24 h incubation (Fig. 15D). The pattern glucose
utilization was similar between strains during the 24 h incubation (Fig. 16). Rates of
glucose utilization were greatest between 0 and 16 h, with residual glucose levels
Time (hour)
0 5 10 15 20 25 30
% R
esid
ual G
luco
se
0
20
40
60
80
100
120
*
Figure 14. Glucose utilization of 0.26 OD530nm conidial inoculum of A. fumigatus strain 46 in the presence (●) or absence (○) of shaking at 150 rpm. Asterisk indicates a significant difference (P<0.05) between % residual glucose values in the presence and absence of shaking at that time period.
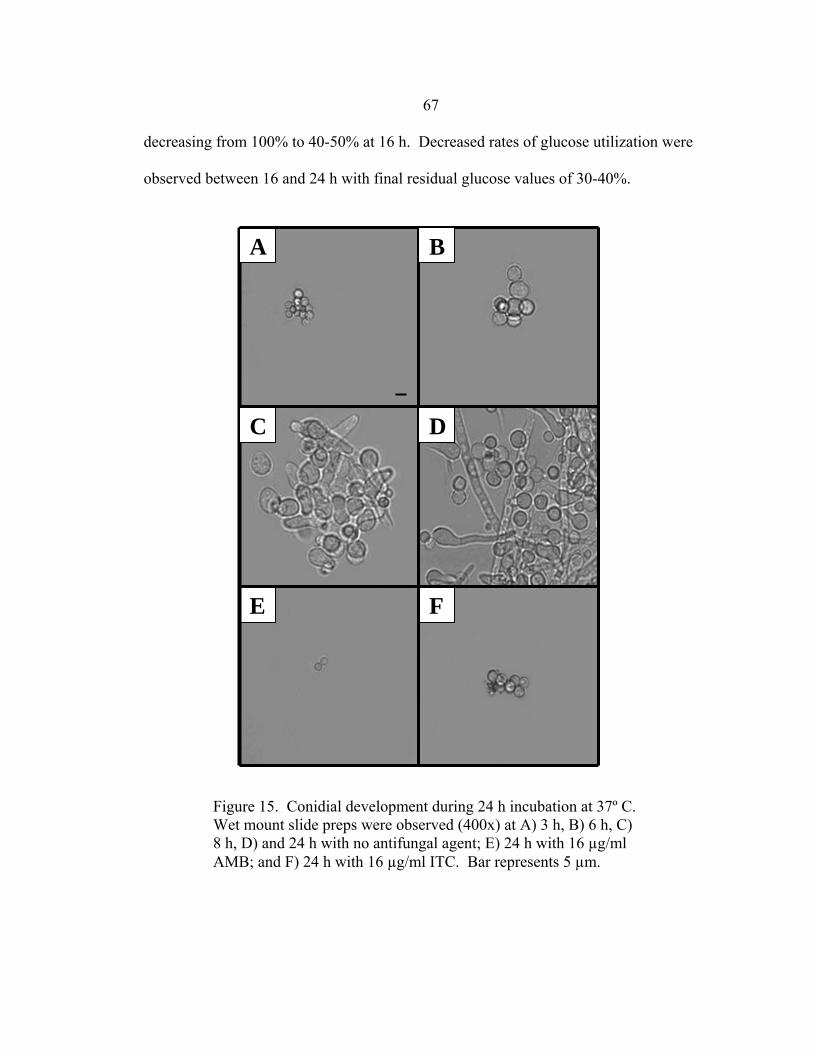
67 decreasing from 100% to 40-50% at 16 h. Decreased rates of glucose utilization were
observed between 16 and 24 h with final residual glucose values of 30-40%.
Figure 15. Conidial development during 24 h incubation at 37º C. Wet mount slide preps were observed (400x) at A) 3 h, B) 6 h, C) 8 h, D) and 24 h with no antifungal agent; E) 24 h with 16 µg/ml AMB; and F) 24 h with 16 µg/ml ITC. Bar represents 5 µm.
E F
A
D
B
C
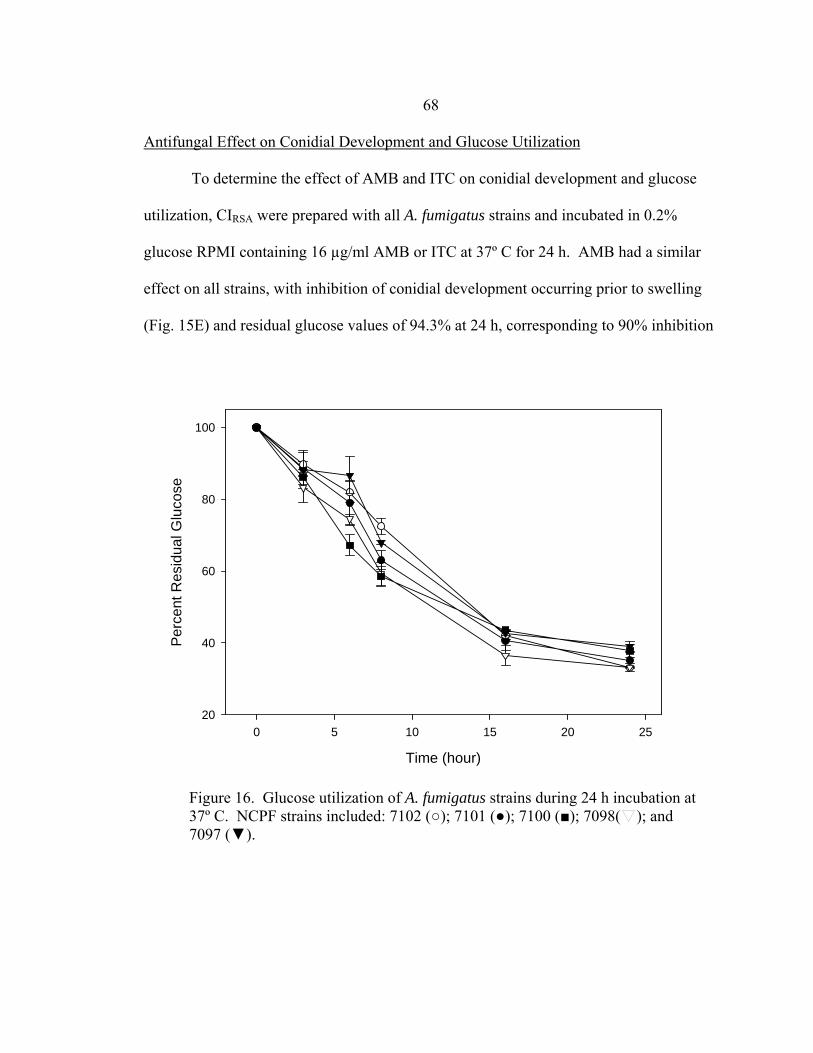
68 Antifungal Effect on Conidial Development and Glucose Utilization
To determine the effect of AMB and ITC on conidial development and glucose
utilization, CIRSA were prepared with all A. fumigatus strains and incubated in 0.2%
glucose RPMI containing 16 µg/ml AMB or ITC at 37º C for 24 h. AMB had a similar
effect on all strains, with inhibition of conidial development occurring prior to swelling
(Fig. 15E) and residual glucose values of 94.3% at 24 h, corresponding to 90% inhibition
Time (hour)
0 5 10 15 20 25
Perc
ent R
esid
ual G
luco
se
20
40
60
80
100
Figure 16. Glucose utilization of A. fumigatus strains during 24 h incubation at 37º C. NCPF strains included: 7102 (○); 7101 (●); 7100 (■); 7098( ); and 7097 (▼).
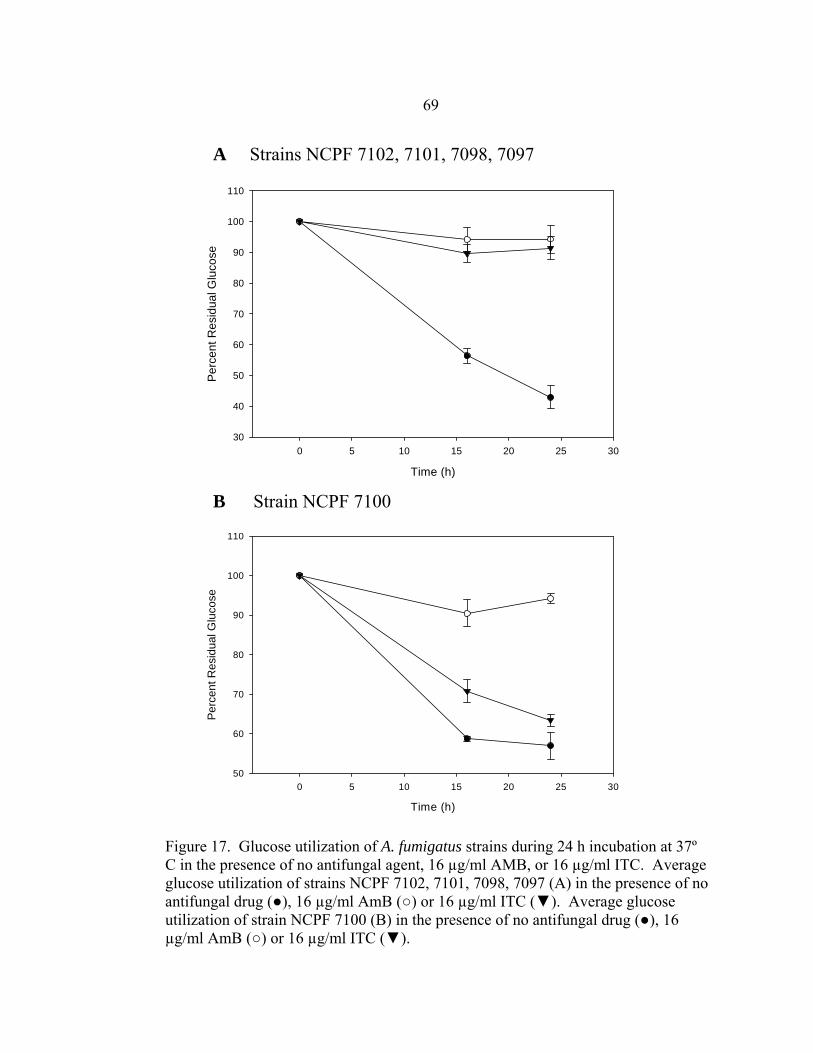
69
Figure 17. Glucose utilization of A. fumigatus strains during 24 h incubation at 37º C in the presence of no antifungal agent, 16 µg/ml AMB, or 16 µg/ml ITC. Average glucose utilization of strains NCPF 7102, 7101, 7098, 7097 (A) in the presence of no antifungal drug (●), 16 µg/ml AmB (○) or 16 µg/ml ITC (▼). Average glucose utilization of strain NCPF 7100 (B) in the presence of no antifungal drug (●), 16 µg/ml AmB (○) or 16 µg/ml ITC (▼).
Time (h)
0 5 10 15 20 25 30
Perc
ent R
esid
ual G
luco
se
50
60
70
80
90
100
110
B Strain NCPF 7100
Time (h)
0 5 10 15 20 25 30
Per
cent
Res
idua
l Glu
cose
30
40
50
60
70
80
90
100
110
A Strains NCPF 7102, 7101, 7098, 7097
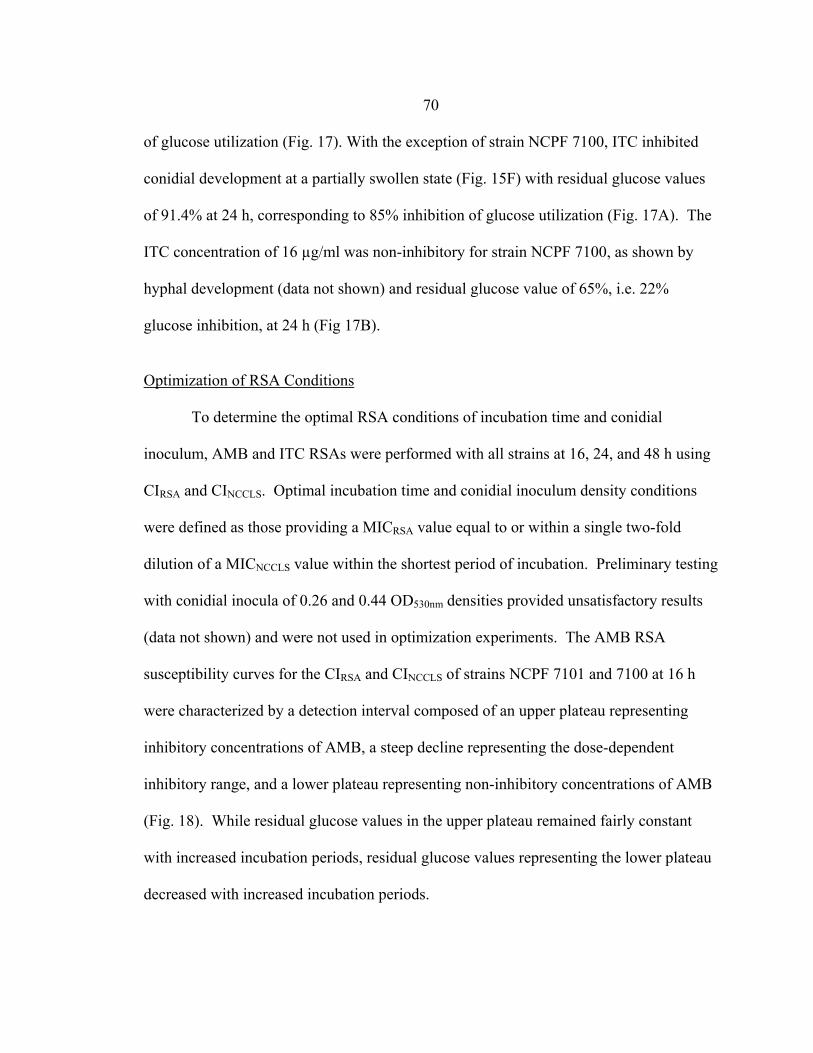
70 of glucose utilization (Fig. 17). With the exception of strain NCPF 7100, ITC inhibited
conidial development at a partially swollen state (Fig. 15F) with residual glucose values
of 91.4% at 24 h, corresponding to 85% inhibition of glucose utilization (Fig. 17A). The
ITC concentration of 16 µg/ml was non-inhibitory for strain NCPF 7100, as shown by
hyphal development (data not shown) and residual glucose value of 65%, i.e. 22%
glucose inhibition, at 24 h (Fig 17B).
Optimization of RSA Conditions
To determine the optimal RSA conditions of incubation time and conidial
inoculum, AMB and ITC RSAs were performed with all strains at 16, 24, and 48 h using
CIRSA and CINCCLS. Optimal incubation time and conidial inoculum density conditions
were defined as those providing a MICRSA value equal to or within a single two-fold
dilution of a MICNCCLS value within the shortest period of incubation. Preliminary testing
with conidial inocula of 0.26 and 0.44 OD530nm densities provided unsatisfactory results
(data not shown) and were not used in optimization experiments. The AMB RSA
susceptibility curves for the CIRSA and CINCCLS of strains NCPF 7101 and 7100 at 16 h
were characterized by a detection interval composed of an upper plateau representing
inhibitory concentrations of AMB, a steep decline representing the dose-dependent
inhibitory range, and a lower plateau representing non-inhibitory concentrations of AMB
(Fig. 18). While residual glucose values in the upper plateau remained fairly constant
with increased incubation periods, residual glucose values representing the lower plateau
decreased with increased incubation periods.
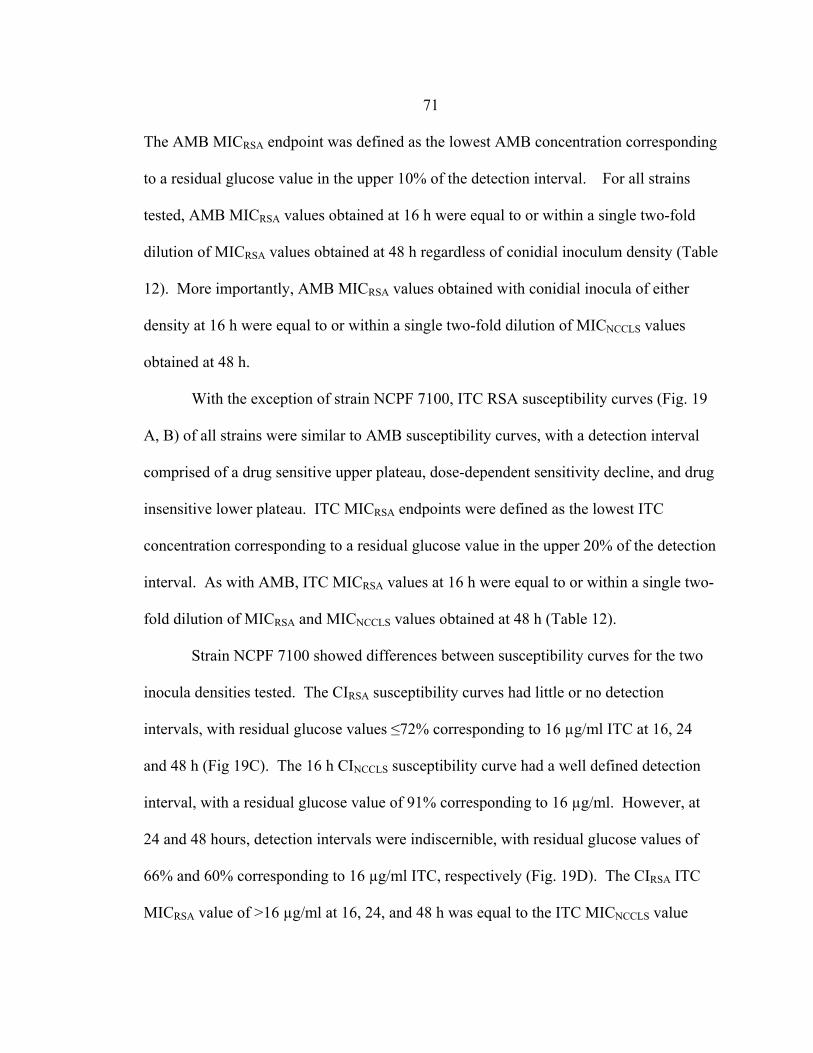
71
The AMB MICRSA endpoint was defined as the lowest AMB concentration corresponding
to a residual glucose value in the upper 10% of the detection interval. For all strains
tested, AMB MICRSA values obtained at 16 h were equal to or within a single two-fold
dilution of MICRSA values obtained at 48 h regardless of conidial inoculum density (Table
12). More importantly, AMB MICRSA values obtained with conidial inocula of either
density at 16 h were equal to or within a single two-fold dilution of MICNCCLS values
obtained at 48 h.
With the exception of strain NCPF 7100, ITC RSA susceptibility curves (Fig. 19
A, B) of all strains were similar to AMB susceptibility curves, with a detection interval
comprised of a drug sensitive upper plateau, dose-dependent sensitivity decline, and drug
insensitive lower plateau. ITC MICRSA endpoints were defined as the lowest ITC
concentration corresponding to a residual glucose value in the upper 20% of the detection
interval. As with AMB, ITC MICRSA values at 16 h were equal to or within a single two-
fold dilution of MICRSA and MICNCCLS values obtained at 48 h (Table 12).
Strain NCPF 7100 showed differences between susceptibility curves for the two
inocula densities tested. The CIRSA susceptibility curves had little or no detection
intervals, with residual glucose values ≤72% corresponding to 16 µg/ml ITC at 16, 24
and 48 h (Fig 19C). The 16 h CINCCLS susceptibility curve had a well defined detection
interval, with a residual glucose value of 91% corresponding to 16 µg/ml. However, at
24 and 48 hours, detection intervals were indiscernible, with residual glucose values of
66% and 60% corresponding to 16 µg/ml ITC, respectively (Fig. 19D). The CIRSA ITC
MICRSA value of >16 µg/ml at 16, 24, and 48 h was equal to the ITC MICNCCLS value
72
Figure 18. RSA AMB susceptibility curves for strains 7101 and 7100 at 16 (●), 24 (○), and 48 (▼) h in the presence of 0.03-16 µg/ml AMB. CIRSA results are shown in A and C, while CINCCLS results are shown in B and D. MIC values in each curve are designated with a box. These data represent one experiment. This experiment was performed three times, resulting in similar curves with MIC points equal to or within a single two-fold dilution of the MIC points shown. A. fumigatus strains NCPF 7102, 7098, and 7097 gave similar results to NCPF 7101 and 7100.
AMB Concentration (ug/ml)
16 8 4 2 1 0.5 0.25 0.125 0.06 0.03 0
Per
cent
Res
idua
l Glu
cose
20
40
60
80
100
A
AMB Concentration (ug/ml)
16 8 4 2 1 0.5 0.25 0.125 0.06 0.03 0
Perc
ent R
esid
ual G
luco
se
20
40
60
80
100
BNCPF 7101 NCPF 7101
AMB Concentration (ug/ml)
16 8 4 2 1 0.5 0.25 0.125 0.06 0.03 0
Perc
ent R
esid
ual G
luco
se
20
40
60
80
100
AMB Concentration (ug/ml)
16 8 4 2 1 0.5 0.25 0.125 0.06 0.03 0
Per
cent
Res
idua
l Glu
cose
20
40
60
80
100
NCPF 7100 NCPF 7100 DC

73
Figure 19. RSA ITC susceptibility curves for strains 7101 and 7100 at 16 (●), 24 (○), and 48 (▼) h in the presence of 0.03-16 µg/ml ITC. CIRSA results are shown in A and C, while CINCCLS results are shown in B and D. MIC values in each curve are designated with a box if value is ≤ 16 µg/ml. These data represent one experiment. This experiment was performed three times, resulting in similar curves with MIC points equal to or within a single two-fold dilution of the MIC points shown (except CINCCLS of 7100 at 24 h). A. fumigatus strains NCPF 7102, 7098, and 7097 had similar results to NCPF 7101.
ITC Concentration (ug/ml)
16 8 4 2 1 0.5 0.25 0.125 0.06 0.03 0
Perc
ent R
esid
ual G
luco
se
20
40
60
80
100
ITC Concentration (ug/ml)
16 8 4 2 1 0.5 0.25 0.125 0.06 0.03 0
Perc
ent R
esid
ual G
luco
se
20
40
60
80
100
DC NCPF 7100
ITC Concentration (ug/ml)
16 8 4 2 1 0.5 0.25 0.125 0.06 0.03 0
Perc
ent R
esid
ual G
luco
se
20
40
60
80
100
B
ITC Concentration (ug/ml)
16 8 4 2 1 0.5 0.25 0.125 0.06 0.03 0
Perc
ent R
esid
ual G
luco
se
20
40
60
80
100
A NCPF 7101 NCPF 7101
NCPF 7100
74 determined at 48 h (Table 12). The CINCCLS ITC MICRSA value was 1 µg/ml at 16 h but
increased to >16 µg/ml by 24 h.
A. terreus RSA Testing
Preliminary AMB and ITC RSA testing was performed with CIRSA and CINCCLS of
A. terreus strain 55 at 16, 24, and 48 h. Use of a CIRSA provided AMB and ITC MICRSA
values at 16 h equal to or within a single two-fold dilution of AMB and ITC MICNCCLS
Table 12. RSA (CIRSA and CINCCLS) and NCCLS M38-P MIC values at 16, 24, and 48 ha.
Aspergillus spp.
NCPF number
Incubation period (h)
AMB MIC (µg/ml)
RSA NCCLS
CIRSA CINCCLS CINCCLS
ITC MIC (µg/ml)
RSA NCCLS
CIRSA CINCCLS CINCCLS
0.5 1 1
0.25 0.5 0.5
0.5 0.5 0.5
0.5 0.5 0.5
0.25 0.5 0.5
≤0.03
0.5 1
7100
7098
7097
7102
7101
A. fumigatus A. terreus
16 24 48
16 24 48
16 24 48
16 24 48
16 24 48
16 24 48
1 1 2
0.5 0.5 1
0.5 0.5 1
0.5 0.5 1
0.5 0.5 1
0.5 1 4
1
0.5
0.5
0.5
0.5
1
>16 >16 >16
0.5 1 1
0.5 0.5 0.5
0.5
0.25 0.5
1 1 1
0.25 0.25 0.25
1 >16b
>16
0.5 0.5 0.5
0.5 0.5
0.25
0.25 0.5 0.5
0.25 0.5 0.5
≤0.03 0.125 0.25
>16
0.5
0.25
0.25
0.5
0.25
a These data represent a single experiment. The experiment was repeated two additional times with MIC values equal to or within a single two-fold dilution of results shown. b variable MIC results (1-16 µg/ml)
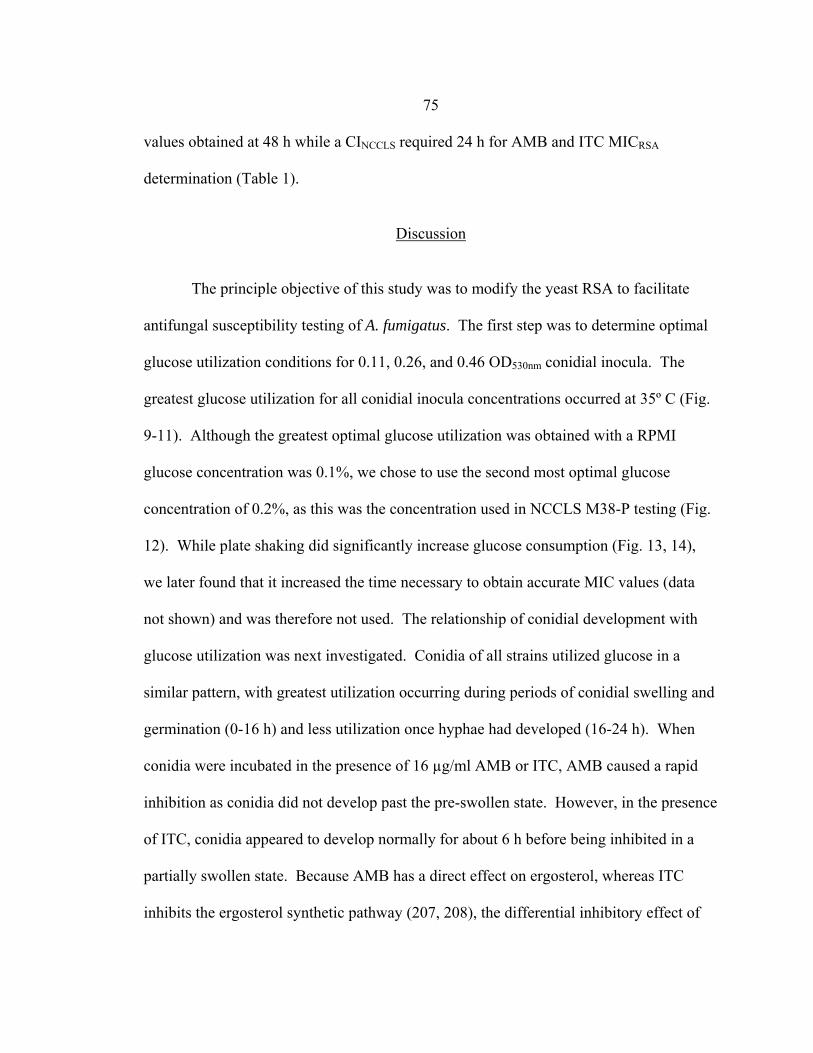
75 values obtained at 48 h while a CINCCLS required 24 h for AMB and ITC MICRSA
determination (Table 1).
Discussion
The principle objective of this study was to modify the yeast RSA to facilitate
antifungal susceptibility testing of A. fumigatus. The first step was to determine optimal
glucose utilization conditions for 0.11, 0.26, and 0.46 OD530nm conidial inocula. The
greatest glucose utilization for all conidial inocula concentrations occurred at 35º C (Fig.
9-11). Although the greatest optimal glucose utilization was obtained with a RPMI
glucose concentration was 0.1%, we chose to use the second most optimal glucose
concentration of 0.2%, as this was the concentration used in NCCLS M38-P testing (Fig.
12). While plate shaking did significantly increase glucose consumption (Fig. 13, 14),
we later found that it increased the time necessary to obtain accurate MIC values (data
not shown) and was therefore not used. The relationship of conidial development with
glucose utilization was next investigated. Conidia of all strains utilized glucose in a
similar pattern, with greatest utilization occurring during periods of conidial swelling and
germination (0-16 h) and less utilization once hyphae had developed (16-24 h). When
conidia were incubated in the presence of 16 µg/ml AMB or ITC, AMB caused a rapid
inhibition as conidia did not develop past the pre-swollen state. However, in the presence
of ITC, conidia appeared to develop normally for about 6 h before being inhibited in a
partially swollen state. Because AMB has a direct effect on ergosterol, whereas ITC
inhibits the ergosterol synthetic pathway (207, 208), the differential inhibitory effect of

76
the two drugs was not unexpected. This difference was also consistent with inhibition of
conidial glucose utilization in the presence of 16 µg/ml of either drug. AMB inhibited
90% of the glucose utilization (94.3% residual glucose) over a 24 h incubation period
while ITC inhibited 85% of the glucose utilization (91.4% residual glucose). As these
residual glucose values were marginally, but not significantly different (P >0.5), we
concluded that ITC inhibited conidial development only a short period after AMB. Since
these data suggested that inhibition of growth, the criterion used in NCCLS M38-P
testing, could be correlated with inhibition of glucose utilization, we concluded that
glucose utilization could be used as an indicator of conidial susceptibility to AMB and
ITC.
Yeast RSA testing parameters requiring modification for the mold RSA were
inoculum concentration, incubation time, and MIC endpoint determination. Optimization
of these conditions was determined by analyzing AMB and ITC susceptibility curves
generated from RSA experiments performed at 16, 24, and 48 h using conidial inocula of
varying density. Optimal conditions produced susceptibility curves composed of a
clearly defined upper plateau (inhibitory doses of drug), a steep decline (dose-dependent
inhibition), and a lower plateau (non-inhibitory doses), with few or no residual values
located in the dose-dependent decline. Preliminary mold RSA experiments with conidial
inocula of 0.11, 0.26, and 0.42 OD530nm densities showed that as conidial inocula density
increased from 0.11 to 0.26 and 0.42 OD530nm, the appearance of the susceptibility curves
became less defined, with a dose-dependent decline of decreased slope containing
increasing numbers of values (data not shown). These data showed that if the conidial
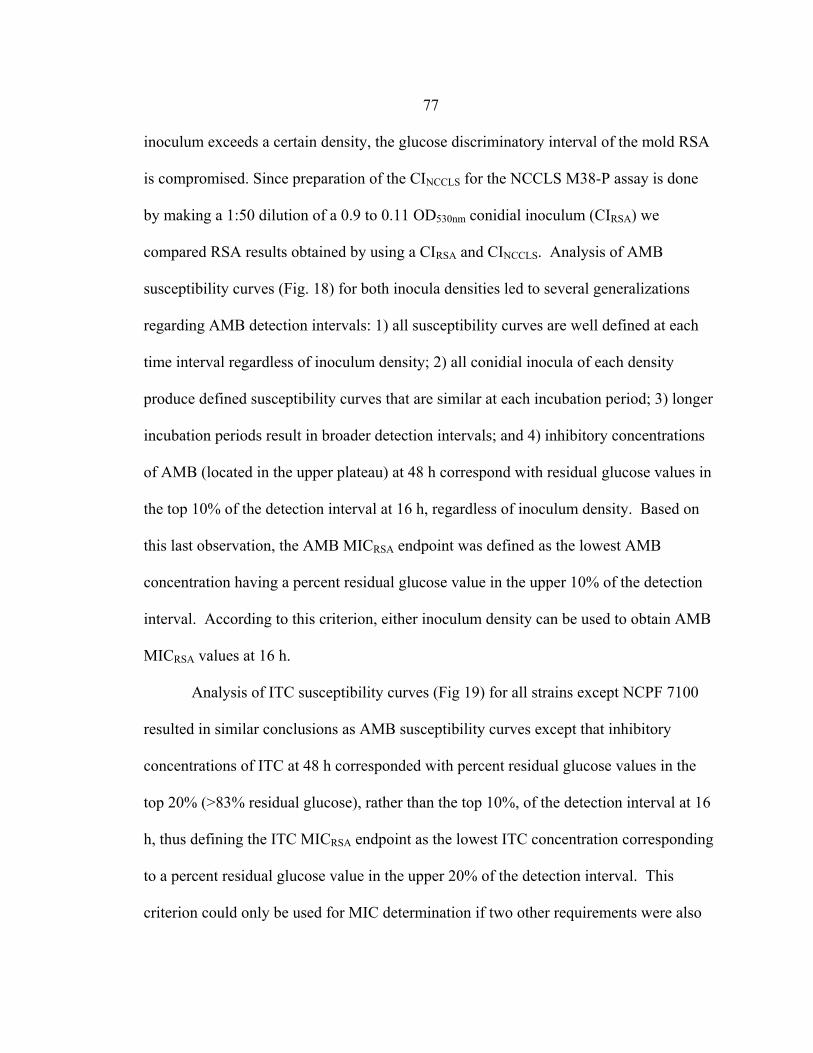
77
inoculum exceeds a certain density, the glucose discriminatory interval of the mold RSA
is compromised. Since preparation of the CINCCLS for the NCCLS M38-P assay is done
by making a 1:50 dilution of a 0.9 to 0.11 OD530nm conidial inoculum (CIRSA) we
compared RSA results obtained by using a CIRSA and CINCCLS. Analysis of AMB
susceptibility curves (Fig. 18) for both inocula densities led to several generalizations
regarding AMB detection intervals: 1) all susceptibility curves are well defined at each
time interval regardless of inoculum density; 2) all conidial inocula of each density
produce defined susceptibility curves that are similar at each incubation period; 3) longer
incubation periods result in broader detection intervals; and 4) inhibitory concentrations
of AMB (located in the upper plateau) at 48 h correspond with residual glucose values in
the top 10% of the detection interval at 16 h, regardless of inoculum density. Based on
this last observation, the AMB MICRSA endpoint was defined as the lowest AMB
concentration having a percent residual glucose value in the upper 10% of the detection
interval. According to this criterion, either inoculum density can be used to obtain AMB
MICRSA values at 16 h.
Analysis of ITC susceptibility curves (Fig 19) for all strains except NCPF 7100
resulted in similar conclusions as AMB susceptibility curves except that inhibitory
concentrations of ITC at 48 h corresponded with percent residual glucose values in the
top 20% (>83% residual glucose), rather than the top 10%, of the detection interval at 16
h, thus defining the ITC MICRSA endpoint as the lowest ITC concentration corresponding
to a percent residual glucose value in the upper 20% of the detection interval. This
criterion could only be used for MIC determination if two other requirements were also
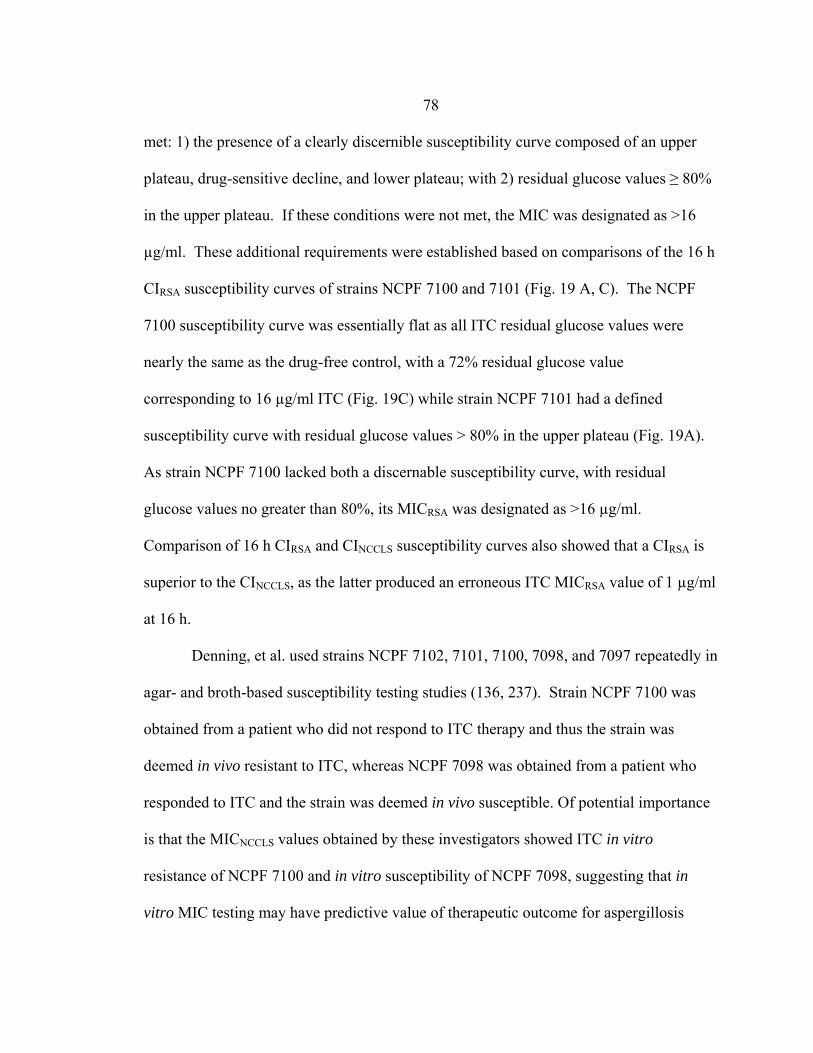
78
met: 1) the presence of a clearly discernible susceptibility curve composed of an upper
plateau, drug-sensitive decline, and lower plateau; with 2) residual glucose values ≥ 80%
in the upper plateau. If these conditions were not met, the MIC was designated as >16
µg/ml. These additional requirements were established based on comparisons of the 16 h
CIRSA susceptibility curves of strains NCPF 7100 and 7101 (Fig. 19 A, C). The NCPF
7100 susceptibility curve was essentially flat as all ITC residual glucose values were
nearly the same as the drug-free control, with a 72% residual glucose value
corresponding to 16 µg/ml ITC (Fig. 19C) while strain NCPF 7101 had a defined
susceptibility curve with residual glucose values > 80% in the upper plateau (Fig. 19A).
As strain NCPF 7100 lacked both a discernable susceptibility curve, with residual
glucose values no greater than 80%, its MICRSA was designated as >16 µg/ml.
Comparison of 16 h CIRSA and CINCCLS susceptibility curves also showed that a CIRSA is
superior to the CINCCLS, as the latter produced an erroneous ITC MICRSA value of 1 µg/ml
at 16 h.
Denning, et al. used strains NCPF 7102, 7101, 7100, 7098, and 7097 repeatedly in
agar- and broth-based susceptibility testing studies (136, 237). Strain NCPF 7100 was
obtained from a patient who did not respond to ITC therapy and thus the strain was
deemed in vivo resistant to ITC, whereas NCPF 7098 was obtained from a patient who
responded to ITC and the strain was deemed in vivo susceptible. Of potential importance
is that the MICNCCLS values obtained by these investigators showed ITC in vitro
resistance of NCPF 7100 and in vitro susceptibility of NCPF 7098, suggesting that in
vitro MIC testing may have predictive value of therapeutic outcome for aspergillosis

79
patients treated with ITC. Using similar reasoning to that used for ITC, Denning used the
results of susceptibility testing with strains NCPF 7101 and 7097, isolates from
aspergillosis patients with failed therapy, to conclude that in vivo resistance to AMB does
not correlate with in vitro MICNCCLS results. ITC and AMB MICRSA values obtained in
our studies have led to similar conclusions. The CIRSA ITC MICRSA value of >16 µg/ml
for strain NCPF 7100 at 16 h correlates with the clinical history of in vivo ITC resistance.
We also showed that in vivo resistance to AMB did not correlate with in vitro resistance
as CIRSA preparations of strains NCPF 7102 and 7097 had AMB MICRSA values of 0.5
and 1 µg/ml at 16 h, respectively, indicating in vitro drug susceptibility.
Results of studies with strains NCPF 7102 and 7097 in experimental animals
suggest why this discrepancy between in vivo resistance and in vitro susceptibility may
exist (136, 237). Strain NCPF 7102, originally designated as in vivo resistant, showed in
vivo susceptibility in experimental animals, suggesting that host factors may be important
in predicting therapeutic outcome. However, strain NCPF 7097 showed in vivo
resistance in experimental animals, suggesting that current susceptibility testing,
including the mold RSA, is thus far unable to detect AMB resistance. Clearly, further
work needs to be done to obtain AMB MIC values that are predictive of patient outcome.
Preliminary testing was performed with A. terreus to assess whether the RSA
could be used with medically significant species other than A. fumigatus. As with A.
fumigatus, only a CIRSA provided AMB and ITC MICRSA values at 16 h equal to or within
a single two-fold dilution of AMB and ITC MICNCCLS values. While the ITC MICRSA
remained unchanged between 16 and 24 h incubation, it was interesting that the AMB
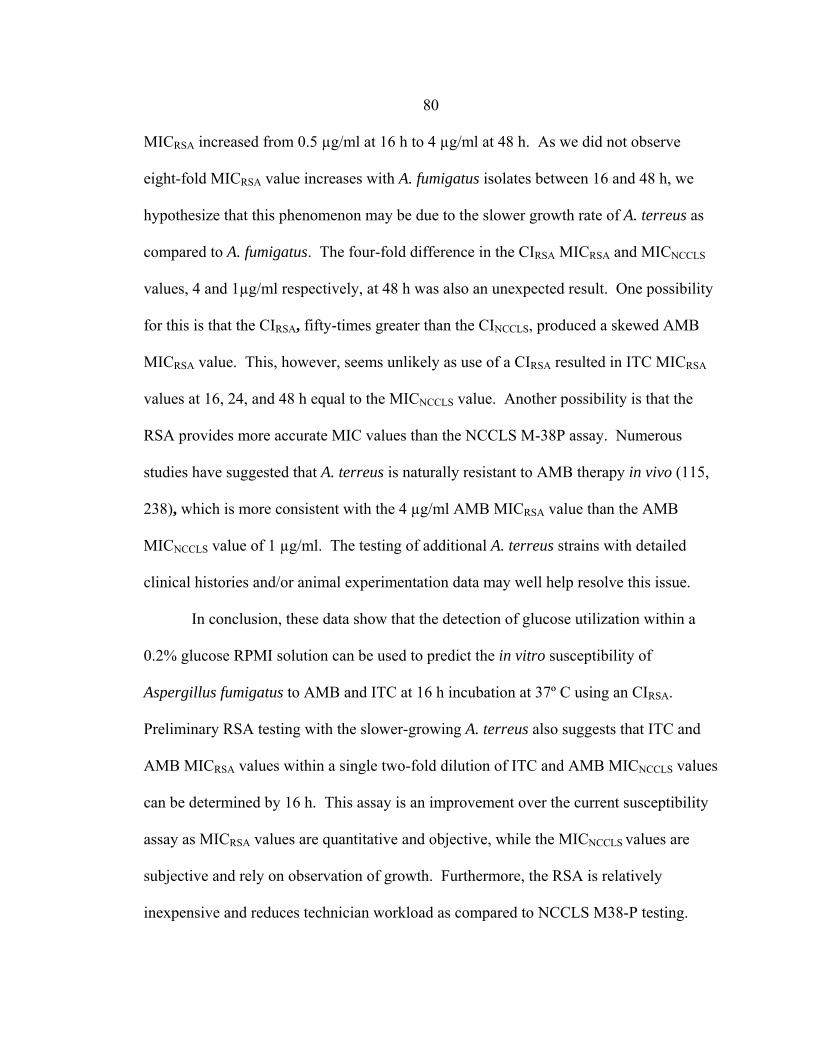
80
MICRSA increased from 0.5 µg/ml at 16 h to 4 µg/ml at 48 h. As we did not observe
eight-fold MICRSA value increases with A. fumigatus isolates between 16 and 48 h, we
hypothesize that this phenomenon may be due to the slower growth rate of A. terreus as
compared to A. fumigatus. The four-fold difference in the CIRSA MICRSA and MICNCCLS
values, 4 and 1µg/ml respectively, at 48 h was also an unexpected result. One possibility
for this is that the CIRSA, fifty-times greater than the CINCCLS, produced a skewed AMB
MICRSA value. This, however, seems unlikely as use of a CIRSA resulted in ITC MICRSA
values at 16, 24, and 48 h equal to the MICNCCLS value. Another possibility is that the
RSA provides more accurate MIC values than the NCCLS M-38P assay. Numerous
studies have suggested that A. terreus is naturally resistant to AMB therapy in vivo (115,
238), which is more consistent with the 4 µg/ml AMB MICRSA value than the AMB
MICNCCLS value of 1 µg/ml. The testing of additional A. terreus strains with detailed
clinical histories and/or animal experimentation data may well help resolve this issue.
In conclusion, these data show that the detection of glucose utilization within a
0.2% glucose RPMI solution can be used to predict the in vitro susceptibility of
Aspergillus fumigatus to AMB and ITC at 16 h incubation at 37º C using an CIRSA.
Preliminary RSA testing with the slower-growing A. terreus also suggests that ITC and
AMB MICRSA values within a single two-fold dilution of ITC and AMB MICNCCLS values
can be determined by 16 h. This assay is an improvement over the current susceptibility
assay as MICRSA values are quantitative and objective, while the MICNCCLS values are
subjective and rely on observation of growth. Furthermore, the RSA is relatively
inexpensive and reduces technician workload as compared to NCCLS M38-P testing.

81
CHAPTER 3
EXPANSION AND VALIDATION OF MOLD RAPID SUSCEPTIBILITY ASSAY
Introduction
I previously demonstrated that the mold RSA (mRSA) provided objective
amphotericin B (AMB) and itraconazole (ITC) minimum inhibitory concentration (MIC)
values for Aspergillus fumigatus isolates in 16 h, a significant improvement compared to
the subjective AMB and ITC MICs obtained by National Committee for Clinical
Laboratory Standards (NCCLS) M38-A testing in 48 h. In this current form, however,
the mRSA is restricted to AMB and ITC susceptibility testing of A. fumigatus. As our
ultimate goal is to develop the mRSA for wide scale use as a generalized antifungal
susceptibility test for all filamentous fungi, it is essential that I continue to validate
current mRSA conditions by testing additional A. fumigatus clinical strains, introduce
new antifungal drugs to the mRSA drug arsenal, and investigate the suitability of mRSA
testing for non-A. fumigatus mold species.
mRSA Testing of Non-A. fumigatus Mold Species
Aspergillus sydowii, Aspergillus terreus, Aspergillus flavus, Fusarium
oxysporum, and Scedosporium angiospermum clinical isolates were chosen to determine
the suitability of mRSA testing for non-A. fumigatus molds. These species were chosen
based on their availability from Kevin Hazen at the Health Sciences Center in
82
Charlottesville, VA. The first and most essential step in determining suitability of mRSA
testing is to demonstrate a direct correlation between antifungal drug effect on both
conidial development and glucose consumption. Establishment of this correlation is
dependent on the fulfillment of two conditions: 1) in the presence of an inhibitory
concentration of drug, both conidial development and glucose consumption are inhibited;
and 2) in the absence of an inhibitory concentration of drug, there is no inhibition of
conidial development or glucose consumption. Those species demonstrating a successful
correlation will be considered suitable for inclusion in mRSA testing.
Introduction of VRC to mRSA Testing
Voriconazole (VRC) was recently approved by the US Food and Drug
Administration for primary treatment of invasive aspergillosis (43, 176). VRC is
available in both oral and intravenous forms, with better adsorption and fewer associated
side effects compared to AMB and ITC. Like ITC, this triazole targets the cytochrome
P450 14α-demethylase enzyme which is involved in ergosterol production (239).
Although both ITC and VRC have the same fungal target, cross-resistance has not been
consistently observed with ITC-resistant A. fumigatus strains, most likely due to target
binding differences (109, 241). VRC has demonstrated excellent in vitro activity against
A. fumigatus, A. terreus, A. flavus, and S. angiospermum, with VRC MICs usually less
than AMB MICs and similar to ITC MICs (213). While the in vitro VRC activity against
F. oxysporum isolates is variable, with MICs ranging from 0.25 to >8 µg/ml (213, 214),
VRC prescribed on a compassionate basis (salvage therapy) to patients with AMB and/or
83
ITC refractory invasive fungal infections caused by Aspergillus, Scedosporium, and
Fusarium spp. has resulted in excellent response rates (215-217). The low toxicity, high
adsorption, and broad spectrum of activity, both in vitro and in vivo, warrants inclusion
of VRC in mRSA testing.
Validation of mRSA
mRSA ITC and AMB testing conditions were originally optimized with ITC-
sensitive and –resistant A. fumigatus strains NCPF 7098 and 7100, respectively and
AMB-sensitive and resistant A. fumigatus strains NCPF 7101 and 7097, respectively
(Chapter 2). While testing of the former strains has demonstrated that the mRSA can
generate clinically relevant ITC MICs in 16 h, testing of additional ITC-sensitive and
ITC-resistant clinical isolates is necessary to reinforce that these conditions are optimal.
mRSA and NCCLS M38-A AMB, ITC, VRC testing was performed with four new ITC-
resistant and two new AMB-sensitive A. fumigatus strains to validate mRSA ITC testing
conditions and to confirm that 16 h mRSA MICs are consistently equal to or within one
dilution of those obtained by NCCLS M38-A testing in 48 h.
Optimization of A. flavus AMB, ITC, and VRC mRSA Testing Conditions
In the first section of results in this chapter, I establish a direct correlation
between the effects of AMB and ITC on A. flavus conidial development and glucose
utilization (Fig. 20-25). Based on this correlation, I will attempt to optimize mRSA
conditions for AMB and ITC testing of A. flavus strains AFL1, AFL2, and AFL3. As
84
VRC has also been introduced to the mRSA for A. fumigatus testing, I will also attempt
to optimize mRSA conditions for VRC testing of the A. flavus strains.
Materials and Methods
Reagents
Preparations of RPMI 1640 with or without 0.4% glucose were buffered with
0.165 M 3-(N-morpholino)-propanesulfonic acid (MOPS) and adjusted to pH 7.0 with 10
N NaOH.
Fungal Strains
A. flavus strains AFL1, AFL2, and AFL3; A. sydowii strains AS1 and AS2; A.
terreus strain AT1; F. oxysporum strain FO1; and S. prolificans strain SC1 were donated
by Kevin Hazen at the University of Virginia Health System (Charlottesville, VA). ITC-
resistant A. fumigatus strains BR181, AF90 (NCPF 7099), AF1422, AF72, and BR130
were donated by David Denning at Hope Hospital, England. AMB-sensitive A.
fumigatus strains CM1396 and CM237 were donated by Emilia Mellado at the Instituto
de Salud Carlos III (Madrid, Spain). ITC-sensitive and –resistant A. fumigatus strains
NCPF 7098 and 7100, respectively, and AMB-sensitive and –resistant strains 7101 and
7097, respectively, were purchased from the National Collection of Pathogenic Fungi
(Bristol, England). A. fumigatus strain 204305 was purchased from the American Type
Culture Collection (ATCC). Species designation of each strain was confirmed by
observations of macroscopic and microscopic characteristics during growth on Potato-

85
Dextrose and/or Sabouraud (SAB) agar. All stocks were maintained in vials of sterile
water at 4º C.
Antifungal Drugs and Preparation
AMB and ITC were purchased from Sigma and Research Diagnostics Inc.,
respectively, while VRC was generously provided by Pfizer (UK). Stock concentrations
of 1600 µg/ml were prepared for each drug with dimethyl sulfoxide (DMSO) and stored
at -80º C for up to six months. For mRSA testing, serial two-fold dilution series of AMB,
ITC, and VRC were prepared in DMSO to achieve drug concentration ranges of 3 to
1600 µg/ml. Each DMSO dilution was then diluted 1:50 in 0.4% glucose RPMI to
achieve 2x drug concentration ranges of 0.06 to 32 µg/ml. Both drug-free growth and
glucose controls were prepared, containing the same ratio of DMSO to 0.4% glucose
RPMI as the 2x drug dilutions.
Microwell Plate Preparation
Testing of non-A. fumigatus molds was performed in 96 well round bottom plates.
Test wells for each mold were prepared by inoculating 100 µl of 32 µg/ml AMB, 32
µg/ml ITC, and drug-free 0.4% glucose RPMI (growth control), containing the same
concentration of DMSO as RPMI containing drug, into triplicate wells. 100 µl of drug-
free 0.4 % glucose RPMI was also added to an additional three wells to represent the
glucose control (no drug or mold). Plates were prepared on the day of use and stored at
4ºC until needed.

86
mRSA and NCCLS M38-A testing was performed in duplicate in 96 well round bottom
plates with each row, comprised of 12 wells, corresponding to one susceptibility test.
Wells 1-10 were inoculated with 100 µl of the 2 x AMB, ITC, or VRC dilution ranges
(0.06 to 32 µg/ml). Wells 11 and 12, the drug-free growth and glucose controls,
respectively, were inoculated with 100 µl of DMSO - 0.4% glucose RPMI. Plates were
prepared on the day of use and stored at 4º C until needed.
Inoculum Preparation
A. fumigatus and non-A. fumigatus isolates were cultured on SAB agar slants at
30º C for three or four days, respectively. The slant surface was flooded with glucose
deficient RPMI and gently scraped with a sterile wooden applicator stick. Once the
hyphal fragments were allowed to settle for 15 min, the conidial suspension was collected
and adjusted with glucose deficient RPMI to an optical density (OD530nm) of 0.09 to 0.11
for non-A. fumigatus spp. and 0.11 for A. fumigatus isolates. If necessary, conidial
suspensions were further diluted 1:50 with glucose deficient RPMI. A conidial
suspension could not be obtained with F. oxysporum FO1. Testing of this strain was
instead performed with a 0.13 OD530nm hyphal inoculum. Conidia were enumerated
microscopically using a hemocytometer and/or by CFU/ml counts.
Glucose Utilization of Conidial or Hyphal Inocula of Non-A. fumigatus
Molds in Presence or Absence of AMB and ITC
Testing of A. flavus, A. sydowii, A. terreus and S. angiospermum strains was
initiated by inoculating 100 µl of each strains’ 0.09-0.11 OD530nm conidial inocula (except

87
F. oxysporum FO1) into wells containing 100 µl of AMB, ITC, or drug-free RPMI.
Testing of F. oxysporum was initiated by inoculating 100 µl of the 0.13 OD530nm hyphal
inoculum into wells containing 100 µl of AMB, ITC, or drug-free RPMI. 100 µl of
glucose deficient RPMI was added to glucose control wells. Plates were sealed with tape
and placed into a 35-37º C incubator. Four identical sets of plates were prepared and
placed into incubator at time 0, permitting one set to be used for determination of glucose
utilization and antifungal effect at 5, 18.5, 24, and 48 h.
The glucose utilization of conidial and hyphal inocula was determined at each
time point by adding 50 µl of color mix testing wells. After 20 min, the optical density
(OD550-655nm) in each well was determined by spectrophotometer. Percent residual
glucose values were calculated by comparing the OD550-655nm value of each AMB, ITC, or
growth control test well with the OD550-655nm of the glucose control well based on the
following equation: (OD550-655nm of test well / OD550-655nm of glucose control well) X 100.
After residual glucose levels had been determined, a pipette tip was used to scrape
the bottom and sides of each well and transfer approximately 50 µl of the mixture to a
glass slide. After placement of a coverslip, the slides were observed by light microscopy
at 400X. Antifungal effect on conidia or hyphae was determined by comparing the
conidial or hyphal appearance in the presence and absence of 16 µg/ml of AMB or ITC.
mRSA Assay and MIC Determination
The mRSA was initiated by inoculating wells 1-11 with 100 µl of the 0.11
OD530nm or 1:50 0.11 OD530nm conidial inoculum of each A. fumigatus or A. flavus test
strain, well 12 with 100 µl of glucose deficient RPMI, sealing the plate edges with tape,
88
and incubation at 35-37º C. The plates were removed from the incubator after
approximately 16 h and residual glucose levels determined by addition of 50 µl of an
enzyme color mix comprised of 0.6 M sodium phosphate buffer (pH 6.0), 360 µg/ml of
4-amino antipyrine, 490 µg/ml of N-ethyl-N-sulfopropyl-m-toluidine, 0.68 U/ml
horseradish peroxidase, and 0.4 U/ml glucose oxidase to each well. At 20 min, the color
intensity was measured at OD550nm with a reference reading of OD655nm in a plate reader.
Percent residual glucose values were calculated by comparing the OD550-655nm value of
each AMB, ITC, VRC, or growth control test well with the OD550-655nm of the glucose
control well based on the following equation: (OD550-655nm of test well / OD550-655nm of
glucose control well) X 100.
Antifungal susceptibility curves were generated for each mRSA test by plotting
the percent residual glucose values (y-axis) against the appropriate AMB, ITC, or VRC
concentrations (x-axis). The resulting detection interval contained an upper and lower
limit represented, respectively, by the percent residual values corresponding to the
highest concentration of antifungal drug and the drug-free growth control. mRSA AMB
MICs were defined as the lowest drug concentration having a percent residual glucose
value within the top 10% of the detection interval. mRSA ITC and VRC MICs were
defined as the lowest drug concentration corresponding to a residual glucose value within
the top 20% of the detection only if a) a detection interval comprised of an upper plateau,
steep decline, and lower plateau was discernable and b) the highest concentration of ITC
or VRC (16 µg/ml) had a corresponding residual glucose value of ≥ 80%. If these
conditions were not met, the ITC or VRC MICRSA was designated as >16 µg/ml.
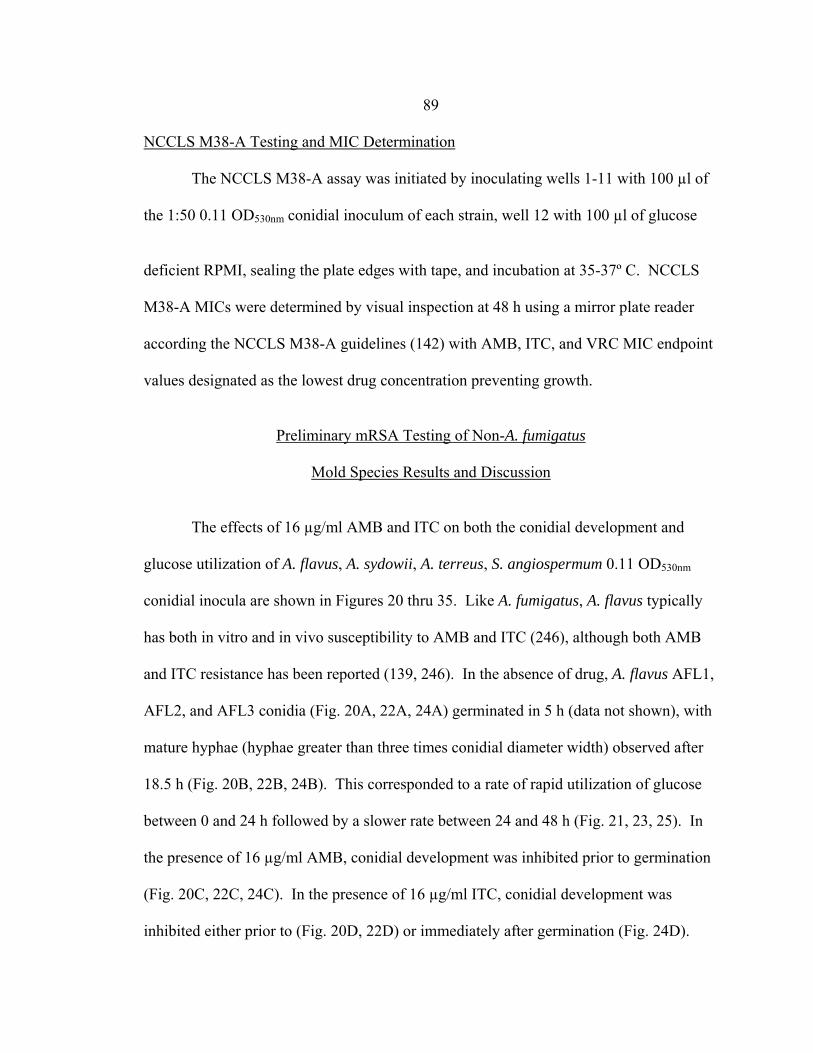
89 NCCLS M38-A Testing and MIC Determination
The NCCLS M38-A assay was initiated by inoculating wells 1-11 with 100 µl of
the 1:50 0.11 OD530nm conidial inoculum of each strain, well 12 with 100 µl of glucose
deficient RPMI, sealing the plate edges with tape, and incubation at 35-37º C. NCCLS
M38-A MICs were determined by visual inspection at 48 h using a mirror plate reader
according the NCCLS M38-A guidelines (142) with AMB, ITC, and VRC MIC endpoint
values designated as the lowest drug concentration preventing growth.
Preliminary mRSA Testing of Non-A. fumigatus
Mold Species Results and Discussion
The effects of 16 µg/ml AMB and ITC on both the conidial development and
glucose utilization of A. flavus, A. sydowii, A. terreus, S. angiospermum 0.11 OD530nm
conidial inocula are shown in Figures 20 thru 35. Like A. fumigatus, A. flavus typically
has both in vitro and in vivo susceptibility to AMB and ITC (246), although both AMB
and ITC resistance has been reported (139, 246). In the absence of drug, A. flavus AFL1,
AFL2, and AFL3 conidia (Fig. 20A, 22A, 24A) germinated in 5 h (data not shown), with
mature hyphae (hyphae greater than three times conidial diameter width) observed after
18.5 h (Fig. 20B, 22B, 24B). This corresponded to a rate of rapid utilization of glucose
between 0 and 24 h followed by a slower rate between 24 and 48 h (Fig. 21, 23, 25). In
the presence of 16 µg/ml AMB, conidial development was inhibited prior to germination
(Fig. 20C, 22C, 24C). In the presence of 16 µg/ml ITC, conidial development was
inhibited either prior to (Fig. 20D, 22D) or immediately after germination (Fig. 24D).
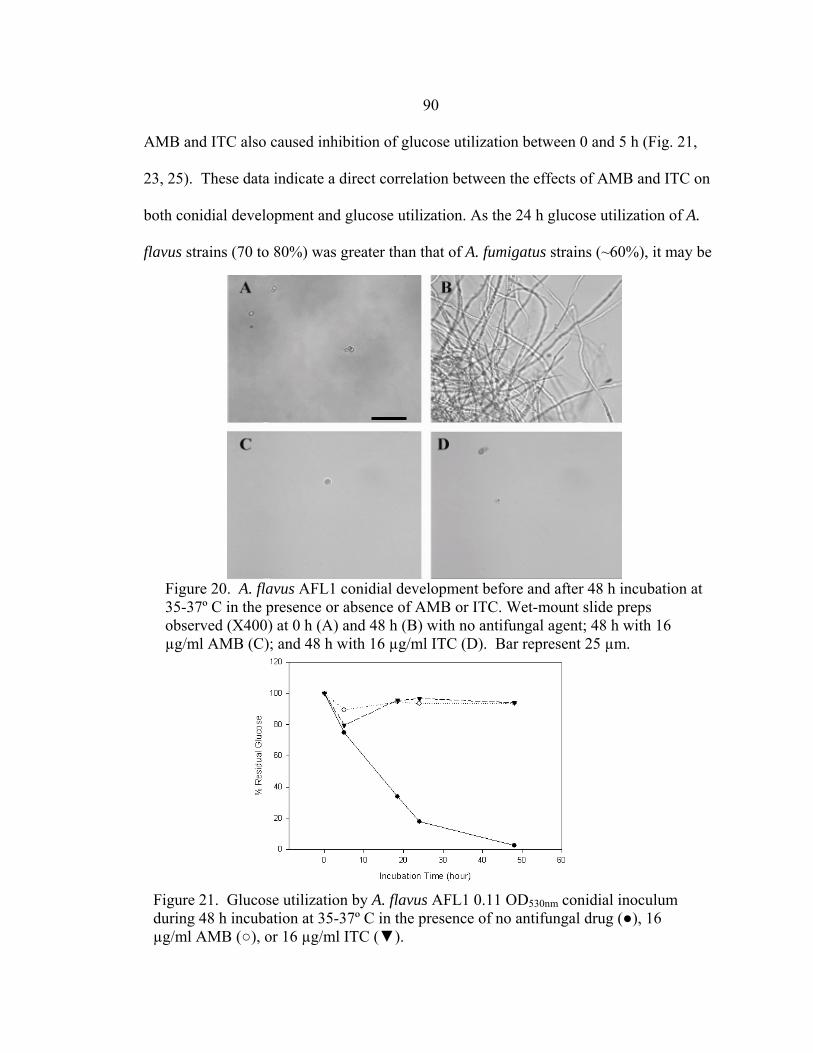
90
Figure 21. Glucose utilization by A. flavus AFL1 0.11 OD530nm conidial inoculum during 48 h incubation at 35-37º C in the presence of no antifungal drug (●), 16 µg/ml AMB (○), or 16 µg/ml ITC (▼).
Figure 20. A. flavus AFL1 conidial development before and after 48 h incubation at 35-37º C in the presence or absence of AMB or ITC. Wet-mount slide preps observed (X400) at 0 h (A) and 48 h (B) with no antifungal agent; 48 h with 16 µg/ml AMB (C); and 48 h with 16 µg/ml ITC (D). Bar represent 25 µm.
AMB and ITC also caused inhibition of glucose utilization between 0 and 5 h (Fig. 21,
23, 25). These data indicate a direct correlation between the effects of AMB and ITC on
both conidial development and glucose utilization. As the 24 h glucose utilization of A.
flavus strains (70 to 80%) was greater than that of A. fumigatus strains (~60%), it may be

91
Figure 22. Glucose utilization by A. flavus AFL2 0.11 OD530nm conidial inoculum during 48 h incubation at 35-37º C in the presence of no antifungal drug (●), 16 µg/ml AMB (○), or 16 µg/ml ITC (▼).
Figure 22. A. flavus AFL2 conidial development before and after 48 h incubation at 35-37º C in the presence or absence of AMB or ITC. Wet-mount slide preps observed (X400) at 0 h (A) and 48 h (B) with no antifungal agent; 48 h with 16 µg/ml AMB (C); and 48 h with 16 µg/ml ITC (D). Bar represents 25 µm.
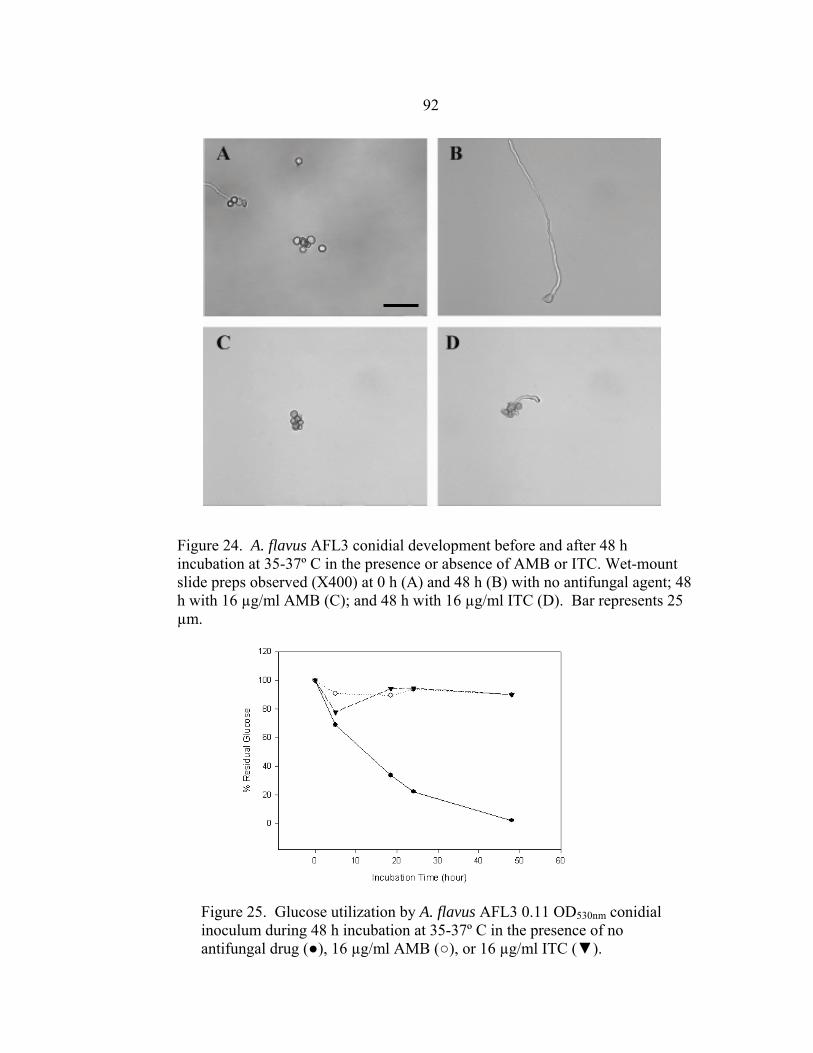
92
Figure 24. A. flavus AFL3 conidial development before and after 48 h incubation at 35-37º C in the presence or absence of AMB or ITC. Wet-mount slide preps observed (X400) at 0 h (A) and 48 h (B) with no antifungal agent; 48 h with 16 µg/ml AMB (C); and 48 h with 16 µg/ml ITC (D). Bar represents 25 µm.
Figure 25. Glucose utilization by A. flavus AFL3 0.11 OD530nm conidial inoculum during 48 h incubation at 35-37º C in the presence of no antifungal drug (●), 16 µg/ml AMB (○), or 16 µg/ml ITC (▼).
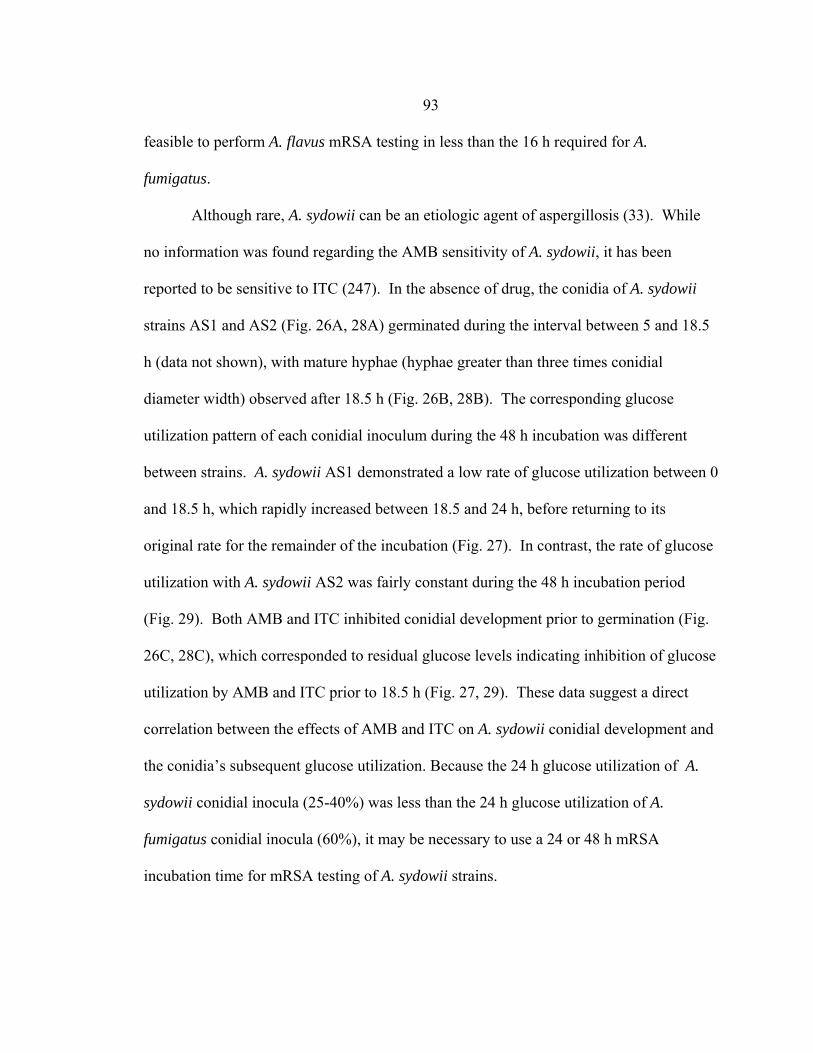
93 feasible to perform A. flavus mRSA testing in less than the 16 h required for A.
fumigatus.
Although rare, A. sydowii can be an etiologic agent of aspergillosis (33). While
no information was found regarding the AMB sensitivity of A. sydowii, it has been
reported to be sensitive to ITC (247). In the absence of drug, the conidia of A. sydowii
strains AS1 and AS2 (Fig. 26A, 28A) germinated during the interval between 5 and 18.5
h (data not shown), with mature hyphae (hyphae greater than three times conidial
diameter width) observed after 18.5 h (Fig. 26B, 28B). The corresponding glucose
utilization pattern of each conidial inoculum during the 48 h incubation was different
between strains. A. sydowii AS1 demonstrated a low rate of glucose utilization between 0
and 18.5 h, which rapidly increased between 18.5 and 24 h, before returning to its
original rate for the remainder of the incubation (Fig. 27). In contrast, the rate of glucose
utilization with A. sydowii AS2 was fairly constant during the 48 h incubation period
(Fig. 29). Both AMB and ITC inhibited conidial development prior to germination (Fig.
26C, 28C), which corresponded to residual glucose levels indicating inhibition of glucose
utilization by AMB and ITC prior to 18.5 h (Fig. 27, 29). These data suggest a direct
correlation between the effects of AMB and ITC on A. sydowii conidial development and
the conidia’s subsequent glucose utilization. Because the 24 h glucose utilization of A.
sydowii conidial inocula (25-40%) was less than the 24 h glucose utilization of A.
fumigatus conidial inocula (60%), it may be necessary to use a 24 or 48 h mRSA
incubation time for mRSA testing of A. sydowii strains.
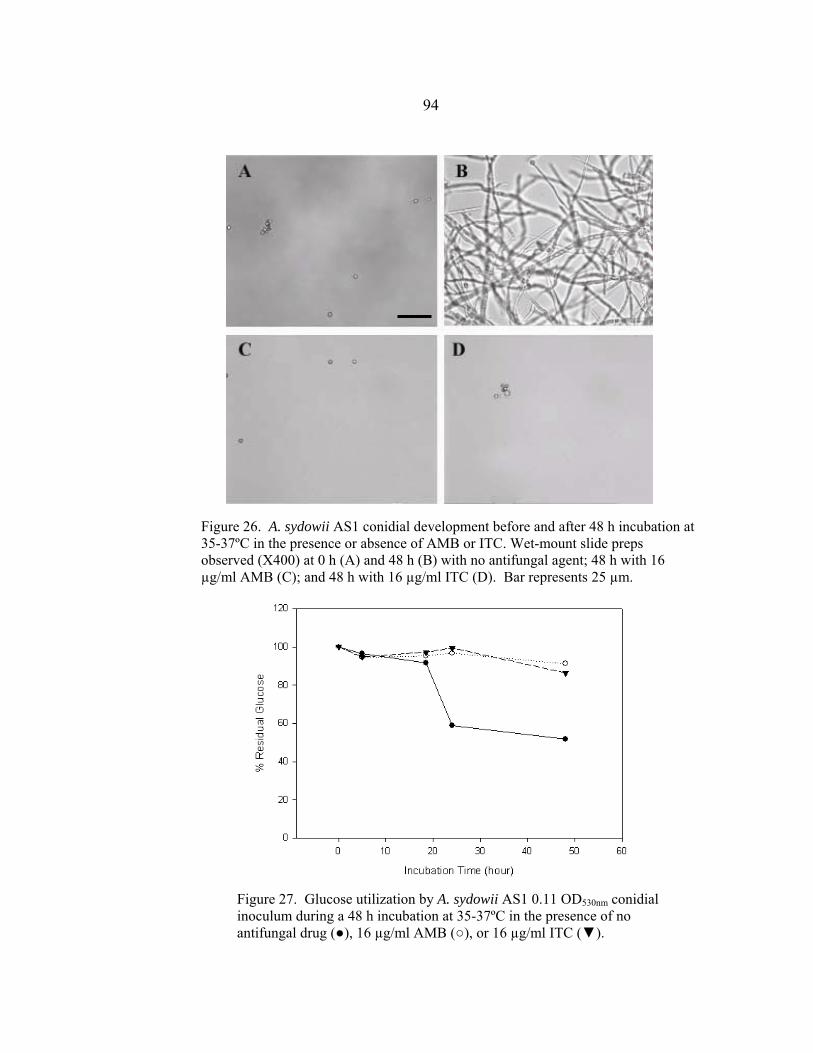
94
Figure 27. Glucose utilization by A. sydowii AS1 0.11 OD530nm conidial inoculum during a 48 h incubation at 35-37ºC in the presence of no antifungal drug (●), 16 µg/ml AMB (○), or 16 µg/ml ITC (▼).
Figure 26. A. sydowii AS1 conidial development before and after 48 h incubation at 35-37ºC in the presence or absence of AMB or ITC. Wet-mount slide preps observed (X400) at 0 h (A) and 48 h (B) with no antifungal agent; 48 h with 16 µg/ml AMB (C); and 48 h with 16 µg/ml ITC (D). Bar represents 25 µm.
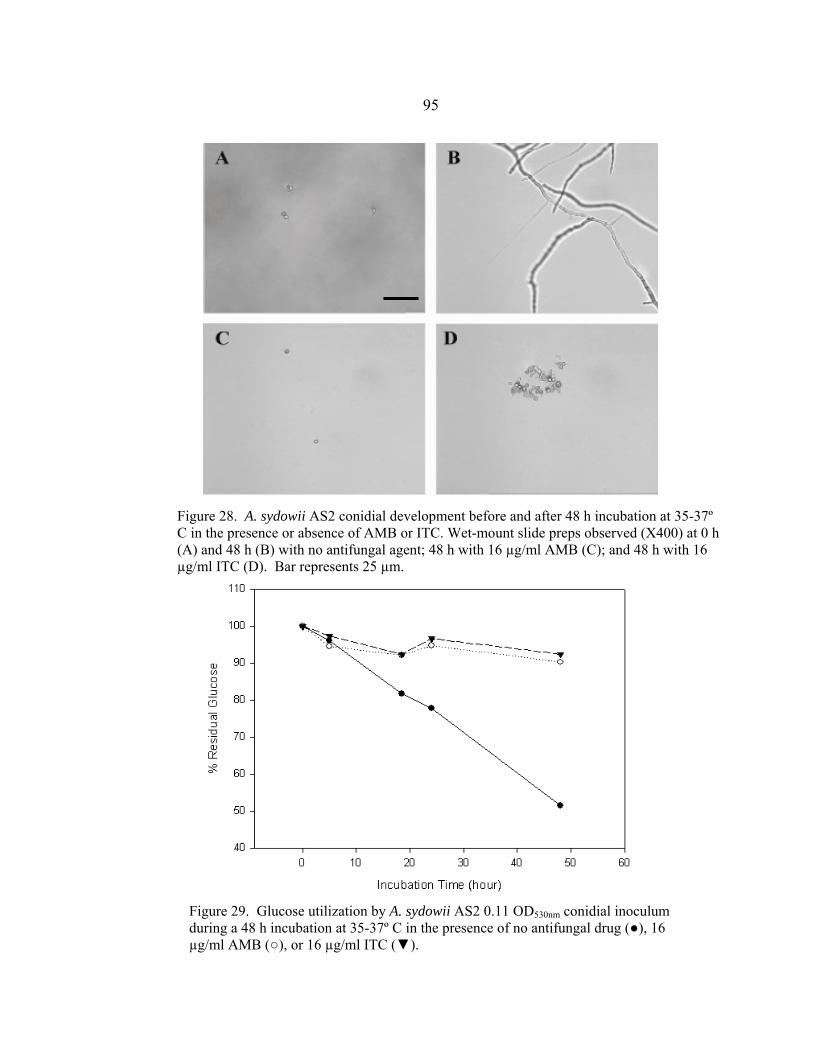
95
Figure 29. Glucose utilization by A. sydowii AS2 0.11 OD530nm conidial inoculum during a 48 h incubation at 35-37º C in the presence of no antifungal drug (●), 16 µg/ml AMB (○), or 16 µg/ml ITC (▼).
Figure 28. A. sydowii AS2 conidial development before and after 48 h incubation at 35-37º C in the presence or absence of AMB or ITC. Wet-mount slide preps observed (X400) at 0 h (A) and 48 h (B) with no antifungal agent; 48 h with 16 µg/ml AMB (C); and 48 h with 16 µg/ml ITC (D). Bar represents 25 µm.

96
The number of reports of pneumonia and disseminated infections caused by A.
terreus is increasing. While A. terreus is reported to be sensitive to ITC both in vivo and
in vitro (114), it has been reported to be resistant to AMB in vivo, with in vitro AMB
MICs ranging from 2 to 4 µg/ml (114). In the absence of drug, A. terreus AT1 conidia
(Fig. 30A) germinated between 5 and 18.5 h incubation (data not shown), with mature
hyphae observed after 18.5 h (Fig. 30B). This corresponded to a moderate rate of glucose
utilization between 0 and 18.5 h, a more rapid rate between 18.5 and 24 h, and another
moderate rate of glucose utilization from 24 to 48 h (Fig. 31). Both AMB and ITC
inhibited conidial development prior to germination (Fig. 30C, D). This corresponded to
residual glucose levels (~92%) that indicated inhibition of glucose utilization by AMB
and ITC prior to 18.5 h (Fig. 31). These data suggest a direct correlation between the
effects of AMB and ITC on A. terreus conidial development and the conidia’s subsequent
glucose utilization. Because the 24 h glucose utilization of the A. terreus conidial
inoculum (~65%) was similar to the 24 h glucose utilization A. fumigatus conidial inocula
(~60%), I predict that A. terreus mRSA testing can be performed in 16 h. In preliminary
A. terreus mRSA testing described in Chapter 2, I did in fact find that 16 h was sufficient
to obtain mRSA AMB and ITC MICs that were equal to or within two-fold dilution of
those obtained by the NCCLS M38-P assay in 48 h. However, the mRSA AMB MIC
was 0.5 µg/ml after 16 h incubation, which indicated AMB sensitivity. Incubating for 48
h increased the mRSA AMB MIC to 4 µg/ml. If all A. terreus strains are resistant to
AMB, perhaps a mRSA incubation time of 48 h may be more appropriate, even though
the glucose utilization indicates that 16 h should be sufficient. Additional
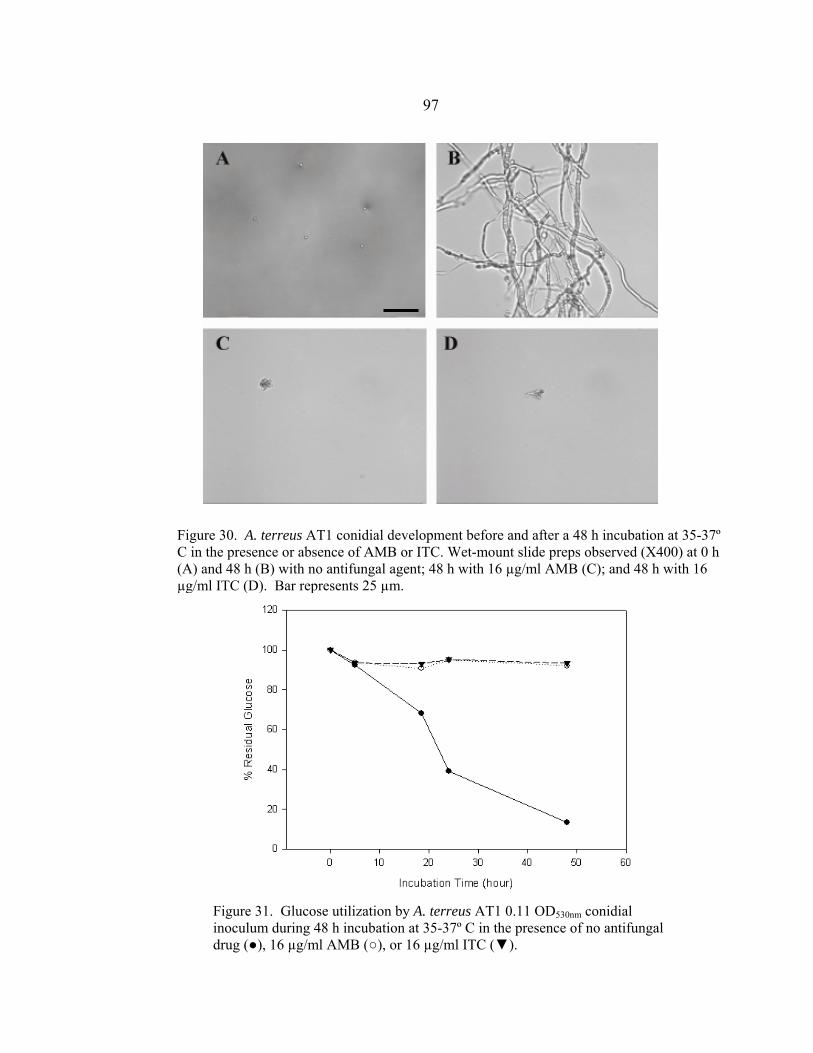
97
Figure 31. Glucose utilization by A. terreus AT1 0.11 OD530nm conidial inoculum during 48 h incubation at 35-37º C in the presence of no antifungal drug (●), 16 µg/ml AMB (○), or 16 µg/ml ITC (▼).
Figure 30. A. terreus AT1 conidial development before and after a 48 h incubation at 35-37º C in the presence or absence of AMB or ITC. Wet-mount slide preps observed (X400) at 0 h (A) and 48 h (B) with no antifungal agent; 48 h with 16 µg/ml AMB (C); and 48 h with 16 µg/ml ITC (D). Bar represents 25 µm.

98 mRSA testing of other A. terreus isolates, especially those isolated from patients with
known clinical failure, is necessary to resolve this matter.
S. angiospermum (Pseudallescheria boydii), another rare but increasingly
prevalent etiologic agent of hyalohyphomycosis, is resistant to AMB and ITC both in
vitro and in vivo, with AMB and ITC MICs ranging from 0.25-16 and 0.25-4 µg/ml,
respectively (139, 193, 241, 242, 248). In the absence of drug, S. angiospermum SA1
conidia (Fig. 32A) germinated between 24 and 48 h incubation (data not shown), with
mature hyphae (hyphae greater than three times conidial diameter width) observed at 48 h
(Fig. 32B). This corresponded to a relatively steady rate of glucose utilization throughout
the 48 h incubation (Fig. 33). There is some question as to why so much glucose was
being utilized before 24 h without germination occurring. Testing of additional S.
angiospermum strains is required to determine if this observation is strain or species
specific. Both AMB and ITC inhibited conidial development prior to germination (Fig.
32C, D). This corresponded to residual glucose levels (~95%) that indicated inhibition of
glucose utilization by AMB and ITC prior to conidial germination (Fig. 33). These data
suggest a direct correlation between the effects of AMB and ITC on S. angiospermum
conidial development and the conidia’s subsequent glucose utilization. As the 24 h
glucose utilization of the S. angiospermum conidial inoculum (~40%) was less than the
24 h glucose utilization of A. fumigatus conidial inocula (~60%), it may be necessary to
use a 24 or 48 h mRSA incubation time for mRSA testing of S. angiospermum strains.
This was not unexpected as the NCCLS M38-A protocol currently recommends 70 to 74
h incubation for AMB and ITC testing of S. angiospermum isolates (128).
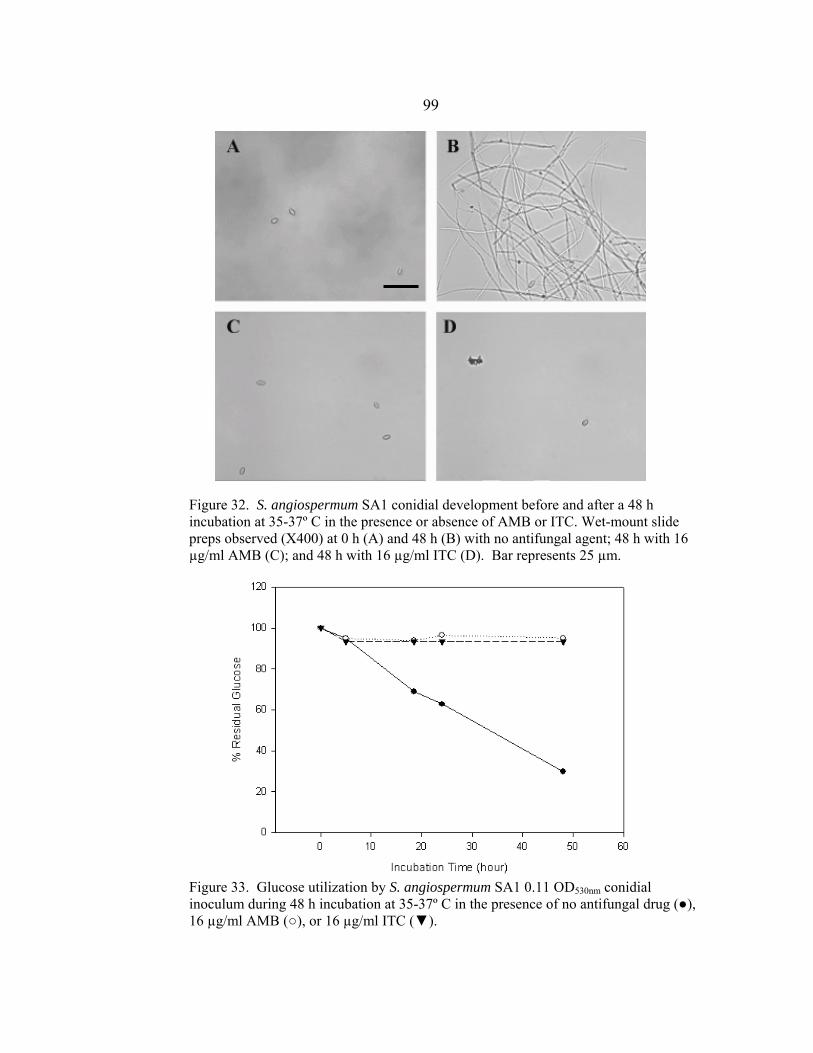
99
Figure 33. Glucose utilization by S. angiospermum SA1 0.11 OD530nm conidial inoculum during 48 h incubation at 35-37º C in the presence of no antifungal drug (●), 16 µg/ml AMB (○), or 16 µg/ml ITC (▼).
Figure 32. S. angiospermum SA1 conidial development before and after a 48 h incubation at 35-37º C in the presence or absence of AMB or ITC. Wet-mount slide preps observed (X400) at 0 h (A) and 48 h (B) with no antifungal agent; 48 h with 16 µg/ml AMB (C); and 48 h with 16 µg/ml ITC (D). Bar represents 25 µm.

100 Fusarium oxysporum is an emerging opportunistic fungal pathogen that can cause severe
disseminated infections in neutropenic patients (244). F. oxysporum is resistant to AMB
and ITC in vivo and usually in vitro, with AMB and ITC MICs ranging from 0.25 – >16
and 0.5– >16 µg/ml, respectively (139, 151, 241, 242, 249). The inability to obtain a
conidial inoculum may have been due to the use of SAB agar as the growth medium.
Perhaps potato dextrose agar should have been used as this medium induces greater
conidial sporulation. As a conidial inoculum could not be prepared, I instead tested a
0.13 OD530nm hyphal inoculum. The appearance of F. oxysporum hyphae before and after
48 h incubation in the absence of AMB and ITC are shown in Fig. 34A and B,
respectively. There is no discernable difference in hyphal appearance between time
points. This corresponded to an irregular rate of glucose utilization during the 48 h
incubation. The rate of glucose utilization was moderate until 18.5 h, when a negative
rate of utilization occurred until 24 h, followed by a very low rate from 24 to 48 h (Fig.
35). Hyphae incubated in the presence of 16 µg/ml AMB appeared fragmented by 48 h
(Fig. 34C). In contrast, hyphae incubated in the presence of 16 µg/ml ITC for 48 h
appeared normal (Fig. 34D). Residual glucose levels in the medium following 48 h
exposure of hyphae to AMB and ITC ranged from 80 to 90%, indicating that the AMB
and ITC effect on glucose utilization occurred within 10 h (Fig. 35). These data suggest a
direct correlation between the effect of AMB on F. oxysporum hyphae and the hyphae’s
subsequent glucose utilization. However, establishment of a direct correlation with ITC
effect on hyphal appearance and the hyphae’s subsequent glucose utilization is more
difficult. Although glucose utilization was inhibited in the presence of ITC, the hyphae

101
Figure 34. F. oxysporum FO1 conidial development before and after 48 h incubation at 35-37º C in the presence or absence of AMB or ITC. Wet-mount slide preps observed (X400) at 0 h (A) and 48 h (B) with no antifungal agent, 16 µg/ml AMB (C), and 48 h with 16 µg/ml ITC (D). Bar represents 25 µm.
Figure 35. Glucose utilization by F. oxysporum FO1 0.13 OD530nm hyphal inoculum during 48 h incubation at 35-37º C in the presence of no antifungal drug (●), 16 µg/ml AMB (○), or 16 µg/ml ITC (▼).
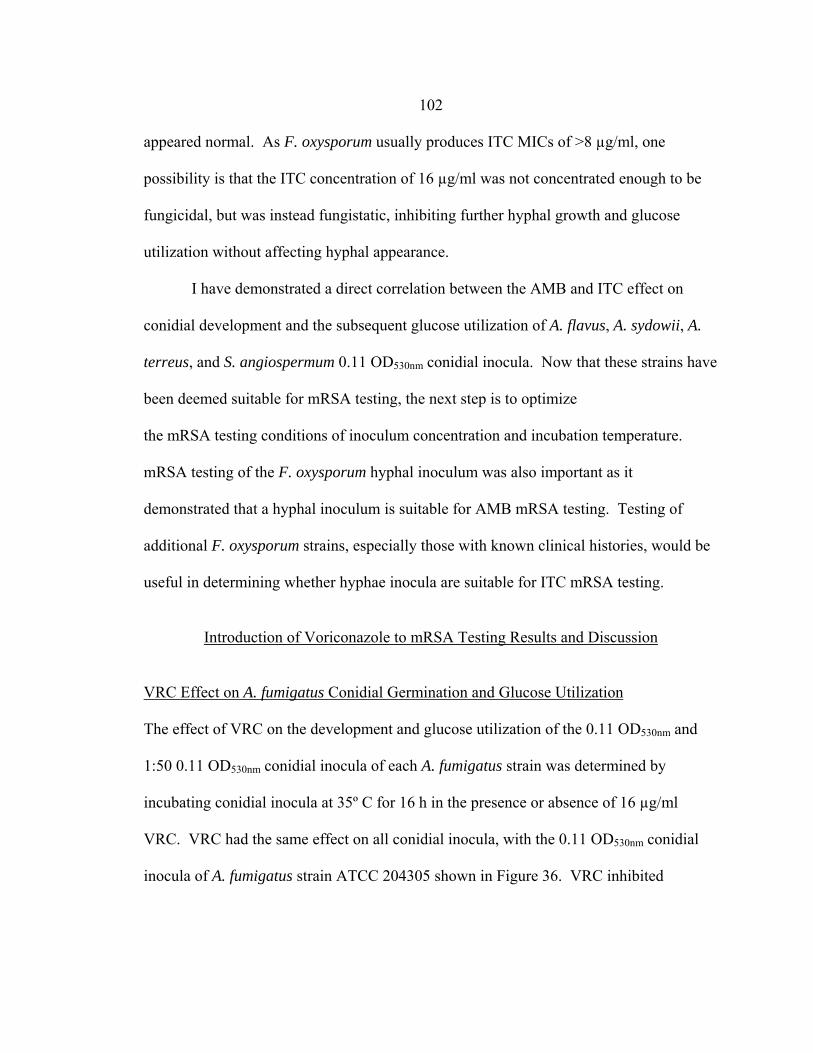
102
appeared normal. As F. oxysporum usually produces ITC MICs of >8 µg/ml, one
possibility is that the ITC concentration of 16 µg/ml was not concentrated enough to be
fungicidal, but was instead fungistatic, inhibiting further hyphal growth and glucose
utilization without affecting hyphal appearance.
I have demonstrated a direct correlation between the AMB and ITC effect on
conidial development and the subsequent glucose utilization of A. flavus, A. sydowii, A.
terreus, and S. angiospermum 0.11 OD530nm conidial inocula. Now that these strains have
been deemed suitable for mRSA testing, the next step is to optimize
the mRSA testing conditions of inoculum concentration and incubation temperature.
mRSA testing of the F. oxysporum hyphal inoculum was also important as it
demonstrated that a hyphal inoculum is suitable for AMB mRSA testing. Testing of
additional F. oxysporum strains, especially those with known clinical histories, would be
useful in determining whether hyphae inocula are suitable for ITC mRSA testing.
Introduction of Voriconazole to mRSA Testing Results and Discussion
VRC Effect on A. fumigatus Conidial Germination and Glucose Utilization
The effect of VRC on the development and glucose utilization of the 0.11 OD530nm and
1:50 0.11 OD530nm conidial inocula of each A. fumigatus strain was determined by
incubating conidial inocula at 35º C for 16 h in the presence or absence of 16 µg/ml
VRC. VRC had the same effect on all conidial inocula, with the 0.11 OD530nm conidial
inocula of A. fumigatus strain ATCC 204305 shown in Figure 36. VRC inhibited
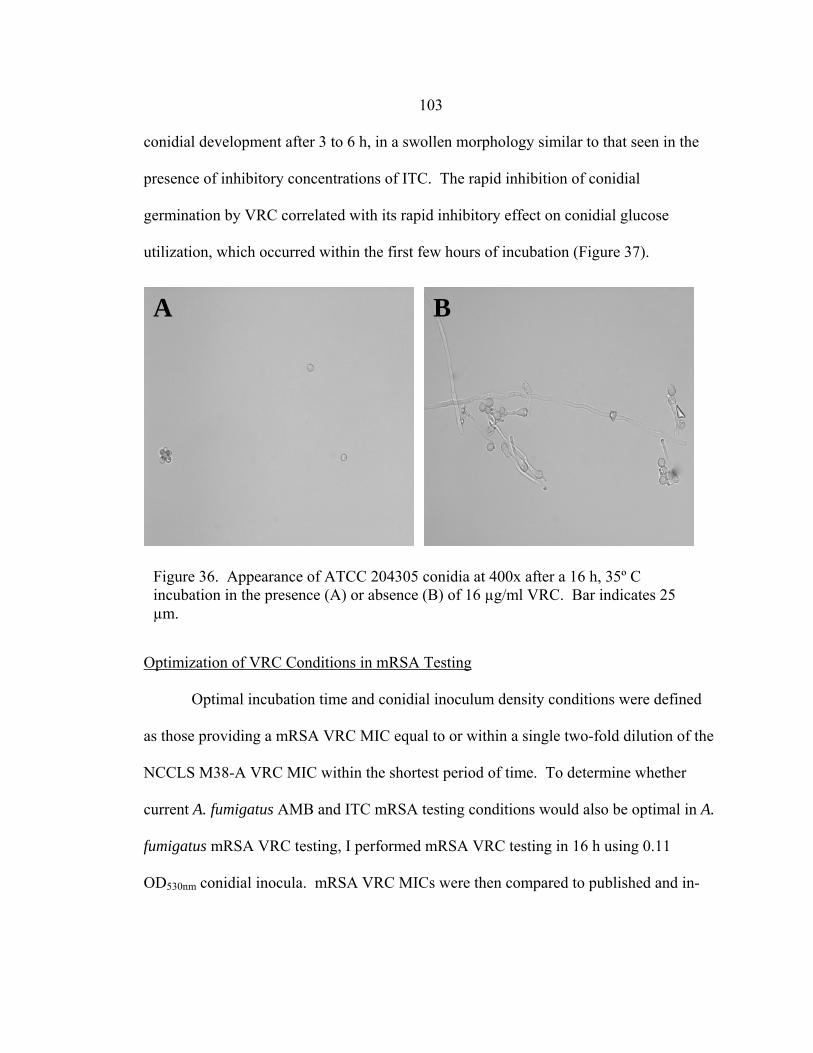
103 conidial development after 3 to 6 h, in a swollen morphology similar to that seen in the
presence of inhibitory concentrations of ITC. The rapid inhibition of conidial
germination by VRC correlated with its rapid inhibitory effect on conidial glucose
utilization, which occurred within the first few hours of incubation (Figure 37).
Optimization of VRC Conditions in mRSA Testing
Optimal incubation time and conidial inoculum density conditions were defined
as those providing a mRSA VRC MIC equal to or within a single two-fold dilution of the
NCCLS M38-A VRC MIC within the shortest period of time. To determine whether
current A. fumigatus AMB and ITC mRSA testing conditions would also be optimal in A.
fumigatus mRSA VRC testing, I performed mRSA VRC testing in 16 h using 0.11
OD530nm conidial inocula. mRSA VRC MICs were then compared to published and in-
A B
Figure 36. Appearance of ATCC 204305 conidia at 400x after a 16 h, 35º C incubation in the presence (A) or absence (B) of 16 µg/ml VRC. Bar indicates 25 µm.
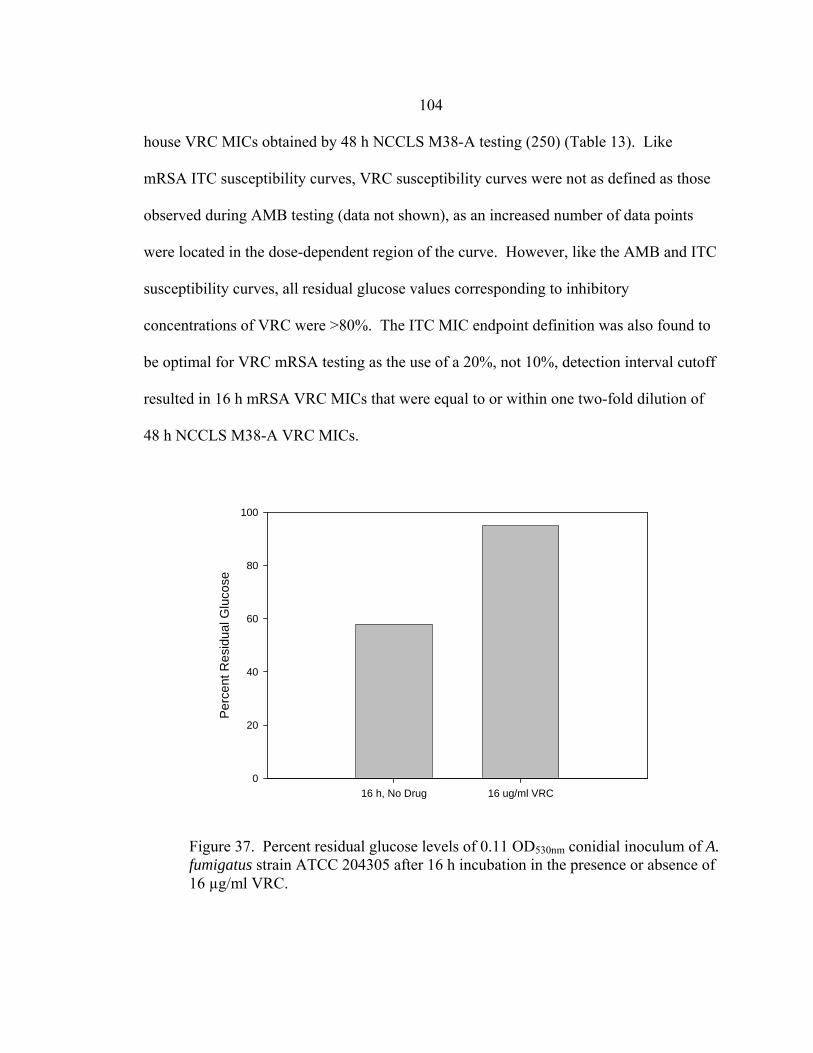
104 house VRC MICs obtained by 48 h NCCLS M38-A testing (250) (Table 13). Like
mRSA ITC susceptibility curves, VRC susceptibility curves were not as defined as those
observed during AMB testing (data not shown), as an increased number of data points
were located in the dose-dependent region of the curve. However, like the AMB and ITC
susceptibility curves, all residual glucose values corresponding to inhibitory
concentrations of VRC were >80%. The ITC MIC endpoint definition was also found to
be optimal for VRC mRSA testing as the use of a 20%, not 10%, detection interval cutoff
resulted in 16 h mRSA VRC MICs that were equal to or within one two-fold dilution of
48 h NCCLS M38-A VRC MICs.
16 h, No Drug 16 ug/ml VRC
Perc
ent R
esid
ual G
luco
se
0
20
40
60
80
100
Figure 37. Percent residual glucose levels of 0.11 OD530nm conidial inoculum of A. fumigatus strain ATCC 204305 after 16 h incubation in the presence or absence of 16 µg/ml VRC.
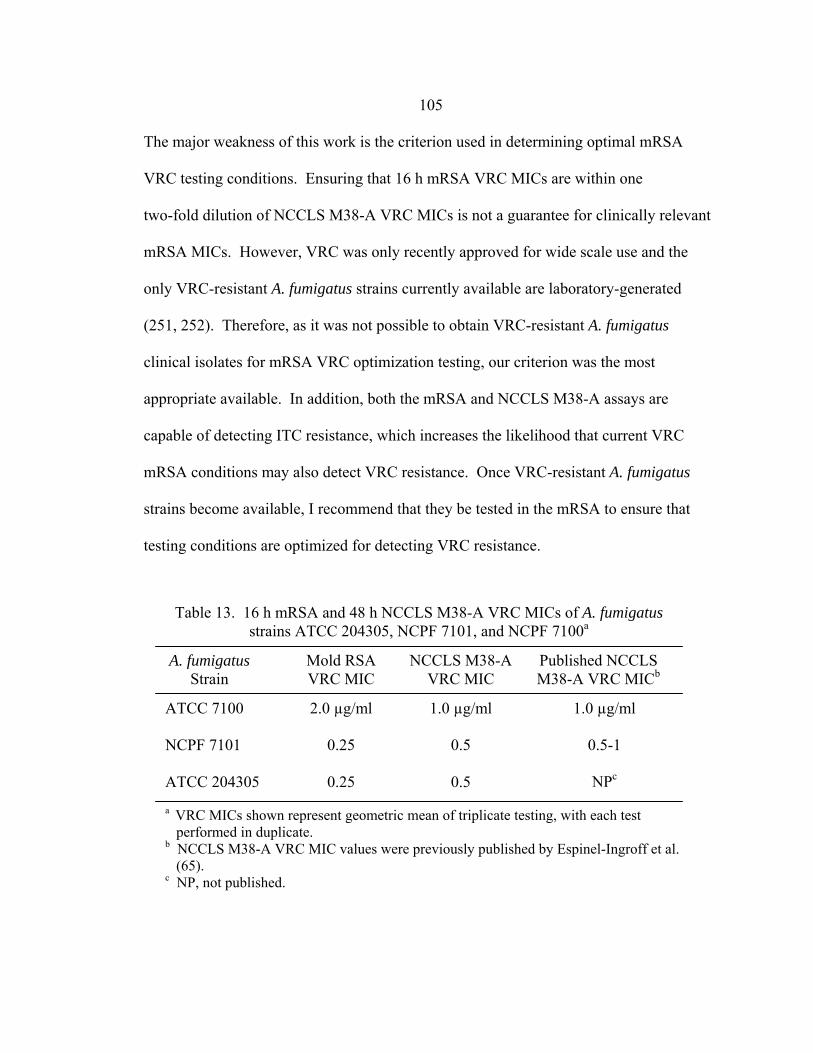
105 The major weakness of this work is the criterion used in determining optimal mRSA
VRC testing conditions. Ensuring that 16 h mRSA VRC MICs are within one
two-fold dilution of NCCLS M38-A VRC MICs is not a guarantee for clinically relevant
mRSA MICs. However, VRC was only recently approved for wide scale use and the
only VRC-resistant A. fumigatus strains currently available are laboratory-generated
(251, 252). Therefore, as it was not possible to obtain VRC-resistant A. fumigatus
clinical isolates for mRSA VRC optimization testing, our criterion was the most
appropriate available. In addition, both the mRSA and NCCLS M38-A assays are
capable of detecting ITC resistance, which increases the likelihood that current VRC
mRSA conditions may also detect VRC resistance. Once VRC-resistant A. fumigatus
strains become available, I recommend that they be tested in the mRSA to ensure that
testing conditions are optimized for detecting VRC resistance.
ATCC 7100 NCPF 7101 ATCC 204305
Table 13. 16 h mRSA and 48 h NCCLS M38-A VRC MICs of A. fumigatus strains ATCC 204305, NCPF 7101, and NCPF 7100a
A. fumigatus Strain
Mold RSA VRC MIC
NCCLS M38-A VRC MIC
2.0 µg/ml
0.25
0.25
1.0 µg/ml
0.5
0.5
a VRC MICs shown represent geometric mean of triplicate testing, with each test performed in duplicate. b NCCLS M38-A VRC MIC values were previously published by Espinel-Ingroff et al. (65). c NP, not published.
Published NCCLS M38-A VRC MICb
1.0 µg/ml
0.5-1
NPc

106
Validation of mRSA ITC Testing Results and Discussion
The mRSA and NCCLS M38-A AMB, ITC, and VRC MICs of new A. fumigatus
clinical control strains are shown in Table 14. The mRSA and NCCLS M38-A AMB
MICs of the AMB-sensitive strains CM237 and CM1369 indicated AMB sensitivity.
However, the mRSA AMB MIC of CM1369 was four-fold less (0.125 µg/ml) than the
NCCLS M38-A MIC (0.5 µg/ml). In addition, the mRSA AMB MIC of AF90 (0.25
µg/ml) was also four-fold less than the NCCLS M38-A AMB MIC (1 µg/ml) The mRSA
and NCCLS M38-A ITC MICs of the ITC-resistant strains BR181, AF90, AF1422, and
AF72 indicated ITC resistance. However, the mRSA ITC of BR181 (8 µg/ml) was four-
fold less than the NCCLS M38-A ITC MIC (>16 µg/ml). All mRSA VRC MICs were
with one two-fold dilution of NCCLS M38-A VRC MICs.
mRSA and NCCLS M38-A testing of the new AMB-sensitive and ITC-resistant
A. fumigatus isolates validated that mRSA conditions were optimized to detect AMB
Strain ID
In vivo susceptibility
mRSA MIC (µg/ml) NCCLS MIC (µg/ml)AMB ITC VRC AMB ITC VRC
CM237a CM1369 BR181b AF90 AF1422 AF72
AMB – Sc
ITC – R
0.25 0.125
0.25 0.25 0.5 1.0
0.25 0.25
8
>16 >16 >16
0.25 0.25
0.13 0.5 0.5 NTd
0.5 0.5
0.5 1 1
NT
0.25 0.25
>16 >16 >16 NT
0.25 0.25
0.25
1 1
NT
Table 14. RSA and NCCLS M38-A MICs of new A. fumigatus clinical strains
a Strains donated by E. Mellado. b Strains donated by D. Denning. c S, sensitive. R, resistant. d NT, not tested.
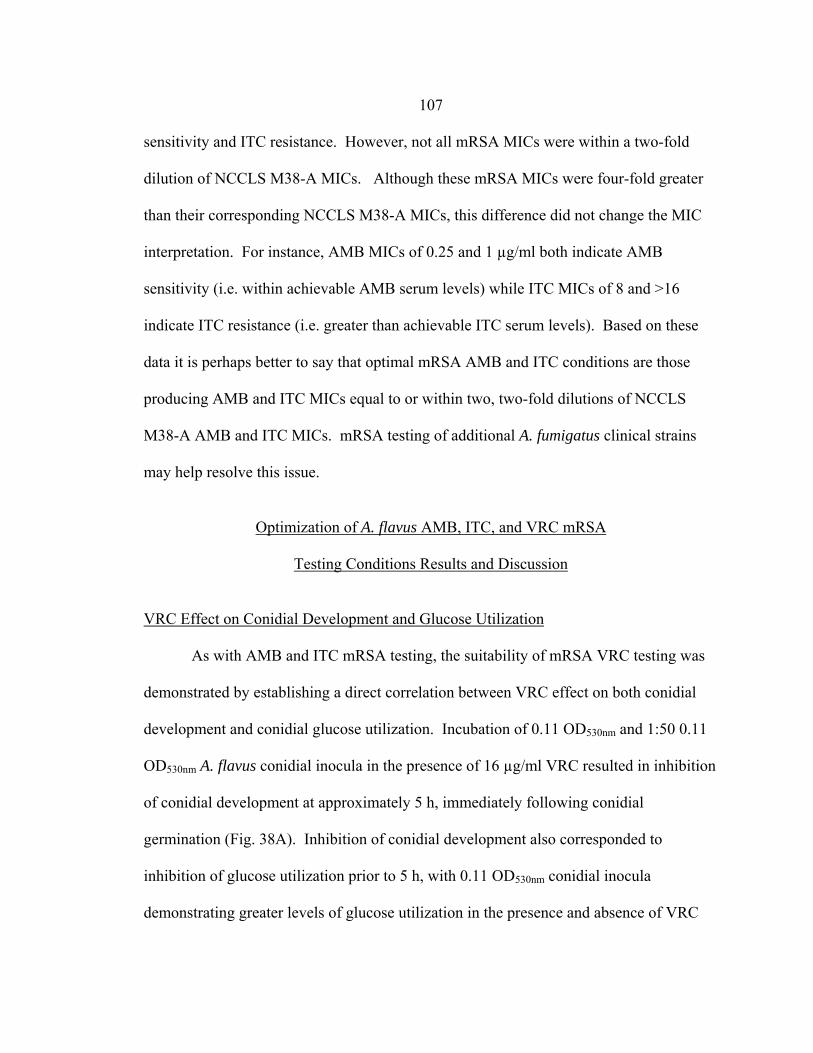
107 sensitivity and ITC resistance. However, not all mRSA MICs were within a two-fold
dilution of NCCLS M38-A MICs. Although these mRSA MICs were four-fold greater
than their corresponding NCCLS M38-A MICs, this difference did not change the MIC
interpretation. For instance, AMB MICs of 0.25 and 1 µg/ml both indicate AMB
sensitivity (i.e. within achievable AMB serum levels) while ITC MICs of 8 and >16
indicate ITC resistance (i.e. greater than achievable ITC serum levels). Based on these
data it is perhaps better to say that optimal mRSA AMB and ITC conditions are those
producing AMB and ITC MICs equal to or within two, two-fold dilutions of NCCLS
M38-A AMB and ITC MICs. mRSA testing of additional A. fumigatus clinical strains
may help resolve this issue.
Optimization of A. flavus AMB, ITC, and VRC mRSA
Testing Conditions Results and Discussion
VRC Effect on Conidial Development and Glucose Utilization
As with AMB and ITC mRSA testing, the suitability of mRSA VRC testing was
demonstrated by establishing a direct correlation between VRC effect on both conidial
development and conidial glucose utilization. Incubation of 0.11 OD530nm and 1:50 0.11
OD530nm A. flavus conidial inocula in the presence of 16 µg/ml VRC resulted in inhibition
of conidial development at approximately 5 h, immediately following conidial
germination (Fig. 38A). Inhibition of conidial development also corresponded to
inhibition of glucose utilization prior to 5 h, with 0.11 OD530nm conidial inocula
demonstrating greater levels of glucose utilization in the presence and absence of VRC

108
Figure 39. Glucose utilization of A. flavus 0.11 OD530nm (■,■) and 1:50 0.11 OD530nm (■,■) conidial inocula during 16 h incubation in the presence (■,■) or absence (■,■) of 16 µg/ml VRC.
A B
Figure 38. A. flavus conidial development after 16 h in the presence (A) or absence (B) of 16 µg/ml VRC.
Time (hour)0 5 10 15 20
Perc
ent R
esid
ual G
luco
se
30
40
50
60
70
80
90
100
110

109 compared to 1:50 0.11 OD530nm conidial inocula (Fig. 39). Inhibition of conidial
development and glucose utilization were similar in all A. flavus strains tested (data not
shown).
mRSA AMB, ITC, and VRC Susceptibility Curves
The AMB, ITC, and VRC mRSA susceptibility curves corresponding to 0.11
OD530nm and 1:50 0.11 OD530nm conidial inocula of A. flavus strains AFL1, AFL2, and
AFL3 are shown in Figures 40-42. In general, susceptibility curves corresponding to
1:50 0.11 OD530nm conidial inocula appeared to be shifted to the right by two dilutions
and slightly higher than the corresponding 0.11 OD530nm susceptibility curves. With the
exception of the A. flavus AFL1 1:50 0.11 OD530nm susceptibility curve (Fig. 40A), the
0.11 OD530nm and 1:50 0.11 OD530nm, AMB susceptibility curves of each A. flavus strain
were well defined with discernable upper plateaus, dose-dependent declines, and lower
plateaus (Fig. 40A, 41A, 42A). The ITC (Fig. 40B, 41B, 42B) and VRC (Fig. 40C, 41C,
42C) susceptibility curves were not as defined as AMB susceptibility curves, with an
increased number of data points in the dose-dependent decline and a small or absent
lower plateau.
Comparison of mRSA and NCCLS M38-A AMB, ITC, and VRC MICs
The 16 h 0.11 OD530nm and 1:50 0.11 OD530nm conidial inocula mRSA and 48 h
1:50 0.11 OD530nm conidial inocula NCCLS M38-A AMB, ITC, and VRC MICs are
shown in Table 15. mRSA AMB were determined using an upper detection interval
cutoff of 10%. mRSA ITC and VRC MICs were determined using an upper detection
110
AMB Concentration (µg/ml)
16 8 4 2 1 0.5 0.25 0.125 0.06 0.03 0
Perc
ent R
esid
ual G
luco
se
40
50
60
70
80
90
100
110
ITC Concentration (µg/ml)
16 8 4 2 1 0.5 0.25 0.125 0.06 0.03 0
Perc
ent R
esid
ual G
luco
se
40
50
60
70
80
90
100
110
VRC Concentration (µg/ml)
16 8 4 2 1 0.5 0.25 0.125 0.06 0.03 0
Perc
ent R
esid
ual G
luco
se
40
50
60
70
80
90
100
110
Figure 40. AMB (A), ITC (B), and VRC (C) mRSA susceptibility curves corresponding to 0.11 OD530nm (●) and 1:50 0.11 OD530nm (○) conidial inocula of A. flavus AFL1.
C
A
B

111
AMB Concentration (µg/ml)
16 8 4 2 1 0.5 0.25 0.125 0.06 0.03 0
Perc
ent R
esid
ual G
luco
se
30
40
50
60
70
80
90
100
110
ITC Concentration (µg/ml)
16 8 4 2 1 0.5 0.25 0.125 0.06 0.03 0
Perc
ent R
esid
ual G
luco
se
30
40
50
60
70
80
90
100
110
VRC Concentration (µg/ml)
16 8 4 2 1 0.5 0.25 0.125 0.06 0.03 0
Perc
ent R
esid
ual G
luco
se
30
40
50
60
70
80
90
100
110
Figure 41. AMB (A), ITC (B), and VRC (C) mRSA susceptibility curves corresponding to 0.11 OD530nm (●) and 1:50 0.11 OD530nm (○) conidial inocula of A. flavus AFL2.
A
B
C

112
AMB Concentration (µg/ml)
16 8 4 2 1 0.5 0.25 0.125 0.06 0.03 0
Perc
ent R
esid
ual G
luco
se
30
40
50
60
70
80
90
100
110
ITC Concentration (µg/ml)
16 8 4 2 1 0.5 0.25 0.125 0.06 0.03 0
Perc
ent R
esid
ual G
luco
se
30
40
50
60
70
80
90
100
110
VRC Concentration (µg/ml)
16 8 4 2 1 0.5 0.25 0.125 0.06 0.03 0
Perc
ent R
esid
ual G
luco
se
30
40
50
60
70
80
90
100
110
Figure 42. AMB (A), ITC (B), and VRC (C) mRSA susceptibility curves corresponding to 0.11 OD530nm (●) and 1:50 0.11 OD530nm (○) conidial inocula of A. flavus AFL3.
A
B
C

113
interval cutoff of 20%. mRSA MICs obtained with 0.11 OD530nm conidial inocula were
equal to or up to eight-fold greater than mRSA MICs obtained with 1:50 0.11 OD530nm
conidial inocula. mRSA MICs obtained with 0.11 OD530nm conidial inocula were
consistently equal to or within a two-fold dilution of those obtained by NCCLS M38-A
testing, while the MICs of 1:50 0.11 OD530nm conidial inocula were up to four-fold less
than NCCLS M38-A MICs. However, the only major difference in MIC interpretation
between the two mRSA conidial inocula concentrations is that the 0.11 OD530nm conidial
inocula of A. flavus strains AFL2 and AFL3 each produced AMB MICs of 2 µg/ml,
which may indicate AMB resistance, while 1:50 0.11 OD530nm conidial inocula produced
AMB MICs of 0.5 µg/ml, indicating AMB sensitivity. Even though A. flavus has been
documented as developing AMB resistance in vivo (139, 246), I am unable to conclude
which MIC interpretation is correct at this time, as the strains tested have no history of
clinical outcome. This can be determined in the future by either testing A. flavus strains
AFL2 or AFL3 in an appropriate animal model to determine responsiveness to AMB in
vivo or by performing mRSA AMB testing with the 0.11 OD530nm and 1:50 0.11 OD530nm
Strain ID NCCLS MIC (µg/ml)
AMB ITC VRC
AF1 AF2 AF3
0.25 0.5 0.5
0.125 0.25 0.25
Table 15. RSA and NCCLS M38-A MICs of A. flavus strains
mRSA MICa (µg/ml)
AMB ITC VRC
mRSA MICb (µg/ml)
AMB ITC VRC 0.5 2 2
1 1 1
0.5 1 1
0.5 1
0.5 a MICs based on analysis of 1:50 0.11 OD530nm mRSA susceptibility curves. b MICs based on analysis of 0.11 OD530nm mRSA susceptibility curves.
0.125 0.25 0.125
0.25 0.25 0.5
0.25 0.25 0.25
114 conidial inocula of an A. flavus clinical control strain, in which the in vivo susceptibility
to AMB is known.

115
CHAPTER 4
MODIFICATION OF MOLD RAPID SUSCEPTIBILITY ASSAY TO DETERMINE SUSCEPTIBILITY OF ASPERGILLUS FUMIGATUS HYPHAE TO AMPHOTERICIN B,
ITRACONAZOLE, AND VORICONAZOLE
Introduction
In previous work I modified the yeast rapid susceptibility assay (RSA) to
determine the susceptibility of Aspergillus fumigatus conidia to amphotericin B (AMB)
and itraconazole (ITC). The mold RSA (mRSA) is based on the assumption that when
fungi are exposed to an inhibitory concentration of antifungal drug, their uptake of
nutrients, such as glucose, is suppressed. A minimum inhibitory concentration (MIC)
value is determined by comparing the residual glucose levels in the medium following
incubation of the fungus with and without drug. This approach provides objective,
quantitative MIC values. Importantly, mRSA MIC values obtained at 16 h were equal to
or within a single two-fold dilution of MIC values determined by National Committee for
Clinical Laboratory Standards (NCCLS) M38-P antifungal testing at 48h.
While most filamentous fungi of medical importance are capable of producing
both conidial and hyphal structures, all mold susceptibility tests, including the mRSA,
utilize a conidial inoculum (124). Although conidial inocula are easier to standardize
compared to hyphal inocula, the use of conidia in standardized susceptibility testing
should be questioned for several reasons. Most importantly, branching hyphae are
responsible for growth in tissue (35). This means that the use of a conidial inoculum in in
vitro antifungal susceptibility testing should only be permitted if the in vitro susceptibility
116
of conidia is predictive of the susceptibility of hyphae in vivo. Another potential
disadvantage of using conidial inocula is that molds isolated in vitro from patients do not
necessarily produce conidia. A third important limitation is that conidial production may
require an extended incubation period, thus, delaying initiation of susceptibility testing.
Results of the limited studies comparing A. fumigatus conidial and hyphal MIC values
have been controversial (128-130, 132-134, 253), possibly due to the lack of proper
control strains and variability of testing parameters such as preparation of hyphal
inoculum, hyphal maturity, and inoculum concentration.
To investigate differences in amphotericin B (AMB), itraconazole (ITC), and
voriconazole (VRC) MIC values between conidial and hyphal inocula, I modified the
mRSA to facilitate susceptibility testing of hyphal inocula (hRSA). As with the mRSA,
A. fumigatus strains NCPF 7097, 7098, 7100, 7101 were used as hRSA optimizing strains
due to their documented in vivo (i.e. hyphal) susceptibilities to AMB or ITC (254, 255).
A standardized hRSA hyphal inoculum was generated by inoculating each testing well
with a standardized conidia inoculum and incubating at 35-37º C to induce germination.
The influence of inoculum size on hRSA MICs was determined by testing hyphal inocula
prepared with a range of dilutions of a standardized conidial inocula. Similarities
between conidial and hyphal MICs were determined by a direct comparison between
mRSA and hRSA MICs, respectively.

117
Materials and Methods
Reagents
Preparations of RPMI 1640 without glucose (Sigma, St. Louis, MO, cat. no. R-
1383) or with 0.4% glucose were buffered with 0.165 M 3-(N-morpholino)-
propanesulfonic acid (MOPS) (USB, Cleveland, OH, cat. no. 19256) and adjusted to pH
7.0 with 10 N NaOH.
Fungal Strains
A. fumigatus strains NCPF 7101, 7100, 7098, and 7097 were purchased from the
National Collection of Pathogenic Fungi (Mycology Reference Laboratory, Bristol).
These strains were isolated from aspergillosis patients with known clinical outcomes.
NCPF 7100 and 7098 were isolated from patients with unsuccessful and successful ITC
therapeutic outcomes, respectively. NCPF 7097 and 7101 were isolated from patients
with unsuccessful and successful AMB therapeutic outcomes, respectively. A. fumigatus
204305 was purchased from the American Type Culture Collection (ATCC). Species
designations of A. fumigatus were confirmed by observations of macroscopic and
microscopic characteristics during growth on Czapek-Dox agar (137). All stocks were
maintained in vials of sterile water at 4º C.
Antifungal Agents
AMB (Sigma A-9528) and ITC (Research Diagnostics Inc., Flanders, NJ, cat. no.
R51211) were purchased in powdered form. VRZ was generously provided by Pfizer,

118
Inc. (UK). Stocks of 1600 µg/ml were prepared for each drug in dimethyl sulfoxide
(DMSO) (Sigma D-2650) and stored at -80°C for up to 6 months.
mRSA and NCCLS M38-A Testing
Antifungal Drug Preparation Serial twofold dilutions of each drug were prepared
in DMSO to achieve a drug concentration range of 3 to 1600 µg/ml. Each DMSO
dilution was then diluted 1:50 in 0.4% glucose RPMI 1640 to achieve a final 2x drug
concentration range of 0.06 to 32 µg/ml. Both drug-free growth and glucose RPMI
controls were also prepared, containing the same ratio of DMSO to 0.4% RPMI 1640 as
the 2x drug dilutions.
Microwell Plate Preparation Each mRSA and NCCLS M38-A test was performed
in duplicate in 96 well round bottom plates (Costar, Corning, NY, cat. no. 3799) with
each row, comprised of 12 wells, corresponding to one susceptibility test. All testing was
performed three times, in duplicate. Wells 1-10 were inoculated with either 100 µl of the
2 x AMB, ITC, or VRZ dilution ranges (0.06 to 32 µg/ml). Wells 11 and 12, the
drug-free growth control and glucose control, respectively, were inoculated with 100 µl
of 0.4% glucose-DMSO RPMI 1640. A. fumigatus ATCC 204305 was tested in
duplicate on every plate as a drug control. Plates were prepared on the day of use and
stored at 4º C until needed.
Conidial Inoculum Preparation Isolates were cultured on Sabouraud glucose agar
(SAB) (BBL, Cockeysville, MD, cat. no. 211584) slants at 30°C for 3 days. After

119
flooding with glucose deficient RPMI 1640, the slant surface was gently scraped with a
sterile wooden applicator stick. Once the hyphal fragments were allowed to settle for
approximately 15 min, the conidial suspension was collected and adjusted with glucose
deficient RPMI 1640 to an optical density (OD530nm) of 0.11. The 0.11 OD530nm conidial
inoculum of ATCC 204305 was diluted 1:50 with glucose deficient RPMI for NCCLS
M38-A testing. Viability of each conidial suspension was determined by plating 0.1ml of
the 0.11 OD530 conidial inoculum, diluted 1:10,000, on SAB plates and incubating at 37º
C.
mRSA assay The microtiter plates were removed from 4º C and allowed to reach
room temperature. The mRSA was initiated by inoculating wells 1-11 with 100 µl of
0.11 OD530nm conidial inoculum, well 12 with 100 µl glucose deficient RPMI, and
incubation at 35-37º C. At 16h, residual glucose levels were detected by addition of 50
µl of an enzyme color mix comprised of 0.6 M sodium phosphate buffer (pH 6.0), 360
µg/ml of 4-amino antipyrine (4-AAP) (Sigma A4382) , 490 µg/ml of N-ethyl-N-
sulfopropyl-m-toluidine (TOPS) (Sigma E8506), 0.68 U/ml horseradish peroxidase
(Sigma P8415), and 0.4 U/ml glucose oxidase (ICN Biochemicals, Aurora, OH, cat. no.
195196) to each well. At 20 min, the color intensity was measured at OD550nm with a
reference reading of OD655nm in a plate reader (Benchmark Plus, Biorad, Hercules, CA).
mRSA Antifungal Susceptibility Curves and MIC Endpoint Determination The
percent residual glucose of each test well was calculated by comparing the OD550nm value
of the test well with the OD550nm of the glucose control well based on the following

120
equation: (OD550nm of test well / OD550nm of glucose control well) X 100. Antifungal
susceptibility curves were generated for each RSA by plotting the percent residual
glucose values (y-axis) against the appropriate AMB or ITC concentrations (x-axis).
The resulting detection interval contained an upper and lower limit represented,
respectively, by the highest concentration of antifungal drug and the drug-free growth
control. AMB mRSA MIC endpoint determinations were defined as the lowest drug
concentration having a percent residual glucose value within the top 10% of the detection
interval. The ITC and VRC mRSA MIC endpoints were defined as the lowest drug
concentration corresponding to a residual glucose value within the top 20% of the
detection interval only if the detection interval was composed of a discernable upper
plateau, steep decline, and lower plateau, and the highest concentration of ITC or VRC
(16 µg/ml) had a corresponding residual glucose value of ≥ 80%. If these conditions
were not met, the ITC or VRC mRSA MIC was interpreted as >16 µg/ml.
NCCLS M38-A Testing and MIC Determination
The NCCLS M38-A assay was initiated by inoculating wells 1-11 with 100 µl of
the 1:50 0.11 OD530nm conidial inoculum of ATCC 204305, well 12 with 100 µl of
glucose deficient RPMI and incubation at 35-37º C. Although the AMB and ITC
dilutions were prepared in 0.4% glucose RPMI and the conidial inocula were prepared in
glucose deficient RPMI, the final concentration of glucose was 0.2% at the time of
incubation in accordance with M38-A procedures. NCCLS MIC values were determined
by visual inspection at 48 h using a mirror plate reader (Cooke Engineering Co.,
Alexandria, VA) according to NCCLS M38-A guidelines (142) with AMB, ITC, and

121
VRC MIC endpoint values designated as the lowest drug concentration preventing
growth.
hRSA Testing
Antifungal Drug Preparation Serial twofold dilutions of each drug were prepared
in DMSO to achieve a concentration range of 1.3 to 656 µg/ml.
Microtiter Plate Preparation 96-well microtiter plates were prepared by adding
100µl of 0.4% glucose RPMI to wells in columns 1-12. Plates were prepared on the day
of use and stored at 4º C until needed.
Hyphal Inoculum Preparation A 0.11 OD530nm conidial inoculum was prepared
with each strain as described in mRSA testing. Hyphal inocula were prepared by diluting
the 0.11 OD530nm conidial inoculum 1:10, 1:50, 1:100, 1:200, and 1:1000 with glucose
deficient RPMI. After inoculating 100 µl of appropriate conidial inoculum into wells
1-11 (1-10, test wells; 11, growth control) and 100 µl of glucose deficient RPMI into well
12 (glucose control), the plates were incubated at 35-37º C for 8, 12 or 25 h.
Drug Application Control Immediately before initiating the hRSA, the 12 h
hRSA plates were removed from the incubator and the hRSA drug application control
(ATCC 204305) set-up in duplicate by adding 100 µl of a 1:50 0.11 OD530nm conidial
inoculum to wells 1-11 (1-10, test wells; 11, growth control) and 100 µl of glucose-
deficient RPMI to well 12 (glucose control) of the two bottom rows of each hRSA plate.

122
The drug application control wells were also inoculated with 100 µl of 0.4% glucose
RPMI.
hRSA The hRSA was initiated by inoculating 12 h hyphae and ATCC 204305
test wells with 5 µl of the 41x AMB, ITC, or VRZ dilution range (656 down to 1.3
µg/ml), resulting a final concentration range of 0.03 to 16 µg/ml, and growth control and
glucose control wells with 5 µl of DMSO. Plates were sealed with tape and shaken at
150 rpm for 15 min. After incubating at 35-37º C for 24 or 48 h, plates were removed
and 50 µl of the enzyme color mix (same composition as mRSA) added to each well. At
20 min, color intensity was measured at OD550nm with a reference reading of OD655nm in a
plate reader.
hRSA Antifungal Susceptibility Curves and MIC Endpoint Determination The
percent residual glucose of each test well was calculated as described in mRSA testing.
Antifungal susceptibility curves were generated for each RSA by plotting the percent
residual glucose values (y-axis) against the appropriate AMB or ITC concentrations (x-
axis). The resulting detection interval contained an upper and lower limit represented,
respectively, by the highest concentration of antifungal drug and the drug-free growth
control. AMB hRSA MIC endpoint determinations were defined as the lowest drug
concentration having a percent residual glucose value within the top 10% of the detection
interval. The ITC and VRC hRSA MIC endpoints were defined as the lowest drug
concentration corresponding to a residual glucose value within the top 20% of the
detection interval only if 1) the detection interval was composed of a discernable upper

123
plateau, steep decline, and lower plateau, and 2) the highest concentration of ITC or VRC
(16 µg/ml) had a corresponding residual glucose value of ≥ 80%. If these conditions
were not met, the ITC or VRC mRSA MIC was interpreted as >16 µg/ml.
Statistics Significant differences between mRSA and hRSA AMB, ITC, or VRZ
MIC values were determined by the Student t-test. A P-value < 0.05 was considered
significant.
Results
Optimal Hyphal Inoculum Conditions
Incubation Period for Hyphal Development The incubation time necessary for
development of hyphae from a conidial inoculum was determined by incubating 1:1,
1:10, 1:100, and 1:1000 dilutions of 0.11 OD530nm conidial inocula of A. fumigatus NCPF
strains 7101, 7100, 7098, and 7097 at 35-37º C and monitoring hyphal development by
light microscopy at 8, 12, and 25 h (Figure 43). By 8 h, conidia had germinated and
formed immature hyphae (germ tubes) (Fig. 43A). Small aggregates of mature hyphae
(hyphae length greater than three times conidial diameter) were observed by 12 h (Figure
43B) with subsequent development of thick hyphal mats on both the fluid surface and
microwell walls by 25 h. Similar hyphal development was observed with each strain,
regardless of the conidial concentration tested (data not shown). A 12 h incubation
period was chosen for subsequent experiments as mature hyphae were observed by this
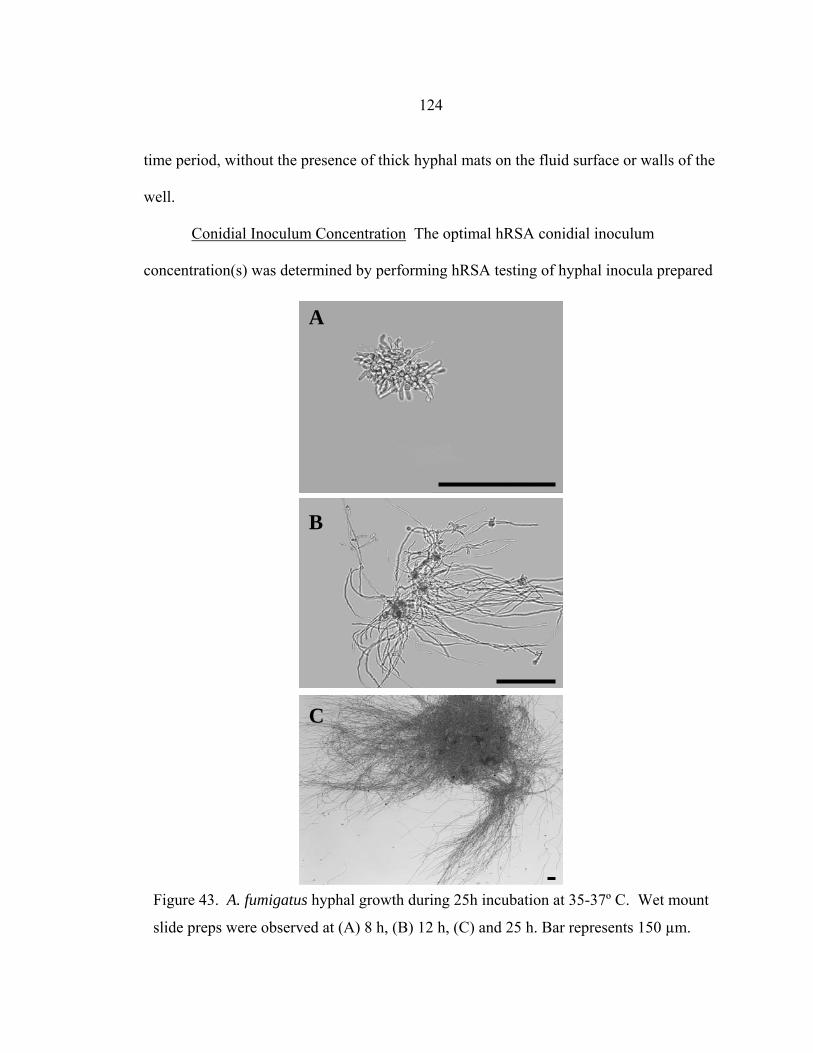
124
time period, without the presence of thick hyphal mats on the fluid surface or walls of the
well.
Conidial Inoculum Concentration The optimal hRSA conidial inoculum
concentration(s) was determined by performing hRSA testing of hyphal inocula prepared
A
C
B
Figure 43. A. fumigatus hyphal growth during 25h incubation at 35-37º C. Wet mount
slide preps were observed at (A) 8 h, (B) 12 h, (C) and 25 h. Bar represents 150 µm.

125
from 1:1, 1:10, 1:50, 1:100, 1:200, and 1:1000 dilutions of the 0.11 OD530nm conidial
inocula of each A. fumigatus strain. At 24 h, hRSA MIC values were not consistently
reproducible in these experiments (data not shown), whereas a 48 h incubation resulted in
consistent values and was, therefore, chosen as the incubation period for all subsequent
hRSA experiments. The AMB, ITC, and VRC MIC values of all strains were influenced
by conidial inoculum size, with increasing size corresponding to higher MIC values
Table 16. RSA hyphae AMB, ITC, and VRC MIC value ranges at 48 ha
0.11 OD530 C.I. Dilution
Strain Number
Hyphae AMB MIC Range
Hyphae ITC MIC Range
Hyphae VRC MIC Range
1:1 1:10 1:50 1:100 1:200 1:1000
>16 µg/ml 2 0.5 – 1 0.5 – 1 0.25 0.125 – 0.25
>16 µg/ml 0.25 – 0.5 0.125 – 0.25 0.125 – 0.25 0.125 – 0.25 0.125 – 0.25
>16 µg/ml 0.25 – >16 0.25 – 0.5 0.25 0.25 0.25
1:1 1:10 1:50 1:100 1:200 1:1000
4 – >16 1 – 2 0.5 0.5 – 1 0.25 0.25
>16 >16 >16 >16 >16 >16
>16 2 1 1 1 1
NCPF 7098 NCPF 7100 NCPF 7101 NCPF 7097
1:1 1:10 1:50 1:100 1:200 1:1000
>16 4 0.5 – 1 0.5 – 1 0.5 0.25 – 0.5
2 – >16 0.5 0.25 0.125 – 0.25 0.125 – 0.25 0.125 – 0.25
8 – >16 0.5 – 1 0.25 – 0.5 0.25 – 0.5 0.25 – 0.5 0.25
>16 4 – 8 2 1 0.5 – 1 0.5 – 1
>16 0.5 – 1.0 0.25 – 0.5 0.125 0.125 0.125
2 – >16 0.5 0.5 0.5 0.25 – 0.5 0.25
1:1 1:10 1:50 1:100 1:200 1:1000
a Testing performed three times, in duplicate.
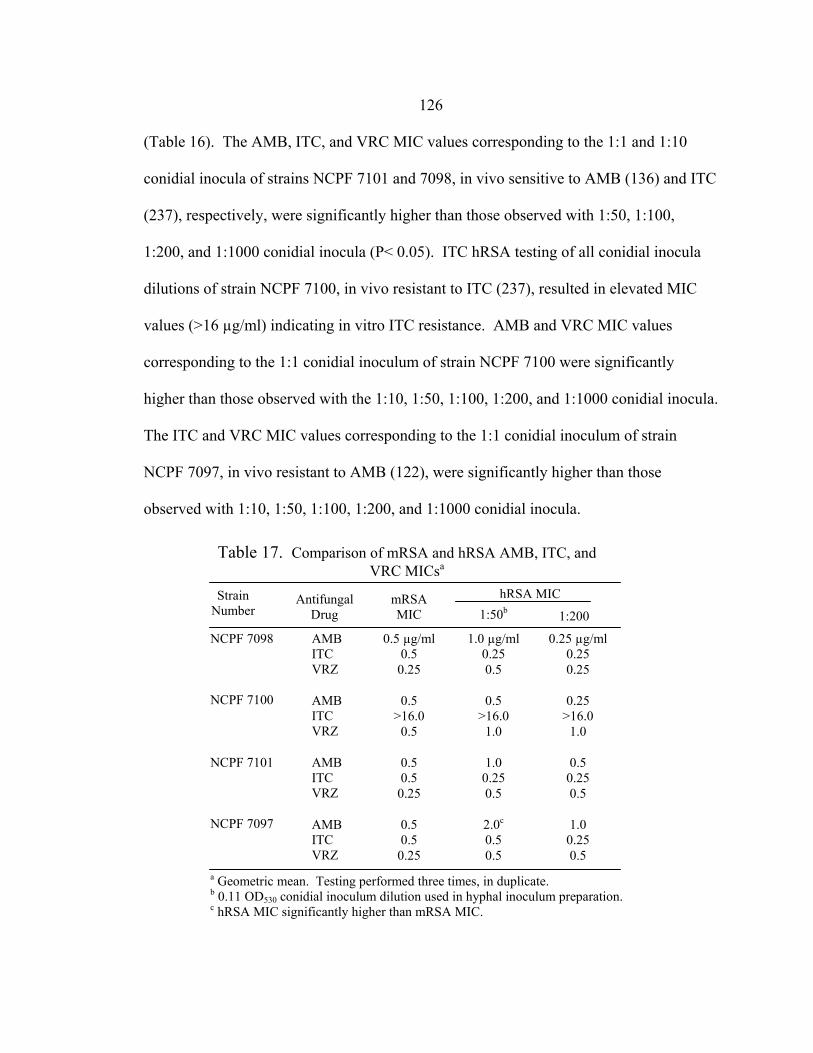
126 (Table 16). The AMB, ITC, and VRC MIC values corresponding to the 1:1 and 1:10
conidial inocula of strains NCPF 7101 and 7098, in vivo sensitive to AMB (136) and ITC
(237), respectively, were significantly higher than those observed with 1:50, 1:100,
1:200, and 1:1000 conidial inocula (P< 0.05). ITC hRSA testing of all conidial inocula
dilutions of strain NCPF 7100, in vivo resistant to ITC (237), resulted in elevated MIC
values (>16 µg/ml) indicating in vitro ITC resistance. AMB and VRC MIC values
corresponding to the 1:1 conidial inoculum of strain NCPF 7100 were significantly
higher than those observed with the 1:10, 1:50, 1:100, 1:200, and 1:1000 conidial inocula.
The ITC and VRC MIC values corresponding to the 1:1 conidial inoculum of strain
NCPF 7097, in vivo resistant to AMB (122), were significantly higher than those
observed with 1:10, 1:50, 1:100, 1:200, and 1:1000 conidial inocula.
Strain Number
Table 17. Comparison of mRSA and hRSA AMB, ITC, and VRC MICsa
1:200
hRSA MIC Nnnnnnnnnnnnn1:50b
Antifungal Drug
mRSA MIC
a Geometric mean. Testing performed three times, in duplicate. b 0.11 OD530 conidial inoculum dilution used in hyphal inoculum preparation. c hRSA MIC significantly higher than mRSA MIC.
1.0 µg/ml 0.25 0.5
0.5 >16.0
1.0
1.0 0.25 0.5
2.0c 0.5 0.5
0.25 µg/ml 0.25 0.25
0.25 >16.0
1.0
0.5 0.25 0.5
1.0 0.25 0.5
NCPF 7098 NCPF 7100
AMB ITC VRZ
AMB ITC VRZ
AMB ITC VRZ
NCPF 7101 NCPF 7097
AMB ITC VRZ
0.5 µg/ml 0.5
0.25
0.5 >16.0
0.5
0.5 0.5
0.25
0.5 0.5
0.25

127 Comparison of Conidial and Hyphal MICs The mRSA and hRSA (1:50 and
1:200 dilutions of 0.11 OD530nm conidial inocula) AMB, ITC, and VRC MIC values of
each strain are shown in Table 17. With one exception, hRSA AMB, ITC, and VRC MIC
values were within a single two-fold dilution of AMB, ITC, and VRC MIC values
obtained with the mRSA. The hRSA AMB MIC value of NCPF 7097, obtained with a
1:50 0.11 OD530nm conidial inoculum, was four-fold higher than the AMB MIC value
obtained by the mRSA.
Discussion
The goal of this study was to compare the AMB, ITC, and VRC susceptibilities of
A. fumigatus conidia and hyphae. This was accomplished by modifying the mRSA,
which utilizes conidial inocula, to facilitate susceptibility testing of hyphal inocula.
mRSA factors requiring modification included inoculum preparation, incubation time,
and MIC endpoint determination.
There are no guidelines for preparing a standardized Aspergillus hyphal inoculum
for broth microdilution susceptibility testing. Pujol (129), Manavathu (128), and Espinel
–Ingroff (130) et al. have prepared hyphal inocula by inoculating a single volume of
growth medium broth (Czapek, peptone-yeast extract-glucose, or RPMI, respectively)
with a standardized conidial suspension and incubating, with or without shaking, until
hyphae developed. The broth was next vortexed, to fragment the hyphae, and
standardized by CFU/ml or optical density. A limitation of this method is that the hyphae
are randomly fragmented by vortexing, potentially resulting in batch-to-batch differences
128
in the amount or length of hyphae in the hyphal inocula and physical damage to the
hyphae that may affect the viability or drug susceptibility of hyphae (256). In contrast,
Lass-Florl (132, 134, 253) et al., prepared hyphal inocula by inoculating 96-well plates
with a standardized conidial inoculum, incubating to allow formation of hyphae, then
washing and refilling the wells with fresh growth medium containing antifungal drug.
While this method uses non-fragmented hyphae, the washing step may be problematic.
During hyphal formation, hyphae may attach to the bottom and sides of the well as well
as initiate formation of a hyphal mat on the fluid surface. As Lass-Florl allowed 16-22 h
for hyphal formation, a sufficient time for early development of a hyphal mat on the fluid
surface, well washing may have resulted in removal of the hyphal mat and other hyphae
loosely bound to well walls. As both methods are problematic, I chose a third method of
hyphal inoculum preparation.
Like Lass-Florl, 100 µl of conidial inoculum was inoculated into 96-well plates
containing 100 µl of RPMI and incubated at 35-37º C to allow formation of hyphae. I
chose an incubation time of 12 h for hyphal formation (Fig. 43) as hyphae were still
young germ tubes at 8 h (Fig. 43A) and because I was concerned that hyphal mat growth
on the fluid surface was too extensive at 25 h (Fig. 43C), possibly interfering with drug
addition. To retard evaporation during the initial 12 h incubation, I sealed the plate edges
with tape, resulting in evaporation of ≤10 µl in any given well (data not shown). Instead
of washing the wells immediately after the 12 h incubation, a small volume (5 µl) of drug
was added to the existing media in each well, leaving the hyphae undisturbed. By
visually examining wells containing 16 µg/ml AMB (an antifungal drug with yellow
129
pigmentation), I determined that antifungal drug could be evenly dispersed in each well
by shaking plates at 150 rpm for 15 min. The plates were then incubated for an
additional 48 h, with residual glucose levels being determined by the same methodology
used in mRSA testing. To confirm that differences between mRSA and hRSA MICs
were not due to differences in each assay’s method of drug addition, I included a drug
addition control in hRSA testing by inoculating the 1:50 0.11 OD530nm conidial inoculum
of ATCC 204305 to the bottom two rows of each hRSA plate prior to drug addition. The
48 h AMB, ITC, and VRC MICs of this drug addition control were equal to or within one
two-fold dilution of those obtained with 16 h mRSA testing and 48 h NCCLS M38-A
testing (data not shown). As I consistently observed a non-significant ±1 two-fold
dilution MIC difference in mRSA and NCCLS M38-A testing, I concluded that there
were no significant differences between MICs obtained by the mRSA and hRSA methods
of drug addition.
To ensure the accuracy of our data interpretation, I optimized hRSA testing
factors using clinical A. fumigatus strains with documented clinical and therapeutic
patient histories. The optimal range of conidial inoculum concentrations for each of these
clinical strains corresponded to in vitro MICs that were non-dose dependent (not affected
by conidial inoculum concentration), differing in value by no more than two, two-fold
dilutions, and reflective of the documented in vivo AMB or ITC susceptibilities of the
strain. A. fumigatus strains NCPF 7101 and 7098 were obtained from aspergillosis
patients who responded to AMB and ITC therapy, respectively (136, 237). The AMB
MICs corresponding to the 1:1 and 1:10 conidial inocula of strain NCPF 7101 and ITC

130
MICs corresponding to the 1:10 conidial inocula of strain NCPF 7098 did not indicate in
vitro sensitivity to AMB or ITC, respectively, and increased in a concentration dependent
manner (Table 16). The 1:50 to 1:1000 dilutions of NCPF 7101 0.11 OD530nm conidial
inocula and 1:10 to 1:1000 dilutions of NCPF 7098 0.11 OD530nm conidial inocula were
considered optimal as the corresponding MICs indicated in vitro sensitivity to AMB and
ITC, respectively, and were not dose-dependent (± 2 dilutions). NCPF 7097 was isolated
from a patient that initially responded to AMB therapy but later relapsed (136), while
NCPF 7100 was obtained from a patient that did not respond to primary ITC therapy
(237). Although the 1:1, 1:10, and 1:50 0.11 OD530nm conidial inocula of NCPF 7097
corresponded to MICs that are equal to or greater than Lass Florl’s presumptive AMB
breakpoint value of ≥ 2 µg/ml (123), they are dose dependent and therefore artifactual.
As AMB resistance has not been consistently demonstrated in vitro, it was not surprising
that the majority of the optimal conidial concentrations (1:50, 1:100, 1:200, 1:1000 0.11
OD530nm) corresponded to AMB MICs that indicated AMB sensitivity. The ITC MICs of
NCPF 7100 consistently indicated in vitro ITC resistance, regardless of conidial
inoculum concentration, indicating that all conidial inocula concentrations could be
considered optimal. The final range of conidial inoculum concentrations common to the
optimal conidial inoculum concentration range of each strain included the 0.11 OD530nm
dilutions 1:50, 1:100, 1:200, and 1:1000.
As VRC was only recently approved for use, I was unable to obtain in vivo VRC-
sensitive or -resistant strains to optimize VRC hRSA conditions. This may not be
necessary, however, as previous testing has shown that optimal mRSA VRC conditions

131
are identical to optimal mRSA ITC conditions, with verification of these conditions as
optimal by demonstrating that the 16 h mRSA VRZ MICs were equal to or within one
two-fold dilution of those obtained by NCCLS M38-A testing at 48 h (data not shown).
By analyzing the VRC MICs obtained with a range of conidial inocula concentrations
(Table 16), I was able to determine that VRC MICs were dose-dependent, with 1:10
and/or 1:1 0.11 OD530nm conidial inocula producing erroneously high MICs and 1:50-
1:1000 0.11 OD530nm conidial inocula producing MICs indicating VRC sensitivity and
differing by no more than three two-fold dilutions. The latter dilutions were consistent
with those conidial inocula concentrations considered optimal for AMB and ITC testing.
To determine whether hyphae sensitivity to AMB, ITC, and VRC was
significantly different to that of conidia, I compared mRSA AMB, ITC, and VRC MICs
with hRSA MICs (1:50 and 1:200 conidial inoculum dilutions) (Table 17). With one
exception, I found that there were no significant differences between mRSA and hRSA
MICs. The exception was the AMB MIC corresponding to the 1:50 0.11 OD530nm
conidial inoculum of NCPF 7097, which was significantly higher (p-value <0.05) than
the mRSA AMB MIC. Either the hRSA 1:50 0.11 OD530nm conidial inoculum is too
concentrated and corresponds to an artificially high MIC or AMB resistance can be
detected more readily with hyphae than conidia. As the hRSA 1:200 0.11 OD530nm AMB
MIC was not significantly greater than the mRSA AMB MIC, it is more probable that the
former is correct, but additional hRSA and mRSA testing of other clinical AMB-resistant
strains of A. fumigatus should be tested to confirm this.

132 These data show that hyphae and conidia have similar sensitivities to AMB, ITC,
and VRC, suggesting that either fungal form can be used to preparing inocula for
antifungal susceptibility testing. As hRSA testing requires 44 more hours than mRSA
testing, I recommend the continued use of the conidial inocula in the mRSA. Because a
conidial inoculum was necessary for performing the hRSA, a future goal is to develop
another hRSA protocol that utilizes a standardized hyphal inoculum prepared with
hyphae instead of conidia. This version of the hRSA will be suitable for testing those
clinical isolates which can not be tested in the mRSA, as they do not sporulate in vitro.

133
CHAPTER 5
SIDE-BY-SIDE COMPARISON OF AMPHOTERICIN B, ITRACONAZOLE, AND VORICONAZOLE MINIMUM INHIBITORY CONCENTRATION VALUES OBTAINED BY
MOLD RSA AND ETEST ANTIFUNGAL SUSCEPTIBILITY TESTING
Introduction
The National Committee for Clinical Laboratory Standards (NCCLS) M38-A
assay is the standardized assay most frequently used in antifungal susceptibility testing of
filamentous fungi. Unfortunately, the NCCLS M38-A assay is burdensome and time-
consuming, prompting investigators to find alternative methods. The Elipsometer Test
(Etest) is a patented method for the quantitative determination of antimicrobial minimum
inhibitory concentration (MIC) values. The mold Etest is similar to other agar-diffusion
based susceptibility tests, except that the disk is replaced by a plastic strip which is
impregnated with a gradient of antifungal drug (149).
Although numerous studies have been conducted to determine the percent
agreement between the NCCLS M27-A2 and Etest MICs of Candida and Cryptococcus
spp. (152, 154, 155, 157-160, 257-261), those determining the percent agreement
between NCCLS M38-A and Etest MICs of Aspergillus spp. have been more limited
(149-151, 156, 262, 263). Overall, the results of these Aspergillus studies have
demonstrated that amphotericin B (AMB), itraconazole (ITC), voriconazole (VRC), and
posaconazole (PCZ) NCCLS M38-A MICs have moderate to excellent agreement (60-
100%) with Etest MICs, with results depending on Etest factors such as agar medium and
incubation time. As the 16 h mold Rapid Susceptibility Assay (mRSA) AMB, ITC, and

134 VRC MICs have been shown to have an excellent agreement (100%) with NCCLS M38-
P and M38-A MICs (Chapters 2 and 4, respectively), I determined whether mRSA AMB,
ITC, and VRC MICs would also demonstrate a high percentage agreement with Etest
MICs.
Materials and Methods
Reagents
For mRSA testing, preparations of RPMI 1640 with or without 0.4% glucose were
buffered with 0.165 M 3-(N-morpholino)-propanesulfonic acid and adjusted to pH 7.0
with 10 N NaOH. 90 or 150 mm petri plates containing 2.0% glucose RPMI 1640 agar
(R63165; Angus Biochemicals, Niagara Falls, NY) were used for Etest testing.
Fungal Strains
A. fumigatus testing strains included the in vivo AMB-sensitive and –resistant
strains 7101 and 7097, respectively, and the in vivo ITC-sensitive and –resistant strains
7098 and 7100, respectively (136, 237). C. parapsilosis ATCC 22019 was used as an
Etest drug control. All A. fumigatus stocks were maintained in vials of sterile water at 4º
C. The C. parapsilosis stock was maintained in a vial of sterile water at room
temperature.
Antifungal Drugs and Preparation
AMB, ITC and VRC Etest strips were purchased from AB Biodisk NA, Inc. and
stored at -20º C until use. AMB and ITC were purchased from Sigma and Research

135
Diagnostics Inc., respectively, while VRC was generously provided by Pfizer (UK).
Stocks of 1600 µg/ml were prepared in dimethyl sulfoxide (DMSO) and stored at -80º C
for up to six months. For mRSA testing, serial two-fold dilutions were prepared and
loaded into the wells of 96-well microwell plates as described in the “Antifungal Agents
and Dilutions” and “Microwell Plate Preparation” sections of Chapter 2. mRSA drug
plates were prepared on the day of use and stored at 4º C until use.
Inoculum Preparation
A. fumigatus isolates were cultured on Sabouraud agar slants at 30º C for 3 days.
C. parapsilosis ATCC 22019 was inoculated onto a GYEP plate and passaged twice at 24
h intervals. For mRSA and Etest testing, slants were flooded with glucose deficient
RPMI or sterile saline, respectively, and the slant surface scraped with a sterile applicator
stick. Once the hyphal fragments had settled (15 min), the upper conidial inoculum was
collected and adjusted with additional glucose deficient or saline to an optimal density
(OD530nm) of 0.11. NCCLS M38-A inocula were prepared by diluting the 0.11 OD530nm
conidial inocula 1:50 with additional glucose-deficient RPMI. The C. parapsilosis
inoculum was prepared by transferring yeast cells from 1 to 2 colonies on the 24 h GYEP
plate to glucose deficient RPMI and adjusting the optical density (OD530nm) to achieve a
density of 0.11. Etest and mRSA inocula were kept at 4º C until use.
Etest Assay and MIC Determination
Each 90 or 150 mm 2.0% glucose RPMI agar plate was inoculated by dipping a
sterile swab into the 0.11 OD530nm inoculum suspension, rolling the swab against the side
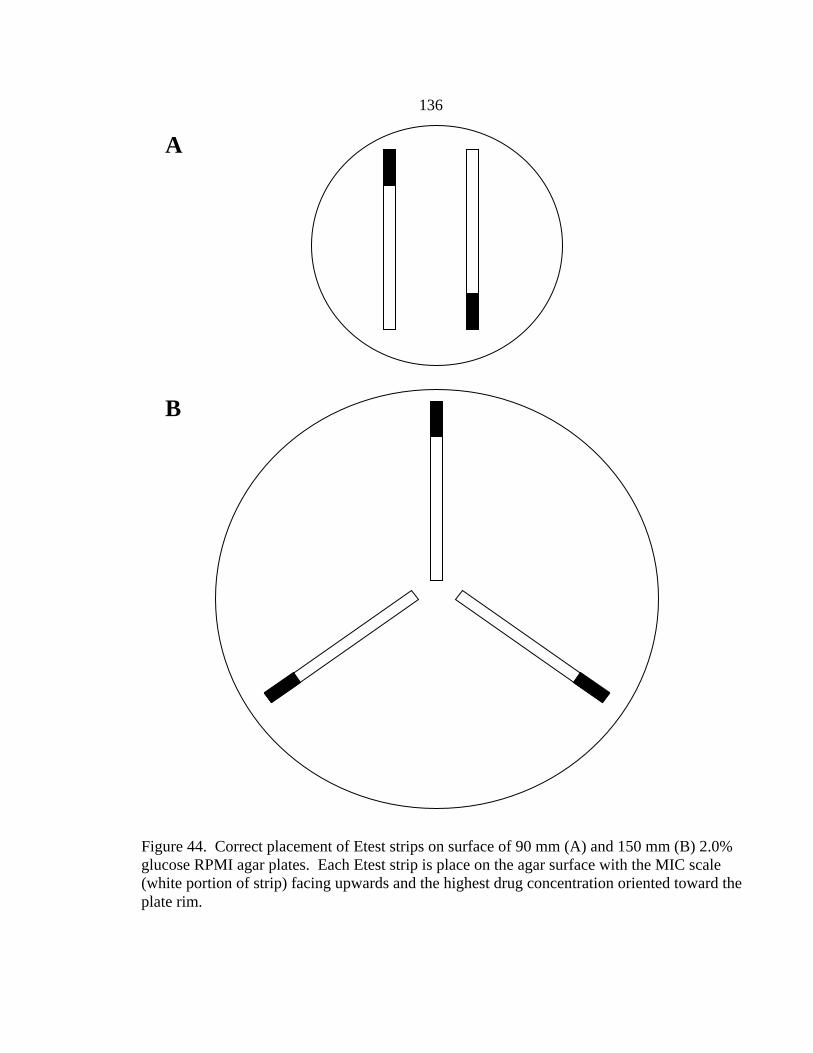
136
Figure 44. Correct placement of Etest strips on surface of 90 mm (A) and 150 mm (B) 2.0% glucose RPMI agar plates. Each Etest strip is place on the agar surface with the MIC scale (white portion of strip) facing upwards and the highest drug concentration oriented toward the plate rim.
B
A
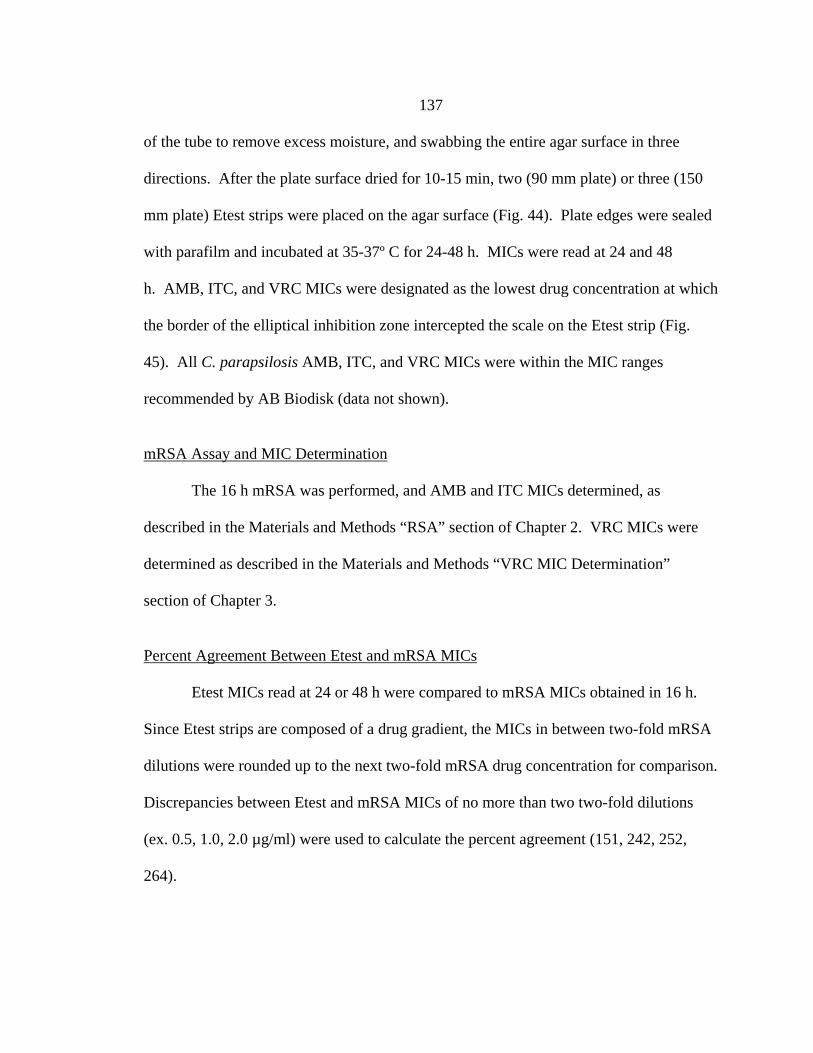
137 of the tube to remove excess moisture, and swabbing the entire agar surface in three
directions. After the plate surface dried for 10-15 min, two (90 mm plate) or three (150
mm plate) Etest strips were placed on the agar surface (Fig. 44). Plate edges were sealed
with parafilm and incubated at 35-37º C for 24-48 h. MICs were read at 24 and 48
h. AMB, ITC, and VRC MICs were designated as the lowest drug concentration at which
the border of the elliptical inhibition zone intercepted the scale on the Etest strip (Fig.
45). All C. parapsilosis AMB, ITC, and VRC MICs were within the MIC ranges
recommended by AB Biodisk (data not shown).
mRSA Assay and MIC Determination
The 16 h mRSA was performed, and AMB and ITC MICs determined, as
described in the Materials and Methods “RSA” section of Chapter 2. VRC MICs were
determined as described in the Materials and Methods “VRC MIC Determination”
section of Chapter 3.
Percent Agreement Between Etest and mRSA MICs
Etest MICs read at 24 or 48 h were compared to mRSA MICs obtained in 16 h.
Since Etest strips are composed of a drug gradient, the MICs in between two-fold mRSA
dilutions were rounded up to the next two-fold mRSA drug concentration for comparison.
Discrepancies between Etest and mRSA MICs of no more than two two-fold dilutions
(ex. 0.5, 1.0, 2.0 µg/ml) were used to calculate the percent agreement (151, 242, 252,
264).
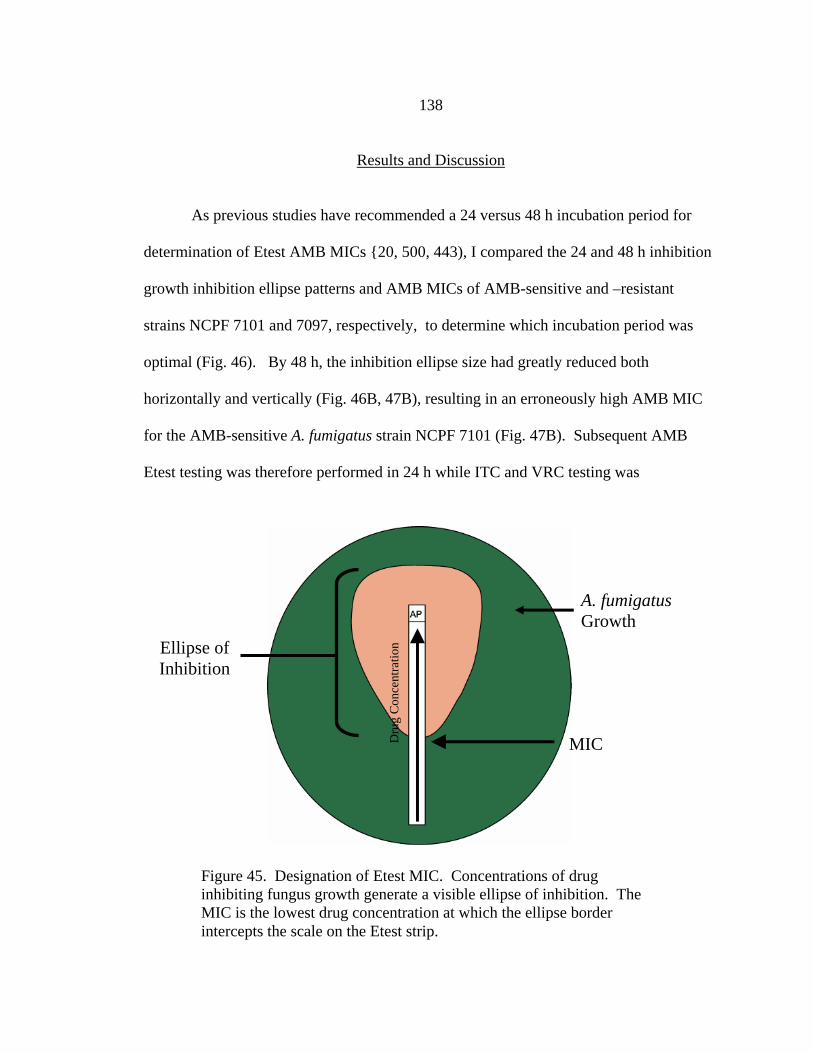
138
Results and Discussion
As previous studies have recommended a 24 versus 48 h incubation period for
determination of Etest AMB MICs {20, 500, 443), I compared the 24 and 48 h inhibition
growth inhibition ellipse patterns and AMB MICs of AMB-sensitive and –resistant
strains NCPF 7101 and 7097, respectively, to determine which incubation period was
optimal (Fig. 46). By 48 h, the inhibition ellipse size had greatly reduced both
horizontally and vertically (Fig. 46B, 47B), resulting in an erroneously high AMB MIC
for the AMB-sensitive A. fumigatus strain NCPF 7101 (Fig. 47B). Subsequent AMB
Etest testing was therefore performed in 24 h while ITC and VRC testing was
Ellipse of Inhibition
Dru
g C
once
ntra
tion
MIC
A. fumigatus Growth
Figure 45. Designation of Etest MIC. Concentrations of drug inhibiting fungus growth generate a visible ellipse of inhibition. The MIC is the lowest drug concentration at which the ellipse border intercepts the scale on the Etest strip.

139
Figure 46. Differences in 24 h (A) and 48 h (B) Etest AMB MICs of AMB-resistant A. fumigatus strain NCPF 7097. AMB MIC indicated by arrow.
A B
performed in 48 h.
All 24 and 48 h inhibition ellipses were clear (i.e. no trailing growth), with the
comparative widths of 48 h ellipses between drugs being VRC > ITC > AMB (Fig. 48).
The absence of trailing growth was not surprising as AMB, ITC, and VRC are fungicidal

140
against Aspergillus fumigatus. Also, the relative ellipse sizes between drugs can be
explained by the drugs’ molecular weights, with VRC and AMB having the smallest and
largest molecular weights, respectively.
Etest and mRSA AMB, ITC, and VRC MICs are shown in Table 18. The Etest
Figure 47. Differences in the 24 h (A) and 48 h (B) Etest AMB MICs of AMB-sensitive A. fumigatus strain NCPF 7101. AMB MIC indicated by arrow.
A B
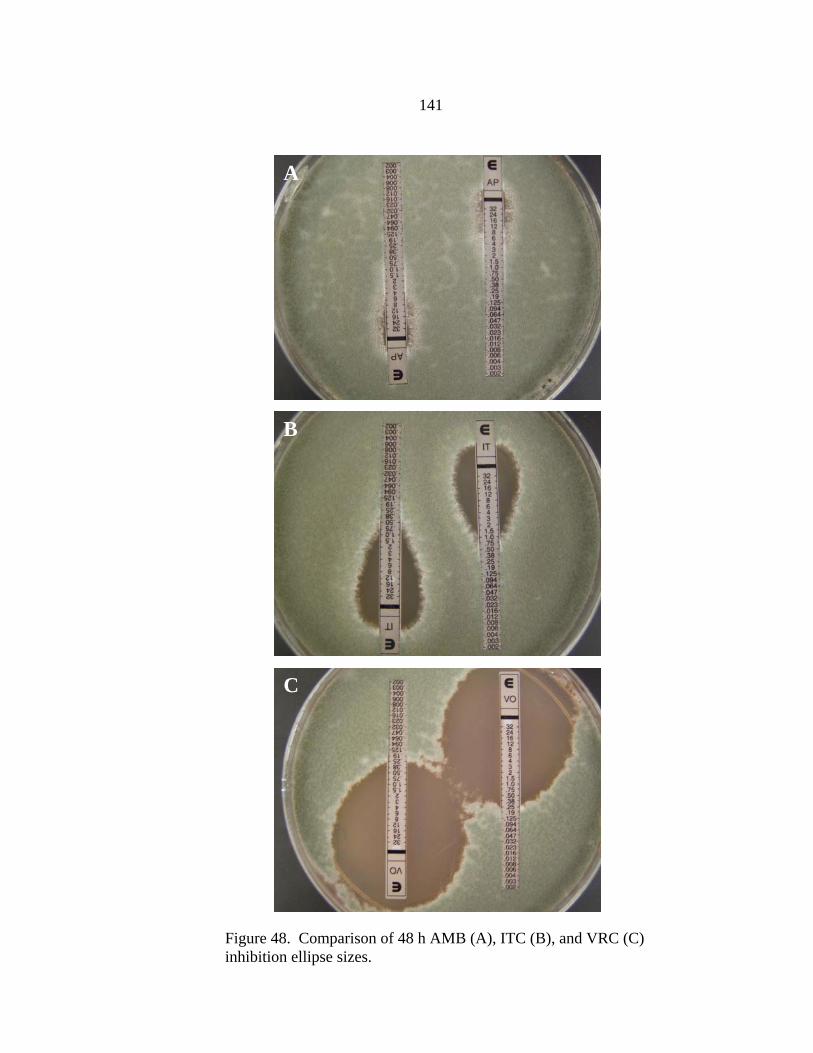
141
Figure 48. Comparison of 48 h AMB (A), ITC (B), and VRC (C) inhibition ellipse sizes.
C
B
A
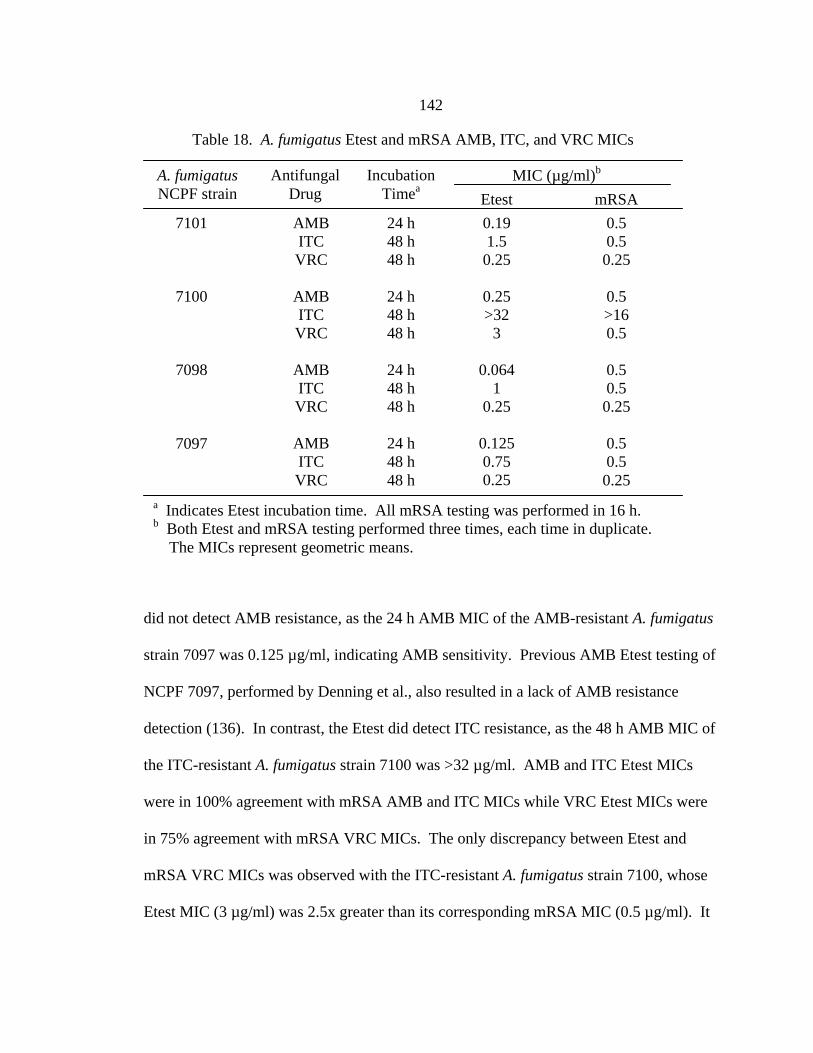
142
did not detect AMB resistance, as the 24 h AMB MIC of the AMB-resistant A. fumigatus
strain 7097 was 0.125 µg/ml, indicating AMB sensitivity. Previous AMB Etest testing of
NCPF 7097, performed by Denning et al., also resulted in a lack of AMB resistance
detection (136). In contrast, the Etest did detect ITC resistance, as the 48 h AMB MIC of
the ITC-resistant A. fumigatus strain 7100 was >32 µg/ml. AMB and ITC Etest MICs
were in 100% agreement with mRSA AMB and ITC MICs while VRC Etest MICs were
in 75% agreement with mRSA VRC MICs. The only discrepancy between Etest and
mRSA VRC MICs was observed with the ITC-resistant A. fumigatus strain 7100, whose
Etest MIC (3 µg/ml) was 2.5x greater than its corresponding mRSA MIC (0.5 µg/ml). It
a Indicates Etest incubation time. All mRSA testing was performed in 16 h. b Both Etest and mRSA testing performed three times, each time in duplicate. The MICs represent geometric means.
0.5 0.5 0.25
0.5 >16 0.5
0.5 0.5 0.25
0.5 0.5 0.25
A. fumigatus NCPF strain
Antifungal Drug
Incubation Timea
MIC (µg/ml)b
Etest mRSA 7101
7100
7098
7097
AMB ITC VRC
AMB ITC VRC
AMB ITC VRC
AMB ITC VRC
24 h 48 h 48 h
24 h 48 h 48 h
24 h 48 h 48 h
24 h 48 h 48 h
0.19 1.5 0.25
0.25 >32
3
0.064 1
0.25
0.125 0.75 0.25
Table 18. A. fumigatus Etest and mRSA AMB, ITC, and VRC MICs

143 is possible that the Etest VRC MIC is erroneously high. However, this seems improbable
as none of the ITC-sensitive A. fumigatus strains exhibited elevated Etest VRC MICs.
Instead, it seems more probable that the Etest is a more sensitive assay than the NCCLS
M38-A or mRSA assays in detecting VRC-ITC cross-sensitivity. VRC Etest testing of
additional ITC-resistant A. fumigatus strains will be necessary to resolve this issue.
In summary, A. fumigatus mRSA MICs demonstrated excellent agreement (92%)
with Etest MICs. In contrast to yeast testing (157, 158), mold Etest testing was unable to
detect AMB resistance, although the Etest did generated ITC MICs that could be used as
predictors of in vivo outcome. Despite the fact that the Etest is less cumbersome than the
mRSA, I still propose that the mRSA is a superior assay, as it generates objective MICs
in 16 h versus the subjective MICs generated by the Etest in 24 or 48 h.
145
CHAPTER 6
VALIDATION AND EXPANSION OF YEAST RSA
Introduction
The gold-standard method for yeast antifungal susceptibility testing is the
National Committee for Clinical Laboratory Standards (NCCLS) M27-A2 assay, which
provides amphotericin B (AMB), flucytosine (5FC), fluconazole (FLC), ketoconazole
(KET), itraconazole (ITC), posaconazole (POS), ravuconazole (RAV), and voriconazole
(VRC) minimum inhibitory concentration (MIC) values for Candida spp. (including C.
glabrata) and Cryptococcus neoformans within 48 and 72 h, respectively (135).
However, the NCCLS M27-A2 assay has major weaknesses, including subjective MIC
determination and extended incubation periods. The yeast Rapid Susceptibility Assay
(RSA) was developed in our laboratory to address these weaknesses, by providing
objective AMB and FLC MICs in 6 and 19 h, respectively, for C. albicans, C. tropicalis,
C. parapsilosis, and C. krusei isolates (145). Unfortunately, RSA testing conditions were
not optimized with clinical control strains, which compromises the validity of RSA MICs
as predictors of clinical outcome. Another current disadvantage of the RSA is that is
does not include testing of C. glabrata, a species which has rapidly increased in clinical
relevance in the past decade.
Clinical control strains are those isolated from patients with documented clinical
outcomes. In theory, strains obtained from patients with successful clinical outcomes
correspond to low MICs, while strains obtained from patients with clinical failure

146
correspond to high MICs. Clinical control strains are therefore useful in optimizing
antifungal susceptibility testing conditions because they ensure that that the in vitro MICs
are predictive of clinical outcome. Instead of using clinical control strains, RSA
optimized testing conditions using NCCLS M27-A2 recommended quality control (QC)
or reference strains: ATCC 24433 and ATCC 90028 (C. albicans); ATCC 750 (C.
tropicalis); ATCC 6258 (C. krusei); and ATCC 22019 and 90018 (C. parapsilosis) (135).
Although the ATCC database identifies these strains as clinical isolates, it does not
provide therapeutic or clinical outcome histories of the patients from which the strains
were isolated. These strains were chosen because the NCCLS M27-A MICs of these
strains were highly reproducible and available in the literature (265), which facilitated a
direct comparison between RSA MICs and published NCCLS M27-A MICs. Although
the yeast RSA can, in its current form, detect innate FLC resistance, as demonstrated by
the elevated RSA FLC MIC (32-64 µg/ml) of C. krusei ATCC 6258 (a species innately
resistant to FLC in vitro and in vivo), it does not guarantee that testing conditions are
optimized to detect acquired FLC resistance. By determining the yeast RSA FLC MICs
of FLC-resistant and –sensitive C. albicans clinical control strains, I will be able to
demonstrate whether the RSA, in its current form, has the capability of predicting FLC
resistance in vitro, and more importantly, in vivo.
The ability to determine C. glabrata FLC MICs by RSA testing is essential due to
the increasing frequency of mucosal and systemic candidiasis caused by C. glabrata in
the past decade (266). Due to the widespread and increased use of immunosuppressive
therapy and broad-spectrum antifungal therapy, C. glabrata is now the second most
147
frequent etiologic agent of candidiasis (11, 19, 20, 32, 216) in the Unites States. To
ensure that C. glabrata RSA FLC MICs are predictive of clinical outcome, I optimized
RSA testing conditions using C. glabrata clinical control strains that were isolated from
oropharyngeal candidiasis patients receiving head and neck cancer therapy at the Cancer
Therapy and Research Center in San Antonio (personal communication with Dr. Spencer
Redding). Optimized testing conditions were considered those producing MICs that
reflected the clinical outcome history of each strain.
Materials and Methods
Reagents
Preparations of RPMI 1640 without glucose or with 0.44% glucose were buffered
with 0.165 M 3-(N-morpholino)-propanesulfonic acid (MOPS) and adjusted to pH 7.0
with 10 N NaOH.
Fungal Strains
Six C. albicans and seven C. glabrata clinical strains were used as clinical
controls in RSA and NCCLS M27-A2 testing. Dr. Ted White provided C. albicans FH1
and FH5, FLC-susceptible and -resistant isolates, respectively, which were derived from
the same C. albicans strain causing invasive candidiasis in a bone marrow transplant
patient (267). Dr. Spencer Redding provided C. albicans strains 1 and 17 and C.
glabrata strains 6318, 6838, 6844, 6856, 6955, 6999, 7015, and 7048. C. albicans strains
1 and 17, FLC-susceptible and resistant, respectively, were derived from the same C.
albicans strain causing oropharyngeal candidiasis in an AIDS patient (268). Originally

148
isolated by Dr. David Stevens, Dr. Ted White also provided FLC-resistant C. albicans
strains 95-68 and 95-142, which are random clinical isolates (269). All FLC-resistant C.
albicans strains were previously confirmed as such by identification of resistance
mechanisms, including FLC efflux pumps and overexpression and/or DNA point
mutations of FLC target (269, 270). C. glabrata strains 6838, 6844, 6856, and 6955 were
sequentially obtained during the FLC treatment of a throat cancer patient with
oropharyngeal candidiasis (271). C. glabrata strains 6999, 7015, and 7048 were also
obtained sequentially during the FLC treatment of a throat cancer patient with
oropharyngeal candidiasis. C. glabrata strain 6318 was a random clinical isolate
(personal communication with Dr. Spencer Redding). C. krusei ATCC 6258 is a NCCLS
M27-A2 reference strain and was used as a FLC drug control for RSA and NCCLS M27-
A2 testing. Strains were confirmed as C. albicans, C. glabrata, or C. krusei by
ChromAgar and/or API testing.
Fluconazole Stock and Preparation
FLC was purchased in a powdered form. A stock of 1600 µg/ml was prepared in
sterile water and stored at -80º C for up to six months. For RSA testing, a serial two-fold
dilution of FLC was prepared in sterile water to achieve a concentration range of 2.5 to
1280 µg/ml. For NCCLS M27-A2 testing, each water dilution was diluted 1:10 in 0.44%
RPMI 1640 to achieve a final 2x drug concentration range of 0.25 to 128 µg/ml in 0.4%
glucose RPMI. For RSA testing, each water dilution was diluted 1:10 in 0.22% RPMI
1640 to achieve a final 2x drug concentration range of 0.25 to 128 µg/ml in 0.2% glucose
RPMI.
149 Microwell Plate Preparation
Each RSA and NCCLS M27-A2 test was performed in duplicate in 96 well round
bottom plates with each row, comprised of 12 wells, corresponding to one susceptibility
test. Wells 1-10 were inoculated with either 100 µl of the 2x FLC dilution range (0.25 to
128 µg/ml). Wells 11 and 12, the drug-free growth control and glucose control,
respectively, were inoculated with 100 µl of 0.4% glucose RPMI 1640. Plates were
prepared on the day of use and stored at 4º C until needed.
Inoculum Preparation
Yeasts were inoculated onto GYEP plates from room temperature water stocks
and passaged twice at 24 or 48 h intervals. Suspensions were prepared from 24 h
cultures. Cells from colonies were suspended in glucose deficient RPMI and the optical
density (OD530nm) adjusted to achieve a density of 0.11. Yeast viability was determined
by plating 0.1ml of a 1:10,000 dilution of the 0.11 OD530nm yeast inoculum of each strain
on GYEP plates, incubating at 35-37° C for 24 to 48 h, and calculating the CFU/ml.
The published optimal inoculum dilution range for C. albicans RSA FLC testing
is 1:512 to 1:8192 0.11 OD530nm. I chose to use the same inoculum concentration of
1:1000 0.11 OD530nm used in NCCLS M27-A2 testing, which was prepared by diluting
the 0.11 OD530nm yeast inoculum 1:50, then 1:20 with glucose deficient RPMI to achieve
a final concentration of 1 X 10³ to 5 X 10³ CFU/ml. C. glabrata RSA inocula were
prepared by diluting 0.11 OD530nm yeast inocula 1:2, 1:8, 1:128, 1:512, 1:1000 or 1:2048
with glucose deficient RPMI. C. albicans, C. glabrata, and C. krusei NCCLS M27-A2
inocula were prepared by diluting the 0.11 OD530nm conidial inoculum 1:50, then 1:20
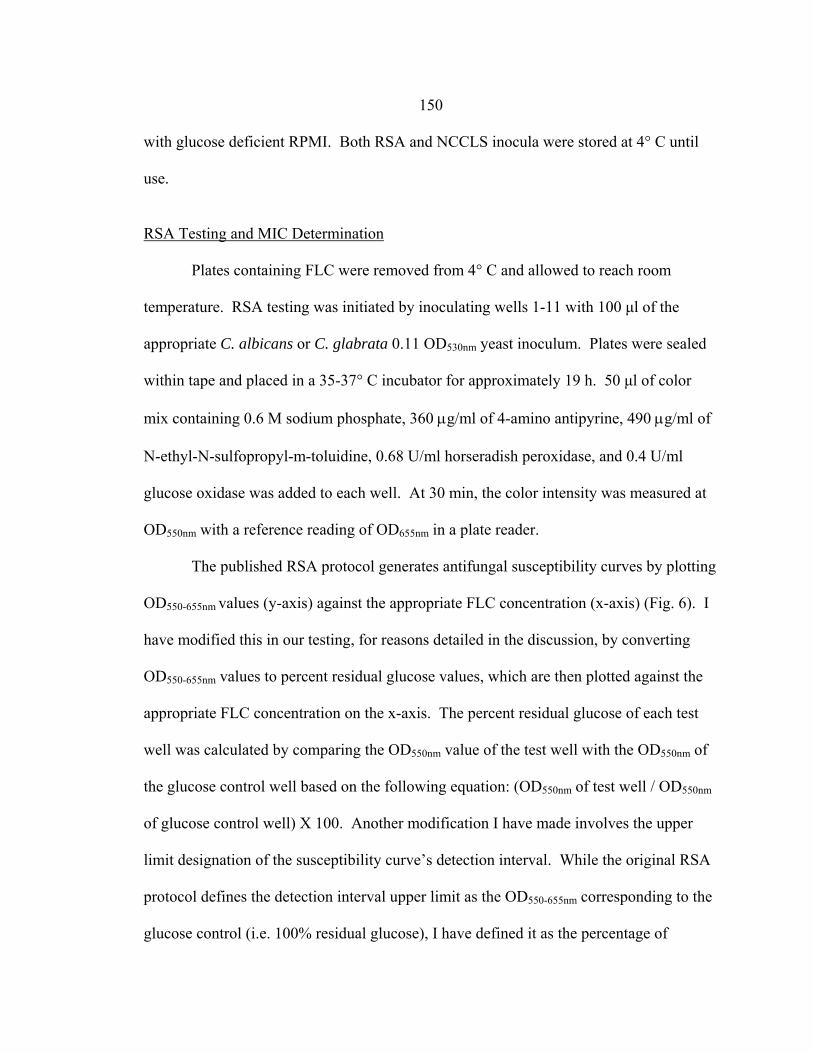
150 with glucose deficient RPMI. Both RSA and NCCLS inocula were stored at 4° C until
use.
RSA Testing and MIC Determination
Plates containing FLC were removed from 4° C and allowed to reach room
temperature. RSA testing was initiated by inoculating wells 1-11 with 100 µl of the
appropriate C. albicans or C. glabrata 0.11 OD530nm yeast inoculum. Plates were sealed
within tape and placed in a 35-37° C incubator for approximately 19 h. 50 µl of color
mix containing 0.6 M sodium phosphate, 360 µg/ml of 4-amino antipyrine, 490 µg/ml of
N-ethyl-N-sulfopropyl-m-toluidine, 0.68 U/ml horseradish peroxidase, and 0.4 U/ml
glucose oxidase was added to each well. At 30 min, the color intensity was measured at
OD550nm with a reference reading of OD655nm in a plate reader.
The published RSA protocol generates antifungal susceptibility curves by plotting
OD550-655nm values (y-axis) against the appropriate FLC concentration (x-axis) (Fig. 6). I
have modified this in our testing, for reasons detailed in the discussion, by converting
OD550-655nm values to percent residual glucose values, which are then plotted against the
appropriate FLC concentration on the x-axis. The percent residual glucose of each test
well was calculated by comparing the OD550nm value of the test well with the OD550nm of
the glucose control well based on the following equation: (OD550nm of test well / OD550nm
of glucose control well) X 100. Another modification I have made involves the upper
limit designation of the susceptibility curve’s detection interval. While the original RSA
protocol defines the detection interval upper limit as the OD550-655nm corresponding to the
glucose control (i.e. 100% residual glucose), I have defined it as the percentage of

151
residual glucose corresponding to the highest inhibitory concentration of FLC. The lower
limit definition remains the same, which is the percentage of residual glucose
corresponding to the drug-free growth control. C. albicans and C. glabrata FLC MICs
are designated as the lowest drug concentration in the upper 10% of the detection
interval. If the residual glucose percentage value corresponding to the upper limit of the
detection interval is below 80%, the FLC MIC is designated as >64 µg/ml.
NCCLS M27-A2 Assay and MIC Determination
Plates containing FLC were removed from 4° C and allowed to reach room
temperature. NCCLS M27-A2 testing was initiated by inoculating wells 1-11 with 100 µl
of C. albicans, C. glabrata, or C. krusei 1:1000 0.11 OD530nm yeast inoculum. Plates
were sealed within tape and placed in a 35-37° C incubator for approximately 48 h (46-52
h). Plates were removed and NCCLS 27-A2 FLC MICs determined by visual inspection
using a mirror plate reader according the NCCLS M27-A2 guidelines (121), with FLC
MIC endpoint values designated as the lowest FLC concentration reducing growth by
50% compared to the growth control.
C. albicans RSA FLC Testing
Results
Use of RSA Color Mix to Improve Objectivity of NCCLS M27-A2 FLC MICs
The visible growth of each C. albicans clinical strain immediately after the NCCLS M27-
A2 48 h incubation is shown in Figures 49A and 50A. According to NCCLS M27-A2
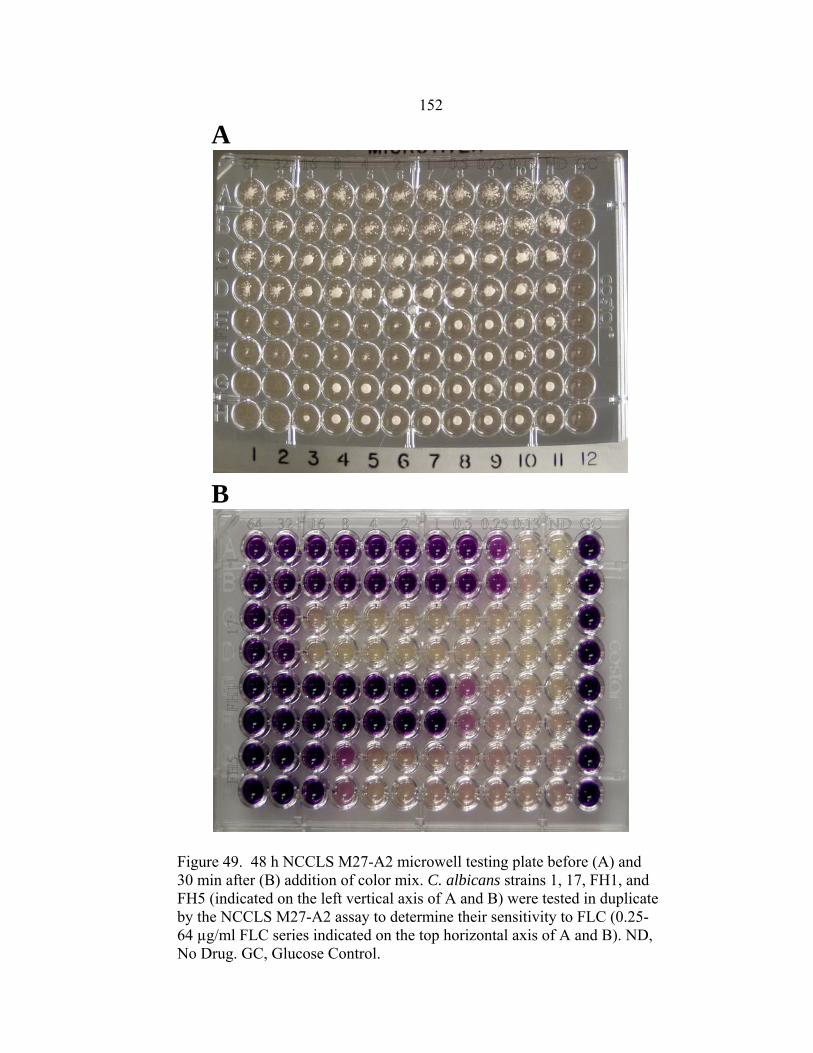
152
Figure 49. 48 h NCCLS M27-A2 microwell testing plate before (A) and 30 min after (B) addition of color mix. C. albicans strains 1, 17, FH1, and FH5 (indicated on the left vertical axis of A and B) were tested in duplicate by the NCCLS M27-A2 assay to determine their sensitivity to FLC (0.25-64 µg/ml FLC series indicated on the top horizontal axis of A and B). ND, No Drug. GC, Glucose Control.
A
B
153
A
Figure 50. 48 h NCCLS M27-A2 microwell testing plate before (A) and 30 min after (B) addition of color mix. C. albicans strains 95-68 and 95-142 (indicated on the left vertical axis of A and B) were tested in duplicate by the NCCLS M27-A2 assay to determine their sensitivity to FLC (0.25-64 µg/ml FLC series indicated on the top horizontal axis of A and B). ND, No Drug. GC, Glucose Control.
B
154 recommended guidelines, FLC MICs were designated as the lowest drug concentration
resulting in a 50% reduction in growth compared to the drug-free growth control.
Trailing growth did not interfere in the determination of FLC MICs with the exception of
one strain, C. albicans 1, who has a published NCCLS M27 FLC MIC of 0.25 µg/ml
(269), but appeared to have a FLC MIC of >64 µg/ml in our NCCLS M27-A2 testing
(Fig. 49A). This was resolved by adding RSA color mix to the testing wells, which
facilitated a visual MIC designation of 0.5 µg/ml (Fig. 49B).
RSA FLC Testing of C. albicans Clinical Control Strains 19 h RSA testing of
the 1:1000 OD530nm yeast inocula of each C. albicans strain resulted in susceptibility
curves that reflected the reported FLC susceptibility of each strain (Fig. 51). The
susceptibility curves of FLC-sensitive C. albicans strains 1 and FH1 (Fig. 51A and B,
respectively) had a well defined upper plateau representing the inhibitory concentrations
of drug and a steep decline representing the dose-dependent inhibitory range. The
susceptibility curves of FLC-resistant C. albicans strains FH5 and 95-68 (Fig. 51D and E,
respectively) had well defined upper plateaus, steep dose-dependent inhibitory ranges,
and lower plateaus, representing non-inhibitory concentrations of FLC. The
susceptibility curve of the FLC-resistant C. albicans strain 17 (Fig. 51B) was composed
of a steep dose-dependent inhibitory range and well defined lower plateau. The FLC-
resistant strain 95-142 (Fig. 51F) did not form a well-defined susceptibility curve, with
all of its residual glucose values falling below 80%. The lowest drug concentration
corresponding to a residual glucose percentage in the top 10% percent of the detection
interval was designated as the FLC MIC (Table 19). The FLC MIC of C. albicans

155
FLC Concentration (µg/ml)
64 32 16 8 4 2 1 0.5 0.25 0.13 0
Perc
ent R
esid
ual G
luco
se
40
50
60
70
80
90
100
110
FLC Concentration (µg/ml)
64 32 16 8 4 2 1 0.5 0.25 0.13 0
Perc
ent R
esid
ual G
luco
se
40
50
60
70
80
90
100
FLC Concentration (µg/ml)
64 32 16 8 4 2 1 0.5 0.25 0.13 0
Perc
ent R
esid
ual G
luco
se
30
40
50
60
70
80
90
100
110
A
B
C
Figure 51. RSA FLC susceptibility curves of C. albicans 1 (A), 17 (B), FH1 (C), FH5 (D), 95-68 (E), and 95-142 (F).
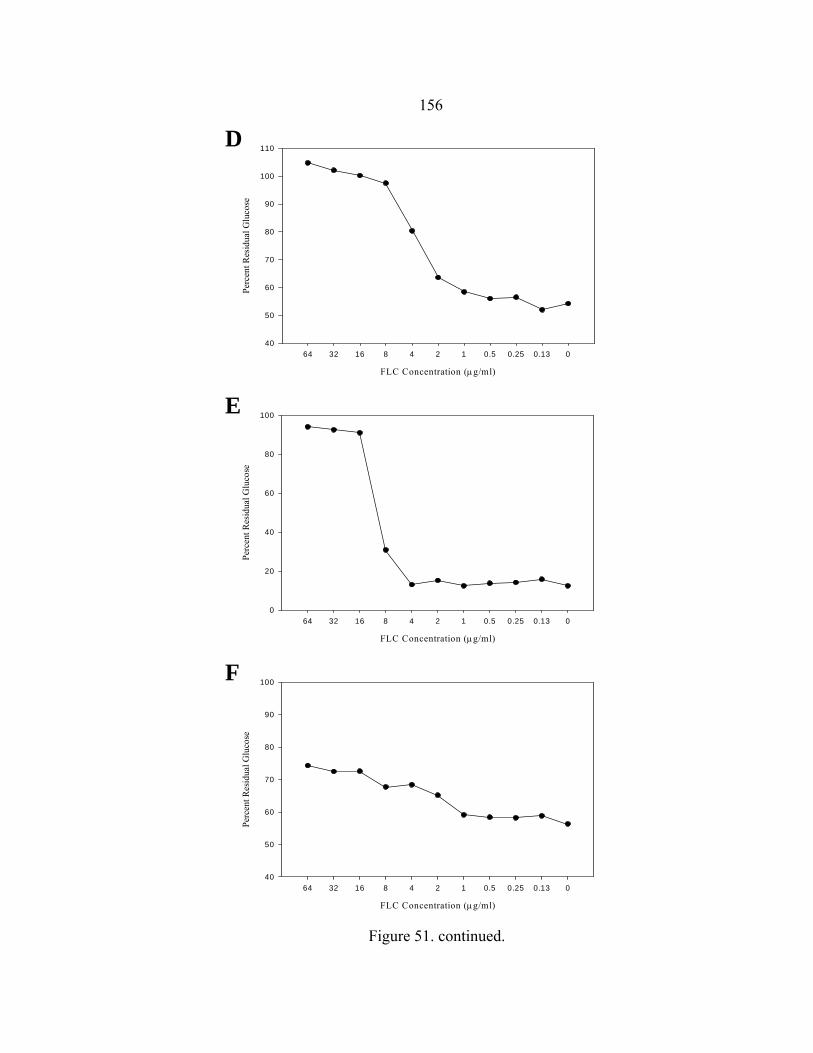
156
FLC Concentration (µg/ml)
64 32 16 8 4 2 1 0.5 0.25 0.13 0
Perc
ent R
esid
ual G
luco
se
40
50
60
70
80
90
100
110
FLC Concentration (µg/ml)
64 32 16 8 4 2 1 0.5 0.25 0.13 0
Perc
ent R
esid
ual G
luco
se
0
20
40
60
80
100
FLC Concentration (µg/ml)
64 32 16 8 4 2 1 0.5 0.25 0.13 0
Perc
ent R
esid
ual G
luco
se
40
50
60
70
80
90
100
E
D
F
Figure 51. continued.

157 95-142 was arbitrarily designated as >64 µg/ml, because it did not produce a discernible
susceptibility curve and the residual glucose value corresponding to 64 µg/ml was less
than 80%.
Comparison of RSA and NCCLS M27-A2 FLC MICs RSA and NCCLS M27-
A2 FLC MICs are listed in Table 19 (267, 269). All RSA MICs were equal to or within
one two-fold dilution of those obtained by NCCLS M27-A2 testing in our laboratory.
The majority of NCCLS M27-A2 FLC MICs determined in our laboratory differed from
published NCCLS M27 FLC MICs by one or two two-fold dilutions. This discrepancy
was not due to improper NCCLS M27-A2 testing, as our drug control, C. krusei strain
ATCC 6258, consistently produced FLC MICs within the FLC MIC range recommended
by NCCLS M27-A2 guidelines (135) (data not shown).
Table 19. 19 h RSA and 48 h NCCLS M27-A FLC MICs of C. albicans clinical control strains.
C. albicans strain
1 17 FH1 FH5 95-68 95-142
Published NCCLS M27 FLC MICa
RSA FLC MIC
NCCLS M27-A2 FLC MICb
0.25 µg/ml
≥64 4
≥64
≥64
≥64
0.5
64 1
32
16
>64
0.5 µg/ml
64
0.5 8
16
>64 a Data obtained from references 128 and 498.
b NCCLS M27-A2 FLC MICs determined in our laboratory.
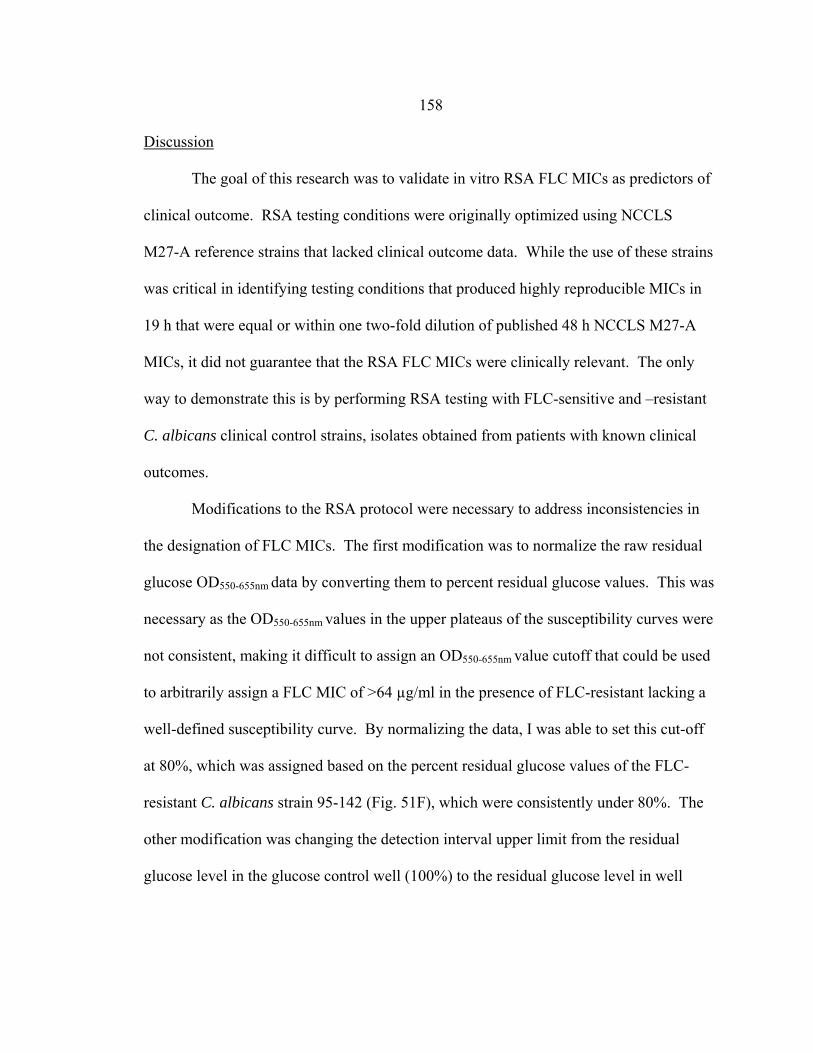
158 Discussion
The goal of this research was to validate in vitro RSA FLC MICs as predictors of
clinical outcome. RSA testing conditions were originally optimized using NCCLS
M27-A reference strains that lacked clinical outcome data. While the use of these strains
was critical in identifying testing conditions that produced highly reproducible MICs in
19 h that were equal or within one two-fold dilution of published 48 h NCCLS M27-A
MICs, it did not guarantee that the RSA FLC MICs were clinically relevant. The only
way to demonstrate this is by performing RSA testing with FLC-sensitive and –resistant
C. albicans clinical control strains, isolates obtained from patients with known clinical
outcomes.
Modifications to the RSA protocol were necessary to address inconsistencies in
the designation of FLC MICs. The first modification was to normalize the raw residual
glucose OD550-655nm data by converting them to percent residual glucose values. This was
necessary as the OD550-655nm values in the upper plateaus of the susceptibility curves were
not consistent, making it difficult to assign an OD550-655nm value cutoff that could be used
to arbitrarily assign a FLC MIC of >64 µg/ml in the presence of FLC-resistant lacking a
well-defined susceptibility curve. By normalizing the data, I was able to set this cut-off
at 80%, which was assigned based on the percent residual glucose values of the FLC-
resistant C. albicans strain 95-142 (Fig. 51F), which were consistently under 80%. The
other modification was changing the detection interval upper limit from the residual
glucose level in the glucose control well (100%) to the residual glucose level in well
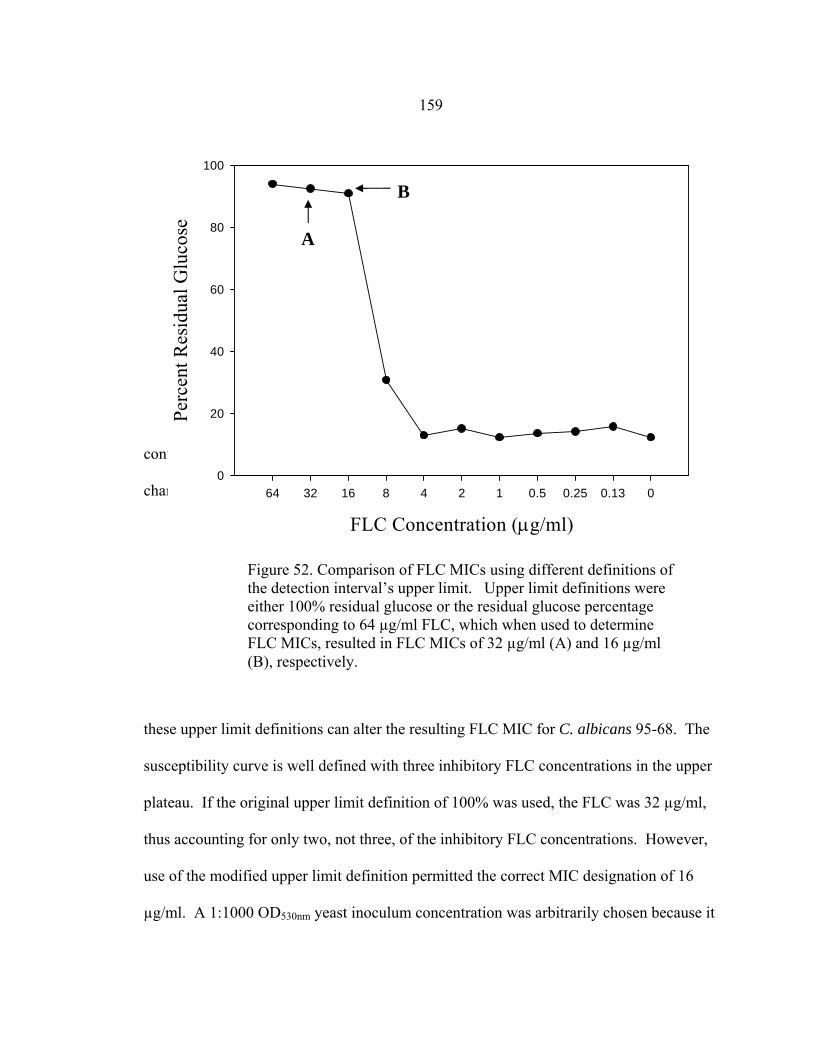
159
containing the highest inhibitory concentration of FLC (64 µg/ml). Figure 52 shows how
changing
these upper limit definitions can alter the resulting FLC MIC for C. albicans 95-68. The
susceptibility curve is well defined with three inhibitory FLC concentrations in the upper
plateau. If the original upper limit definition of 100% was used, the FLC was 32 µg/ml,
thus accounting for only two, not three, of the inhibitory FLC concentrations. However,
use of the modified upper limit definition permitted the correct MIC designation of 16
µg/ml. A 1:1000 OD530nm yeast inoculum concentration was arbitrarily chosen because it
FLC Concentration (µg/ml)
64 32 16 8 4 2 1 0.5 0.25 0.13 0
Perc
ent R
esid
ual G
luco
se
0
20
40
60
80
100
A
B
Figure 52. Comparison of FLC MICs using different definitions of the detection interval’s upper limit. Upper limit definitions were either 100% residual glucose or the residual glucose percentage corresponding to 64 µg/ml FLC, which when used to determine FLC MICs, resulted in FLC MICs of 32 µg/ml (A) and 16 µg/ml (B), respectively.
160 was in the midpoint of the RSA recommended FLC inoculum concentration range for C.
albicans testing (1:512 – 1:2048) (145), but also for convenience, as this was the same
inoculum concentration used in M27-A2 testing (135). The use of this yeast inoculum
concentration in the RSA FLC testing of C. albicans clinical control strains resulted in
susceptibility curves (Fig. 51) and FLC MICs (Table 19) that reflected each strain’s
sensitivity to FLC in vivo. In addition, RSA MICs were equal to or within one two-fold
dilution of NCCLS M27-A2 FLC MICs determined in our laboratory. These data
validate that in vitro RSA FLC MICs are predictors of in vivo clinical outcome.
Differences between the published NCCLS M27-A2 MICs and those obtained in our
laboratory, especially with C. albicans FH1 and 95-68, are most likely due to the
extensive transferring and storage of the strains prior to us receiving the strains (personal
communication with Dr. Spencer Redding). However, as the RSA and NCCLS M27-A2
FLC MIC of every strain tested in our laboratory reflected their documented in vivo
sensitivities to FLC, I am confident that discrepancy is not significant.
This research has also shown that addition of RSA color mix to NCCLS M27-A2
plates after 48 h incubation can help negate the complicating effect of trailing growth on
FLC MIC determination (Fig. 49, 50). The FLC-sensitive C. albicans strain 1 had a
visual MIC of 0.25 µg/ml after 24 h of incubation (data not shown), which increased to
>64 µg/ml after 48 h incubation (Fig. 49A). According to the NCCLS M27-A2
publication, this occurs in 5% of isolates, 24 h MICs being more clinically relevant (135).
Because of this, the NCCLS M27-A2 publication now recommends that MICs be
determined at 24 and 48h. As this increases the NCCLS M27-A2 workload it therefore

161 seemed beneficial to find a way to counteract the negative effects of trailing growth on
MIC determination at 48 h. By adding the RSA color mix to testing wells of C. albicans
1 and allowing 30 min for color development, I was able to objectively determine a FLC
MIC of 0.25 µg/ml. Visual assessment of the color reaction in testing wells of the
remaining C. albicans strains, which did not have significant trailing growth, were also
within one two-fold dilution of the FLC MIC designations made prior to addition of color
mix (Table 19).
C. glabrata RSA FLC Testing
Results
Optimal Yeast Inoculum Concentration The optimal yeast inoculum
concentration was determined by performing 19 h RSA testing with 1:2, 1:8, 1:32, 1:128,
1:512, 1:1000, or 1:2048 dilutions of the 0.11 OD530nm yeast inocula of FLC- sensitive
(6999 and 6938) and FLC–resistant (6955 and 7048) strains (Table 20). The 1:2 dilution
was too concentrated as the FLC MIC of 6999, which is FLC-sensitive, was >64 µg/ml,
indicating FLC resistance. In contrast, the 1:512, 1:1000, and 1:2048 dilutions were
considered too dilute as the FLC MICs of 7048, FLC-resistant, were ≤2 µg/ml, indicating
FLC sensitivity. Although the 1:8 and 1:32 susceptibility curves of the two FLC-
sensitive strains, 6938 and 6999 (Fig. 53A and B, respectively), were well defined,
residual glucose values in the upper plateau were not consistently greater than 80%,
resulting FLC MIC designations of >64 µg/ml. The optimal 0.11 OD530nm yeast
inoculum dilution was designated as 1:128 because RSA FLC MICs were equal to or
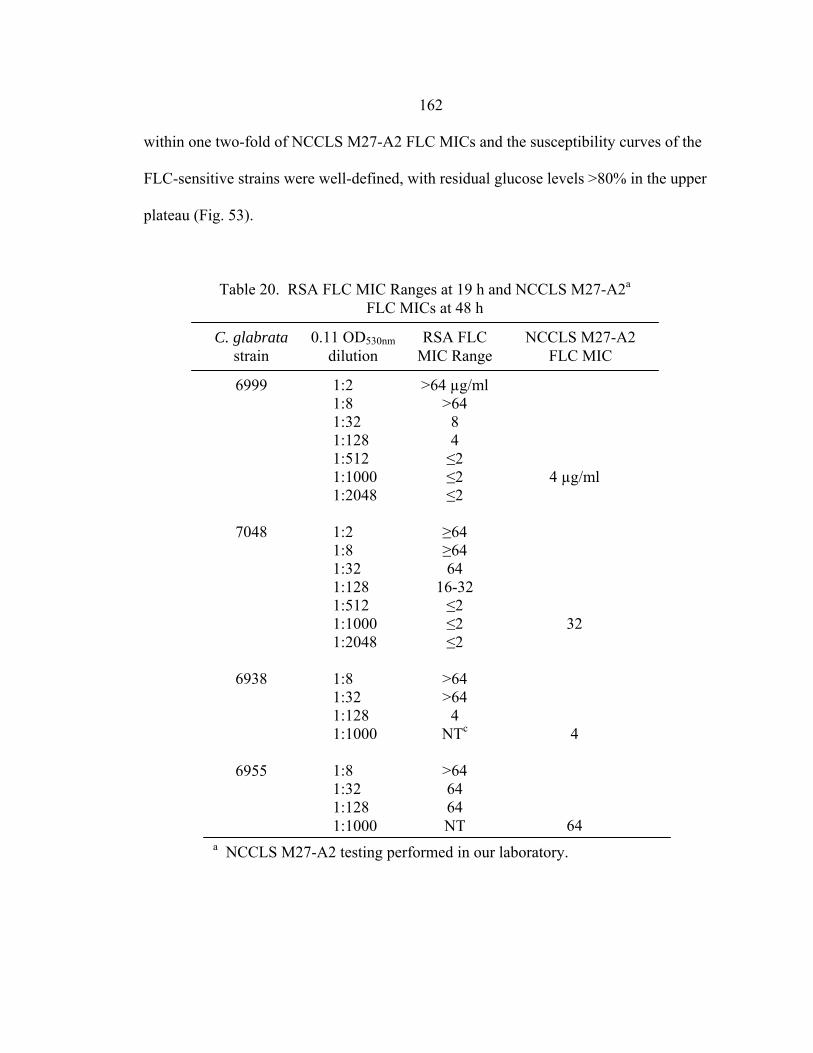
162
within one two-fold of NCCLS M27-A2 FLC MICs and the susceptibility curves of the
FLC-sensitive strains were well-defined, with residual glucose levels >80% in the upper
plateau (Fig. 53).
Table 20. RSA FLC MIC Ranges at 19 h and NCCLS M27-A2a FLC MICs at 48 h
6999
7048
6938
6955
1:2 1:8 1:32 1:128 1:512 1:1000 1:2048 1:2 1:8 1:32 1:128 1:512 1:1000 1:2048 1:8 1:32 1:128 1:1000 1:8 1:32 1:128 1:1000
>64 µg/ml >64
8 4 ≤2 ≤2 ≤2
≥64 ≥64 64
16-32 ≤2 ≤2 ≤2
>64 >64
4 NTc
>64 64 64 NT
4 µg/ml
32 4
64
C. glabrata strain
0.11 OD530nm dilution
RSA FLC MIC Range
NCCLS M27-A2 FLC MIC
a NCCLS M27-A2 testing performed in our laboratory.

163
FLC Concentration (µg/ml)
64 32 16 8 4 2 1 0.5 0.25 0.13 0
Perc
ent R
esid
ual G
luco
se
0
20
40
60
80
100
FLC Concentration (µg/ml)
64 32 16 8 4 2 1 0.5 0.25 0.13 0
Perc
ent R
esid
ual G
luco
se
0
20
40
60
80
100
Figure 53. Susceptibility curves corresponding to the 1:8 (●), 1:32 (○), 1:128 (▼), and 1:1000 ( ) 0. 11 OD530nm yeast inocula of FLC-resistant C. glabrata strains 6938 (A) and 6999 (B).
A
B
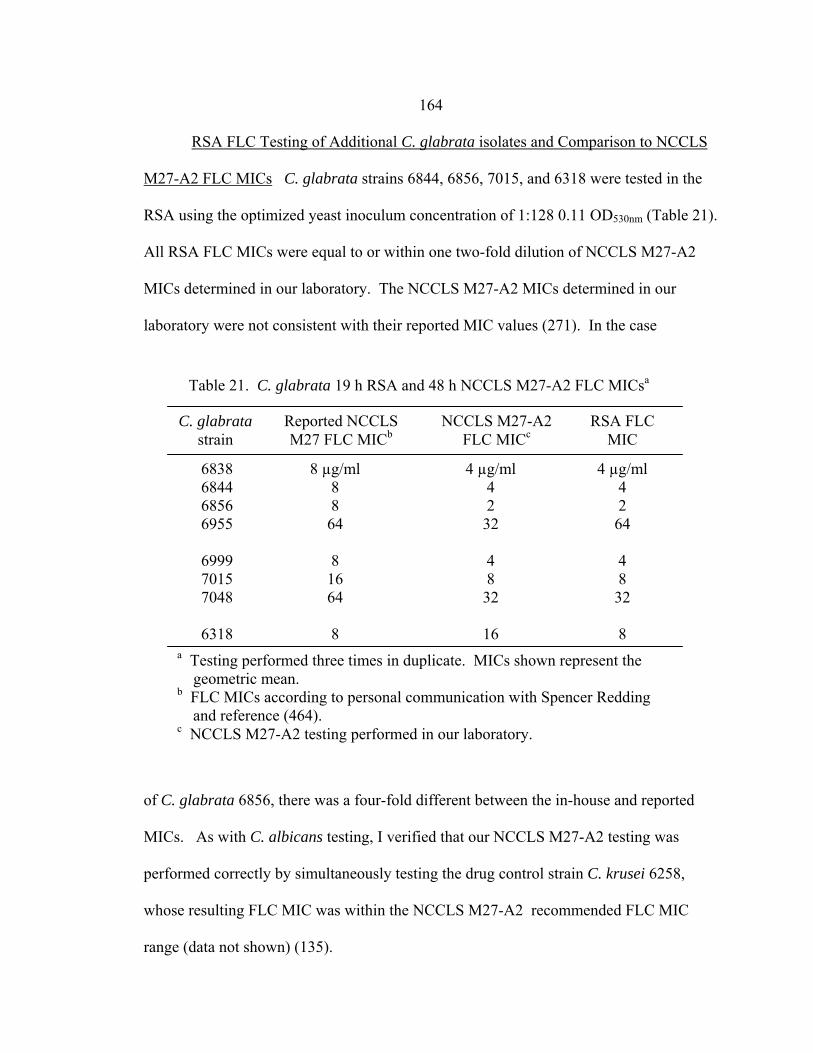
164 RSA FLC Testing of Additional C. glabrata isolates and Comparison to NCCLS
M27-A2 FLC MICs C. glabrata strains 6844, 6856, 7015, and 6318 were tested in the
RSA using the optimized yeast inoculum concentration of 1:128 0.11 OD530nm (Table 21).
All RSA FLC MICs were equal to or within one two-fold dilution of NCCLS M27-A2
MICs determined in our laboratory. The NCCLS M27-A2 MICs determined in our
laboratory were not consistent with their reported MIC values (271). In the case
of C. glabrata 6856, there was a four-fold different between the in-house and reported
MICs. As with C. albicans testing, I verified that our NCCLS M27-A2 testing was
performed correctly by simultaneously testing the drug control strain C. krusei 6258,
whose resulting FLC MIC was within the NCCLS M27-A2 recommended FLC MIC
range (data not shown) (135).
Table 21. C. glabrata 19 h RSA and 48 h NCCLS M27-A2 FLC MICsa
C. glabrata strain
6838 6844 6856 6955 6999 7015 7048 6318
Reported NCCLS M27 FLC MICb
8 µg/ml 8 8 64
8 16 64 8
NCCLS M27-A2 FLC MICc
4 µg/ml 4 2 32 4 8 32
16
RSA FLC MIC
4 µg/ml 4 2 64 4 8 32 8
a Testing performed three times in duplicate. MICs shown represent the geometric mean. b FLC MICs according to personal communication with Spencer Redding and reference (464). c NCCLS M27-A2 testing performed in our laboratory.

165 Discussion
The goal of these experiments was to optimize RSA conditions to facilitate
determination of clinically relevant C. glabrata FLC MICs. To accomplish this, I
obtained a set of C. glabrata clinical control isolates, with previously known or published
patient clinical outcomes and/or NCCLS M27-A2 FLC MICs (personal communication
with Dr. Spencer Redding), to optimize RSA conditions, thus ensuring that the MICs are
predictive of clinical outcome.
As discussed earlier, the RSA protocol was modified to address inconsistencies in
C. albicans and C. glabrata MIC determination. As with our C. albicans RSA testing,
the OD550-655nm data corresponding to the upper plateau of the susceptibility curve differed
between both in replicate testing of each strain and between strains, making designation
of an arbitrary OD550-655nm cutoff, for designating the FLC MIC of highly FLC-resistant
strains as >64 µg/ml, difficult. By converting raw OD550-655nm data to percent residual
glucose I was able to determine that inhibitory concentrations of FLC in the upper plateau
of the 1:128 0.11 OD530nm susceptibility curves of FLC-sensitive C. glabrata strains 6938
and 6999 were consistently greater than 80% (Figure 51), while non-inhibitory
concentrations of FLC in the dose-dependent range or lower plateau of the 1:128 0.11
OD530nm susceptibility curves of FLC-resistant C. glabrata strains 7048 and 6955 were
consistently lower than 80% (data not shown). Therefore, like C. albicans, I was able to
designate 80% residual glucose as the cutoff for an arbitrary FLC MIC designation of
>64 µg/ml. I also found it necessary to change the detection interval upper limit from
100% residual glucose to the residual glucose value corresponding to 64

166 µg/ml. As with C. albicans, I found that by using the published protocol our FLC MICs
were two- to four-fold greater than would be predicted based on analysis of the
susceptibility curve (data not shown).
The dose-dependence effect of yeast inoculum concentration on FLC MIC was
demonstrated by performing RSA testing with a range (1:2 to 1:2048) of diluted 0.11
OD530nm yeast inocula of FLC-sensitive C. glabrata strains 6938 and 6999 and FLC-
resistant C. glabrata strains 7048 and 6955 (Table 20). I was able to eliminate overly
concentrated or dilute concentrations by comparing the FLC MICs to each strains’ known
in vivo susceptibility to FLC and by analyzing the corresponding susceptibility curves
(Fig. 53). The 1:128 dilution was the only dilution consistently producing susceptibility
curves with clinically relevant MICs. RSA FLC testing of the remaining C. glabrata
strains, under these same conditions, also resulted in clinically relevant MICs, with all
RSA FLC MICs being equal to or within one two-fold dilution of FLC obtained by
NCCLS M27-A2 testing performed in our laboratory (Table 21). As mentioned before,
differences between the published and in-house NCCLS M27-A2 FLC MICs are most
likely due to the extensive transferring and storage time that may have occurred prior to
us receiving the strains.
In conclusion I was able to optimize RSA conditions to generate clinically
relevant C. glabrata FLC MICs. However, as C. glabrata infections are primarily treated
with either FLC or AMB {460}, an essential task that remains undone is to locate AMB-
sensitive and/or AMB-resistant C. glabrata clinical control strains and use them to
optimize conditions for RSA AMB testing of C. glabrata isolates.

167
CHAPTER 7
CONCURRENT AND SEQUENTIAL ANTIFUNGAL (AMPHOTERICIN B, ITRACONAZOLE, AND VORICONAZOLE) COMBINATION TESTING OF CONIDIAL
AND HYPHAL INOCULA OF ASPERGILLUS FUMIGATUS ISOLATES
Introduction
The increasing incidence of invasive aspergillosis (IA) and advent of new
antifungals has generated interest in concurrent antifungal combination therapy. In,
addition, the increasing use of secondary and sometimes tertiary antifungal regimens for
IA, necessary due to fungal resistance to or the toxic effects of primary antifungal
regimens, have prompted both physicians and investigators to question the safety and
efficacy of sequential antifungal therapy.
I have utilized in vitro checkerboard testing formats to determine the effects of
two-drug concurrent and sequential combinations of amphotericin B (AMB), itraconazole
(ITC), or voriconazole (VRC) on the conidial and hyphal inocula of A. fumigatus. AMB,
ITC, and VRC were chosen as they are the only three antifungal drugs currently approved
for primary therapy of IA. Although I previously demonstrated that A. fumigatus conidia
and hyphae have similar susceptibilities to AMB, ITC, and VRC (Chapter 4), I could not
assume that this would also be true with antifungal combination testing. I therefore
performed antifungal combination testing with both conidial and hyphal inocula. The
effects of concurrent and sequential antifungal combinations were interpreted by
generating fractional inhibitory concentration (FIC) index definitions that
168
permitted a ± 1 dilution experimental error that is often observed in checkerboard testing
(183, 201).
Materials and Methods
Reagents
Preparations of RPMI 1640 with or without 0.4% glucose were buffered with
0.165 M 3-(N-morpholino)-propanesulfonic acid and adjusted to pH 7.0 with 10 N
NaOH.
Fungal Strains
A. fumigatus strains NCPF 7101, 7100, 7098, and 7097 were purchased from the
National Collection of Pathogenic Fungi (Mycology Reference Laboratory, Bristol). A.
fumigatus AF-72 was donated by Dr. Denning at Hope Hospital, UK. These strains were
isolated from aspergillosis patients with known clinical outcomes. Species designations
of A. fumigatus were confirmed by observations of macroscopic and microscopic
characteristics during growth on Czapek-Dox agar (35). All stocks were maintained in
vials of sterile water at 4º C.
Antifungal Agents and Preparation
AMB and ITC were purchased in powdered form. VRZ was generously provided
by Pfizer, Inc. Stocks of 1600 µg/ml were prepared for each drug in dimethyl sulfoxide
(DMSO) and stored at -80°C for up to 6 months. 41x AMB, ITC, and VRC twofold
dilution series’ were prepared in DMSO for cRSA testing of each A. fumigatus isolate

169
(Table 22). The 41x drug series’ were stored at -80º C overnight and warmed to room
temperature before use.
Microwell Plate Preparation.
Each cRSA plate was prepared by inoculating 100µl of 0.4% glucose RPMI into
the first 8x8 grid of wells and the last column of wells in a 96-well microtiter plate.
Plates were sealed and stored at 4º C until use.
Conidial Inoculum Preparation Isolates were cultured on Sabouraud glucose agar (SAB)
(BBL, Cockeysville, MD, cat. no. 211584) slants at 30º C for 3 days. After flooding with
glucose deficient RPMI 1640, the slant surface was gently scraped with a sterile wooden
applicator stick. Once the hyphal fragments were allowed to settle for approximately 15
min, the conidial suspension was collected and adjusted with glucose deficient RPMI
1640 to an optical
A. fumigatus isolate
NCPF 7097 NCPF 7098 NCPF 7100 NCPF 7101
AMB range (µg/ml)
ITC range (µg/ml)
VRC range (µg/ml)
0.13 – 8.0
0.06 – 4.0
0.06 – 4.0
0.06 – 4.0
0.06 – 4.0
0.06 – 4.0
0.13 – 8.0
0.06 – 4.0
0.06 – 4.0
0.06 – 4.0
0.13 – 8.0
0.06 – 4.0
Table 22. Final AMB, ITC, and VRC ranges in antifungal combination testing of A. fumigatus isolatesa
a Final drug range concentrations after adding 5µl of 41x drug range to testing and control wells containing 200 µl RPMI.

170
density (OD530nm) of 0.11, then diluted 1:50. Viability of each conidial suspension was
determined by plating 0.1ml of the 0.11 OD530nm conidial inoculum, diluted 1:10,000, on
SAB plates and incubating at 37º C.
Concurrent Antifungal Combination Testing
Microtiter plates containing 0.4% glucose RPMI were removed from 4º C and
allowed to reach room temperature. 100 µl of 1:50 0.11 OD530nm conidial inoculum was
inoculated into the 8x8 testing well grid. Wells in the last column were inoculated with
100 µl of glucose-deficient RPMI (glucose controls). Hyphae plates were sealed and
incubated at 35-37º C for 12 h before proceeding to the next step. Concurrent antifungal
susceptibility testing was initiated in both conidial and hyphal plates by inoculating
testing wells with 5µl of two of the 41x AMB, ITC, or VRZ dilution ranges or DMSO
Figure 54. Illustration of antifungal drug checkerboard set-up in a testing plate. For the first drug, 5 µl of DMSO was added to column 1 while 5 µl of drug was added to columns 2 – 8, with drug concentrations increasing from the left to the right. For the second drug, 5 µl of DMSO was added to row 8 while 5 µl of drug was added to rows 1 – 7, with drug concentrations increasing from the bottom to the top. The last column (glucose controls) was inoculated with 10 µl of DMSO.
171
(drug-free testing wells and glucose control wells) (Fig. 54). Plates were sealed with tape
and shaken at 150 rpm for 15 min. After incubating at 35-37º C for 48 h, plates were
removed and fungal growth assessed by visual inspection using a mirror plate reader.
50µl of the enzyme color mix (same composition as in mRSA testing) was then added to
each well. At 20 min, color intensity was measured at OD550nm with a reference reading
of OD655nm in a plate reader.
Sequential Antifungal Combination Testing
Microtiter plates containing 0.4% glucose RPMI were removed from 4º C and
allowed to reach room temperature. 100 µl of 1:50 0.11 OD530nm conidial inoculum was
inoculated into the 8x8 testing well grid. Wells in the last column were inoculated with
100 µl of glucose-deficient RPMI (glucose controls). Hyphae plates were sealed and
incubated at 35-37º C for 12 h before proceeding to the next step. Sequential antifungal
combination testing was initiated in both conidial and hyphal plates by inoculating testing
wells with 5 µl of one of the 41x AMB, ITC, or VRZ dilution ranges or DMSO (drug-
free testing wells and glucose control wells). Plates were sealed with tape and shaken at
150 rpm for 15 min. After incubating at 35-37º C for 8h, plates were removed and 5 µl
of the second 41x drug dilution range or DMSO (drug-free testing wells and glucose
control wells) were added to the wells. Plates were sealed with tape and shaken at 150
rpm for 15 min. After incubating at 35-37º C for 48 h, plates were removed and fungal
growth assessed by visual inspection using a mirror plate reader.

172 Analysis of Drug Interactions
Drug interactions were analyzed by a fractional inhibitory concentration (FIC)
index method. Like the NCCLS M38-A assay, AMB, ITC, and VRC MIC endpoint
values were based on visual determination of inhibition of growth. FIC indices in
concurrent and sequential antifungal combination testing of conidial inocula were
determined based on AMB, ITC, and VRC MIC endpoint definitions of 100% growth
inhibition. FIC indices in concurrent and sequential antifungal combination testing of
hyphal inocula were determined based on AMB, ITC, and VRC MIC endpoint definitions
of 80% growth inhibition. For purposes of calculation, off-scale MICs were converted to
the next higher dilution. The FIC of each drug was calculated as the ratio of the
concentration of the drug in combination that achieves the MIC endpoint to the MIC of
the drug alone by using that endpoint. FIC index values were calculated by adding the
individual FIC values of each drug present in the well. FIC index values were interpreted
as follows: ≤ 0.5, synergistic; > 0.5 – 1.0, additive; > 1.0 – 4.0 indifferent; > 4.0,
antagonistic.
Results
AMB, ITC, and VRC MICs of Conidial and Hyphal Inocula
To assess whether combination testing was prepared correctly, the monodrug
AMB, ITC, and VRC MICs of conidial and hyphal conidial inocula were compared to
previously determined AMB, ITC, and VRC NCCLS M38-A and hRSA MICs,
respectively. The AMB, ITC, and VRC MICs corresponding to the conidial inocula of
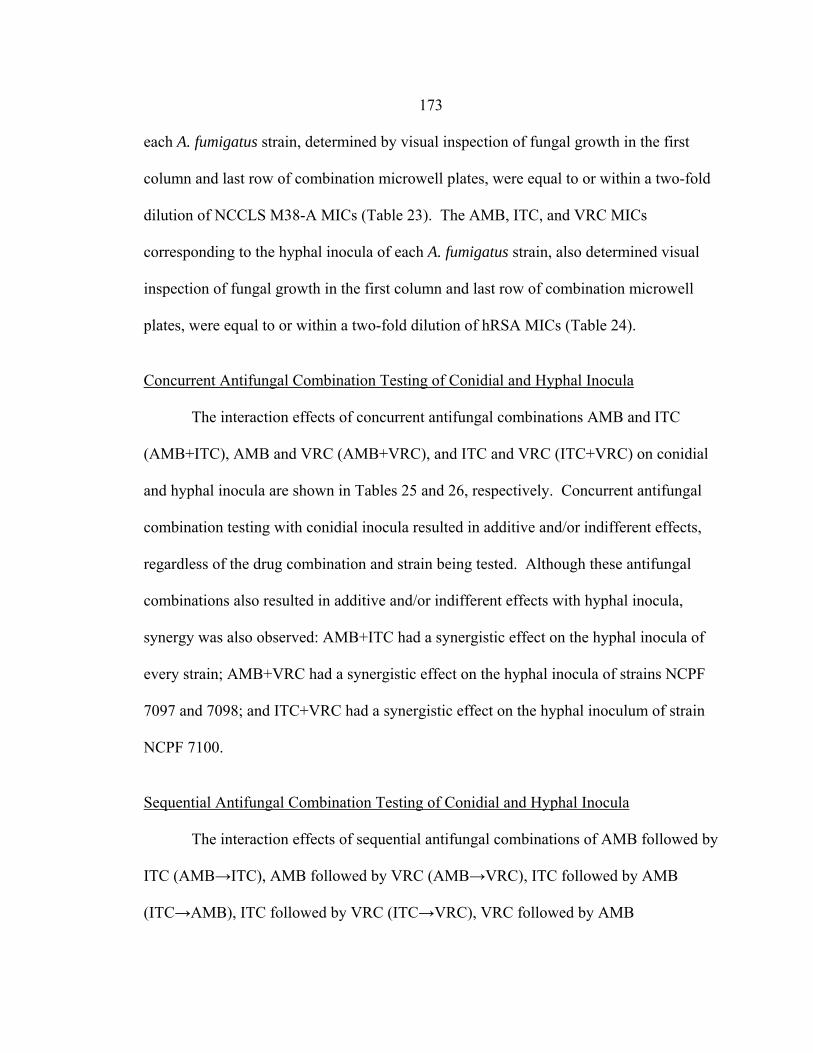
173 each A. fumigatus strain, determined by visual inspection of fungal growth in the first
column and last row of combination microwell plates, were equal to or within a two-fold
dilution of NCCLS M38-A MICs (Table 23). The AMB, ITC, and VRC MICs
corresponding to the hyphal inocula of each A. fumigatus strain, also determined visual
inspection of fungal growth in the first column and last row of combination microwell
plates, were equal to or within a two-fold dilution of hRSA MICs (Table 24).
Concurrent Antifungal Combination Testing of Conidial and Hyphal Inocula The interaction effects of concurrent antifungal combinations AMB and ITC
(AMB+ITC), AMB and VRC (AMB+VRC), and ITC and VRC (ITC+VRC) on conidial
and hyphal inocula are shown in Tables 25 and 26, respectively. Concurrent antifungal
combination testing with conidial inocula resulted in additive and/or indifferent effects,
regardless of the drug combination and strain being tested. Although these antifungal
combinations also resulted in additive and/or indifferent effects with hyphal inocula,
synergy was also observed: AMB+ITC had a synergistic effect on the hyphal inocula of
every strain; AMB+VRC had a synergistic effect on the hyphal inocula of strains NCPF
7097 and 7098; and ITC+VRC had a synergistic effect on the hyphal inoculum of strain
NCPF 7100.
Sequential Antifungal Combination Testing of Conidial and Hyphal Inocula
The interaction effects of sequential antifungal combinations of AMB followed by
ITC (AMB→ITC), AMB followed by VRC (AMB→VRC), ITC followed by AMB
(ITC→AMB), ITC followed by VRC (ITC→VRC), VRC followed by AMB

174
(VRC→AMB), and VRC followed by ITC (VRC→ITC) on conidial and hyphal inocula
are shown in Tables 27 and 28, respectively. AMB→ITC had additive and/or indifferent
effects on the majority of conidial inocula with the exception of strain NCPF 7098, in
which a synergistic effect was also observed. In contrast, AMB→ITC had a synergistic
effect on the majority of hyphal inocula, with the exception of strain NCPF 7100,
Drug
AMB
ITC
VRC
0.5-1.0 (1) 1
0.25-1 (0.25) 0.25
0.5 0.5
1 4
0.25-0.5 (0.5) 0.5
0.25-1 (0.5)
0.5
1-2 (2) 1
0.25-0.5 (0.5) 0.25
0.25-0.5 (0.5)
0.5
0.25-0.5 (0.25) 0.5
8->8 (>8)
>16
0.5-1 (1) 2
Table 24. Comparison between AMB, ITC, and VRC MICs obtained with hyphal inocula in current testing and previous hRSAa testing
NCPF 7100
NCPF 7098
NCPF 7101
NCPF 7097
MIC (µg/ml) (geometric mean) Testing
Current hRSA Current hRSA Current hRSA
a MICs values corresponding to hyphal inocula prepared with 1:50 0.11 OD530nm conidia inocula.
Drug
AMB
ITC
VRC
1-4 (2) 1 0.25-0.5 (0.25)0.5 0.25-0.5 (0.25)0.25
2 1 0.25-0.5 (0.25)0.5 0.25-0.5 (0.25)0.25
2-4 (2) 1 0.5 0.5 0.25-0.5 (0.5) 0.5
1-4 (1) 1 >8 >16 1 1
Table 23. Comparison between AMB, ITC, and VRC MICs obtained with conidial inocula in current testing and previous NCCLS M38-A testing
NCPF 7100
NCPF 7098
NCPF 7101
NCPF 7097
MIC (µg/ml) (geometric mean) Testing
Current NCCLS M38-A Current NCCLS M38-A Current NCCLS M38-A
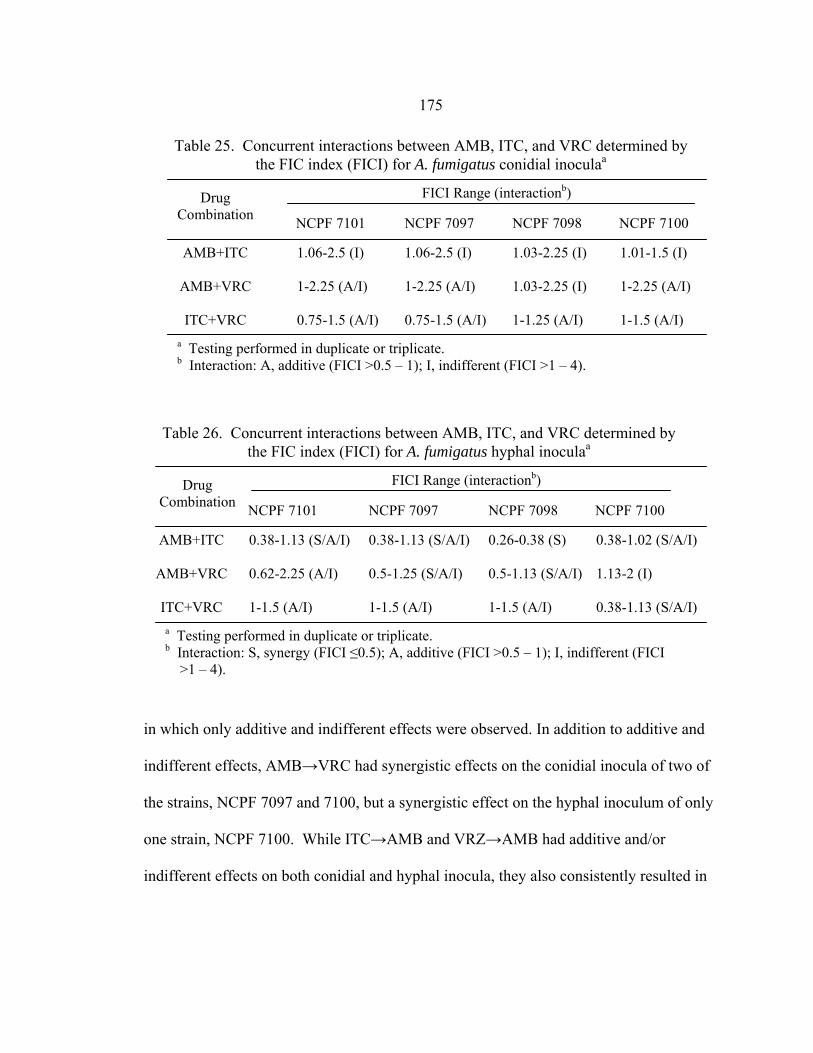
175 in which only additive and indifferent effects were observed. In addition to additive and
indifferent effects, AMB→VRC had synergistic effects on the conidial inocula of two of
the strains, NCPF 7097 and 7100, but a synergistic effect on the hyphal inoculum of only
one strain, NCPF 7100. While ITC→AMB and VRZ→AMB had additive and/or
indifferent effects on both conidial and hyphal inocula, they also consistently resulted in
Drug
Combination
AMB+ITC
AMB+VRC
ITC+VRC
NCPF 7100
NCPF 7098
NCPF 7101
0.38-1.13 (S/A/I) 0.62-2.25 (A/I) 1-1.5 (A/I)
NCPF 7097
0.38-1.13 (S/A/I) 0.5-1.25 (S/A/I) 1-1.5 (A/I)
0.26-0.38 (S) 0.5-1.13 (S/A/I) 1-1.5 (A/I)
0.38-1.02 (S/A/I) 1.13-2 (I) 0.38-1.13 (S/A/I)
Table 26. Concurrent interactions between AMB, ITC, and VRC determined by the FIC index (FICI) for A. fumigatus hyphal inoculaa
FICI Range (interactionb)
a Testing performed in duplicate or triplicate. b Interaction: S, synergy (FICI ≤0.5); A, additive (FICI >0.5 – 1); I, indifferent (FICI >1 – 4).
Drug
Combination
AMB+ITC
AMB+VRC
ITC+VRC
NCPF 7100
NCPF 7098
NCPF 7101
1.06-2.5 (I) 1-2.25 (A/I) 0.75-1.5 (A/I)
NCPF 7097
1.06-2.5 (I) 1-2.25 (A/I) 0.75-1.5 (A/I)
1.03-2.25 (I) 1.03-2.25 (I) 1-1.25 (A/I)
1.01-1.5 (I) 1-2.25 (A/I) 1-1.5 (A/I)
Table 25. Concurrent interactions between AMB, ITC, and VRC determined by the FIC index (FICI) for A. fumigatus conidial inoculaa
FICI Range (interactionb)
a Testing performed in duplicate or triplicate. b Interaction: A, additive (FICI >0.5 – 1); I, indifferent (FICI >1 – 4).

176
AMB→ITC AMB→VRC ITC→AMB ITC→VRC VRC→AMB VRC→ITC
Table 27. Sequential interactions between AMB, ITC, and VRC determined by the FIC index (FICI) for A. fumigatus conidial inoculaa
a Testing performed in duplicate or triplicate. b Interaction: S, synergy (FICI ≤0.5); A, additive (FICI >0.5 – 1); I, indifferent (FICI >1 – 4); T, antagonism (FICI >4) .
NCPF 7100
NCPF 7098
NCPF 7101
1-2.25 (A/I) 0.75-1.25 (A/I) 1.13-16.5 (I/T) 1.13-2 (I) 0.75-4.25 (A/I/T) 1-1.25 (A/I)
NCPF 7097
1-2.5 (A/I) 0.5-1.25 (S/A/I) 1.06-8.5 (I/T) 1-1.5 (A/I) 0.75-4.25 (A/I/T) 1.25-2.5 (I)
0.5-1.25 (S/A/I) 0.75-2.06 (A/I) 2.03-4.5 (I/T) 0.63-1.25 (A/I) 1-4.5 (A/I/T) 0.63-2.25 (A/I)
1.01-1.5 (I) 0.5-1.25 (S/A/I) 8.01-9 (T) 0.63-1.13 (A/I) 1.03-5 (I/T) 1.01-2 (I)
FICI Range (interactionb) Drug Combination
Drug Combination
AMB→ITC AMB→VRC ITC→AMB ITC→VRC VRC→AMB VRC→ITC
NCPF 7100
NCPF 7098
NCPF 7101
0.5-0.75 (S/A) 0.56-1.25 (A/I) 1.06-9 (I/T) 1-2.25 (A/I) 1.03-5 (I/T) 1.13-2 (I)
NCPF 7097
0.38-0.75 (S/A) 0.75-2.25 (A/I) 1.06-9 (I/T) 0.75-1.25 (A/I) 2.13-16.5 (I/T) 0.63-1.25 (A/I)
0.38-2.06 (S/A/I) 0.63-1.25 (A/I) 1.03-6 (I/T) 1.13-2 (I) 4.03-6 (T) 1-1.5 (A/I)
0.52-1.25 (A/I) 0.5-1.25 (S/A/I) 4.01-4.5 (T) 0.63-1.25 (I) 1.25-33 (I/T) 1-1.03 (A/I)
Table 28. Sequential interactions between AMB, ITC, and VRC determined by the FIC index (FICI) for A. fumigatus hyphal inoculaa
FICI Range (interactionb)
a Testing performed in duplicate or triplicate. b Interaction: S, synergy (FICI ≤0.5); A, additive (FICI >0.5 – 1); I, indifferent (FICI >1 – 4); T, antagonism (FICI >4).
177 antagonistic effects. ITC→VRC and VRC→ITC resulted in additive and/or indifference
effects on the conidial and hyphal inocula of all strains.
Discussion
The goals of this study were to determine the effects of concurrent and sequential
two-drug combinations of AMB, ITC, or VRC on the conidial and hyphal inocula of A.
fumigatus strains NCPF 7097, 7098, 7100, and 7101 and to ascertain whether these drug
combinations had differential effects on conidia versus hyphae. To our knowledge, this
is the first study that has compared the in vitro sensitivities of A. fumigatus conidia and
hyphae to concurrent and sequential combinations of antifungal drugs.
In vitro combination testing can be performed in several formats including the
time-kill, checkerboard, and most recently, E-test format. As our testing included more
than seventy concurrent and sequential antifungal combinations, I chose the checkerboard
format as it is more convenient than the time-kill format and has been more extensively
used than the E-test format. Each two-drug checkerboard combination test was
performed in a 96-well plate, with testing wells comprising an 8x8 grid of testing wells
(Fig. 54). This design facilitated MIC determinations with each drug alone as well as
testing of 49 concentration combinations of the two drugs per plate.
Antifungal combination testing of conidial and hyphal inocula required different
testing parameters. Preliminary conidial inocula concurrent combination testing
performed in 16 h, using mRSA testing parameters, and 48 h, using NCCLS M38-A
testing parameters, demonstrated that reproducible drug interaction results could be
178
determined in 48 h, but not 16 h (data not shown). As a result, all subsequent concurrent
and sequential combination testing of conidial inocula were performed using the NCCLS
M38-A testing parameters of conidial inoculum concentration (1:50 0.11 OD530nm),
glucose concentration (0.2%), and MIC endpoint definitions (100% visible growth
inhibition). Concurrent and sequential combination testing of conidial inocula were
prepared correctly as the monodrug AMB, ITC, and VRC MICs corresponding to
conidial inocula in each combination plate after 48 (concurrent testing) or 54 h
(sequential testing) were equal to or within a two-fold dilution of AMB, ITC, and VRC
MICs determined in previous 48 h NCCLS M38-A testing (Table 23). In contrast,
testing parameters for concurrent and sequential combination testing of hyphal inocula
were based on those used in hRSA testing (Chapter 4) with the exception of the MIC
endpoint definition used in combination testing, which was a visible 80% inhibition of
growth. This endpoint was necessary due to fungal growth for 12 h prior to addition of
both drugs in concurrent antifungal testing and 20 h of fungal growth prior to addition of
the second drug in sequential antifungal testing. Concurrent and sequential combination
testing of hyphal inocula were prepared correctly as the monodrug AMB, ITC, and VRC
MICs corresponding to hyphal inocula in each combination plate after 60 or 68 h were
equal to or within a two-fold dilution of the AMB, ITC, and VRC MICs determined in
previous 60 h hRSA testing (Table 24).
Although not an issue in concurrent and sequential antifungal combination testing
with conidial inocula, the growth-based MIC endpoint definition of 80% growth
reduction used in determining FIC indices in concurrent and sequential antifungal

179
combination testing of hyphal inocula introduced subjectivity to our interpretations of
combinatorial antifungal effects. Unfortunately, the use of a growth-based MIC endpoint
definition was necessary as comprehensive RSA-based endpoint definitions could not be
established for antifungal combination testing of conidial or hyphal inocula and response
surface statistical analysis did not consistently produce drug interaction values (ICα) that
reflected the true drug interaction effect. RSA-based MIC endpoint definitions could not
be established because an appropriate detection interval cut-off value could not be
determined. For example, when the conidial inoculum of A. fumigatus NCPF 7097 was
incubated in the presence of ITC for 8 h prior to addition of AMB, visible antagonistic
effects were observed after 48 h incubation (Fig. 67B). Figure 55 shows how the use of a
20, 30, 40 and 50% (Fig. 55A, B, C, and D, respectively) RSA detection interval cut-off
value affected the FIC index determination. The use of 20, 30, or 40% detection interval
cutoff values was unsuitable because artificially high FIC indices were generated. The
use of a 50% detection interval cutoff was suitable as the resulting indices were identical
to those determined by the use of subjective (visual-based) MIC endpoint definitions.
Unfortunately, a 50% detection interval cutoff was not sufficient in determining FIC
indices on all plates. When the conidial inoculum of A. fumigatus NCPF 7097 was
incubated in the presence of VRC and AMB, additive and/or indifferent effects were
visually observed after 48 h incubation (Fig. 59B). Figure 56 shows how the use of a 40,
50, 60 and 90% (Fig. 56A, B, C, and D, respectively) RSA detection interval cut-off
value affected the FIC index determination. Surprisingly, the use of all of the detection
interval cutoff values generated artificially high FIC indices. The use of a RSA detection
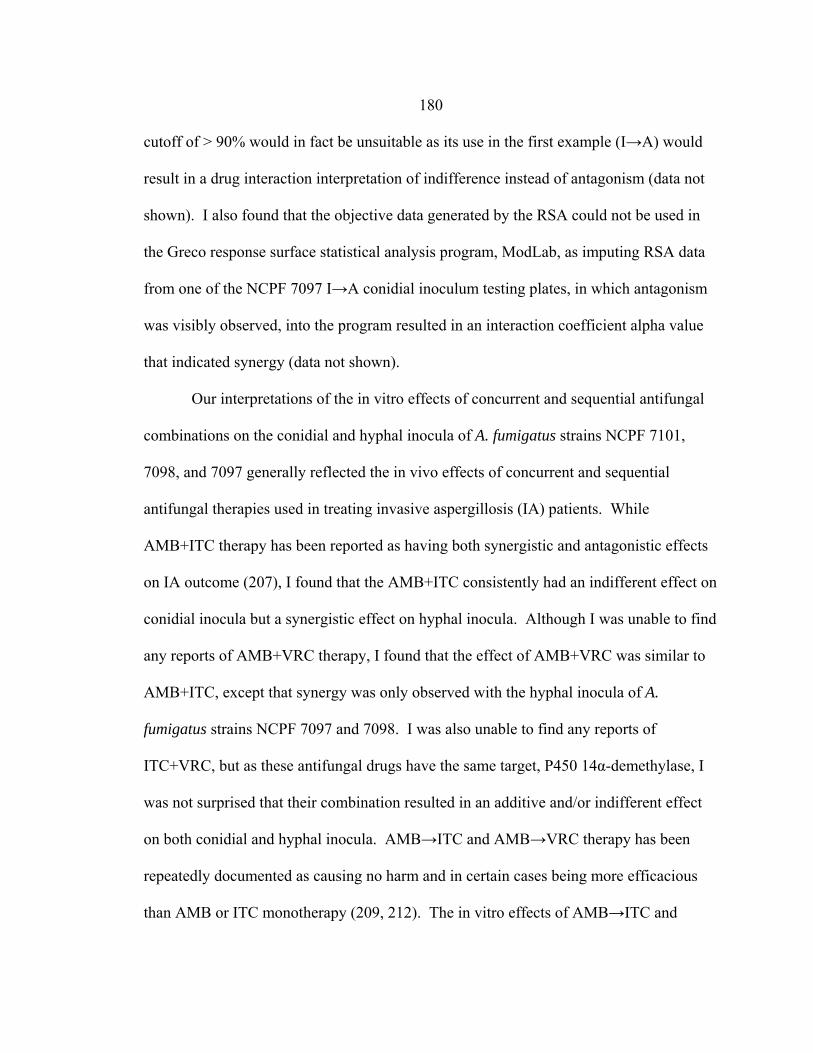
180 cutoff of > 90% would in fact be unsuitable as its use in the first example (I→A) would
result in a drug interaction interpretation of indifference instead of antagonism (data not
shown). I also found that the objective data generated by the RSA could not be used in
the Greco response surface statistical analysis program, ModLab, as imputing RSA data
from one of the NCPF 7097 I→A conidial inoculum testing plates, in which antagonism
was visibly observed, into the program resulted in an interaction coefficient alpha value
that indicated synergy (data not shown).
Our interpretations of the in vitro effects of concurrent and sequential antifungal
combinations on the conidial and hyphal inocula of A. fumigatus strains NCPF 7101,
7098, and 7097 generally reflected the in vivo effects of concurrent and sequential
antifungal therapies used in treating invasive aspergillosis (IA) patients. While
AMB+ITC therapy has been reported as having both synergistic and antagonistic effects
on IA outcome (207), I found that the AMB+ITC consistently had an indifferent effect on
conidial inocula but a synergistic effect on hyphal inocula. Although I was unable to find
any reports of AMB+VRC therapy, I found that the effect of AMB+VRC was similar to
AMB+ITC, except that synergy was only observed with the hyphal inocula of A.
fumigatus strains NCPF 7097 and 7098. I was also unable to find any reports of
ITC+VRC, but as these antifungal drugs have the same target, P450 14α-demethylase, I
was not surprised that their combination resulted in an additive and/or indifferent effect
on both conidial and hyphal inocula. AMB→ITC and AMB→VRC therapy has been
repeatedly documented as causing no harm and in certain cases being more efficacious
than AMB or ITC monotherapy (209, 212). The in vitro effects of AMB→ITC and

181
82.4% 98.4% 84.8% 100.6% 86.9% 82.7% 102.2% 103.9%103.3% 101.2% 92.8% 100.9% 92.0% 90.4% 102.4% 104.7%
99.6% 95.0% 81.9% 83.9% 82.4% 84.1% 93.2% 103.0%103.3% 84.5% 82.8% 84.3% 83.3% 85.0% 97.8% 102.9%
99.0% 94.2% 91.5% 96.6% 84.1% 86.5% 99.9% 102.3%85.7% 74.8% 61.5% 57.4% 54.4% 73.6% 96.0% 98.5%66.4% 50.2% 51.9% 46.0% 40.2% 55.4% 62.0% 70.9%59.0% 57.3% 59.2% 59.6% 55.2% 94.2% 93.4% 101.6%
A
B
C
D
Figure 55. Effect of different MIC endpoint definitions for conidial sequential antifungal testing (I→A) of NCPF 7097. Detection interval cutoff values are 20% (A), 30% (B), 40% (C), and 50% (D). Values in each well represent percent residual glucose. Grey boxes indicate residual glucose percentages that fall below the detection interval cutoff value. Red boxes indicate drug combinations for which FIC values would be determined.

182
81.7% 92.5% 90.3% 88.2% 77.3% 85.6% 83.4% 90.1%91.4% 95.2% 81.4% 82.2% 73.0% 86.2% 79.6% 80.1%88.3% 94.4% 79.4% 85.4% 73.5% 88.2% 79.3% 77.8%89.9% 79.9% 80.2% 79.1% 72.5% 83.6% 75.2% 75.6%79.1% 65.5% 72.3% 76.5% 73.7% 86.7% 73.5% 72.9%75.4% 66.9% 56.7% 69.6% 91.9% 79.9% 72.3% 76.3%77.7% 55.9% 58.2% 59.7% 73.8% 84.0% 73.0% 84.8%72.9% 63.2% 62.0% 60.3% 62.7% 89.5% 81.3% 93.4%
81.7% 92.5% 90.3% 88.2% 77.3% 85.6% 83.4% 90.1%91.4% 95.2% 81.4% 82.2% 73.0% 86.2% 79.6% 80.1%88.3% 94.4% 79.4% 85.4% 73.5% 88.2% 79.3% 77.8%89.9% 79.9% 80.2% 79.1% 72.5% 83.6% 75.2% 75.6%79.1% 65.5% 72.3% 76.5% 73.7% 86.7% 73.5% 72.9%75.4% 66.9% 56.7% 69.6% 91.9% 79.9% 72.3% 76.3%77.7% 55.9% 58.2% 59.7% 73.8% 84.0% 73.0% 84.8%72.9% 63.2% 62.0% 60.3% 62.7% 89.5% 81.3% 93.4%
81.7% 92.5% 90.3% 88.2% 77.3% 85.6% 83.4% 90.1%91.4% 95.2% 81.4% 82.2% 73.0% 86.2% 79.6% 80.1%88.3% 94.4% 79.4% 85.4% 73.5% 88.2% 79.3% 77.8%89.9% 79.9% 80.2% 79.1% 72.5% 83.6% 75.2% 75.6%79.1% 65.5% 72.3% 76.5% 73.7% 86.7% 73.5% 72.9%75.4% 66.9% 56.7% 69.6% 91.9% 79.9% 72.3% 76.3%77.7% 55.9% 58.2% 59.7% 73.8% 84.0% 73.0% 84.8%72.9% 63.2% 62.0% 60.3% 62.7% 89.5% 81.3% 93.4%
81.7% 92.5% 90.3% 88.2% 77.3% 85.6% 83.4% 90.1%91.4% 95.2% 81.4% 82.2% 73.0% 86.2% 79.6% 80.1%88.3% 94.4% 79.4% 85.4% 73.5% 88.2% 79.3% 77.8%89.9% 79.9% 80.2% 79.1% 72.5% 83.6% 75.2% 75.6%79.1% 65.5% 72.3% 76.5% 73.7% 86.7% 73.5% 72.9%75.4% 66.9% 56.7% 69.6% 91.9% 79.9% 72.3% 76.3%77.7% 55.9% 58.2% 59.7% 73.8% 84.0% 73.0% 84.8%72.9% 63.2% 62.0% 60.3% 62.7% 89.5% 81.3% 93.4%
A
B
C
D
Figure 56. Effect of different MIC endpoint definitions for conidial concurrent antifungal testing (V+A) of NCPF 7097. Detection interval cutoff values are 40% (A), 50% (B), 60% (C), and 90% (D). Values in each well represent percent residual glucose. Grey boxes indicate residual glucose percentages that fall below the detection interval cutoff value. Red boxes indicate drug combinations for which FIC values would be determined.
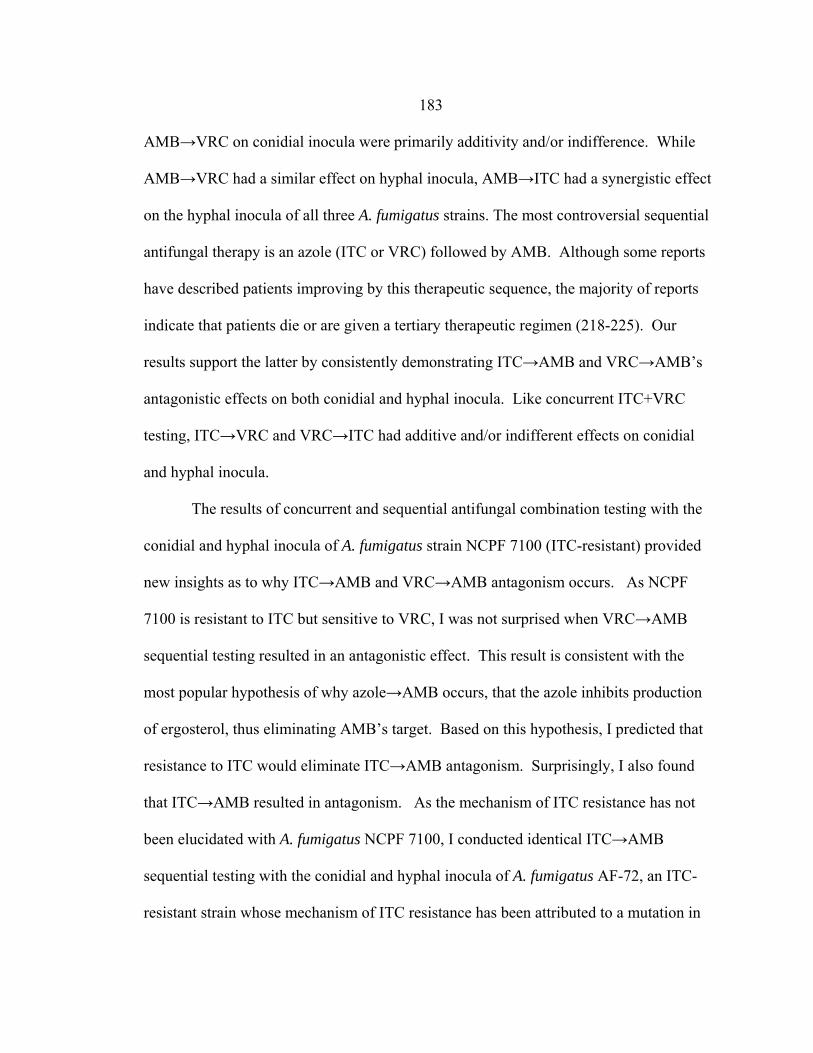
183 AMB→VRC on conidial inocula were primarily additivity and/or indifference. While
AMB→VRC had a similar effect on hyphal inocula, AMB→ITC had a synergistic effect
on the hyphal inocula of all three A. fumigatus strains. The most controversial sequential
antifungal therapy is an azole (ITC or VRC) followed by AMB. Although some reports
have described patients improving by this therapeutic sequence, the majority of reports
indicate that patients die or are given a tertiary therapeutic regimen (218-225). Our
results support the latter by consistently demonstrating ITC→AMB and VRC→AMB’s
antagonistic effects on both conidial and hyphal inocula. Like concurrent ITC+VRC
testing, ITC→VRC and VRC→ITC had additive and/or indifferent effects on conidial
and hyphal inocula.
The results of concurrent and sequential antifungal combination testing with the
conidial and hyphal inocula of A. fumigatus strain NCPF 7100 (ITC-resistant) provided
new insights as to why ITC→AMB and VRC→AMB antagonism occurs. As NCPF
7100 is resistant to ITC but sensitive to VRC, I was not surprised when VRC→AMB
sequential testing resulted in an antagonistic effect. This result is consistent with the
most popular hypothesis of why azole→AMB occurs, that the azole inhibits production
of ergosterol, thus eliminating AMB’s target. Based on this hypothesis, I predicted that
resistance to ITC would eliminate ITC→AMB antagonism. Surprisingly, I also found
that ITC→AMB resulted in antagonism. As the mechanism of ITC resistance has not
been elucidated with A. fumigatus NCPF 7100, I conducted identical ITC→AMB
sequential testing with the conidial and hyphal inocula of A. fumigatus AF-72, an ITC-
resistant strain whose mechanism of ITC resistance has been attributed to a mutation in
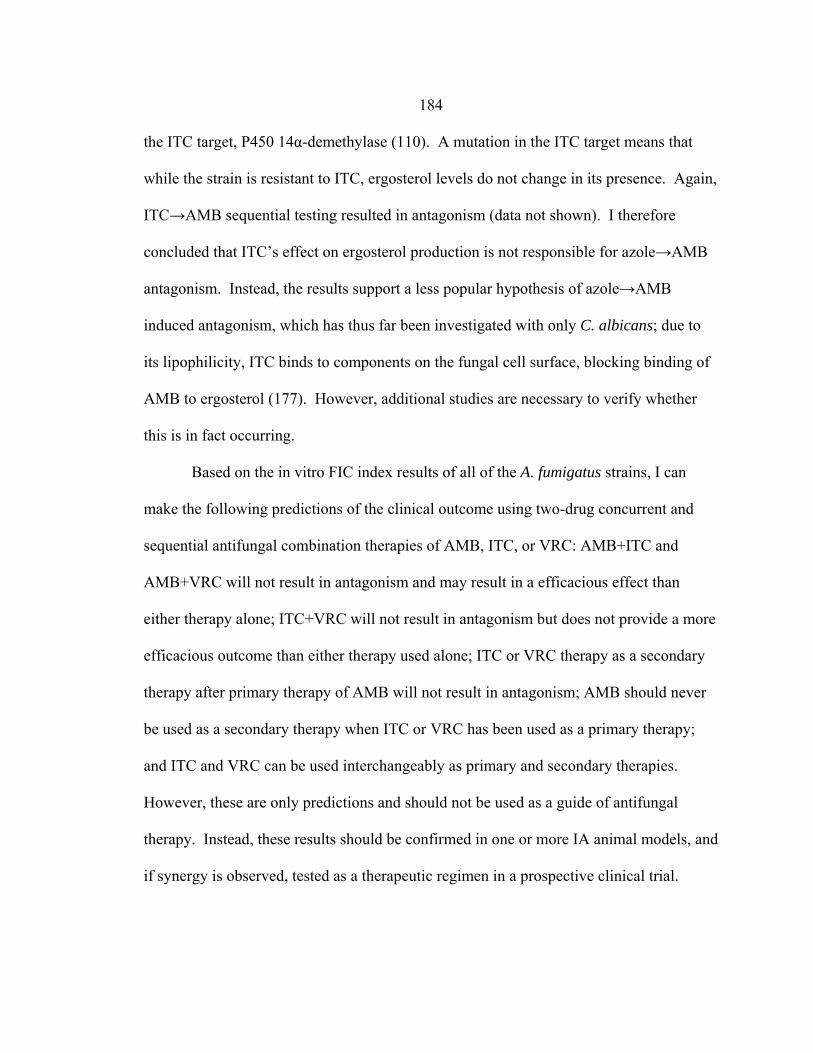
184
the ITC target, P450 14α-demethylase (110). A mutation in the ITC target means that
while the strain is resistant to ITC, ergosterol levels do not change in its presence. Again,
ITC→AMB sequential testing resulted in antagonism (data not shown). I therefore
concluded that ITC’s effect on ergosterol production is not responsible for azole→AMB
antagonism. Instead, the results support a less popular hypothesis of azole→AMB
induced antagonism, which has thus far been investigated with only C. albicans; due to
its lipophilicity, ITC binds to components on the fungal cell surface, blocking binding of
AMB to ergosterol (177). However, additional studies are necessary to verify whether
this is in fact occurring.
Based on the in vitro FIC index results of all of the A. fumigatus strains, I can
make the following predictions of the clinical outcome using two-drug concurrent and
sequential antifungal combination therapies of AMB, ITC, or VRC: AMB+ITC and
AMB+VRC will not result in antagonism and may result in a efficacious effect than
either therapy alone; ITC+VRC will not result in antagonism but does not provide a more
efficacious outcome than either therapy used alone; ITC or VRC therapy as a secondary
therapy after primary therapy of AMB will not result in antagonism; AMB should never
be used as a secondary therapy when ITC or VRC has been used as a primary therapy;
and ITC and VRC can be used interchangeably as primary and secondary therapies.
However, these are only predictions and should not be used as a guide of antifungal
therapy. Instead, these results should be confirmed in one or more IA animal models, and
if synergy is observed, tested as a therapeutic regimen in a prospective clinical trial.

185 In conclusion, I have utilized in vitro checkerboard testing formats to determine
the effects of concurrent and sequential antifungal combinations on the conidial and
hyphal inocula of A. fumigatus clinical isolates and found that concurrent and sequential
antifungal combinations can have differential effects on conidial and hyphal inocula.
Antagonistic effects could be detected with both conidial and hyphal inocula while
synergy was more readily detected with hyphal inocula. As hyphae are the
morphological form of the fungus observed in vivo, I recommend that all future
combination testing be performed with hyphal inocula.
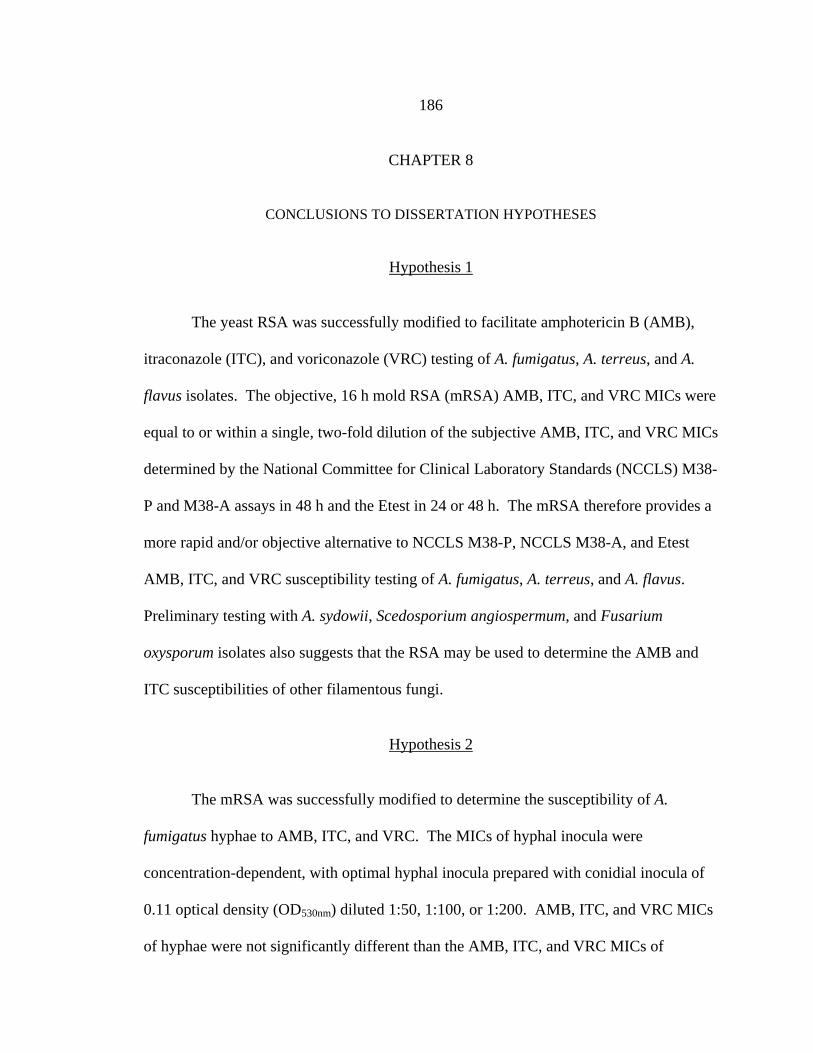
186
CHAPTER 8
CONCLUSIONS TO DISSERTATION HYPOTHESES
Hypothesis 1
The yeast RSA was successfully modified to facilitate amphotericin B (AMB),
itraconazole (ITC), and voriconazole (VRC) testing of A. fumigatus, A. terreus, and A.
flavus isolates. The objective, 16 h mold RSA (mRSA) AMB, ITC, and VRC MICs were
equal to or within a single, two-fold dilution of the subjective AMB, ITC, and VRC MICs
determined by the National Committee for Clinical Laboratory Standards (NCCLS) M38-
P and M38-A assays in 48 h and the Etest in 24 or 48 h. The mRSA therefore provides a
more rapid and/or objective alternative to NCCLS M38-P, NCCLS M38-A, and Etest
AMB, ITC, and VRC susceptibility testing of A. fumigatus, A. terreus, and A. flavus.
Preliminary testing with A. sydowii, Scedosporium angiospermum, and Fusarium
oxysporum isolates also suggests that the RSA may be used to determine the AMB and
ITC susceptibilities of other filamentous fungi.
Hypothesis 2
The mRSA was successfully modified to determine the susceptibility of A.
fumigatus hyphae to AMB, ITC, and VRC. The MICs of hyphal inocula were
concentration-dependent, with optimal hyphal inocula prepared with conidial inocula of
0.11 optical density (OD530nm) diluted 1:50, 1:100, or 1:200. AMB, ITC, and VRC MICs
of hyphae were not significantly different than the AMB, ITC, and VRC MICs of

187 conidia. These data suggest that RSA testing can be performed with conidial or hyphal
inocula. However, we recommend the use of conidial inocula as this facilitates
generation of MICs in a shorter period of time.
Hypotheses 3 and 4
RSA FLC testing of FLC-resistant Candida albicans clinical isolates
demonstrated that the yeast RSA was able to generate clinically relevant FLC MICs.
Yeast RSA conditions were also determined to generate clinically relevant FLC MICs for
C. glabrata clinical isolates.
Hypothesis 5
We were unable to use a RSA-based testing format for interpreting the effects of
concurrent and sequential antifungal combinations on A. fumigatus conidial and hyphal
inocula. We instead interpreted these effects by a visual assessment of growth. Based
on this criterion, our interpretations of the in vitro effects of concurrent and sequential
antifungal combinations on A. fumigatus closely matched the reported outcomes of
invasive aspergillosis patients treated with concurrent and sequential antifungal therapies.
Hypothesis 6
Concurrent and sequential antifungal testing demonstrated that select drug
combinations had differential effects on conidial and hyphal inocula. Specifically, AMB
and ITC, ITC followed by AMB, or VRC followed by AMB had a greater synergistic

188 effect on hyphal, rather than conidial, inocula. In contrast, antagonistic effects could be
detected with both conidial and hyphal inocula.
Hypothesis 7
Although RSA testing provided quantitative imput data for the ModLab program,
interpretations of the interaction coefficients generated by the program did not
consistently correspond to interaction effects determined by visual observation.

189
APPENDIX
ADDITIONAL DATA FROM CONCURRENT AND SEQUENTIAL ANTIFUNGAL COMBINATION TESTING
Fi
gure
57.
Vis
ual g
row
th o
f con
idia
l ino
cula
A. f
umig
atus
stra
ins N
CPF
710
1 (A
), 70
97 (B
), 70
98 (C
), an
d 71
00 (D
) afte
r 48
h co
ncur
rent
AM
B+I
TC c
ombi
natio
n te
stin
g. A
MB
con
cent
ratio
n in
crea
ses o
n th
e ho
rizon
tal a
xis f
rom
righ
t to
left.
ITC
con
cent
ratio
n in
crea
ses o
n th
e ve
rtica
l axi
s fro
m b
otto
m to
top.
AA
BB
CC
DD

190
Figu
re 5
8. V
isua
l gro
wth
of h
ypha
l ino
cula
A. f
umig
atus
stra
ins N
CPF
710
1 (A
), 70
97 (B
), 70
98 (C
), an
d 71
00 (D
) afte
r 48
h co
ncur
rent
AM
B+I
TC c
ombi
natio
n te
stin
g. A
MB
con
cent
ratio
n in
crea
ses o
n th
e ho
rizon
tala
xisf
rom
right
tole
ft.IT
Cco
ncen
tratio
nin
crea
seso
nth
eve
rtica
laxi
sfro
mbo
ttom
toto
p.
BB
DD
AA
CC

191
Figu
re 5
9. V
isua
l gro
wth
of c
onid
ial i
nocu
la o
f A. f
umig
atus
stra
ins N
CPF
710
1 (A
), 70
97 (B
), 70
98 (C
), an
d 71
00 (D
) afte
r 48
h co
ncur
rent
AM
B+V
RC
com
bina
tion
test
ing.
AM
B c
once
ntra
tion
incr
ease
s on
the
horiz
onta
l axi
s fro
m ri
ght t
o le
ft. V
RC
con
cent
ratio
n in
crea
ses o
n th
e ve
rtica
l axi
s fro
m b
otto
m to
to
p.
BB
DD
AA
CC
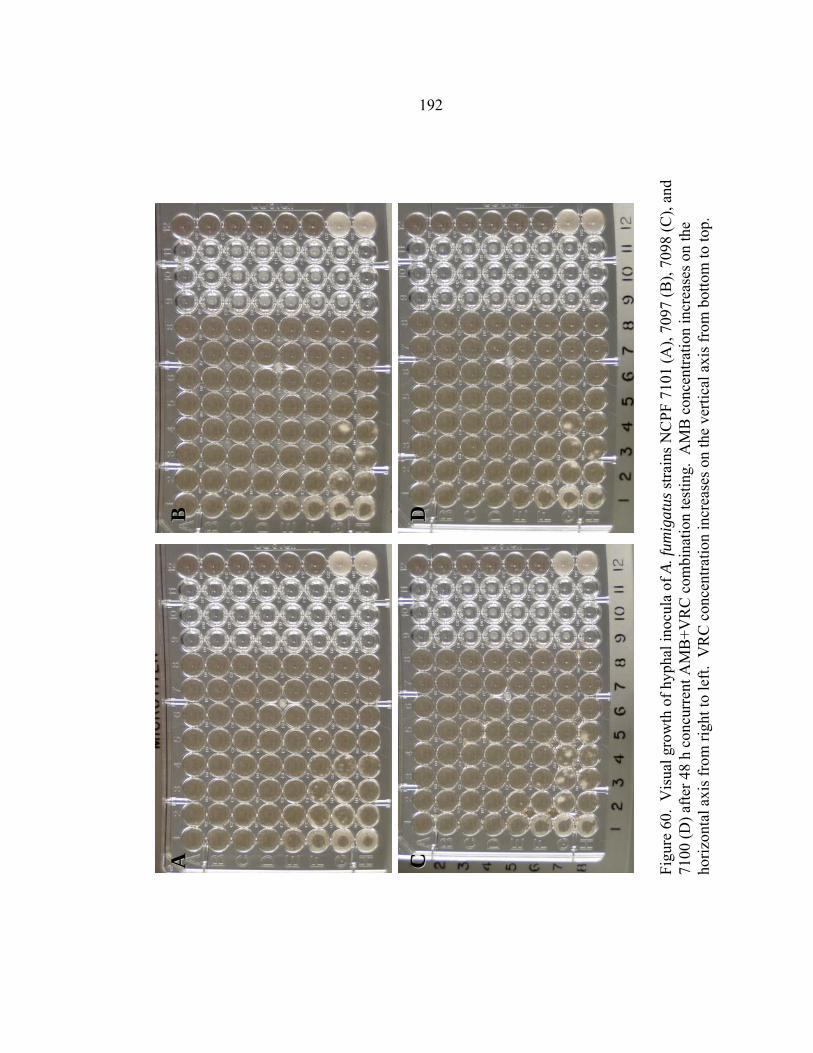
192
Figu
re 6
0. V
isua
l gro
wth
of h
ypha
l ino
cula
of A
. fum
igat
us st
rain
s NC
PF 7
101
(A),
7097
(B),
7098
(C),
and
7100
(D) a
fter 4
8 h
conc
urre
nt A
MB
+VR
C c
ombi
natio
n te
stin
g. A
MB
con
cent
ratio
n in
crea
ses o
n th
e ho
rizon
tal a
xis f
rom
righ
t to
left.
VR
C c
once
ntra
tion
incr
ease
s on
the
verti
cal a
xis f
rom
bot
tom
to to
p.
DD
CC
BB
AA
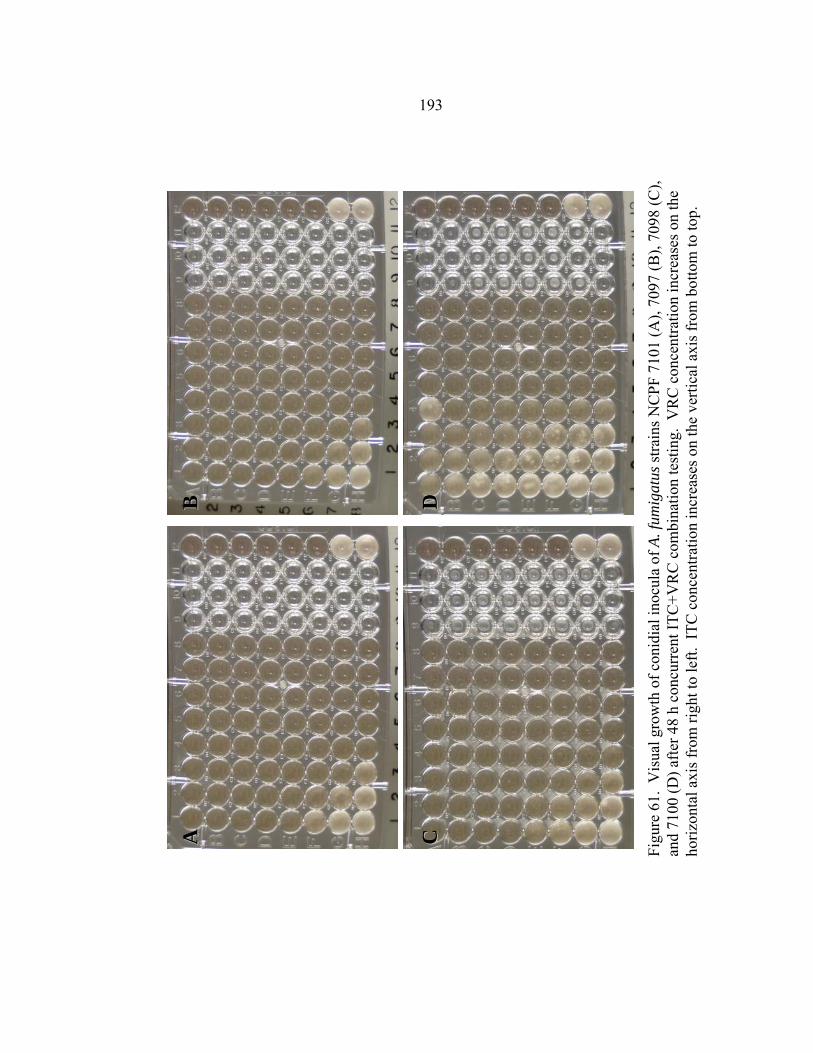
193
Figu
re 6
1. V
isua
l gro
wth
of c
onid
ial i
nocu
la o
f A. f
umig
atus
stra
ins N
CPF
710
1 (A
), 70
97 (B
), 70
98 (C
), an
d 71
00 (D
) afte
r 48
h co
ncur
rent
ITC
+VR
C c
ombi
natio
n te
stin
g. V
RC
con
cent
ratio
n in
crea
ses o
n th
e ho
rizon
tal a
xis f
rom
righ
t to
left.
ITC
con
cent
ratio
n in
crea
ses o
n th
e ve
rtica
l axi
s fro
m b
otto
m to
top.
AA
BB
CC
DD
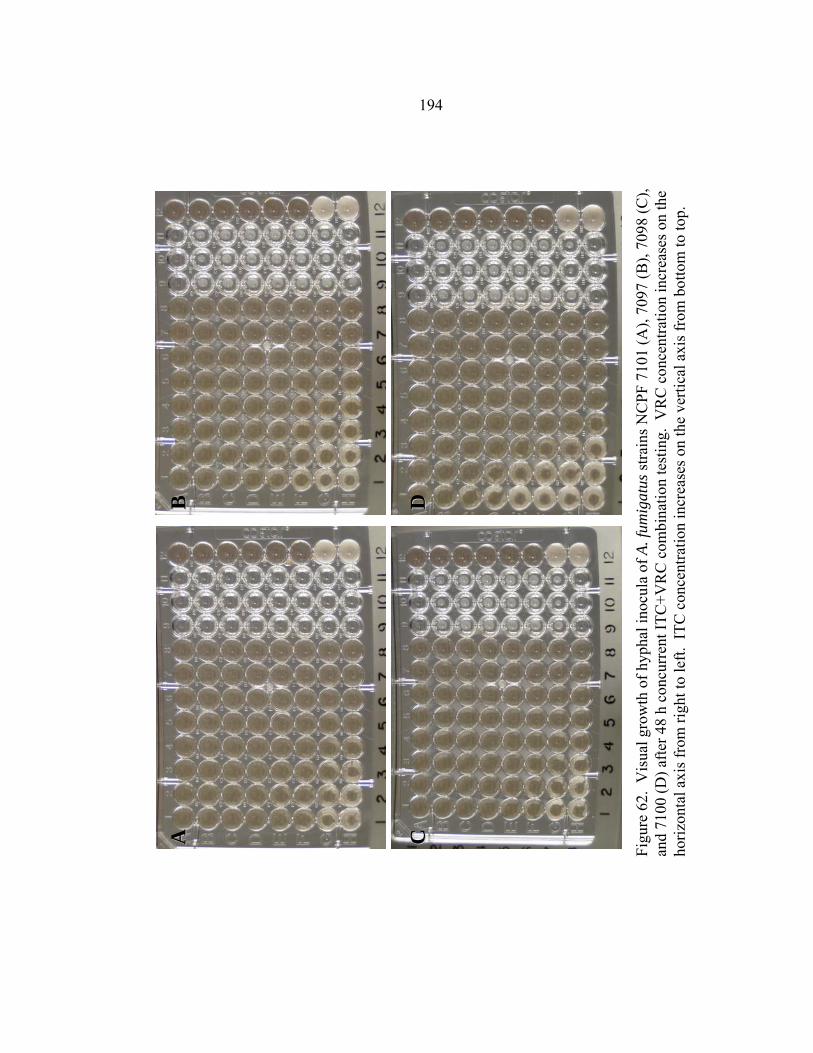
194
Figu
re 6
2. V
isua
l gro
wth
of h
ypha
l ino
cula
of A
. fum
igat
us st
rain
s NC
PF 7
101
(A),
7097
(B),
7098
(C),
and
7100
(D) a
fter 4
8 h
conc
urre
nt IT
C+V
RC
com
bina
tion
test
ing.
VR
C c
once
ntra
tion
incr
ease
s on
the
horiz
onta
l axi
s fro
m ri
ght t
o le
ft. I
TC c
once
ntra
tion
incr
ease
s on
the
verti
cal a
xis f
rom
bot
tom
to to
p.
AA
BB
CC
DD

195
Figu
re 6
3. V
isua
l gro
wth
of c
onid
ial i
nocu
la o
f A. f
umig
atus
stra
ins N
CPF
710
1 (A
), 70
97 (B
), 70
98 (C
), an
d 71
00 (D
) afte
r 48
h se
quen
tial A
MB→
ITC
com
bina
tion
test
ing.
AM
B c
once
ntra
tion
incr
ease
s on
the
horiz
onta
l axi
s fro
m ri
ght t
o le
ft. I
TC c
once
ntra
tion
incr
ease
s on
the
verti
cal a
xis f
rom
bot
tom
to to
p.
CC
BB
AA
DD
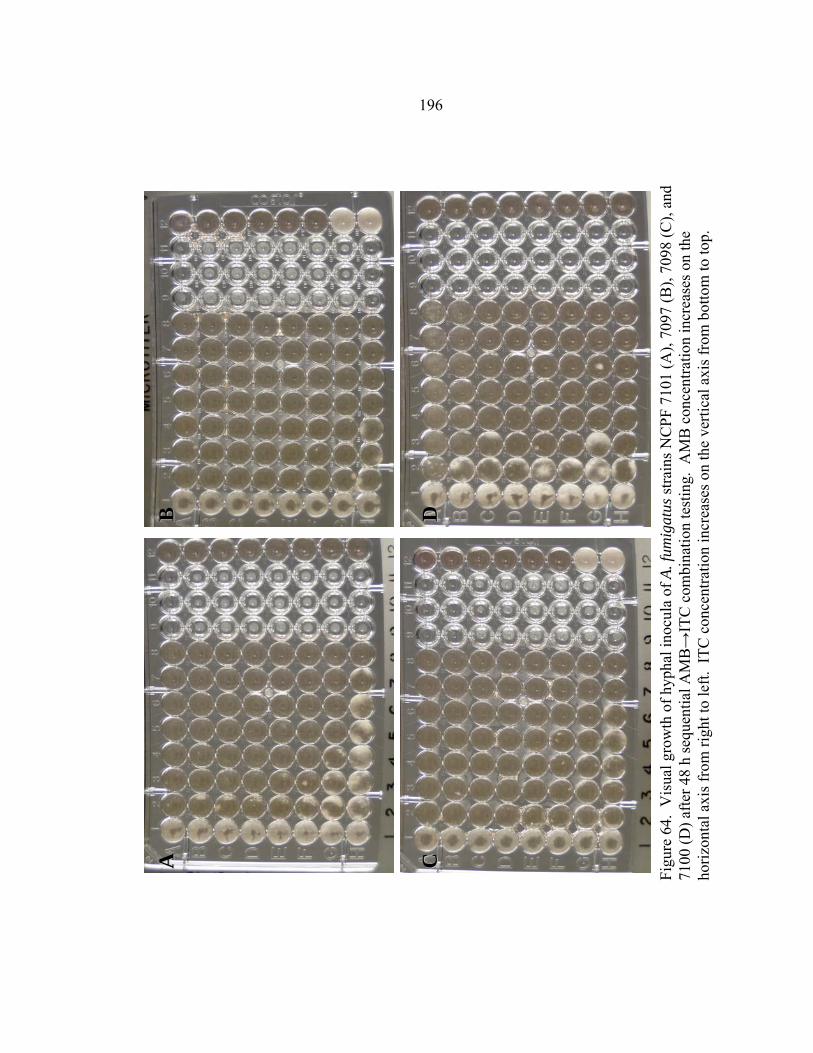
196
Figu
re 6
4. V
isua
l gro
wth
of h
ypha
l ino
cula
of A
. fum
igat
us st
rain
s NC
PF 7
101
(A),
7097
(B),
7098
(C),
and
7100
(D) a
fter 4
8 h
sequ
entia
l AM
B→
ITC
com
bina
tion
test
ing.
AM
B c
once
ntra
tion
incr
ease
s on
the
horiz
onta
l axi
s fro
m ri
ght t
o le
ft. I
TC c
once
ntra
tion
incr
ease
s on
the
verti
cal a
xis f
rom
bot
tom
to to
p.
BB
DD
AA
CC

197
Figu
re 6
5. V
isua
l gro
wth
of c
onid
ial i
nocu
la o
f A. f
umig
atus
stra
ins N
CPF
710
1 (A
), 70
97 (B
), 70
98 (C
), an
d 71
00 (D
) afte
r 48
h se
quen
tial A
MB→
VR
C c
ombi
natio
n te
stin
g. A
MB
con
cent
ratio
n in
crea
ses o
n th
e ho
rizon
tal a
xis f
rom
righ
t to
left.
VR
C c
once
ntra
tion
incr
ease
s on
the
verti
cal a
xis f
rom
bot
tom
to to
p.
AA
BB
DD
CC
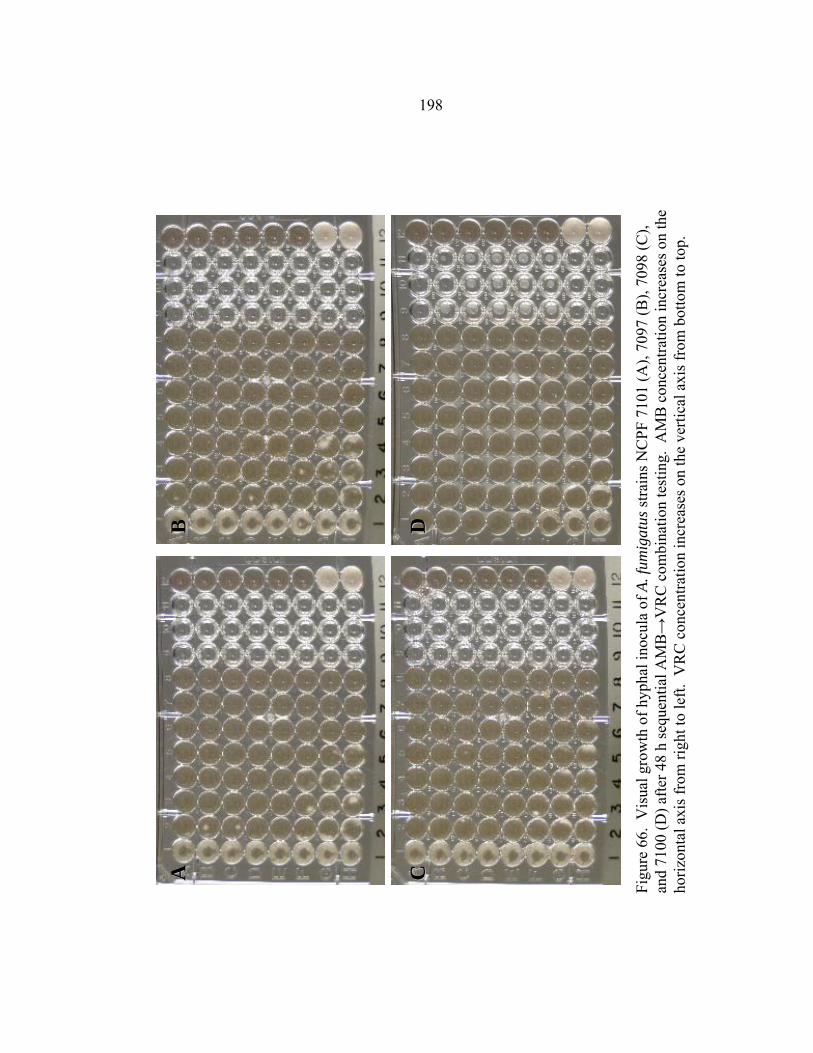
198
Figu
re 6
6. V
isua
l gro
wth
of h
ypha
l ino
cula
of A
. fum
igat
us st
rain
s NC
PF 7
101
(A),
7097
(B),
7098
(C),
and
7100
(D) a
fter 4
8 h
sequ
entia
l AM
B→
VR
C c
ombi
natio
n te
stin
g. A
MB
con
cent
ratio
n in
crea
ses o
n th
e ho
rizon
tal a
xis f
rom
righ
t to
left.
VR
C c
once
ntra
tion
incr
ease
s on
the
verti
cal a
xis f
rom
bot
tom
to to
p.
AA
CC
DD
BB
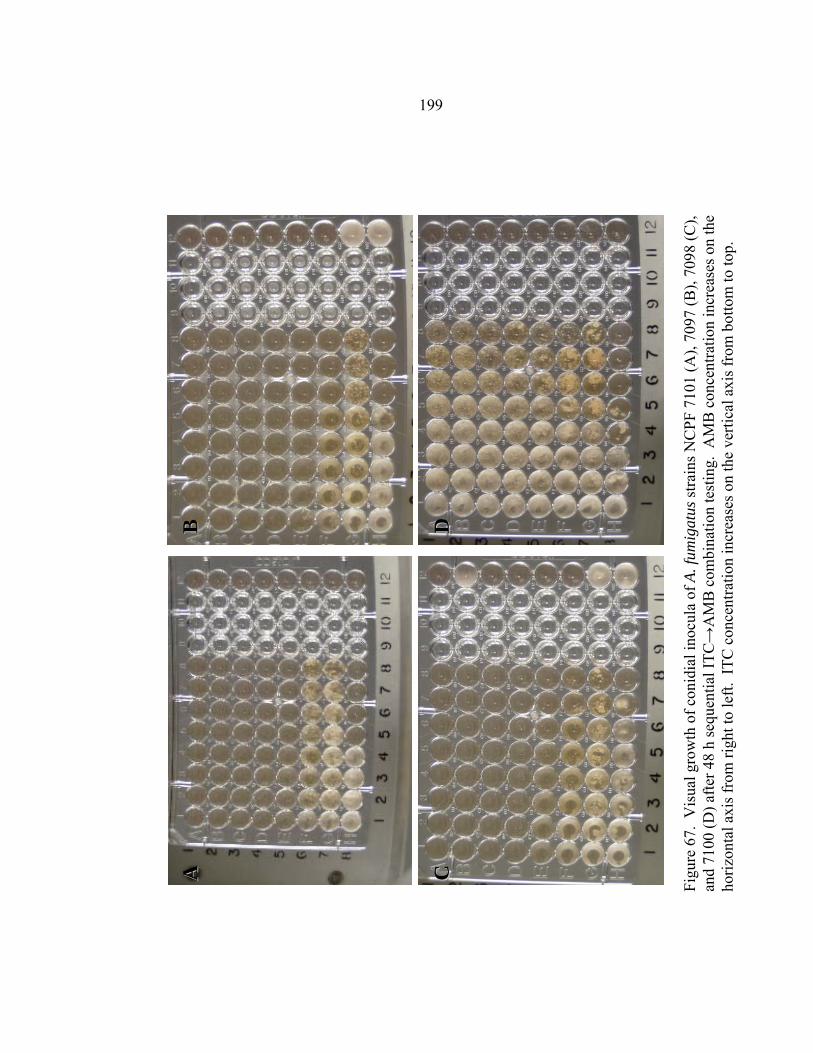
199
Figu
re 6
7. V
isua
l gro
wth
of c
onid
ial i
nocu
la o
f A. f
umig
atus
stra
ins N
CPF
710
1 (A
), 70
97 (B
), 70
98 (C
), an
d 71
00 (D
) afte
r 48
h se
quen
tial I
TC→
AM
B c
ombi
natio
n te
stin
g. A
MB
con
cent
ratio
n in
crea
ses o
n th
e ho
rizon
tal a
xis f
rom
righ
t to
left.
ITC
con
cent
ratio
n in
crea
ses o
n th
e ve
rtica
l axi
s fro
m b
otto
m to
top.
AA
BB
CC
DD

200
Figu
re 6
8. V
isua
l gro
wth
of h
ypha
l ino
cula
of A
. fum
igat
us st
rain
s NC
PF 7
101
(A),
7097
(B),
7098
(C),
and
7100
(D) a
fter 4
8 h
sequ
entia
l ITC
→A
MB
com
bina
tion
test
ing.
AM
B c
once
ntra
tion
incr
ease
s on
the
horiz
onta
l axi
s fro
m ri
ght t
o le
ft. I
TC c
once
ntra
tion
incr
ease
s on
the
verti
cal a
xis f
rom
bot
tom
to to
p.
AA
CC
DD
BB

201
Figu
re 6
9. V
isua
l gro
wth
of c
onid
ial i
nocu
la o
f A. f
umig
atus
stra
ins N
CPF
710
1 (A
), 70
97 (B
), 70
98 (C
), an
d 71
00 (D
) afte
r 48
h se
quen
tial I
TC→
VR
C c
ombi
natio
n te
stin
g. V
RC
con
cent
ratio
n in
crea
ses o
n th
e ho
rizon
tal a
xis f
rom
righ
t to
left.
ITC
con
cent
ratio
n in
crea
ses o
n th
e ve
rtica
l axi
s fro
m b
otto
m to
top.
AA
DD
CC
BB

202
Figu
re 7
0. V
isua
l gro
wth
of h
ypha
l ino
cula
of A
. fum
igat
us st
rain
s NC
PF 7
101
(A),
7097
(B),
7098
(C),
and
7100
(D) a
fter 4
8 h
sequ
entia
l ITC
→V
RC
com
bina
tion
test
ing.
VR
C c
once
ntra
tion
incr
ease
s on
the
horiz
onta
l axi
s fro
m ri
ght t
o le
ft. I
TC c
once
ntra
tion
incr
ease
s on
the
verti
cal a
xis f
rom
bot
tom
to to
p.
AA
CC
DD
BB

203
Figu
re 7
1. V
isua
l gro
wth
of c
onid
ial i
nocu
la o
f A. f
umig
atus
stra
ins N
CPF
710
1 (A
), 70
97 (B
), 70
98 (C
), an
d 71
00 (D
) afte
r 48
h se
quen
tial V
RC→
AM
B c
ombi
natio
n te
stin
g. A
MB
con
cent
ratio
n in
crea
ses o
n th
e ho
rizon
tal a
xis f
rom
righ
t to
left.
VR
C c
once
ntra
tion
incr
ease
s on
the
verti
cal a
xis f
rom
bot
tom
to to
p.
AA
BB
CC
DD

204
Figu
re 7
2. V
isua
l gro
wth
of h
ypha
l ino
cula
of A
. fum
igat
us st
rain
s NC
PF 7
101
(A),
7097
(B),
7098
(C),
and
7100
(D) a
fter 4
8 h
sequ
entia
l VR
C→
AM
B c
ombi
natio
n te
stin
g. A
MB
con
cent
ratio
n in
crea
ses o
n th
e ho
rizon
tal a
xis f
rom
righ
t to
left.
VR
C c
once
ntra
tion
incr
ease
s on
the
verti
cal a
xis f
rom
bot
tom
to to
p.
AA
BB
CC
DD

205
Figu
re 7
3. V
isua
l gro
wth
of c
onid
ial i
nocu
la o
f A. f
umig
atus
stra
ins N
CPF
710
1 (A
), 70
97 (B
), 70
98 (C
), an
d 71
00 (D
) afte
r 48
h se
quen
tial V
RC→
ITC
com
bina
tion
test
ing.
VR
C c
once
ntra
tion
incr
ease
s on
the
horiz
onta
l axi
s fro
m ri
ght t
o le
ft. I
TC c
once
ntra
tion
incr
ease
s on
the
verti
cal a
xis f
rom
bot
tom
to to
p.
AA
BB
DD
BB
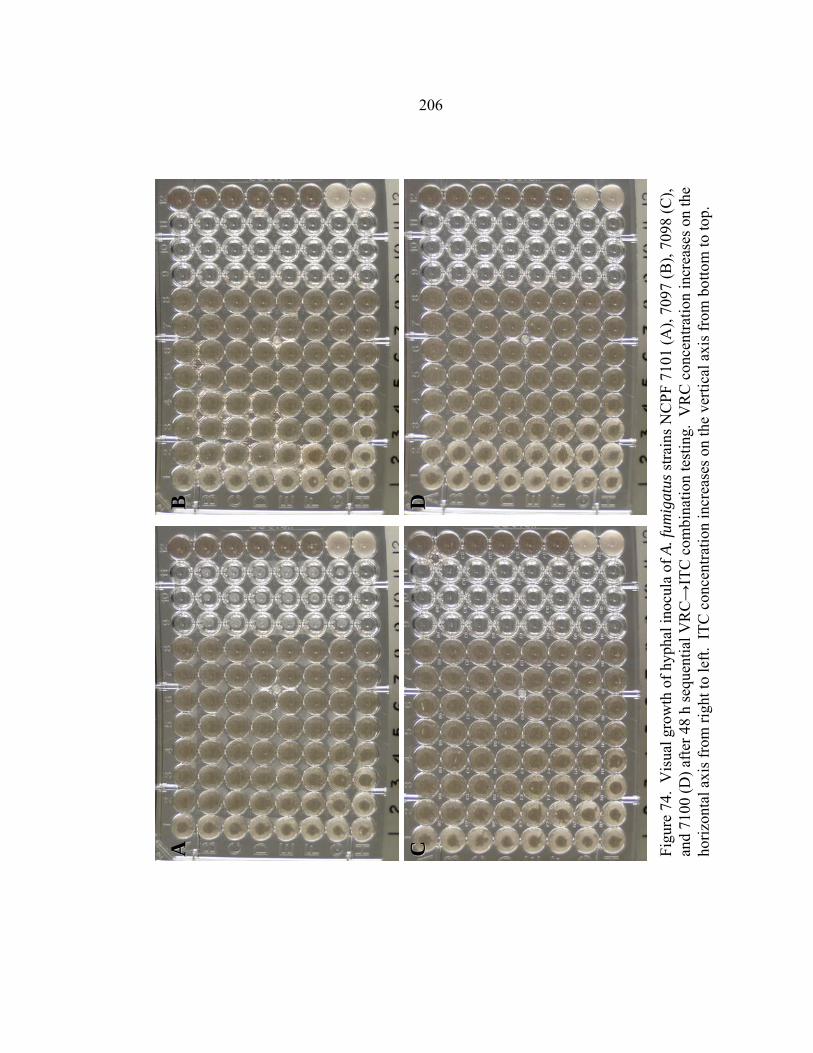
206
Figu
re 7
4. V
isua
l gro
wth
of h
ypha
l ino
cula
of A
. fum
igat
us st
rain
s NC
PF 7
101
(A),
7097
(B),
7098
(C),
and
7100
(D) a
fter 4
8 h
sequ
entia
l VR
C→
ITC
com
bina
tion
test
ing.
VR
C c
once
ntra
tion
incr
ease
s on
the
horiz
onta
l axi
s fro
m ri
ght t
o le
ft. I
TC c
once
ntra
tion
incr
ease
s on
the
verti
cal a
xis f
rom
bot
tom
to to
p.
DD
CC
AA
BB
207
LITERATURE CITED
1. Falkow, S. What is a pathogen? Developing a definition of a pathogen requires looking closely at the many complicated relationships that exist between organisms. ASM News 63(7), 359-365. 1997.
2. Cole, G. T. 2003. Fungal Pathogenesis, p. 20-45. In E. J. Anaissie, M. R. McGinnis, and M. A. Pfaller (eds.), Clinical Mycology. Churchill Livingstone, New York.
3. Pfaller, M. A. and R. P. Wenzel . 2003. The epidemiology of fungal infections, p. 3-19. In E. J. Anaissie, M. R. McGinnis, and M. A. Pfaller (eds.), Clinical Mycology. Churchill Livingstone, New York.
4. Fridkin, S. K. and Jarvis, W. R. Epidemiology of nosocomial fungal infections. Clinical Microbiology Reviews 9(4), 499-511. 1996.
5. Schell, W. A. New aspects of emerging fungal pathogens: a multifaceted challenge. Clinics in Laboratory Medicine 15(2), 365-387. 1995.
6. Anaissie, E. J. and Bodey, G. P. Nosocomial fungal infections: old problems and new challenges. Infect Dis Clin North Am 3, 867. 1989.
7. Harvey, R. L. Nosocomial fungemia in a large community teaching hospital. Annuals of Internal Medicine 147, 2117-2120. 1987.
8. Pfaller, M. A. Epidemiology and control of fungal infections. Clinical Infectious Diseases 19(Suppl 1), S8-S13. 1994.
9. Beck-Sague, C. M. Secular trends in the epidemiology of nosocomial fungal infections in the United States, 1980-1990. Journal of Infectious Diseases 167, 1247-1251. 1993.
10. Bodey, G. P. The emergence of fungi as major hospital pathogens. Journal of Hospital Infections 11(Suppl A), S411-S426. 1988.
11. Pfaller, M. A., Jones, R. N., Messer, S. A., Edmond, M. B., Wenzel, R. P., and SCOPE Participant Group. National surveillence of nosocomial blood stream infection due to species of Candida other than Candida albicans: frequency of occurence and antifungal susceptibility in the SCOPE program. Diagn Microbiol Infect Dis 30, 121-129. 1998.
12. Wingard, J. R. Aspergillosis: are we making progress? Infect Med 20(6), 294-304. 2003.
208
13. Dignani, M. C., J. S. Solomkin, and E. J. Anaissie. 2003. Candida, p. 195-239. In E. J. Anaissie, M. R. McGinnis, and M. A. Pfaller (eds.), Clinical Mycology. Churchill Livingston, New York.
14. Wey, S. B., Mori, M., Pfaller, M. A., Woolson, R., and Wenzel, R. P. Hospital-acquired candidemia: the attributable mortality and excess length of stay. Archives of Internal Medicine 148, 2642-2645. 1988.
15. Rex, J. H., Pfaller, M. A., Barry, A. L., Nelson, P. W., Webb, C. D., NIAID Mycoses Study Group, and Candidemia Study Group. Antifungal susceptibility testing of isolates from a randomized, multicenter trial of fluconazole versus amphotericin B as treatment of nonneutropenic patients with candidemia. Antimicrobial Agents and Chemotherapy 39(1), 40-44. 1995.
16. Nguyen, M. H., Peacock Jr.J.E., Morris, A. J., Tanner, D. C., Nguyen, M. L., Snydman, D. R., Wagener, M. M., Rinaldi, M. G, and Yu, V. The changing face of candidemia: emergence of non-Candida albicans species and antifungal resistance. American Journal of Medicine 100, 617-623. 1996.
17. Kao, A. S., Brandt, M. E., Pruitt, W. R., Conn, L. A., Perkins, B. A., Stephens, D. S., Baughman, W. S., Reingold, A. L., Rothrock, G. A., Pfaller, M. A., Pinner, R. W., and Hajjeh, R. A. The epidemiology of candidemia in two United States cities: results of a population-based active surveillance. Clinical Infectious Diseases 29, 1164-1170. 1999.
18. Rees, J. R., Pinner, R. W., Hajjeh, R. A., Brandt, M. E., and Reingold, A. L. The epidemiological features of invasive mycotic infections in the San Francisco Bay area, 1992-1993: Results of population-based laboratory active surveillance. Clinical Infectious Diseases 27, 1138-1147. 1998.
19. Edmond, M. B., Wallace, S. E., McClish, D. K., Pfaller, M. A., Jones, R. N., and Wenzel, R. P. Nosocomial bloodstream infections in United States Hospitals: a three-year analysis. Clinical Infectious Diseases 29, 239-244. 1999.
20. Pfaller, M. A., Diekema, D. J., Jones, R. N., Messer, S. A., Hollis, R. J., and SENTRY Participants Group. Trends in antifungal susceptibility of Candida spp. isolated from pediatric and adult patients with bloodstream infections: SENTRY antimicrobial surveillance program, 1997 to 2000. Journal of Clinical Microbiology 40(3), 852-856. 2002.
21. Asmundsdottir, L. R., Erlendsdottir, H., and Gottfredsson, M. Increasing incidence of candidemia: results from a 20-year nationwide study in Iceland. Journal of Clinical Microbiology 40(9), 3489-3492. 2002.
209
22. Sandven, P., Bevanger, L., Digranes, A., Gaustad, P., Haukland, H. H., Steinbakk, M., and Norwegian Yeast Study Group. Constant low rate of fungemia in Norway, 1991 to 1996. Journal of Clinical Microbiology 36(12), 3455-3459. 1998.
23. Viscoli, C., Girmenia, C., Marinus, A., Collette, L., Maschmeyer, G., Doyen, C., Lebeau, B., Spence, D., Kremery, V., De Pauw, B. E., Meunier, F., and Invasive Fungal Infection Group of the EORTC. Candidemia in cancer patients: a prospective, multicenter surveillance study by the invasive fungal infection group (IFIG) of the Europeans Organization for Research and treatment of cancer (EORTC). Clinical Infectious Diseases 28, 1071-1079. 1999.
24. Yamamura, D. L., Rotstein, C., Nicolle, L. E., Ioannou, S., and Fungal Disease Registry of the Canadian Infectious Disease Society. Candidemia at selected Canadian sites: results from the Fungal Disease Registry, 1992-1994. Canadian Medical Association Journal 160, 493-499. 1999.
25. Rennert, G., Rennert, H. S., Pitlik, S., Finkelstein, R., and Kitzes-Cohen, R. Epidemiology of candidemia - a nationwide survey in Israel. Infection 28, 26-29. 2000.
26. St-Germain, G., Laverdiere, M., Pelletier, R., Bourgault, A. M., Libman, M., Lemieux, C., and Noel, G. Prevalence and antifungal susceptibility of 442 Candida isolates from blood and other normally sterile sites: results of a 2-year (1996 to 1998) multicenter surveillance study in Quebec, Candida. Journal of Clinical Microbiology 39(3), 949-953. 2001.
27. Marco, F., Danes, C., Almela, M., Jurado, A., Mensa, J., Puig de la Bellacasa, J., Espasa, M., Martinez, J. A., and Jimenez de Anta, M. T. Trends in frequency and in vitro susceptibilities to antifungal agents, including voriconazole and anidulafungin, of Candida bloodstream isolates. Results from a six-year study. Diagn Microbiol Infect Dis 46, 259-264. 2003.
28. Bulmer, G. S., Marquez, M. A., Co-Barcelona, L., and Fromtling, R. A. Yeasts and fluconazole susceptibility in the Philippines. Mycopathologia 146, 117-120. 1999.
29. Meis, J., Petrou, M. A., Bille, J., Ellis, D., Gibbs, D., and Global Antifungal Surveillance Group. A global evaluation of the susceptibility of Candida species to fluconazole by disk diffusion. Diagn Microbiol Infect Dis 36, 215-223. 2000.

210
30. Blumberg, H. M., Jarvis, W. R., Soucie, J. M., Edwards, Jr. J. E., Patterson, J. E., Pfaller, M. A., Rangel-Frausto, M. S., Rinaldi, M. G, Saiman, L., Wiblin, R. T., Wenzel, R. P., and NEMIS Study Group. Risk factors for candidal bloodstream infections in surgical intensive care unit patients: the NEMIS prospective multicenter study. Clinical Infectious Diseases 33, 177-186. 2001.
31. Rangel-Frausto, M. S., Wiblin, R. T., Blumberg, H. M., Saiman, L., Patterson, J. E., Rinaldi, M. G, Pfaller, M. A., Edwards, Jr. J. E., Jarvis, W. R., Dawson, J., and Wenzel, R. P. National epidemiology of mycoses study (NEMIS): variations in the rates of bloodstream infections due to Candida species in seven surgical intensive care units. Clinical Infectious Diseases 29, 253-258. 1999.
32. Kao, A. S., Brandt, M. E., Pruitt, W. R., Conn, L. A., Perkins, B. A., Stephens, D. S., Baughman, W. S., Reingold, A. L., Rothrock, G. A., Pfaller, M. A., Pinner, R. W., and Hajjeh, R. A. The epidemiology of candidemia in two United States cities: results of a population-based active surveillance. Clinical Infectious Diseases 29, 1164-1170. 1999.
33. Diekema, D. J., Messer, S. A., Brueggemann, A. B., Coffman, S. L., Doern, G. V., Herwaldt, L. A., and Pfaller, M. A. Epidemiology of candidemia: three-year results from the emerging infections and the epidemiology of Iowa organisms study. Journal of Clinical Microbiology 40, 1298-1302. 2002.
34. Richardson, M. D. 2003. Aspergillus, p. 273-296. In E. J. Anaissie, M. R. McGinnis, and M. A. Pfaller (eds.), Clinical Mycology. Churchill Livingston, New York.
35. 1992. Aspergillosis, p. 201-247. In K. J. Kwon-Chung and J. E. Bennett (eds.), Medical Mycology. Lea & Febiger, Philadephia.
36. Young, R. C., Jennings, A., and Bennett, J. E. Species identification of invasive aspergillosis in man. American Journal of Clinical Pathology 58, 554-557. 1972.
37. Pannuti, C. S., Gingrich, R. D., Pfaller, M. A., and Wenzel, R. P. Nosocomial pneumonia in adult patients undergoing bone marrow transplantation: a 3-year study. Journal of Clinical Oncology 9, 77-84. 1991.
38. Rhame, F. Prevention of nosocomial aspergillosis. Journal of Hospital Infection 18 (Suppl A), 466-472. 1991.
39. Walsh, T. J. and Dixon, D. M. Nosocomial aspergillosis: environmental microbiology, hospital epidemiology, diagnosis and treatment. European Journal of Epidemiology 5(2), 131-142. 1989.
211
40. Fishman, J. A. Overview: fungal infections in the transplant patient. Transplant Infect Dis 4(Suppl 3), 3-11. 2002.
41. Goldman, A. I., and Kersey, J. A prospective study of infectious diseases following bone marrow transplantation: emergence of Aspergillus and Cytomegalovirus as the major causes of mortality. Infection Control 4(2), 81-89. 1983.
42. Steinbach, W. J. and Stevens, D. A. Review of newer antifungal and immunomodulary strategies for invasive aspergillosis. Clinical Infectious Diseases 37 (Suppl 3), 157-187. 2003.
43. Herbrecht, R., Denning, D. W., and Patterson, T. F. Voriconazole versus amphotericin B for primary therapy of invasive aspergillosis. New England Journal of Medicine 347, 408-415. 2002.
44. Mercurio, M. G. and Elewski, B. Therapy of sporotrichosis. Semin Dermatology 12, 285. 1993.
45. Hazen, E. L. and Brown, R. Fungicidin, antibiotic produced by soil actinomycete. Proceedings for the Society of Experimental Biology and Medicine 76, 93-97. 1951.
46. Gold, W., H. A. Stout, I. F. Pagona, and R. Donovick. 1955. Amphotericins A and B, antifungal antibiotics produced by a streptomycete. I. In vitro studies., p. 579-586. In Antibiotics Annual, 1955-1956. Medical Encyclopedia, Inc., New York.
47. Drutz, D. J. Amphotericin B in the treatment of coccidioidomycosis. Drugs 26, 337-346. 1983.
48. Kelly, P. C. 1980. Coccidioidal meningitis, p. 163-193. In D. A. Stevens (ed.), Coccidioidomycosis: A Text. New York.
49. Hoeprich, P. D. Clinical use of amphotericin B and derivitives: lore, mistique, and fact. Clinical Infectious Diseases 1(suppl), S114-S119. 1992.
50. Gallis, H. A., Drew, R. H., and Pickard, W. W. Amphotericin B: 30 years of clinical experience. Review of Infectious Diseases 12, 308-329. 1990.
51. Gallis, H. A. Amphotericin B: a commentary on its role as an antifungal agent and as a comparative agent in clinical trials. Clinical Infectious Diseases 2(suppl), S145-S147. 1996.
212
52. Winn, W. A. Coccidioidomycosis and amphotericin B. Med Clin North Am 47, 1131-1148. 1963.
53. Groll, A. H., S. C. Piscitelli, and T. J. Walsh. 1998. Clinical pharmacology of systemic antifungal agents: a comprehensive review of agents in clinical us, current investigational compounds, and putative targets for antifungal drug development, p. 343-500. In J. T. August, M. W. Anders, F. Murad, and J. T. Coyle (eds.), Academic Press, San Diego.
54. Duschinsky, R., Pleven, E., and Heidelberger, C. The synthesis of 5-fluoropyrimidines. J Am Chem Soc 79, 4559-4560. 1957.
55. Bennett, J. E. Flucytosine. Annuals of Internal Medicine 86, 319-322. 1977.
56. Stiller, R. L., Bennett, J. E., Scholer, H. J., Wall, M., Polak, A., and Stevens, D. A. Correlation of in vitro susceptibility test results with in vivo response: Flucytosine therapy in a systemic candidiasis model. Journal of Infectious Diseases 147, 1070-1077. 1983.
57. Polak, A. and D. M. Dixon. 1987. In vivo/in vitro correlation of antifungal susceptibility testing using 5-fluorocytosine and ketoconazole as examples of two extremes, p. 45-55. In R. A. Fromtling (ed.), Recent Trends in the Discovery and Evaluation of Antifungal Agents. JR Prous Science Publishers, Barcelona.
58. Utz, J. P., Garrigues, I. L., Sande, M. A., Warner, J. F., Mandell, G. L., and McGehee, R. F. Therapy of cryptococcosis with a combination of flucytosine and amphotericin B. Journal of Infectious Diseases 132, 368-373. 1975.
59. Saag, M., Cloud, G. A., Graybill, J. R., Sobel, J. D., Tuazon, C. U., Johnson, P. C., Fessel, W. J., Moskovitz, B. L., Wiesinger, B., Cosmatos, D., Riser, L., Thomas, C., Hafner, R., Dismukes, W. E., and National Institute of Allergy and Infectious Diseases Mycoses Study Group. A comparison of itraconazole versus fluconazole as maintenance therapy for AIDS-associated cryptococcal meningitis. Clinical Infectious Diseases 28, 291-296. 1999.
60. Bennett, J. E., Dismukes, W. E., Duma, R. J., Medoff, G., Sande, M. A., and Gallis, H. A. A comparison of amphotericin B alone and in combination with flucytosine in the treatment of cryptococcal meningitis. New England Journal of Medicine 301, 126-131. 1979.
61. Dismukes, W. E., Cloud, G. A., Gallis, H. A., Kerkering, T. M., Medoff, G., and Craven, P. C. Treatment of cryptococcal meningitis with combination amphotericin B and flucytosine for four as compared with six weeks. New England Journal of Medicine 317, 334-341. 1987.
213
62. Van der Horst, C. M., Saag, M. S., Cloud, G. A., Hamill, R. J., Graybill, J. R., and Sobel, J. D. Treatment of cryptococcal meningitis associated with the acquired immunodificiency syndrome. National Institute of Allergy and Infectious Diseases, Mycoses Study Group. New England Journal of Medicine 337, 15-21. 1997.
63. Zuger, A., Louie, E., Holzman, R. S., Simberkoff, M. S., and Rahal, J. J. Cryptococcal disease in patients with the acquired immune deficiency syndrome. Diagnostic features and outcome of treatment. Annuals of Internal Medicine 104, 234-240. 2003.
64. Larsen, R. A., Bauer, M., Weiner, J. M., Diamond, D. M., Leal, M. A., Ding, J. C., Rinaldi, M. G, and Graybill, J. R. Effect of fluconazole on fungicidal activity of flucytosine in murine cryptococcal meningitis. Antimicrobial Agents and Chemotherapy 40(9), 2178-2182. 1996.
65. Sanche, S. E., D. A. Sutton, and M. G. Rinaldi. 2003. Dematiaceous Fungi, p. 325-351. In E. J. Anaissie, M. R. McGinnis, and M. A. Pfaller (eds.), Clinical Mycology. Churchill Livingstone, New York.
66. Bayles, M. A. Chromomycosis. Current Topics in Medical Mycology 6, 221-243. 1995.
67. Burgess, M. A. and Bodey, G. P. Clotrimazole (Bay b 5097): in vitro and clinical pharmacological studies. Antimicrobial Agents and Chemotherapy 2, 423-426. 1972.
68. Fainstein, V. and Bodey, G. P. Cardiorespiratory toxicity due to miconazole. Annuals of Internal Medicine 93, 432-433. 1980.
69. Dismukes, W. E., Stamm, A. M., and Graybill, J. R. Treatment of systemic mycoses with ketoconazole: emphasis on toxicity and clinical response in 52 patients. Annuals of Internal Medicine 98(1), 13-20. 2003.
70. Negroni, R., Robles, A. M., and Arechavala, A. Ketoconazole in the treatment of paracoccidioidomycosis and histoplasmosis. Review of Infectious Diseases 2, 643-649. 1980.
71. Saag, M., Bradsher, R. W., and Chapman, S. W. Treatment of blastomycosis and histoplasmosis with ketoconazole. Annuals of Internal Medicine 103, 861-872. 1985.
72. Bradsher, R. W., Rice, DC., and Abernathy, R. S. Ketoconazole therapy for endemic blastomycosis. Annuals of Internal Medicine 103, 872-879. 1985.
214
73. Galgiani, J. N., Stevens, D. A., Graybill, J. R., and National Institute of Allergy and Infectious Diseases Mycoses Study Group. Ketoconazole therapy of progressive coccidioidomycosis: comparison of 400 and 800 mg dose and observations at higher doses. American Journal of Medicine 84, 603-610. 1988.
74. Calhoun, D. L., Waskin, H., White, M. P., Bonner, J. R., Mulholland, J. H., Rumans, L. W., Stevens, D. A., and Galgiani, J. N. Treatment of systemic sporotrichosis with ketoconazole. Review of Infectious Diseases 13, 47-51. 1991.
75. Manian, F. A. and Brischetto, M. J. Pulmonary infection due to Exophiala jeanselmei: successful treatment with ketoconazole. Clinical Infectious Diseases 16, 445. 1993.
76. Como, J. A. and Dismukes, W. E. Oral azole drugs as systemic antifungal therapy. New England Journal of Medicine 330, 263-272. 1994.
77. Bastert, J., Schaller, M., Korting, H. C., and Evans, E. G. V. Current and future approaches to antimycotic treatment in the era of resistant fungi and immunocompromised hosts. International Journal of Antimicrobial Agents 17, 81-91. 2001.
78. Roilides, E., Dagnani, M. C., Anaissie, E. J., and Rex, J. H. The role of immunoreconstitution in the management of refactory opportunistic fungal infections. Medical Mycology 36, 12-25. 1998.
79. Jessup, C., Reyes, G., Fothergill, A, McCarthy, D., Rinaldi, M. G, Messer, S. A., Pfaller, M. A., and Ghannoum, M. Head-on comparison of the in vitro antifungal activity of conventional and lipid-based amphotericin B: a multicenter study. Journal of Chemotherapy 12(1), 22-29. 2000.
80. Hiemenz, J. W. and Walsh, T. J. Emergency-use amphotericin B lipid complex (ABLC) in the treatment of aspergillosis: historical -control comparison with amphotericin B. Blood 86, 849a. 1995.
81. White, M. H., Anaissie, E. J., and Kusne, S. Amphotericin B colloidal dispersion vs amphotericin B as therapy for invasive aspergillosis. Clinical Infectious Diseases 24, 635-642. 1997.
82. Bowden, R., Chandrasekar, P. H., and White, M. H. A double-blind, randomized, controlled trial of amphotericin B colloidal dispersion versus amphotericin B for treatment of invasive aspergillosis in immunocompromised patients. Clinical Infectious Diseases 35, 359-366. 2002.
215
83. Ellis, M., Spence, D., De Pauw, B. E., Meunier, F., Marinus, A., Collette, L., Sylvester, R., Meis, J., Boogaerts, M., Selleslag, D., Kremery, V., von Sinner, W., MacDonald, P., Doyen, C., and Vandercam, B. An EORTC international multicenter randomized trial (EORTC number 19923) comparing two dosages of liposomal amphotericin B for treatment of invasive aspergillosis. Clinical Infectious Diseases 27, 1406-1412. 1998.
84. Stone, E. A., Fung, H. B., and Kirschenbaum, H. L. Caspofungin: an echinocandin antifungal agent. Clinical Therapeutics 24(3), 351-377. 2002.
85. New antimicrobial agents approved by the U.S. Food and Drug Administration in 2001 and new indications for previously approved agents. Antimicrobial Agents and Chemotherapy 46(4), 1160. 2002.
86. Villanueva, A., Arathoon, E. G., and Gotuzzo, E. A randomized double-blind study of caspofungin versus amphotericin B for the treatment of candidal esophagitis. Journal of Infectious Diseases 33, 1529-1535. 2001.
87. Arathoon, E. G., Gotuzzo, E., and Noriega, L. A randomized double-blind multicenter trial of MK-0991, an echinocandin antifungal agent, vs amphotericin B for the treatment of oropharyngeal and esophageal candidiasis in adults. Program and Abstracts of the 36th Annual Meeting of Infectious Diseases Society of America . 1998. Denver.
88. Chandrasekar, P. H. and Manavathu, E. K. Caspofungin. Drugs of Today 38(12), 829-846. 2002.
89. Maertens, J., Raad, I., Sable, C. A., Ngai, A., Berman, R., Patterson, T. F, Denning, D. W., and Walsh, T. J. Multicenter, noncomparative study to evaluate safety and efficacy of caspofungin (CAS) in adults with invasive aspergillosis (IA) refactory (R) or intolerant (I) to amphotericin B (AMB), AMB lipid formulations (Lipid AMB) or azoles. Program and Abstracts of the 40th Interscience Conference on Antimicrobial Agents and Chemotherapy . 2000. Toronto.
90. Denning, D. W., Ribaud, P., and Milpied, N. Efficacy and safety of voriconazole in the treatment of acute invasive aspergillosis. Clinical Infectious Diseases 34, 563-571. 2002.
91. Jeu, L., Piacenti, P. J., Lyakhovetskiy, A. G., and Fung, H. B. Voriconazole. Clinical Therapeutics 25(5), 1321-1381. 2003.
92. Medoff, G., Brajtburg, J., and Kobayashi, G. S. Antifungal agents useful in therapy of systemic fungal infections. Annual Review of Pharmacology and Toxicology 23, 303-330. 1983.
216
93. Readio, J. D. and Bittman, R. Equilibrium binding of amphotericin B and its methyl ester and borate complex to sterols. Biochem Biophs Acta 685, 219-224. 1982.
94. Schell, R. E. Proton permeability of renal membranes: influence of amphotericin B. Nephron 63, 481. 1993.
95. Hsu, S.-F. and Burnett, R. R. The effect of amphotericin B on the K-channel activity of MDCK cells. Biochem Biophys Acta Protein Struct Mol Enzymol 1152, 189. 1993.
96. McGinnis, M. R. and M. G. Rinaldi. 2003. Antifungal Drugs: Mechanisms of Action, Drug Resistance, Susceptibility Testing, and Assays of activity in biological fluids, p. 198-257. In V. Lorian (ed.), Antibiotics in Laboratory Medicine. Williams & Wilkins, Baltimore.
97. Brajtburg, J., Powderly, W. G., Kobayashi, G. S., and Medoff, G. Amphotercin B: current understanding of mechanisms of action. Antimicrobial Agents and Chemotherapy 34, 183-188. 1990.
98. Jahn, B., Rampp, A., Dick, C., Jahn, A., Palmer, M., and Bhakdi, S. Accumulation of amphotericin B in human macrophages enhances activity against Aspergillus fumigatus conidia: quantification of conidial kill at the single cell level. Antimicrobial Agents and Chemotherapy 42(10), 2569-2575. 1998.
99. Jullien, S., Capuozzo, E., Salerno, C., and Crifo, C. Effects of polyene antibiotics on the activation of human polymorphonuclear leukocytes. Biochem Pharmacol 41, 2037-2040. 1991.
100. Brajtburg, J. and Bolard, J. Carrier effects on biological activity of amphotericin B. Clinical Microbiology Reviews 9(4), 512-531. 1996.
101. Barwicz, J., Gruda, I., and Tancrede, P. A kinetic study of the oxidation effects of amphotericin B on human low-density lipoproteins. FEBS Letters 465, 83-86. 2000.
102. Yoshida, Y. 1988. Primary targets for azole antifungal agents, p. 388-418. In M. R. McGinnis (ed.), Current Topics in Mycology. Springer-Verlag, New York.
103. Joseph-Horne, T. and Hollomon, D. W. Molecular mechanisms of azole resistance in fungi. FEMS Microbiology Letters 149, 141-149. 1997.

217
104. Yoshida, Y. and Aoyama, Y. Interaction of azole antifungal agents with cytochrome P450 14dm purified from Saccharomyces cerevisiae microsomes. Biochem Pharmacol 36, 229-235. 1987.
105. Rodreguez, R. J., Low, C., Bottema, C. D., and Parks, L. W. Multiple functions for sterols in Saccharomyces cerevisiae. Biochem Biophs Acta 837, 336-343. 1985.
106. Nes, D. W., Janssen, G. G., Cromley, F. G., Kalinowska, M., and Akihisa, T. The structural requirements of sterols for membrane function in Saccharomyces cerevisiae. Arch Biochem Biophys 300, 724-733. 1993.
107. Espinel-Ingroff, A., Bartlett, M., Chaturvedi, V., Ghannoum, M., Hazen, K. C., Pfaller, M. A., Rinaldi, M. G., and Walsh, T. J. Optimal susceptibility testing conditions for detection of azole resistance in Aspergillus spp.: NCCLS collaborative study. Antimicrobial Agents and Chemotherapy 45(6), 1828-1835. 2001.
108. Mann, P. A., Parmegiani, M., Wei, S., Mendrick, C. A., Li, X., Loebenberg, D., DiDomenico, B., Hare, S., Walker, S. S., and McNicholas, P. M. Mutations in Aspergillus fumigatus resulting in reduced susceptibility to posaconazole appear to be restricted to a single amino acid in the cytochrome P450 14α-demethylase. Antimicrobial Agents and Chemotherapy 47(2), 577-581. 2003.
109. Xiao, Li, Madison, V., Chau, A. S., Loenbenberg, D., Palermo, R. E., and McNicholas, P. M. Three-dimensional models of wild-type and mutated forms of cytochrome P450 14α-sterol demethylases from Aspergillus fumigatus and Candida albicans provide insights into posaconazole binding. Antimicrobial Agents and Chemotherapy 48(2), 568-574. 2004.
110. Diaz-Guerra, T. M., Mellado, E., Cuenca-Estrella, M., and Rodriguez-Tudela, J. L. A point mutation in the 14α-sterol demethylase gene cyp51A contributes to itraconazole resistance in Aspergillus fumigatus. Antimicrobial Agents and Chemotherapy 47(3), 1120-1224. 2003.
111. Ji, H., Zhang, H., Zhou, Y., Zhang, M., Zhu, J., Song, Y., Lu, J., and Zhu, J. A three-dimensional model of lanosterol 14α-demethylase of Candida albicans and its interaction with azole antifungals. Journal of Medical Chemistry 43, 2493-2505. 2000.

218
112. Lewis, D. F., Wiseman, A., and Tarbit, M. H. Molecular modeling of lanosterol 14α-demethylase (CYP51) from Saccharomyces cerevisiae via homology with CYP102, a unique bacterial chromosome P450 isoform: quantitative structure-activity relationships (QSARs) within two related series of antifungal azole derivatives. Journal of Enzyme Inhib 14, 175-192. 1999.
113. Loeffler, J. and Stevens, D. A. Antifungal drug resistance. Clinical Infectious Diseases 36(Suppl 1), S31-S41. 2003.
114. Walsh, T. J., Petraitis, V., Petraitiene, R., Field-Ridley, A., Sutton, D. A., Ghannoum, M., Sein, T., Schaufele, R., Peter, J., Bacher, J., Casler, H. E., Armstrong, D., Espinel-Ingroff, A., Rinaldi, M. G, and Lyman, C. A. Experimental pulmonary aspergillosis due to Aspergillus terreus: pathogenesis and treatment of an emerging fungal pathogen resistant to AMB. Journal of Infectious Diseases 188, 305-319. 2003.
115. Dannaoui, E., Borel, E., Persat, F., and Piens, M. A. Picot S. Amphotericin B resistance of Aspergillus terreus in a murine model of disseminated aspergillosis. Journal of Medical Microbiology 49, 601-606. 2000.
116. Bahmed, K., Bonaly, R., and Coulon, J. Relation between cell wall chitin and susceptibility to amphotericin B in Kluyveromyces, Candida and Schizosaccharomyces species. Research in Microbiology 154, 215-222. 2003.
117. Seo, K., Akiyoshi, H., and Ohnishi, Y. Alteration of cell wall composition leads to amphotericin B resistance in Aspergillus flavus. Microbiol Immunol 43(11), 1017-1025. 1999.
118. Gale, E. F. Nature and development of phenotypic resistance to amphotericin B in Candida albicans. Advances in Microbial Physiology 27, 278-320. 1986.
119. Mellado, E., Diaz-Guerra, T. M., Cuenca-Estrella, M., and Rodriguez-Tudela, J. L. Identification of two different 14α sterol demethylase-related genes (cyp51A and cyp51B) in Aspergillus fumigatus and other Aspergillus species. Journal of Clinical Microbiology 39(7), 2431-2438. 2001.
120. Manavathu, E. K., Vazquez, J. A., and Chandrasekar, P. H. Reduced susceptibility in laboratory selected mutants of Aspergillus fumigatus to itraconazole due to decreased intracellular accumulation of the antifungal agent. International Journal of Antimicrobial Agents 12, 213-219. 1999.
219
121. Nascimento, A. M., Goldman, G. H., Park, S., Marras, S. A. E., Delmas, G., Oza, U., Lolans, K., Dunlop, A. A. S., Mann, P. A., and Perlin, D. S. Multiple resistance mechanisms among Aspergillus fumigatus mutants with high level resistance to itraconazole. Antimicrobial Agents and Chemotherapy 47(5), 1719-1726. 2003.
122. Osherov, N., Kontoyiannis, D. P., Romans, A., and May, G. Resistance to itraconazole in Aspergillus nidulans and Aspergillus fumigatus is conferred by extra copies of the A. nidulans P-450 14α-demethylase gene, pdmA. Journal of Antimicrobial Chemotherapy 48, 75-81. 2001.
123. Mosquera, J. and Denning, D. W. Azole cross resistance in Aspergillus fumigatus. Antimicrobial Agents and Chemotherapy 46(2), 556-557. 2002.
124. Seibold, M. and Tintelnot, K. Susceptibility testing of fungi - current status and open questions. Prog Drug Research , 191-241. 2003.
125. Sanders, C. C. ARTs versus ASTs: where are we going? Journal of Antimicrobial Chemotherapy 28, 621-623. 1991.
126. Ghannoum, M., Rex, J. H., and Galgiani, J. N. Susceptibility testing of fungi: current status of correlation of in vitro data with clinical outcome. Journal of Clinical Microbiology 34(4), 489-495. 1996.
127. Tortorano, A. M., Dannaoui, E., Meletiadis, J., Mallie, M., Viviani, M. A., Piens, M. A., Rigoni, A. L., Bastide, J. M., Grillot, R., and EBGA Network. Effect of medium composition on static and cidal activity of amphotericin B, itraconazole, voriconazole, posaconazole and terbinafine against Aspergillus fumigatus: a multicenter study. Journal of Chemotherapy 14(3), 246-252. 2002.
128. Manavathu, E. K., Cutright, J. L., and Chandrasekar, P. H. Comparative study of susceptibilities of germinated and ungerminated conidia of Aspergillus fumigatus to various antifungal agents. Journal of Clinical Microbiology 37(3), 858-861. 1999.
129. Pujol, I., Fernandez-Ballart, J., and Guarro, J. Effect of inoculum form on in vitro antifungal susceptibilities of Aspergillus spp. Journal of Antimicrobial Chemotherapy 47, 715-718. 2001.
130. Espinel-Ingroff, A. Germinated and nongerminated conidial suspensions for testing of susceptibilities of Aspergillus spp. to amphotericin B, itraconazole, posaconazole, ravuconazole, and voriconazole. Antimicrobial Agents and Chemotherapy 45(2), 605-607. 2001.
220
131. Lass-Florl, C., Nagl, M., Speth, C., Ulmer, H., Dierich, M. P., and Wurzner, R. Studies of in vitro activities of voriconazole and itraconazole against Aspergillus hyphae using viability staining. Antimicrobial Agents and Chemotherapy 45(1), 124-128. 2002.
132. Lass-Florl, C., Nagl, M., Gunsilius, E., Speth, C., Ulmer, H., and Wurzner, R. In vitro studies on the activity of amphotericin B and lipid based amphotericin B formulations against Aspergillus conidia and hyphae. Mycoses 45, 166-169. 2002.
133. Guarro, J., LLop, C., Aguilar, C., and Pujol, I. Comparison of in vitro antifungal susceptibilities of conidia and hyphae of filamentous fungi. Antimicrobial Agents and Chemotherapy 41, 2760-2762. 1997.
134. Lass-Florl, C., Speth, C., Kofler, G., Dierich, M. P., Gunsilius, E., and Wurzner, R. Effect of increasing inoculum sizes of Aspergillus hyphae on MICs and MFCs of antifungal agents by broth microdilution method. International Journal of Antimicrobial Agents 21, 229-233. 2003.
135. National Committee for Clinical Laboratory Standards. 2002. Reference method for broth dilution antifungal susceptibility testing of yeasts; Approved standard - second edition. National Committee for Clinical Laboratory Standards, Wayne, Pa.
136. Johnson, E. M., Oakley, K. L., Radford, S. A., Moore, C. B., Warn, P., Warnock, D. W., and Denning, D. W. Lack of correlation of in vitro amphotericin B susceptibility testing with outcome in a murine model of Aspergillus infections. Journal of Antimicrobial Chemotherapy 45, 85-93. 2000.
137. Lass-Florl, C., Kofler, G., Kropshofer, G., Hermans, J., Kreczy, A., Dierich, M. P., and Niederwieser, D. In-vitro testing of susceptibility to amphotericin B is a reliable predictor of clinical outcome in invasive aspergillosis. Journal of Antimicrobial Chemotherapy 42, 497-502. 1998.
138. Moosa, M. S., Alangaden, G. J., Manavathu, E. K., and Chandrasekar, P. H. Resistance to amphotericin B does not emerge during treatment for invasive aspergillosis. Journal of Antimicrobial Chemotherapy 49, 209-213. 2002.
139. Odds, F. C., Van Gervan, F., Espinel-Ingroff, A., Bartlett, M., Ghannoum, M., Lancaster, M. V., Pfaller, M. A., Rex, J. H., Rinaldi, M. G., and Walsh, T. J. Evaluation of possible correlations between antifungal susceptibilities of filamentous fungi in vitro and antifungal treatment outcomes in animal infection models. Antimicrobial Agents and Chemotherapy 42(2), 282-288. 1998.
221
140. Calhoun, D. L., Roberts, G. D., Galgiani, J. N., Bennett, J. E., Feingold, D. S., Jorgenson, J., Kobayashi, G. S., and Shadomy, S. Results of a survey of antifungal susceptibility tests in the United States and interlaboratory comparison of broth dilution testing of flucytosine and amphotericin B. Journal of Clinical Microbiology 23, 298-301. 1986.
141. Galgiani, J. N., Reiser, J., Brass, C., Espinel-Ingroff, A., Gordon, M. A., and Kerkering, T. M. Comparison of relative susceptibilities of Candida species to three antifungal agents as determined by unstandardized methods. Antimicrobial Agents and Chemotherapy 31, 1343-1347. 1987.
142. National Committee for Clinical Laboratory Standards. 2003. Reference method for broth dilution antifungal susceptibility testing of filamentous fungi, Approved standard. National Committee for Clinical Laboratory Standards, Wayne, Pa.
143. Rex, J. H., Pfaller, M. A., Walsh, T. J., Chaturvedi, V., Espinel-Ingroff, A., Ghannoum, M., Gosey, L. L., Odds, F. C., Rinaldi, M. G, Sheehan, D. J., and Warnock, D. W. Antifungal susceptibility testing: Practical aspects and current challenges. Clinical Microbiology Reviews 14(4), 643-658. 2001.
144. Manavathu, E. K., Cutright, J. L., and Chandrasekar, P. H. Organism dependent fungicidal activities of azoles. Antimicrobial Agents and Chemotherapy 42(11), 3018-3021. 1998.
145. Riesselman, M. H., Hazen, K. C., and Cutler, J. E. Determination of antifungal MICs by a rapid susceptibility assay. Journal of Clinical Microbiology 38(1), 333-340. 2000.
146. Blake, D. A. and McLean, N. V. A colorimetric assay for the measurement of D-glucose consumption by cultures cells. Anal Biochem 177, 156-160. 1989.
147. Okajima, T., Nakamura, K., Zhang, H., Ling, N., Tanabe, T., Yasuda, T., and Rosenfeld, R. G. Sensitive colorimetric bioassays for insulin-like growth factor (IGF) stimulation of cell proliferation and glucose consumption: use in studies of IGF analogs. Endocrinology 130(4), 2201-2212. 1991.
148. Pfaller, M. A., Messer, S. A., Boyken, L., Hollis, R. J., and Diekema, D. J. In vitro susceptibility testing of filamentous fungi: comparison of Etest and reference M38-A microdilution methods for determining posaconazole MICs. Diagn. Microbiol. Infect. Dis. 45, 241-244. 2003.
149. Szekely, A., Johnson, E. M., and Warnock, D. W. Comparison of E-test and broth microdilution methods for antifungal drug susceptibility testing of molds. Journal of Clinical Microbiology 37(5), 1480-1483. 1999.
222
150. Pfaller, M. A., Messer, S. A., Mills, K., and Bolmstrom, A. In vitro susceptibility testing of filamentous fungi: comparison of Etest and reference microdilution methods for determining itraconazole MICs. Journal of Clinical Microbiology 38(9), 3359-3361. 2000.
151. Espinel-Ingroff, A. Comparison of the E-test with the NCCLS M38-P method for antifungal susceptibility testing of common and emerging pathogenic filamentous fungi. Journal of Clinical Microbiology 39(4), 1360-1367. 2001.
152. Matar, M. J., Ostrosky-Zeichner, L., Paetznick, V., Rodriguez, J. R., Chen, E., and Rex, J. H. Correlation between E-test, disk diffusion, and microdilution methods for antifungal susceptibility testing of fluconazole and voriconazole. Antimicrobial Agents and Chemotherapy 47(5), 1647-1651. 2003.
153. Chryssanthou, E. Trends in antifungal susceptibility among Swedish Candida species bloodstream isolates from 1994 to 1998: comparison of the E-test and the Sensititre YeastOne colorimetric antifungal panel with the NCCLS M27-A reference method. Journal of Clinical Microbiology 39(11), 4181-4183. 2001.
154. Pfaller, M. A., Diekema, D. J., Messer, S. A., Boyken, L., and Hollis, R. J. Activity of fluconazole and voriconazole determined by broth microdilution, disk diffusion, and E-test methods against 1,586 recent clinical isolates of Candida species: report from the ARTEMIS Global Antifungal Susceptibility Program, 2001.
155. Espinel-Ingroff, A., Pfaller, M. A., Erwin, M. E., and Jones, R. N. Interlaboratory evaluation of Etest method for testing antifungal susceptibilities of pathogenic yeasts to five antifungal agents by using casitine agar and solidifies RPMI 1640 medium with 2% glucose. Journal of Clinical Microbiology 34(4), 848-852. 1996.
156. Meletiadis, J., Mouton, J. W., Meis, J., Bouman, B. A., Verweij, P., and Eurofung Network. Comparison of the Etest and the Sensititre YeastOne methods with the NCCLS proposed standard for antifungal susceptibility testing of Aspergillus species. Journal of Clinical Microbiology 40(8), 2876-2885. 2002.
157. Wanger, A., Mills, K., Nelson, P. W., and Rex, J. H. Comparison of Etest and national committee for clinical laboratory standards broth macrodilution method for antifungal susceptibility testing: Enhanced ability to detect amphotericin B-resistant Candida isolates. Antimicrobial Agents and Chemotherapy 39(11), 2520-2522. 1995.

223
158. Pfaller, M. A., Messer, S. A., and Bolmstrom, A. Evaluation of Etest for determining in vitro susceptibility of yeast isolates to amphotericin B. Diagn Microbiol Infect Dis 32(3), 223-227. 1998.
159. Lozano-Chiu, M., Paetznick, V., Ghannoum, M., and Rex, J. H. Detection of resistance to amphotericin B among Cryptococcus neoformans clinical isolates: Performances of three different media assessed by using E-test and National Committee for Clinical Laboratory Standards M27-A methodologies. Journal of Clinical Microbiology 36(10), 2817-2822. 1998.
160. Clancy, C. J. and Nguyen, M. H. Correlation between in vitro susceptibility determined by E test and response to therapy with amphotericin B: results from a multicenter prospective study of candidemia. Antimicrobial Agents and Chemotherapy 43(5), 1289-1290. 1999.
161. Kretschmar, M., Nichterlein, T., Kuntz, P., and Hof, H. Rapid detection of susceptibility to fluconazole in Candida species by a bioluminescence assay of intracellular ATP. Diagn Microbiol Infect Dis 25, 117-121. 1996.
162. Clancy, C. J. and Nguyen, M. H. Comparison of a photometric method with standardized methods of antifungal susceptibility testing of yeasts. Journal of Clinical Microbiology 35(11), 2878-2882. 1997.
163. Hawser, S. P., Norris, H., Jessup, C., and Ghannoum, M. Comparison of a 2,3-bis(2-methoxy-4-nitro-5-dulfophenyl)-5-[(phenylamino) carbonyl]-2H-tetrazolium hydroxide (XTT) colorimetric method with the standardized National Committee for Clinical Laboratory Standards Method of testing clinical yeast isolates for susceptibility to antifungal agents. Journal of Clinical Microbiology 36(5), 1450-1452. 1998.
164. Yang, H. C., Mikami, Y., Yazawa, K., Taguchi, H., Nishimura, K., Miyaji, M., Branchini, M. L., Aoki, F. H., and Yamamoto, K. Colorimetric MTT assessment of antifungal activity of D0870 against fluconazole-resistant Candida albicans. Mycoses 41(11-12), 477-480. 1998.
165. Jahn, B., Stuben, A., and Bhakdi, S. Colorimetric susceptibility testing for Aspergillus fumigatus: Comparison of menadione-augmented 3-(4,5-dimethyl-2-thiazolyl)-2,5-diphenyl-2H-Tetrazolium bromide and Alamar Blue tests. Journal of Clinical Microbiology 34(8), 2039-2041. 1996.
166. Meletiadis, J., Mouton, J. W., Meis, J., Bouman, B. A., Donnelly, J. P., and Verweij, P. Colorimetric assay for antifungal susceptibility testing of Aspergillus species. Journal of Clinical Microbiology 39(9), 3402-3408. 2001.
224
167. Meletiadis, J., Mouton, J. W., Meis, J., and Verweij, P. In vitro drug interaction modeling of combinations of azoles with terbinafine against clinical Scedosporium prolificans isolates. Antimicrobial Agents and Chemotherapy 47(1), 106-117. 2003.
168. Jahn, B., Koch, A., Schmidt, A., Wanner, G., Gehringer, H., Bhakdi, S., and Brakhage, A. A. Isolation and characterization of a pigmentless-conidium mutant of Aspergillus fumigatus with altered conidial surface and reduced virulence. Infection and Immunity 65(12), 5110-5117. 1997.
169. Tellier, R., Krajden, M., Grigoriew, G. A., and Campbell, I. Innovative endpoint determination system for antifungal susceptibility testing of yeasts. Antimicrobial Agents and Chemotherapy 36(8), 1619-1625. 1992.
170. Ahmed, S. A., Gogal, R. M., and Walsh, J. E. A new rapid and simple non-radioactive assay to monitor and determine the proliferation of lymphocytes: an alternative to [3H]thymidine incorporation assay. Journal of Immunological Methods 170(2), 211-224. 1994.
171. Pfaller, M. A., Messer, S. A., Hollis, R. J., Espinel-Ingroff, A., Ghannoum, M., Plavan, H., Killian, S. B., and Knapp, C. Multisite reproducibility of MIC results by the Sensititre YeastOne colorimetric antifungal susceptibility panel. Diagn Microbiol Infect Dis 31, 543-547. 1998.
172. Pfaller, M. A. and Barry, A. L. Evaluation of a novel colorimetric broth microdilution method for antifungal susceptibility testing of yeast isolates. Journal of Clinical Microbiology 32(8), 1992-1996. 1994.
173. Espinel-Ingroff, A., Pfaller, M. A., Messer, S. A., Knapp, C., Killian, S. B., Norris, H., and Ghannoum, M. Multicenter comparison of the Sensititre YeastOne Colorimetric Antifungal Panel with the National Committee for Clinical Laboratory Standards M27-A reference method for testing clinical isolates of common and emerging Candida spp., Cryptococcus spp., and other yeasts and yeast-like organisms. Journal of Clinical Microbiology 37(3), 591-595. 1999.
174. Pfaller, M. A., Grant, C., Morthland, V., and Rhine-Chalberg, J. Comparative evaluation of alternative methods for broth dilution susceptibility testing of fluconazole against Candida albicans. Journal of Clinical Microbiology 32(2), 506-509. 1994.
175. Yamaguchi, H., Uchida, K., Nagino, K., and Matsunaga, T. Usefulness of a colorimetric method for testing antifungal drug susceptibilities of Aspergillus species to voriconazole. Journal of Infection and Chemotherapy 8, 374-377. 2002.

225
176. Lewis, R. E. and Kontoyiannis, D. P. Rationale for combination antifungal therapy. Pharmacotherapy 21(8), 149-164. 2001.
177. 2002. Mycobacterium, p. 366-377. In P. R. Murray, K. S. Rosenthal, G. S. Kobayashi, and M. A. Pfaller (eds.), Medical Microbiology. Mosby, St. Louis.
178. Saag, M. S., Graybill, R. J., Larsen, R. A., Pappas, P., Perfect, J. R., Powderly, W. G., Sobel, J. D., and Dismukes, W. E. Practice guidelines for the management of cryptococcal disease. Clinical Infectious Diseases 30, 710-718. 2000.
179. Wilkin, A. and Feinburg, J. Prophylaxis against fungal infections and cytomegalovirus disease after bone marrow transplantation. Oncology 14(12), 1701-1708. 2000.
180. Groll, A. H. and Walsh, T. J. Antifungal chemotherapy: advances and perspectives. Swiss Med Wkly 132, 303-311. 2002.
181. Fishman, J. A. Summary: Future directions in antifungal therapy. Transplant Infect Dis 4(Suppl 3), 67-68. 2002.
182. Polak, A. The past, present and future of antimycotic combination therapy. Mycoses 42, 355-370. 2003.
183. Hindler, J. 1992. Animicrobial susceptibility testing, p. 5.18.11-5.18.20. In H. D. Isenberg (ed.), Clinical microbiology procedures handbook. American Society of Microbiology Press, Washington D.C.
184. Eliopoulos, G. M. and Jr. R. C. Moellering. 1991. Antimicrobial Combinations, p. 432-492. In Antibiotics in laboratory medicine. Williams & Wilkins, Baltimore.
185. Te Dorsthorst, D. T. A., Verweij, P., Meletiadis, J., Bergervoet, M., Punt, N. C., Meis, J., and Mouton, J. W. In vitro interaction of flucytosine combined with amphotericin B or fluconazole against thirty-five yeast isolates determined by both fractional inhibitory concentration index and the response surface approach. Antimicrobial Agents and Chemotherapy 46(9), 2982-2989. 2002.
186. Siau, H. and Kerridge, D. The effect of antifungal drugs in combination on the growth of Candida glabrata in solid and liquid media. Journal of Antimicrobial Chemotherapy 41, 357-366. 1998.
226
187. Te Dorsthorst, D. T. A., Verweij, P., Meis, J., Punt, N. C., and Mouton, J. W. Comparison of fractional inhibitory concentration index with response surface modeling for characterization of in vitro interaction of antifungals against itraconazole susceptible and resistant Aspergillus fumigatus isolates. Antimicrobial Agents and Chemotherapy 46(3), 702-707. 2002.
188. Gomez-Lopez, A., Cuenca-Estrella, M., Mellado, E., and Rodriguez-Tudela, J. L. In vitro evaluation of combination of terbinafine with itraconazole or amphotericin B against Zygomycota. Diagn Microbiol Infect Dis 45, 199-202. 2003.
189. Dannaoui, E., Afeltra, J., Meis, J., and Verweij, P. In vitro susceptibilities of zygomycetes to combinations of antimicrobial agents. Antimicrobial Agents and Chemotherapy 46(8), 2708-2711. 2002.
190. Arikan, S., Loranzo-Chiu, M., Paetznick, V., and Rex, J. H. In vitro synergy of caspofungin and amphotericin B against Aspergillus and Fusarium spp. Antimicrobial Agents and Chemotherapy 46(1), 245-247. 2002.
191. Shalit, I., Shadkchan, Y., Samra, Z., and Osherov, N. In vitro synergy of caspofungin and itraconazole against Aspergillus spp.: MIC vs. minimal effective concentration end points. Antimicrobial Agents and Chemotherapy 47(4), 1416-1418. 2003.
192. Afeltra, J., Dannaoui, E., Meis, J., Rodriguez-Tudela, J. L., Verweij, P., and Eurofung Network. In vitro synergistic interaction between amphotericin B and pentamidine against Scedosporium prolificans. Antimicrobial Agents and Chemotherapy 46(10), 3323-3326. 2002.
193. Walsh, T. J., Peter, J., McGough, D. A., Fothergill, A, Rinaldi, M. G, and Pizzo, P. A. Activities of amphotericin B and antifungal azoles alone and in combination against Pseudallescheria boydii. Antimicrobial Agents and Chemotherapy 39(6), 1361-1364. 1995.
194. Denning, D. W., Hanson, L. H., Perlman, A. M., and Stevens, D. A. In vitro susceptibility and synergy studies of Aspergillus species to conventional and new agents. Diagn Microbiol Infect Dis 15, 21-34. 1992.
195. Nguyen, M. H., Barchiesi, F., McGough, D. A., Yu, V., and Rinaldi, M. G. In vitro evaluation of combination of fluconazole and flucytosine against Cryptococcus neoformans var. neoformans. Antimicrobial Agents and Chemotherapy 39(8), 1691-1695. 1995.

227
196. Lewis, R. E., Diekema, D. J., Messer, S. A., Pfaller, M. A., and Klepser, M. E. Comparison of E-test, checkerboard dilution and time-kill studies for the detection of synergy or antagonism between antifungal agents tested against Candida species. Journal of Antimicrobial Chemotherapy 49, 345-351. 2002.
197. Perea, S., G, Gonzalez, G, Fothergill, A, Kirkpatrick, W. R, Rinaldi, M. G, and Patterson, T. F. In vitro interaction of caspofungin acetate with voriconazole against clinical isolates of Aspergillus spp. Antimicrobial Agents and Chemotherapy 46(9), 3039-3041. 2002.
198. Perea, S., Gonzalez, G, Fothergill, A, Sutton, D. A., and Rinaldi, M. G. In vitro activities of terbinafine in combination with fluconazole, itraconazole, voriconazole, and posaconazole against clinical isolates of Candida glabrata with decreased susceptibility to azoles. Journal of Clinical Microbiology 40(5), 1831-1833. 2002.
199. Meletiadis, J., Mouton, J. W., Rodriguez-Tudela, J. L., Meis, J., and Verweij, P. In vitro interaction of terbinafine with itraconazole against clinical isolates of Scedosporium prolificans. Antimicrobial Agents and Chemotherapy 44(2), 470-472. 2000.
200. Berenbaum, M. C. A method for testing for synergy with any number of agents. Journal of Infectious Diseases 137(2), 122-130. 1978.
201. Mackay, M. L., Milne, K., and Gould, I. M. Comparison of methods for assessing synergistic antibiotic interactions. International Journal of Antimicrobial Agents 15, 125-129. 2000.
202. Greco, W. R., Bravo, G., and Parsons, J. C. The search for synergy: a critical review from a response surface perspective. Pharmacalogical Reviews 47(2), 331-385. 1995.
203. Drusano, G. L., D'Argenio, D. Z., Symonds, W., Bilello, P. A., McDowell, J., Sadler, B., Bye, A., and Bilello, J. A. Nucleoside analog 1592U89 and human immunodeficiency virus protease inhibitor 141W94 are synergistic in vitro. Antimicrobial Agents and Chemotherapy 42(9), 2153-2159. 1998.
204. Patrick, A. K., Boritzki, T. J., and Bloom, L. A. Activities of the human immunodeficiency virus type 1 (HIV-1) protease inhibitor nelfinavir mesylate in combination with reverse transcriptase and protease inhibitors against acute HIV-1 infection in vitro. Antimicrobial Agents and Chemotherapy 41(10), 2159-2164. 1997.

228
205. Scheven, M. and Schwegler, F. Antagonistic interactions between azoles and amphotericin B with yeasts depend on azole lipophilia for special test conditions in vitro. Antimicrobial Agents and Chemotherapy 39(8), 1779-1783. 1995.
206. Moore, C. B., Sayers, N., Mosquera, J., Slaven, J., and Denning, D. W. Antifungal drug resistance in Aspergillus. Journal of Infection 41, 203-220. 2000.
207. Steinbach, W. J., Stevens, D. A., and Denning, D. W. Combination and sequential antifungal therapy for invasive aspergillosis: review of published in vitro and in vivo interactions from 1966 to 2001. Clinical Infectious Diseases 37(Suppl 3), S188-S224. 2003.
208. Manavathu, E. K., L. T. Ganesan, J. L. Cutright, and P. H. Chandrasekar. 2001. In vitro antifungal activity of voriconazole in two-drug combination with micafungin, caspofungin and amphotericin B [abstract J-152], In Program and abstracts of the 41st Interscience Conference on Antimicrobial Agents and Chemotherapy. American Society for Microbiology, Washington, D.C.
209. Patterson, T. F, Kirkpatrick, W. R, White, M. H., Hiemenz, J. W., Wingard, J. R., Dupont, B., Rinaldi, M. G, Stevens, D. A., and Graybill, J. R. Invasive aspergillosis: disease spectrum, treatment practices, and outcomes. Medicine (Baltimore) 79, 250-260. 2000.
210. Denning, D. W., Lee, J., and Hostetler, J. S. NIAID Mycoses Study Group multicenter trial of oral itraconazole therapy for invasive aspergillosis. American Journal of Medicine 97, 135-144. 1994.
211. Stevens, D. A., Kullberg, B. J., Brummer, E., Casadevall, A., Netea, M. G., and Sugar, A. M. Combined treatment: antifungal drugs with antibodies, cytokines, or drugs. Medical Mycology 38, 305-315. 2000.
212. Stevens, D. A. and Lee, J. Analysis of compassionate use itraconazole therapy for invasive aspergillosis by the NIAID Mycoses Study Group criteria. Archives of Internal Medicine 157, 1857-1862. 1997.
213. van't Hek, L. G., Verweij, P., Weemaes, C. M., van Dalen, R., Yntema, J. B., and Meis, J. Successful treatment with voriconazole of invasive aspergillosis in chronic granulomatous disease. American Journal of Respiratory Critical Care Medicine 157, 1694-1696. 1998.
229
214. Verweij, P., Weemaes, C. M., Curfs, J. H., Meis, J., and Bretagne, S. Failure to detect circulating Aspergillus markers in a patient with chronic granulomatous disease and invasive aspergillosis. Journal of Clinical Microbiology 38, 3900-3901. 2000.
215. Machetti, M., Zotti, M., and Veroni, L. Antigen detection in the diagnosis and management of a patient with probable cerebral aspergillosis treated with voriconazole. Transplant Infect Dis 2, 140-144. 2000.
216. Maesaki, S., Kohno, S., Kaku, M., Koga, H., and Hara, K. Effects of antifungal agent combinations administered simultaneously and sequentially against Aspergillus fumigatus. Antimicrobial Agents and Chemotherapy 38(12), 2843-2845. 1994.
217. Maesaki, S., Kawamura, S., Miyazaki, Y., Tomono, K., Tashiro, T., and Kohono, S. Effect of sequential combination of amphotericin B and azole antifungal agents against Aspergillus fumigatus. Journal of Infection and Chemotherapy 5, 125-129. 1999.
218. Verweij, P., Brinkman, K., Kremer, H. P., and Meis, J. Aspergillus meningitis: diagnosis by non-culture based microbiological methods and management. Journal of Clinical Microbiology 37, 1186-1189. 1999.
219. Tumbarello, M., Ventura, G., Caldarola, G., Morace, G., Cauda, R., and Ortona, L. An emerging opportunistic infection in HIV patients: a retrospective analysis of 11 cases of pulmonary aspergillosis. European Journal of Epidemiology 9, 638-644. 1993.
220. Girmenia, C., Gastaldi, R., and Martino, P. Catheter-related cutaneous aspergillosis complicated by fungemia and fatal pulmonary infection in an HIV-positive patient with acute lymphocytic leukemia. European Journal of Clinical Microbiology Infectious Diseases 14, 524-526. 1995.
221. Khoo, S. H. and Denning, D. W. Cure of chronic invasive sinus aspergillosis with oral saperconazole. Journal of Medical and Veterinary Mycology 33, 63-66. 1995.
222. Decker, C. F. and Parenti, D. M. Invasive aspergillosis in patients with HIV infection: report of two patients and a review of the literature. Journal of Acquired Immune Deficiency Syndrome 4, 603-606. 1991.
223. Libanore, M., Pastore, A., and Frasconi, P. C. Invasive multiple sinusitis by Aspergillus fumigatus in a patient with AIDS. Int J STD AIDS 5, 293-295. 1994.

230
224. Nanas, J. N., Saroglou, G., and Anastasiou-Nana, M. I. Itraconazole for the treatment of pulmonary aspergillosis in heart transplant recipients. Clinical Transplant 12, 30-34. 1998.
225. Galimberti, R., Kowalczuk, A., Hidalgo Parra, I., Gonzales Ramos, M., and Flores, V. Cutaneous aspergillosis: a report of six cases. British Journal of Dermatology 139, 522-526. 1998.
226. Lewis, R. E., Prince, R. A., Chi, J., and Kontoyiannis, D. P. Itraconazole reexposure attenuates the efficacy of subsequent amphotericin B therapy in a murine model of acute invasive pulmonary aspergillosis. Antimicrobial Agents and Chemotherapy 46(10), 3208-3214. 2002.
227. Schaffner, A. and Bohler, A. Amphotericin B refractory aspergillosis after itraconazole: evidence for significant antagonism. Mycoses 36, 421-424. 1993.
228. Vazquez, J. A., Arganoza, M. T., Boikov, D., Yoon, S., Sobel, J. D., and Akins, R. A. Stable phenotypic resistance of Candida species to amphotericin B conferred by preexposure to subinhibitory levels of azoles. Journal of Clinical Microbiology 36(9), 2690-2695. 1998.
229. Kessler, R., Massard, R., Wartner, A., Wihlm, J. M., and Weitzenblum, E. Bronchial-pulmonary artery fistula under unilateral lung transplantation: a case report. Journal of Heart and Lung Transplantation 16, 674-677. 1997.
230. Swift, A. C. and Denning, D. W. Skull base osteitis following fungal sinusitis. J Laryngol Otol 112, 92-97. 1998.
231. National Committee for Clinical Laboratory Standards. 2004. Reference method for broth dilution antifungal susceptibility testing of yeasts. Approved standard, NCCLS document M27-A. NCCLS, Wayne, Pa.
232. Denning, D. W. Invasive aspergillosis. Clinical Infectious Diseases 26, 781-805. 1998.
233. Dannaoui, E., Borel, E., Monier, M., Piens, M. A., Picot, S., and Persat, F. Acquired itraconazole resistance in Aspergillus fumigatus. Journal of Antimicrobial Chemotherapy 47, 333-340. 2001.
234. National Committee for Clinical Laboratory Standards. 1998. Reference method for broth dilution antifungal susceptibility testing of conidium-forming filamentous fungi; Proposed standard. National Committee for Clinical Laboratory Standards, Wayne, Pa.

231
235. Marichal, P., Gorrens, J., and Vanden Bossche, H. The action of itraconazole and ketoconazole on growth and sterol synthesis in Aspergillus fumigatus and Aspergillus niger. Sabouraudia 23, 13-21. 1985.
236. 2004. Biochemical targets for antifungal azole derivitives: hypothesis on the mode of action, p. 313-351. In M. R. McGinnis (ed.), Current Topics in Medical Mycology, vol. 1. Springer-Verlag, New York, N.Y.
237. Denning, D. W., Radford, S. A., Oakley, K. L., Hall, L., Johnson, E. M., and Warnock, D. W. Correlation between in vitro susceptibility testing to itraconazole and in vivo outcome of Aspergillus fumigatus infection. Journal of Antimicrobial Chemotherapy 40, 401-414. 1997.
238. Iwen, P. C., Rupp, M. E., Langnas, A. N., Reed, E. C., and Hinrichs, S. H. Invasive pulmonary aspergillosis due to Aspergillus terreus: 12-year experience and review of the literature. Clinical Infectious Diseases 26, 1092-1097. 1998.
239. Sanati, H., Belanger, P., Fratti, R., and Ghannoum, M. A new triazole, voriconazole (UK-109,496), blocks sterol biosynthesis in Candida albicans and Candida krusei. Antimicrobial Agents and Chemotherapy 41(11), 2492-2496. 1997.
240. Mosquera, J. and Denning, D. W. Azole cross-resistance in Aspergillus fumigatus. Antimicrobial Agents and Chemotherapy 46(2), 556-557. 2002.
241. Espinel-Ingroff, A., Boyle, K., and Sheehan, D. J. In vitro antifungal activities of voriconazole and reference agents as determined by NCCLS methods: review of the literature. Mycopathologia 150, 101-115. 2001.
242. Espinel-Ingroff, A. In vitro fungicidal activities against voriconazole, itraconazole, and amphotericin B against opportunistic moniliaceous and dematiaceous fungi. Journal of Clinical Microbiology 39(3), 954-958. 2001.
243. Fortun, J., Martin-Davila, P., Sanchez, M. A., Pintado, V., Alvarez, M. E., Sanchez-Sousa, A., and Moreno, S. Voriconazole in the treatment of invasive mold infections in transplant recipients. European Journal of Clinical Microbiology Infectious Diseases 22, 408-413. 2003.
244. Consigny, S., Dhedin, N., Datry, A., Choquet, S., Leblond, V., and Chosidow, O. Successful voriconazole treatment of disseminated Fusarium infection in an immunocompromised patient. Clinical Infectious Diseases 37, 311-313. 2003.

232
245. Baden, L. R., Katz, J. T., Fishman, J. A., Koziol, C., DelVecchio, A., Doran, M., and Rubin, R. H. Salvage therapy with voriconazole for invasive fungal infection in patients failing or intolerant to standard antifungal therapy. Transplantation 76(11), 1632-1637. 2003.
246. Mosquera, J., Warn, P., Morrissey, J., Moore, C. B., Gil-Lamaignere, C., and Denning, D. W. Susceptibility testing of Aspergillus flavus:inoculum dependence with itraconazole and lack of correlation between susceptibility to amphotericin B in vitro and outcome in vivo. Antimicrobial Agents and Chemotherapy 45(5), 1456-1462. 2001.
247. Pfaller, J. B., Messer, S. A., Hollis, R. J., Diekema, D. J., and Pfaller, M. A. In vitro susceptibility testing of Aspergillus spp.: comparison of Etest and reference microdilution methods for determining voriconazole and itraconazole MICs. Journal of Clinical Microbiology 41(3), 1126-1129. 2003.
248. Johnson, E. M., Szekely, A., and Warnock, D. W. In vitro activity of voriconazole, itraconazole and amphotericin B against filamentous fungi. Journal of Antimicrobial Chemotherapy 42, 741-745. 1998.
249. Meletiadis, J., Meis, J., Mouton, J. W., Donnelly, J. P., and Verweij, P. Comparison of NCCLS and 3-(4,5-dimethyl-2-thiazyl)-2,5-diphenyl-2H-tetrazolium bromide (MTT) methods of in vitro susceptibility testing of filamentous fungi and development of a new simplified method. Journal of Clinical Microbiology 38(8), 2949-2954. 2000.
250. Espinel-Ingroff, A., Fothergill, A., Peter, J., Rinaldi, M. G., and Walsh, T. J. Testing conditions for determination of minimum fungicidal concentrations of new and established antifungal agents for Aspergillus spp.: NCCLS collaborative study. Journal of Clinical Microbiology 40(9), 3204-3208. 2002.
251. Manavathu, E. K., Abraham, O. C., and Chandrasekar, P. H. Isolation and in vitro susceptibility to amphotericin B, itraconazole and posaconazole of voriconazole-resistant laboratory isolates of Aspergillus fumigatus. Clinical Microbiology and Infections 7, 130-137. 2001.
252. Espinel-Ingroff, A., Bartlett, M., Chaturvedi, V., Ghannoum, M., Hazen, K. C., Pfaller, M. A., Rinaldi, M. G, and Walsh, T. J. Optimal susceptibility testing conditions for detection of azole resistance in Aspergillus spp.: NCCLS collaborative evaluation. Antimicrobial Agents and Chemotherapy 45(6), 1828-1835. 2001.
233
253. Lass-Florl, C., Nagl, M., Speth, C., Ulmer, H., Dierich, M. P., and Wurzner, R. Studies of in vitro activities of voriconazole and itraconazole against Aspergillus hyphae using viability staining. Antimicrobial Agents and Chemotherapy 45(1), 124-128. 2001.
254. Gow, N., Brown, J. P., and Odds, F. C. Fungal morphogenesis and host invasion. Current Opinion in Microbiology 5, 366-371. 2002.
255. Bekersky, I., Fielding, R. M., Dressler, D. E., Lee, J. W., Buell, D. N., and Walsh, T. J. Pharmacokinetics, excretion, and mass balence of liposomal amphotericin B (Ambisome) and amphotericin B deoxycholate in humans. Antimicrobial Agents and Chemotherapy 46(3), 828-833. 2002.
256. Granade, T. C. and Artis, W. M. Antimycotic susceptibility testing of dermatophytes in microcultures with a standardized fragmented mycelial inoculum. Antimicrobial Agents and Chemotherapy 17, 725-729. 1980.
257. Pfaller, M. A., Messer, S. A., Mills, K., Bolmstrom, A., and Jones, R. N. Evaluation of Etest method for determining posaconazole MICs for 314 clinical isolates of Candida species. Journal of Clinical Microbiology 39(11), 3952-3954. 2001.
258. Pfaller, M. A., Messer, S. A., Houston, A., Mills, K., Bolmstrom, A., and Jones, R. N. Evaluation of the Etest method for determining voriconazole susceptibilities of 312 clinical isolates of Candida species by using three different agar media. Journal of Clinical Microbiology 38(10), 3715-3717. 2000.
259. Barry, A. L., Pfaller, M. A., Rennie, R. P., Fuchs, P. C., and Brown, S. D. Precision and accuracy of fluconazole susceptibility testing by broth microdilution, Etest, and disk diffusion methods. Antimicrobial Agents and Chemotherapy 46(6), 1781-1784. 2002.
260. Chryssanthou, E. and Cuenca-Estrella, M. Comparison of the Antifungal Susceptibility Testing Subcommittee of the European Committee on Antibiotic Susceptibility Testing Proposed Standard and the E-test with the NCCLS broth microdilution method for voriconazole and caspofungin susceptibility testing of yeast species. Journal of Clinical Microbiology 40(10), 3841-3844. 2002.
261. Posteraro, B., Romano, L., Sanguinetti, M., Masucci, L., Morace, G., and Fadda, G. Commercial systems for fluconazole susceptibility testing of yeasts: comparison with the broth microdilution method. Diagn Microbiol Infect Dis 38, 29-36. 2000.
234
262. Espinel-Ingroff, A. Evaluation of broth microdilution testing parameters and agar diffusion Etest procedure for testing susceptibilities of Aspergillus spp. to caspofungin acetate. Journal of Clinical Microbiology 41(1), 403-409. 2003.
263. Serrano, M. C., Morilla, D., Valverde, A., Chavez, M., Espinel-Ingroff, A., Claro, R., Ramirez, M., and Mazuelos, E. M. Comparison of Etest with modified broth microdilution method for testing susceptibility of Aspergillus spp. to voriconazole. Journal of Clinical Microbiology 41(11), 5270-5272. 2003.
264. Espinel-Ingroff, A. and Rezusta, A. E-test method for testing susceptibilities of Aspergillus spp. to the new triazoles voriconazole and posaconazole and to established antifungal agents: comparison with NCCLS broth microdilution method. Journal of Clinical Microbiology 40(6), 2101-2107. 2002.
265. Pfaller, M. A., Bale, M., Buschelman, B., Lancaster, M., Espinel-Ingroff, A., Rex, J. H., and Rinaldi, M. G. Selection of candidate quality control isolates and tentative quality control ranges for in vitro susceptibility testing of yeast isolates by National Committee for Clinical Laboratory Standards proposed standard methods. Journal of Clinical Microbiology 32(7), 1650-1653. 1994.
266. Fidel, Jr. J. R., Vazquez, J. A., and Sobel, J. D. Candida glabrata: Review of epidemiology, pathogenesis, and clinical disease with comparison to C. albicans. Clinical Microbiology Reviews 12(1), 80-96. 2004.
267. Marr, K. A., White, T. C., van Burik, J. H., and Bowden, R. Development of fluconazole resistance in Candida albicans causing disseminated infection in a patient undergoing marrow transplantation. Clinical Infectious Diseases 25, 908-910. 1997.
268. Redding, S. W., Smith, J. A., Farinacci, G., Rinaldi, M. G, Fothergill, A, Rhine-Chalberg, J., and Pfaller, M. A. Resistance of Candida albicans to fluconazole during treatment of oropharyngeal candidiasis in a patient with AIDS: documentation by in vitro susceptibility testing and DNA subtype analysis. Clinical Infectious Diseases 18, 240-242. 1994.
269. White, T. C., Holleman, S., Mirels, L. F., Dy, F., and Stevens, D. A. Resistance mechanisms in clinical isolates of Candida albicans. Antimicrobial Agents and Chemotherapy 46(6), 1704-1713. 2002.
270. Marr, K. A., Lyons, C. N., Ha, K., Rustad, T. R., and White, T. C. Inducible azole resistance associated with a heterogenous phenotype in Candida albicans. Antimicrobial Agents and Chemotherapy 45(1), 52-59. 2001.

235
271. Redding, S. W., Kirkpatrick, W. R, Saville, S., Coco, B. J., White, W., Fothergill, A, Rinaldi, M. G, Eng, T., Patterson, T. F, and Lopez-Ribot, J. L. Multiple patterns of resistance to fluconazole in Candida glabrata isolates from a patient with oropharyngeal candidiasis receiving head and neck radiation. Journal of Clinical Microbiology 41(2), 619-622. 2003.