Advances in Mechanical Engineering 2017, Vol. 9(3) 1–12 ...
12
Special Issue Article Advances in Mechanical Engineering 2017, Vol. 9(3) 1–12 Ó The Author(s) 2017 DOI: 10.1177/1687814017695047 journals.sagepub.com/home/ade Lifetime fatigue reliability evaluation of short to medium span bridges under site-specific stochastic truck loading Donghuang Yan 1 , Yuan Luo 1 , Ming Yuan 1 and Naiwei Lu 2,3 Abstract Bridges are vulnerable to the fatigue damage accumulation caused by traffic loading over the service period. A continu- ous growth in both the vehicle weight and the traffic volume may cause a safety hazard to existing bridges. This study presented a computational framework for probabilistic modeling of the fatigue damage accumulation of short to medium span bridges under actual traffic loading. Stochastic truck-load models were simulated based on site-specific weigh-in- motion measurements. A response surface method was utilized to substitute the time-consuming finite element model for an efficient computation. A case study of a simply supported bridge demonstrated the effectiveness of the computa- tional framework. Numerical results show that the simulated fatigue stress spectrum captures the probability density functions of the heavy traffic loading. The equivalent fatigue stress range increases mostly linearly in the good road roughness condition with the growth of the gross vehicle weight. The vehicle type and the road roughness condition affect the stress range. The influence of the driving speed on the equivalent stress range is non-monotonic. The bridge fatigue reliability has a considerable increase even under a relatively high overload limit. It is anticipated that the pro- posed computational framework can be applied for more types of bridges. Keywords Fatigue reliability, probabilistic modeling, response surface method, stochastic traffic flow, overloading, weigh-in-motion Date received: 4 September 2016; accepted: 30 January 2017 Academic Editor: Eleni Chatzi Introduction With the steady growth of the global economy and the intense competition of the transportation market, the traffic loading on highway bridges has increased over the last decades. 1,2 Such continuous increase in the traf- fic loading may pose a safety threat to the existing bridges. As a result, several bridges were collapsed due to couples of overloaded trucks. 3,4 Fatigue damage induced by heavy trucks is one of these failure mechan- isms as summarized by Deng et al. 5 leading to the col- lapse of in-service bridges. For the short to medium span bridges, the applications of the high strength materials, the design theory that makes full use of strength of materials in high stress condition, and the decreasing dead-to-live-load ratio make them fatigue-sensitive to vehicle loads. 6 Therefore, the traffic- load-induced fatigue damage accumulation of short to medium span bridge deserves investigation. It is acknowledged that the bridge fatigue evaluation mainly involves two aspects including the structural resistance evaluation and the load effect computation. 1 School of Civil Engineering and Architecture, Changsha University of Science & Technology, Changsha, China 2 School of Civil Engineering, Southeast University, Nanjing, China 3 Institute for Risk and Reliability, Leibniz Universita ¨t Hannover, Hannover, Germany Corresponding author: Yuan Luo, School of Civil Engineering and Architecture, Changsha University of Science & Technology, Changsha 410114, China. Email: [email protected] Creative Commons CC-BY: This article is distributed under the terms of the Creative Commons Attribution 3.0 License (http://www.creativecommons.org/licenses/by/3.0/) which permits any use, reproduction and distribution of the work without further permission provided the original work is attributed as specified on the SAGE and Open Access pages (https://us.sagepub.com/en-us/nam/ open-access-at-sage).
Transcript of Advances in Mechanical Engineering 2017, Vol. 9(3) 1–12 ...
Special Issue Article
Advances in Mechanical Engineering2017, Vol. 9(3) 1–12� The Author(s) 2017DOI: 10.1177/1687814017695047journals.sagepub.com/home/ade
Lifetime fatigue reliability evaluation ofshort to medium span bridges undersite-specific stochastic truck loading
Donghuang Yan1, Yuan Luo1, Ming Yuan1 and Naiwei Lu2,3
AbstractBridges are vulnerable to the fatigue damage accumulation caused by traffic loading over the service period. A continu-ous growth in both the vehicle weight and the traffic volume may cause a safety hazard to existing bridges. This studypresented a computational framework for probabilistic modeling of the fatigue damage accumulation of short to mediumspan bridges under actual traffic loading. Stochastic truck-load models were simulated based on site-specific weigh-in-motion measurements. A response surface method was utilized to substitute the time-consuming finite element modelfor an efficient computation. A case study of a simply supported bridge demonstrated the effectiveness of the computa-tional framework. Numerical results show that the simulated fatigue stress spectrum captures the probability densityfunctions of the heavy traffic loading. The equivalent fatigue stress range increases mostly linearly in the good roadroughness condition with the growth of the gross vehicle weight. The vehicle type and the road roughness conditionaffect the stress range. The influence of the driving speed on the equivalent stress range is non-monotonic. The bridgefatigue reliability has a considerable increase even under a relatively high overload limit. It is anticipated that the pro-posed computational framework can be applied for more types of bridges.
KeywordsFatigue reliability, probabilistic modeling, response surface method, stochastic traffic flow, overloading, weigh-in-motion
Date received: 4 September 2016; accepted: 30 January 2017
Academic Editor: Eleni Chatzi
Introduction
With the steady growth of the global economy and theintense competition of the transportation market, thetraffic loading on highway bridges has increased overthe last decades.1,2 Such continuous increase in the traf-fic loading may pose a safety threat to the existingbridges. As a result, several bridges were collapsed dueto couples of overloaded trucks.3,4 Fatigue damageinduced by heavy trucks is one of these failure mechan-isms as summarized by Deng et al.5 leading to the col-lapse of in-service bridges. For the short to mediumspan bridges, the applications of the high strengthmaterials, the design theory that makes full use ofstrength of materials in high stress condition, andthe decreasing dead-to-live-load ratio make them
fatigue-sensitive to vehicle loads.6 Therefore, the traffic-load-induced fatigue damage accumulation of short tomedium span bridge deserves investigation.
It is acknowledged that the bridge fatigue evaluationmainly involves two aspects including the structuralresistance evaluation and the load effect computation.
1School of Civil Engineering and Architecture, Changsha University of
Science & Technology, Changsha, China2School of Civil Engineering, Southeast University, Nanjing, China3Institute for Risk and Reliability, Leibniz Universitat Hannover, Hannover,
Germany
Corresponding author:
Yuan Luo, School of Civil Engineering and Architecture, Changsha
University of Science & Technology, Changsha 410114, China.
Email: [email protected]
Creative Commons CC-BY: This article is distributed under the terms of the Creative Commons Attribution 3.0 License
(http://www.creativecommons.org/licenses/by/3.0/) which permits any use, reproduction and distribution of the work without
further permission provided the original work is attributed as specified on the SAGE and Open Access pages (https://us.sagepub.com/en-us/nam/
open-access-at-sage).
Great progresses have been made on investigations ofthe bridge fatigue behavior in recent years. Ma et al.7
proposed a new crack-growth-based corrosion fatiguelife prediction method for aging reinforced concrete(RC) beams. Characteristic stress-life (S-N) curves wereproposed by Ghahremani et al.8 for the fatigue designof treated welds under variable amplitude loading inthe high cycle domain. In addition to the above-men-tioned, the traffic loading is also a critical factorimpacting the fatigue damage accumulation. In thisregard, Zhang et al.9 evaluated the fatigue reliability oflong-span bridges under combined dynamic loads fromwinds and vehicles. Wang et al.10 investigated thevehicle–bridge interaction of the fatigue stress rangeand the number of stress cycles of short-span bridges.The influence of different road roughness conditions(RRCs) and vehicle speeds of bridges on dynamicamplification factors (DAFs) of load effects was alsobeen considered for fatigue design of existing bridges.11
However, influence of the vehicle dynamic effect inconjunction with the traffic growth on the fatigue relia-bility of short to medium span bridges is still not clear.
It is acknowledged that the stress spectra of thebridge critical components are a precondition for fatiguereliability assessment. For the simulation of the stressspectra, in addition to the structural health monitoring(SHM) approach,12–14 the numerical simulation basedon weigh-in-motion (WIM) measurements is an alterna-tive method for a wide range of bridges. Due to thestress spectra being sensitive to site-specific traffic loads,numerous studies have been conducted to develop fati-gue truck-load models based on site-specific WIM mea-surements. Typical fatigue truck-load models withdeterministic configurations and gross vehicle weights(GVWs) have been specified or recommended innational design codes, such as AASHTO,15 Eurocode1,16 and BS5400.17 However, Zhou18 indicated that fati-gue analysis based on specification loads and distribu-tion factors usually underestimates the remaining fatiguelife of existing bridges by overestimating the live-loadstress ranges. Chotickai and Bowman19 found that fati-gue damage can be notably overestimated in short-spangirders utilizing the 240-kN AASHTO fatigue truck.The different research conclusions mentioned aboveillustrate the deterministic fatigue truck models in speci-fications cannot capture the characteristics of the localtransportation as a result of an inaccurate fatigue analy-sis. For this reason, the randomness of vehicle para-meters begins to be widely accepted in simulating theactual vehicle model. In this regard, Guo et al.20 assessedthe fatigue reliability of steel bridge details via integrat-ing WIM data and probabilistic finite element analysis(FEA), which simulated the traffic condition vividly andmade the uncertainties associated with vehicle para-meters well considered. However, the axle weight inGuo’s truck model obeyed a standard Gaussian
distribution that cannon reflect a multi-peaks feature ofthe actual traffic condition. Currently, most of the sto-chastic analysis on vehicle parameters is associated withestimation of DAF.21,22 Application of stochastic truck-load model to fatigue reliability assessment of short tomedium span bridges is insufficient.
This study aims to present a computational frame-work for fatigue reliability evaluation of short tomedium span bridges under stochastic truck loading.As the first task, the equivalent fatigue stress and thelimit state function (LSF) of the short to medium spanbridge under stochastic traffic loading are formulated.Subsequently, a framework is proposed to simulate thefatigue stress spectrum of the bridge under stochasticsimulation more effectively. Finally, the proposedframework and the stochastic traffic loads are appliedto a simply supported bridge. Influence of the stochas-tic parameters including the vehicle speed, the RRC,and the GVW on the stress range is investigated. Theeffect of traffic growth and an overload control on thefatigue reliability is emphasized.
Theoretical bases
Truck-induced fatigue damage accumulation
It is acknowledged that each truck passage will yieldseveral stress blocks in the bridge structures. Thesestress blocks have the properties of high cycles and lowamplitudes. In general, these stress blocks are convertedto fatigue damage by the S-N approach. Several designcodes have specified S-N curves for various structuraldetails. Eurocode 316 is utilized herein to define the S-Ncurve. In Eurocode 3, the fatigue strength of nominalstress range is represented by a series of curves withrespect to typical detail categories. The category is des-ignated by the fatigue strength DsC at 2million cycles.The S-N curve in Eurocode 3 is expressed as
Ds3RNR =KC KC = 2 3 106Ds3
C DsR � DsD
� �ð1Þ
Ds5RNR =KD KD = 5 3 106Ds5
C DsL\DsR�DsD
� �ð2Þ
where DsR is the stress range, NR is the number ofcycles, DsD and DsL are constant-amplitude fatiguelimit and fatigue threshold, respectively, and KC andKD are the fatigue strength coefficients with respect toDsR. DsD and DsR � DsD, respectively. In thisstudy, as the research objective, the steel bar in concretebridges has a category of 80MPa. Details of the para-meters in the S-N curve are shown in Table 1.
In addition to the S-N curve, the well-knownPalmgren’s fatigue damage accumulation theory is atheoretical basis for the fatigue damage analysis as well.In Palmgren’s theory,23 the fatigue damage caused byvariant-amplitude stress cycles is linearly accumulated.
2 Advances in Mechanical Engineering

By integrating the linear accumulation formula and theS-N curve, the structural fatigue damage accumulationis written as15
D=X ni
Ni
=XNiDs3
i
KC
+XNjDs5
j
KD
ð3Þ
where Dsi and Dsj are the ith and jth stress ranges thatare larger than and less than DsD, respectively. Ni andNj are the number of cycles of Dsi and Dsj,respectively.
Before utilizing the fatigue damage accumulationformula shown in equation (3), the variant-amplitudestress cycles should be converted into constant-amplitude stress cycles. The equivalent formula can bederived by equations (1)–(3) and is written as
Ds5re =
P NiDs3i
KC+P NjDs5
j
KDPNi +
PNj
� �=KD
ð4Þ
where Dsre is the equivalent stress range.Herein, the truck-induced fatigue damage accumula-
tion can be obtained by implementing the S-N curvesspecified in Eurocode 3 and the linear accumulation cri-terion. The equivalent stress range caused by an indi-vidual truck passage can also be derived.
LSF of fatigue damage accumulation accounting fortraffic growth
A LSF is to describe the relationship between fatigueresistance and fatigue loading, which is the basis forfatigue reliability evaluation. The LSF is essential forfatigue reliability evaluation taking into account thestochastic parameters in structural resistance and load-ing analysis. On this basis, the structural componentwill be demanded as fatigue failure when the number ofstress cycles reaches a critical value. In this study, themajor stochastic parameters, the GVWs and the trafficvolume, are growing with the development of nationaleconomy and should be considered in the LSF.Assuming that the GVW increases linearly, the LSF offatigue damage accumulation during the lifetime of abridge is written as24
gn(X )=DD � Dn(X )=DD � 365Ds5reNde�
Pnt = 1
1+(t � 1)RGVW½ �5
KD
ð5Þ
where gn(X) is the LSF of bridges in the nth year, X is arandom variable, DD is the Miner’s critical damageaccumulation index, Dn(X) is the cumulative fatiguedamage in the nth year, e is the distribution coefficientof transverse axle load, Nd is the number of daily cycleswith respect to Dsre, and RGVW is the annual lineargrowth rate of the GVW.
With the explicit expression of the LSF shown inequation (5), an appropriate approach can be selectedto conduct an accurate fatigue reliability evaluation.Monte Carlo simulation (MCS)25 is utilized herein tocalculate the fatigue reliability of the LSF. Suppose thatthe sample size be N, the estimation of failure probabil-ity is described as
�pf =1
N
XN
i= 1
I(Ai) ð6Þ
I Aið Þ=1 if g(Xi)\0
0 if g(Xi) � 0
�ð7Þ
where I(Ai) is a characteristic function; I(Ai)=1, if thefunction value is less than 0, otherwise I(Ai)=0.According to the geometric meaning of reliabilityindex, the relationship between reliability index andfailure probability can be described as
b= norminv 1� �pf
� �ð8Þ
where norminv represents the inverse function of a nor-mal distribution function. Herein, fatigue reliability ofbridges under site-specific stochastic loading account-ing for the growth of traffic can be calculated with theapplication of the proposed LSF and MCS.
Proposed computational framework forstress spectrum modeling
Conventional approaches
The stress spectrum depends on the geometry of thevehicles, the axle loads, the vehicle spacing, the compo-sition of the traffic, and its dynamic effects. In thisregard, various fatigue load models (FLMs) weredefined in the national design specifications.15–17
Taking Eurocode 116 as an example, five FLMs weredefined here to calculate the stress spectrum for differ-ent applications. FLM 1 has the configuration of thecharacteristic of load model 1 defined in 4.3.2 of
Table 1. Parameters of S-N curve in the Eurocode 3 specification.
Description DsC (MPa) DsD (MPa) DsL (MPa) KC KD
Steel bar 80 59 32 1.02 3 1012 1.64 3 1014
S-N: stress-life.
Yan et al. 3
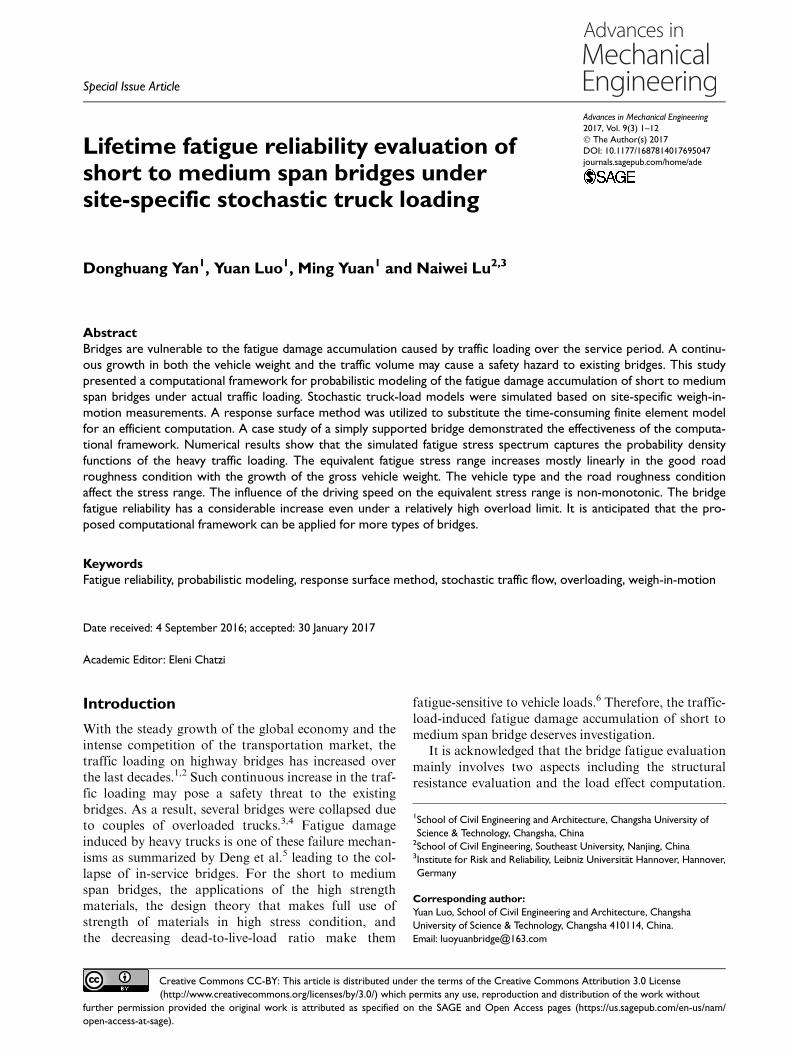
Eurocode 1. FLM 2 consists of a set of idealized lor-ries. FLM 3 was defined as single vehicle model, whichconsists of four axles, each of them having two identi-cal wheels. The geometry of FLM 3 is shown inFigure 1. The weight of each axle is equal to 120kN,and the contact surface of each wheel is a square of side0.40m. FLM 4 consists of sets of standard lorries,which together produce effects equivalent to those oftypical traffic on European roads. FLM 5 consists ofthe direct application of recorded traffic data, supple-mented, if relevant, by appropriate statistical and pro-jected extrapolations. In the above categories, FLMs 3,4, and 5 are intended to be used for the fatigue lifeassessment by reference to fatigue strength curvesdefined in EN 1992 to 1999. With these FLMs, thereare three procedures for stress spectrum molding: (1)conduct the finite element simulation of a bridge undertypical fatigue truck-load model and extract the stresshistories; (2) extract stress cycles via rainflow countingmethod;26 (3) calculate structural fatigue damage basedon Palmgren–Miner criterion. In the above content, theestablishment of typical fatigue truck-load model is ofcrucial importance.
As mentioned above, the typical fatigue truck-loadmodel is able to conduct a deterministic estimation ofthe fatigue condition of bridges. However, as shown inthe introduction, the deterministic analysis cannotreflect the probability characteristic of the traffic condi-tion for an accurate fatigue reliability assessment ofbridges.
The proposed computational framework
For the aforementioned problems, a stochastic fatiguetruck-load model based on site-specific WIM measure-ments is developed here to replace the typical fatiguetruck-load model for the fatigue reliability estimation.A stochastic truck-load model is a parametric truck-load model integrated with statistic parameters, such asthe GVWs, the vehicle types, the driving lanes, and thevehicle speeds. The stochastic truck-load model can besimulated in the time domain. If the conventionalapproach is utilized to simulate the stress spectra underthe stochastic truck-load model, the traffic volume ofthousands of vehicles per day need huge computational
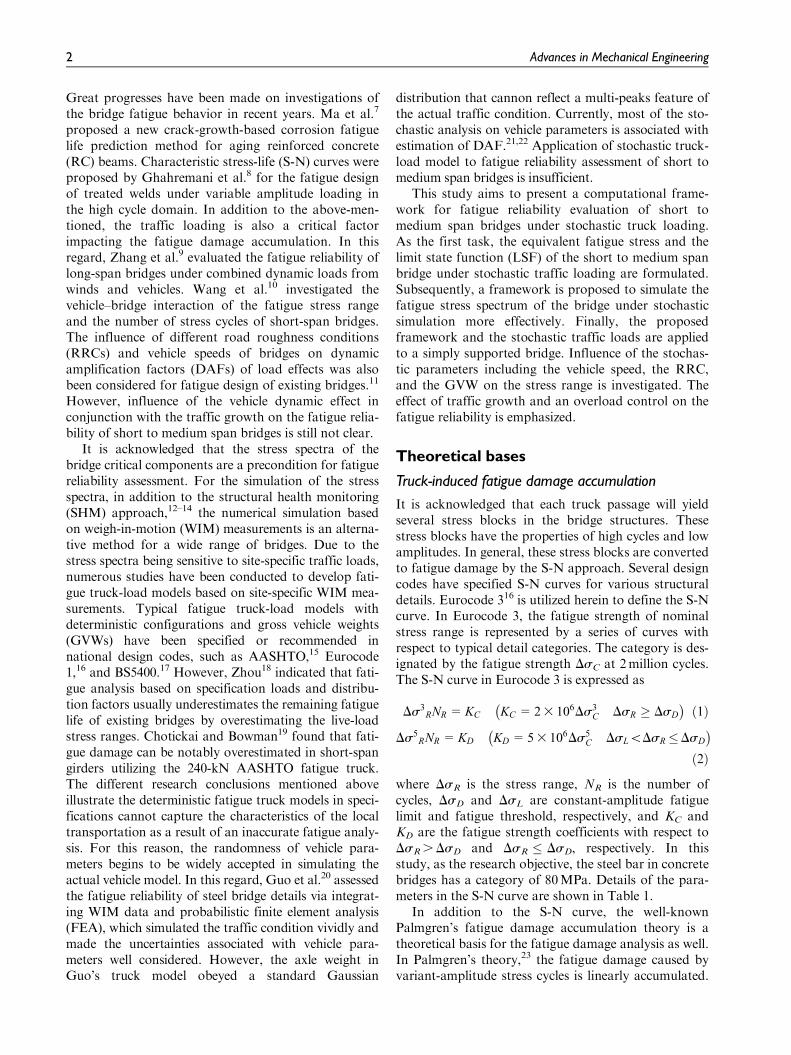
efforts. Therefore, in order to solve the time-consumingproblem, a response surface method (RSM) is utilizedherein to approximate the function relationshipbetween vehicle parameters and structural fatigue stressrange. The RSM can reflect the structural fatigue stressunder the stochastic truck-load model with a smallnumber of samples for finite element program runs.The flowchart of the computational framework isshown in Figure 2.
As shown in Figure 2, there are two critical stepsincluding the deterministic simulation and the probabil-istic modeling of damage accumulation. The determi-nistic simulation is to approximate response surfacefunction based on a small number of truck samples.The probabilistic modeling is to conduct a probabilisticanalysis of fatigue damage accumulation.
Probabilistic modeling of fatigue load effects is a sig-nificant procedure for the structural fatigue reliabilityevaluation. The probabilistic distribution of fatigueanalysis was discussed initially by the American Societyof Civil Engineers (ASCE) Committee on Fatigue andFracture Reliability.27 Subsequently, distributions ofWeibull, Beta, and Lognormal for loading were utilizedto calculate equivalent stress range. In this regard,Pourzeynali and Datta28 utilized Lognormal andWeibull distributions to analyze fatigue reliability ofsuspension bridges. Guo et al.20 utilized the normal andLognormal distribution models to simulate the vehicleparameters including the axle weight and axle spacingbased on the WIM measurements monitored from 2005and then various stress ranges in fatigue critical compo-nents. However, the increasingly heavy-duty trucks inrecent years lead to the complication of simulating thefatigue load effects via a standard probability distribu-tion model. Xia et al.29 characterized the multi-loadeffects such as traffic and wind with the application ofthe mixture distribution models. Similarly, Gaussian
Figure 1. Fatigue load model 3 in Eurocode 1.
Figure 2. Flowchart of the proposed computationalframework.
4 Advances in Mechanical Engineering

mixture model (GMM),30 a method with ability toapproximate the density distribution of any arbitraryshape smoothly, is utilized to capture the multi-peakdistribution characteristics in this study. The proce-dures of the GMM are as follows: (1) analyze the likeli-hood function between monitoring data of fatigueloading; (2) develop iterative estimations of parametersin the GMM including weight, mean value, and var-iance with the utilization of expectation-maximumalgorithm; (3) determine the optimal GMM probabilitymodel based on Akaike information criterion (AIC)and the Bayesian information criterion (BIC).31 Theprobability density function (PDF) of a GMM is writ-ten as
f (x)=XMi= 1
wi
1ffiffiffiffiffiffi2pp
si
� exp � (x� mi)2
2s2i
� ð9Þ
where ai, mi, and si are the weight, mean value, and var-iance of the ith variable in GMM, respectively, and Mis the number of Gaussian models.
A finite element run is essential for each truck pas-sage. It is a time-consuming computation for the entiretruck samples in the stochastic truck-load model.Therefore, the machine learning32 was applied hereinfor effective operation through devising complex mod-els and algorithms that lend themselves to prediction.In general, machine learning approaches mainly includethe neural network method (NNM), the support vectormachine (SVM), the interpolation function method(IFM), and the RSM. In this regard, the selection of anappropriate method is particularly important. Thesemethods have their own characteristics. The NNMrequires massive parameters and has an over-fittingproblem. The SVM requires larger sample inputs andhas no general solution for nonlinear problems, andthe IFM with linear relation between two adjacentinterpolation points is difficult to describe nonlinearphenomena. Therefore, the RSM,33,34 an optimizationmethod with capability of solving the optimization ofthe time-consuming and nonsmooth problems, wasselected herein to make the computation more efficient.
The RSM is a statistical and mathematical techniqueutilized to dispose the conversion problem betweeninput and output in a complex system. A performancefunction with an explicit representation of randomvariables can be approximated by the regression of ananalytical expression to replace the real surface func-tion. A second-order RSM,35,36 the approximate func-tion between vehicle parameters and Dsre is written as
Z =g(X )’ a+Xn
i= 1
bi � Xi +Xn
i= 1
ci � X 2i ð10Þ
where X is a random variable representing GVW in thisstudy, g(X) is the structural performance function, and
a, b, and c are coefficients that will be approximated bythe training data. It is worth noting that a response sur-face function of vehicle of type Vi can be approximatedby 2i + 1 times of computer runs.
Stochastic fatigue truck-load simulation
An accurate simulation of the stochastic fatigue truck-load model is the precondition of fatigue assessment.One or few simple distributions without a comprehen-sive consideration of the random characteristics willcontribute to large errors in fatigue evaluation. Forfatigue analysis of bridges, the application of stochastictruck-load model with time-variant characteristic hasgreat important significance. The stochastic traffic flowis a probability model that takes relevant parameters asrandom variables. These parameters mainly include thevehicle configuration, the GVW, the vehicle spacing,and the driving speed. The vehicle configurations andthe GVW are directly relative to the number of stresscycles and stress ranges, which affect the calculation offatigue damage shown in the aforementioned LSF.Therefore, these two factors are considered in thisstudy. As the study objects herein are small to mediumspan bridges, it is a small probability event that twocars travel on the bridge at the same time. Therefore,the influence of vehicle spacing is ignored. A flowchartof the framework for stochastic fatigue truck-loadsimulation is shown in Figure 3.
The statistical analysis of traffic flows can be esti-mated based on the site-specific WIM measurements.With the statistical database, the stochastic fatiguetruck-load model can be generated via MCS.According to the framework, the first step is to gener-ate the vehicle type. Subsequently, generate the GVWand the axle weight, respectively. At last, determine thedriving speed of the corresponding vehicle. Herein, avector of the ith vehicle type is obtained with the com-bination of the aforementioned parameters. Finally,the traffic matrix can be obtained by repeating theabove steps. It is worth noting that the almost linearrelationship between the axle weights and the GVW ofthe corresponding vehicle type was utilized to make thestatistics of the axle weight more authentic.
Case study
The simply supported prestressed T-beam bridge is cho-sen here as prototype to demonstrate the effectivenessand application of the stochastic fatigue truck-loadmodel and the computational framework for fatiguereliability assessment.
Bridge details and traffic loading
The widely used simply supported bridge with T-girdersis selected as a case study to demonstrate the proposed
Yan et al. 5

computational framework. Dimensions of the cross sec-tion at the central point of the girder (L=40m) areshown in Figure 4. The fatigue critical components arethe steel bars at the bottom of the cross section.Normally, the prestressed girders will not crack in thelifetime, except for undeserved or unsuitable construc-tion or operation in the bridge lifetime. Once the con-crete of the girder cracks, the stress of the steel bar willincrease and has a risk of fatigue damage.
WIM measurements of a highway bridge in Sichuan,China, are utilized in this study. Details of the relevantdata can be found in the work by Liu et al.37 As theresearch objective is the heavy vehicles, filtering pro-cesses were conducted for the purpose of removing theinvalid measurements. The measurements wereexcluded while meeting the following criteria: (1) theGVW is less than 30 kN; (2) the axle weight is greaterthan 200kN or less than 5 kN; (3) the vehicle length ismore than 20m or less than 3m; and (4) measuringdata were affected by system error. The rest of vehiclesamples were classified into six categories according tothe vehicle configuration, where V1 represents the lightcars and V2–V6 represent 2–6 axle trucks, respectively.Proportion of the vehicle types is shown in Figure 5.Subsequently, the PDFs of the GVWs of the relevantvehicle types were simulated via GMM based on theWIM measurements, as shown in Figure 6.
It is observed from Figures 5 and 6 that the heavytrucks have a high proportion and a high overload ratioin the actual traffic condition. GVWs of the highwayhave a significant characteristic of multi-modal distri-bution, which has been approximated by the multi-parameter GMM.
In accordance with the above statistics, stochastictruck-load model can be obtained within 1 h via theMCS based on the flowchart shown in Figure 3, asshown in Figure 7.
As observed from Figure 7, each symbol indicates anindividual truck. Even though these trucks are differentfrom each other, they follow a prescribed probabilitydistribution.
The simulation of the stochastic truck-load modelindicates the accomplishment of the procedures inFigure 3. The statistical vehicle parameters includingthe vehicle type and the GVW provide the data basisfor the subsequent simulation of stress spectra.
Probabilistic modeling of the fatigue stress spectrum
For fatigue damage analysis of the bridge under thesimulated stochastic truck-load model, the dynamic
Figure 3. Flowchart of the stochastic fatigue truck-loadsimulation.
Figure 4. Dimensions of the cross section at the middle of agirder of the bridge with L = 40 m.
Figure 5. Proportion of vehicle types.
6 Advances in Mechanical Engineering

impact was considered in the transient analysis. TheRRC has a significant influence on the vehicle–bridgeinteraction. It is usually simulated by an inverseFourier transformation and an assumed power spectraldensity.22 The road roughness coefficients referred tothe International Organization for Standardization(ISO) specification38 for ‘‘Good,’’ ‘‘Average,’’ and‘‘Poor’’ conditions are 32 3 1026, 128 3 1026, and512 3 1026m3/cycle, respectively. In the finite elementmodel, the load step is 0.01 s, the vehicle velocity is20m/s, the GVW of the vehicle is 100kN, and the road
roughness is supposed as ‘‘Good.’’ In order to studythe influence of the vehicle spacing, which is the vehiclegap between two adjacent vehicles in the same lane, thevehicle spacing is supposed to be 20, 40, and 80m onthe stress history. The bridge with a span length of40m is selected herein as the objective. The computedresults are shown in Figure 8.
It is worth noting that the vehicle spacing impactsthe stress ranges of the bridge. The case of simultaneouspresence of two vehicles on a bridge can be consideredin two cases: (1) longitudinal direction in a same traffic
Figure 6. Probability density curves of GVWs of statistical trucks: (a) light truck, (b) two-axle truck, (c) three-axle truck,(d) four-axle truck, (e) five-axle truck, and (f) six-axle truck.
Yan et al. 7

lane; (2) transverse direction in different traffic lanes.For the first case, influence of the vehicle spacing in atraffic lane on the stress history was analyzed andshown in Figure 8. It is indeed observed that two vehi-cles with vehicle spacing of 20m produce higher stressamplitude than the other two cases. Therefore, the vehi-cle spacing less than the bridge length will magnify thestress range. The simultaneous presence of two vehiclesin the same traffic lane on a short to medium spanbridge is relatively rare. Therefore, this study ignoredvehicle spacing and supposed the vehicle crossed thebridge independently. Lu et al.24 utilized a truck-by-truck simulation to conduct the stress spectrum simula-tion of an orthotropic steel bridge deck since mosteffective influence line is in the region between two dia-phragms (3.2m). The present objective is the simplysupported girder bridge that is different to the steelbridge. Nevertheless, the length of the effective influ-ence line of the simply supported bridge is much shortthan the regular vehicle spacing of highway bridges.For the second case, in the opening literature, thesimultaneous presence of vehicles on a bridge is usually
considered by a multiple presence factor (MPF). Thepractice specifications have defined the MPFs for dif-ferent number of traffic lanes. For instance, the MPFsfor the three traffic lanes are 0.85 and 0.75 according tothe AASHTO15 and the China’s code, respectively.Fu et al.39 used WIM truck data to calibrate the code-specified MPF values, which were verified of being400% higher than the practical case.
On the basis of these time–stress histories, the fatiguestress blocks can be estimated by the rainflow countingmethod. The RSM is utilized to approximate the func-tion corresponding to each vehicle type between GVWsand Dsre. Taking the three-axle truck as an example,the approximated response function is
Dsre = 1 3 10�5w2 + 0:6043w� 1:4109 ð11Þ
where w is GVW of each 3-axel truck.In order to investigate the influence of the vehicle
type and the RRC on the equivalent stress, supposethat a two-axle truck and a six-axle truck with GVWsbetween 20 and 120 t cross the bridge at a constantspeed of 15m/s. Their stress histories were evaluatedbased on the vehicle–bridge coupled vibration system.22
The equivalent fatigue stresses of the bottom steel barunder various load cases are plotted in Figure 9. It isobserved that the equivalent fatigue stress rangeincreases mostly linearly for a good RRC with thegrowth of the GVW. In addition, the vehicle type andthe RRC affect the stress range under the same GVW,where the vehicle with fewer axles and the worse RRCleads to higher stress ranges. These results demonstratethe significance of the fatigue stress calculation ofshort-span bridges accounting for the vehicle type andthe RRC.
In addition to the vehicle type, the RRC, and theGVW, the driving speed of a vehicle influences thevehicle–bridge interaction. Suppose a six-axle truckwith the GVW between 300 and 1500 kN and the
Figure 7. Simulated stochastic truck-load models.
Figure 8. Stress–time histories of a 40-m-length bridge undertwo adjacent three-axle truck loadings in different vehiclespacing.
Figure 9. Influence of the GVW, RRC, and vehicle types on theequivalent stress range.
8 Advances in Mechanical Engineering
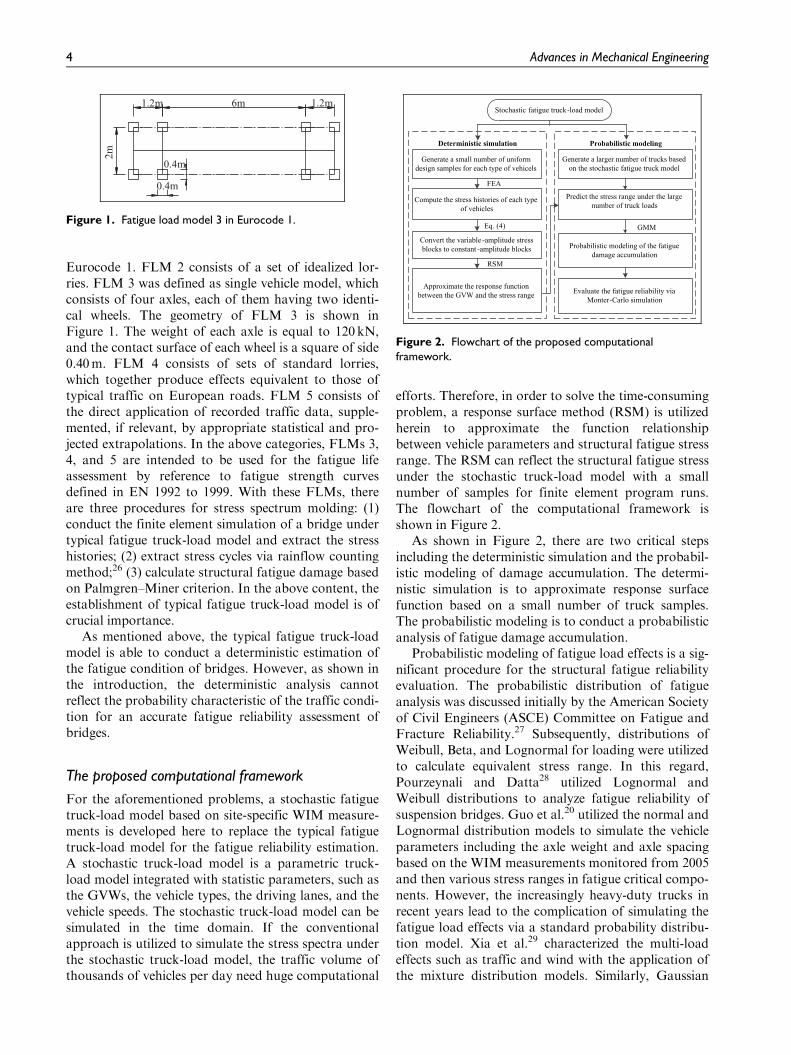
driving speed between 60 and 120km/h cross thebridge, the equivalent stress range versus the drivingspeed is not monotonous, as shown in Figure 10.Therefore, the influence of the driving speed on theequivalent stress range is a wave factor.
A total number of six response functions corre-sponding to six types of vehicles were fitted by 37 timesof computer runs. However, without the RSM, thestress spectrum modeling with thousands of truck sam-ples will cause an incredible number of computationswith the consideration of dynamic impacts.
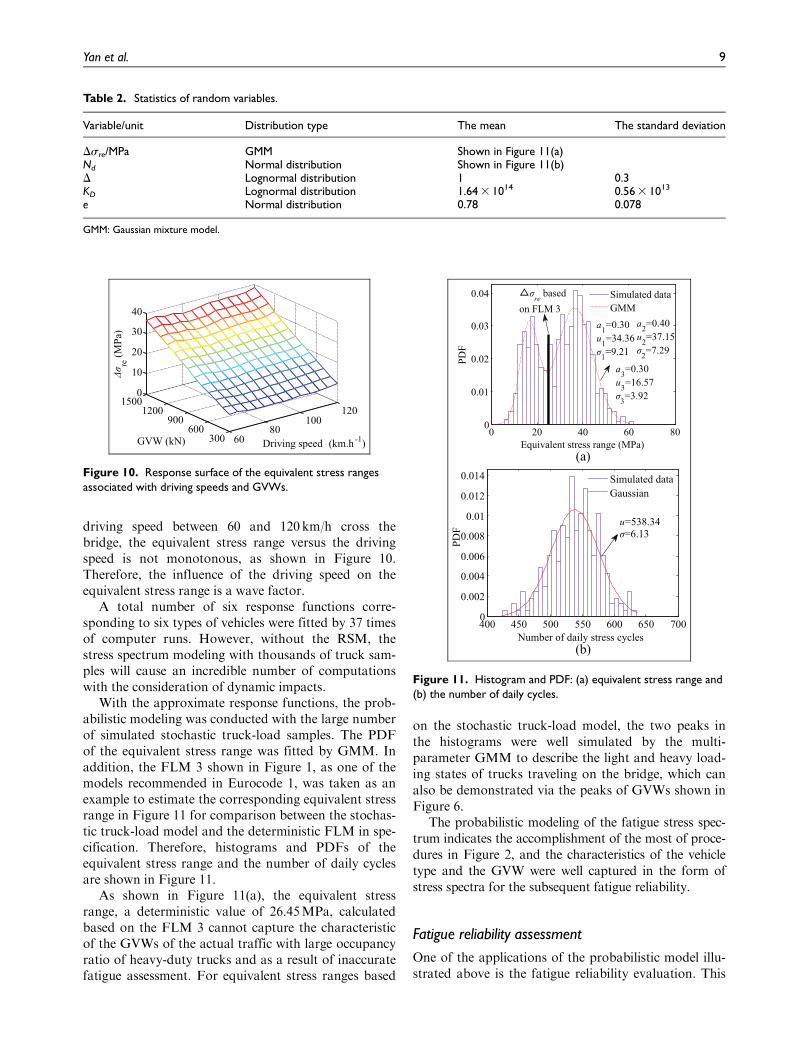
With the approximate response functions, the prob-abilistic modeling was conducted with the large numberof simulated stochastic truck-load samples. The PDFof the equivalent stress range was fitted by GMM. Inaddition, the FLM 3 shown in Figure 1, as one of themodels recommended in Eurocode 1, was taken as anexample to estimate the corresponding equivalent stressrange in Figure 11 for comparison between the stochas-tic truck-load model and the deterministic FLM in spe-cification. Therefore, histograms and PDFs of theequivalent stress range and the number of daily cyclesare shown in Figure 11.
As shown in Figure 11(a), the equivalent stressrange, a deterministic value of 26.45MPa, calculatedbased on the FLM 3 cannot capture the characteristicof the GVWs of the actual traffic with large occupancyratio of heavy-duty trucks and as a result of inaccuratefatigue assessment. For equivalent stress ranges based
on the stochastic truck-load model, the two peaks inthe histograms were well simulated by the multi-parameter GMM to describe the light and heavy load-ing states of trucks traveling on the bridge, which canalso be demonstrated via the peaks of GVWs shown inFigure 6.
The probabilistic modeling of the fatigue stress spec-trum indicates the accomplishment of the most of proce-dures in Figure 2, and the characteristics of the vehicletype and the GVW were well captured in the form ofstress spectra for the subsequent fatigue reliability.
Fatigue reliability assessment
One of the applications of the probabilistic model illu-strated above is the fatigue reliability evaluation. This
Table 2. Statistics of random variables.
Variable/unit Distribution type The mean The standard deviation
Dsre/MPa GMM Shown in Figure 11(a)Nd Normal distribution Shown in Figure 11(b)D Lognormal distribution 1 0.3KD Lognormal distribution 1.64 3 1014 0.56 3 1013
e Normal distribution 0.78 0.078
GMM: Gaussian mixture model.
Figure 10. Response surface of the equivalent stress rangesassociated with driving speeds and GVWs.
Figure 11. Histogram and PDF: (a) equivalent stress range and(b) the number of daily cycles.
Yan et al. 9
can be achieved by utilizing the LSF shown in equation(5). The random variable X in the LSF is associatedwith five parameters including the equivalent stressrange Dsre, the number of cycles Nd, the critical fatiguedamage D, the transverse distribution coefficient ofwheel load e, and the fatigue strength coefficient KD.Statistics of these random variables are shown inTable 2, where the statistics of the D and e are referredto Wirsching40 and Lu et al.24
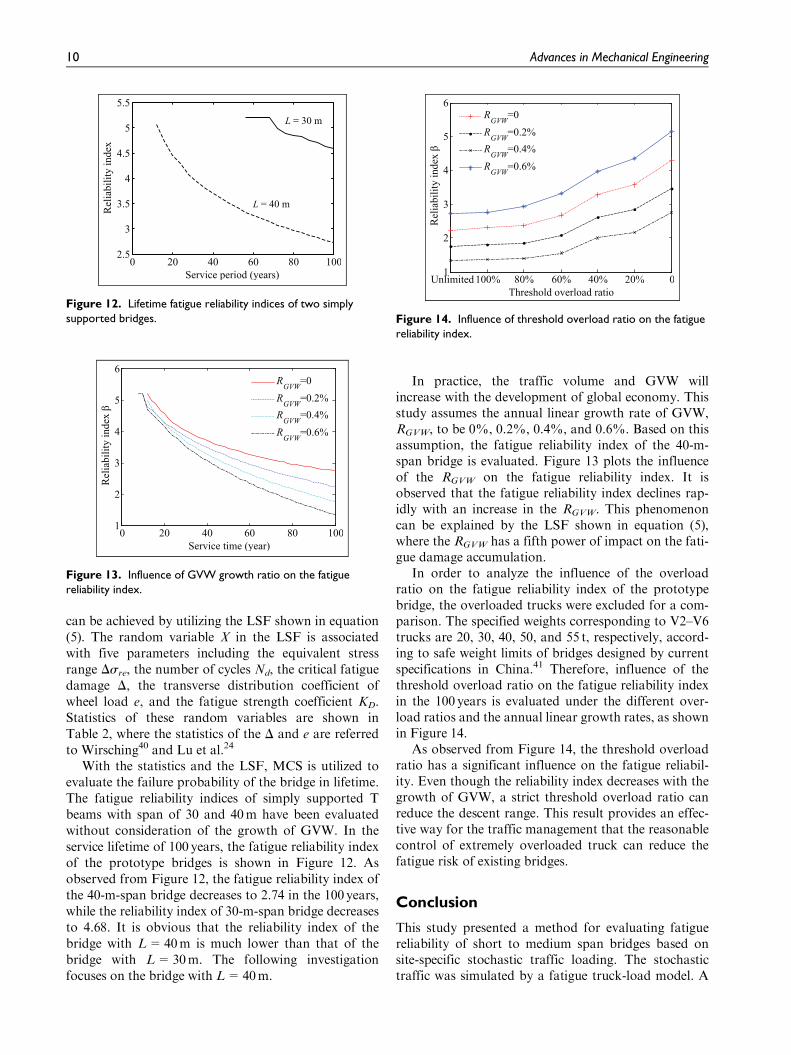
With the statistics and the LSF, MCS is utilized toevaluate the failure probability of the bridge in lifetime.The fatigue reliability indices of simply supported Tbeams with span of 30 and 40m have been evaluatedwithout consideration of the growth of GVW. In theservice lifetime of 100 years, the fatigue reliability indexof the prototype bridges is shown in Figure 12. Asobserved from Figure 12, the fatigue reliability index ofthe 40-m-span bridge decreases to 2.74 in the 100 years,while the reliability index of 30-m-span bridge decreasesto 4.68. It is obvious that the reliability index of thebridge with L=40m is much lower than that of thebridge with L=30m. The following investigationfocuses on the bridge with L=40m.
In practice, the traffic volume and GVW willincrease with the development of global economy. Thisstudy assumes the annual linear growth rate of GVW,RGVW, to be 0%, 0.2%, 0.4%, and 0.6%. Based on thisassumption, the fatigue reliability index of the 40-m-span bridge is evaluated. Figure 13 plots the influenceof the RGVW on the fatigue reliability index. It isobserved that the fatigue reliability index declines rap-idly with an increase in the RGVW. This phenomenoncan be explained by the LSF shown in equation (5),where the RGVW has a fifth power of impact on the fati-gue damage accumulation.
In order to analyze the influence of the overloadratio on the fatigue reliability index of the prototypebridge, the overloaded trucks were excluded for a com-parison. The specified weights corresponding to V2–V6trucks are 20, 30, 40, 50, and 55 t, respectively, accord-ing to safe weight limits of bridges designed by currentspecifications in China.41 Therefore, influence of thethreshold overload ratio on the fatigue reliability indexin the 100 years is evaluated under the different over-load ratios and the annual linear growth rates, as shownin Figure 14.
As observed from Figure 14, the threshold overloadratio has a significant influence on the fatigue reliabil-ity. Even though the reliability index decreases with thegrowth of GVW, a strict threshold overload ratio canreduce the descent range. This result provides an effec-tive way for the traffic management that the reasonablecontrol of extremely overloaded truck can reduce thefatigue risk of existing bridges.
Conclusion
This study presented a method for evaluating fatiguereliability of short to medium span bridges based onsite-specific stochastic traffic loading. The stochastictraffic was simulated by a fatigue truck-load model. A
Figure 12. Lifetime fatigue reliability indices of two simplysupported bridges.
Figure 13. Influence of GVW growth ratio on the fatiguereliability index.
Figure 14. Influence of threshold overload ratio on the fatiguereliability index.
10 Advances in Mechanical Engineering

response surface function was utilized to make thedeterministic simulation of fatigue stress more efficient.Application of the stochastic truck-load model and thecomputational framework was demonstrated through acase study of the simply supported bridge.
Numerical results of the case study show that thesimulated fatigue stress spectra captured the PDFs ofthe heavy traffic loading, where the second peak of thestress spectrum is mostly caused by the overloadedvehicles. The equivalent fatigue stress range increasesmostly linearly in the same RRC with the growth ofthe GVW, and the vehicle type and the RRC affect thestress range under the same GVW; the influence of thedriving speed on the equivalent stress range is non-monotonic. As the annual linear growth rate of theGVW increases from 0% to 0.6%, the fatigue reliabilityindex of the bridge decreases from 2.73 to 1.34. Thebridge fatigue reliability has a considerable increaseeven under a relatively high threshold overload ratio. Itis anticipated that the stochastic fatigue truck-loadmodel and the proposed computational framework canbe developed and applied for more types of bridges.
There are some challenges for further studies. First,the influence of the degradation of the road surfaceroughness condition should be considered as a morerealistic vehicle–bridge interaction model. Second, theRSM can be replaced by the relatively developedmachine learning approaches. Third, the influences ofconcrete cracking and reinforcement corrosion on fati-gue damage should be considered. Finally, the trafficgrowth model should be more realistic rather than anannual linear growth factor. These shortcomingsexposed in this study will be studied in the future work.
Declaration of conflicting interests
The author(s) declared no potential conflicts of interest withrespect to the research, authorship, and/or publication of thisarticle.
Funding
The author(s) disclosed receipt of the following financial sup-port for the research, authorship, and/or publication of thisarticle: This research was supported by the National BasicResearch Program (973 program) of China (Grant No.2015CB057706), the National Natural Science Foundation ofChina (Grant nos 51108046 and 51678068) Hunan ProvincialNatural Science Foundation of China (Grant No. 13JJ6049),Science and Technology Project of Department ofCommunications of Guizhou Province (Grant No.2014122019), Innovation Team Development Fund Project ofDepartment of Education, Changsha University of Scienceand Technology (Grant No. 15QLTD04), the Open Fund ofNational Joint Engineering Research Laboratory for Long-term Performance Improvement Technology for Bridges inSouthern China (CSUST Grant No. 16BCX02), and theResearch Innovation Project of Graduate student in Hunan
Province. Findings and conclusions expressed are those of theauthors and do not necessarily represent the views of thesponsors.
References
1. National Research Council (US). Committee for the study
of the regulation of weights, lengths, widths of commercial
motor vehicles. Regulation of weights, lengths, and widths
of commercial motor vehicles. Washington, DC: Trans-portation Research Board, 2002.
2. Lu N, Noori M and Liu Y. First-passage probability of
the deflection of a cable-stayed bridge under long-termsite-specific traffic loading. Adv Mech Eng 2017; 9: 1–10.
3. OBrien EJ, Bordallo-Ruiz A and Enright B. Lifetimemaximum load effects on short-span bridges subject to
growing traffic volumes. Struct Saf 2014; 50: 113–122.4. Han W, Wu J, Cai CS, et al. Characteristics and dynamic
impact of overloaded extra heavy trucks on typical high-way bridges. J Bridge Eng 2014; 20: 05014011.
5. Deng L, Wang W and Yu Y. State-of-the-art review onthe causes and mechanisms of bridge collapse. J Perform
Constr Fac 2015; 30: 04015005.6. Deng L and Cai CS. Development of dynamic impact
factor for performance evaluation of existing multi-girderconcrete bridges. Eng Struct 2010; 32: 21–31.
7. Ma Y, Xiang Y, Wang L, et al. Fatigue life prediction
for aging RC beams considering corrosive environments.Eng Struct 2014; 79: 211–221.
8. Ghahremani K, Walbridge S and Topper T. High cyclefatigue behaviour of impact treated welds under variable
amplitude loading conditions. Int J Fatig 2015; 81:128–142.
9. Zhang W, Cai CS and Pan F. Fatigue reliability assess-ment for long-span bridges under combined dynamicloads from winds and vehicles. J Bridge Eng 2012; 18:
735–747.10. Wang W, Deng L and Shao X. Number of stress cycles
for fatigue design of simply-supported steel I-girderbridges considering the dynamic effect of vehicle loading.Eng Struct 2016; 110: 70–78.
11. Zhang W and Cai CS. Reliability-based dynamic amplifi-cation factor on stress ranges for fatigue design of existingbridges. J Bridge Eng 2012; 18: 538–552.
12. Chen ZW, Xu YL and Wang XM. SHMS-based fatiguereliability analysis of multiloading suspension bridges. Int
J Fatig 2011; 138: 299–307.13. Deng Y, Liu Y, Feng DM, et al. Investigation of fatigue
performance of welded details in long-span steel bridgesusing long-term monitoring strain data. Struct Contr
Health Monit 2015; 22: 1343–1358.14. Chatzi EN and Smyth AW. Particle filter scheme with
mutation for the estimation of time-invariant parametersin structural health monitoring applications. Struct ContrHealth Monit 2013; 20: 1081–1095.
15. American Association of State Highway & Transporta-
tion Officials, Subcommittee on Bridges. AASHTO load
and resistance factor design movable highway bridge design
specifications. Washington, DC: AASHTO, 2007.16. European Standard EN 1991-2:2003. Eurocode 1: actions
on structures—part 2: traffic loads on bridges.
Yan et al. 11

17. BS 5400-2:1978. Steel, concrete and composite bridges:specifications for loads.
18. Zhou YE. Assessment of bridge remaining fatigue lifethrough field strain measurement. J Bridge Eng 2006; 11:737–744.
19. Chotickai P and Bowman MD. Truck models forimproved fatigue life predictions of steel bridges. J Bridge
Eng 2006; 11: 71–80.20. Guo T, Frangopol DM and Chen Y. Fatigue reliability
assessment of steel bridge details integrating weigh-in-motion data and probabilistic finite element analysis.Comput Struct 2012; 112: 245–257.
21. Xinfeng Y, Yang L, Lu D, et al. Impact factors of bridgesin service under stochastic traffic flow and road surfaceprogressive deterioration. Adv Struct Eng 2016; 19:38–52.
22. Zhang W and Cai CS. Fatigue reliability assessment for
existing bridges considering vehicle speed and road sur-face conditions. J Bridge Eng 2011; 17: 443–453.
23. Miner MA. Cumulative damage in fatigue. J Appl Mech
1945; 12: 159–164.24. Lu N, Noori M and Liu Y. Fatigue reliability assessment
of welded steel bridge decks under stochastic truck loadsvia machine learning. J Bridge Eng 2017; 22: 04016105.
25. Proppe C, Pradlwarter HJ and Schueller GI. Equivalentlinearization and Monte Carlo simulation in stochasticdynamics. Probabilist Eng Mech 2003; 18: 1–15.
26. Rychlik I. A new definition of the rainflow cycle countingmethod. Int J Fatig 1987; 9: 119–121.
27. ASCE Committee on Fatigue and Fracture Reliability.Fatigue reliability. J Struct Div Proc ASCE 1982;108(ST1): 3–23.
28. Pourzeynali S and Datta TK. Reliability analysis of sus-pension bridges against fatigue failure from the gusting ofwind. J Bridge Eng 2005; 10: 262–271.
29. Xia HW, Ni YQ, Wong KY, et al. Reliability-based con-dition assessment of in-service bridges using mixture dis-tribution models. Comput Struct 2012; 106: 204–213.
30. Shental N, Bar-Hillel A, Hertz T, et al. Computing Gaus-sian mixture models with EM using equivalence con-straints. Adv Neural Inform Process Syst 2004; 16:465–472.
31. Vrieze SI. Model selection and psychological theory: adiscussion of the differences between the Akaike informa-tion criterion (AIC) and the Bayesian information criter-ion (BIC). Psychol Meth 2012; 17: 228–243.
32. Samuel AL. Some studies in machine learning using the
game of checkers. IBM J Res Dev 1959; 3: 210–229.33. Liu Y, Lu N and Yin X. A hybrid method for structural
system reliability-based design optimization and its appli-
cation to trusses. Qual Reliab Eng Int 2016; 32: 595–608.34. Wong SM, Hobbs RE and Onof C. An adaptive response
surface method for reliability analysis of structures with
multiple loading sequences. Struct Saf 2005; 27: 287–308.35. Bucher CG and Bourgund U. A fast and efficient res-
ponse surface approach for structural reliability problems.
Struct Saf 1990; 7: 57–66.36. Rajashekhar MR and Ellingwood BR. A new look at the
response surface approach for reliability analysis. Struct
Saf 1993; 12: 205–220.37. Liu Y, Deng Y and Cai CS. Deflection monitoring and
assessment for a suspension bridge using a connected pipe
system: a case study in China. Struct Contr Health Monit
2015; 22: 1408–1425.38. ISO 8608:1995. Mechanical vibration—road surface
profiles—reporting of measured data.39. Fu G, Liu L and Bowman MD. Multiple presence factor
for truck load on highway bridges. J Bridge Eng 2011; 18:240–249.
40. Wirsching PH. Fatigue reliability for offshore structures.
Int J Fatig 1984; 110: 2340–2356.41. GB 1589-2004. Limits of dimensions, axle load and
masses for road vehicles.
Appendix 1
Notation
DD Miner’s critical damage accumulationindex
KC, KD Fatigue strength coefficientsRGVW Annual linear growth rate of GVWw Distribution coefficient of transverse axle
load
DsD constant-amplitude fatigue limitDsL Fatigue thresholdDsR Stress rangeDsre Equivalent stress range
12 Advances in Mechanical Engineering