Advanced GIS Functions
16
TR C- GI S/Event 1/Sess ion 3/ 1 Sess ion 3: Advanc ed GIS functions GIS extensions 3D Analys t Task 1: Construct a TIN Step 1: Create a new map file in ArcMap - Activ ate the ArcGIS programme: “ S ta rt à Program à ArcGIS à ArcMap” - Choose “ A ne w em pt y ma p” when the start up dialogue prompt up. - Click th e icon “ Add Da ta” from the toolbar. - Go to the path “C:\\yuikee\Session3\3DAnalyst” to add the following shapefiles, they ar e “sites.s hp’, “buil d up area.shp”, “contou r .shp”, “spot_ht .shp”, “ re li e f.shp”, “hyd ro.shp” an d “ roa d.s hp” . Step 2: Activat e “3D Analyst ” extension in ArcMap To create a TIN file please follow the steps below. - cli ck “ T o o ls ” à “ Ex ten sio ns” à choose “3D Analyst” and then close this window. - - A toolbar of “3D Anal yst” will appear as shown below. Please check “View à Toolbars” and look for “3DAnalyst” if the toolbar does not show up.
-
Upload
ini-chitoz -
Category
Documents
-
view
270 -
download
0
Transcript of Advanced GIS Functions

7/29/2019 Advanced GIS Functions
http://slidepdf.com/reader/full/advanced-gis-functions 1/16
TRC-GIS/Event 1/Sess ion 3/1
Session 3: Advanced GIS functions
GIS extensions
3D Analyst
Task 1: Construct a TIN
Step 1: Create a new map file in ArcMap
- Activate the ArcGIS programme: “ Startà Programà ArcGISà ArcMap”
- Choose “ A new empty map” when the start up dialogue prompt up.
- Click the icon “ Add Data” from the toolbar.
- Go to the path “C:\\yuikee\Session3\3DAnalyst” to add the following shapefiles, they
are “sites.shp’, “build up area.shp”, “contour.shp”, “spot_ht.shp”, “ relief.shp”,
“hydro.shp” and “ road.shp”.
Step 2: Activate “3D Analyst” extension in ArcMap
To create a TIN file please follow the steps below.
- click “ Tools” à “ Extensions” à choose “3D Analyst” and then close this window.
-
- A toolbar of “3D Analyst” will appear as shown below. Please check “View à
Toolbars” and look for “3DAnalyst” if the toolbar does not show up.

7/29/2019 Advanced GIS Functions
http://slidepdf.com/reader/full/advanced-gis-functions 2/16
TRC-GIS/Event 1/Sess ion 3/2
Step 3: Create the TIN
- “3D Analyst” toolbarà Click “ Create/Modify TIN”à Choose “ Create TIN From
Features”
- In the “Create TIN From Features” dialogue box à choose “spot_ht” from the
column of Layers. This means the “spot_ht” layer will be used to create a TIN.
- choose “SPOT_HT” as the Height Source from the column of Settings for selected
layer.
- Please save your new TIN file in the text box named “ Output TIN” à
C:\yiukee\3DAnalyst\tin à Click “ OK”.
-
- A TIN will be created as shown below.
-
C:\\yuikee\Session3\3DAnal yst\?

7/29/2019 Advanced GIS Functions
http://slidepdf.com/reader/full/advanced-gis-functions 3/16
TRC-GIS/Event 1/Sess ion 3/3
Task 2: Edit TIN by using contour lines
In Task 1, you have prepared a TIN file by using spot height s. The resulted TIN map is
generalized into rigid lines which cannot reflect the topography of Mui Wo
comprehensively. Hence, we will try to refine the TIN by using contour lines.
- In the “3D Analyst” toolbarà click “ Create/Modify TIN”à Choose “ Add Featureto TIN”
- In the “ Add Feature to TIN” dialogue boxà Choose “tin” in the “ Input TIN”
- Choose “contour” from the column of Layers. This means the “contour” layer will be
used to refine the TIN.
- Choose “ CON_HT” as Height Source and Triangulate as “ hardline” from the
column of Settings for selected layer.
- Please save your new TIN file in the text box named “ Output TIN” à
C:\yiukee\3DAnalyst\tin_edità Click “ OK”.
C:\\yuikee\Session3\3DAnal yst\?
7/29/2019 Advanced GIS Functions
http://slidepdf.com/reader/full/advanced-gis-functions 4/16
TRC-GIS/Event 1/Sess ion 3/4
- The result is shown as below:
- As there are too many contour lines on your map, it is hard to see the topography clearly,
so we try to fade out contour lines by the following steps.
- Right click “tin_edit” à Click “Properties” à In the Layer Properties box, click
“Symbology”à Check out “edge types” à Click OK
- The edited TIN without contour lines on top will be shown as below:
- Try to put the “ river” layer on the top of the TOC, then you can see river pattern
lying over the terrain.
-
Quiz
How can you find out the location with 132.4m? (Hints: icons on the tool bar and dialogue boxes can give you a hand.)

7/29/2019 Advanced GIS Functions
http://slidepdf.com/reader/full/advanced-gis-functions 5/16
TRC-GIS/Event 1/Sess ion 3/5
Exercise: River Studies
- A group of S4 students had fieldwork in Mui Wo last Saturday. They studied the
morphology of River Silver and examined the water quality at Point A, B and C. Now
they are using GIS to process and present their results.
Task 1
- Add Point A, B and C on the map by using Editor
Steps: Adding features into the map
- Open the Editor toolbaràViewà Toolbarsà Editor
- Click “ Editor” à Click “ Start Editing”
- In the Editor toolbar, activate the ‘sketch tool’ function by click the icon
- Your task is to “ Create new features” and the target is “sites”, so the toolbar should
be liked this :
-
- click à the mouse will change to à point on the location where your
study site is located à a blue point will be shown on the map
- add all study sites on the mapà When you finish à Click “Editor” à Click “Save
Edits”
- Check the attribute table of site à Right click “sites” layer à Click “OpenAttribute Table”
sites
A
B
C
7/29/2019 Advanced GIS Functions
http://slidepdf.com/reader/full/advanced-gis-functions 6/16
TRC-GIS/Event 1/Sess ion 3/6
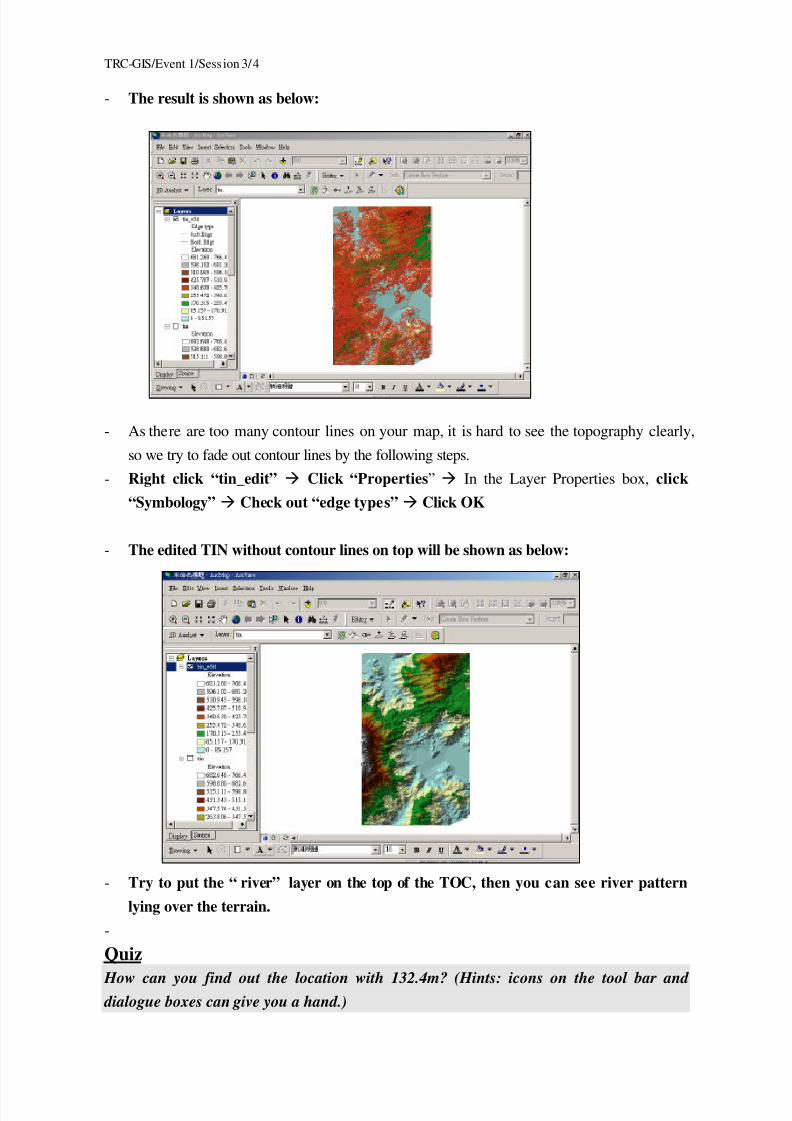
- A table prompt up à Under the field “ id”, change the number according to this
order 1 –3 (see Table 1)à Add the data provided under the field “Name” and other
attributes (See Table 1) to the attribute table
Table 1 Water Quality of Different Sampling Points
Tributary of River SilverSampling
Points
Parameters
A
(id : 1)
B
(id : 2)
C
(id : 3)
DO (mg/l) 7.9 6.5 2.0
pH 7.0 6.4 8.4
Conductivity (ppm) 9 500 1090
Salinity (‰) 0.0 0.3 4.0
- When you finish à Click “ Editor” à Click “Save Edits” à Click “ Stop Editing”
*** Identify the site by using the icon
Task 2
- Add hyperlinks and photographs on the map
Steps: Add photos on the map
- Click on the site
- Right click site on the identify window à choose “Add hyperlink” àA
box pop up à select “link to a document”à choose the file in the path
“C:\\yiukee\3D Analyst\Stream Quality\Photos”
- To display the photo à click à Click the site
Task 3 Study the river profile
- Click the icon “Interpolate Line” à Click Point A, follow the river morphology
and draw a line from Point A to Cà double- click to stop digitizing

7/29/2019 Advanced GIS Functions
http://slidepdf.com/reader/full/advanced-gis-functions 7/16
TRC-GIS/Event 1/Sess ion 3/7
- the result will be shown as below:
- Click the icon ‘Create Profile Graph’ à A river profile graph is created.
Task 4
Discussion
Prepare related questions for students by using the TIN model
Question 1
_________________________________________________________________________
_________________________________________________________________________
Question 2
_________________________________________________________________________
_________________________________________________________________________
Question 3
_________________________________________________________________________
_________________________________________________________________________
Question 4
__________________________________________________________________________________________________________________________________________________

7/29/2019 Advanced GIS Functions
http://slidepdf.com/reader/full/advanced-gis-functions 8/16
TRC-GIS/Event 1/Sess ion 3/8
Spati al Analyst
Task 1: Start the program and open the map document
- Activate the ArcGIS programme from “Startà Program à ArcGIS à ArcMap”- Choose “ A new empty map” when the start up dialogue prompt up.
- Double click ‘Browse’ à Open the map document under the path
“C:\\yuikee\Session 3\Spatial Analyst\API_Map”à Click “ OK”
-
Task 2: Calculating Straight Line Distance, Allocation and Direction
Step 1: Activate “Spatial Analyst” in ArcMap
- click “Tools” à “Extensions ” à choose “Spatial Analyst” and then close this
window.
-
- A toolbar of “Spatial Analyst” will appear as shown below. Please check “View” à
Toolbars” and look for “Spatial Analyst” if the toolbar does not show up.
Task 3: Using Inverse Distance Weighted (IDW) for interpolation
- 1“Spatial Analyst” toolbar à Choose “Interpolate to Raster” à Choose “Inverse
Distance Weighted”

7/29/2019 Advanced GIS Functions
http://slidepdf.com/reader/full/advanced-gis-functions 9/16
TRC-GIS/Event 1/Sess ion 3/9
- 2A box prompt up, change the values as below:
- 3Click “ OK” and wait for minutes during calculation
- 4Click the layer of ‘idw of APIstation’, choose ‘Layers properties’à click ‘Display’ à
choose ‘Transparent’, change the percentage of transparent into 20%
- 5The results will be shown as below:
Discussion
1. Which location has the highest API?
2. What are the land uses in (a)?
3. Suggest the possible measures to alleviate the problems of air pollution in (a)
Exercise
! Create a TIN model by using map data B20000
C:\\yuikee\Session
3\SpatialAnalyst\API_id
AP I
30

7/29/2019 Advanced GIS Functions
http://slidepdf.com/reader/full/advanced-gis-functions 10/16
TRC-GIS/Event 1/Session 3/10
Demonstrations and practice: Applying GIS in teaching AL curriculum
Brainstorming exercise
The list below is the main themes you have to teach at Advanced Level. For each, try to
think about a teaching or learning activity which may make use of GIS:*For the detailed syllabus, go to Education and Manpower Bureau
(www.emb.gov.hk) English Kindergarten, Primary and Secondary Education
Curriculum Development Personal, Social and Humanities Education
Curriculum & Syllabuses Geography Geography (Advanced Level)
Theme Teaching/Learning Activity
Natural Landscapes
Climatic System
Energy budget & flow- insolation and temperature
Atmospheric moisture
- condensation and precipitation
Atmospheric circulation
- pressure and wind
Climatic variation
- climatic types
Landform System
Plate tectonics
-plate movement and tectonic landforms
Drainage basin
- water cycle and basin subsystems
Biotic System
Ecosystem
- energy flow and nutrient cycles
Soils
-soil forming processes
Vegetation
- plant ecology and natural vegetation
Biomes
- vegetation response to environment
People-environment Relationships
Tropical rain forest
- deforestation and afforestation
Tropical desert
- human adaptations and desertification

7/29/2019 Advanced GIS Functions
http://slidepdf.com/reader/full/advanced-gis-functions 11/16
TRC-GIS/Event 1/Session 3/11
Agricultural Landscapes
Farming systems
- agroecosystems and farming types
Agricultural location
- von Thünen and Sinclair modelsImpact of urbanization and
industrialization
- farming changes
Farming hazards
- flooding and droughts
Urban and Industrial Landscapes
Urban functions and hierarchy
- functions of cities and Christallermodel
Urban structure
- urban land use models
Manufacturing location
- Weber model
Urban problems
- housing and transport problems
Environmental impact- pollution and environmental changes
Creating your own step-by-step manual
Exercise 1
Your Advanced Level students should be capable of manipulating data with the GIS.
Now try to prepare a map showing the close relationship between the location of most
recent major earthquakes and the plate boundaries. Work out a detailed step-by-step
manual for your students:
1. Switch on your computer.
2. ___________________________________________________________________
3. ___________________________________________________________________
4. ___________________________________________________________________

7/29/2019 Advanced GIS Functions
http://slidepdf.com/reader/full/advanced-gis-functions 12/16
TRC-GIS/Event 1/Session 3/12
5. ___________________________________________________________________
6. ___________________________________________________________________
7. ___________________________________________________________________
8. ___________________________________________________________________
9. ___________________________________________________________________
10. ___________________________________________________________________
______________________________________________________________________
______________________________________________________________________
______________________________________________________________________
______________________________________________________________________
______________________________________________________________________
______________________________________________________________________
______________________________________________________________________
______________________________________________________________________
______________________________________________________________________
______________________________________________________________________
______________________________________________________________________
______________________________________________________________________
______________________________________________________________________

7/29/2019 Advanced GIS Functions
http://slidepdf.com/reader/full/advanced-gis-functions 13/16
TRC-GIS/Event 1/Session 3/13
Using GIS in field trips and project-based learning
Example 1
Ping Chau Heritage Park - Rural Sustainable Development
Chinese International School
Project Aims
1. Provide a Geographic Information System (GIS) for an inventory of thecultural heritage assets (buildings and other structures) found on the island of
Ping Chau. This GIS would catalogue all structures, their state of repair & use,and most importantly, indicate their level of vulnerability in terms of permanent
loss.
2. Develop a “sustainable use of the island’s cultural heritage plan” and
submit it to the relevant Hong Kong Government Authorities with the aim of facilitating them in establishing “protective guidelines” such as those in placefor the Marine conservation.
3. Establish on going monitoring of the island’s cultural heritage assets.
Project Details
1. Each building/structure on the entire island will be inventoried, by:
i) Being digitally photographedii) Being Geo-coded, using GPS
iii) Recording building/site attributes, such as
• Building materials
• Age
• Current/past use
• Ownership
•
Date of construction• Vulnerability assessment
• Evidence of change
• Other notable featuresiv) Recording current condition of the building
2. Data gathering and presentation will involve the following hardware and software:
• Digital map of the island
• Arcview Software 3.2
• GPS
• Digital Camera• ArcPad/iPac

7/29/2019 Advanced GIS Functions
http://slidepdf.com/reader/full/advanced-gis-functions 14/16
TRC-GIS/Event 1/Session 3/14
3. Summarizing of the data will be in the form of thematic maps which will help identifyrelationships between current use and vulnerability (high risk areas), provide day
trippers with an essential tool to appreciate the cultural assets, provide base line datawhich can track change on the island and facilitate the formulation of a long term
“sustainable use plan”.
4. A “Cultural heritage assets” booklet will be produced for interested parties, such as the
current landowners, governing bodies and visitors. The booklet would includephotographs and relevant maps.
Project Participants and Time Line
1. A pilot project will be undertaken by a small group of Year 11/12 CIS students during
the school’s October Project Week, October 13 – 17, 2003. The purpose of the pilotproject is to develop the GIS methodology which will allow the completion of the
project. A small sample of building in one village will be selected to inventory.
2. In December of 2003, the CIS Year 9 students (110 in total), under “Humanities
Department” direction, will undertake the island wide cultural heritage assetsinventory, which will then be used to provide a baseline for project development.
3. The Chinese International School Year 12/13 Geographers (30 students) who currentlyare involved in field work on the island1 , will formulate a “Sustainable Use of theIsland’s Cultural Heritage Assets” Plan, for submission to relevant authorities. The
plan will be based on empirical data.
4. Monitoring and up dating of the island’s cultural heritage assets will be done by theYear 9 Humanities students on an annual basis.
Funding and Leadership
1. The government of HK has recently announced a “Sustainable Development” fund inwhich schools can apply. The purpose of such a fund, as stated by the government is
to facilitate research projects which are “sustainable in nature” and encourage localcommunity’s to put in place sustainable practices. It would be the intention of this
project to apply for such funding for the purpose of purchasing required equipment to
undertake the field research, for communicating and publicizing the project’s researchto all relevant interested parties and to establish a permanent mechanism which would
ensure sustainability of the cultural assets found on the island.
2. Chinese International School would initiate and undertake the steps in establishing thecultural assets inventory for the island. Long term viability of the project will need thesupport and help from the “island community” who still maintain links with their island
property. It is therefore essential that the island community eventually take“ownership” of the project at an appropriate time for “indefinite” management.
1 http://www.cis.edu.hk/Sec/ss/Geography/IB/fieldwk/pingchau.htm
7/29/2019 Advanced GIS Functions
http://slidepdf.com/reader/full/advanced-gis-functions 15/16
TRC-GIS/Event 1/Session 3/15
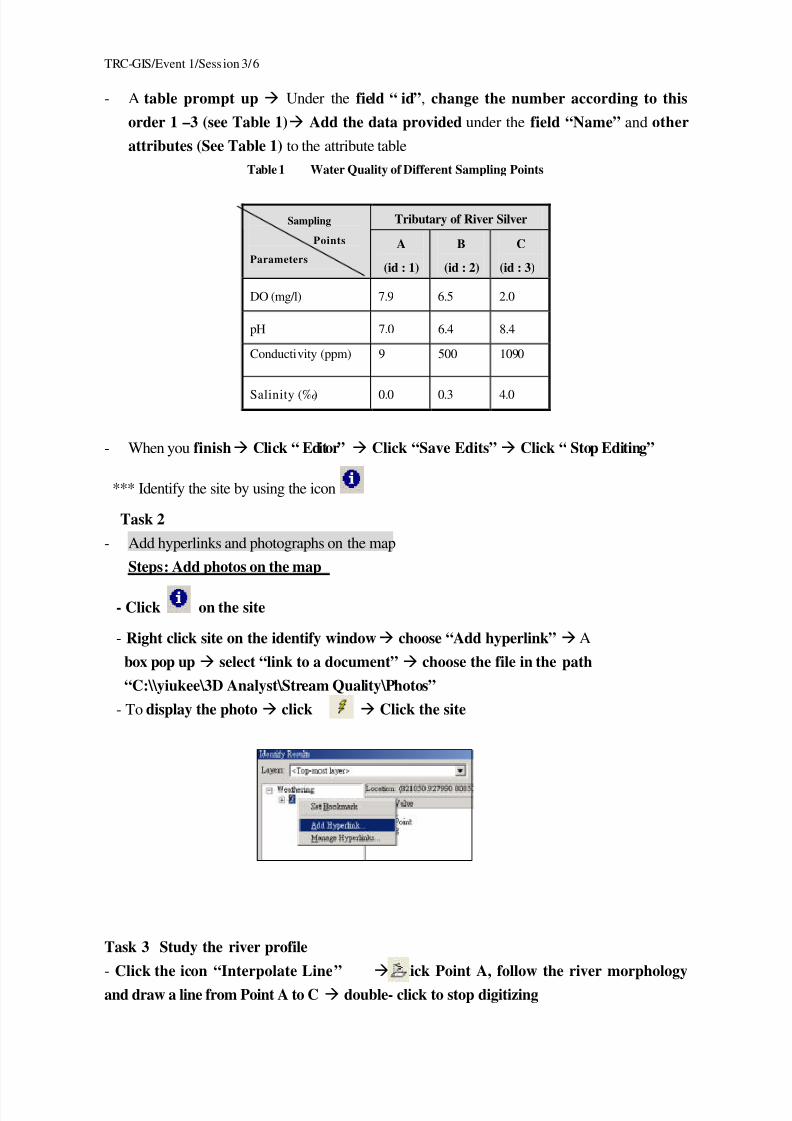
Data Fields and descriptions
Fields Description
Building Number Assign numbers to the buildings on the Arcview map,
then record data according to the assigned numbers.Function State the use of the building. This can be classified into a
few groups: Residential (R), Commercial (C), Religious
(Re), Utility (U). If it is multifunctional state all the letters
that apply, such as “RC”.
Building Materials State the main type of building material. This can be
classified into different groups: Sedimentary rock (SR),
Concrete (C), Granite (G), Mixed (M).
Walls? State the number of walls that are still completely intact(The outer structure). (0, 1, 2, 3, 4)
Roof? State the material used to build the roof (Steel (S), Tiles
(T), Corrigated asbestos sheets (A)). (If the roof is no
longer standing, write None (N).)
Locked? State if the doors are locked. Yes or No.
Evidence of use? Look for evidence (food, dishes, toothbrush etc.) that
shows the building has been used recently. Yes or No.
Evidence of repair? Yes (new windows or doors, concrete walls, ‘mendings’
on the walls, extentions) or No.
Floors? Look at how many floors there are. 1 (ground floor), 2
(another floor including ground floor), or more.
Plumbing? Yes (pipes leading to the house) or No.
Cistern? Yes (cistern outside house) or No.
Photo – exterior, interior and
notable features
Take a photo of the front of the house, another for the
interior (if possible) and one more for a special notable
feature. When collecting the data, just note down the
number of the digital photo (from the digital camera).
Notable features State any notable features (if any) of the building. Choose
one and take a photo. (Example: archways, temple
carvings, barred doors etc.)

7/29/2019 Advanced GIS Functions
http://slidepdf.com/reader/full/advanced-gis-functions 16/16
TRC-GIS/Event 1/Session 3/16
Example 2
Hong Kong Victoria Harbour Through Time Tunnel
Wah Yan College, Kowloon