
Advanced Flue Gas Conditioning as a Retrofit Upgrade to ...
30
Advanced Flue Gas Conditioning as a Retrofit Upgrade to Enhance PM Collection from Coal-Fired Electric Utility Boilers Quarterly Technical Report Reporting Period: January – March 2002 Principal Authors: Kenneth E. Baldrey ADA Environmental Solutions, LLC 8100 SouthPark Way, B-2 Littleton, Colorado 80120 Submitted: May 2002 DOE Award: DE-FC26-00NT40755 Report No. 40755R09
Transcript of Advanced Flue Gas Conditioning as a Retrofit Upgrade to ...

Advanced Flue Gas Conditioning as a Retrofit Upgrade to Enhance PM Collection from Coal-Fired Electric Utility Boilers
Quarterly Technical Report Reporting Period: January – March 2002
Principal Authors: Kenneth E. Baldrey
ADA Environmental Solutions, LLC 8100 SouthPark Way, B-2 Littleton, Colorado 80120
Submitted: May 2002
DOE Award: DE-FC26-00NT40755
Report No. 40755R09
DOE Report No. 40755R09
DISCLAIMER
This technical report was prepared with the support of the U.S. Department of Energy, under Award No. DE-FC26-00NT40755. However, any opinions, findings, conclusions, or recommendations expressed herein are those of the author(s) and do not necessarily reflect the views of the DOE. This report was prepared as an account of work sponsored by an agency of the United States Government. Neither the United States government nor any agency thereof, nor any of their employees, makes any warranty, express or implied, or assumes any legal liability or responsibility for the accuracy, completeness, or usefulness of any information, apparatus, product, or process disclosed, or represents that its use would not infringe privately owned rights. Reference herein to any specific commercial product, process, or service by trade name trademark, manufacturer, or otherwise does not necessarily constitute or imply its endorsement, recommendation, or favoring by the United States Government or any agency thereof. The views and opinions of authors expressed herein do not necessarily state or reflect those of the United States Government or any agency thereof.

DOE Report No. 40755R09
ABSTRACT The U.S. Department of Energy and ADA Environmental Solutions are engaged in a project to develop commercial flue gas conditioning additives. The objective is to develop conditioning agents that can help improve particulate control performance of smaller or under-sized electrostatic precipitators on utility coal-fired boilers. The new chemicals will be used to control both the electrical resistivity and the adhesion or cohesivity of the fly ash. There is a need to provide cost-effective and safer alternatives to traditional flue gas conditioning with SO3 and ammonia. During this reporting quarter, performance testing of flue gas conditioning was underway at the PacifiCorp Jim Bridger Power Plant. The product tested, ADA-43, was a combination resistivity modifier with cohesivity polymers. This represents the first long-term full-scale testing of this class of products. Modifications to the flue gas conditioning system at Jim Bridger, including development of alternate injection lances, was also undertaken to improve chemical spray distribution and to avoid spray deposition to duct interior surfaces. Also in this quarter, a firm commitment was received for another long-term test of the cohesivity additives. This plant fires a bituminous coal and has opacity and particulate emissions performance issues related to fly ash re-entrainment. Ammonia conditioning is employed here on one unit, but there is interest in liquid cohesivity additives as a safer alternative.

DOE Report No. 40755R09 i
TABLE OF CONTENTS INTRODUCTION ............................................................................................ 1 EXPERIMENTAL ............................................................................................ 2
FGC Performance Test at Jim Bridger ........................................................................... 2 Injection System Performance ....................................................................................... 2 Nozzle Spray Test ........................................................................................................ 3 Facility ......................................................................................................................... 3
RESULTS AND DISCUSSION ........................................................................ 5
PacifiCorp Jim Bridger: FGC Performance Test .......................................................... 5 Fly Ash Test Results...................................................................................................... 6 Injection System Performance ....................................................................................... 7 ERC Spray Test Results ................................................................................................ 8 Next Steps at Jim Bridger ............................................................................................ 10 Technology Transfer and Commercialization ............................................................ 10
CONCLUSION ............................................................................................... 11 REFERENCES ............................................................................................... 12 LIST OF ACRONYMS AND ABBREVIATIONS ....................................... 13 APPENDIX A: DRAFT SCOPE OF WORK .............................................. A-1
DOE Report No. 40755R09 ii
LIST OF GRAPHICAL MATERIALS FIGURE 1: ERC SPRAY TEST FACILITY ............................................................. 4 FIGURE 2: ERC FACILITY PHOTO ....................................................................... 4 FIGURE 3: T/R POWER IN 1ST FIELD WITH CONDITIONING (UNIT 1) AND WITHOUT (UNIT 2) .............................................................................................. 5 FIGURE 4: SPARK RATE IN 1ST FIELD WITH CONDITIONING (UNIT 1) AND WITHOUT (UNIT 2) .............................................................................................. 6 FIGURE 5: FLUE GAS TEMPERATURE AT FGC INJECTION LOCATION ............ 7 FIGURE 6: COMPARISON OF MEAN DROPLET FRACTION ................................ 9 FIGURE 7: COMPARISON OF LARGE DROPLET FRACTION .............................. 9

DOE Report No. 40755R09 Page 1
INTRODUCTION The objective of this program is to develop a family of cohesivity modifying flue gas conditioning agents that can be commercialized to provide utilities with a cost-effective means of complying with particulate emission and opacity regulations. Improving the cohesivity and agglomeration of fly ash particles is a proven means of increasing the collection efficiency of an electrostatic precipitator (ESP). Optimizing these properties in combination with control of electrical resistivity is vital to the overall collection efficiency of ESPs, and flue gas conditioning may provide the most cost effective means in today’s deregulated utility market for plants to meet DOE’s goals of 0.01 lb/Mbtu and 99.99% collection efficiency in the particle size range of 0.1 to 10 microns. This new class of additives is needed because currently available agglomerating aids on the market require the storage and handling of large quantities of ammonia, which under recent legislation has been classified as extremely hazardous and necessitates extensive risk assessment and emergency response plans. There are also operating conditions and coals where the ammonia-based technologies are not effective and treated ash may be unusable for recycle applications or difficult to dispose due to ammonia vapor off-gas. This quarterly report covers technical work undertaken on the project from January through March 2002. During this period work was underway on Task 5, Conduct Demonstrations to Confirm Performance for Different Coals and Configuration. Full-scale testing of flue gas conditioning was conducted at Jim Bridger Power Plant, Unit 1. The performance results were positive; however, hardware problems that resulted in deposition within the ductwork developed. Testing was discontinued and the injection system was modified to overcome the application problems.
DOE Report No. 40755R09 Page 2
EXPERIMENTAL FGC Performance Test at Jim Bridger A test of the flue gas conditioning performance was conducted on Unit 1 at Jim Bridger in January 2002. Conditioning rate varied from 0.25 to 1.0 lbs/ton fuel (0.125gm/kg to 0.5 gm/kg). Conditioning was applied as necessary to maintain acceptable opacity with variable coal quality. Due to the need to accommodate operational requirements, comparative data at fixed conditioning rates was not obtained. Process data was collected for both Units 1 and 2 during the test period. Unit 2 did not employ flue gas conditioning during the operational test. Fly ash samples were obtained from Units 1 and 2 storage silos during the operational test. Selected fly ash samples were tested for suitability for concrete admixture by the ASTM C618-97 procedure1. The on-site ash contractor also ran a proprietary foam index test on selected samples of conditioned fly ash. This test is a form of titration of a fly ash/water mixture with an air entrainment chemical until a given level of stable foam is produced. This gives a comparative value of the chemical reactivity of the fly ash to the air entrainment chemicals. Injection System Performance The flue gas conditioning system at Jim Bridger was a retrofit of an existing spray humidification system, as previously described2. At the beginning of the program at Jim Bridger, the original spray nozzles were replaced with a finer atomizing nozzle from the original manufacturer (EnviroCare). In addition, the liquid flow was reduced to less than 8 gpm, boosting the Air-to-Liquid ratio (ALR) of the nozzles. These changes improved atomization while the lances were clean. However, spray-induced buildup onto the cool lance surfaces was not significantly reduced. Therefore, once the spray-induced buildup directly interfered with spray patterns, the atomization rapidly degraded. Problems with control of air and water pressure also contributed to periods of poor spray atomization. In the original control mode for the humidification system, liquid and air pressure was adjusted dynamically using a differential pressure signal. Liquid pressure was allowed to fluctuate with the plant firewater supply pressure. This system was intended for feedback of gas temperature for control of in-duct spray cooling. However, the degree of control required, the instrumentation response, and the implementation of PLC logic to accomplish this proved to be a major undertaking that was never entirely successful. Poor atomization contributed to spray-induced deposition inside the duct onto turning vanes, flow dampers and perf screens. Visual monitoring with an in-duct video camera and inspections of the duct and injection lances confirmed the problems with the injection system.
DOE Report No. 40755R09 Page 3
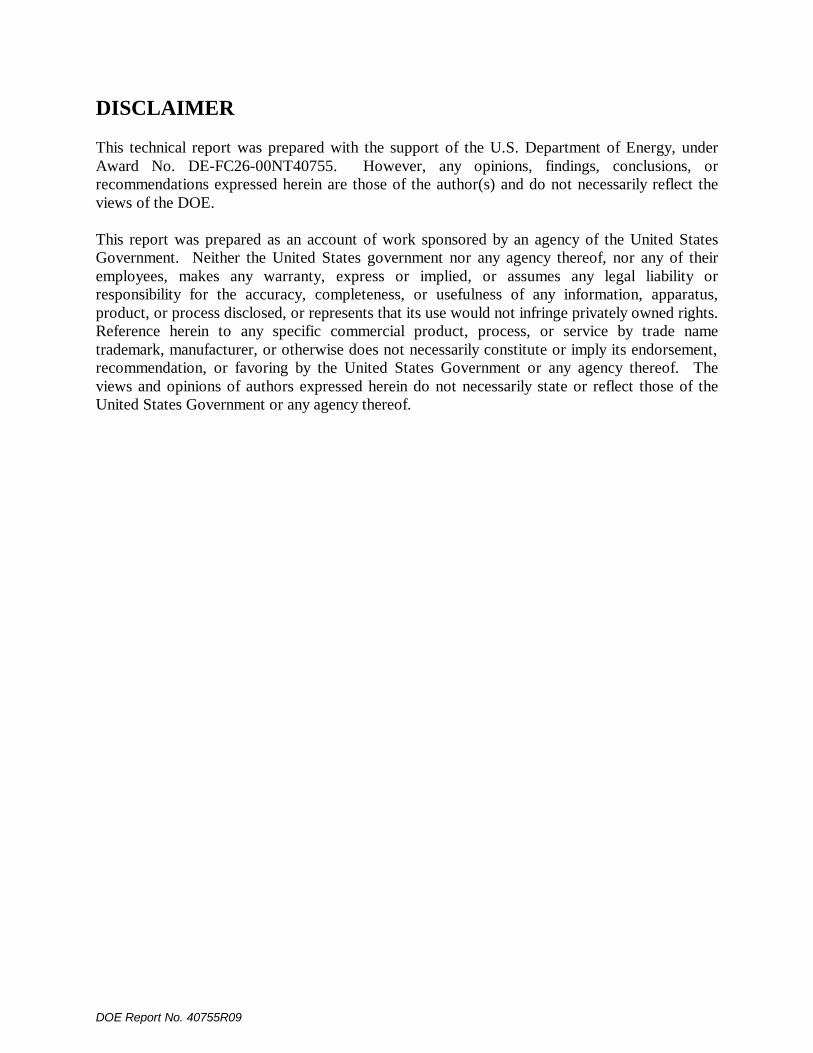
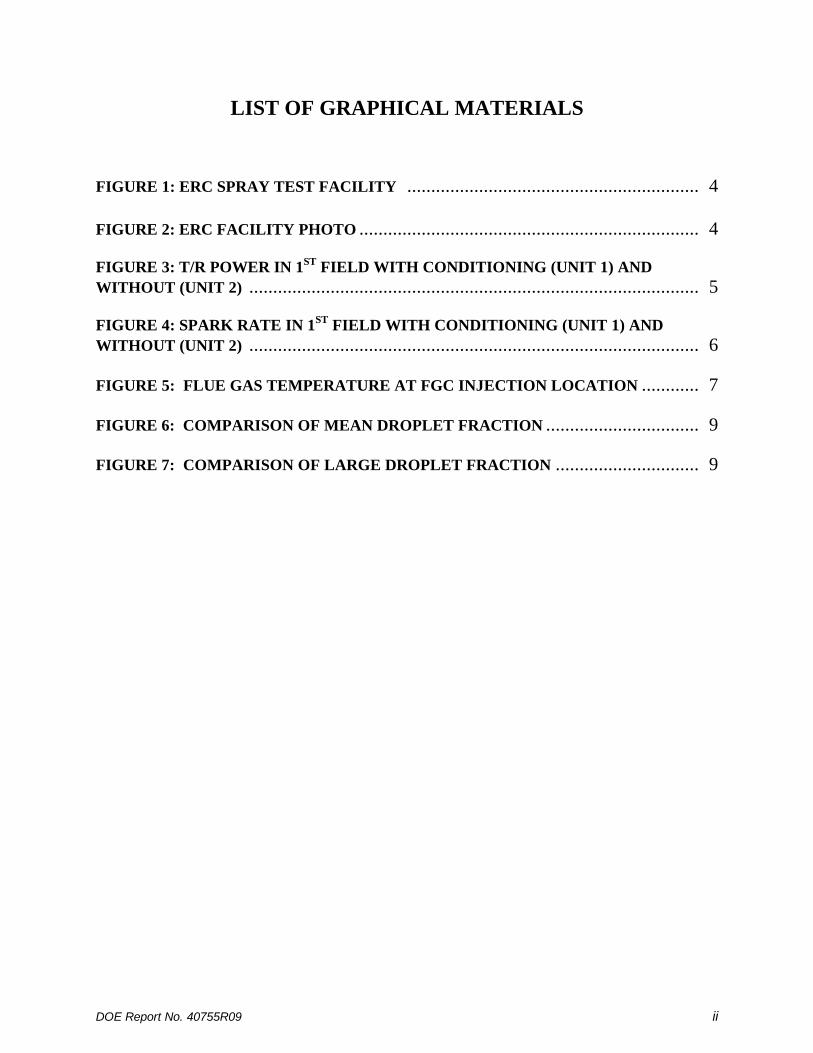
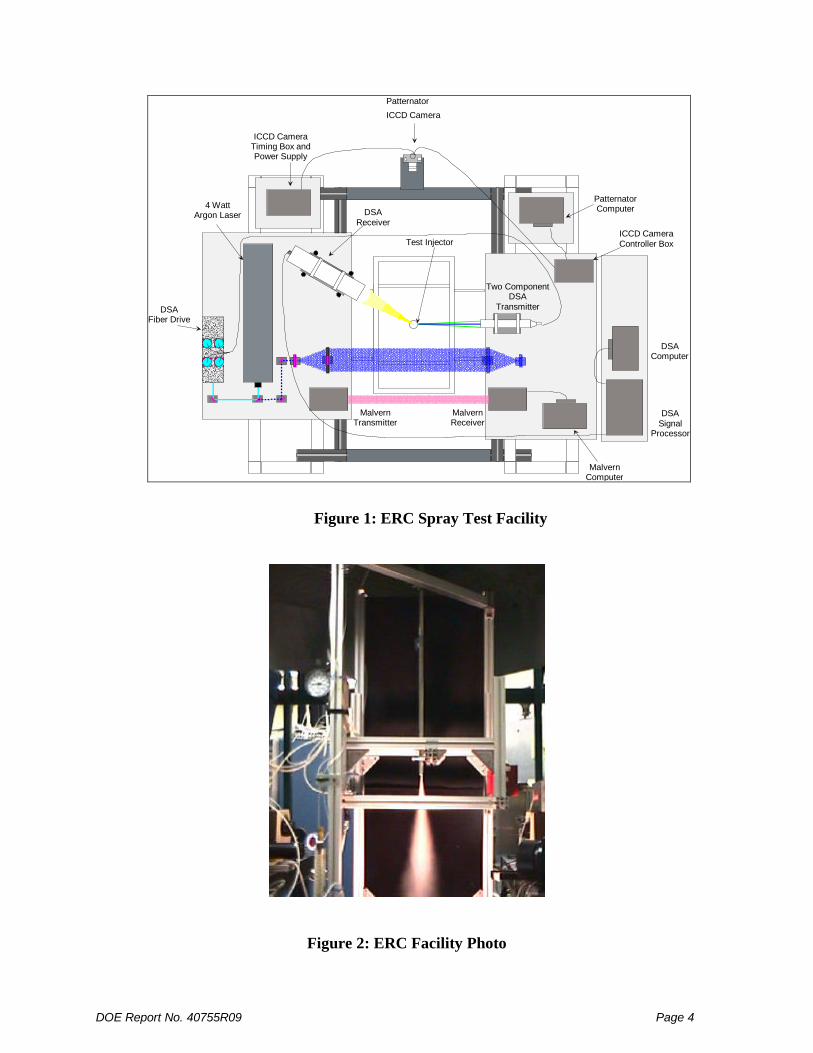
Nozzle Spray Test One of the root causes of the duct deposition at Jim Bridger was spray nozzle performance. Droplet size, in particular the large droplet fraction, must be minimized for successful liquid flue gas conditioning (FGC). Compressed air availability is typically less than optimal; nozzles must also be efficient. Based on published data, the low flow humidification nozzles appeared to be acceptable. However, it was decided to characterize the actual droplet size distribution to see if better performance could be obtained and if the nozzle was performing to specification. Energy Research Consultants completed a laboratory evaluation of spray performance under subcontract to ADA-ES. In addition to the humidification spray nozzle, several other dual-fluid nozzles were tested to select the best nozzle for an alternate FGC injection lance. This study focused on the droplet median size distribution and on large droplet formation. Sprays were generated at three water flow rates (3, 6, and 12 gph) and at three air pressures (50, 70, and 90 psig). Flow data, visualization, and Phase Doppler Interferometry (PDI) sizing and velocity measurements were obtained in each case. Facility Figure 1 is a schematic arrangement of the ERC Spray Test Facility. Phase Doppler Interferometry was used for the study. The facility schematic also includes two diagnostics not used in the present study: Laser Diffraction (Malvern) and Optical Patternation. Figure 2 presents a photo of a nozzle installed on the vertical traverse, which in turn is mounted onto a cage assembly on the downfired side of the ERC Spray Stand. The nozzles were centrally located within a 22.5 inch x 22.5 inch (0.57m x 0.57m) square duct and injected the spray downward into the coflowing air moving at ~1 m/s. Drop separation and exhaust occurs in a plenum below the field of view shown in Figure 1. The longest lance tested for the present project was about 48 inches (1.2m).
Phase Doppler Interferometry sizing and velocity were obtained with an Aerometrics DSA system sampling 12 inches (0.3m) downstream of the nozzle exit. D10, D32, DV0.5, DV0.9, mean axial velocity, and volume flux were measured or calculated for each nozzle and condition. D10 is the linear average of all the drops in the spray at the particular position probed. D32 (also known as the Sauter mean diameter or SMD) is the diameter of the drop whose ratio of volume to surface area is the same as that of the entire spray at the particular position probed. DV0.5 is the drop diameter such that 50% of the total liquid volume in the sample is contained in drops of smaller diameter. DV0.9 is the drop diameter such that 90% of the total liquid volume in the sample is contained is in drops of smaller diameter.
DOE Report No. 40755R09 Page 4
DSAReceiver
DSASignal
Processor
DSAComputer
4 WattArgon Laser
DSAFiber Drive
Two ComponentDSA
Transmitter
Test Injector
Patternator
ICCD Camera
PatternatorComputer
MalvernComputer
MalvernTransmitter
MalvernReceiver
ICCD CameraTiming Box andPower Supply
ICCD CameraController Box
Figure 1: ERC Spray Test Facility
Figure 2: ERC Facility Photo
DOE Report No. 40755R09 Page 5
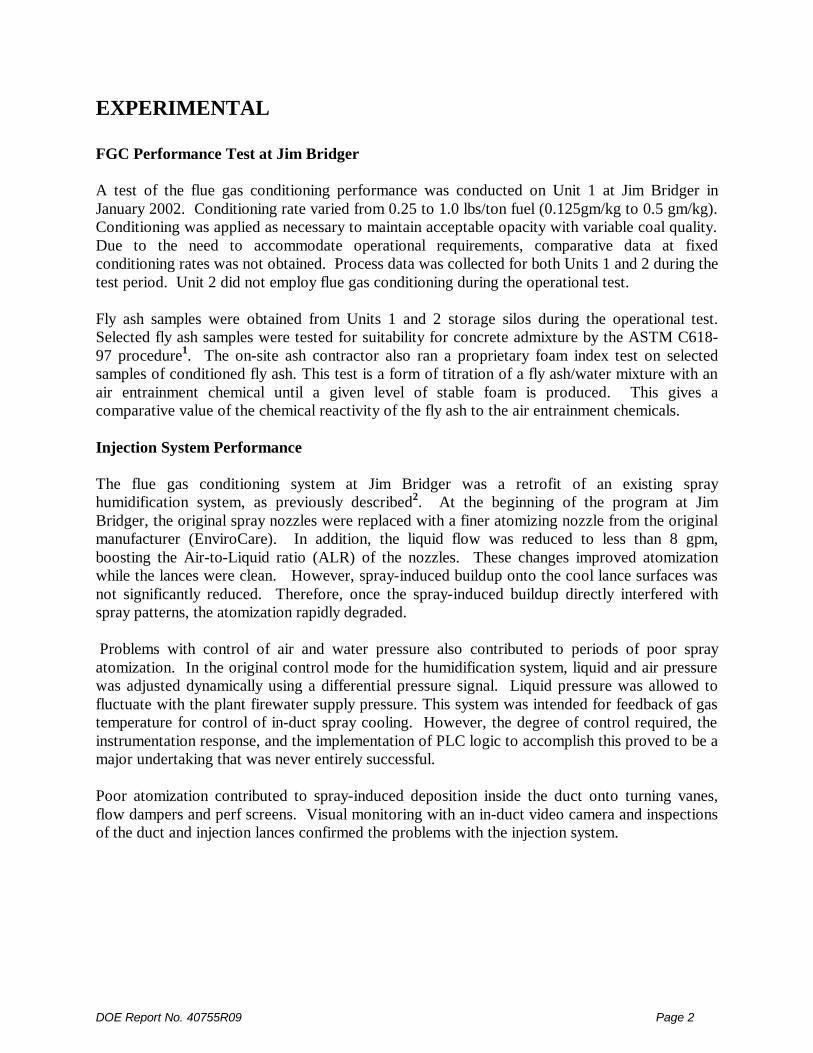
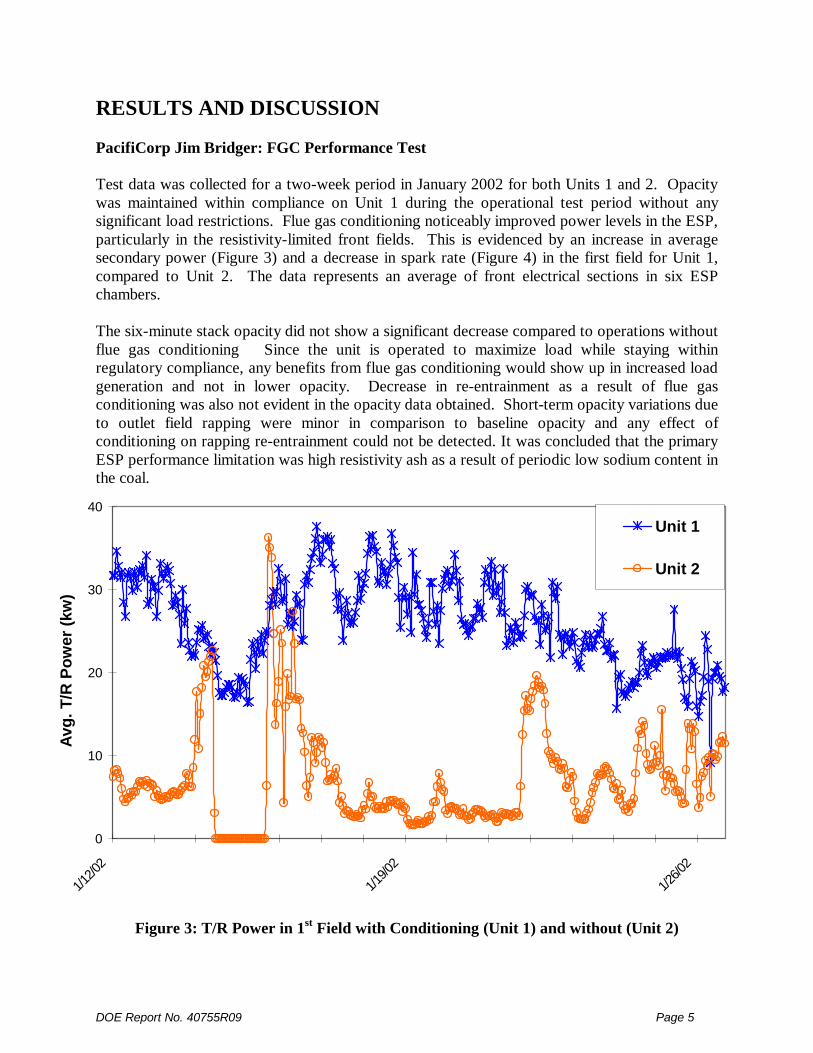
RESULTS AND DISCUSSION PacifiCorp Jim Bridger: FGC Performance Test Test data was collected for a two-week period in January 2002 for both Units 1 and 2. Opacity was maintained within compliance on Unit 1 during the operational test period without any significant load restrictions. Flue gas conditioning noticeably improved power levels in the ESP, particularly in the resistivity-limited front fields. This is evidenced by an increase in average secondary power (Figure 3) and a decrease in spark rate (Figure 4) in the first field for Unit 1, compared to Unit 2. The data represents an average of front electrical sections in six ESP chambers. The six-minute stack opacity did not show a significant decrease compared to operations without flue gas conditioning Since the unit is operated to maximize load while staying within regulatory compliance, any benefits from flue gas conditioning would show up in increased load generation and not in lower opacity. Decrease in re-entrainment as a result of flue gas conditioning was also not evident in the opacity data obtained. Short-term opacity variations due to outlet field rapping were minor in comparison to baseline opacity and any effect of conditioning on rapping re-entrainment could not be detected. It was concluded that the primary ESP performance limitation was high resistivity ash as a result of periodic low sodium content in the coal.
Figure 3: T/R Power in 1st Field with Conditioning (Unit 1) and without (Unit 2)
0
10
20
30
40
1/12/0
2
1/19/0
2
1/26/0
2
Avg
. T/R
Pow
er (k
w)
Unit 1
Unit 2

DOE Report No. 40755R09 Page 6
0
8
16
24
32
12-Ja
n-02
19-Ja
n-02
26-Ja
n-02
Spa
rk R
ate
(spm
)
U1 Avg Spark RateU2 Avg Spark Rate
Figure 4: Spark Rate in 1st Field with Conditioning (Unit 1) and without (Unit 2)
Fly Ash Test Results The only notable difference between the conditioned ash from Unit 1 and the unconditioned ash from Unit 2 when tested by ASTM C618 specification was an increase in “available alkali” content for one set of samples tested (0.7% to 1.3%). At this plant, the sodium in coal is quite variable so that it is not unusual to see variation in elemental sodium and available alkali. The available alkali specification at this plant and for most of the nation is typically 1.5% or less as set by various state highway transportation agencies. All samples tested were acceptable in terms of strength activity, water requirement, and other physical specifications. The foam index value for conditioned fly ash from Unit 1 compared to unconditioned ash was lower (i.e. the conditioned ash tended to require less air entrainment chemical). This ultimately would be interpreted as a net benefit due to lower use of costly air entrainment chemicals. However, in the short-term any variability up or down compared to the typical range for this fly ash is detrimental because the end users must re-adjust their mix parameters accordingly. However, for a long-term use situation this would not create a problem and for certain plants that have difficulty with foam index and air entrainment issues this could be a significant net benefit.

DOE Report No. 40755R09 Page 7
Injection System Performance During the FGC performance test, ongoing problems with spray deposition became more severe. Further modifications were made to the control of the FGC system to decrease total liquid flow rate and to eliminate periods of erratic control of air pressure. In addition, lances were cleaned and inspected weekly. The liquid flow rate was decreased to 4 – 6 gpm, the minimum possible with existing instrumentation and control. It would have been desirable to further reduce the liquid flow rate to improve atomization. However, the humidification spray system was intended for a normal flow rate of 60 gpm and the control at the low end became very erratic. It was concluded that injection lances with large, cooled surfaces and non-aerodynamic profile, such as those of the existing humidification system, were not suitable for spray of dilute chemical additives or for spray of water into the flue gas at this location unless cleaning was performed daily. This level of attention was beyond the scope of the project and was certainly not practical with the plant’s scarce maintenance resources. All injection of FGC additives was discontinued in late January 2002 after a cleaning of extensive deposition in the ESP inlet duct on Unit 1. During the duct inspection some hardened coating was observed on duct walls and on ESP perforation screens well downstream of injection lances. These deposits were not characteristic of water and fly ash and may have formed as a result of chemical reaction with the cohesivity additives in the ADA-43 blend. Again, however, the poor atomization and large droplet generation were likely a factor in formation. Another factor contributing to wall wetting and deposition may have been incomplete evaporation of spray droplets due to cold zones in the duct. Examination of data collected across an array of thermocouples at the FGC injection location revealed significant temperature stratification (Figure 5). Across one side of the duct, the temperatures ranged from 240 – 320oF (116 – 160oC).
Figure 5: Flue Gas Temperature At FGC Injection Location
150
200
250
300
350
37329
Tem
pera
ture
(°F)
APH1: TC1 APH1: TC2 APH1:TC3 APH1:TC4

DOE Report No. 40755R09 Page 8
ERC Spray Test Results A low flow version of the spray nozzle for the Jim Bridger humidification system was compared to ADA-ES spray nozzles at the ERC Spray Test Facility, as previously described. The ADA-ES nozzles were installed in a straight-in lance available commercially (J-Core). Table 1 summarizes the nozzle performance at the actual operating conditions of the injection array. Figures 6 and 7 compare the Sauter mean diameter (droplet surface average) and the volume drop size at 90% of the distribution (DV90). At the operating point indicated for the humidification nozzle, the liquid and air pressure are approximately 50 - 60 psig. With the existing FGC control system, this was the maximum pressure obtainable due to limited compressed air. With lower liquid flow rate and fewer nozzles it was possible to operate the ADA-ES nozzle at a steady pressure of greater than 90 psig. The difference in operating pressure and the use of a nozzle more specialized to flue gas conditioning contributes to a big difference in performance. D32 for the ADA-ES nozzle was 17 ? m compared to more than 45 ? m for the humidification nozzle. Difference in the large droplet size was even more extreme: DV90 at 80+ ? m compared to 27 ? m. The Sauter mean diameter is a performance indicator of the overall spray distribution, while the DV90 is a measure of the maximum droplet size and the maximum time to evaporate. The maximum droplet size is the primary parameter that will influence deposition past the spray zone. Even with a clean lance the largest droplets produced with the existing lances were likely too large to evaporate before reaching downstream duct features. This contributed to wall wetting and deposition into the ESP.
Table 1: Comparison of Nozzle Performance at Actual Conditions
Injection Lance # Nozzles
Air Flow
(scfm)
Liquid Flow
(Gpm)
Air Pressure
(psig)
Sauter Mean Diameter
(µm)
Max. Droplet Size, DV90
(µm) Humidification 32 450 >4.0 50 – 60 46 82 J-Core w/ADA-ES Nozzles
12 235 1.2 90 17 27

DOE Report No. 40755R09 Page 9
Figure 6: Comparison of Mean Droplet Fraction
Figure 7: Comparison of Large Droplet Fraction
10
20
30
40
50
60
70
80
90
0.0 1.0 2.0 3.0 4.0Air-To-Liquid Ratio
DV
90 D
ia. (
um)
Humidifcation Nozzle Operating Point
ADA-ES NozzleOperating Point
Humidifcation Nozzle
ADA-ES Nozzle
10
15
20
25
30
35
40
45
50
0.0 1.0 2.0 3.0 4.0Air-To-Liquid Ratio
Saut
er M
ean
Dia.
(um
)
Humidifcation Nozzle Operating Point
ADA-ES NozzleOperating Point
Humidifcation Nozzle
ADA-ES Nozzle
DOE Report No. 40755R09 Page 10
Next Steps at Jim Bridger At a project meeting in February, results and problems with the FGC system were discussed and alternatives to the existing injection lances were explored. Further chemical injection was halted pending resolution of the spray injection. Two alternate injection lances were proposed by ADA-ES. The lances included the following:
1. Straight-in lance (J-Core) with single ADA-ES nozzle 2. ADA-ES shielded, multi-nozzle lances
In addition, changes were recommended to the FGC control system:
Maintain constant liquid pressure (add boost pump and backpressure regulator to eliminate fluctuations in system water pressure);
Regulate air pressure to a constant pressure rather than by differential difference to water pressure; and
Reduce overall liquid flow to less than 2 gpm. The plant opted to proceed with a spray test with a straight-in lance design and the recommended flow changes as the least-cost alternative. A test of the modified system was scheduled on Unit 4 prior to a scheduled spring outage. ADA-ES has manufactured a set of 12 injection lances and completed other modifications to the FGC system. Technology Transfer and Commercialization During the quarter a detailed proposal was submitted and accepted for a long-term evaluation of the cohesion additives at an eastern utility plant firing a bituminous coal. The plant is American Electric Power Conesville Unit 3. A draft Scope of Work for this demonstration is included in Appendix A. Installation of equipment is expected to be completed in June 2002 with testing set to begin later in the summer of 2002. Test schedule may be delayed past peak summer generation.

DOE Report No. 40755R09 Page 11
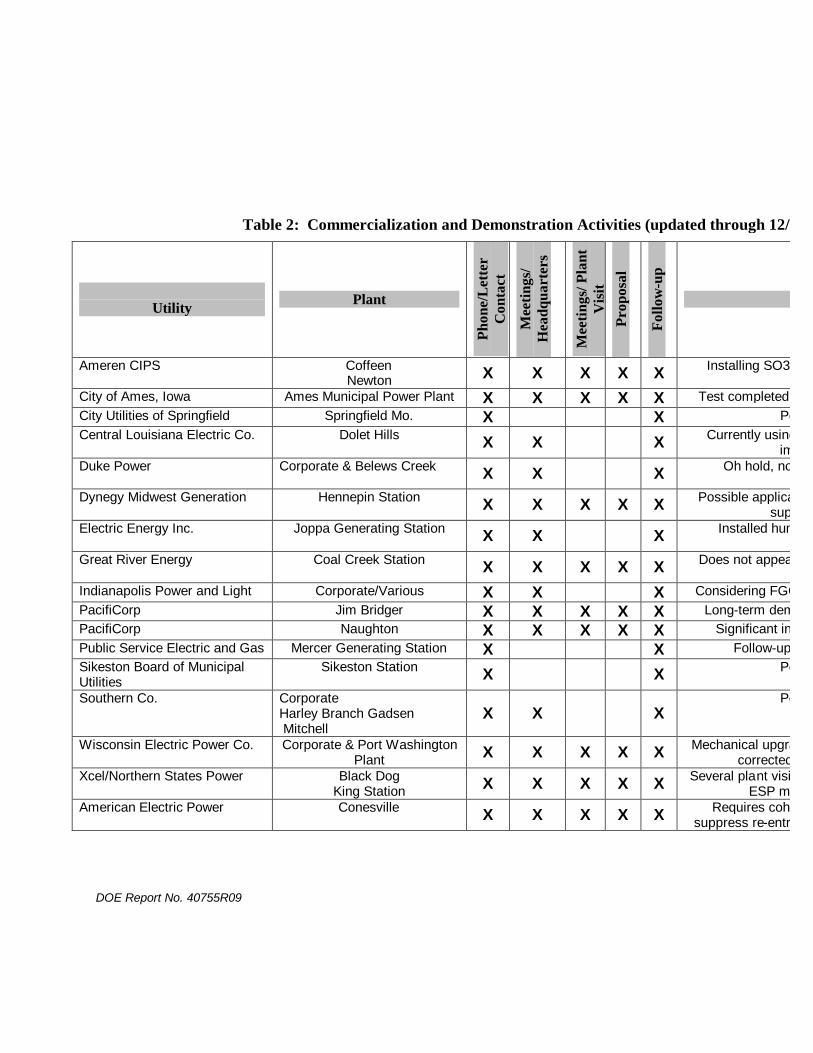
CONCLUSION Work began on Cooperative Agreement No. DE-FC26-00NT40755 in February 2000. Initial activities included holding a project kickoff meeting and various planning and administrative tasks. Development of laboratory instrumentation to support the project’s objectives was the next task. This included adoption and further development of a lab-scale method to measure the tensile strength of uncompacted fly ash. This method and apparatus (electrostatic tensiometer) had been previously developed and patented by Southern Research Institute. Permission to build and operate the electrostatic tensiometer was obtained from SRI. A comprehensive laboratory-screening program for potential new flue gas conditioning agents was completed on schedule in the first year of the project. In parallel with the lab-scale additive development work, commercialization and technology transfer activities have been on going since the program commenced. A number of potential industry partners have been contacted regarding program participation and full proposals with presentations have been prepared for seven sites thus far. Results of this effort to date include:
? ? A short-term FGC test program was run at the City of Ames, Iowa Municipal Power Plant on a 30 MW coal-fired unit with RDF co-firing. Tests confirmed effective resistivity control with the ADA-43 additive formulation developed on the project. Cohesivity effects were inconclusive due to a very aggressive rapping schedule on this ESP and non-uniform fuel feed and composition.
? ? A long-term demonstration is being conducted at Jim Bridger Power Plant, Units 1 and 2. Performance of the additive has been successful but problems with injection have so far precluded long-term acceptance.
? ? A full-scale test will be completed in 2002 at AEP Conesville Unit 3. Table 2 presents an updated summary of all commercialization and technology transfer activities on the project.
DOE Report No. 40755R09 Page 12
REFERENCES 1. ASTM C618, “Standard Specification for Fly Ash and Raw or Calcined Natural Pozzolan
for Use as a Mineral Admixture in Portland Cement Concrete”, American Society for Testing Materials.
2. “Advanced Flue Gas Conditioning as a Retrofit Upgrade to Enhance PM Collection from Coal-fired Electric Utility Boilers”, Quarterly Technical Reports, Reporting Periods: Feb. – March 2000, April – June, 2000, July – Sept. 2001, Oct. – Dec. 2001. DOE NETL Contract No. DE-FC26-00NT40755.

DOE Report No. 40755R09 Page 13
LIST OF ACRONYMS AND ABBREVIATIONS ALR – Air-To-Liquid Ratio
ASTM – American Society of Testing and Materials
CEM – Continuous Emission Monitor
DCS – Data Collection System
DOE – U.S. Department of Energy
ESP – Electrostatic Precipitator
FGC – Flue gas conditioning for particulate control
KV – Kilovolt
KW – Kilowatt
LOI – Loss on Ignition
MA – Milliamp
MW – Megawatt
NETL – National Energy Technology Laboratory
PM – Particulate matter
RDF – Refuse Derived Fuel
SCA – Specific Collection Area, ft2/1000 acfm flue gas flow
SRI – Southern Research Institute
DOE Report No. 40755R09
Table 2: Commercialization and Demonstration Activities (updated through 12/01)
Utility Plant
Phon
e/L
ette
r C
onta
ct
Mee
tings
/ H
eadq
uart
ers
Mee
tings
/ Pla
nt
Vis
it Pr
opos
al
Follo
w-u
p
Ameren CIPS Coffeen Newton X X X X X Installing SO3 conditioning, no immediate
City of Ames, Iowa Ames Municipal Power Plant X X X X X Test completed, additional chemical ordered City Utilities of Springfield Springfield Mo. X X Possible interestCentral Louisiana Electric Co. Dolet Hills
X X X Currently using ammonia conditioning, no immediate need.
Duke Power
Corporate & Belews Creek X X X Oh hold, no immediate applications.
Dynegy Midwest Generation Hennepin Station X X X X X Possible application as combined FGC or as supplement to SO3.
Electric Energy Inc. Joppa Generating Station X X X Installed humidification, no immediate
Great River Energy Coal Creek Station X X X X X Does not appear that FGC wi
Indianapolis Power and Light Corporate/Various X X X Considering FGC, no immediate applications.PacifiCorp Jim Bridger X X X X X Long-term demonstration on Units 1 and 2PacifiCorp Naughton X X X X X Significant interest,Public Service Electric and Gas Mercer Generating Station X X Follow-up and site visit required.Sikeston Board of Municipal Utilities
Sikeston Station X X Possible interest
Southern Co.
Corporate Harley Branch Gadsen Mitchell
X X X Possible interest
Wisconsin Electric Power Co. Corporate & Port Washington Plant X X X X X Mechanical upgrades and rapping optimization
corrected immediate problems.Xcel/Northern States Power Black Dog
King Station X X X X X Several plant visits, pending outcome of staged ESP mechanical upgrades.
American Electric Power Conesville X X X X X Requires cohesivitysuppress re-entrainment; long
DOE Report No. 40755R09 Appendix A – Page 1
APPENDIX A
SAMPLE SCOPE OF WORK

DOE Report No. 40755R09 Appendix A – Page 2
DOE Flue Gas Conditioning Demonstration AEP Conesville Unit 3
Draft Work Scope Document
Prepared for: American Electric Power
Prepared by: ADA-ES 8100 SouthPark Way Unit B-2 Littleton, CO 80120 (303)734-1727
February 28, 2002
DOE Report No. 40755R09 Appendix A – Page 3
INTRODUCTION The Department of Energy National Energy Technology Laboratory (DOE NETL) and ADA Environmental Solutions (ADA-ES) are collaborating on a project to develop advanced commercial flue gas conditioning additives. The objective is to develop conditioning agents that can help improve fine particulate control performance of electrostatic precipitators (ESP) on utility coal-fired boilers. The new chemicals will be used to control the adhesion or cohesivity of the fly ash. Small ESPs and those operating at high face velocities can have high reentrainment emissions, from rapping and flue gas scouring. Some of these ESPs, such as AEP Conesville Unit 3, operate on higher sulfur coals and/or with high unburned carbon in the collected flyash. Such units have difficulty meeting particulate and opacity emission standards due to reentrainment of collected flyash. Reentrainment is exacerbated by low particulate electrical resistivity and low ash tensile strength due to the unburned carbon. With improved cohesivity, the collected flyash will form a more stable layer on the plates and fall into the collection hoppers in sheets when rapped rather than reentrained out the stack. The existing commercial cohesivity additive is ammonia which combines with native or injected SO3 to form ammonium bisulfate, a sticky, cohesive reaction product. Safety issues with ammonia are limiting its use. There is a need to provide cost-effective and safer alternatives to traditional dual agent flue gas conditioning with SO3 and ammonia. Under this program, a long-term demonstration of the developed chemical additives is required in order to promote commercial acceptance. Accordingly, a joint cost-sharing arrangement between DOE NETL, ADA-ES, and AEP, is proposed to demonstrate the chemical additives at the Conesville Power Plant. The project will provide approximately 2 months operational data. This document explains the Installation Scope of Work and describes the test program envisioned.

DOE Report No. 40755R09 Appendix A – Page 4
TEST DESCRIPTION The application of flue gas conditioning additives for cohesivity modification is site-specific and requires careful attention to the fuel characteristics, load profile, and the frequency of opacity excursions. At AEP Conesville, the main problem is with unit derates associated with opacity spiking at full load. It will be important to determine a dosage range that will minimally increase the layer tensile strength, reduce plate scouring effects and enhance rapping of large sheet ash structures and particulate agglomerates. These rapped agglomerates and ash sheets will reach the collection hoppers with minimal boil up and secondary reentrainment.
For each additive, up to a two-week test period is envisioned. Data will be taken for a baseline with no conditioning and then chemical will be applied beginning at a very low additive-to ash (ATA) weight ratio. The conditioning rate will be increased in small steps until indications of opacity variability and spiking begin to decrease at the problematic load conditions. Once some effects are observed, then the rate of injection will be optimized for full-load operation without opacity excursions (if this can be achieved). It may prove possible to use chemical only intermittently during difficult periods.
Upon completion of the trial for each additive, the best performing conditioner will be further applied for approximately two more weeks to gain more operating experience under different conditions. The entire demonstration period is estimated at approximately two months. A detailed test plan will be developed by ADA-ES with input from AEP prior to start of the trial. Table 1 summarizes the process data that will be monitored and used to evaluate additive performance.

DOE Report No. 40755R09 Appendix A – Page 5
Table 1: Preliminary Test Matrix
Parameters Sampling Method Data Frequency
Unit Load (gross MW) Plant DCS As available.
Coal Analysis Plant coal data, as available Daily
Fuel Firing Rate Plant DCS Hourly
Air Heater outlet flue gas temperature
Plant DCS
ESP electrical (Secondary Kv, Secondary Ma, Kw, Spark Rate each field, overall)
As available from ESP logging computer.
Hourly average or more frequent if available.
Injection System (Chem. Rate, Liquid Rate, Air Pressure)
Manual log or PLC data acquisition
Hourly
Opacity Unit 3 Stack Opacity Monitor (or temporary monitor installed at outlet duct if necessary)
1 minute data preferred
Flyash ESP hoppers, composite sample.
Several samples for each additive.
Lance Inspection Visual inspection, frequency to be determined. Manual log.
As necessary primarily at start of program. Also during routine maintenance inspections.
Injection System Operation
Visual inspection and on-board skid data log.
Six minute logged data. Also routine operational checks.
Deposition probes at ESP inlet
Visual inspection, Daily or more frequently as necessary

DOE Report No. 40755R09 Appendix A – Page 6
ADA-ES SCOPE Equipment to be leased from ADA Environmental Solutions (ADA-ES):
1. Additive injection skid (to be located in the compressor building between units 2 & 3): ? ? Skid comes complete with chemical metering pump, dilution water pump, valves,
flow meters, filters, step down transformer, power distribution panel, local digital controls and remote telemetry.
? ? Approximate weight: 900 lbs.
2. Chemical distribution manifolds (location near injection point TBD): ? ? One manifold/duct. ? ? Each manifold serves up to eight lances. ? ? Includes flowmeters valves and gauges. ? ? SS tubing to each lance. ? ? Air hose to each lance.
3. Chemical transport hoses:
? ? Chemical hoses (1 1/2" ID) connecting the storage tank to the injection skid, and connecting the injection skid to the injection manifolds on the ducts. 400 ft will be provided.
4. Injection lances:
? ? Injection lance assemblies (# TBD), each with multiple dual fluid atomizing nozzles.
5. Atomizing air control station(s) (to be located upstream of compressed air manifold): ? ? Duplex or tri-plex coalescing filter. ? ? Pressure regulator.
6. Atomizing Air Manifold and hoses
7. Shield air blower(s) (location near injection lances TBD): ? ? 25 hp. ? ? 3500 acfm @ 30" H20 Approximate weight: 500 lbs. ? ? Silencer. Butterfly valve. ? ? Inlet screen. ? ? Motor starter panel.
8. Shield air manifold(s) and distribution hoses to each lance.
DOE Report No. 40755R09 Appendix A – Page 7
Flue Gas Conditioning Chemicals ADA-ES will provide up to 3 chemical blends for the test program. Chemicals will be delivered in transportable totes or liquibins with storage capacities ranging from 250 to 300 gallons each. On-site chemical inventories shall be limited to 1200 gallons at any given time. ADA-ES will provide the following Installation, operation and testing services during the demonstration: ADA-ES will provide four people for approximately two weeks to install the ADA-ES process equipment. ADA-ES will provide technical interface to assist AEP with its installation activities (described herein). This will include one trip to the site. At least one ADA-ES representative will be on-site during day shift for all parametric testing and the long-term tests.
The ADA-ES injection system is designed to run unattended. The skid is equipped with data logging and remote telemetry. This will allow ADA-ES’ on site representative to monitor operation from the hotel, as well as engineers in Denver to assist in the data analysis. ADA-ES will provide the following documentation: 1. MSDS. 2. Drawing package:
? ? System flow diagram. ? ? System electrical one-line. ? ? Skid P&I diagram. ? ? Chemical distribution manifold mechanical drawing. ? ? Compressed air manifold drawing. ? ? Atomizing air control station mechanical drawing. ? ? Shield air system mechanical drawing. ? ? Injection lance assembly drawings.
3. O&M Manual(s).
DOE Report No. 40755R09 Appendix A – Page 8
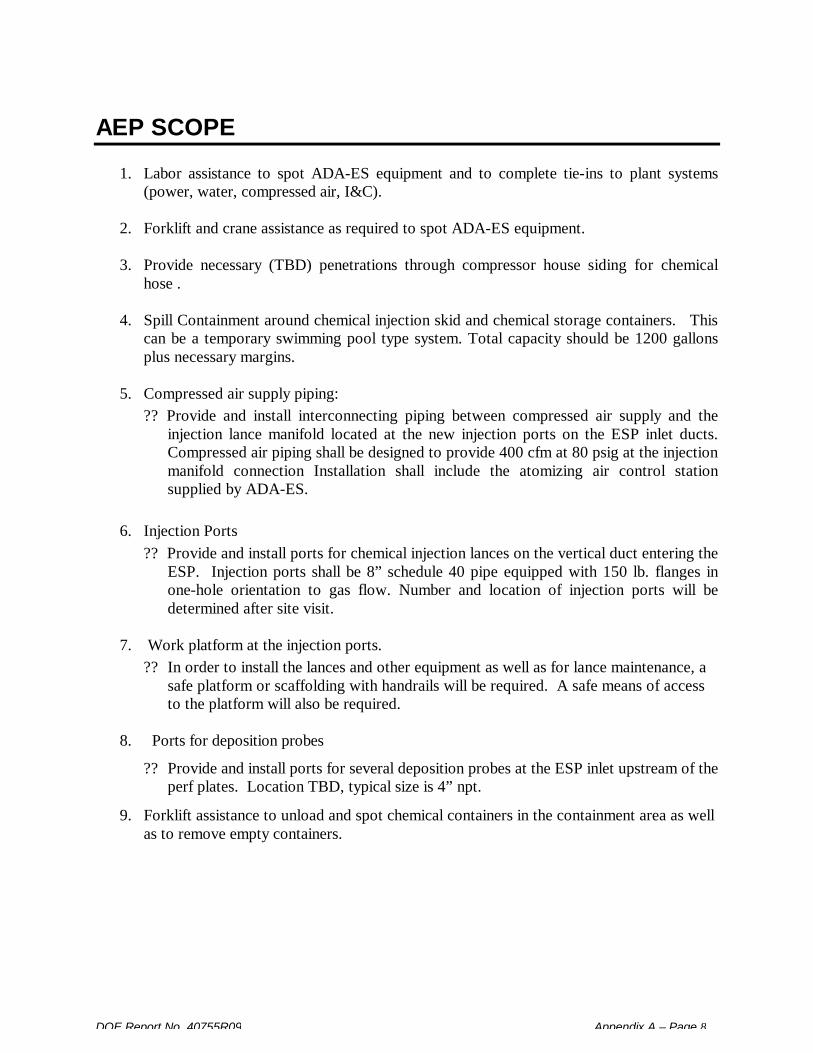
AEP SCOPE
1. Labor assistance to spot ADA-ES equipment and to complete tie-ins to plant systems (power, water, compressed air, I&C).
2. Forklift and crane assistance as required to spot ADA-ES equipment.
3. Provide necessary (TBD) penetrations through compressor house siding for chemical
hose .
4. Spill Containment around chemical injection skid and chemical storage containers. This can be a temporary swimming pool type system. Total capacity should be 1200 gallons plus necessary margins.
5. Compressed air supply piping:
? ? Provide and install interconnecting piping between compressed air supply and the injection lance manifold located at the new injection ports on the ESP inlet ducts. Compressed air piping shall be designed to provide 400 cfm at 80 psig at the injection manifold connection Installation shall include the atomizing air control station supplied by ADA-ES.
6. Injection Ports
? ? Provide and install ports for chemical injection lances on the vertical duct entering the ESP. Injection ports shall be 8” schedule 40 pipe equipped with 150 lb. flanges in one-hole orientation to gas flow. Number and location of injection ports will be determined after site visit.
7. Work platform at the injection ports.
? ? In order to install the lances and other equipment as well as for lance maintenance, a safe platform or scaffolding with handrails will be required. A safe means of access to the platform will also be required.
8. Ports for deposition probes
? ? Provide and install ports for several deposition probes at the ESP inlet upstream of the perf plates. Location TBD, typical size is 4” npt.
9. Forklift assistance to unload and spot chemical containers in the containment area as well as to remove empty containers.

DOE Report No. 40755R09 Appendix A – Page 9
10. Injection lance maintenance/cleaning.
? ? ADA-ES will inspect lances and clean as necessary during the two month demonstration and until all start-up related problems have been resolved. This includes identifying and resolving problems that normally occur at start-up when the lances are first operated in a hot dirty gas stream (leaking nozzles or lance alignment problems resulting from fabrication). If AEP decides to continue flue gas conditioning operation after the demonstration period, maintenance of the injection lances will then be turned over to AEP. Due to the hot and dusty environment, the lances will require a relatively small amount of preventive maintenance. The recommended schedule is to inspect and clean lances every two weeks (two persons, two-four hours) to ensure good operation and performance. ADA-ES will provide one lot of spare nozzle parts.
11. System Operation
? ? ADA-ES will be responsible for daytime system operation & maintenance during the two month demonstration. The system is designed to operate unattended. AEP will be responsible for monitoring system operation once / shift during evenings and nights. ). If AEP decides to continue flue gas conditioning operation after the demonstration period, AEP will be responsible for daily operation.
Utility Requirements: 1. Electric Power:
? ? Skid: 48OV, three phase, 20 amps. ? ? Shield blower: 48OV, three phase, 60 amps (<30 amps running).
2. Water:
? ? Dilution water (filtered station service water) to skid: 20 gpm max, 30 psig uninterrupted.
3. Compressed Air:
? ? Atomizing air at injection manifold (injection port location): 400 scfm*, 80 psig, uninterrupted.
*estimate to be verified after site visit
DOE Report No. 40755R09 Appendix A – Page 10
4. I&C:
? ? Boiler load signal. A signal indicating boiler load (or main steam flow), 4-20 mA, connected to injection skid.
? ? Opacity signal. A signal indicating opacity, 4-20 mA, connected to injection skid.
? ? Telephone line. A standard dedicated phone line run to the injection skid for remote monitoring and data transfer.
? ? Signal wiring from skid to control room.
DOE Report No. 40755R09 Appendix A – Page 11
SCHEDULE/MILESTONES* The drawing package will be submitted to AEP 3 weeks after contract is finalized. The ADA-ES process equipment will be delivered to Conesville 12 weeks after contract is finalized. Some items such as the chemical hose will be delivered earlier. Site work by AEP to prepare for the installation of ADA-ES equipment should be completed prior to equipment delivery. Barring unforeseen difficulties, the system should be ready for operation 15 weeks after contract is finalized. *Estimates: May change after Site visit
COSTS The AEP cost share for the two month DOE Flue Gas Conditioning Demonstration is $40,000 not including the AEP scope items described herein.


![diagram 5.1 [Converted] - Building Control NI · part of the flue serving an open-flued appliance. flue soot door debris collection space chimney appliance flue outlet appliance flue](https://static.fdocuments.in/doc/165x107/60ea4a68722f9641f22c1939/diagram-51-converted-building-control-ni-part-of-the-flue-serving-an-open-flued.jpg)


