Advanced Conference on Seismic Risk Mitigation...
20
2142-15 Advanced Conference on Seismic Risk Mitigation and Sustainable Development Kojiro Irikura 10 - 14 May 2010 Kyoto University Disaster Prevention Research Institute Kyoto Japan Advanced Methods of Predicting Strong Ground Motions from Crustal Earthquake Scenarios - Application to Design Basis Ground Motion for Seismic Safety of Nuclear Power Plant-
Transcript of Advanced Conference on Seismic Risk Mitigation...
2142-15
Advanced Conference on Seismic Risk Mitigation and Sustainable Development
Kojiro Irikura
10 - 14 May 2010
Kyoto University Disaster Prevention Research Institute
Kyoto Japan
Advanced Methods of Predicting Strong Ground Motions from Crustal Earthquake Scenarios - Application to Design Basis
Ground Motion for Seismic Safety of Nuclear Power Plant-

Advanced Methods of Predicting Strong Ground Motions
from Crustal Earthquake Scenarios - Application to Design Basis
Ground Motion for Seismic Safety of Nuclear Power Plant-
Irikura K.(1), Kurahashi S.(2)
(1) Professor, Aichi Institute of Technology, 1247 Yachigusa, Yakusa-cho, Toyota, Aichi 470-0392, Japan, [email protected]
(2) Post-doctoral Fellow, ditto, [email protected]
Abstract
From recent developments of the waveform inversion analyses for rupture process us-
ing strong motion data during large earthquakes, we have understood that strong
ground motions are related to slip heterogeneity inside source rather than average slip
in the entire rupture area. Asperities are characterized as regions that have a large slip
relative to the average slip on the rupture area, based on heterogeneous slip distribu-
tions that are estimated by the waveform inversion. We proposed a recipe for predict-
ing strong ground motions from specific earthquakes based on the characterized
source model. Verification and applicability have been examined by comparing ob-
served ground motions with synthesized ones using the “recipe” for recent disastrous
earthquakes. In this paper, first we describe the verification results for the 2007 Noto-
oki earthquake. Then we apply it to simulating ground motions for the 2007 Niigata-
ken Chuetsu-oki earthquake, which it happened very close to the Kasiwazaki-Kariwa
Nuclear Power Plant. The active faults caused to the earthquake have not been speci-
fied for the aseismic design of the plant. Ground motions from the earthquake are
found to be predictable as long as the source fault is specified through investigation of
active folds and faults. Further studies are discussed to make more reliable evaluation
of ground motions for earthquake safety designs.
Key-words: strong ground motion, prediction, recipe, active fault, asperity
Introduction
Importance of strong motion prediction has been widely recognized for promoting earthquake-counter
measures as one of the lessons from the 1995 Kobe earthquake in Japan, The Headquarter of Earth-
quake Research Promotion established just after the Great Earthquake Disaster have developed “Na-
tional Seismic Hazard Maps” (Earthquake Research Committee 2005). It should be more precisely
called to be “Maps of Strong Motion Prediction in Japan”. The maps show results of prediction of
strong ground motions from two different approaches, probabilistic and deterministic, integrating sur-
vey of active faults, long-term evaluation for earthquake activities, and evaluation of strong ground mo-
tion. The probabilistic hazard maps show the probability of ground motion larger than a certain level of
seismic intensity, occurring within 30 years from the present. On the other hand, the deterministic ha-
zard maps show the ground motions (waveforms, response spectra, PGA, PGV, seismic intensity etc.)
from earthquakes caused to specific active faults, based on fault models obtained from active fault sur-
veys, historical earthquake records, and so on.
One of the problems with the probabilistic maps is that recent disastrous earthquakes have occurred in
regions where probability of ground motions is relatively small, for example, the 2000 Tottori-ken Sei-
bu earthquake (Mw 6.6-6.7), the 2004 Chuetsu earthquake (Mw 6.6), the 2005 Fukuoka-ken Seiho-oki
The ICTP Advanced Conference on "Seismic Risk Mitigation and Sustainable Development" 10-14 May 2010, Trieste, Italy

earthquake (Mw 6.6), the 2007 Noto-hanto earthquake (6.6-6.7), the 2007 Chuetsu-oki earthquake (6.6)
and the 2008 Iwate-Miyagi-Nairiku earthquake (Mw 6.8). Therefore, the maps by themselves are not
always responsible for people who expect seismologists and earthquake engineers to reduce earthquake
damage for future large earthquakes. These earthquakes are caused to inland and offshore active folds
and faults. A reason is that high shaking areas in probabilistic sense are related to mainly subduction
earthquakes, because the probability of earthquake occurrence on the inland active folds and faults are
one to two order smaller than the subduction earthquakes.
This shows that the prediction of strong ground motions from inland crustal earthquake caused to active
folds and faults are required to make countermeasures for future inland earthquakes using deterministic
approach, even if the probability of shaking is not so high.
The procedures of fault modeling for the prediction of strong ground motion are proposed as a “recipe”
combining the active fault information with scaling relations of fault parameters from the waveform
inversion of source processes using strong ground motions. We have examined the validity of the earth-
quake sources constructed by our recipe by comparing simulated and observed ground motions from
recent inland crustal earthquakes, such as the 1995 Kobe earthquake, 2005 Fukuoka earthquake, the
2007 Noto-hanto earthquake and so on (Irikura and Miyake, 2010). Using the „recipe‟ for future large
earthquakes, we can provide earthquake engineers, emergency response personnel and other govern-
ment and private officials with ground motion estimates that will allow them to take the appropriate
action.
This technique is introduced to the “Regulatory Guide for Aseismic Design of Nuclear Power Reactor
Facilities” revised in 2006 by the Nuclear Safety Commission of Japan (NSCJ, 2006).
The 2007 Niigata-ken Chuetsu-oki happened very close to the Kasiwazaki-Kariwa Nuclear Power Plant
that has the largest electric output in the world. Fortunately, no severe problems have been confirmed
with regard to the safety of the nuclear reactors as four of the plant‟s seven reactors running at the time
of the earthquake were all shut down automatically by a safety mechanism according to the reports by
the International Atomic Energy Agency (IAEA, 2007) as well as the Nuclear and Industrial Safety
Agency in Japan (NISAJ, 2007).
There was recorded ground acceleration of 680 gals on the base mat of Unit No.1 reactor, 2.5 times
more than the ground motion levels for aseismic design of facilities. The active faults caused to the
earthquake have not been specified in evaluating input ground motions for the aseismic design. We need
to make careful examinations why the active faults have been missed and how the ground motions have
been underestimated.
In this report, we outline strong motion prediction based on the “recipe” and verification of the recipe
for recent disastrous earthquakes, in particular simulations of the 2007 Chuetsu-oki earthquake. Strong Motion Prediction Based on the “RECIPE”
The framework of strong motion prediction for crustal earthquake scenarios is shown in Fig. 1. The
strong ground motions from a scenario earthquake are evaluated based on comprehensive information
about (1) monitoring of seismic activity and field surveys of active faults around the target areas, (2)
observation of strong ground motions, and (3) exploration of velocity structures in targeted areas. There
are two important factors for predicting strong ground motion: one is source modeling for each earth-
quake scenario and the second is estimation of the Green's functions from source to site. Source models
for specific earthquakes are derived from analysis of (1) and (2); the Green‟s functions are estimated
using analysis of (2) and (3). Then, ground motions are predicted using the source models and the
Green‟s functions. The validity of the results is determined by comparing the historical data with pre-
dicted motions.
Strong motions for large earthquakes are simulated, based on characterized source models defined by three kinds of parameters, outer, inner, and extra fault parameters. Those fault parameters are given by
the “recipe” of strong motion prediction as shown in e.g. Irikura (2007) and Irikura and Miyake (2010).

The source model is constructed by the following procedure. First, the outer fault parameters are given
as follows. Step 1: Fault Length (L) is given from geo-morphological and geological survey of active
faults (Fig. 2), Fault Width (W) is estimated from of thickness of seismogenic zone and dip angle of the
faults (3), and then Total Rupture Area (S = LW) is evaluated. Step 2: Total Seismic Moment (M0) is
given from the empirical scaling relation (Fig. 4), M0 versus S (Irikura and Miyake, 2001). Step 3: Av-
erage Stress Drop ( c ) on the source fault is estimated
2/32/37
16
0S
cM
(1)
from the theoretical equation for circular crack model by Eshelby (1957) for aspect ratio L/W less than
2,
L
LWM c
2
max
0 (2)
from the equation derived by Fujii and Matsu‟ura (2000) for aspect ratio more than 2. For the two con-
stantsinequation (2) are assumed 2104.1 and 0.1 .
Next, the inner fault parameters are given to characterize stress heterogeneity inside the fault area. Step
4: Combined Area of Asperities (Sa) is estimated from an empirical relationship between the rupture
area S as the outer fault parameter and the combined area of the asperities Sa,as the inner fault parameter
as shown in Fig. 5 (Irikura and Miyake, 2001). The combined area of asperities clearly increases with
the seismic moment for both inland and subduction earthquakes. The ratio Sa /S seems to be constant
regardless of the rupture area with a value of about 0.22 for an inland earthquake. The stress drop on the
asperities ais derived by multiplying the average stress drop over the fault c by the ratio of the
total rupture area S to the asperity area Sa (e.g., Madariaga, 1979).
a
caS
S
(3)
Another empirical-relationship related to the inner source parameters is shown in Fig. 6. The relation-
ship between the seismic moment M0 and the amplitude of the acceleration source spectral level A0 was
originally found by Dan et al. (2001) and later confirmed by others (Morikawa and Fujiwara, 2003; Sa-
toh, 2004).
3/17
0
102
0 )10(Nm)(1046.2)(Nm/s MAa (4)
The acceleration level A0 was theoretically related to the combined asperity areas and the stress drop in
the asperities for a circular asperity by MADARIAGA (1977).
aar
a SvA 40 (5)
The combined area of the asperities can be estimated as follows.
20
20
22
)(
)(
4
7aRa
AS
MvS
(6)
Step 5: Stress Drop on Asperities ( a ) is derived as a product of c as the outer fault parameter and
Sa /S (Madariaga, 1979) from Step 4. Step 6: Number of Asperities (N) is related to the segmentation of
the active faults, e.g. two per a segment. Step 7: Average Slip on Asperities (Da) is given as D0.2
based on the empirical relationship by Somerville et al. (1999). Step 8: Effective Stress on Asperity
is considered to be identical to stress drop on asperity . Effective stress of background slip

areas () is given to coincide with the average stress drop ( c ) over the entire rupture area. Step 9:
Parameterization of Slip-Velocity Time Functions is given to be the Kostrov-like slip-velocity time
functions as a function of peak slip-velocity and rise time based on the results of dynamic simulation by
Day (1982). The peak slip-velocity is given as a function of effective stress, rupture velocity and fmax.
Finally, the extra fault parameters are the rupture starting point and rupture velocity to characterize the
rupture propagating pattern in the fault plane. For inland crustal earthquakes, rupture nucleation and
termination are related to geomorphology of active faults (e.g., Nakata et al. 1998).
This “recipe” has been applying to deterministic seismic-hazard maps for specified seismic source faults
with high probability of occurrence potential in the National Seismic Hazard Maps for Japan (2005).
The availability of the “recipe” has been tested in each application by the comparison between PGV‟s of
the synthesized motions and those derived from empirical attenuation relationship by Si and Midorika-
wa (1999). More detailed examination for strong motion prediction should be made, comparing simu-
lated ground motions with observed ones for recent disastrous earthquakes.
Verification of the “Recipe” for Recent Disastrous Earthquakes We introduce two examples, one is the 2007 Noto Hanto earthquake and the other is the 2007 Niigata-
ken Chuetsu-oki earthquake.
The 2007 Noto-Hanto earthquake (Mw=6.7) This earthquake occurred west off the Noto peninsula, Japan, on March 25, 2007. Strong ground mo-
tions with the JMA seismic intensity of 6-upper struck Wajima, Anamizu, and Nanao in the northern
part of the Noto peninsula. The PGA‟s of this earthquake with shortest fault distance seem to be a little
larger than the empirical attenuation-distance relationships by Si and Midorikawa (1999) as shown in
Fig. 8.
The source slip model of the 2005 Noto Hanto earthquake was determined from the inversion of strong
ground motion records by Horikawa (2007) as shown in the upper left of Fig. 9. His result is not always
available for strong motion simulation because the inversion is done using only long-period motions
more than 1 sec. The characterized source model with asperities inside the rupture area is needed to si-
mulate broadband motions including short-period motions less than 1 sec. for accurate estimation of
seismic intensity interest. The asperities are defined as rectangular regions where the slip exceeds in the
same specified manner as Somerville et al. (1999) as shown a red rectangle in the upper left of Fig. 9.
For comparison, we made a source model by forward modeling, comparing between the observed
records and synthesized motions based on the characterized source model using the empirical Green‟s
function method. The best-fit source model consists of two asperities with different size shown in Fig.
10. A large one is located just above the hypocenter with an area of 6.3 x 6.3 km2 and stress drop of
about 26 MPa. A smaller one is located north-east of the large one with an area of 3.6 x 3.6 km2 and
stress drop of about 10 MPa. The stress drop of the larger asperity is about two times higher than aver-
age values of inland crustal earthquakes so far estimated.
Next, we made a source model following the “recipe” as shown in the lower right of Fig. 9, where the
asperity area and stress parameters are estimated from the acceleration source spectral-level of observed
data. The stress drop of the asperity estimated from the waveform inversion is almost the same as those
from the recipe. However, one of the asperities by the forward modeling has a little larger stress drop
(ASP1:26MPa) than the empirical ones. This result is consistent with lager acceleration than the empiri-
cal attenuation distance relation in Fig. 9. Observed motions at ISK001 and ISK003 are compared with
synthesized motions for those three source models in Fig. 10. The synthesized waveforms for any mod-
els almost agree with the observed ones. Of course, the forward modeling gave the synthesized motions
best-fit to the observed. The 2007 Niigata-ken Chuetsu-oki (NCO) earthquake (Mw 6.6)
This earthquake occured on July 15, 2007 at the Niigataken Chuetsu-oki, offshore north of the Niigata-
prefecture at a depth of about 17 kilometers. In the Niigata prefecture and Nagano prefecture, strong
ground motions were observed as the largest intensity 6 upper. The source mechanism of this earth-

quake is supposed to be a reverse fault with the SW-NE strike and SE dip from the aftershock distribu-
tion re-determined using the OBS seismometers (ERI, Univ. of Tokyo 2008) as shown in Fig. 11. The
PGA attenuation-distance relationships in Fig. 12 generally follow the empirical relations in Japan ob-
tained by Si and Midorikawa (1999) except the KKNPP. The strong ground motions in the site of the
KKNPP had markedly large accelerations more than those expected from the empirical relations. The
surface motions there had the PGA of more than 1200 gals and even underground motions on one of the
base-mats of the reactors locating five stories below the ground had the PGS of 680 gals. The observed
records near the source area show a marked feature with three distinctive pulses in Fig. 13.
Rupture processes of this earthquake have been done by many authors using strong motion data. An
example is shown in Fig, 14 (Horikawa, 2007). The slip distributions common in most of the inversion
results show three asperities which generate three distinct pulses clearly seen in the observed records.
However, locations of those three asperities are different each other in the source processes inverted by
many authors, although almost the same data of strong ground motions were used in the analysis. The
main reason why the inverted results are different is that velocity structures are too complex to assume
equivalent flat-layers-structure model in calculating the Green‟s functions for the inversion analysis.
We attempt to simulate strong ground motions during the 2007 Niigata-ken Chuetsu-oki (NCO) earth-
quake based on the characterized source model. The locations of asperities are estimated by picking up
the time differences between those pulses from observed records as shown in Fig.13. We find that three
asperities are located south-west and south of the hypocenter in Fig. 15. In this study, we called those
asperities to be ASP1, ASP2 and ASP3. We chose appropriate records of aftershocks as the empirical
Green‟s function, taking into account locations and fault mechanisms of the aftershocks. As a result, we
adopted the record of Aftershock 1 (Mw 4.4) on July 16 at 21:08 for ASP 1 and ASP2, and Aftershock 2
(Mw 3.4) on August 4 at 0:16 for ASP3. We obtained the best-fit model by forward modeling to minim-
ize the residuals between the observed and synthesized. The areas of three asperities were about 30 km2
and stress drop were 20 – 24 MPa. The synthesized motions at KKZ1R2, KKZ5R2, NIG005 and NIG018 are compared with the observed
ones in Fig. 17. The synthesized waveforms agree with the observed ones fairly well. In particular, three
pulses appearing in the observed records at KKZ1R2 and KKZ5R2 located at B5F in underground of
Unit 1 and Unit 5, respectively, are well reproduced in the synthesized velocity and displacement.
It might be likely from the viewpoint of source physics that the starting point of the ASP3 in Fig.15 is
not at the edge but near the center. We find that the best-fit source model for simulating strong ground
motions is available putting the starting at the upper boundary of the ASP3 as long as the propagation
times from the asperity to the site are calculated with the 3-D velocity structures.
Re-evaluation of seismic safety for the Kashiwazaki-Kariwa nulclear power plant
The two earthquakes, 2007 Noto-hanto and 2007 Chuetsu-oki (NCO) earthquakes happened very close
to the Nuclear Power Plants. The ground motions at the base mats of two reactors at the Shiga Nuclear
Power Plant during the 2007 Noto-hanto earthquake were a little bit larger than the design spectral le-
vels at long periods, although the facilities also have no damage. At the Kashiwazaki-Kariwa Nuclear
Plant all of seven reactors were struck by strong ground motions exceeding the levels accounted for in
the aseismic design of the plants. In particular, observed acceleration at the base mat of Unit 1 from the
NCO earthquake was 680 gals, 2.5 times as large as the design level. Although the levels of the seismic
inputs in the design of the plant were exceeded during the earthquake, "there is no visible significant
damage because of the conservatisms introduced at different stages of the design process” as the IAEE
report says. They also indicated that “a re-evaluation of the seismic safety for Kashiwazaki-Kariwa
plant needs to be done taking account of the lessons learned from the NCO earthquake and using up-
dated criteria and methods (IAEA, 2008).” The re-evaluation of the seismic safety should also be done
for all of other nuclear power plants in Japan.
The flow of re-evaluating seismic safety of nuclear facilities as back-check based on the new regulatory
guide is shown in Fig. 18. First of all, comprehensive investigation of active faults in a target area sur-

rounding the site, combining geomorphologic, geologic and geophysical surveys have been done not to
miss any causative source faults. Next, advanced evaluation of the design basis ground motions
(DGBM) Ss has been done by both methods, empirical response spectra and fault modeling. Further,
seismic safety of important facilities and important components and piping are evaluated against the
DGBM.
Concerning to the active fault surveys, there were found eight active faults and folds to be influential to
the Kashiwazaki-Kariwa plant, three inland and five offshore. The largest contributions of those active
faults and folds to the ground motions at the plant are from the F-B folds-band (No. 6 in Fig. 19) and
from the the Nagaoka-Plain-Western-Rim fault zone connected with three faults, the Kakuta-Yahiko
fault (No.1 in Fig.19), the Kihinomiya fault (No. 2 in Fig.19), and the Katakai fault (No. 3 in Fig.19)
which are possibly activated together.
The DGBMs were evaluated from the F-B fault (FBF) earthquake with fault length of 36 km and the
Nagaoka-Plain-Western-Rim fault (NPWRF) earthquake with that of 91 km, respectively. The accelera-
tion time histories calculated using the fault models for the FBF earthquake and for the NPWRF earth-
quake are shown in Fig. 20 and Fig. 21, respectively. The fault parameters were basically given follow-
ing the “recipe”. The influence of uncertainties of the fault parameters on ground motions was examined,
as lessons learned from the analysis of observed records from the NCO earthquake. One of them is that
the stress parameters on the asperities are given to be 50 % higher than the “recipe”. The ground mo-
tions with the largest responses are adopted as Ss. The ground motions from the FBF earthquake have
short duration and high acceleration, while those from the NPWRF earthquake have long duration and
relatively low acceleration although the NPWRF earthquake has longer fault-length and larger magni-
tude. The reason is that the NPWRF is located to a little further than the FBF.
The response spectra of the DBGM are shown for Unit 1 and Unit 5 in Fig. 22. The Ss-1H and Ss-3H
were response spectra estimated from the empirical method for the FBF and the NPWRF, giving magni-
tude estimated from fault length and equivalent fault distance. The Ss-2 and the Ss-4 were calculated
from the fault models for the FBF and the NPWRF. The response spectra for Unit 1 are about two times
as large as those for Unit 5, reflecting the experiences of observed motions during the NCO earthquake.
The difference between the Unit 1and Unit 5 sides is due to the effect of shallow underground structures
to ground motions. The ground motion at the Unit 1 side was almost doubled due to the effects of the
fold structure in the shallow part immediately below the site (NISA, 2008).
The S2 is the DBGM at construction time evaluated based on the old regulatory guide established in
1981. At that time, there were not found any active faults near the plant. Ground motions from a pre-
sumed event with Mj 6.5 at 10 km deep are requested to even if no active faults are detected near sited
as a minimum requirement. Therefore, the main contributions to the S2 were short period motions from
a presumed 6.5 earthquake with Mj located at 10 km deep and long period motions from an active fault
earthquake with Mj 7.7 located at far distance of more than 100 km. The response spectra of ground
motions on the free surface of the base strata estimated from the observed records of the 2007 NCO
earthquake are shown by green lines. We find that the Ss were evaluated to be about two times as large
as the observed ones.
The peak values of the acceleration responses of the Ss are summarized in the bottom of Fig. 22. The
peak accelerations of the S2 were set to be 450 gals at the construction time. On the other hand, the Ss
increased the peak values of 2300 gals for Unit 1 side including Unit 1 to Unit 4 and those of 1209 gals
for Unit 5 side including Unit 5 to Unit 7. The peak values of the response accelerations at the base mats
for the Ss defined at the base strata are listed in upper of Fig. 23, compared with the observed values
during the NCO earthquake. It is interesting that differences between the base mats of the Units are
smaller than those at the base strata, because of the effects of the shallow underground structures men-
tioned above. The peak accelerations on the base mats of the Units are set to be 25 % to 100 % larger
than the observed ones. For example, the peak acceleration on the Unit 1 base-mat for the Ss is 845 gals,
about 25 % higher than the observed value 680 gals during the NCO earthquake.

This shows that the seismic safety of the plant are enhanced much more than before as the results of re-
evaluation of the seismic safety following the revision of the seismic safety regulatory guide in 2006
and the lessons learned from the 2007 Chuesu-oki earthquake.
Conclusions
Ground motions from earthquakes caused to specified source faults are evaluated using the “recipe”
proposed by the scaling relations of the outer and inner fault parameters. Ground motions from the 2007
Noto-hanto (Mw 6.7) and the Niigata-ken Chuetsu-oki (NCO) earthquake are well simulated with the
characterized source models based on the “recipe”, as long as the source fault are specified by geo-
morphological and geological surveys. Uncertainties of the fault parameters make variability of about
50 % in ground motion level. Design ground motions for seismic safety are possibly estimated as long
as fault modeling is appropriately made. To do that, outer and inner fault parameters should be esti-
mated based on surveys of active faults and underground structures in propagation-path. Methodology
for estimating design ground motions without specifying earthquake sources should be further improved
as one of the lessons learned from the 2007 Chuetsu-oki earthquake. Source modeling based on com-
prehensive analysis of active faults, active folds and tectonics should be established for seismic safety
design of nuclear facilities.
Acknowledgements
We appreciate National Research Institute for Earth Science and Disaster Prevention (NIED) for provid-
ing the K-NET, KiK-net and F-net data. We also thank to Tokyo Electric Power Company (TEPCO) for
providing strong ground motion data at the Kashiwazaki-Kariwa nuclear power plant. This study was
supported in part by funds from the Grant-in-Aid for Scientific Research (B)(20310106, 2008-2010)
from Ministry of Education, Culture, Sports, Science, and Technology.
References
Dan, K., Watanabe, T., Sato, T. and Ishii, T. (2001), “Short-period source spectra inferred from varia-
ble-slip rupture models and modeling of earthquake fault for strong motion prediction,” Journal of Struct. Constr. Engng. AIJ, 545, 51-62.
Day, S. M. (1982). Three-dimensional simulation of spontaneous rupture: the effect of nonuniform pre-
stress, Bull. Seism. Soc. Am., 88, 512-522.
Earthquake Research Committee (2005). Report: National Seismic Hazard Map for Japan (2005),
MEXT, http://www.jishin.go.jp/ main/ index-e.html .
Earthquake Research Institute, Univ. of Tokyo (2008). The aftershock distribution of 2007 Chuetsu-oki
earthquake re-determined using the OBS seismometers, Report published by Earthquake Research
Committee 2008, (in Japanese).
Eshelby, J. D. (1957). The determination of the elastic field of an ellipsoidal inclusion, and related prob-
lems, Proc. Roy Soc., A241, 376-396.
Fujii, Y. and Matsu'ura, M. (2000). Regional difference in scaling laws for large earthquakes and its
tectonic implication, PAGEOPH, 157, 2283-2302.
Horikawa, H. (2007). Source rupture process of 2007 Noto-Hanto Earthquake,
http://unit.aist.go.jp/actfault/katsudo/jishin/notohanto/hakaikatei2.htm. (in Japanese).
IAEA (2007). IAEA Mission Report : Preliminary Findings and Lessons Learned from the 16 July 2007
Earthquake at Kashiwazaki-Kariwa NPP, Vol. I., http://www.nisa.meti.go.jp/ english/index.htm.
IAEA (2008).Second Follow-up IAEA Mission in Relation to the Findings and Lessons Learned from
the 16 July 2007 Earthquake at Kashiwazaki-Kariwa NPP: Vol. I., http://www.nisa.meti.go.jp/ eng-
lish/index.htm.
Irikura, K. (2007). Predicting Strong Ground Motions with a “Recipe”, Bull. Earthq. Res. Inst. Univ.
Tokyo, 81, 341-352.
Irikura, K and S. Kurahashi (2008). Validity of Strong Motion Prediction Recipe for Inland-Crust
Earthquakes, Proceedings of 14th World Conference on Earthquake Engineering October 12-17,
2008, Beijing, China, CD-Rom, Paper_ID 02-0073. Irikura, K. and Miyake, H. (2001). Prediction of strong ground motions for scenario earthquakes, Jour-
nal of Geography, 110, 849-875 (in Japanese with English abstract).

Irikura, K. and H. Miyake (2002). Source modeling for strong ground motion prediction, Chikyu,
Monthly, extra issue 37, 62-77 (in Japanese).
Irikura, K. and H. Miyake (2010). Recipe for predicting strong ground motions from crustal earthquake
scenarios, Pageoph Topical Volume on "Advanced Seismic Hazard Assesment".
Kame, N. and Yamashita, T. (2003). Dynamic branching, arresting of rupture and the seismic wave rad-
iation in self-chosen crack path modeling, Geophys. J. Int., 155, 1042-1050.
Madariaga, R. (1979). On the relation between seismic moment and stress drop in the presence of stress
and strength heterogeneity, J. Geophys. Res., 84, 2243-2250.
Nakata, T., Shimazaki, K., Suzuki, Y. and Tsukuda, E. (1998). Fault branching and directivity of rup-
ture propagation, Journal of Geography, 107, 512-528. (in Japanese).
NISAJ (2007). The Earthquakes in Niigata Prefecture and its Effects on Kashiwazaki-Kariwa Nuclear
Power Station, http://www.nisa.meti.go.jp/english/index.htm.
NISAJ (2007). The Earthquakes in Niigata Prefecture and its Effects on Kashiwazaki-Kariwa Nuclear
Power Station, http://www.nisa.meti.go.jp/english/index.htm.
NSCJ (2006). Regulatory Guide for Reviewing Seismic Design of Nuclear Power Reactor Facilities1,
NSC Decision No. 2006-D59, Appendix 1, http://www.nsc.go.jp/NSCenglish/documents/ deci-
sions/2006/2006_59_1.pdf.
NISAJ (2008). Kashiwazaki-Kariwa Nuclear Power Station, Tokyo Electric Power Company Interim
Report on the Geology and Geological Structure of the Ground Surrounding the Site and on the Eval-
uation of the Design Basis Ground Motions, http://www.nisa.meti.go.jp/text/kokusai/IAEA2ndFU/
01-G1-NISA 01_Report_Evaluation of Seismic Ground Motion.pdf (1,338,590 bytes)
Si, H. and Midorikawa, S. (1999). New attenuation relationships for peak ground acceleration and ve-
locity considering effects of fault type and site condition, J. Struct. Constr. Eng., AIJ., 523, 63-70. (in
Japanese with English abstract).
Somerville, P. G., Irikura, K., Graves, R., Sawada, S., Wald, D., Abrahamson, N., Iwasaki, T., Kagawa,
T., Smith, N. and Kowada, A. (1999). Characterizing crustal earthquake slip models for the predic-
tion of strong ground motion, Seism. Res. Lett., 70, 59-80.

Fig. 1. Framework of predicting strong ground motions for crustal earthquake scenarios.
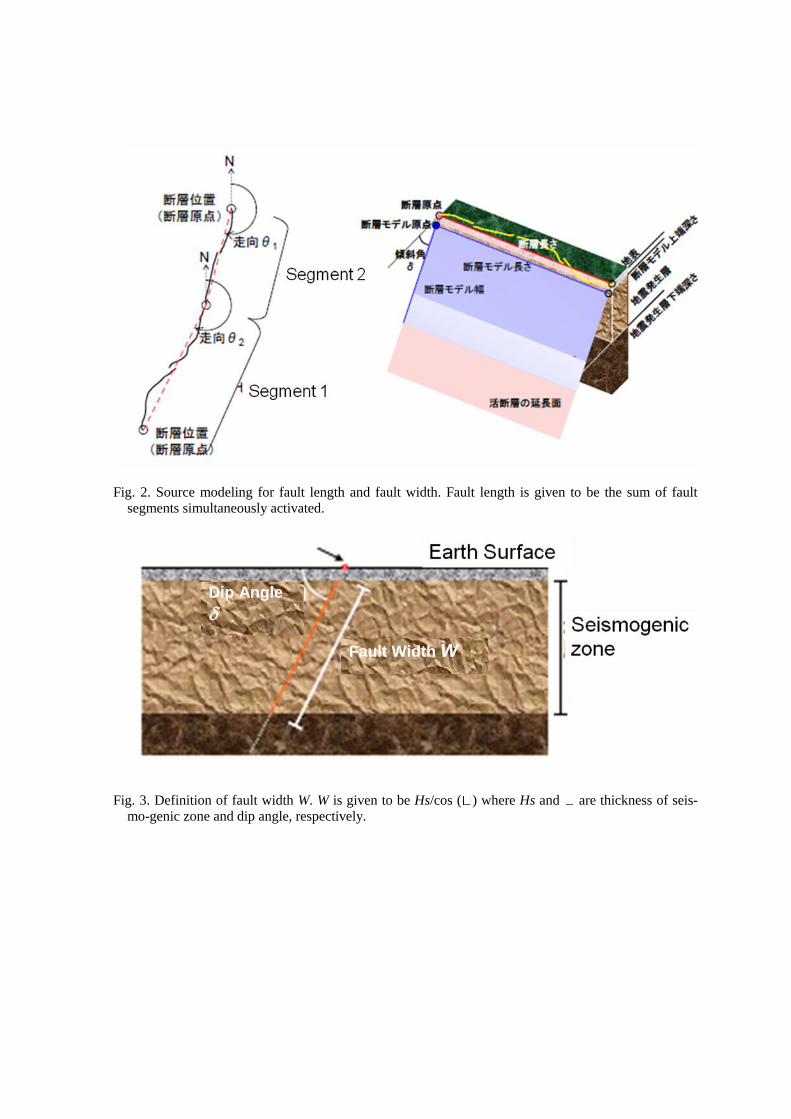
Fig. 2. Source modeling for fault length and fault width. Fault length is given to be the sum of fault
segments simultaneously activated.
Fig. 3. Definition of fault width W. W is given to be Hs/cos ( ) where Hs and are thickness of seis-
mo-genic zone and dip angle, respectively.
Dip Angle
Fault Width W

Fig. 4. Empirical relationships between seismic moment and rupture area for inland crustal earthquakes.
Red broken lines are the 3-stage scaling relationships proposed by our studies (after Irikura and
Miyake, 2001; Irikura et al., 2004).
Fig. 5. Empirical relationships between combined area of asperities and total rupture area for inland
crustal earthquakes (after Irikura and Miyake, 2001). Shaded areas represent (standard deviation).
The thin solid lines show a factor of 2 and 1/2 for the average. The database obtained by waveform
inversions is from Somerville et al. (1999) and Miyakoshi (2002).

Fig. 6. Empirical relationship between seismic moment and acceleration source-spectral level.
Fig. 7. Map showing source fault of 2007 Noto Hanto earthquake (rectangular), the locations of stations
used for analysis (circle), the other stations (square) and epicenter of the mainshock (star).

Fig. 8. Upper: Map showing source fault by Horikawa (2007). Lower: Relationship of observed peak
horizontal ground accelerations versus shortest distances to the source fault. Red solid and dotted
curves show the empirical PGA attenuation distance relationship for surface data by Si and Midori-
kawa (1999) and its standard deviation (lower).
Source Model for Calculation
(Horikawa,2007)
Epicenter
Source Fault
Source Model for Calculation
(Horikawa,2007)
Epicenter
Source Fault
Distance
PG
A (cm
/s/s)
ObsSi and Midorikawa(1999)
Mw=6.7 depth=11km type:CRUSTAL
1 10 100 100010-1
100
101
102
103
Attenuation Distance Relation of PGA
Distance
PG
A (cm
/s/s)
ObsSi and Midorikawa(1999)
Mw=6.7 depth=11km type:CRUSTAL
1 10 100 100010-1
100
101
102
103
Attenuation Distance Relation of PGA

Fig. 9. Characterized source models with asperities inside the rupture area. Upper left is a model by
waveform inversion result and upper right is that by forward modeling. Lower left is that by recipe.
Fig. 10. Comparison between observed records and synthesized motions for three source models by
waveform inversion, recipe, and forward modeling at ISK001 and ISK003.
Waveform InversionWaveform Inversion
Distance along Strike (km)
Dis
tan
ce
alo
ng D
ip(k
m)
Recipe
Distance along Strike (km)
Dis
tan
ce
alo
ng D
ip(k
m)
Distance along Strike (km)
Dis
tan
ce
alo
ng D
ip(k
m)
Recipe
Forward ModelingForward Modeling

Fig. 11. Aftershock distributions in the horizontal plane (left) and cross section perpendicular
to the strike (right) using the OBS seismometers (ERI, Univ. of Tokyo,2008).
Fig. 12. Relationship of observed peak horizontal ground accelerations versus shortest distances to
source fault. Red solid and dotted curves show the empirical PGA attenuation distance relationship
for surface data by Si and Midorikawa (1999) and its standard deviation.
Fig. 13. Strong motion records (velocity) near the source area. The uppermost record was obtained at
the surface station near Unit No.1 Reactor.
Distance
PG
A (cm
/s/s
)
観測司・翠川(1999)
Mw=6.6 depth=10km type:CRUSTAL
1 10 100 100010-1
100
101
102
103
Attenuation Distance Relation of PGA
Kashiwazaki-
Kariwa NPP
Obs
Si and Midorikawa(1999)
Distance
PG
A (cm
/s/s
)
観測司・翠川(1999)
Mw=6.6 depth=10km type:CRUSTAL
1 10 100 100010-1
100
101
102
103
Attenuation Distance Relation of PGA
Kashiwazaki-
Kariwa NPP
Obs
Si and Midorikawa(1999)

Fig. 17. Comparison between the observed records (black) and synthesized motions (red). Acceleration
(top), velocity (middle) and displacement (bottom) are shown at KKZ1R2, KKZ5R2, NIG005 and
NIG018.
Fig. 15. Map showing source model (rectangle) con-
sisting of three asperities (Asp1, Asp2 and Asp3)
in this study and the locations of K-net stations
and KKNPP (circle) and the epicenter of the
mainshock (red star).
Fig.14. Slip distribution inverted the waveform
inversion using strong motion data
(Horikawa, 2007). Red rectangles show
strong motion generation areas estimated by
forward modeling in Fig. 15.
Mainshock
Asp1
Asp2
Asp3
Mainshock
Asp1
Asp2
Asp3
ASP1 ASP2 ASP3

Fig. 18. Flow of reevaluating seismic safety of nuclear power plants based on the new seismic safety
regulatory guide established in 2006.
Fig. 19. Active faults and folds near the Kashiwazaki-Kariwa Nuclear Power Stations.
2007
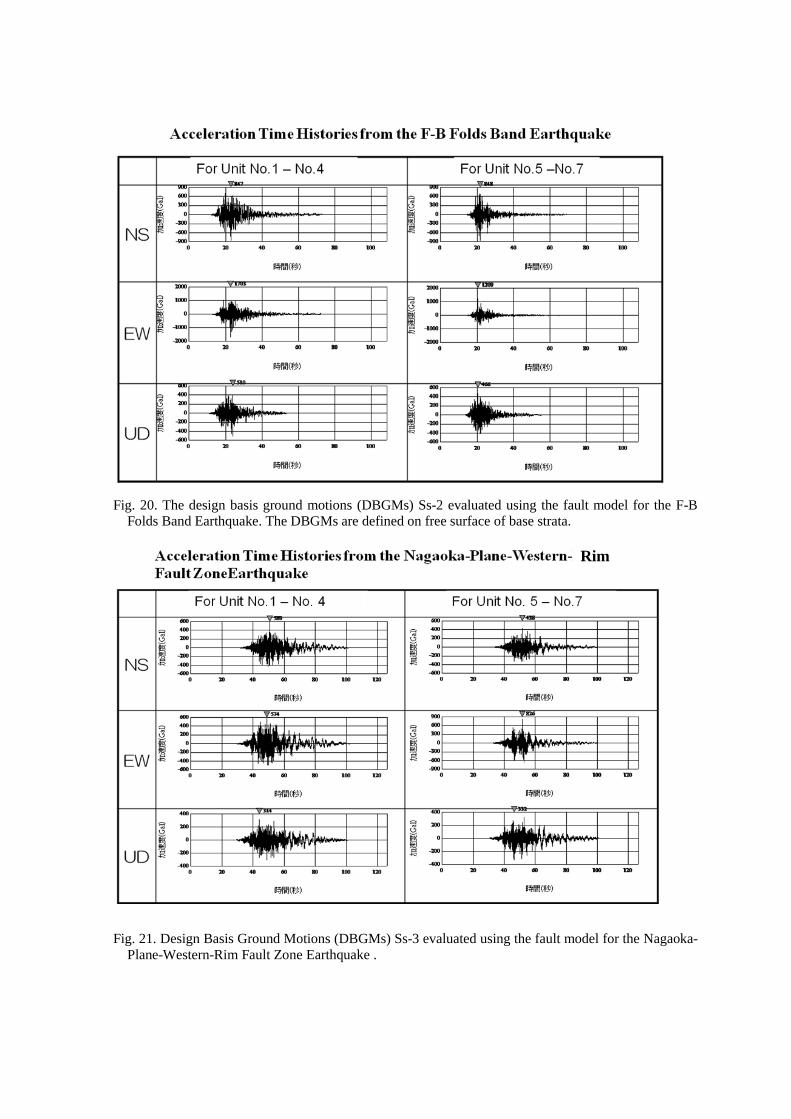
Fig. 20. The design basis ground motions (DBGMs) Ss-2 evaluated using the fault model for the F-B
Folds Band Earthquake. The DBGMs are defined on free surface of base strata.
Fig. 21. Design Basis Ground Motions (DBGMs) Ss-3 evaluated using the fault model for the Nagaoka-
Plane-Western-Rim Fault Zone Earthquake .
Rim

Fig. 22. Response spactra of the design basis ground motions.
Fig. 23. Peak acceleration value of the design basis ground motions.