Adult Cardiac Surgery in New York State 2013-2015 · Members of the New York State Cardiac Advisory...
63
ADULT CARDIAC SURGERY in New York State 2013-2015 Department of Health February 2018
Transcript of Adult Cardiac Surgery in New York State 2013-2015 · Members of the New York State Cardiac Advisory...

ADULT CARDIAC SURGERYin New York State2013-2015
Departmentof Health
February 2018


Members of the New York State Cardiac Advisory Committee
ChairSpencer King III, M.D. Professor of Medicine, Emeritus Emory University School of Medicine Atlanta, GA
Vice ChairGary Walford, M.D. Associate Professor of Medicine Johns Hopkins Medical Center Baltimore, MD
MembersM. Hashmat Ashraf, M.D., FRCS Chief, Department of Cardiothoracic Surgery Kaleida Health Buffalo, NYPeter B. Berger, M.D. Cardiology ConsultantFrederick Bierman, M.D. Director of Graduate Medical Education Westchester Medical Center Valhalla, NYJoanna Chikwe, MD Chief, Division of Cardiothoracic Surgery Co-Director, The Heart Institute Stony Brook University Hospital Stony Brook, NYJeptha Curtis, M.D. Asst. Professor, Dept. of Internal Medicine (Cardiology) Director, Cardiology Outcomes Research & Evaluation Data Analytic Center Yale University School of Medicine New Haven, CTLeonard Girardi, MD, FACS Chairman, Department of Cardiothoracic Surgery Cardiothoracic Surgeon-in-Chief New York Presbyterian Hospital Weill Cornell Medical College New York, NYJeffrey P. Gold, M.D. Chancellor University of Nebraska Medical Center University of Nebraska - Omaha Omaha, NEAlice Jacobs, M.D. Professor of Medicine Vice Chair for Clinical Affairs, Department of Medicine Boston University School of Medicine Boston Medical Center Boston, MADesmond Jordan, M.D. Associate Professor of Clinical Anesthesiology in Biomedical Informatics NY Presbyterian Hospital – Columbia New York, NYThomas Kulik, M.D. Director, Pulmonary Hypertension Program Children’s Hospital Boston Boston, MAStephen Lahey, M.D. Chief, Division of Cardiothoracic Surgery University of Connecticut Health Center Farmington, CTFrederick S. Ling, MD Professor in Medicine (Cardiology) University of Rochester Medical Center Rochester, NY
Ralph Mosca, M.D. Vice Chairman, Department of Cardiac Surgery Director, Congenital Cardiac Surgery NYU Medical Center New York, NYRobert H. Pass, MD, FSCAI Director, Pediatric Electrophysiology Director, Pediatric Cardiac Catheterization Laboratory Montefiore Medical Center Children’s Hospital at Montefiore New York, NYCarlos E. Ruiz, M.D., Ph.D. Professor of Cardiology in Pediatrics and Medicine Director, Structural and Congenital Heart Disease Hackensack University Medical Center The Joseph M. Sanzari Children’s Hospital Hackensack, NJCraig Smith, M.D. Johnson & Johnson Distinguished Professor Valentine Mott Professor of Surgery Columbia University Medical Center New York Presbyterian Hospital New York, NYThoralf Sundt, III, M.D. Chief, Cardiac Surgical Division Co-Director, Heart Center Massachusetts General Hospital Boston, MAJames Tweddell, M.D. Surgical Director and Executive Co-Director The Heart Institute Professor of Surgery Cincinnati Children’s Hospital Medical Center Cincinnati, OH Ferdinand Venditti, Jr., M.D. Executive Vice President for System Care Delivery Hospital General Director Albany Medical College Albany, NYAndrew S. Wechsler, M.D. Emeritus Professor, Cardiothoracic Surgery Department Drexel University College of Medicine Philadelphia, PA
ConsultantEdward L. Hannan, Ph.D. Distinguished Professor Emeritus Department of Health Policy, Management & Behavior Associate Dean Emeritus University at Albany, School of Public Health Rensselaer, NY

Cardiac Surgery Reporting System Subcommittee
Members & ConsultantsCraig Smith, M.D. (Chair) Johnson & Johnson Distinguished Professor Valentine Mott Professor of Surgery Columbia University Medical Center New York Presbyterian HospitalM. Hashmat Ashraf, M.D., FRCS Chief, Department of Cardiothoracic Surgery Kaleida HealthJoanna Chikwe, MD Chief, Division of Cardiothoracic Surgery Co-Director, The Heart Institute Stony Brook University HospitalLeonard Girardi, MD, FACS Chairman, Department of Cardiothoracic Surgery Cardiothoracic Surgeon-in-Chief New York Presbyterian Hospital Weill Cornell Medical CollegeJeffrey P. Gold, M.D. Chancellor University of Nebraska Medical Cente University of Nebraska - Omaha rEdward L. Hannan, Ph.D. Distinguished Professor Emeritus Department of Health Policy, Management & Behavior Associate Dean Emeritus University at Albany, School of Public HealthDesmond Jordan, M.D. Associate Professor of Clinical Anesthesiology in Biomedical Informatics NY Presbyterian Hospital – ColumbiaStephen Lahey, M.D. Chief, Division of Cardiothoracic Surgery Professor of Surgery University of Connecticut Health CenterRalph Mosca, M.D. Vice Chairman, Department of Cardiac Surgery Director, Congenital Cardiac Surgery NYU Medical CenterRobert H. Pass, MD, FSCAI Director, Pediatric Electrophysiology Director, Pediatric Cardiac Catheterization Laboratory Montefiore Medical Center Children’s Hospital at MontefioreCarlos E. Ruiz, M.D., Ph.D. Professor of Cardiology in Pediatrics and Medicine Director, Structural and Congenital Heart Disease Hackensack University Medical Center The Joseph M. Sanzari Children’s HospitalThoralf Sundt, III, M.D. Chief, Cardiac Surgical Division Co-Director, Heart Center Massachusetts General HospitalJames Tweddell, M.D. Surgical Director and Executive Co-Director The Heart Institute Professor of Surgery Cincinnati Children’s Hospital Medical CenterAndrew S. Wechsler, M.D. Emeritus Professor, Cardiothoracic Surgery Department Drexel University College of Medicine
Staff to CSRS Analysis Workgroup – New York State Department of Health
Office of Quality and Patient SafetyMarcus Friedrich, MD, MBA, FACP Chief Medical OfficerJeanne Alicandro, MD Medical Director
Cardiac Services ProgramKimberly S. Cozzens, M.A. Program ManagerAshraf Al-Hamadani, MD, MPH Clinical Record ReviewerDiane Fanuele, MS Clinical Data CoordinatorLori Frazier Project AssistantJessica Kincaid Quality Improvement Project CoordinatorRosemary Lombardo, M.S. CSRS CoordinatorFeng (Johnson) Qian, MD, PhD Associate Professor of Health Policy and ManagementZaza Samadashvili, M.D., M.P.H. Research Scientist

TABLE OF CONTENTS
INTRODUCTION . . . . . . . . . . . . . . . . . . . . . . . . . . . . . . . . . . . . . . . . . . . . . . . . . . 7
CORONARY ARTERY BYPASS GRAFT SURGERY (CABG) . . . . . . . . . . . . . . . . . . . . . . . . . . . 8
CARDIAC VALVE PROCEDURES . . . . . . . . . . . . . . . . . . . . . . . . . . . . . . . . . . . . . . . . . 8
THE DEPARTMENT OF HEALTH PROGRAM . . . . . . . . . . . . . . . . . . . . . . . . . . . . . . . . . . . 9
PATIENT POPULATION . . . . . . . . . . . . . . . . . . . . . . . . . . . . . . . . . . . . . . . . . . . . . . . 9
RISK ADJUSTMENT FOR ASSESSING PROVIDER PERFORMANCE . . . . . . . . . . . . . . . . . . . . . . 11
Data Collection, Data Validation and Identifying In-Hospital/30-Day Deaths and 30-Day Readmission . . 11
Assessing Patient Risk. . . . . . . . . . . . . . . . . . . . . . . . . . . . . . . . . . . . . . . . . . . . . . 11
Predicting Patient Mortality Rates for Providers. . . . . . . . . . . . . . . . . . . . . . . . . . . . . . . . 12
Computing the Risk-Adjusted Mortality Rate . . . . . . . . . . . . . . . . . . . . . . . . . . . . . . . . . 12
Interpreting the Risk-Adjusted Mortality Rate . . . . . . . . . . . . . . . . . . . . . . . . . . . . . . . . . 12
Predicting Patient Readmission and Computing and Interpreting Risk-Adjusted Readmission Rates . . 13
How This Initiative Contributes to Quality Improvement . . . . . . . . . . . . . . . . . . . . . . . . . . . 13
DEFINITIONS OF KEY TERMS . . . . . . . . . . . . . . . . . . . . . . . . . . . . . . . . . . . . . . . . . . . 14
2015 HOSPITAL OUTCOMES FOR CABG SURGERY . . . . . . . . . . . . . . . . . . . . . . . . . . . . . . 15
Table 1 In-Hospital/30-Day Observed, Expected and Risk-Adjusted Mortality Rates for Isolated CABG Surgery in New York State, 2015 Discharges . . . . . . . . . . . . . 16
Figure 1 In-Hospital / 30-Day Risk-Adjusted Mortality Rates for Isolated CABG in New York State, 2015 Discharges . . . . . . . . . . . . . . . . . . . . . . . . . . . . . . . . . . . . . . . . . . . . 17
Table 2 30-Day Observed, Expected and Risk-Adjusted Readmission Rates for Isolated CABG in New York State, 2015 Discharges . . . . . . . . . . . . . . . . . . . . . . . . . . . . . . . . . 18
Figure 2 30-Day Risk-Adjusted Readmission Rates for Isolated CABG in New York State, 2015 Discharges . . . . . . . . . . . . . . . . . . . . . . . . . . . . . . . . . 19
2013-2015 HOSPITAL OUTCOMES FOR VALVE SURGERY. . . . . . . . . . . . . . . . . . . . . . . . . . 20
Table 3 In-Hospital/30-Day Observed, Expected and Risk-Adjusted Mortality Rates for Valve or Valve/CABG Surgery in New York State, 2013-2015 Discharges . . . . . . . . . . . . 21
Figure 3 In-Hospital/30-Day Risk-Adjusted Mortality Rates for Valve or Valve/CABG Surgery in New York State, 2013-2015 Discharges. . . . . . . . . . . . . . . . . . . . . . . . . . . . . 22
Table 4 Hospital Volume for Valve Surgery in New York State, 2013-2015 Discharges . . . . . . . . 23
Table 5 In-Hospital/30-Day Observed, Expected and Risk-Adjusted Mortality Rates for Transcatheter Aortic Valve Replacement in New York State, 2013-2015 Discharges . . . . . 24
2013-2015 HOSPITAL AND SURGEON OUTCOMES . . . . . . . . . . . . . . . . . . . . . . . . . . . . . 25
Table 6 In-Hospital/30-Day Observed, Expected and Risk-Adjusted Mortality Rates by Surgeon for Isolated CABG and Valve Surgery (done in combination with or without CABG) in New York State, 2013-2015 Discharges . . . . . . . . . . . . . . . 25
Table 7 Summary Information for Surgeons Practicing at More Than One Hospital, 2013-2015 . . . 33
6
SURGEON AND HOSPITAL VOLUMES FOR TOTAL ADULT CARDIAC SURGERY, 2013-2015. . . . . . . 37
Table 8 Surgeon and Hospital Volume for Isolated CABG, Valve or Valve/CABG, Other Cardiac Surgery and Total Adult Cardiac Surgery, 2013-2015 . . . . . . . . . . . . . . 37
CRITERIA USED IN REPORTING SIGNIFICANT RISK FACTORS (2014) . . . . . . . . . . . . . . . . . . . 45
MEDICAL TERMINOLOGY . . . . . . . . . . . . . . . . . . . . . . . . . . . . . . . . . . . . . . . . . . . . 49
APPENDIX 1 Risk Factors for CABG In-Hospital / 30-Day Deaths in New York State in 2015 . . . . . . . . . . . . . . . . . . . . . . . . . . . . . . . . . . . . . 51
APPENDIX 2 Risk Factors for CABG 30-Day Readmissions in New York State in 2015 . . . . . . . . . . . . . . . . . . . . . . . . . . . . . . . . . . . . 53
APPENDIX 3 Risk Factors for Valve Surgery In-Hospital/30-Day Mortality in New York State in 2013-2015 . . . . . . . . . . . . . . . . . . . . . . . . . . . . . . . . . 55
APPENDIX 4 Risk Factors for Valve and CABG Surgery In-Hospital/30-Day Mortality in New York State in 2013-2015 . . . . . . . . . . . . . . . . . . . . . . . . . . . . . . . . . 57
APPENDIX 5 Risk Factors for TAVR In-Hospital/30-Day Mortality in New York State 2013-2015 . . . . . 59
APPENDIX 6 Risk Factors for Isolated CABG In-Hospital/30-Day Mortality in New York State 2013-2015 . . . . . . . . . . . . . . . . . . . . . . . . . . . . . . . . . . 60
NEW YORK STATE CARDIAC SURGERY CENTERS . . . . . . . . . . . . . . . . . . . . . . . . . . . . . . . 61

7
INTRODUCTIONFor over twenty years, the NYS Cardiac Data Reporting System has been a powerful resource for quality improvement in the areas of cardiac surgery and percutaneous coronary interventions (PCI). Building on this strong foundation, we are pleased to include in one report information on mortality after coronary artery bypass graft (CABG) surgery, valve repair or replacement surgery, transcatheter aortic valve replacement (TAVR), and readmissions after CABG.
New York State (NYS) has taken a leadership role in setting standards for cardiac services, monitoring outcomes and sharing performance data with patients, hospitals and physicians. Hospitals and doctors involved in cardiac care have worked in cooperation with the NYS Department of Health (Department of Health) and the NYS Cardiac Advisory Committee (Cardiac Advisory Committee) to compile accurate and meaningful data that can and have been used to enhance quality of care. We believe that this process has been instrumental in achieving the excellent outcomes that are evidenced in this report for centers across NYS.
The information contained in this report is intended for health care providers, patients and families of patients who are considering cardiac surgery. It includes:
• Mortality rates, adjusted for patient severity of illness, for CABG surgery, valve repair or replacement surgery, and TAVR at NYS hospitals.
• Readmission rates, adjusted for patient severity of illness, following CABG at NYS hospitals.• Mortality rates, adjusted for patient severity of illness, following CABG and/or valve surgery for
surgeons performing the procedure.• Volume (number of cases) of all cardiac surgery for NYS hospitals and surgeons.• Description of the patient risk factors associated with mortality for CABG and valve surgery and TAVR,
and those associated with readmissions after CABG surgery.
The data that serve as the basis for this report are collected by the NYS Department of Health cooperatively with hospitals throughout the state. Careful auditing and rigorous analysis assure that these reports represent meaningful outcome assessments. The report was developed with clinical guidance from the NYS Cardiac Advisory Committee, an advisory body to the Commissioner of Health consisting of nationally recognized cardiac surgeons, cardiologists and others from related disciplines working both in New York State and elsewhere. The Cardiac Advisory Committee is to be commended for sustained leadership in these efforts.
As they develop treatment plans, we encourage doctors to discuss this information with their patients and colleagues. While these statistics are an important tool in making informed health care choices, individual treatment plans must be made by doctors and patients together after careful consideration of all pertinent factors. It is important to recognize that many factors can influence the outcome of cardiac surgery. These include the patient’s health before the procedure, the skill of the operating team and general after-care. In addition, keep in mind that the information in this booklet does not include data after 2015. Important changes may have taken place in hospitals during that time period.
It is important that patients and physicians alike give careful consideration to the importance of healthy lifestyles for all those affected by heart disease. While some risk factors, such as heredity, gender and age cannot be controlled, others certainly can. Controllable risk factors that contribute to a higher likelihood of developing coronary artery disease are high cholesterol levels, cigarette smoking, high blood pressure, obesity and sedentary lifestyle. Careful attention to these risk factors after surgery will continue to be important in promoting good health and preventing recurrence of disease.
Hospitals and physicians in NYS can take pride in the excellent patient care provided and in their role in contributing to this unique collaborative quality improvement system. The Department of Health will continue to work in partnership with hospitals and physicians to ensure that continued high-quality cardiac surgery is available to NYS residents.

8
CORONARY ARTERY BYPASS GRAFT SURGERY (CABG)Heart disease is the leading cause of death in NYS, and the most common form of heart disease is atherosclerotic coronary artery disease. Different treatments are recommended for patients with coronary artery disease. For some people, changes in lifestyle, such as dietary changes, not smoking and regular exercise, can result in great improvements in health. In other cases, medication prescribed for high blood pressure or other conditions can make a significant difference.
Sometimes, however, an interventional procedure is recommended. The two common procedures performed on patients with coronary artery disease are CABG surgery and percutaneous coronary intervention (PCI).
CABG surgery is an operation in which a vein or artery from another part of the body is used to create an alternate path for blood to flow to the heart muscle, bypassing the arterial blockage. Typically, a section of one of the large (saphenous) veins in the leg, the radial artery
in the arm or the mammary artery in the chest is used to construct the bypass. One or more bypasses may be performed during a single operation, since providing several routes for the blood supply to travel is believed to improve long-term success for the procedure. CABG surgery is one of the most common, successful major operations currently performed in the United States.
As is true of all major surgery, risks must be considered. The patient is totally anesthetized and there is generally a substantial recovery period in the hospital followed by several weeks of recuperation at home. Even in successful cases, there is a risk of relapse causing the need for another operation.
Those who have CABG surgery are not cured of coronary artery disease; the disease can still occur in the grafted blood vessels or other coronary arteries. In order to minimize new blockages, patients should continue to reduce their risk factors for heart disease.
CARDIAC VALVE PROCEDURESHeart valves control the flow of blood as it enters the heart and is pumped from the chambers of the heart to the lungs for oxygenation and back to the body. There are four valves: the tricuspid, mitral, pulmonary and aortic valves. Heart valve disease occurs when a valve cannot open all the way because of disease or injury, thus causing a decrease in blood flow to the next heart chamber. Another type of valve problem occurs when the valve does not close completely, which leads to blood leaking backward into the previous chamber. Either of these problems causes the heart to work harder to pump blood or causes blood to back up in the lungs or lower body.
When a valve is stenotic (too narrow to allow enough blood to flow through the valve opening) or incompetent (cannot close tightly enough to prevent the backflow of blood), one of the treatment options is to repair the valve. Repair of a stenotic valve typically involves widening the valve opening, whereas repair
of an incompetent valve is typically achieved by narrowing or tightening the supporting structures of the valve. The mitral valve is particularly amenable to valve repairs because its parts can frequently be repaired without having to be replaced.
In many cases, defective valves are replaced rather than repaired, using either a mechanical or biological valve. Mechanical valves are built using durable materials that generally last a lifetime. Biological valves are made from tissue taken from pigs, cows or humans. Mechanical and biological valves each have advantages and disadvantages that can be discussed with referring physicians.
The most common heart valve surgeries involve the aortic and mitral valves. Patients undergoing heart surgery are totally anesthetized and are usually placed on a heart-lung machine, whereby the heart is stopped for a short period of time using special drugs. As is the case for CABG surgery, there is a recovery period of

9
several weeks at home after being discharged from the hospital. Some patients require replacement of more than one valve and some patients with both coronary artery disease and valve disease require valve replacement and CABG surgery. This report contains outcomes for the following valve surgeries when done alone or in combination with CABG: Aortic Valve Replacement, Mitral Valve Repair, Mitral Valve Replacement and Multiple Valve Surgery.
In recent years, a new technique for replacement of the aortic valve has been tested
and approved for use in the United States under certain circumstances. This procedure, known as Transcatheter Aortic Valve Replacement (TAVR, also sometimes called Transcatheter Aortic Valve Implantation or TAVI), differs from traditional surgical valve replacement in that the replacement valve is delivered to the heart through a catheter rather than through a standard surgical incision. The procedure is performed collaboratively by cardiologists and cardiac surgeons.
THE DEPARTMENT OF HEALTH PROGRAMFor many years, the Department of Health has been studying the effects of patient and treatment characteristics (called risk factors) on outcomes for patients with heart disease. Detailed statistical analyses of the information received from the study have been conducted under the guidance of the Cardiac Advisory Committee, a group of independent practicing cardiac surgeons, cardiologists and other professionals in related fields.
The results have been used to create a cardiac profile system which assesses the performance of hospitals and surgeons over time,
independent of the severity of each individual patient’s pre-operative conditions.
Designed to improve health in people with heart disease, this program is aimed at:
• understanding the health risks of patients that adversely affect how they will fare in coronary artery bypass surgery and/or valve surgery;
• improving the results of different treatments of heart disease;
• improving cardiac care; and
• providing information to help patients make better decisions about their own care.
PATIENT POPULATIONThis report is based on data for patients discharged between December 1, 2012, and November 30, 2015, provided by all non-federal hospitals in NYS where cardiac surgery is performed. The analysis period for this report includes patients discharged in December 2012 but not those discharged in December 2015. This strategy allows for more timely report publication by eliminating the need to track patients for 30-day mortality into the following calendar year. Inclusion of cases from the previous December allows for meaningful comparison of 12-month volume as found in previous reports. The single year analysis for 2015 cases includes patients discharged from December 1, 2014 through November 30, 2015. In total there were 60,820 cardiac surgical procedures performed during this time period.
For various reasons, some of these cases are excluded from analysis in this report. The reasons for exclusion and number of cases affected are described below.
Records for 149 patients residing outside the United States were excluded because these patients could not be followed after hospital discharge. There were 9 cases excluded from analysis because each 30-day mortality can only be associated with a single cardiac surgery.
Beginning with patients discharged in 2006, the Department of Health, with the advice of the Cardiac Advisory Committee, began a trial period of excluding from publicly released reports any patients meeting the Cardiac Data System definition of pre-operative cardiogenic shock. Cardiogenic shock is a condition

10
associated with severe hypotension (very low blood pressure). [The technical definition used in this report can be found on page 45.] Patients in cardiogenic shock are extremely high-risk, but for some, cardiac surgery may be their best chance for survival. Furthermore, the magnitude of the risk is not always easily determined using registry data. These cases were excluded after careful deliberation and input from NYS providers and others in an effort to ensure that physicians could accept these cases where appropriate without concern over a detrimental impact on their reported outcomes. In total, 610 cases with cardiogenic shock were removed from the data. This accounts for 1.00 percent of all cardiac surgeries (CABG, valve surgery and other cardiac surgery reported in this data system) in the three years.
After all of the above exclusions, there were 60,052 cardiac surgeries analyzed in this report. Isolated CABG surgery represented 40.74 percent of all adult cardiac surgery included in this report. Valve or combined valve/CABG surgery represented 36.85 percent of all adult cardiac surgery for the same period. TAVR represented 9.25 percent of all cardiac surgeries reported. Total cardiac surgery, isolated CABG, valve surgery and other cardiac surgery volumes are tabulated in Table 8 by hospital and surgeon for the period 2013 through 2015.
While there were 8,356 CABG cases included in the mortality analysis for 2015 discharges, some additional exclusions were required for the readmission analysis. Records belonging to patients residing outside NYS were excluded because there is no reliable way to track out-of-state readmissions. This accounted for 326 cases. Another 105 patients were excluded because they died in the same admission as their index CABG, so readmission was impossible. Nineteen cases were transfered to another acute care facility after CABG and so were excluded from readmission analysis. Finally, 7 cases with a discharge status of ‘left against medical advice’ were excluded from the readmission analysis.
In total, the number of excluded cases was 451 (some patients had more than 1 reason for exclusion), leaving 7,905 cases to be examined for 30-day readmission rates.
Note on Hospitals Not Performing Cardiac Surgery During Entire 2013 – 2015 Period
Good Samaritan in West Islip began performing cardiac surgery in January 2014. The cardiac surgery programs at Erie County Medical Center and Champlain Valley Physician’s Hospital closed in March and December of 2013, respectively.

11
RISK ADJUSTMENT FOR ASSESSING PROVIDER PERFORMANCEProvider performance is directly related to patient outcomes. Whether patients recover quickly, experience complications, require another hospitalization, or die following a procedure is, in part, a result of the kind of medical care they receive. It is difficult, however, to compare outcomes across hospitals when assessing provider performance because different hospitals treat different types of patients. Hospitals with sicker patients may have higher rates of death and readmission than other hospitals in the state. The following describes how the Department of Health adjusts for patient risk in assessing provider outcomes.
Data Collection, Data Validation and Identifying In-Hospital/30-Day Deaths and 30-Day Readmission
As part of the risk-adjustment process, NYS hospitals where cardiac surgery is performed provide information to the Department of Health for each patient undergoing that procedure. Cardiac surgery departments collect data concerning patients’ demographic and clinical characteristics. Approximately 40 of these characteristics (called risk factors) are collected for each patient. Along with information about the procedure, physician and the patient’s status at discharge, these data are entered into a computer and sent to the Department of Health for analysis.
Data are verified through review of unusual reporting frequencies, cross-matching of cardiac surgery data with other Department of Health databases and a review of medical records for a selected sample of cases. These activities are extremely helpful in ensuring consistent interpretation of data elements across hospitals.
The analyses in this report base mortality on deaths occurring during the same hospital stay in which a patient underwent cardiac surgery or TAVR and on deaths that occur after discharge but within 30 days of surgery.
An in-hospital death is defined as a patient who died subsequent to CABG or valve surgery or TAVR during the same admission or was discharged to hospice care and expired within 30 days.
Deaths that occur after hospital discharge but within 30 days of surgery are also counted in the risk-adjusted mortality analyses. This is done because hospital length of stay has been decreasing and, in the opinion of the Cardiac Advisory Committee, most deaths that occur after hospital discharge but within 30 days of surgery are related to complications of surgery.
Data on deaths occurring after discharge from the hospital are obtained from the Department of Health, the New York City Department of Health and Mental Hygiene Bureau of Vital Statistics, and the National Death Index.
Data on readmissions are obtained from the Department of Health’s acute care hospital dataset, the Statewide Planning and Research Cooperative System (SPARCS), which contains data pertaining to all acute care hospital discharges in the state.
Thirty-day readmission is defined as admission to a NYS non-Federal hospital within 30 days of discharge from the index hospitalization.
Assessing Patient Risk
Each person who develops heart disease has a unique health history. A cardiac profile system has been developed to evaluate the risk of treatment for each individual patient based on his or her history, weighing the important health factors for that person based on the experiences of thousands of patients who have undergone the same procedures in recent years. All important risk factors for each patient are combined to create a risk profile. For example, an 80-year-old patient with renal failure requiring dialysis has a very different risk profile than a 40-year-old with no renal failure.
The statistical analyses conducted by the Department of Health consist of determining which of the risk factors collected are significantly related to death or readmission following CABG and/or valve surgery and determining how to weigh the significant risk factors to predict the chance each patient will have of dying or being readmitted, given his or her specific characteristics.

12
Doctors and patients should review individual risk profiles together. Treatment decisions must be made by doctors and patients together after consideration of all the information.
Predicting Patient Mortality Rates for Providers
The statistical methods used to predict mortality on the basis of the significant risk factors are tested to determine whether they are sufficiently accurate in predicting mortality for patients who are extremely ill prior to undergoing the procedure as well as for patients who are relatively healthy. These tests have confirmed that the models are reasonably accurate in predicting how patients of all different risk levels will fare when undergoing cardiac surgery.
The mortality rate for each hospital and surgeon is also predicted using the relevant statistical models. This is accomplished by summing the predicted probabilities of death for each of the provider’s patients and dividing by the number of patients. The resulting rate is an estimate of what the provider’s mortality rate would have been if the provider’s performance were identical to the state performance. The percentage is called the predicted or expected mortality rate (EMR). A hospital’s EMR is contrasted with its observed mortality rate (OMR), which is the number of patients who died divided by the total number of patients.
Computing the Risk-Adjusted Mortality Rate
The risk-adjusted mortality rate (RAMR) represents the best estimate, based on the associated statistical model, of what the provider’s mortality rate would have been if the provider had a mix of patients identical to the statewide mix. Thus, the RAMR has, to the extent possible, ironed out differences among providers in patient severity of illness, since it arrives at a mortality rate for each provider for an identical group of patients. To calculate the RAMR, the OMR is first divided by the provider’s EMR. If the resulting ratio is larger than one, the provider has a higher mortality rate than expected on the basis of its patient mix; if it is smaller than one, the provider has a lower mortality rate than expected from its patient mix. For isolated CABG patients the ratio is then multiplied by the overall statewide mortality
rate of 1.56 percent (in-hospital/30-day mortality in 2015) to obtain the provider’s RAMR. For the three-year period 2013-2015, the ratio is multiplied by 1.54 percent (in-hospital/30-day mortality rate) for isolated CABG patients or 3.03 percent (in-hospital/30-day mortality rate) for valve or valve/CABG patients.
There is no Statewide EMR or RAMR, because the statewide data is not risk-adjusted. The Statewide OMR (number of total cases divided by number of total deaths) serves as the basis for comparison for each hospital’s EMR and RAMR.
Interpreting the Risk-Adjusted Mortality Rate
If the RAMR is significantly lower than the statewide mortality rate, the provider has a significantly better performance than the state as a whole; if the RAMR is significantly higher than the statewide mortality rate, the provider has a significantly worse performance than the state as a whole.
The RAMR is used in this report as a measure of quality of care provided by hospitals and surgeons. However, there are reasons that a provider’s RAMR may not be indicative of its true quality. For example, extreme outcome rates may occur due to chance alone. This is particularly true for low-volume providers, for whom very high or very low mortality rates are more likely to occur than for high-volume providers. To prevent misinterpretation of differences caused by chance variation, confidence intervals are reported in the results. The interpretations of those terms are provided later when the data are presented.
Differences in hospital coding of risk factors could be an additional reason that a provider’s RAMR may not be reflective of quality of care. The Department of Health monitors the quality of coded data by reviewing samples of patients’ medical records to ascertain the presence of key risk factors. When significant coding problems are discovered, hospitals are required to correct these data and are subjected to subsequent monitoring.
Although there are reasons that RAMRs presented here may not be a perfect reflection of quality of care, the Department of Health feels that this information is a valuable aid in choosing providers for cardiac surgery.

13
Predicting Patient Readmission and Computing and Interpreting Risk-Adjusted Readmission Rates
Patient risk of 30-day readmission is assessed using the same methods used for assessing mortality risk as described above. All potential risk factors are considered and those that are independently related to readmission are identified and given weights so as to best predict the risk of 30-day readmission for each patient. Observed readmission rates (ORR), expected readmission rates (ERR) and risk-adjusted readmission rates (RARR) are calculated in the same way that OMR, EMR and RAMR are calculated. ERR and RARR are compared to the statewide observed readmission rate (13.18 percent in 2015).
This analysis is based on all-cause readmission, not just readmission directly related to the CABG procedure. Not all readmissions represent a poor patient outcome or reflect poor patient care. However, by risk-adjusting and comparing the results across the many hospitals that perform this procedure we are able to look for meaningful differences from the overall statewide experience. If the RARR is significantly lower than the statewide readmission rate, the hospital has a better performance than the state as a whole; if the RARR is significantly higher than the statewide readmission rate, the hospital has a worse performance than the state as a whole.
As described above for mortality, there are reasons that a provider’s RARR may not be indicative of its true quality. Confidence intervals and careful attention to data quality are used in the same way for readmission as they are for mortality.
How This Initiative Contributes to Quality Improvement
One goal of the Department of Health and the Cardiac Advisory Committee is to improve the quality of care related to cardiac surgery in NYS. Providing the hospitals and cardiac surgeons in NYS with data about their own outcomes for these procedures allows them to examine the quality of the care they provide and to identify areas that need improvement.
The data collected and analyzed in this program are reviewed by the Cardiac Advisory Committee. Committee members assist with interpretation and advise the Department of Health regarding hospitals and surgeons that may need special attention. Committee members have also conducted site visits to particular hospitals and have recommended that some hospitals obtain the expertise of outside consultants to design improvements for their programs.
The overall results of this program of ongoing review show that significant progress is being made. In response to the program’s results for surgery, facilities have refined patient criteria, evaluated patients more closely for pre-operative risks and directed them to the appropriate surgeon. More importantly, many hospitals have identified medical care processes that have led to less than optimal outcomes, and have altered those processes to achieve improved results

14
DEFINITIONS OF KEY TERMSThe observed mortality rate (OMR) is the observed number of deaths divided by the total number of cases.
The expected mortality rate (EMR) is the sum of the predicted probabilities of death for all patients divided by the total number of patients.
The risk-adjusted mortality rate (RAMR) is the best estimate, based on the statistical model, of what the provider’s mortality rate would have been if the provider had a mix of patients identical to the statewide mix. It is obtained by first dividing the OMR by the EMR, and then multiplying by the relevant statewide mortality rate (for example, 1.56 percent for Isolated CABG patients in 2015 or 3.03 percent for Valve or Valve/CABG patients in 2013-2015).
The observed readmission rate (ORR) is the observed number of 30-day readmissions divided by the total number of analyzed cases.
The expected readmission rate (ERR) is the sum of the predicted probabilities of readmission for all patients divided by the total number of analyzed cases.
The risk-adjusted readmission rate (RARR) is the best estimate, based on the statistical model, of what the provider’s readmission rate would have been if the provider had a mix of patients similar to the statewide mix. It is obtained by first dividing the ORR by the ERR, and then multiplying that quotient by the statewide readmission rate (13.18 percent 30-day readmission rate for all CABG patients discharged in 2015).
Confidence Intervals are used to identify which hospitals had significantly more or fewer deaths or readmissions than expected given the risk factors of their patients. The confidence interval identifies the range in which the risk-adjusted rate may fall. Hospitals with significantly higher rates than expected after adjusting for risk are those where the confidence interval range falls entirely above the statewide mortality rate. Hospitals with significantly lower rates than expected, given the severity of illness of their patients before surgery, have confidence intervals entirely below the statewide mortality rate. The more cases a provider performs, the narrower their confidence interval will be. This is because as a provider performs more cases, the likelihood of chance variation in the risk-adjusted rate decreases.

15
2015 HOSPITAL OUTCOMES FOR CABG SURGERYTable 1 and Figure 1 present the CABG surgery results for the 38 hospitals performing this operation in NYS in 2015. The table contains, for each hospital, the number of isolated CABG operations (CABG operations with no other major heart surgery earlier in the hospital stay) for patients discharged in 2015, the number of in-hospital/30-day deaths, the OMR, the EMR based on the statistical model presented in Appendix 1, the RAMR and a 95 percent confidence interval for the RAMR.
As indicated in Table 1, the overall in-hospital/ 30-day mortality rate for the 8,356 CABG surgeries was 1.56 percent. In-hospital/30-day OMRs ranged from 0.00 percent to 16.67 percent. The range of EMRs, which measure patient severity of illness, was 0.82 percent to 2.28 percent.
The RAMRs, which are used to measure performance, ranged from 0.00 percent to 12.60 percent. No hospitals had RAMRs that were significantly lower than the statewide rate. One hospital (University Hospital - Brooklyn) had mortality rate that was significantly higher than the statewide rate.
The 2015 in-hospital/30-day mortality rate of 1.56 percent for Isolated CABG is higher than the 1.22 percent observed in 2014.
The in-hospital OMR for 2015 Isolated CABG discharges (not shown in Table 1) was 1.26 percent for all 8,356 patients included in the analysis.
Figure 1 provides a visual representation of the data displayed in Table 1. For each hospital, the black dot represents the RAMR and the gray bar represents the confidence interval, or potential statistical error, for the RAMR. The black vertical line is the NYS in-hospital/30-day mortality rate. A gray bar that extends far above and/or below the statewide average indicates that a hospital has a wide confidence interval. This
is common when the hospital has a very small number of cases. It does not necessarily mean that the risk-adjusted mortality rate is very high or very low. For any hospital where the gray bar crosses the state average line, the RAMR is not statistically different from the state as a whole. Hospitals that are statistical outliers will have gray bars (confidence intervals) that are either entirely above or entirely below the line for the statewide rate.
Table 2 presents the 30-day readmission results for the 38 hospitals performing CABG in NYS in 2015 for which data could be analyzed. The table contains, for each hospital, the number of CABGs resulting in 2015 discharges in the readmission analysis, the number of 30-Day readmissions, the ORR, the ERR based on the statistical model presented in Appendix 2, the RARR and a 95 percent confidence interval for the RARR.
The overall ORR for the 7,905 CABGs included in this 2015 analysis was 13.18 percent. Observed readmission rates ranged from 4.65 percent to 25.00 percent. The range in ERRs, which measure patient severity of illness, was between 10.23 percent and 15.08 percent. The RARRs, which measure hospital performance, range from 5.41 percent to 21.91 percent.
Based on confidence intervals for RARRs, three hospitals (Bellevue Hospital in Manhattan, Good Samaritan Hospital in West Islip, and Rochester General Hospital) had RARRs that were significantly higher than the statewide average. Four hospitals (NYU Hospitals Center in Manhattan, Southside Hospital in Bayshore, St. Peter’s Hospital in Albany, and Vassar Brothers Medical Center in Poughkeepsie) had RARRs that were significantly lower than the statewide average.
Figure 2 provides a visual representation of the data displayed in Table 2. It is interpreted in the same way as Figure 1 described above.

16
Table 1
In-hospital/30-Day Observed, Expected and Risk-Adjusted Mortality Rates for Isolated CABG Surgery in New York State, 2015 Discharges (Listed Alphabetically by Hospital)
Hospital Cases Deaths OMR EMR RAMR 95% CI for RAMR
Albany Med. Ctr 260 3 1.15 1.66 1.08 (0.22, 3.16)Arnot Ogden Med Ctr 80 1 1.25 0.82 2.37 (0.03,13.16)Bassett Medical Center 74 2 2.70 1.02 4.13 (0.46,14.91)Bellevue Hospital Ctr 113 2 1.77 0.95 2.89 (0.32,10.42)Buffalo General Hosp 474 10 2.11 1.25 2.62 (1.26, 4.82)Ellis Hospital 185 4 2.16 1.58 2.12 (0.57, 5.44)Good Sam - Suffern 108 2 1.85 1.10 2.63 (0.29, 9.48)Good Sam-West Islip 199 2 1.01 1.39 1.12 (0.13, 4.05)Lenox Hill Hospital 259 8 3.09 1.84 2.61 (1.12, 5.14)Long Island Jewish MC 97 0 0.00 1.48 0.00 (0.00, 3.98)Maimonides Medical Ctr 255 8 3.14 2.28 2.14 (0.92, 4.22)Mercy Hospital 391 5 1.28 1.42 1.40 (0.45, 3.27)Montefiore - Moses 176 0 0.00 1.24 0.00 (0.00, 2.61)Montefiore - Weiler 194 4 2.06 1.41 2.28 (0.61, 5.84)Mount Sinai Beth Israel 210 1 0.48 1.26 0.59 (0.01, 3.28)Mount Sinai Hospital 398 5 1.26 1.69 1.16 (0.37, 2.70)Mount Sinai St. Lukes 146 1 0.68 1.57 0.68 (0.01, 3.78)NYP-Brooklyn Methodist 110 1 0.91 1.91 0.74 (0.01, 4.12)NYP-Columbia Presby. 387 8 2.07 2.06 1.56 (0.67, 3.08)NYP-Queens 117 0 0.00 0.83 0.00 (0.00, 5.88)NYP-Weill Cornell 196 2 1.02 1.56 1.02 (0.11, 3.69)NYU Hospitals Center 183 2 1.09 1.18 1.45 (0.16, 5.22)NYU Winthrop Hospital 208 1 0.48 1.32 0.57 (0.01, 3.15)North Shore Univ Hosp 421 4 0.95 1.70 0.87 (0.23, 2.23)Rochester General Hosp 355 8 2.25 1.60 2.19 (0.94, 4.31)Southside Hospital 170 1 0.59 0.97 0.95 (0.01, 5.27)St. Elizabeth Med Ctr 166 5 3.01 1.57 2.98 (0.96, 6.94)St. Francis Hospital 481 9 1.87 1.88 1.54 (0.70, 2.93)St. Josephs Hospital 382 6 1.57 1.59 1.54 (0.56, 3.36)St. Peters Hospital 344 1 0.29 1.05 0.43 (0.01, 2.39)Staten Island Univ Hosp 185 4 2.16 1.83 1.84 (0.49, 4.70)Strong Memorial Hosp 203 2 0.99 1.75 0.88 (0.10, 3.17)UHS-Wilson Med Ctr 142 2 1.41 1.34 1.63 (0.18, 5.90)Univ. Hosp-Brooklyn 36 6 16.67 2.06 12.60 * (4.60,27.43)Univ. Hosp-Stony Brook 297 3 1.01 1.88 0.84 (0.17, 2.45)Univ. Hosp-Upstate 31 1 3.23 1.06 4.75 (0.06,26.44)Vassar Bros. Med Ctr 174 2 1.15 1.57 1.14 (0.13, 4.10)Westchester Med Ctr 149 4 2.68 2.15 1.94 (0.52, 4.97)
STATEWIDE TOTAL 8356 130 1.56
* Risk-adjusted mortality rate significantly higher than the statewide rate based on 95 percent confidence interval.

17
0 2 4 6 8 10 30
13.16
27.43
26.44
14.91
KeyRAMRPotential margin of statistical error
1.56New York State Average
Albany Med. CtrArnot Ogden Med Ctr
Bassett Medical CenterBellevue Hospital CtrBuffalo General Hosp
Ellis HospitalGood Sam - Suffern
Good Sam-West IslipLenox Hill Hospital
Long Island Jewish MCMaimonides Medical Ctr
Mercy HospitalMontefiore - MosesMontefiore - Weiler
Mount Sinai Beth IsraelMount Sinai HospitalMount Sinai St. Lukes
NYP-Brooklyn MethodistNYP-Columbia Presby.
NYP-QueensNYP-Weill Cornell
NYU Hospitals CenterNYU Winthrop HospitalNorth Shore Univ Hosp
Rochester General HospSouthside Hospital
St. Elizabeth Med CtrSt. Francis Hospital
St. Josephs HospitalSt. Peters Hospital
Staten Island Univ HospStrong Memorial Hosp
UHS-Wilson Med CtrUniv. Hosp-Brooklyn*
Univ. Hosp-Stony BrookUniv. Hosp-Upstate
Vassar Bros. Med CtrWestchester Med Ctr
Figure 1
In-Hospital/30-Day Risk-Adjusted Mortality Rates for Isolated CABG in New York State, 2015 Discharges
* Risk-adjusted mortality rate significantly higher than the statewide rate based on 95 percent confidence interval.

18
Table 2
30-Day Observed, Expected and Risk-Adjusted Readmission Rates for Isolated CABG Surgery in New York State, 2015 Discharges (Listed Alphabetically by Hospital)
Hospital Cases Readmits ORR ERR RARR 95% CI for RARR
Albany Med. Ctr 231 29 12.55 13.12 12.61 ( 8.45,18.12)Arnot Ogden Med Ctr 73 5 6.85 11.38 7.93 ( 2.56,18.51)Bassett Medical Center 72 5 6.94 13.37 6.85 ( 2.21,15.98)Bellevue Hospital Ctr 112 22 19.64 11.82 21.91* (13.72,33.17)Buffalo General Hosp 441 65 14.74 12.41 15.65 (12.08,19.95)Ellis Hospital 178 20 11.24 13.42 11.04 ( 6.74,17.05)Good Sam - Suffern 94 10 10.64 12.21 11.48 ( 5.50,21.12)Good Sam-West Islip 196 39 19.90 13.49 19.44* (13.82,26.57)Lenox Hill Hospital 246 31 12.60 13.42 12.37 ( 8.41,17.56)Long Island Jewish MC 97 9 9.28 13.46 9.08 ( 4.14,17.24)Maimonides Medical Ctr 248 33 13.31 13.68 12.83 ( 8.83,18.01)Mercy Hospital 384 60 15.63 13.40 15.37 (11.73,19.79)Montefiore - Moses 172 24 13.95 12.80 14.37 ( 9.20,21.38)Montefiore - Weiler 185 35 18.92 14.00 17.81 (12.40,24.77)Mount Sinai Beth Israel 197 26 13.20 12.12 14.35 ( 9.37,21.03)Mount Sinai Hospital 361 54 14.96 12.87 15.32 (11.51,19.99)Mount Sinai St. Lukes 140 14 10.00 13.17 10.01 ( 5.47,16.79)NYP-Brooklyn Methodist 106 8 7.55 11.69 8.51 ( 3.66,16.77)NYP-Columbia Presby. 310 38 12.26 13.66 11.82 ( 8.37,16.23)NYP-Queens 114 17 14.91 10.23 19.21 (11.18,30.75)NYP-Weill Cornell 166 23 13.86 12.94 14.12 ( 8.95,21.18)NYU Hospitals Center 172 8 4.65 11.33 5.41** ( 2.33,10.66)NYU Winthrop Hospital 202 34 16.83 13.82 16.05 (11.11,22.43)North Shore Univ Hosp 409 65 15.89 13.23 15.84 (12.22,20.19)Rochester General Hosp 345 66 19.13 13.90 18.15* (14.03,23.09)Southside Hospital 165 10 6.06 12.05 6.63** ( 3.17,12.19)St. Elizabeth Med Ctr 161 17 10.56 13.78 10.10 ( 5.88,16.17)St. Francis Hospital 468 71 15.17 13.52 14.79 (11.55,18.66)St. Josephs Hospital 373 41 10.99 14.65 9.89 ( 7.10,13.42)St. Peters Hospital 328 19 5.79 12.78 5.98** ( 3.60, 9.33)Staten Island Univ Hosp 172 29 16.86 13.93 15.95 (10.68,22.91)Strong Memorial Hosp 194 20 10.31 12.89 10.54 ( 6.44,16.28)UHS-Wilson Med Ctr 134 23 17.16 13.20 17.13 (10.86,25.71)Univ. Hosp-Brooklyn 32 8 25.00 15.08 21.85 ( 9.41,43.06)Univ. Hosp-Stony Brook 285 34 11.93 13.87 11.34 ( 7.85,15.84)Univ. Hosp-Upstate 30 2 6.67 14.42 6.09 ( 0.68,22.00)Vassar Bros. Med Ctr 170 12 7.06 13.59 6.85** ( 3.53,11.96)Westchester Med Ctr 142 16 11.27 12.78 11.62 ( 6.64,18.87)
STATEWIDE TOTAL 7905 1042 13.18
* Risk-adjusted readmission rate significantly higher than the statewide rate based on 95 percent confidence interval. ** Risk-adjusted readmission rate significantly lower than the statewide rate based on 95 percent confidence interval.

19
Figure 2
30-Day Risk-Adjusted Readmission Rates for Isolated CABG in New York State, 2015 Discharges
* Risk-adjusted readmission rate significantly higher than the statewide rate based on 95 percent confidence interval.** Risk-adjusted readmission rate significantly lower than the statewide rate based on 95 percent confidence interval.
0 5 10 15 20 25 30
30.75
50
33.17
43.06
Albany Med. CtrArnot Ogden Med Ctr
Bassett Medical CenterBellevue Hospital Ctr*
Buffalo General HospEllis Hospital
Good Sam - SuffernGood Sam-West Islip*
Lenox Hill HospitalLong Island Jewish MC
Maimonides Medical CtrMercy Hospital
Montefiore - MosesMontefiore - Weiler
Mount Sinai Beth IsraelMount Sinai HospitalMount Sinai St. Lukes
NYP-Brooklyn MethodistNYP-Columbia Presby.
NYP-QueensNYP-Weill Cornell
NYU Hospitals Center**NYU Winthrop HospitalNorth Shore Univ Hosp
Rochester General Hosp*Southside Hospital**St. Elizabeth Med Ctr
St. Francis HospitalSt. Josephs Hospital
St. Peters HospitalStaten Island Univ Hosp
Strong Memorial HospUHS-Wilson Med CtrUniv. Hosp-Brooklyn
Univ. Hosp-Stony BrookUniv. Hosp-Upstate
Vassar Bros. Med Ctr**Westchester Med Ctr
13.18New York State Average
KeyRARRPotential margin of statistical error

20
2013-2015 HOSPITAL OUTCOMES FOR VALVE SURGERYTable 3 and Figure 3 present the combined Valve Only and Valve/CABG surgery results for the 40 hospitals performing these operations in NYS during the years 2013-2015. The table contains, for each hospital, the combined number of Valve Only and Valve/CABG operations resulting in 2013-2015 discharges, the number of in-hospital/30-day deaths, the OMR, the EMR based on the statistical models presented in Appendices 3-4, the RAMR and a 95 percent confidence interval for the RAMR.
As indicated in Table 3, the overall in-hospital/30-day mortality rate for the 22,129 combined Valve Only and Valve/CABG procedures performed at the 40 hospitals was 3.03 percent. The OMRs ranged from 0.00 percent to 11.11 percent. The range of EMRs, which measure patient severity of illness, was 1.33 percent to 4.41 percent.
The RAMRs, which are used to measure performance, ranged from 0.00 percent to 10.88 percent. Five hospitals (Mercy Hospital in Buffalo, St. Elizabeth Medical Center in Utica, Strong Memorial Hospital in Rochester, United Health Services - Wilson in Johnson City and University Hospital - Brooklyn) had RAMRs that were significantly higher than the statewide rate. Four hospital (Long Island Jewish in New Hyde Park, Maimonides Medical Center in Brooklyn, St. Joseph’s Hospital in Syracuse, and Vassar Brothers Medical Center in Poughkeepsie) had RAMRs that were significantly lower than the statewide rate.
Figure 3 provides a visual representation of the data displayed in Table 3. It is interpreted in the same way as Figure 1 described above.
Table 4 presents valve procedures performed at the 40 cardiac surgery hospitals in NYS during 2013-2015. The table contains, for each hospital, the number of valve operations (as defined by eight separate groups: Aortic Valve Replacements, Aortic Valve Repair or Replacements plus CABG, Mitral Valve Replacement, Mitral Valve Replacement plus CABG, Mitral Valve Repair, Mitral Valve Repair
plus CABG, Multiple Valve Surgery and Multiple Valve Surgery plus CABG) resulting in 2013-2015 discharges. In addition to the hospital volumes, the rate of in-hospital/30-day death for the state (Statewide Mortality Rate) is given for each group. Unless otherwise specified, when the report refers to Valve or Valve/CABG procedures it is referring to the last column of Table 4.
The 2013-2015 in-hospital/30-day OMR of 3.03 percent for Valve and Valve/CABG surgeries is lower than the 3.18 percent observed for 2012-2014. The in-hospital OMR for 2013-2015 valve surgeries (not shown in Table 3) is 2.53 percent for the 22,129 patients included in this analysis.
Table 5 presents the results for transcatheter aortic valve replacement (TAVR) procedures performed at the 24 hospitals performing TAVR during the 2013-2015 discharge period. The table contains, for each hospital, the number of TAVR procedures resulting in 2013-2015 discharges, the number of in-hospital/30-day deaths, the OMR, the EMR based on the statistical model presented in Appendix 5, the RAMR and a 95 percent confidence interval for the RAMR. Please note, some hospitals listed in Table 5 began performing the procedure during the 2013-2015 reporting period and the number of cases listed does not represent a full three year’s program activity. Other hospitals have begun performing the procedure more recently.
As indicated in Table 5, the overall in-hospital/30-day mortality rate for the 5,554 TAVR procedures performed at the 24 hospitals was 4.75 percent. The OMRs ranged from 0.00 percent to 8.41 percent. The range of EMRs, which measure patient severity of illness, was 3.44 percent to 7.45 percent.
The RAMRs, which are used to measure performance, ranged from 0.00 percent to 8.07 percent. One hospital (Mt. Sinai Hospital in Manhattan) had a RAMR that was statistically higher than the statewide rate. One hospital (NY Presbyterian at Columbia in Manhattan) had a RAMR that was statistically lower than the statewide rate.

21
Table 3
In-hospital/30-Day Observed, Expected, and Risk-Adjusted Mortality Rates for Valve or Valve/CABG Surgery in New York State, 2013 - 2015 Discharges
Hospital Cases Deaths OMR EMR RAMR 95% CI for RAMR
Albany Med. Ctr 668 27 4.04 2.89 4.25 (2.80, 6.18)Arnot Ogden Med Ctr 66 2 3.03 1.80 5.12 (0.57,18.47)Bassett Medical Center 137 4 2.92 2.23 3.97 (1.07,10.16)Bellevue Hospital Ctr 244 3 1.23 2.08 1.79 (0.36, 5.24)Buffalo General Hosp 779 21 2.70 2.46 3.32 (2.05, 5.08)Champ.Valley Phys Hosp 21 1 4.76 1.33 10.88 (0.14,60.52)Ellis Hospital 284 9 3.17 2.61 3.68 (1.68, 6.99)Erie County Med Ctr 4 0 0.00 1.89 0.00 (0.00,100.0)Good Sam - Suffern 132 6 4.55 2.68 5.15 (1.88,11.20)Good Sam-West Islip 147 4 2.72 2.75 3.01 (0.81, 7.69)Lenox Hill Hospital 444 12 2.70 2.50 3.28 (1.69, 5.74)Long Island Jewish MC 416 6 1.44 3.75 1.16 ** (0.43, 2.54)Maimonides Medical Ctr 461 11 2.39 4.41 1.64 ** (0.82, 2.93)Mercy Hospital 538 25 4.65 2.27 6.21 * (4.02, 9.17)Montefiore - Moses 448 21 4.69 3.60 3.95 (2.44, 6.04)Montefiore - Weiler 340 12 3.53 4.09 2.62 (1.35, 4.57)Mount Sinai Beth Israel 229 13 5.68 3.06 5.63 (3.00, 9.63)Mount Sinai Hospital 2151 51 2.37 3.09 2.33 (1.73, 3.06)Mount Sinai St. Lukes 275 6 2.18 2.67 2.48 (0.91, 5.40)NYP-Brooklyn Methodist 180 2 1.11 3.68 0.92 (0.10, 3.30)NYP-Columbia Presby. 2103 55 2.62 3.17 2.50 (1.88, 3.25)NYP-Queens 101 3 2.97 2.38 3.79 (0.76,11.07)NYP-Weill Cornell 1200 28 2.33 3.08 2.30 (1.53, 3.32)NYU Hospitals Center 1330 25 1.88 1.86 3.07 (1.99, 4.53)NYU Winthrop Hospital 517 12 2.32 3.05 2.30 (1.19, 4.02)North Shore Univ Hosp 879 26 2.96 3.53 2.54 (1.66, 3.72)Rochester General Hosp 1081 39 3.61 3.28 3.33 (2.37, 4.55)Southside Hospital 362 12 3.31 3.64 2.76 (1.43, 4.83)St. Elizabeth Med Ctr 288 15 5.21 2.31 6.82 * (3.82,11.25)St. Francis Hospital 1474 52 3.53 3.18 3.36 (2.51, 4.41)St. Josephs Hospital 1356 35 2.58 3.61 2.17 ** (1.51, 3.02)St. Peters Hospital 869 33 3.80 3.09 3.73 (2.57, 5.24)Staten Island Univ Hosp 171 4 2.34 2.78 2.55 (0.69, 6.53)Strong Memorial Hosp 629 30 4.77 2.54 5.69 * (3.84, 8.12)UHS-Wilson Med Ctr 230 14 6.09 2.06 8.96 * (4.89,15.03)Univ. Hosp-Brooklyn 90 10 11.11 3.24 10.41 * (4.98,19.14)Univ. Hosp-Stony Brook 669 25 3.74 3.33 3.40 (2.20, 5.02)Univ. Hosp-Upstate 71 3 4.23 2.43 5.27 (1.06,15.40)Vassar Bros. Med Ctr 436 5 1.15 2.76 1.26 ** (0.41, 2.94)Westchester Med Ctr 309 9 2.91 3.64 2.43 (1.11, 4.61)
STATEWIDE TOTAL 22129 671 3.03
* Risk-adjusted mortality rate significantly higher than the statewide rate based on 95 percent confidence interval. ** Risk-adjusted mortality rate significantly lower than the statewide rate based on 95 percent confidence interval.

22
0 2 4 6 8 10 12 141 3 5 7 9 11 13 15 30
26.2060.52
100.0
19.14
15.40
3.03New York State Average
KeyRAMRPotential margin of statistical error
18.47Albany Med. Ctr
Arnot Ogden Med CtrBassett Medical Center
Bellevue Hospital CtrBuffalo General Hosp
Champ.Valley Phys HospEllis Hospital
Erie County Med CtrGood Sam - Suffern
Good Sam-West IslipLenox Hill Hospital
Long Island Jewish MC**Maimonides Medical Ctr**
Mercy Hospital*Montefiore - MosesMontefiore - Weiler
Mount Sinai Beth IsraelMount Sinai HospitalMount Sinai St. Lukes
NYP-Brooklyn MethodistNYP-Columbia Presby.
NYP-QueensNYP-Weill Cornell
NYU Hospitals CenterNYU Winthrop HospitalNorth Shore Univ Hosp
Rochester General HospSouthside Hospital
St. Elizabeth Med Ctr*St. Francis Hospital
St. Josephs Hospital**St. Peters Hospital
Staten Island Univ HospStrong Memorial Hosp*
UHS-Wilson Med Ctr*Univ. Hosp-Brooklyn*
Univ. Hosp-Stony BrookUniv. Hosp-Upstate
Vassar Bros. Med Ctr**Westchester Med Ctr
Figure 3
In-Hospital/30-Day Risk-Adjusted Mortality Rates for Valve or Valve/ CABG Surgery in New York State, 2013-2015 Discharges
* Risk-adjusted mortality rate significantly higher than the statewide rate based on 95 percent confidence interval.** Risk-adjusted mortality rate significantly lower than the statewide rate based on 95 percent confidence interval.

23
Table 4
Hospital Volume for Valve Surgery in New York State, 2013-2015 Discharges
Hospital Aortic Aortic Mitral Mitral Mitral Mitral Multiple Multiple Total Valve Valve Valve Replace Valve Repair Valve Valve Valve or Replace and Replace and Repair and Surgery and Valve/ Surgery CABG Surgery CABG Surgery CABG CABG CABG
Albany Med. Ctr 255 144 41 12 86 33 72 25 668Arnot Ogden Med Ctr 27 26 2 1 7 0 3 0 66Bassett Medical Center 58 54 2 2 4 6 4 7 137Bellevue Hospital Ctr 97 13 70 5 12 3 39 5 244Buffalo General Hosp 307 240 71 25 68 29 18 21 779Champ.Valley Phys Hosp 14 7 0 0 0 0 0 0 21Ellis Hospital 113 96 18 13 14 11 12 7 284Erie County Med Ctr 0 2 0 0 1 0 1 0 4Good Sam - Suffern 39 42 13 4 16 6 6 6 132Good Sam-West Islip 51 44 4 5 11 15 12 5 147Lenox Hill Hospital 137 47 66 8 98 18 61 9 444Long Island Jewish MC 103 73 43 20 68 30 59 20 416Maimonides Medical Ctr 132 77 105 32 19 13 78 5 461Mercy Hospital 198 152 51 27 72 5 28 5 538Montefiore - Moses 132 66 83 30 38 22 63 14 448Montefiore - Weiler 82 61 63 22 17 34 43 18 340Mount Sinai Beth Israel 62 45 26 12 19 14 37 14 229Mount Sinai Hospital 449 157 42 12 199 81 1056 155 2151Mount Sinai St. Lukes 46 39 26 9 76 32 36 11 275NYP-Brooklyn Methodist 63 29 33 9 5 2 32 7 180NYP-Columbia Presby. 807 373 213 60 260 71 265 54 2103NYP-Queens 41 22 21 4 6 4 2 1 101NYP-Weill Cornell 479 185 122 34 136 23 180 41 1200NYU Hospitals Center 488 102 84 13 436 27 164 16 1330NYU Winthrop Hospital 177 91 81 38 47 35 24 24 517North Shore Univ Hosp 302 181 118 41 66 28 115 28 879Rochester General Hosp 410 257 71 26 121 79 74 43 1081Southside Hospital 106 76 37 16 45 19 46 17 362St. Elizabeth Med Ctr 91 78 19 12 33 25 21 9 288St. Francis Hospital 536 305 93 30 172 88 180 70 1474St. Josephs Hospital 402 278 101 59 211 74 152 79 1356St. Peters Hospital 282 248 36 23 53 57 116 54 869Staten Island Univ Hosp 70 36 20 14 19 1 8 3 171Strong Memorial Hosp 271 140 60 8 90 13 35 12 629UHS-Wilson Med Ctr 110 77 16 5 7 3 7 5 230Univ. Hosp-Brooklyn 25 10 20 3 6 8 16 2 90Univ. Hosp-Stony Brook 234 189 47 22 53 39 54 31 669Univ. Hosp-Upstate 30 13 9 3 7 3 5 1 71Vassar Bros. Med Ctr 155 121 54 19 32 13 24 18 436Westchester Med Ctr 93 69 34 20 26 20 36 11 309
Total 7474 4265 2015 698 2656 984 3184 853 22129
STATEWIDE MORTALITY RATE (%) 1.81 2.95 3.92 8.45 0.72 3.35 4.93 7.39 3.03

24
Table 5
In-hospital/30-Day Observed, Expected and Risk-Adjusted Mortality Rates for TAVR in New York State, 2013-2015 Discharges (Listed Alphabetically by Hospital)
Hospital Cases Deaths OMR EMR RAMR 95% CI for RAMR
Albany Med. Ctr 339 13 3.83 4.19 4.35 (2.31, 7.44)
Buffalo General Hosp 238 9 3.78 4.52 3.97 (1.81, 7.55)
Lenox Hill Hospital 128 8 6.25 4.91 6.05 (2.60,11.92)
Long Island Jewish MC 141 5 3.55 4.94 3.41 (1.10, 7.96)
Maimonides Medical Ctr 151 7 4.64 4.16 5.29 (2.12,10.90)
Mercy Hospital 7 0 0.00 5.40 0.00 (0.00,46.14)
Montefiore - Moses 115 7 6.09 5.24 5.52 (2.21,11.38)
Montefiore - Weiler 17 1 5.88 3.47 8.07 (0.11,44.88)
Mount Sinai Hospital 452 33 7.30 4.78 7.26 * (4.99,10.19)
NYP-Brooklyn Methodist 40 3 7.50 4.73 7.54 (1.52,22.04)
NYP-Columbia Presby. 959 34 3.55 5.63 2.99 ** (2.07, 4.18)
NYP-Weill Cornell 329 16 4.86 4.31 5.37 (3.06, 8.71)
NYU Hospitals Center 322 12 3.73 3.44 5.15 (2.66, 8.99)
NYU Winthrop Hospital 537 20 3.72 4.45 3.97 (2.43, 6.14)
North Shore Univ Hosp 323 16 4.95 4.77 4.94 (2.82, 8.02)
Rochester General Hosp 4 0 0.00 7.45 0.00 (0.00,58.52)
Southside Hospital 116 4 3.45 3.79 4.33 (1.16,11.08)
St. Francis Hospital 542 26 4.80 4.87 4.68 (3.06, 6.86)
St. Josephs Hospital 278 18 6.47 4.74 6.50 (3.85,10.27)
St. Peters Hospital 68 5 7.35 4.33 8.07 (2.60,18.84)
Strong Memorial Hosp 159 13 8.18 5.20 7.47 (3.97,12.78)
UHS-Wilson Med Ctr 38 0 0.00 4.19 0.00 (0.00,10.94)
Univ. Hosp-Stony Brook 107 9 8.41 4.99 8.01 (3.66,15.21)
Westchester Med Ctr 144 5 3.47 5.55 2.97 (0.96, 6.94)
STATEWIDE TOTAL 5554 264 4.75
* Risk-adjusted mortality rate significantly higher than the statewide rate based on 95 percent confidence interval. ** Risk-adjusted mortality rate significantly lower than the statewide rate based on 95 percent confidence interval.

25
Table 6
In-Hospital / 30-Day Observed, Expected and Risk-Adjusted Mortality Rates by Surgeon for Isolated CABG and Valve Surgery (done in combination with or without CABG) in New York State, 2013-2015 Discharges
Isolated CABG Isolated CABG, or Valve or Valve/CABG No of 95% CI Cases Deaths OMR EMR RAMR for RAMR Cases RAMR
STATEWIDE TOTAL 24466 377 1.54 46595 2.25
Albany Med. Ctr #Akujuo A C 172 2 1.16 1.48 1.21 (0.14, 4.37) 268 3.76 Bennett E 36 1 2.78 1.28 3.35 (0.04,18.62) 220 3.28 Britton L 103 0 0.00 1.46 0.00 (0.00, 3.75) 234 1.38 Depan H 174 2 1.15 2.66 0.67 (0.07, 2.41) 347 2.41 Devejian N . . . . . ( . , . ) 1 0.00 Miller S 169 2 1.18 2.02 0.90 (0.10, 3.27) 244 1.46 All Others 62 2 3.23 1.16 4.30 (0.48,15.51) 70 4.32 Total 716 9 1.26 1.85 1.05 (0.48, 1.99) 1384 2.49
Arnot Ogden Med Ctr #Hoffman D 63 1 1.59 0.83 2.96 (0.04,16.46) 80 2.80 Metzdorff M T 80 2 2.50 0.86 4.49 (0.50,16.20) 100 6.44 All Others 86 2 2.33 1.17 3.07 (0.34,11.07) 115 4.36 Total 229 5 2.18 0.97 3.48 (1.12, 8.12) 295 4.63
2013-2015 HOSPITAL AND SURGEON OUTCOMESTable 6 provides the number of Isolated CABG operations, number of CABG patients who died in the hospital or after discharge but within 30 days of surgery, OMR, EMR, RAMR and the 95 percent confidence interval for the RAMR for Isolated CABG patients in 2013-2015. In addition, the final two columns provide the number of Isolated CABG, Valve and Valve/CABG procedures and the RAMR for these patients in 2013-2015 for each of the 40 hospitals performing these operations during the time period. Surgeons and hospitals with RAMRs that are significantly lower or higher than the statewide mortality rate (as judged by the 95 percent confidence interval) are also noted.
The hospital information is presented for each surgeon who met at least one of the following criteria: (a) performed 200 or more cardiac operations during 2013-2015, (b) performed at least one cardiac operation in each of the years, 2013-2015. A cardiac operation is defined as any reportable adult cardiac operation and may include cases not listed in Tables 6 or 7.
The results for surgeons not meeting either of the above criteria are grouped together and reported as “All Others” in the hospital in which the operations were performed. Surgeons who met the above criteria and who performed operations in more than one hospital during 2013-2015 are noted in Table 6 and listed under all hospitals in which they performed these operations; their results are also listed separately in Table 7. This table contains the same information as Table 6 across all hospitals in which the surgeon performed operations.

26
Table 6 continued Isolated CABG Isolated CABG, or Valve or Valve/CABG No of 95% CI Cases Deaths OMR EMR RAMR for RAMR Cases RAMR
Bassett Medical Center #Choumarov K 1 0 0.00 0.70 0.00 (0.00,100.0) 1 0.00 Kelley J 158 2 1.27 1.18 1.65 (0.18, 5.95) 248 2.21 All Others 102 1 0.98 1.29 1.17 (0.02, 6.51) 149 3.10 Total 261 3 1.15 1.22 1.45 (0.29, 4.23) 398 2.52
Bellevue Hospital Ctr #Balsam L B 121 1 0.83 1.07 1.19 (0.02, 6.61) 244 1.19 ##Culliford A 56 2 3.57 0.98 5.61 (0.63,20.25) 91 4.26 ##Deanda A 67 0 0.00 1.11 0.00 (0.00, 7.59) 115 0.00 #Grossi E 1 0 0.00 0.35 0.00 (0.00,100.0) 1 0.00 ##Loulmet D F . . . . . ( . , . ) 4 100.00 ##Zias E 1 0 0.00 5.02 0.00 (0.00,100.0) 1 0.00 All Others 62 0 0.00 0.96 0.00 (0.00, 9.54) 96 0.00 Total 308 3 0.97 1.05 1.43 (0.29, 4.17) 552 1.62
Buffalo General Hosp Aldridge J 189 7 3.70 1.54 3.70 (1.48, 7.62) 210 5.49 * #Ashraf M 607 12 1.98 1.28 2.38 (1.23, 4.15) 740 2.99 ##Downing S W 7 1 14.29 1.05 20.95 (0.27,100.0) 9 8.39 Grosner G 568 8 1.41 1.29 1.68 (0.72, 3.30) 1191 2.45 Total 1371 28 2.04 1.32 2.38 * (1.58, 3.44) 2150 2.96
Champ.Valley Phys Hosp #Cahill A T 46 1 2.17 0.82 4.07 (0.05,22.64) 66 6.90 All Others 21 1 4.76 0.73 10.11 (0.13,56.25) 22 14.24 Total 67 2 2.99 0.79 5.80 (0.65,20.95) 88 8.33
Ellis Hospital #Choumarov K 217 3 1.38 1.59 1.34 (0.27, 3.92) 279 2.16 Reich H 122 2 1.64 1.58 1.60 (0.18, 5.78) 249 2.27 Singh C 229 2 0.87 1.59 0.85 (0.10, 3.06) 324 2.16 Total 568 7 1.23 1.59 1.20 (0.48, 2.47) 852 2.19
Erie County Med Ctr ##Downing S W 22 0 0.00 1.05 0.00 (0.00,24.37) 26 0.00 Total 22 0 0.00 1.05 0.00 (0.00,24.37) 26 0.00
Good Sam - Suffern Elmann E M 44 0 0.00 1.93 0.00 (0.00, 6.64) 83 2.23 #Lundy E F 30 1 3.33 2.52 2.04 (0.03,11.34) 38 2.17 Somberg E D 140 1 0.71 0.99 1.11 (0.01, 6.19) 176 4.01 All Others 99 3 3.03 1.28 3.65 (0.73,10.67) 148 3.60 Total 313 5 1.60 1.36 1.81 (0.58, 4.22) 445 3.17
Good Sam-West Islip #Lamendola C 147 4 2.72 1.49 2.81 (0.76, 7.19) 248 3.86 #Rovensky M 202 0 0.00 1.10 0.00 (0.00, 2.55) 248 0.00 ** All Others 1 0 0.00 0.65 0.00 (0.00,100.0) 1 0.00 Total 350 4 1.14 1.26 1.40 (0.38, 3.57) 497 2.13

27
Table 6 continued Isolated CABG Isolated CABG, or Valve or Valve/CABG No of 95% CI Cases Deaths OMR EMR RAMR for RAMR Cases RAMR
Lenox Hill Hospital ##Galloway A 2 0 0.00 1.08 0.00 (0.00,100.0) 9 0.00 Hemli J M 24 1 4.17 1.05 6.12 (0.08,34.07) 25 8.19 ##Loulmet D F 3 0 0.00 0.92 0.00 (0.00,100.0) 7 0.00 Patel N C 625 10 1.60 1.42 1.74 (0.83, 3.20) 877 2.51 #Scheinerman S J 37 2 5.41 1.23 6.79 (0.76,24.50) 62 4.34 ##Zias E . . . . . ( . , . ) 1 0.00 All Others 67 3 4.48 2.14 3.22 (0.65, 9.41) 221 3.42 Total 758 16 2.11 1.46 2.23 (1.27, 3.62) 1202 2.84
Long Island Jewish MC #Graver L 180 3 1.67 2.20 1.17 (0.23, 3.41) 427 0.97 ** ##Hartman A 3 0 0.00 0.58 0.00 (0.00,100.0) 7 0.00 Meyer D B . . . . . ( . , . ) 2 0.00 #Palazzo R 184 0 0.00 1.42 0.00 (0.00, 2.16) 248 0.46 #Scheinerman S J 103 2 1.94 2.01 1.48 (0.17, 5.36) 201 1.69 All Others 2 0 0.00 1.40 0.00 (0.00,100.0) 3 0.00 Total 472 5 1.06 1.84 0.89 (0.29, 2.07) 888 1.02 **
Maimonides Medical Ctr Abrol S 113 3 2.65 2.33 1.75 (0.35, 5.12) 203 0.84 Crooke G 99 1 1.01 1.61 0.97 (0.01, 5.39) 160 0.54 Jacobowitz I 234 1 0.43 2.09 0.31 (0.00, 1.75) 340 0.90 Ribakove G 93 2 2.15 1.79 1.85 (0.21, 6.69) 185 2.95 Saunders P 63 1 1.59 1.94 1.26 (0.02, 7.03) 77 2.65 Stephens G A 15 1 6.67 3.87 2.65 (0.03,14.75) 44 4.88 #Tak V M 2 1 50.00 8.03 9.60 (0.13,53.39) 6 8.66 Vaynblat M 127 3 2.36 1.69 2.16 (0.43, 6.30) 192 1.75 Total 746 13 1.74 2.00 1.34 (0.72, 2.30) 1207 1.53
Mercy Hospital Adkins M 217 3 1.38 1.59 1.34 (0.27, 3.91) 270 3.03 #Ashraf M 1 0 0.00 0.46 0.00 (0.00,100.0) 1 0.00 Bell-Thomson J 351 8 2.28 1.33 2.64 (1.14, 5.21) 686 4.29 * ##Downing S W 433 8 1.85 1.59 1.79 (0.77, 3.53) 572 3.33 All Others 47 0 0.00 1.23 0.00 (0.00, 9.74) 58 0.00 Total 1049 19 1.81 1.49 1.88 (1.13, 2.93) 1587 3.56 *
Montefiore - Moses #Bello R A 11 1 9.09 3.92 3.57 (0.05,19.87) 13 4.54 #D Alessandro D A 195 2 1.03 1.55 1.02 (0.11, 3.69) 329 2.07 #Derose J J 7 0 0.00 1.30 0.00 (0.00,61.99) 11 11.30 #Goldstein D J 138 0 0.00 1.11 0.00 (0.00, 3.69) 246 2.04 #Jakobleff W A 144 2 1.39 1.62 1.32 (0.15, 4.78) 184 4.17 #Michler R E 75 1 1.33 1.31 1.57 (0.02, 8.74) 231 1.93 Weinstein S . . . . . ( . , . ) 2 0.00 All Others 1 0 0.00 0.28 0.00 (0.00,100.0) 3 0.00 Total 571 6 1.05 1.47 1.10 (0.40, 2.40) 1019 2.48

28
Table 6 continued Isolated CABG Isolated CABG, or Valve or Valve/CABG No of 95% CI Cases Deaths OMR EMR RAMR for RAMR Cases RAMR
Montefiore - Weiler #Bello R A 201 2 1.00 1.51 1.02 (0.11, 3.67) 294 1.98 #D Alessandro D A 1 0 0.00 0.37 0.00 (0.00,100.0) 3 0.00 #Derose J J 298 3 1.01 1.23 1.26 (0.25, 3.69) 499 1.90 #Goldstein D J 54 2 3.70 1.11 5.15 (0.58,18.60) 84 3.15 #Jakobleff W A 2 0 0.00 0.38 0.00 (0.00,100.0) 3 0.00 #Michler R E 2 0 0.00 0.70 0.00 (0.00,100.0) 15 0.00 All Others 11 1 9.09 2.23 6.28 (0.08,34.92) 11 9.16 Total 569 8 1.41 1.33 1.63 (0.70, 3.21) 909 2.10
Mount Sinai Beth Israel ##Culliford A . . . . . ( . , . ) 3 45.24 ##Deanda A . . . . . ( . , . ) 1 0.00 ##Galloway A . . . . . ( . , . ) 1 0.00 #Hoffman D 84 1 1.19 1.33 1.38 (0.02, 7.67) 109 2.12 ##Loulmet D F . . . . . ( . , . ) 1 0.00 #Puskas J D 188 4 2.13 1.14 2.86 (0.77, 7.33) 276 3.72 ##Tranbaugh R 252 2 0.79 1.35 0.90 (0.10, 3.26) 344 2.82 ##Zias E 1 0 0.00 0.45 0.00 (0.00,100.0) 5 0.00 All Others 32 1 3.13 2.79 1.72 (0.02, 9.59) 46 4.14 Total 557 8 1.44 1.36 1.63 (0.70, 3.20) 786 3.24
Mount Sinai Hospital Adams D H 8 0 0.00 1.13 0.00 (0.00,62.51) 1041 0.52 ** Anyanwu A C 57 1 1.75 1.20 2.26 (0.03,12.57) 159 4.10 Boateng P 19 0 0.00 0.75 0.00 (0.00,39.70) 59 3.27 #Chikwe J Y 143 5 3.50 1.09 4.96 * (1.60,11.57) 225 3.47 El-Eshmawi A M 7 0 0.00 0.65 0.00 (0.00,100.0) 34 5.95 Filsoufi F 279 2 0.72 1.08 1.02 (0.12, 3.70) 412 2.67 #Puskas J D 42 0 0.00 1.09 0.00 (0.00,12.36) 47 0.00 Reddy R C 263 2 0.76 1.76 0.67 (0.07, 2.40) 387 1.14 Stelzer P 42 0 0.00 0.92 0.00 (0.00,14.67) 330 1.50 #Stewart A S 89 3 3.37 1.39 3.73 (0.75,10.89) 283 3.90 Tannous H J 65 0 0.00 0.98 0.00 (0.00, 8.83) 103 0.00 Varghese R 84 2 2.38 0.96 3.80 (0.43,13.73) 152 2.34 All Others 22 0 0.00 2.09 0.00 (0.00,12.30) 39 1.93 Total 1120 15 1.34 1.26 1.63 (0.91, 2.70) 3271 1.84
Mount Sinai St. Lukes Balaram S K 114 1 0.88 2.69 0.50 (0.01, 2.79) 176 1.22 #Chikwe J Y 49 0 0.00 0.99 0.00 (0.00,11.71) 91 1.50 #Swistel D 190 4 2.11 1.90 1.70 (0.46, 4.36) 361 2.10 Total 353 5 1.42 2.03 1.07 (0.35, 2.51) 628 1.70
NYP-Brooklyn Methodist #Gulkarov I M 146 1 0.68 1.48 0.71 (0.01, 3.97) 247 0.71 Tortolani A 105 2 1.90 1.28 2.29 (0.26, 8.25) 159 2.24 ##Tranbaugh R 14 0 0.00 1.21 0.00 (0.00,33.40) 18 0.00 #Worku B M 42 0 0.00 2.68 0.00 (0.00, 5.02) 63 0.00 Total 307 3 0.98 1.56 0.96 (0.19, 2.81) 487 0.98

29
Table 6 continued Isolated CABG Isolated CABG, or Valve or Valve/CABG No of 95% CI Cases Deaths OMR EMR RAMR for RAMR Cases RAMR
NYP-Columbia Presby. Argenziano M 215 0 0.00 1.11 0.00 (0.00, 2.38) 521 0.90 Bacchetta M D . . . . . ( . , . ) 1 0.00 #Bacha E . . . . . ( . , . ) 4 0.00 Borger M A 19 0 0.00 3.24 0.00 (0.00, 9.18) 137 1.77 #Chai P J . . . . . ( . , . ) 3 0.00 George I 129 3 2.33 2.18 1.64 (0.33, 4.80) 290 2.66 Naka Y 253 3 1.19 1.52 1.20 (0.24, 3.52) 450 1.84 Quaegebeur J . . . . . ( . , . ) 2 0.00 Smith C 167 0 0.00 1.26 0.00 (0.00, 2.69) 794 2.17 #Stewart A S 45 1 2.22 2.37 1.44 (0.02, 8.04) 153 2.84 Takayama H 333 6 1.80 2.33 1.19 (0.43, 2.59) 596 1.64 #Williams M R 21 0 0.00 1.07 0.00 (0.00,25.20) 316 0.79 ** All Others 19 1 5.26 2.22 3.65 (0.05,20.33) 37 2.23 Total 1201 14 1.17 1.77 1.02 (0.55, 1.70) 3304 1.76 **
NYP-Queens #Lang S 261 2 0.77 0.91 1.30 (0.15, 4.70) 360 2.37 All Others 7 0 0.00 0.75 0.00 (0.00,100.0) 9 0.00 Total 268 2 0.75 0.90 1.27 (0.14, 4.60) 369 2.33
NYP-Weill Cornell #Bacha E . . . . . ( . , . ) 5 0.00 #Chai P J . . . . . ( . , . ) 3 0.00 Girardi L 273 1 0.37 1.19 0.48 (0.01, 2.64) 962 1.63 #Gulkarov I M 5 0 0.00 3.37 0.00 (0.00,33.53) 9 0.00 Isom O 3 0 0.00 0.55 0.00 (0.00,100.0) 25 0.00 Krieger K 188 3 1.60 1.63 1.51 (0.30, 4.41) 546 1.77 #Lang S 8 0 0.00 0.83 0.00 (0.00,85.46) 20 0.00 Salemi A 72 0 0.00 1.23 0.00 (0.00, 6.36) 169 1.20 ##Tranbaugh R . . . . . ( . , . ) 1 0.00 #Worku B M . . . . . ( . , . ) 1 0.00 All Others 15 1 6.67 3.23 3.19 (0.04,17.72) 23 5.47 Total 564 5 0.89 1.41 0.97 (0.31, 2.27) 1764 1.65
NYU Hospitals Center #Balsam L B 2 0 0.00 0.67 0.00 (0.00,100.0) 8 5.31 ##Culliford A 48 0 0.00 0.66 0.00 (0.00,17.80) 101 1.34 ##Deanda A 5 0 0.00 0.40 0.00 (0.00,100.0) 21 0.00 ##Galloway A 64 0 0.00 0.85 0.00 (0.00,10.43) 549 2.62 #Grossi E 6 0 0.00 0.68 0.00 (0.00,100.0) 14 0.00 ##Loulmet D F 57 0 0.00 0.71 0.00 (0.00,13.89) 431 1.69 Malhotra S P . . . . . ( . , . ) 2 0.00 Mosca R S . . . . . ( . , . ) 5 0.00 #Swistel D 10 0 0.00 1.04 0.00 (0.00,54.32) 30 0.00 #Williams M R 8 0 0.00 1.02 0.00 (0.00,69.35) 88 4.94 ##Zias E 272 3 1.10 0.91 1.87 (0.37, 5.45) 544 1.52 All Others 15 0 0.00 0.93 0.00 (0.00,40.39) 24 5.21 Total 487 3 0.62 0.85 1.12 (0.22, 3.26) 1817 2.18

30
Table 6 continued Isolated CABG Isolated CABG, or Valve or Valve/CABG No of 95% CI Cases Deaths OMR EMR RAMR for RAMR Cases RAMR
NYU Winthrop Hospital Goncalves J A 132 2 1.52 1.44 1.62 (0.18, 5.86) 331 2.07 Kokotos W J 170 2 1.18 1.23 1.47 (0.17, 5.31) 326 1.07 Salhab K F 124 1 0.81 1.48 0.84 (0.01, 4.68) 156 2.37 Schubach S 167 0 0.00 1.30 0.00 (0.00, 2.61) 289 0.97 All Others 31 0 0.00 1.38 0.00 (0.00,13.18) 39 2.95 Total 624 5 0.80 1.35 0.92 (0.29, 2.14) 1141 1.58
North Shore Univ Hosp Esposito R 241 2 0.83 1.31 0.97 (0.11, 3.51) 425 1.87 ##Fernandez H A . . . . . ( . , . ) 1 0.00 #Graver L 53 1 1.89 3.59 0.81 (0.01, 4.51) 113 0.55 Hall M 109 1 0.92 2.66 0.53 (0.01, 2.95) 183 1.60 ##Hartman A 76 0 0.00 1.17 0.00 (0.00, 6.34) 278 1.42 #Kalimi R 83 2 2.41 1.87 1.98 (0.22, 7.15) 186 1.61 #Palazzo R 40 0 0.00 1.18 0.00 (0.00,11.99) 60 2.30 #Pogo G 100 4 4.00 1.86 3.31 (0.89, 8.48) 166 4.60 ##Taylor J 13 0 0.00 0.60 0.00 (0.00,72.40) 22 0.00 Vatsia S 174 5 2.87 1.35 3.28 (1.06, 7.65) 295 2.54 Yu P J 66 0 0.00 1.62 0.00 (0.00, 5.28) 104 2.24 All Others 7 0 0.00 0.78 0.00 (0.00,100.0) 8 0.00 Total 962 15 1.56 1.69 1.42 (0.79, 2.34) 1841 1.95
Rochester General Hosp Cheeran D 486 8 1.65 1.82 1.39 (0.60, 2.74) 919 2.11 Kirshner R 424 5 1.18 1.42 1.28 (0.41, 2.99) 1051 2.56 All Others 67 2 2.99 1.32 3.48 (0.39,12.56) 88 3.46 Total 977 15 1.54 1.61 1.47 (0.82, 2.42) 2058 2.37
Southside Hospital ##Fernandez H A 6 0 0.00 1.26 0.00 (0.00,74.90) 12 0.00 ##Hartman A 40 2 5.00 1.80 4.27 (0.48,15.43) 153 3.32 #Kalimi R 215 3 1.40 1.82 1.18 (0.24, 3.46) 369 1.39 Manetta F 184 1 0.54 1.75 0.48 (0.01, 2.66) 254 0.86 #Pogo G 32 1 3.13 1.36 3.54 (0.05,19.70) 46 5.69 ##Taylor J 1 0 0.00 0.47 0.00 (0.00,100.0) 1 0.00 All Others 15 1 6.67 2.47 4.16 (0.05,23.13) 20 8.12 Total 493 8 1.62 1.77 1.41 (0.61, 2.78) 855 2.05
St. Elizabeth Med Ctr #Akujuo A C 5 0 0.00 0.97 0.00 (0.00,100.0) 11 12.33 #Cahill A T 10 0 0.00 1.30 0.00 (0.00,43.51) 12 0.00 El Amir N 206 4 1.94 1.31 2.29 (0.62, 5.86) 319 3.55 Joyce F 315 7 2.22 1.40 2.45 (0.98, 5.04) 476 4.69 * All Others 21 2 9.52 1.53 9.57 (1.07,34.54) 27 8.72 Total 557 13 2.33 1.36 2.63 (1.40, 4.51) 845 4.41 *

31
Table 6 continued Isolated CABG Isolated CABG, or Valve or Valve/CABG No of 95% CI Cases Deaths OMR EMR RAMR for RAMR Cases RAMR
St. Francis Hospital Bercow N 470 14 2.98 2.00 2.29 (1.25, 3.85) 806 2.96 Colangelo R 603 8 1.33 1.30 1.57 (0.67, 3.09) 1136 2.21 #Lamendola C 118 1 0.85 1.60 0.82 (0.01, 4.54) 210 2.35 #Lundy E F 192 4 2.08 2.32 1.38 (0.37, 3.54) 271 1.96 Robinson N 135 3 2.22 1.48 2.31 (0.46, 6.75) 554 2.87 #Rovensky M 34 0 0.00 2.42 0.00 (0.00, 6.88) 44 0.00 All Others 70 2 2.86 2.77 1.59 (0.18, 5.73) 75 2.17 Total 1622 32 1.97 1.75 1.74 (1.19, 2.45) 3096 2.51
St. Josephs Hospital Green G R 233 4 1.72 1.67 1.59 (0.43, 4.07) 530 1.31 Lutz C J 238 4 1.68 1.84 1.41 (0.38, 3.60) 570 1.50 Marvasti M 160 1 0.63 2.64 0.37 (0.00, 2.03) 347 0.96 Nazem A 264 2 0.76 1.55 0.75 (0.08, 2.72) 493 2.02 Zhou Z 274 6 2.19 1.66 2.03 (0.74, 4.42) 585 2.21 Total 1169 17 1.45 1.81 1.24 (0.72, 1.98) 2525 1.67 **
St. Peters Hospital Edwards N 165 2 1.21 0.92 2.03 (0.23, 7.31) 413 2.81 Karavas A N 352 3 0.85 1.29 1.02 (0.20, 2.98) 424 1.78 Saifi J 160 2 1.25 2.02 0.95 (0.11, 3.45) 505 3.04 Terrien C M 310 5 1.61 1.52 1.64 (0.53, 3.82) 514 1.92 Total 987 12 1.22 1.42 1.32 (0.68, 2.31) 1856 2.48
Staten Island Univ Hosp McGinn J 308 6 1.95 1.53 1.97 (0.72, 4.28) 427 2.33 Rosell F M 259 0 0.00 1.68 0.00 ** (0.00, 1.30) 298 0.78 Wohler A M 49 3 6.12 1.56 6.04 (1.21,17.65) 62 6.19 All Others 3 1 33.33 0.79 65.27 (0.85,100.0) 3 95.27 Total 619 10 1.62 1.59 1.57 (0.75, 2.88) 790 2.16
Strong Memorial Hosp Alfieris G . . . . . ( . , . ) 2 0.00 Gensini P F . . . . . ( . , . ) 9 0.00 Hicks G 89 3 3.37 1.57 3.31 (0.67, 9.68) 138 5.89 * Knight P 460 6 1.30 1.59 1.26 (0.46, 2.74) 963 2.94 Massey H 79 3 3.80 1.37 4.29 (0.86,12.52) 138 6.69 * All Others 36 1 2.78 1.42 3.02 (0.04,16.80) 43 3.77 Total 664 13 1.96 1.55 1.94 (1.03, 3.32) 1293 3.68 *
UHS-Wilson Med Ctr Wong K 200 6 3.00 1.40 3.29 (1.20, 7.16) 318 4.69 * Yousuf M 236 7 2.97 1.61 2.85 (1.14, 5.87) 348 5.94 * Total 436 13 2.98 1.51 3.04 * (1.62, 5.19) 666 5.36 *
Univ. Hosp-Brooklyn #Tak V M 73 4 5.48 1.82 4.65 (1.25,11.90) 144 7.90 * All Others 43 5 11.63 2.36 7.60 * (2.45,17.73) 62 8.70 * Total 116 9 7.76 2.02 5.93 * (2.70,11.25) 206 8.13 *

32
Table 6 continued Isolated CABG Isolated CABG, or Valve or Valve/CABG No of 95% CI Cases Deaths OMR EMR RAMR for RAMR Cases RAMR
Univ. Hosp-Stony Brook Bilfinger T 26 2 7.69 3.54 3.34 (0.38,12.07) 35 5.77 ##Fernandez H A 269 2 0.74 1.50 0.77 (0.09, 2.76) 454 1.35 Gupta S 151 1 0.66 1.31 0.78 (0.01, 4.33) 306 2.32 McLarty A 4 0 0.00 1.29 0.00 (0.00,100.0) 5 0.00 Seifert F 77 2 2.60 1.48 2.70 (0.30, 9.76) 98 6.02 ##Taylor J 293 1 0.34 1.63 0.32 (0.00, 1.80) 591 1.61 Total 820 8 0.98 1.57 0.96 (0.41, 1.88) 1489 2.11
Univ. Hosp-Upstate Dunton R F 51 3 5.88 2.03 4.46 (0.90,13.02) 70 4.79 Fink G W 72 0 0.00 1.33 0.00 (0.00, 5.89) 122 1.97 All Others 2 0 0.00 1.10 0.00 (0.00,100.0) 4 41.60 Total 125 3 2.40 1.62 2.29 (0.46, 6.69) 196 3.60
Vassar Bros. Med Ctr Sarabu M 115 2 1.74 1.38 1.94 (0.22, 7.01) 327 1.14 Shahani R B 159 2 1.26 1.56 1.24 (0.14, 4.48) 249 1.31 Zakow P 204 1 0.49 1.84 0.41 (0.01, 2.29) 338 0.99 All Others 19 0 0.00 1.61 0.00 (0.00,18.48) 19 0.00 Total 497 5 1.01 1.63 0.95 (0.31, 2.21) 933 1.12 **
Westchester Med Ctr Kai M 126 2 1.59 1.98 1.23 (0.14, 4.46) 192 2.30 Lafaro R 57 1 1.75 1.08 2.51 (0.03,13.95) 88 1.38 Lansman S 20 0 0.00 1.39 0.00 (0.00,20.26) 35 0.00 Malekan R 192 2 1.04 1.92 0.84 (0.09, 3.02) 264 1.38 Spielvogel D 175 6 3.43 1.93 2.73 (1.00, 5.95) 278 2.83 Tang G H L 1 0 0.00 0.77 0.00 (0.00,100.0) 23 4.18 Total 571 11 1.93 1.83 1.62 (0.81, 2.90) 880 2.07
STATEWIDE TOTAL 24466 377 1.54 46595 2.25
* RAMR significantly higher than statewide rate based on 95 percent confidence interval. ** RAMR significantly lower than statewide rate based on 95 percent confidence interval. # Performed operations in another NYS hospital. ## Performed operations in two or more other NYS hospitals.

33
Table 7
Summary Information for Surgeons Practicing at More Than One Hospital, 2013-2015.
Isolated CABG Isolated CABG, or Valve or Valve/CABG 95% CI Cases Deaths OMR EMR RAMR for RAMR Cases RAMR
Akujuo A C 177 2 1.13 1.46 1.19 (0.13, 4.29) 279 4.04 Albany Med. Ctr 172 2 1.16 1.48 1.21 (0.14, 4.37) 268 3.76 St. Elizabeth Med Ctr 5 0 0.00 0.97 0.00 (0.00,100.0) 11 12.33
Ashraf M 608 12 1.97 1.28 2.38 (1.23, 4.15) 741 2.99 Buffalo General Hosp 607 12 1.98 1.28 2.38 (1.23, 4.15) 740 2.99 Mercy Hospital 1 0 0.00 0.46 0.00 (0.00,100.0) 1 0.00
Bacha E . . . . . ( . , . ) 9 0.00 NYP-Columbia Presby. . . . . . ( . , . ) 4 0.00 NYP-Weill Cornell . . . . . ( . , . ) 5 0.00
Balsam L B 123 1 0.81 1.07 1.18 (0.02, 6.54) 252 1.60 Bellevue Hospital Ctr 121 1 0.83 1.07 1.19 (0.02, 6.61) 244 1.19 NYU Hospitals Center 2 0 0.00 0.67 0.00 (0.00,100.0) 8 5.31
Bello R A 212 3 1.42 1.63 1.33 (0.27, 3.90) 307 2.15 Montefiore - Moses 11 1 9.09 3.92 3.57 (0.05,19.87) 13 4.54 Montefiore - Weiler 201 2 1.00 1.51 1.02 (0.11, 3.67) 294 1.98
Cahill A T 56 1 1.79 0.91 3.03 (0.04,16.85) 78 5.32 Champ.Valley Phys Hosp 46 1 2.17 0.82 4.07 (0.05,22.64) 66 6.90 St. Elizabeth Med Ctr 10 0 0.00 1.30 0.00 (0.00,43.51) 12 0.00
Chai P J . . . . . ( . , . ) 6 0.00 NYP-Columbia Presby. . . . . . ( . , . ) 3 0.00 NYP-Weill Cornell . . . . . ( . , . ) 3 0.00
Chikwe J Y 192 5 2.60 1.06 3.78 (1.22, 8.83) 316 2.92 Mount Sinai Hospital 143 5 3.50 1.09 4.96 * (1.60,11.57) 225 3.47 Mount Sinai St. Lukes 49 0 0.00 0.99 0.00 (0.00,11.71) 91 1.50
Choumarov K 218 3 1.38 1.58 1.34 (0.27, 3.92) 280 2.15 Bassett Medical Center 1 0 0.00 0.70 0.00 (0.00,100.0) 1 0.00 Ellis Hospital 217 3 1.38 1.59 1.34 (0.27, 3.92) 279 2.16
Culliford A 104 2 1.92 0.83 3.55 (0.40,12.83) 195 3.40 Bellevue Hospital Ctr 56 2 3.57 0.98 5.61 (0.63,20.25) 91 4.26 Mount Sinai Beth Israel . . . . . ( . , . ) 3 45.24 NYU Hospitals Center 48 0 0.00 0.66 0.00 (0.00,17.80) 101 1.34
D Alessandro D A 196 2 1.02 1.54 1.02 (0.11, 3.69) 332 2.01 Montefiore - Moses 195 2 1.03 1.55 1.02 (0.11, 3.69) 329 2.07 Montefiore - Weiler 1 0 0.00 0.37 0.00 (0.00,100.0) 3 0.00

34
Table 7 continued Isolated CABG Isolated CABG, or Valve or Valve/CABG 95% CI Cases Deaths OMR EMR RAMR for RAMR Cases RAMR
Deanda A 72 0 0.00 1.06 0.00 (0.00, 7.39) 137 0.00 Bellevue Hospital Ctr 67 0 0.00 1.11 0.00 (0.00, 7.59) 115 0.00 Mount Sinai Beth Israel . . . . . ( . , . ) 1 0.00 NYU Hospitals Center 5 0 0.00 0.40 0.00 (0.00,100.0) 21 0.00
Derose J J 305 3 0.98 1.23 1.23 (0.25, 3.60) 510 2.07 Montefiore - Moses 7 0 0.00 1.30 0.00 (0.00,61.99) 11 11.30 Montefiore - Weiler 298 3 1.01 1.23 1.26 (0.25, 3.69) 499 1.90
Downing S W 462 9 1.95 1.56 1.93 (0.88, 3.66) 607 3.49 Buffalo General Hosp 7 1 14.29 1.05 20.95 (0.27,100.0) 9 8.39 Erie County Med Ctr 22 0 0.00 1.05 0.00 (0.00,24.37) 26 0.00 Mercy Hospital 433 8 1.85 1.59 1.79 (0.77, 3.53) 572 3.33
Fernandez H A 275 2 0.73 1.49 0.75 (0.08, 2.71) 467 1.33 North Shore Univ Hosp . . . . . ( . , . ) 1 0.00 Southside Hospital 6 0 0.00 1.26 0.00 (0.00,74.90) 12 0.00 Univ. Hosp-Stony Brook 269 2 0.74 1.50 0.77 (0.09, 2.76) 454 1.35
Galloway A 66 0 0.00 0.85 0.00 (0.00,10.03) 559 2.55 Lenox Hill Hospital 2 0 0.00 1.08 0.00 (0.00,100.0) 9 0.00 Mount Sinai Beth Israel . . . . . ( . , . ) 1 0.00 NYU Hospitals Center 64 0 0.00 0.85 0.00 (0.00,10.43) 549 2.62
Goldstein D J 192 2 1.04 1.11 1.45 (0.16, 5.23) 330 2.42 Montefiore - Moses 138 0 0.00 1.11 0.00 (0.00, 3.69) 246 2.04 Montefiore - Weiler 54 2 3.70 1.11 5.15 (0.58,18.60) 84 3.15
Graver L 233 4 1.72 2.52 1.05 (0.28, 2.69) 540 0.87 ** Long Island Jewish MC 180 3 1.67 2.20 1.17 (0.23, 3.41) 427 0.97 ** North Shore Univ Hosp 53 1 1.89 3.59 0.81 (0.01, 4.51) 113 0.55
Grossi E 7 0 0.00 0.63 0.00 (0.00,100.0) 15 0.00 Bellevue Hospital Ctr 1 0 0.00 0.35 0.00 (0.00,100.0) 1 0.00 NYU Hospitals Center 6 0 0.00 0.68 0.00 (0.00,100.0) 14 0.00
Gulkarov I M 151 1 0.66 1.54 0.66 (0.01, 3.68) 256 0.67 NYP-Brooklyn Methodist 146 1 0.68 1.48 0.71 (0.01, 3.97) 247 0.71 NYP-Weill Cornell 5 0 0.00 3.37 0.00 (0.00,33.53) 9 0.00
Hartman A 119 2 1.68 1.37 1.89 (0.21, 6.83) 438 2.18 Long Island Jewish MC 3 0 0.00 0.58 0.00 (0.00,100.0) 7 0.00 North Shore Univ Hosp 76 0 0.00 1.17 0.00 (0.00, 6.34) 278 1.42 Southside Hospital 40 2 5.00 1.80 4.27 (0.48,15.43) 153 3.32
Hoffman D 147 2 1.36 1.11 1.88 (0.21, 6.79) 189 2.30 Arnot Ogden Med Ctr 63 1 1.59 0.83 2.96 (0.04,16.46) 80 2.80 Mount Sinai Beth Israel 84 1 1.19 1.33 1.38 (0.02, 7.67) 109 2.12
Jakobleff W A 146 2 1.37 1.60 1.32 (0.15, 4.77) 187 4.13 Montefiore - Moses 144 2 1.39 1.62 1.32 (0.15, 4.78) 184 4.17 Montefiore - Weiler 2 0 0.00 0.38 0.00 (0.00,100.0) 3 0.00

35
Table 7 continued Isolated CABG Isolated CABG, or Valve or Valve/CABG 95% CI Cases Deaths OMR EMR RAMR for RAMR Cases RAMR
Kalimi R 298 5 1.68 1.83 1.41 (0.45, 3.29) 555 1.45 North Shore Univ Hosp 83 2 2.41 1.87 1.98 (0.22, 7.15) 186 1.61 Southside Hospital 215 3 1.40 1.82 1.18 (0.24, 3.46) 369 1.39
Lamendola C 265 5 1.89 1.54 1.89 (0.61, 4.40) 458 3.10 Good Sam-West Islip 147 4 2.72 1.49 2.81 (0.76, 7.19) 248 3.86 St. Francis Hospital 118 1 0.85 1.60 0.82 (0.01, 4.54) 210 2.35
Lang S 269 2 0.74 0.90 1.27 (0.14, 4.58) 380 2.11 NYP-Queens 261 2 0.77 0.91 1.30 (0.15, 4.70) 360 2.37 NYP-Weill Cornell 8 0 0.00 0.83 0.00 (0.00,85.46) 20 0.00
Loulmet D F 60 0 0.00 0.72 0.00 (0.00,13.01) 443 2.08 Bellevue Hospital Ctr . . . . . ( . , . ) 4 100.00 Lenox Hill Hospital 3 0 0.00 0.92 0.00 (0.00,100.0) 7 0.00 Mount Sinai Beth Israel . . . . . ( . , . ) 1 0.00 NYU Hospitals Center 57 0 0.00 0.71 0.00 (0.00,13.89) 431 1.69
Lundy E F 222 5 2.25 2.35 1.48 (0.48, 3.45) 309 1.99 Good Sam - Suffern 30 1 3.33 2.52 2.04 (0.03,11.34) 38 2.17 St. Francis Hospital 192 4 2.08 2.32 1.38 (0.37, 3.54) 271 1.96
Michler R E 77 1 1.30 1.29 1.55 (0.02, 8.61) 246 1.77 Montefiore - Moses 75 1 1.33 1.31 1.57 (0.02, 8.74) 231 1.93 Montefiore - Weiler 2 0 0.00 0.70 0.00 (0.00,100.0) 15 0.00
Palazzo R 224 0 0.00 1.38 0.00 (0.00, 1.83) 308 0.77 Long Island Jewish MC 184 0 0.00 1.42 0.00 (0.00, 2.16) 248 0.46 North Shore Univ Hosp 40 0 0.00 1.18 0.00 (0.00,11.99) 60 2.30
Pogo G 132 5 3.79 1.74 3.35 (1.08, 7.83) 212 4.81 North Shore Univ Hosp 100 4 4.00 1.86 3.31 (0.89, 8.48) 166 4.60 Southside Hospital 32 1 3.13 1.36 3.54 (0.05,19.70) 46 5.69
Puskas J D 230 4 1.74 1.13 2.36 (0.64, 6.05) 323 3.16 Mount Sinai Beth Israel 188 4 2.13 1.14 2.86 (0.77, 7.33) 276 3.72 Mount Sinai Hospital 42 0 0.00 1.09 0.00 (0.00,12.36) 47 0.00
Rovensky M 236 0 0.00 1.29 0.00 (0.00, 1.86) 292 0.00 ** Good Sam-West Islip 202 0 0.00 1.10 0.00 (0.00, 2.55) 248 0.00 ** St. Francis Hospital 34 0 0.00 2.42 0.00 (0.00, 6.88) 44 0.00
Scheinerman S J 140 4 2.86 1.81 2.44 (0.66, 6.24) 263 2.12 Lenox Hill Hospital 37 2 5.41 1.23 6.79 (0.76,24.50) 62 4.34 Long Island Jewish MC 103 2 1.94 2.01 1.48 (0.17, 5.36) 201 1.69
Stewart A S 134 4 2.99 1.72 2.67 (0.72, 6.84) 436 3.42 Mount Sinai Hospital 89 3 3.37 1.39 3.73 (0.75,10.89) 283 3.90 NYP-Columbia Presby. 45 1 2.22 2.37 1.44 (0.02, 8.04) 153 2.84
Swistel D 200 4 2.00 1.86 1.66 (0.45, 4.24) 391 2.03 Mount Sinai St. Lukes 190 4 2.11 1.90 1.70 (0.46, 4.36) 361 2.10 NYU Hospitals Center 10 0 0.00 1.04 0.00 (0.00,54.32) 30 0.00

36
Table 7 continued Isolated CABG Isolated CABG, or Valve or Valve/CABG 95% CI Cases Deaths OMR EMR RAMR for RAMR Cases RAMR
Tak V M 75 5 6.67 1.98 5.18 * (1.67,12.09) 150 7.95 * Maimonides Medical Ctr 2 1 50.00 8.03 9.60 (0.13,53.39) 6 8.66 Univ. Hosp-Brooklyn 73 4 5.48 1.82 4.65 (1.25,11.90) 144 7.90 *
Taylor J 307 1 0.33 1.58 0.32 (0.00, 1.77) 614 1.57 North Shore Univ Hosp 13 0 0.00 0.60 0.00 (0.00,72.40) 22 0.00 Southside Hospital 1 0 0.00 0.47 0.00 (0.00,100.0) 1 0.00 Univ. Hosp-Stony Brook 293 1 0.34 1.63 0.32 (0.00, 1.80) 591 1.61
Tranbaugh R 266 2 0.75 1.35 0.86 (0.10, 3.11) 363 2.69 Mount Sinai Beth Israel 252 2 0.79 1.35 0.90 (0.10, 3.26) 344 2.82 NYP-Brooklyn Methodist 14 0 0.00 1.21 0.00 (0.00,33.40) 18 0.00 NYP-Weill Cornell . . . . . ( . , . ) 1 0.00
Williams M R 29 0 0.00 1.05 0.00 (0.00,18.48) 404 1.37 NYP-Columbia Presby. 21 0 0.00 1.07 0.00 (0.00,25.20) 316 0.79 ** NYU Hospitals Center 8 0 0.00 1.02 0.00 (0.00,69.35) 88 4.94
Worku B M 42 0 0.00 2.68 0.00 (0.00, 5.02) 64 0.00 NYP-Brooklyn Methodist 42 0 0.00 2.68 0.00 (0.00, 5.02) 63 0.00 NYP-Weill Cornell . . . . . ( . , . ) 1 0.00
Zias E 274 3 1.09 0.92 1.82 (0.37, 5.33) 551 1.49 Bellevue Hospital Ctr 1 0 0.00 5.02 0.00 (0.00,100.0) 1 0.00 Lenox Hill Hospital . . . . . ( . , . ) 1 0.00 Mount Sinai Beth Israel 1 0 0.00 0.45 0.00 (0.00,100.0) 5 0.00 NYU Hospitals Center 272 3 1.10 0.91 1.87 (0.37, 5.45) 544 1.52
* RAMR significantly higher than statewide rate based on 95 percent confidence interval. ** RAMR significantly lower than statewide rate based on 95 percent confidence interval.

37
SURGEON AND HOSPITAL VOLUMES FOR TOTAL ADULT CARDIAC SURGERY, 2013-2015Table 8 presents, for each hospital and for each surgeon performing at least 200 cardiac operations in any hospital in 2013-2015 and/or performing one or more cardiac operations in each of the years 2013-2015, the total number of Isolated CABG operations, the total number of Valve or Valve/CABG operations, the total number of Other Cardiac operations and Total Cardiac operations. As in Table 6, results for surgeons not meeting the above criteria are grouped together in an “All Others” category.
The Isolated CABG column includes patients who undergo bypass of one or more of the coronary arteries with no other major heart
surgery earlier in the same admission. Valve or Valve/CABG volumes include the total number of cases for the eight Valve or groups that were identified in Table 4. Other Cardiac Surgery refers to cardiac procedures not represented by Isolated CABG, and Valve or Valve/CABG operations and includes, but is not limited to: repairs of congenital conditions, heart transplants, aneurysm repairs, ventricular reconstruction and ventricular assist device insertions. Total Cardiac Surgery is the sum of the previous three columns and includes any surgery on the heart or great vessels.
Table 8
Surgeon and Hospital Volume for Isolated CABG, Valve or Valve/CABG, Other Cardiac Surgery, and Total Adult Cardiac Surgery, 2013-2015.
Other Total Isolated Valve or Cardiac Cardiac CABG Valve/CABG Surgery Surgery
Albany Med. Ctr Akujuo A C 172 96 31 299 Bennett E 36 184 305 525 Britton L 103 131 116 350 Depan H 174 173 38 385 Devejian N 0 1 13 14 Miller S 169 75 26 270 All Others 62 8 10 80 Total 716 668 539 1923 Arnot Ogden Med Ctr Hoffman D 63 17 2 82 Metzdorff M T 80 20 0 100 All Others 86 29 4 119 Total 229 66 6 301 Bassett Medical Center Choumarov K 1 0 0 1 Kelley J 158 90 23 271 All Others 102 47 8 157 Total 261 137 31 429

38
Table 8 continued Other Total Isolated Valve or Cardiac Cardiac CABG Valve/CABG Surgery Surgery
Bellevue Hospital Ctr Balsam L B 121 123 38 282 Culliford A 56 35 10 101 Deanda A 67 48 45 160 Grossi E 1 0 1 2 Loulmet D F 0 4 3 7 Zias E 1 0 1 2 All Others 62 34 24 120 Total 308 244 122 674 Buffalo General Hosp Aldridge J 189 21 89 299 Ashraf M 607 133 166 906 Downing S W 7 2 2 11 Grosner G 568 623 188 1379 Total 1371 779 445 2595 Champ.Valley Phys Hosp Cahill A T 46 20 3 69 All Others 21 1 0 22 Total 67 21 3 91 Ellis Hospital Choumarov K 217 62 16 295 Reich H 122 127 24 273 Singh C 229 95 11 335 Total 568 284 51 903 Erie County Med Ctr Downing S W 22 4 3 29 All Others 0 0 3 3 Total 22 4 6 32 Good Sam - Suffern Elmann E M 44 39 2 85 Lundy E F 30 8 1 39 Somberg E D 140 36 0 176 All Others 99 49 6 154 Total 313 132 9 454 Good Sam-West Islip Lamendola C 147 101 18 266 Rovensky M 202 46 8 256 All Others 1 0 0 1 Total 350 147 26 523 Lenox Hill Hospital Galloway A 2 7 0 9 Hemli J M 24 1 5 30 Loulmet D F 3 4 0 7 Patel N C 625 252 47 924 Scheinerman S J 37 25 18 80 Zias E 0 1 0 1 All Others 67 154 311 532 Total 758 444 381 1583

39
Table 8 continued Other Total Isolated Valve or Cardiac Cardiac CABG Valve/CABG Surgery Surgery
Long Island Jewish MC Graver L 180 247 42 469 Hartman A 3 4 1 8 Meyer D B 0 2 15 17 Palazzo R 184 64 85 333 Scheinerman S J 103 98 88 289 All Others 2 1 19 22 Total 472 416 250 1138 Maimonides Medical Ctr Abrol S 113 90 74 277 Crooke G 99 61 126 286 Jacobowitz I 234 106 84 424 Ribakove G 93 92 63 248 Saunders P 63 14 45 122 Stephens G A 15 29 6 50 Tak V M 2 4 1 7 Vaynblat M 127 65 33 225 Total 746 461 432 1639 Mercy Hospital Adkins M 217 53 10 280 Ashraf M 1 0 0 1 Bell-Thomson J 351 335 69 755 Downing S W 433 139 56 628 All Others 47 11 9 67 Total 1049 538 144 1731 Montefiore - Moses Bello R A 11 2 17 30 D Alessandro D A 195 134 78 407 Derose J J 7 4 112 123 Goldstein D J 138 108 95 341 Jakobleff W A 144 40 11 195 Michler R E 75 156 30 261 Weinstein S 0 2 15 17 All Others 1 2 22 25 Total 571 448 380 1399 Montefiore - Weiler Bello R A 201 93 38 332 D Alessandro D A 1 2 3 6 Derose J J 298 201 60 559 Goldstein D J 54 30 9 93 Jakobleff W A 2 1 2 5 Michler R E 2 13 0 15 All Others 11 0 10 21 Total 569 340 122 1031

40
Table 8 continued Other Total Isolated Valve or Cardiac Cardiac CABG Valve/CABG Surgery Surgery
Mount Sinai Beth Israel Culliford A 0 3 0 3 Deanda A 0 1 1 2 Galloway A 0 1 0 1 Hoffman D 84 25 10 119 Loulmet D F 0 1 0 1 Puskas J D 188 88 16 292 Tranbaugh R 252 92 23 367 Zias E 1 4 0 5 All Others 32 14 6 52 Total 557 229 56 842 Mount Sinai Hospital Adams D H 8 1033 77 1118 Anyanwu A C 57 102 335 494 Boateng P 19 40 11 70 Chikwe J Y 143 82 47 272 El-Eshmawi A M 7 27 6 40 Filsoufi F 279 133 18 430 Puskas J D 42 5 4 51 Reddy R C 263 124 78 465 Stelzer P 42 288 337 667 Stewart A S 89 194 334 617 Tannous H J 65 38 6 109 Varghese R 84 68 18 170 All Others 22 17 64 103 Total 1120 2151 1335 4606 Mount Sinai St. Lukes Balaram S K 114 62 27 203 Chikwe J Y 49 42 12 103 Swistel D 190 171 25 386 Total 353 275 64 692 NYP-Brooklyn Methodist Gulkarov I M 146 101 49 296 Tortolani A 105 54 4 163 Tranbaugh R 14 4 2 20 Worku B M 42 21 12 75 All Others 0 0 38 38 Total 307 180 105 592 NYP-Columbia Presby. Argenziano M 215 306 37 558 Bacchetta M D 0 1 154 155 Bacha E 0 4 121 125 Borger M A 19 118 111 248 Chai P J 0 3 58 61 George I 129 161 504 794 Naka Y 253 197 186 636 Quaegebeur J 0 2 61 63 Smith C 167 627 76 870 Stewart A S 45 108 96 249

41
Table 8 continued Other Total Isolated Valve or Cardiac Cardiac CABG Valve/CABG Surgery Surgery
NYP-Columbia Presby., continued Takayama H 333 263 185 781 Williams M R 21 295 521 837 All Others 19 18 144 181 Total 1201 2103 2254 5558 NYP-Queens Lang S 261 99 23 383 All Others 7 2 3 12 Total 268 101 26 395 NYP-Weill Cornell Bacha E 0 5 17 22 Chai P J 0 3 5 8 Girardi L 273 689 720 1682 Gulkarov I M 5 4 1 10 Isom O 3 22 0 25 Krieger K 188 358 22 568 Lang S 8 12 1 21 Salemi A 72 97 369 538 Tranbaugh R 0 1 0 1 Worku B M 0 1 0 1 All Others 15 8 11 34 Total 564 1200 1146 2910 NYU Hospitals Center Balsam L B 2 6 29 37 Culliford A 48 53 16 117 Deanda A 5 16 31 52 Galloway A 64 485 53 602 Grossi E 6 8 34 48 Loulmet D F 57 374 94 525 Malhotra S P 0 2 11 13 Mosca R S 0 5 21 26 Swistel D 10 20 5 35 Williams M R 8 80 268 356 Zias E 272 272 48 592 All Others 15 9 7 31 Total 487 1330 617 2434 NYU Winthrop Hospital Goncalves J A 132 199 638 969 Kokotos W J 170 156 61 387 Salhab K F 124 32 10 166 Schubach S 167 122 0 289 All Others 31 8 0 39 Total 624 517 709 1850

42
Table 8 continued Other Total Isolated Valve or Cardiac Cardiac CABG Valve/CABG Surgery Surgery
North Shore Univ Hosp Esposito R 241 184 225 650 Fernandez H A 0 1 0 1 Graver L 53 60 6 119 Hall M 109 74 21 204 Hartman A 76 202 92 370 Kalimi R 83 103 17 203 Palazzo R 40 20 20 80 Pogo G 100 66 23 189 Taylor J 13 9 0 22 Vatsia S 174 121 53 348 Yu P J 66 38 63 167 All Others 7 1 14 22 Total 962 879 534 2375 Rochester General Hosp Cheeran D 486 433 123 1042 Kirshner R 424 627 92 1143 All Others 67 21 2 90 Total 977 1081 217 2275 Southside Hospital Fernandez H A 6 6 0 12 Hartman A 40 113 61 214 Kalimi R 215 154 68 437 Manetta F 184 70 61 315 Pogo G 32 14 7 53 Taylor J 1 0 0 1 All Others 15 5 1 21 Total 493 362 198 1053 St. Elizabeth Med Ctr Akujuo A C 5 6 1 12 Cahill A T 10 2 0 12 El Amir N 206 113 35 354 Joyce F 315 161 12 488 All Others 21 6 1 28 Total 557 288 49 894 St. Francis Hospital Bercow N 470 336 154 960 Colangelo R 603 533 46 1182 Lamendola C 118 92 18 228 Lundy E F 192 79 10 281 Robinson N 135 419 458 1012 Rovensky M 34 10 2 46 All Others 70 5 4 79 Total 1622 1474 692 3788

43
Table 8 continued Other Total Isolated Valve or Cardiac Cardiac CABG Valve/CABG Surgery Surgery
St. Josephs Hospital Green G R 233 297 173 703 Lutz C J 238 332 140 710 Marvasti M 160 187 42 389 Nazem A 264 229 66 559 Zhou Z 274 311 193 778 Total 1169 1356 614 3139 St. Peters Hospital Edwards N 165 248 77 490 Karavas A N 352 72 26 450 Saifi J 160 345 82 587 Terrien C M 310 204 60 574 Total 987 869 245 2101 Staten Island Univ Hosp McGinn J 308 119 11 438 Rosell F M 259 39 24 322 Wohler A M 49 13 21 83 All Others 3 0 0 3 Total 619 171 56 846 Strong Memorial Hosp Alfieris G 0 2 20 22 Gensini P F 0 9 48 57 Hicks G 89 49 45 183 Knight P 460 503 273 1236 Massey H 79 59 143 281 All Others 36 7 34 77 Total 664 629 563 1856 UHS-Wilson Med Ctr Wong K 200 118 29 347 Yousuf M 236 112 34 382 Total 436 230 63 729 Univ. Hosp-Brooklyn Tak V M 73 71 9 153 All Others 43 19 10 72 Total 116 90 19 225 Univ. Hosp-Stony Brook Bilfinger T 26 9 12 47 Fernandez H A 269 185 93 547 Gupta S 151 155 98 404 McLarty A 4 1 38 43 Seifert F 77 21 2 100 Taylor J 293 298 109 700 Total 820 669 352 1841 Univ. Hosp-Upstate Dunton R F 51 19 4 74 Fink G W 72 50 33 155 All Others 2 2 4 8 Total 125 71 41 237

44
Table 8 continued Other Total Isolated Valve or Cardiac Cardiac CABG Valve/CABG Surgery Surgery
Vassar Bros. Med Ctr Sarabu M 115 212 50 377 Shahani R B 159 90 20 269 Zakow P 204 134 29 367 All Others 19 0 1 20 Total 497 436 100 1033
Westchester Med Ctr Kai M 126 66 78 270 Lafaro R 57 31 17 105 Lansman S 20 15 24 59 Malekan R 192 72 111 375 Spielvogel D 175 103 86 364 Tang G H L 1 22 134 157 All Others 0 0 5 5 Total 571 309 455 1335
TOTAL 24466 22129 13457 60052

45
Criteria Used in Reporting Significant Risk Factors (2015)
Based on Documentation in Medical Records
Patient Risk Factor Definitions
Demographic
Body Surface Area Body surface area (BSA) is a function of height and weight and increases for larger heights and weights. The statistical formula used to calculate BSA in this report is: BSA (m2) =0.0003207 x H0.3 x W(0.7285 - ( 0.0188 x LOG))
Where H is Height in centimeters and W is Weight in grams.
Body Mass Index Body Mass Index (BMI) is a measure of body size that is the ratio of the weight of the body in kilograms to the square of its height in meters and is considered an indication of nutritional status of the body.
The formula for BMI is: BMI=Weight/Height2 where Height is height in meters (m) and Weight is weight in kilograms (kg).
Hemodynamic State Determined in the immediate pre-operative period, defined as the period prior to anesthesia taking responsibility for the patient.
Non-Refractory Cardiogenic Shock Non-Refractory Cardiogenic Shock is defined as an episode of systolic blood pressure <90 mmHg and/or cardiac index < 2.2 L/min /m2 determined to be secondary to cardiac dysfunction and the requirement for parenteral inotropic or vasopressor agents or mechanical support (e.g., IABP, extracorporeal circulation, VAD) to maintain blood pressure and cardiac index above those specified levels. (Definition adopted in 2015)
Prior to 2015 the risk factor was called “Unstable” and defined as follows: Patient requires pharmacologic or mechanical support to maintain blood pressure or cardiac index.
Refractory Cardiogenic Shock Refractory Cardiogenic Shock is defined as an episode of systolic blood pressure <80 mm Hg and/or cardiac index < 2.0 L/min /m2 determined to be secondary to cardiac dysfunction despite the use of parenteral inotropic or vasopressor agents or mechanical support (e.g., IABP, extracorporeal circulation, VADs). (Definition adopted in 2015.)
Prior to 2015 the risk factor was called Shock and defined as follows: Acute hypotension (systolic blood pressure < 80 mmHg) or low cardiac index (< 2.0 liters/min/m2), despite pharmacologic or mechanical support. Records with this risk factor were excluded from all analyses in this report.

46
Patient Risk Factor Definitions
Comorbidities
Cerebrovascular Disease Cerebrovascular disease prior to surgery documented by any one of the following:• CVA (symptoms > 24 hrs after onset, presumed to be from
vascular etiology);• TIA (recovery within 24 hrs);• Non-invasive carotid test with > 79% diameter occlusion.; or• Prior carotid surgery or stenting or prior cerebral aneurysm
clipping or coil. Does not include neurological disease processes such as metabolic and/or anoxic ischemic encephalopathy.
Chronic Lung Disease The patient has chronic lung disease with pre-operative findings of one of the following:• Mild - FEV1 60% to 75% of predicted, and/or on chronic inhaled or
oral bronchodilator therapy. • Moderate - FEV1 50% to 59% of predicted, and/or on chronic
steroid therapy aimed at lung disease.• Severe - FEV1 <50% predicted, and/or Room Air pO2 < 60 or Room
Air pCO2 > 50.
Congestive Heart Failure (CHF), Current
Within 2 weeks prior to the procedure, the patient has a clinical diagnosis of CHF and symptoms requiring treatment for CHF. Note: Physician diagnosis of CHF may be based on one of the following:• Paroxysmal nocturnal dyspnea (PND)• Dyspnea on exertion (DOE) due to heart failure• Chest X-Ray showing pulmonary congestion
Documentation must include the presence of a diagnosis of CHF, evidence of symptoms, and treatment for CHF.
Congestive Heart Failure (CHF), Past
Between 2 weeks and 6 months prior to the procedure, the patient has a clinical diagnosis / past medical history of CHF and ongoing treatment for CHF.
Note: Physician diagnosis of CHF may be based on one of the following:• Paroxysmal nocturnal dyspnea (PND)• Dyspnea on exertion (DOE) due to heart failure• Chest X-Ray showing pulmonary congestion
Documentation must include a diagnosis of CHF and evidence of treatment for CHF. Patient’s clinical status may be compensated.
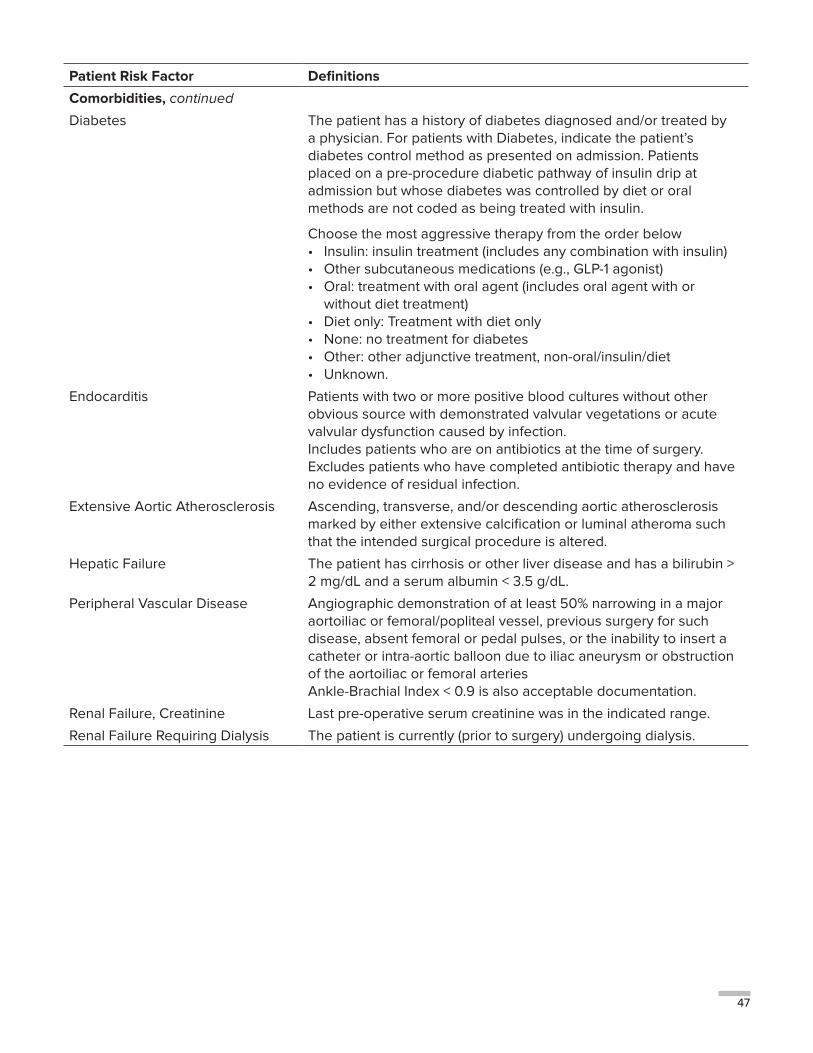
47
Patient Risk Factor Definitions
Comorbidities, continued
Diabetes The patient has a history of diabetes diagnosed and/or treated by a physician. For patients with Diabetes, indicate the patient’s diabetes control method as presented on admission. Patients placed on a pre-procedure diabetic pathway of insulin drip at admission but whose diabetes was controlled by diet or oral methods are not coded as being treated with insulin.
Choose the most aggressive therapy from the order below• Insulin: insulin treatment (includes any combination with insulin)• Other subcutaneous medications (e.g., GLP-1 agonist)• Oral: treatment with oral agent (includes oral agent with or
without diet treatment)• Diet only: Treatment with diet only• None: no treatment for diabetes• Other: other adjunctive treatment, non-oral/insulin/diet• Unknown.
Endocarditis Patients with two or more positive blood cultures without other obvious source with demonstrated valvular vegetations or acute valvular dysfunction caused by infection. Includes patients who are on antibiotics at the time of surgery. Excludes patients who have completed antibiotic therapy and have no evidence of residual infection.
Extensive Aortic Atherosclerosis Ascending, transverse, and/or descending aortic atherosclerosis marked by either extensive calcification or luminal atheroma such that the intended surgical procedure is altered.
Hepatic Failure The patient has cirrhosis or other liver disease and has a bilirubin > 2 mg/dL and a serum albumin < 3.5 g/dL.
Peripheral Vascular Disease Angiographic demonstration of at least 50% narrowing in a major aortoiliac or femoral/popliteal vessel, previous surgery for such disease, absent femoral or pedal pulses, or the inability to insert a catheter or intra-aortic balloon due to iliac aneurysm or obstruction of the aortoiliac or femoral arteries Ankle-Brachial Index < 0.9 is also acceptable documentation.
Renal Failure, Creatinine Last pre-operative serum creatinine was in the indicated range.
Renal Failure Requiring Dialysis The patient is currently (prior to surgery) undergoing dialysis.

48
Patient Risk Factor Definitions
Ventricular Function
Ejection Fraction Value of the ejection fraction taken closest to but before the start of the procedure. Intraoperative direct observation of the heart is not an adequate basis for a visual estimate of the ejection fraction. Intra-operative TEE is acceptable, if no pre-operative Ejection Fraction is available. If no ejection fraction is reported, the ejection fraction is considered “normal” for purposes of analysis and is classified with the reference category.
Previous MI One or more myocardial infarctions (MI) in the specified time period prior to surgery.
STEMI The patient presented with a ST-elevation myocardial infarction (STEMI) or its equivalent as documented in the medical record. STEMIs are characterized by the presence of both criteria:
a. ECG evidence of STEM
b. Cardiac biomarkers (creatinine kinase-myocardial band, Troponin T or I) exceed the upper limit of normal according to the individual hospital’s laboratory parameters with a clinical presentation which is consistent or suggestive of ischemia.
Previous Procedures
Previous Organ Transplant The patient has had any organ transplant prior to the current cardiac surgery. This includes, but is not limited to, heart, lung, kidney, and liver transplants.
Previous PCI The patient has had a Percutaneous Coronary Intervention prior to the current cardiac surgery.
Previous PCI, this episode with Emergency Transfer
Prior to this cardiac surgery and during the same episode of care, the patient underwent PCI and required immediate surgery after PCI or diagnostic catheterization.
Previous Valve Surgery or Intervention
Prior to this cardiac surgery, the patient has previously undergone surgery or catheter based intervention for valve repair or replacement.
Previous CABG Surgery with Patent Grafts
Prior to this cardiac surgery, the patient has previously undergone CABG surgery and at least one graft remains patent (open for blood flow).
Any Previous Cardiac Surgery Prior to this cardiac surgery, the patient has previously undergone any previous Cardiac Surgery. This would include a previous catheter-based valve repair or replacement but not other catheter-based interventions.
Vessels Diseased
Left Main Disease The patient has at least a 50 percent blockage in the Left Main Coronary Artery.

49
MEDICAL TERMINOLOGYangina pectoris – The pain or discomfort felt when blood and oxygen flow to the heart are impeded by blockages in the coronary arteries. Can also be caused by an arterial spasm.
angioplasty – Also known as percutaneous transluminal coronary angioplasty (PTCA) or percutaneous coronary intervention (PCI). In this procedure, a balloon catheter is threaded up to the site of blockage in an artery in the heart, and is then inflated to push arterial plaque against the wall of the artery to create a wider channel in the artery. Other procedures or devices are frequently used in conjunction with, or in place of, the balloon catheter. In particular, stents are used for most patients and devices such as rotoblaters and ultrasound are sometimes used.
arteriosclerosis – Also called atherosclerotic coronary artery disease or coronary artery disease, the group of diseases characterized by thickening and loss of elasticity of the arterial walls, popularly called “hardening of the arteries.”
atherosclerosis – One form of arteriosclerosis in which plaques or fatty deposits form in the inner layer of the arteries.
coronary artery bypass graft surgery (CABG) – A procedure in which a vein or artery from another part of the body is used to create an alternate path for blood to flow to the heart muscle, bypassing the arterial blockage. Typically, a section of one of the large saphenous veins in the leg, the radial artery in the arm or the mammary artery in the chest is used to construct the bypass. One or more bypasses may be performed during a single operation. When no other major heart surgery (such as valve replacement) is included, the operation is referred to as an isolated CABG. The average number of bypass grafts created during CABG is three or four. Generally, all significantly blocked arteries are bypassed unless they enter areas of the heart that are permanently damaged by previous heart attacks. Five or more bypasses are occasionally created. Multiple bypasses are often performed to provide several alternate routes for the blood flow and to improve the long-term success of the procedure, not necessarily because the patient’s condition is more severe.
cardiac catheterization – Also known as coronary angiography, a procedure for diagnosing the condition of the heart and the arteries connecting to it. A thin tube threaded through an artery to the heart releases a dye, which allows doctors to observe blockages with an X-ray camera. This procedure is generally required before coronary bypass surgery.
cardiovascular disease – Disease of the heart and blood vessels, the most common form is coronary artery disease.
coronary arteries – The arteries that supply the heart muscle with blood. When they are narrowed or blocked, oxygen-rich blood cannot flow freely to the heart muscle or myocardium.
heart valve – Gates that connect the different chambers of the heart so that there is a one-way flow of blood between the chambers. The heart has four valves: the tricuspid, mitral, pulmonic and aortic valves.
incompetent valves – A valve that does not close tightly.
ischemic heart disease (ischemia) – Heart disease that occurs as a result of inadequate blood supply to the heart muscle or myocardium.
myocardial infarction (MI) – Also called a heart attack, partial destruction of the heart muscle due to interrupted blood supply.
plaque – Also called atheroma, this is the fatty deposit in the coronary artery that can block blood flow.
risk factors for heart disease – Certain risk factors have been found to increase the likelihood of developing heart disease. Some are controllable or avoidable and some cannot be controlled. The biggest heart disease risk factors are heredity, gender and age, none of which can be controlled. Men are much more likely to develop heart disease than women before the age of 55, although it is the number one killer of both men and women. Some controllable risk factors that contribute to a higher likelihood of developing coronary artery disease are high cholesterol levels, cigarette smoking, high blood pressure (hypertension), obesity, a sedentary lifestyle or lack of exercise, diabetes and poor stress management.

50
stenosis - The narrowing of an artery due to blockage. Restenosis is when the narrowing recurs after surgery.
stenotic valve – A valve that does not open fully.
valve disease – Occurs when a valve cannot open all of the way (reducing flow to the next heart chamber) or cannot close all of the way (causing blood to leak backwards into the previous heart chamber).
valve repair – Widening valve openings for stenotic valves or narrowing or tightening valve openings for incompetent valves without having to replace the valves.
valve replacement – Replacement of a diseased valve. New valves are either mechanical (durable materials such as Dacron or titanium) or biological (tissues taken from pigs, cows or human donors).

51
Appendix 1 Risk Factors for CABG In-Hospital / 30-Day Deaths in New York State in 2015The significant pre-operative risk factors for death in the hospital during the same admission as the surgery or after hospital discharge but within 30 days of surgery (in-hospital/30-day mortality) for CABG in 2015 are presented in Appendix Table 1.
Roughly speaking, the odds ratio for a risk factor represents the number of times more likely to die in the hospital during or after CABG or after discharge but within 30 days of the surgery a patient with that risk factor is than a patient without the risk factor, all other risk factors being the same. For example, the odds ratio for the risk factor Peripheral Vascular Disease is 2.713. This means that a patient who has Peripheral Vascular Disease prior to surgery is approximately 2.713 times as likely to die in the hospital or after discharge within 30 days of surgery as a patient who does not have Peripheral Vascular Disease but who has the same other significant risk factors.
For all of the risk factors in the table except Age: Number of years greater than 60, Body Surface Area and Renal Failure, there are only two possibilities: having the risk factor and not having it.
For age, the odds ratio roughly represents the number of times more likely to die a patient who is older than 60 is compared to a patient who is one year younger but otherwise has the same
significant risk factors. Thus, the chance of in-hospital / 30-day death for a patient undergoing CABG who is 66 years old is approximately 1.072 times that of a patient 65 years old undergoing CABG, if all other risk factors are the same. All patients age 60 and younger have roughly the same odds of in-hospital / 30-day mortality if their other risk factors are identical.
Body surface area (BSA) is a function of height and weight and increases for larger heights and weights. This model includes terms for both BSA and BSA-squared, reflecting the complex relationship between BSA and in-hospital/ 30-day mortality. The quadratic function of BSA (BSA-squared) used in this statistical model reflects the fact that patients with very high or very low BSAs tend to have higher risks of in-hospital/30-day mortality than patients with intermediate levels of BSA. This functional form is used to improve the model’s ability to predict mortality, but it means that the odds ratios for these terms do not have a straightforward interpretation.
Renal Failure is subdivided into three groups. The first group represents patients with serum creatinine greater than 1.5 m/dL who are not on dialysis. The second group includes patients with renal failure on dialysis. These groups are relative to patients who are not on dialysis and whose last pre-operative serum creatinine values were not greater than 1.5 mg/dL.

52
Appendix Table 1Multivariable Risk Factor Equation for CABG In-Hospital / 30-Day Deaths in New York State in 2015.
Logistic Regression
Patient Risk Factor Prevalence (%) Coefficient P-Value Odds Ratio
Demographic
Age: Number of years greater than 60 — 0.0692 <.0001 1.072
Body Surface Area (10m2) — -0.8304 0.0045 —
Body Surface Area – squared (100m4) — 0.0197 0.0050 —
Ventricular Function
Ejection Fraction < 30% 6.70 0.9016 0.0002 2.463
STEMI < 24 hours 1.33 1.9011 <.0001 6.693
Hemodynamic State
Non-Refractory Shock 0.57 1.9465 <.0001 7.004
Comorbidities
Peripheral Vascular Disease 12.37 0.9981 <.0001 2.713
Congestive Heart Failure, within 2 weeks 15.58 0.7827 0.0002 2.187
Chronic Lung Disease, Severe 3.70 0.6734 0.0275 1.961
Diabetes 49.13 0.6533 0.0013 1.922
Renal Failure
No Renal Failure 89.41 — Reference — 1.000
Creatinine > 1.5 mg/dl 7.30 0.7876 0.0013 2.198
Requiring Dialysis 3.29 1.1257 0.0003 3.082
Previous Procedures
Previous CABG with Patent Grafts 1.04 1.5693 0.0014 4.803
Previous Organ Transplant 0.51 1.4140 0.0149 4.113
Intercept = 2.3943C Statistic = 0.830

53
Appendix 2 Risk Factors for CABG 30-Day Readmissions in New York State in 2015The significant pre-procedural risk factors for 30-day readmissions following CABG in 2015 are presented in the table that follows. Female, Ejection Fraction, Cerebrovascular Disease, Chronic Lung Disease, and Previous PCI are interpreted in the same way as Peripheral Vascular Disease in Appendix 1. The patient either has the risk factor or does not.
The interpretation for Age is the same as that presented in Appendix 1 except in this instance risk increases for each year older than 55.
Body Mass Index (BMI) is a relationship of weight to height. It is a measure of body size that is the ratio of the weight of the body in kilograms to the square of its height in meters and is considered an indication of nutritional status of the body. This model includes terms for both BMI and BMI-squared, reflecting the complex relationship between BMI and 30-day readmission. The quadratic function of BMI (BMI-squared) used in the statistical model reflects the fact that patients with very high and very low BMIs tend to have higher risks of readmission than patients with intermediate levels of BMI. This functional form is used to improve the model’s ability to predict mortality, but it means that the odds ratios for these terms do not have a straightforward interpretation.
Previous MI is categorized in four groups. Two groups represent patients who have experienced a STEMI either in the six hours before surgery or from six hours to seven days before surgery. A third group represents patients who have previously experienced any MI except a STEMI within seven days before surgery. The odds ratios for all three of these groups are relative to patients who have never experienced an MI.
In this model, Diabetes is categorized in three groups. One group includes patients who have diabetes and are treated with insulin. Another group includes patients whose diabetes is not treated prior to admission (that is, no diet control, oral medication, insulin or other treatments). The odds ratios for both of these groups are relative to patients who either do not have diabetes or who have diabetes but are receiving therapy other than insulin (such as diet or oral medications).
Renal Failure is expressed in terms of renal failure with dialysis and elevated serum creatinine without dialysis. The odds ratios for all four Renal Failure categories are relative to patients with no dialysis and whose last serum creatinine measured prior to surgery was not greater than 1.2 mg/dL.

54
Appendix Table 2
Multivariable Risk Factor Equation for CABG / 30-Day Readmission in New York State in 2015.
Logistic Regression
Patient Risk Factor Prevalence (%) Coefficient P-Value Odds Ratio
Demographic
Age: Number of years greater than 55 — 0.0158 <0.0001 1.016
Body Mass Index — -0.1022 0.0015 —
Body Mass Index - squared — 0.0018 0.0001 —
Female 24.29 0.3175 <0.0001 1.374
Ventricular Function
Ejection Fraction < 40% 16.39 0.2328 0.0076 1.262
Previous MI
No Previous MI 51.70 — Reference — 1.000
STEMI, < 6 hours 0.52 0.8474 0.0309 2.334
STEMI, 6 hours – 7 days 2.69 0.4005 0.0401 1.493
Any other Previous MI 45.09 0.2018 0.0056 1.224
Comorbidities
Cerebrovascular Disease 13.54 0.3225 0.0003 1.381
Chronic Lung Disease, Severe 3.69 0.7653 <0.0001 2.150
Diabetes
No Diabetes or treatment other than Insulin 78.31 — Reference — 1.000
Diabetes on Insulin Therapy 17.38 0.2825 0.0012 1.326
Diabetes, Not treated 4.31 0.3424 0.0255 1.408
Renal Failure
No Renal Failure 79.35 — Reference — 1.000
Creatinine 1.3-2.0 mg/dl 14.78 0.3576 0.0001 1.430
Creatinine 2.1-2.5 mg/dl 1.42 0.6535 0.0050 1.922
Creatinine > 2.5 mg/dl 1.24 0.8979 0.0002 2.454
Requiring Dialysis 3.21 1.0062 <0.0001 2.735
Previous Procedures
Previous PCI 29.10 0.1776 0.0167 1.194
Intercept = -1.3124C Statistic = 0.651

55
Appendix 3 Risk Factors For Valve Surgery In-Hospital / 30-Day Mortality in 2013-2017The significant pre-procedural risk factors for in-hospital/30-day mortality following valve surgery in the 2013-2015 time period are presented in the table that follows.
For Age in years, the odds ratio represents the increased likelihood for in-hospital/30-day mortality for each one year increase in age. If two patients have all of the same significant risk factors but one patient is one year older, the older patient will be 1.043 times as likely die in the hospital or within 30 days of discharge.
The odds ratio for type of valve surgery roughly represents the number of times more likely to die in the hospital during or after that particular surgery or after discharge but within 30 days a patient with a specific valve surgery is than a
patient who has had aortic valve replacement surgery, all other risk factors being the same. For example, a patient who has a mitral valve replacement surgery is roughly 1.687 times as likely to die in the hospital during or after surgery or after discharge but within 30 days of surgery as a patient with aortic valve replacement surgery, all other significant risk factors being the same.
The interpretation of renal failure in this model is similar to that provided in Appendix 2 except in this case there are only two levels of elevated serum creatinine.
All other variables can be interpreted in the same way as previously described.

56
Table 3
Multivariable Risk Factor Equation for Valve Surgery In-Hospital / 30-Day Deaths In NYS, 2013-2015.
Logistic Regression
Patient Risk Factor Prevalence (%) Coefficient P-Value Odds Ratio
Demographic
Age in years — 0.0425 <.0001 1.043
Body Surface Area (10m2) — -0.5661 0.0005 —
Body Surface Area – squared (100m4) — 0.0134 0.0009 —
Female 45.48 0.3883 0.0013 1.474
Type of Valve Surgery
Aortic Valve Replacement 48.76 — Reference — 1.000
Mitral Valve Replacement 13.15 0.5232 0.0008 1.687
Mitral Valve Repair 17.33 -0.5408 0.0310 0.582
Multiple Valve Repair/Replacement 20.77 0.8355 <.0001 2.306
Hemodynamic State
Non-Refractory Shock 0.50 1.1729 0.0019 3.231
Comorbidities
Cerebrovascular Disease 11.87 0.3274 0.0140 1.387
Chronic Lung Disease, Severe 3.93 0.8386 <.0001 2.313
Congestive Heart Failure, within 2 weeks 33.32 0.3731 0.0009 1.452
Endocarditis 5.36 0.4258 0.0236 1.531
Peripheral Vascular Disease 6.66 0.4028 0.0137 1.496
Renal Failure
No Renal Failure 90.35 — Reference — 1.000
Creatinine 1.6 – 2.0 mg/dl 5.02 0.6324 0.0003 1.882
Creatinine > 2.0 mg/dl 2.01 0.6511 0.0135 1.918
Requiring Dialysis 2.62 1.7137 <.0001 5.550
Previous Procedres
Any Previous Valve Surgery or Intervention 11.94 0.3733 0.0058 1.453
Intercept = -1.8361
C Statistic = 0.783

57
Appendix 4 Risk Factors for Valve and CABG Surgery In-Hospital/30-Day Mortality in New York State in 2013-2015The significant pre-procedural risk factors for in-hospital/30-day mortality following valve and CABG surgery in the 2013-2015 time period are presented in the table that follows.
The odds ratio for Type of Valve with CABG surgery roughly represents the number of times more likely to die in the hospital during or after that particular surgery or after discharge but within 30 days a patient with a specific Valve with CABG surgery is than a patient who had aortic valve repair or replacement and CABG surgery, all other risk factors being the same. For example, a patient who has a mitral valve replacement and CABG surgery is 2.311 times as likely to die in the hospital or within 30 days after discharge as a patient with aortic valve repair or replacement and CABG surgery, all other significant risk factors being the same.
Ejection Fraction, which is the percentage of blood in the heart’s left ventricle that is expelled when it contracts (with more denoting
a healthier heart), is subdivided into three ranges (less than 30 percent, 30 percent to 49 percent, and 50 percent or more). The last range is referred to as the reference category. This means that the odds ratio that appears for the other Ejection Fraction categories in the table is relative to patients with an ejection fraction of 50 percent or more. Thus, a Valve with CABG patient with an ejection fraction of less than 30 percent is about 2.184 times as likely to die in the hospital or within 30 days as a patient with an ejection fraction of 50 percent or higher, all other significant risk factors being the same.
Chronic Lung Disease is divided into three categories: patients with Moderate disease; patients with Severe disease; and patients with either no chronic lung disease or mild disease. The last group is the reference category.
All other risk factors are interpreted as described in Appendix 1-3.

58
Appendix Table 4
Multivariable Risk Factor Equation for Valve and CABG Surgery In-Hospital/ 30-Day Deaths in NYS, 2013-2015.
Logistic Regression
Patient Risk Factor Prevalence (%) Coefficient P-Value Odds Ratio
DemographicAge: Number of years greater than 65 — 0.0591 <.0001 1.061Body Surface Area (10 m2) — -0.7379 0.0008 —Body Surface Area – squared (100 m4) — 0.0180 0.0010 —Female 32.79 0.4259 0.0041 1.531
Type of Valve (with CABG)Aortic Valve Replacement 62.72 — Reference — 1.000Mitral Valve Replacement 10.26 0.8379 <.0001 2.311Mitral Valve Repair 14.47 -0.0393 0.8531 0.961Multiple Valve Repair/Replacement 12.54 0.7489 <.0001 2.115
Ventricular FunctionEjection Fraction
Ejection Fraction 50% or greater 66.91 — Reference — 1.000Ejection Fraction < 30% 8.68 0.7811 <.0001 2.184Ejection Fraction 30 – 49% 24.41 0.3479 0.0178 1.416
STEMI within 7 days 1.32 1.0707 0.0028 2.917
Hemodynamic StateNon-Refractory Shock 0.99 1.1675 0.0020 3.214
ComorbiditiesChronic Lung Disease
Chronic Lung Disease, None or Mild 86.84 — Reference — 1.000Chronic Lung Disease, Moderate 6.76 0.4590 0.0352 1.582Chronic Lung Disease, Severe 6.40 0.5493 0.0080 1.732
Renal FailureNo Renal Failure 63.32 — Reference — 1.000Renal Failure, Creatinine 1.2-1.5 mg/dl 22.68 0.4637 0.0037 1.590Renal Failure, Creatinine 1.6-2.0 mg/dl 6.85 0.7024 0.0013 2.019Renal Failure, Creatinine > 2.0 mg/dl 3.18 0.7989 0.0054 2.223Renal Failure Requiring Dialysis 3.97 1.8594 <.0001 6.420
Previous ProceduresAny Previous CABG Surgery 4.10 1.0064 <.0001 2.736Previous Organ Transplant 0.78 1.2575 0.0028 3.517
Intercept = 2.5169C Statistic = 0.752

59
Appendix 5 Multivariable Risk Factor Equation for TAVR In-Hospital / 30-Day Deaths in New York State in 2013-2015.The significant pre-procedural risk factors for in-hospital/30-day mortality following TAVR in the 2013-2015 time period are presented in the table that follows. The risk factors in this model are interpreted as described in Appendices 1 – 4.
Appendix Table 5
Multivariable Risk Factor Equation for TAVR In-Hospital / 30-Day Deaths in New York State in 2013-2015.
Patient Risk Factor Prevalence (%)
Logistic Regression
Coefficient P-Value Odds Ratio
Demographic
Age: Number of years greater than 80 — 0.0551 0.0002 1.057
Body Surface Area (10 m2) — -0.7366 <.0001 —
Body Surface Area – squared (100 m4) — 0.0178 0.0002 —
Ventricular Function
Ejection Fraction < 30% 8.35 0.4824 0.0122 1.620
Comorbidities
Cerebrovascular Disease, not TIA only 19.03 0.4119 0.0058 1.510
Congestive Heart Failure, within 2 weeks 54.23 0.4235 0.0020 1.527
Chronic Lung Disease, Severe 12.59 0.5221 0.0023 1.686
Extensive Aortic Atherosclerosis 2.72 0.8136 0.0038 2.256
Hepatic Failure 0.13 2.1973 0.0127 9.001
Renal Failure
No Renal Failure 90.37 — Reference — 1.000
Creatinine 2.1 - 2.5 mg/dl 3.08 0.6428 0.0286 1.902
Creatinine > 2.5 mg/dl or Dialysis 6.55 0.9632 <.0001 2.620
Vessels Diseased
Left Main Disease 2.57 0.7013 0.0178 2.016
Intercept = 3.4275
C Statistic = 0.668

60
Appendix 6 Risk Factors for Isolated CABG In-Hospital/30-Day Mortality in New York State 2013-2015The significant pre-procedural risk factors for in-hospital/30-day mortality following isolated CABG in the 2013-2015 time period are presented in the table that follows. The risk factors in this model are interpreted as described in Appendices 1 – 5
Appendix Table 6
Multivariable Risk Factor Equation for CABG In-Hospital / 30-Day Deaths in New York State in 2013-2015.
Patient Risk Factor Prevalence (%)
Logistic Regression
Coefficient P-Value Odds Ratio
DemographicAge: Number of years greater than 60 — 0.0563 <.0001 1.058Body Mass Index — -0.0939 0.0363 —Body Mass Index – squared — 0.0016 0.0152 —Female 24.26 0.2364 0.0415 1.267
Hemodynamic StateNon-refractory Shock 0.70 1.2675 <.0001 3.552
Ventricular FunctionEjection Fraction < 30% 7.48 0.7887 <.0001 2.201Previous MI
No Previous MI within 7 days 75.95 — Reference — 1.000STEMI, < 6 hours 0.57 1.9170 <.0001 6.801STEMI, 6-23 hours 0.84 1.7581 <.0001 5.801STEMI, 1 – 7 days 2.80 0.8556 0.0003 2.353NSTEMI, < 24 hours 1.25 0.7446 0.0346 2.106NSTEMI, 1 – 7 days 18.59 0.2696 0.0393 1.309
ComorbiditiesCerebrovascular Disease 14.21 0.3559 0.0053 1.427Chronic Lung Disease, Severe 4.24 0.7921 <.0001 2.208Congestive Heart Failure, within 2 weeks 15.29 0.5916 <.0001 1.807Diabetes
No Diabetes or treatment other than insulin 78.68 — Reference — 1.000Diabetes, on Insulin Therapy 17.38 0.4959 0.0002 1.642Diabetes, Not Treated 3.94 0.6588 0.0031 1.932
Extensive Aortic Atherosclerosis 3.30 0.4472 0.0205 1.564Peripheral Vascular Disease 12.14 0.5541 <.0001 1.740Renal Failure
No Renal Failure 89.04 — Reference — 1.000Renal Failure, Creatinine 1.6 – 2.5 mg/dl 6.39 0.4196 0.0124 1.521Renal Failure, Creatinine > 2.5 mg/dl 1.26 1.0145 0.0002 2.758Renal Failure Requiring Dialysis 3.31 1.0859 <.0001 2.962
Previous Procedures Previous Valve Surgery or Intervention 0.31 1.0190 0.0290 2.770Previous CABG with Patent Grafts 1.28 1.3331 <.0001 3.793
Previous PCI this admission w/ emergency surgery after PCI or Dx Cath 0.47 1.1042 0.0051 3.017
Intercept = -4.5209C Statistic = 0.808

61
NEW YORK STATE CARDIAC SURGERY CENTERSAlbany Medical Center 47 New Scotland Avenue Albany, New York 12208
Arnot Ogden Medical Center 600 Roe Avenue Elmira, New York 14905
Bassett Medical Center Atwell Road Cooperstown, New York 13326
Bellevue Hospital Center 462 First Avenue and 27th Street New York, New York 10016
Buffalo General Medical Center 100 High Street Buffalo, New York 14203
Champlain Valley Physicians Hospital*** 75 Beekman Street Plattsburgh, New York 12901
Ellis Hospital 1101 Nott Street Schenectady, New York 12308
Erie County Medical Center *** 462 Grider Street Buffalo, New York 14215
Good Samaritan Hospital Medical Center 1000 Montauk Highway West Islip, New York 11795
Good Samaritan Hospital of Suffern 255 Lafayette Avenue Suffern, New York 10901
Lenox Hill Hospital 100 East 77th Street New York, New York 10021
Long Island Jewish Medical Center 270-05 76th Avenue New Hyde Park, New York 11040
Maimonides Medical Center 4802 Tenth Avenue Brooklyn, New York 11219
Mercy Hospital of Buffalo 565 Abbott Road Buffalo, New York 14220
Montefiore Medical Center @ Henry & Lucy Moses Division 111 East 210th Street Bronx, New York 10467
Montefiore Medical Center @ Jack D. Weiler Hospital of A. Einstein College 1825 Eastchester Road Bronx, New York 10461
Mount Sinai Beth Israel 10 Nathan D. Perlman Place New York, New York 10003
Mount Sinai Hospital One Gustave L. Levy Place New York, New York 10029
Mount Sinai St. Luke’s 1111 Amsterdam Avenue New York, New York 10025
NY Presbyterian / Queens 56-45 Main Street Flushing, New York 11355
NY Presbyterian Brooklyn Methodist Hospital 506 Sixth Street Brooklyn, New York 11215
NY Presbyterian Hospital @ Columbia Presbyterian Center 630 West 168th Street New York, New York 10032
NY Presbyterian Hospital @ New York Weill – Cornell College 525 East 68th Street New York, New York 10021
NYU Hospitals Center 550 First Avenue New York, New York 10016
NYU Winthrop University Hospital 259 First Street Mineola, New York 11501
North Shore University Hospital 300 Community Drive Manhasset, New York 11030
Rochester General Hospital 1425 Portland Avenue Rochester, New York 14621
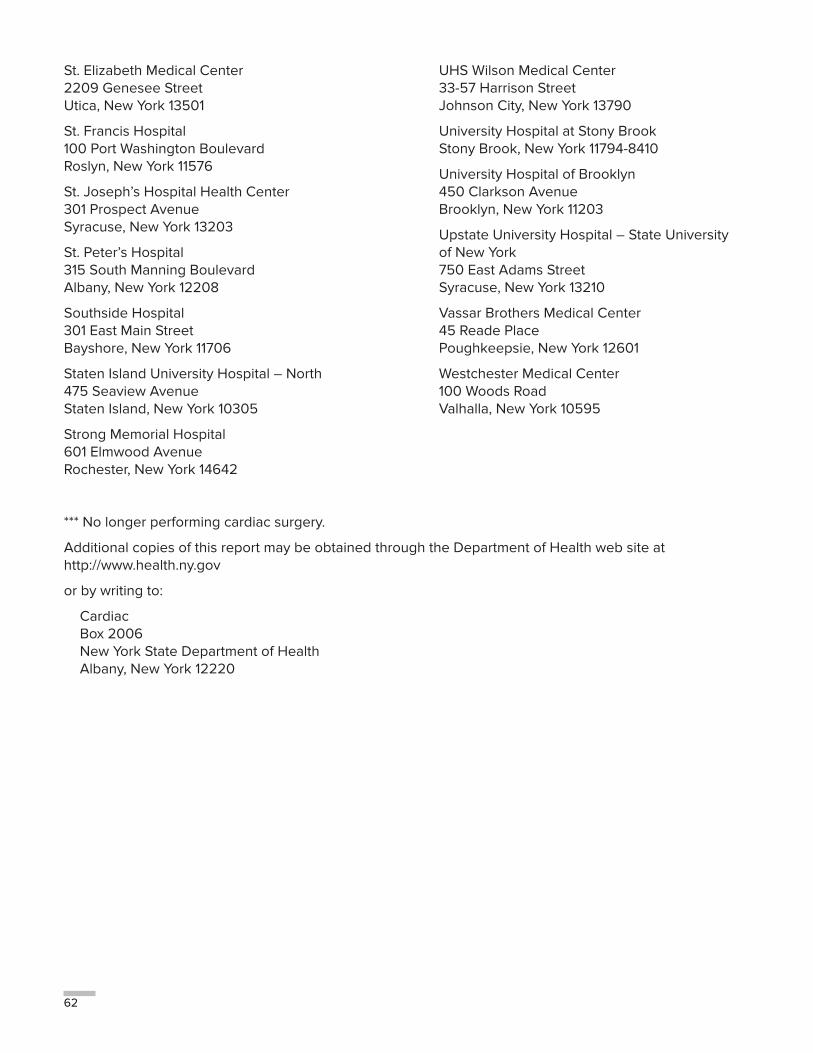
62
St. Elizabeth Medical Center 2209 Genesee Street Utica, New York 13501
St. Francis Hospital 100 Port Washington Boulevard Roslyn, New York 11576
St. Joseph’s Hospital Health Center 301 Prospect Avenue Syracuse, New York 13203
St. Peter’s Hospital 315 South Manning Boulevard Albany, New York 12208
Southside Hospital 301 East Main Street Bayshore, New York 11706
Staten Island University Hospital – North 475 Seaview Avenue Staten Island, New York 10305
Strong Memorial Hospital 601 Elmwood Avenue Rochester, New York 14642
UHS Wilson Medical Center 33-57 Harrison Street Johnson City, New York 13790
University Hospital at Stony Brook Stony Brook, New York 11794-8410
University Hospital of Brooklyn 450 Clarkson Avenue Brooklyn, New York 11203
Upstate University Hospital – State University of New York 750 East Adams Street Syracuse, New York 13210
Vassar Brothers Medical Center 45 Reade Place Poughkeepsie, New York 12601
Westchester Medical Center 100 Woods Road Valhalla, New York 10595
*** No longer performing cardiac surgery.
Additional copies of this report may be obtained through the Department of Health web site at http://www.health.ny.gov
or by writing to:
Cardiac Box 2006 New York State Department of Health Albany, New York 12220

Departmentof Health
2/18