Adoption and Efficacy of Wechsler Intelligence Scale for ...
18
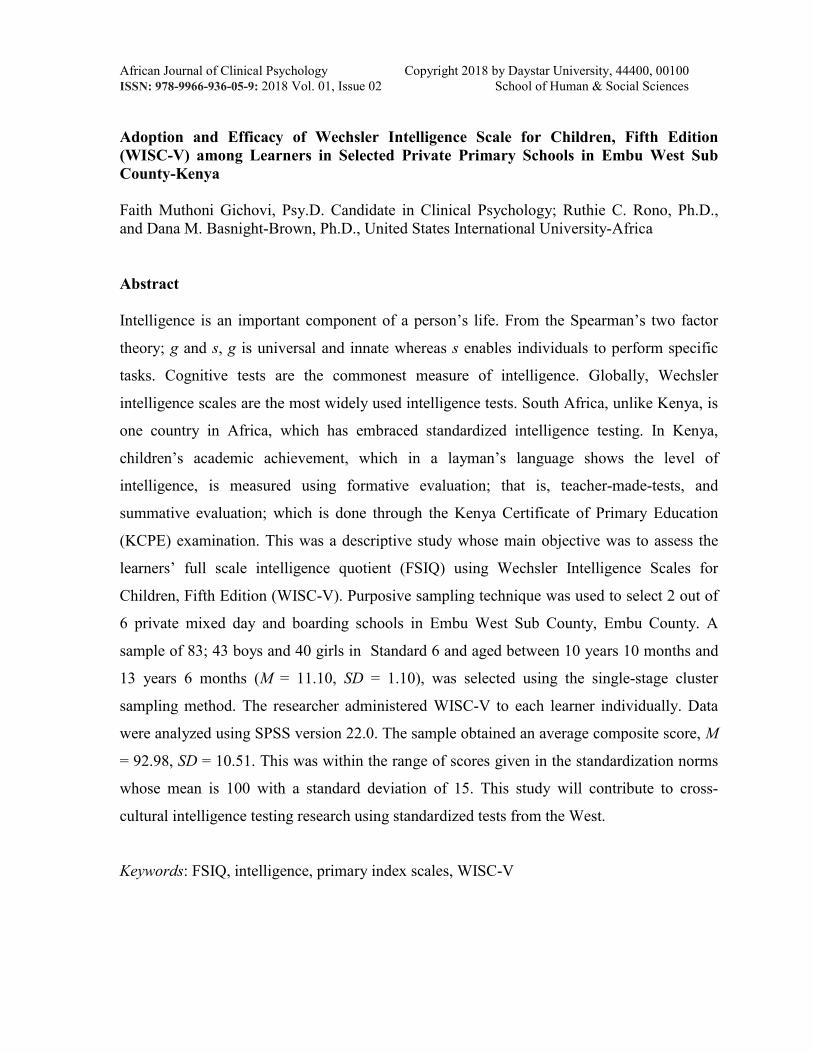
African Journal of Clinical Psychology Copyright 2018 by Daystar University, 44400, 00100 ISSN: 978-9966-936-05-9: 2018 Vol. 01, Issue 02 School of Human & Social Sciences Adoption and Efficacy of Wechsler Intelligence Scale for Children, Fifth Edition (WISC-V) among Learners in Selected Private Primary Schools in Embu West Sub County-Kenya Faith Muthoni Gichovi, Psy.D. Candidate in Clinical Psychology; Ruthie C. Rono, Ph.D., and Dana M. Basnight-Brown, Ph.D., United States International University-Africa Abstract Intelligence is an important component of a person’s life. From the Spearman’s two factor theory; g and s, g is universal and innate whereas s enables individuals to perform specific tasks. Cognitive tests are the commonest measure of intelligence. Globally, Wechsler intelligence scales are the most widely used intelligence tests. South Africa, unlike Kenya, is one country in Africa, which has embraced standardized intelligence testing. In Kenya, children’s academic achievement, which in a layman’s language shows the level of intelligence, is measured using formative evaluation; that is, teacher-made-tests, and summative evaluation; which is done through the Kenya Certificate of Primary Education (KCPE) examination. This was a descriptive study whose main objective was to assess the learners’ full scale intelligence quotient (FSIQ) using Wechsler Intelligence Scales for Children, Fifth Edition (WISC-V). Purposive sampling technique was used to select 2 out of 6 private mixed day and boarding schools in Embu West Sub County, Embu County. A sample of 83; 43 boys and 40 girls in Standard 6 and aged between 10 years 10 months and 13 years 6 months (M = 11.10, SD = 1.10), was selected using the single-stage cluster sampling method. The researcher administered WISC-V to each learner individually. Data were analyzed using SPSS version 22.0. The sample obtained an average composite score, M = 92.98, SD = 10.51. This was within the range of scores given in the standardization norms whose mean is 100 with a standard deviation of 15. This study will contribute to cross- cultural intelligence testing research using standardized tests from the West. Keywords: FSIQ, intelligence, primary index scales, WISC-V
Transcript of Adoption and Efficacy of Wechsler Intelligence Scale for ...
African Journal of Clinical Psychology Copyright 2018 by Daystar University, 44400, 00100 ISSN: 978-9966-936-05-9: 2018 Vol. 01, Issue 02 School of Human & Social Sciences
Adoption and Efficacy of Wechsler Intelligence Scale for Children, Fifth Edition (WISC-V) among Learners in Selected Private Primary Schools in Embu West Sub County-Kenya Faith Muthoni Gichovi, Psy.D. Candidate in Clinical Psychology; Ruthie C. Rono, Ph.D., and Dana M. Basnight-Brown, Ph.D., United States International University-Africa
Abstract
Intelligence is an important component of a person’s life. From the Spearman’s two factor
theory; g and s, g is universal and innate whereas s enables individuals to perform specific
tasks. Cognitive tests are the commonest measure of intelligence. Globally, Wechsler
intelligence scales are the most widely used intelligence tests. South Africa, unlike Kenya, is
one country in Africa, which has embraced standardized intelligence testing. In Kenya,
children’s academic achievement, which in a layman’s language shows the level of
intelligence, is measured using formative evaluation; that is, teacher-made-tests, and
summative evaluation; which is done through the Kenya Certificate of Primary Education
(KCPE) examination. This was a descriptive study whose main objective was to assess the
learners’ full scale intelligence quotient (FSIQ) using Wechsler Intelligence Scales for
Children, Fifth Edition (WISC-V). Purposive sampling technique was used to select 2 out of
6 private mixed day and boarding schools in Embu West Sub County, Embu County. A
sample of 83; 43 boys and 40 girls in Standard 6 and aged between 10 years 10 months and
13 years 6 months (M = 11.10, SD = 1.10), was selected using the single-stage cluster
sampling method. The researcher administered WISC-V to each learner individually. Data
were analyzed using SPSS version 22.0. The sample obtained an average composite score, M
= 92.98, SD = 10.51. This was within the range of scores given in the standardization norms
whose mean is 100 with a standard deviation of 15. This study will contribute to cross-
cultural intelligence testing research using standardized tests from the West.
Keywords: FSIQ, intelligence, primary index scales, WISC-V
African Journal of Clinical Psychology Copyright 2018 by Daystar University, 44400, 00100 ISSN: 978-9966-936-05-9: 2018 Vol. 01, Issue 02 School of Human & Social Sciences
Introduction and background
Intelligence is an important factor to a person as he or she tries to maneuver the world around
him or her. It enables one to think rationally and act responsibly within his or her
environment. Globally, Wechsler intelligence scales are the most widely used intelligence
measures, with South Africa being the greatest consumer in Africa (Shuttleworth-Edwards &
Van de Merwe, 2015; Cockcroft, Alloway, Copello & Milligan, 2015).
The development of WISC-V was influenced by theories, neuro-developmental research, and
clinical utility. It is modeled after contemporary structural intelligence theories, such as
Cattell-Horn-Carroll (CHC); which can be utilized in the interpretation of WISC-V (Pearson,
2015). Among the many theories of intelligence, the CHC theory is the most widely accepted
due to its empirical support and comprehensiveness. Construction of most intelligence tests is
based on this theory (Schwehr, 2015). The Horn-Cattell theory proposes fluid and
crystallized intelligence. Fluid intelligence is an indicator of ability, whereas, crystallized
intelligence is said to be integrated through culture. Environmental factors such as culture
and education therefore influence a person’s intelligence (Cattell, 1967).
Cattell argues that fluid intelligence influences crystallized ability. This has been refuted due
to the fact that fluid ability includes non-verbal reasoning and crystallized abilities consist of
verbal- educational abilities (Kyllonen & Kell, 2017). The Spearman theory of intelligence is
among the oldest theories. He proposed a theory of intelligence comprising two factors; the
general (g) factor and the specific (s) factor. The g factor represents the more general mental
energy involved in the more complex mental operations such as ability, intensity, quickness
and intellectual productivity ( Flanagan, McGrew & Ortiz, 2000; Meyers, 2004).
Intelligence tests have been widely used to predict academic achievements of children in the
West (Sternberg, Grigorenko & Bundy, 2001). Gottfredson (1998) claimed that it is possible
and also important to test people’s intelligence. This is because the (g) factor is common in
all human beings. Despite the content, intelligence tests indicate that there exists a global
factor that pervades all aspects of cognition. This global factor tends to considerably
African Journal of Clinical Psychology Copyright 2018 by Daystar University, 44400, 00100 ISSN: 978-9966-936-05-9: 2018 Vol. 01, Issue 02 School of Human & Social Sciences
influence an individual’s practical quality of life. She argued that intelligence has proved to
be the single most effective predictor of a person’s school and job performance. Intelligence
also predicts other aspects of well-being including chances of dropping out of school, being
unemployed, divorced, or having illegitimate children.
Further, Schneider and McGrew (2013) reported that low intelligence, not only predicts
consumer behavior and inability to learn a foreign language, but also delinquent behavior.
They argued that persons of low intelligence are more likely to engage in criminal activities
due to their inability to understand the consequences of their actions or to delay gratification.
Bickel (2015) argued that the subtests measure the person’s ability to understand and grasp
what is happening in the world around him or her. They evaluate the resourcefulness of the
person in coping with the challenges in the immediate environment. Therefore, intelligence
has been a topic of interest to governments, educationists, psychologists, and individuals for
different reasons Weiss, Saklofske, Holdnack & Prifitera, 2016).
David Wechsler, an American psychologist‘s clinical skills, experience in testing during the
First World War (WWI) coupled with the statistical training received under Pearson and
Spearman in England enabled him to develop the Wechsler psychological assessments tools.
Wechsler intelligence scale for children (WISC) was modeled on the Army intelligence
scales developed during the WW1. They have a sound theoretical base, and have influenced
the development of and research in other tests. These scales have made a great impact in the
field of intelligence and cognitive abilities testing (Corwin, 2002; Konald & Canivez, 2010).
Flanagan and his colleagues (2000) also acknowledged that the Wechsler intelligence scales
are unequalled in the field of cognitive ability testing. However, few critics have argued that
the Wechsler scales have their flaws (Flanagan, McGrew & Ortiz, 2000). Benson (2003)
argued that the Wechsler intelligence scales for children continue to dominate the world of
intelligence testing despite what critics say. They have evolved with more research and
practice from the Wechsler Bellevue Scale (1939) to the current WISC-V (2014). The scales
take the form of individual administration Weiss et al., 2016).
African Journal of Clinical Psychology Copyright 2018 by Daystar University, 44400, 00100 ISSN: 978-9966-936-05-9: 2018 Vol. 01, Issue 02 School of Human & Social Sciences
WISC-V is a comprehensive clinical tool for assessing intelligence of children aged between
6:0 and 16:11 years. It comprises primary and secondary subtests which are set on a scaled
score metric. It is a standardized test developed, normed, and standardized in the West.
During standardization, it was normalized and assigned a mean of 100, with a standard
deviation of 15 (PsychCorp, 2015; Kaufman, Raiford & Coalson, 2016). The standard scores
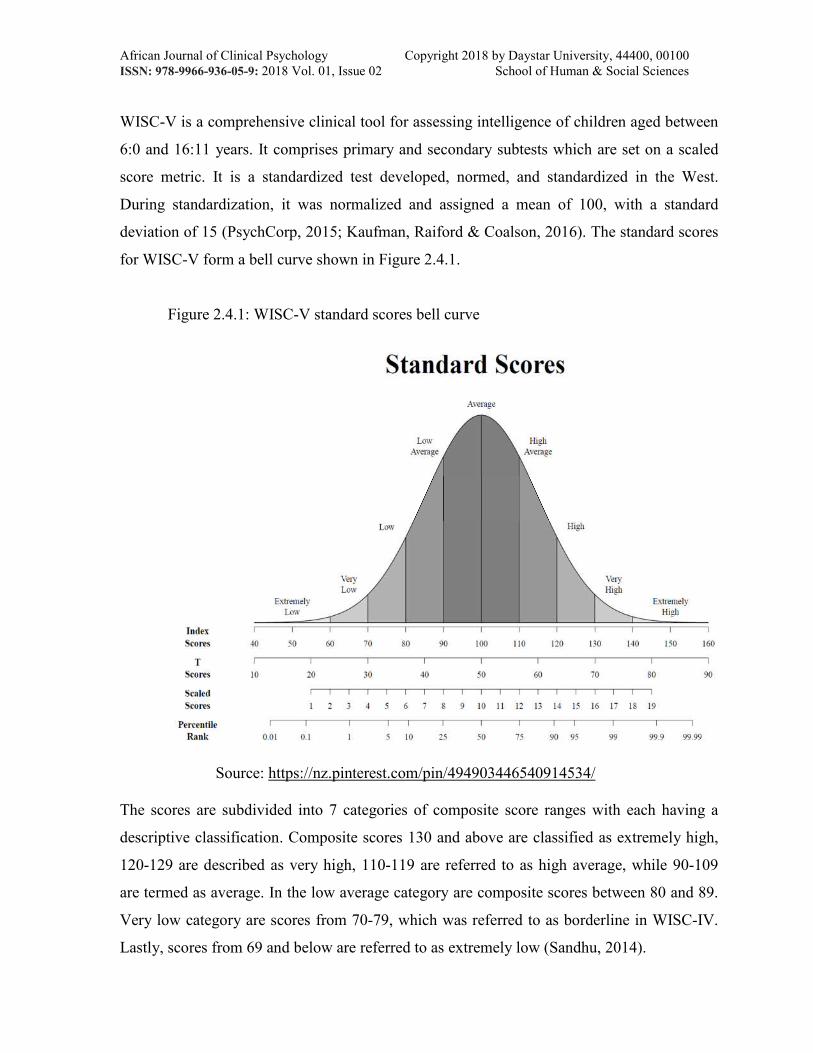
for WISC-V form a bell curve shown in Figure 2.4.1.
Figure 2.4.1: WISC-V standard scores bell curve
Source: https://nz.pinterest.com/pin/494903446540914534/
The scores are subdivided into 7 categories of composite score ranges with each having a
descriptive classification. Composite scores 130 and above are classified as extremely high,
120-129 are described as very high, 110-119 are referred to as high average, while 90-109
are termed as average. In the low average category are composite scores between 80 and 89.
Very low category are scores from 70-79, which was referred to as borderline in WISC-IV.
Lastly, scores from 69 and below are referred to as extremely low (Sandhu, 2014).
African Journal of Clinical Psychology Copyright 2018 by Daystar University, 44400, 00100 ISSN: 978-9966-936-05-9: 2018 Vol. 01, Issue 02 School of Human & Social Sciences
Little literature was available for review in this study on testing of children using WISC-V
because it is relatively new in the market. However, studies that document testing using the
older versions are available. WISC-IV was normalized and assigned a mean of 100 and a
standard deviation of 15 (Bickel, 2015). Van Tonder (2007) assessed 36 grade 7 children
aged between 12 and 13 years using WISC-IV. They were stratified according to the quality
of education into three groups; English speaking private schools, Xhosa speaking private
schools, and Department of Education and Training (DET) schools.
Those from the English speaking private schools were the best with an average score of
112.83; above average range. They were followed by the Xhosa speaking in private schools
with an average score of 93.92 which is in the average range. Last were those from the Xhosa
speaking in Department of Education and Training (DET) schools with a mean score of
77.08, which is in the borderline range. In 2015, Bickel conducted a study using WISC-IV to
find out how Grade 3 Xhosa- speaking learners’ scores from disadvantaged background
compared with those of the UK population. She also wanted to compare performance of the
Xhosa- speaking grade 3 and Xhosa- speaking grade 7 learners’ scores reported by Van
Tonder in 2007. The research showed that the average FSIQ of Grade 3 Xhosa- speaking
children was 78.95, while the UK group obtained a mean FSIQ score of 99.40 (Bickel, 2015).
WISC-V was utilized in individual testing of an 8 years 2 months old grade 4 multiracial girl
named Laurie Jones. She was assessed on 6/1/2015. Her FSIQ score was 85, which is in the
16 percentile rank at 80-91 Confidence Interval (CI) compared to other children of her age.
This was in the low average range. John Smith, the examiner noted that several factors
influenced the WISC-V cognitive ability scores but may not be captured in the report. He
therefore recommended that the scores be taken as representing a child’s current functioning
and a repeat be done after some time. He argued that the second testing scores may be
slightly higher or lower than the first test scores (PsychCorp, 2015).
A parent reported that his child had obtained the following scores on WISC-V and wanted to
know whether the child can be classified as gifted for placement into the gifted education
African Journal of Clinical Psychology Copyright 2018 by Daystar University, 44400, 00100 ISSN: 978-9966-936-05-9: 2018 Vol. 01, Issue 02 School of Human & Social Sciences
program; FSIQ: 118, working memory: 117, verbal comprehension: 116, fluid reasoning:
112, processing speed: 108, and visual spatial: 97. The response was that further testing was
required before one could conclusively place him in the program because of a likely
mismatch between ability and learning (Sandhu, 2014).
Several studies on intelligence in South Africa have in the past indicated that the blacks
performed poorer than Afrikaans, whose performance was lower than that of the whites
(Rushton & Jensen, 2005; Bickel, 2015). This study agrees with this assertion because the
few available intelligence test results involving non white populations report scores that are
lower than the standardization mean of 100. Those who use English as their first language
outperform those whom English is not their first language. Cross cultural differences are
reported among Chinese, Europeans and Canadians when compared to the USA
standardization. Similarly, in Zimbabwe, a lowering of up to 30 IQ points has been reported
for black children when compared with London children (Konald & Canivez, 2010).
Most intelligence tests are administered in Western countries where chidrens’ first and
probably the only language is English. The sample in this study is multilingual. The
children's first languages are their diverse mother tongues, then Kiswahili followed by
English. There was also evdience of “Sheng, the language spoken by Kenyan youth today.
There was also a tendency to mix English, Kiswahili, and ‘sheng”, and to switch languages
during the assessment. This may not only have affected their VCI, but also their FSIQ scores.
There were times when a word would slip through, and evidently, a learner would struggle to
remember, but ultimately would not be able to articulate the answer. Proficiency in English
affects scores in that if one speaks more than one language, there will be a split of resources
between the two and that impacts their vocabulary and response during testing (Niolon,
2005).
Bickel (2015) asserted that language is the most influential factor that mediates performance
in a test. When children are tested in a language they don’t regularly use in all settings, the
test language may deny them the advantage of use of the medium of communication through
which they acquired most of the knowledge and experience. It will affect scores in both
African Journal of Clinical Psychology Copyright 2018 by Daystar University, 44400, 00100 ISSN: 978-9966-936-05-9: 2018 Vol. 01, Issue 02 School of Human & Social Sciences
verbal and non-verbal subtests. This study will not only contribute to data on cross cultural
standardized intelligence testing by comparing the composite scores of the Kenyan children
with the standardization norms, but also show that the results agree with the Spearman’s two
factor theory, g and s and Cattell-Horn-Carroll’s fluid and crystallized theory. Intelligence is
universal and innate. Children in this study were able to solve problems they had not
encountered before and applied previously learned material to solve new problems.
Methodology
Purposive sampling technique was employed to select 2 out of 6 private primary schools in
Embu West Sub County. These school possessed the characteristics that the researcher was
interested in so as to collect data to answer the research question (Tongco (2007). The
schools were mixed day and boarding, they conduct parents meetings every term which
enabled the researcher to obtain parental consent, and they administered the common Kenya
Private Schools Association (KPSA) examinations to their learners. This helped control for
extraneous variables when comparing their scores.
The study utilized a descriptive survey design with a quantitative approach to assess the Full
Scale Intelligence Quotient (FSIQ) of children aged between 10 years 10 months and 13
years 6 months (M = 11.10, SD = 1.10) in 2 private schools in Embu West Sub County. It
comprised 83 (N = 43 boys and N = 40 girls) out of the 87 sampled respondents all in
Standard 6; that is equivalent of grade 4, selected using the single stage cluster sampling
method in which all the units in the cluster qualified for selection. Parents, head teachers, and
respondents were informed about the study 5 months in advance.
Parents granted written consent while the children gave their assent for participation in the
study. The head teachers, parents and participants were assured of confidentiality and
privacy. Coding was done during data collection and publishing. Similar codes were run
through each learner’s documents including the Parental Consent Form, Record Form, and
Response Booklet 1. This also helped to avoid any mix up of the data.

African Journal of Clinical Psychology Copyright 2018 by Daystar University, 44400, 00100 ISSN: 978-9966-936-05-9: 2018 Vol. 01, Issue 02 School of Human & Social Sciences
The United States International University-Africa (USIU-A) reviewed the proposal and
through the Institutional Review Board (IRB) gave approval for the study. Authority to
conduct the study in Kenya was granted by the National Commission for Science,
Technology and Innovation (NACOSTI). The NACOSTI permit and letter were utilized to
request for permission from the Deputy County Commissioner, Embu West and the County
Director of Education, Embu. The two offices granted permission to conduct the study in the
Sub County and the 2 schools respectively. The researcher planned to network with the
schools to get as many parents consenting as possible.
Only the children who gave assent and whose parents or guardians granted written consent
were considered for participation in the study. Five respondents did not participate due to
withdrawal of assent and transfers out or in the school after parental consent had been
granted. The ten subtests that constitute five WISC-V primary index scales were
administered individually to each learner by the researcher following the test protocol
outlined in the WISC-V Administration and Scoring Manual. The manual stipulates the
environmental conditions required during the assessment, rapport building, starting point for
each subtest according to the child’s age, discontinue rule, and what to do when assessment
is not completed in one session. Assessment was conducted during the evenings, weekends
and at times early in the morning to avoid getting learners out of class during lessons.
Stimulus Book 1 contained some of the stimuli that were administered by the examiner
namely, Block Design, Matrix Reasoning, Figure Weights, and Visual Puzzles. The only
stimulus relevant to this study contained in Stimulus Book 2 was Picture Span. Response
Booklet 1 contained the Coding and Symbol Search subtests. The rest were found in the
manual. The ten subtests completed for this study were Block Design, Similarities, Matrix
Reasoning, Digit Span, Coding, Vocabulary, Figure Weights, Visual Puzzles, Picture Span
and Symbol Search. Seven out of these namely; Block Design, Similarities, Matrix
Reasoning, Digit Span, Coding, Vocabulary, and Figure Weights were used to derive the
FSIQ. It took each learner approximately 1 hour 45 minutes to complete the test. Wechsler
suggests 1 hour 15 minutes for completion of the ten subtests (Wechsler, 2014).
African Journal of Clinical Psychology Copyright 2018 by Daystar University, 44400, 00100 ISSN: 978-9966-936-05-9: 2018 Vol. 01, Issue 02 School of Human & Social Sciences
The WISC-V Record Form was used to record the names of the child and examiner, test date,
birth date and test age of the child. The manual has given the formula for calculation of the
test age (Wechsler, 2014). The researcher recorded the learner’s responses verbatim for the
Similarities and Vocabulary subtests. For other subtests the responses were recorded as given
except for the Coding and Symbol Search subtests that were completed by the learner in the
Response Booklet 1 and timed by the researcher. The researcher filled in each learner’s raw
scores at the end of the subtest in the spaces provided. The same scores were entered at
summary page at the back of the Record Form. The Coding Key Template was used to score
the coding subtest.
The Administration and Scoring Manual was utilized in obtaining the corresponding scaled
scores for each subtest according to the age of the learner. The learner’s final full scale score
was also utilized to check his or her FSIQ score in the manual. These were then converted to
composite scores and given the percentile rank at 90-95% Confidence Interval.
Data were entered into the Data and Variable Views and analyzed using Statistical Package
for Social Sciences version 22.0 (SPSS v. 22.0). Tables, pie chart, and histograms were
generated. Both the Record Form and the Response Booklet 1 contained spaces for recoding
behavior observation during testing. Though this was done, it was only used for
recommendations to the parents on a few cases that required intervention.
Results
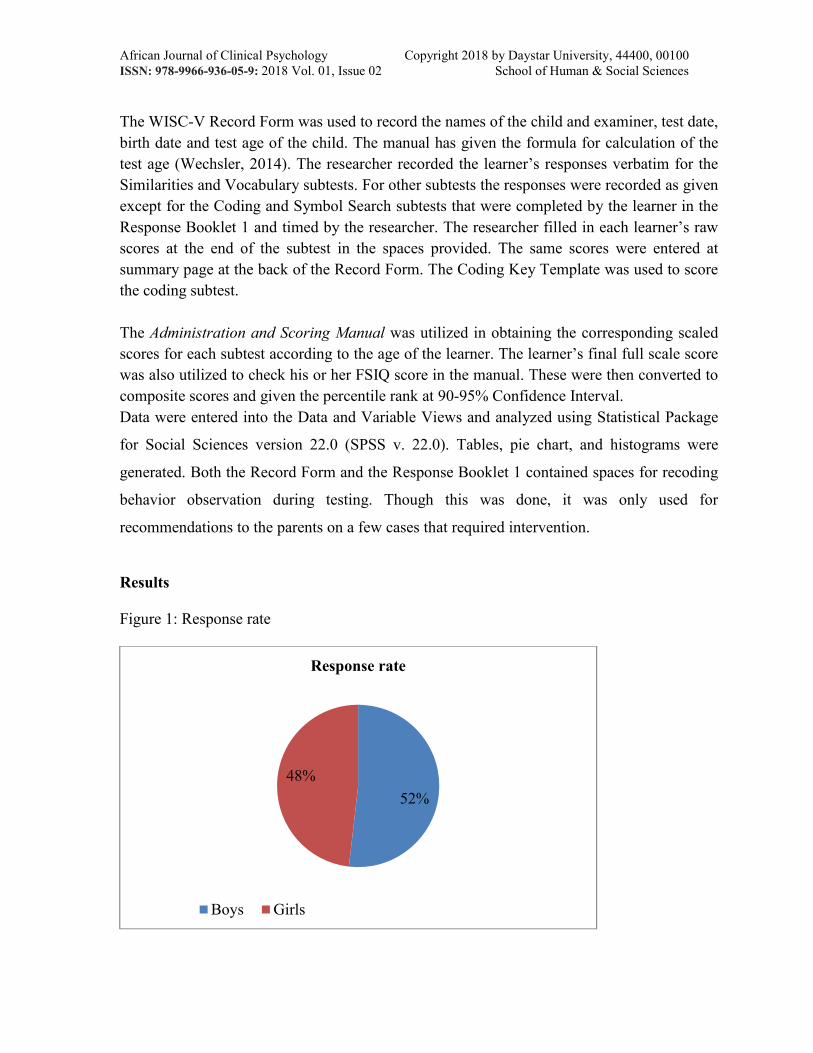
Figure 1: Response rate
52%
48%
Response rate
Boys Girls
African Journal of Clinical Psychology Copyright 2018 by Daystar University, 44400, 00100 ISSN: 978-9966-936-05-9: 2018 Vol. 01, Issue 02 School of Human & Social Sciences
The respondents were 83; 43 boys and 40 girls. This translated to 52% boys and 48% girls
(see Figure 1). The boys’ average age was 12 years while that of the girls was 11 years 3
months. The age range of the sample was 10 years 10 months and 13 years 6 months (M =
11.10, SD = 1.10). The study realized 95 % response rate; that is, 83 out of 87 sampled
respondents participated.
African Journal of Clinical Psychology Copyright 2018 by Daystar University, 44400, 00100 ISSN: 978-9966-936-05-9: 2018 Vol. 01, Issue 02 School of Human & Social Sciences
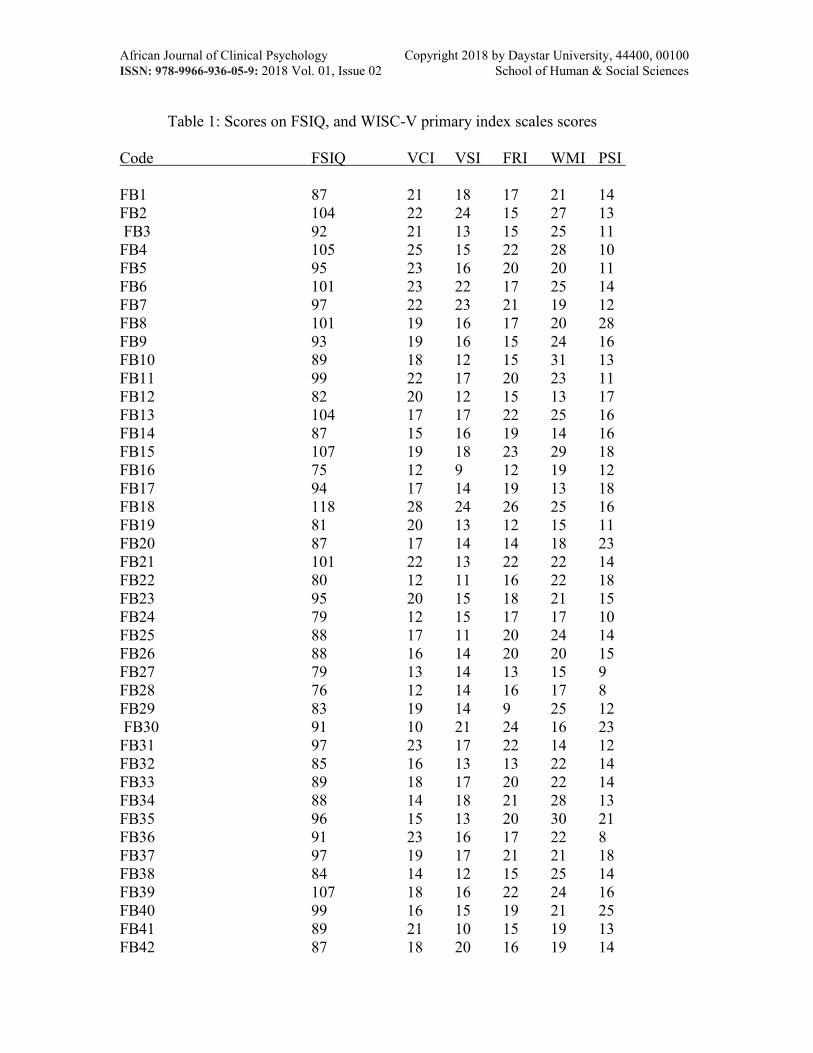
Table 1: Scores on FSIQ, and WISC-V primary index scales scores
Code FSIQ VCI VSI FRI WMI PSI
FB1 87 21 18 17 21 14 FB2 104 22 24 15 27 13 FB3 92 21 13 15 25 11 FB4 105 25 15 22 28 10 FB5 95 23 16 20 20 11 FB6 101 23 22 17 25 14 FB7 97 22 23 21 19 12 FB8 101 19 16 17 20 28 FB9 93 19 16 15 24 16 FB10 89 18 12 15 31 13 FB11 99 22 17 20 23 11 FB12 82 20 12 15 13 17 FB13 104 17 17 22 25 16 FB14 87 15 16 19 14 16 FB15 107 19 18 23 29 18 FB16 75 12 9 12 19 12 FB17 94 17 14 19 13 18 FB18 118 28 24 26 25 16 FB19 81 20 13 12 15 11 FB20 87 17 14 14 18 23 FB21 101 22 13 22 22 14 FB22 80 12 11 16 22 18 FB23 95 20 15 18 21 15 FB24 79 12 15 17 17 10 FB25 88 17 11 20 24 14 FB26 88 16 14 20 20 15 FB27 79 13 14 13 15 9 FB28 76 12 14 16 17 8 FB29 83 19 14 9 25 12 FB30 91 10 21 24 16 23 FB31 97 23 17 22 14 12 FB32 85 16 13 13 22 14 FB33 89 18 17 20 22 14 FB34 88 14 18 21 28 13 FB35 96 15 13 20 30 21 FB36 91 23 16 17 22 8 FB37 97 19 17 21 21 18 FB38 84 14 12 15 25 14 FB39 107 18 16 22 24 16 FB40 99 16 15 19 21 25 FB41 89 21 10 15 19 13 FB42 87 18 20 16 19 14
African Journal of Clinical Psychology Copyright 2018 by Daystar University, 44400, 00100 ISSN: 978-9966-936-05-9: 2018 Vol. 01, Issue 02 School of Human & Social Sciences
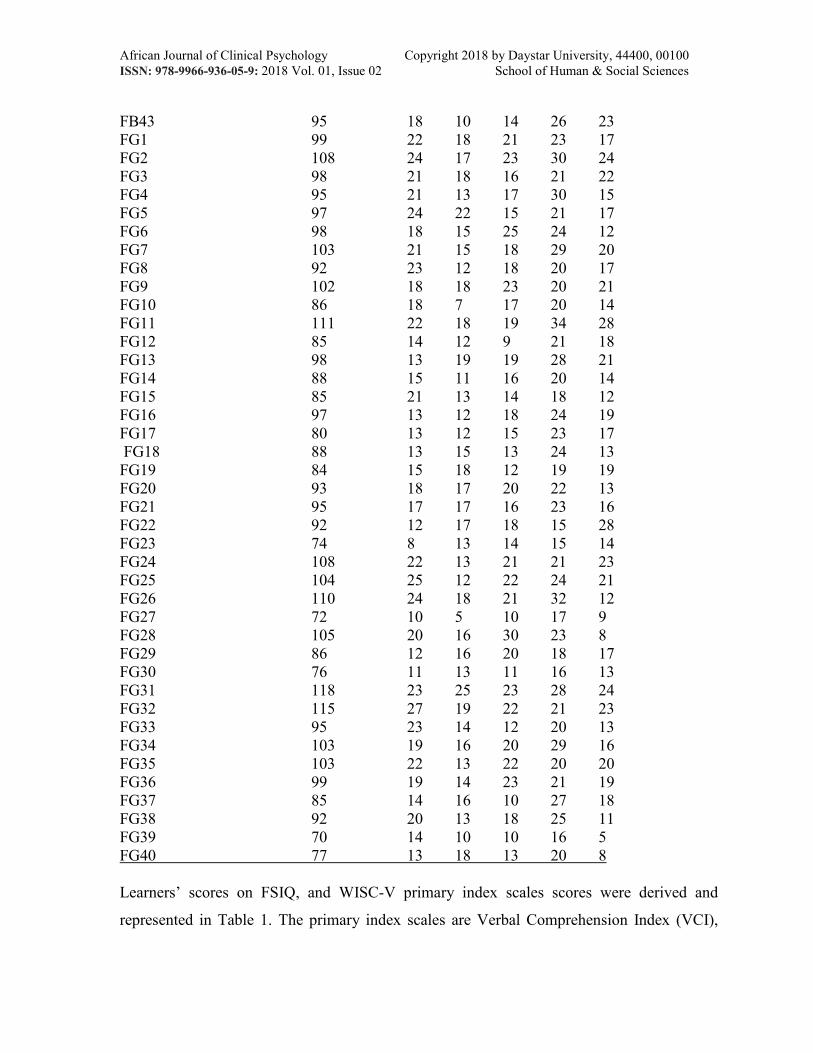
FB43 95 18 10 14 26 23 FG1 99 22 18 21 23 17 FG2 108 24 17 23 30 24 FG3 98 21 18 16 21 22 FG4 95 21 13 17 30 15 FG5 97 24 22 15 21 17 FG6 98 18 15 25 24 12 FG7 103 21 15 18 29 20 FG8 92 23 12 18 20 17 FG9 102 18 18 23 20 21 FG10 86 18 7 17 20 14 FG11 111 22 18 19 34 28 FG12 85 14 12 9 21 18 FG13 98 13 19 19 28 21 FG14 88 15 11 16 20 14 FG15 85 21 13 14 18 12 FG16 97 13 12 18 24 19 FG17 80 13 12 15 23 17 FG18 88 13 15 13 24 13 FG19 84 15 18 12 19 19 FG20 93 18 17 20 22 13 FG21 95 17 17 16 23 16 FG22 92 12 17 18 15 28 FG23 74 8 13 14 15 14 FG24 108 22 13 21 21 23 FG25 104 25 12 22 24 21 FG26 110 24 18 21 32 12 FG27 72 10 5 10 17 9 FG28 105 20 16 30 23 8 FG29 86 12 16 20 18 17 FG30 76 11 13 11 16 13 FG31 118 23 25 23 28 24 FG32 115 27 19 22 21 23 FG33 95 23 14 12 20 13 FG34 103 19 16 20 29 16 FG35 103 22 13 22 20 20 FG36 99 19 14 23 21 19 FG37 85 14 16 10 27 18 FG38 92 20 13 18 25 11 FG39 70 14 10 10 16 5 FG40 77 13 18 13 20 8 Learners’ scores on FSIQ, and WISC-V primary index scales scores were derived and
represented in Table 1. The primary index scales are Verbal Comprehension Index (VCI),
African Journal of Clinical Psychology Copyright 2018 by Daystar University, 44400, 00100 ISSN: 978-9966-936-05-9: 2018 Vol. 01, Issue 02 School of Human & Social Sciences
Visual Spatial Index (VSI), Fluid Reasoning Speed Index (FRI), Working Memory Index
(WMI), and Processing Speed Index (PSI).
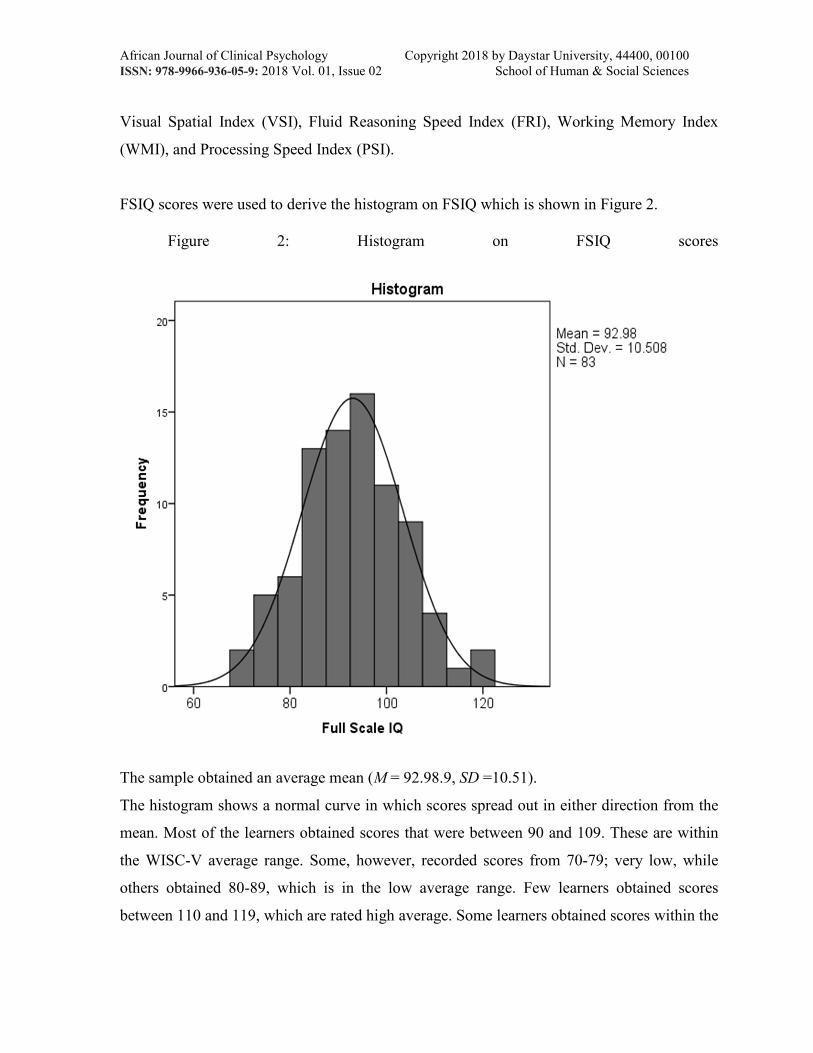
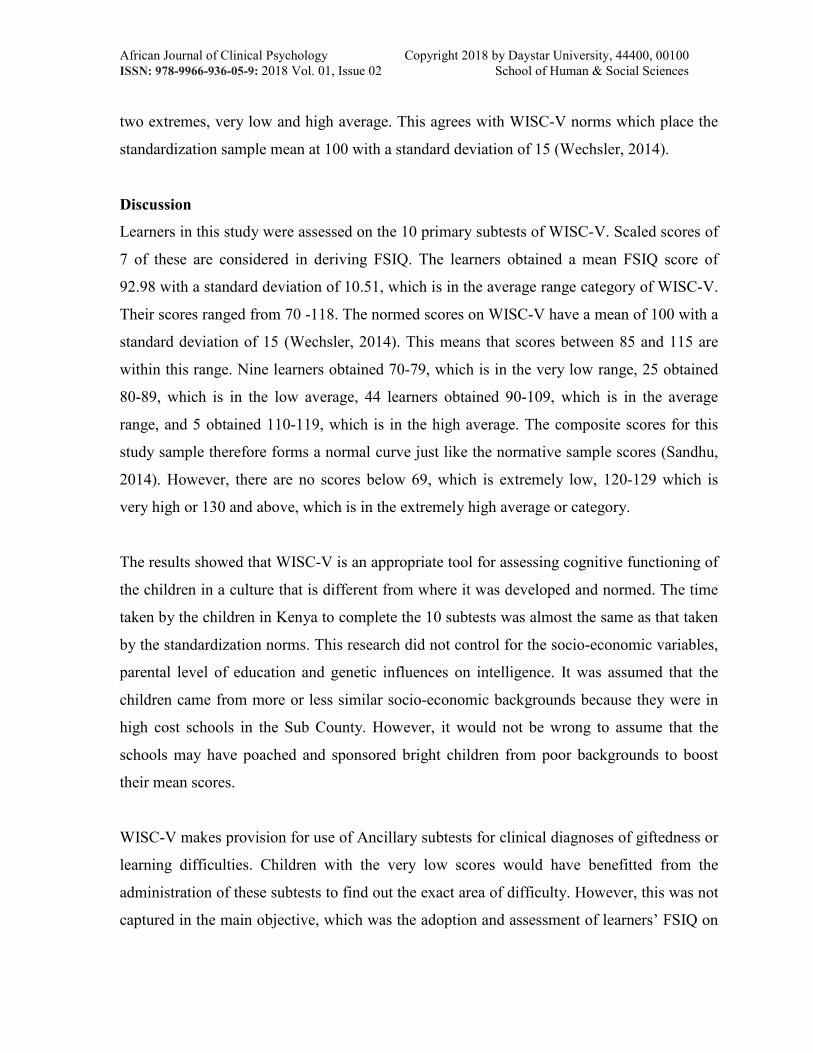
FSIQ scores were used to derive the histogram on FSIQ which is shown in Figure 2.
Figure 2: Histogram on FSIQ scores
The sample obtained an average mean (M = 92.98.9, SD =10.51).
The histogram shows a normal curve in which scores spread out in either direction from the
mean. Most of the learners obtained scores that were between 90 and 109. These are within
the WISC-V average range. Some, however, recorded scores from 70-79; very low, while
others obtained 80-89, which is in the low average range. Few learners obtained scores
between 110 and 119, which are rated high average. Some learners obtained scores within the
African Journal of Clinical Psychology Copyright 2018 by Daystar University, 44400, 00100 ISSN: 978-9966-936-05-9: 2018 Vol. 01, Issue 02 School of Human & Social Sciences
two extremes, very low and high average. This agrees with WISC-V norms which place the
standardization sample mean at 100 with a standard deviation of 15 (Wechsler, 2014).
Discussion
Learners in this study were assessed on the 10 primary subtests of WISC-V. Scaled scores of
7 of these are considered in deriving FSIQ. The learners obtained a mean FSIQ score of
92.98 with a standard deviation of 10.51, which is in the average range category of WISC-V.
Their scores ranged from 70 -118. The normed scores on WISC-V have a mean of 100 with a
standard deviation of 15 (Wechsler, 2014). This means that scores between 85 and 115 are
within this range. Nine learners obtained 70-79, which is in the very low range, 25 obtained
80-89, which is in the low average, 44 learners obtained 90-109, which is in the average
range, and 5 obtained 110-119, which is in the high average. The composite scores for this
study sample therefore forms a normal curve just like the normative sample scores (Sandhu,
2014). However, there are no scores below 69, which is extremely low, 120-129 which is
very high or 130 and above, which is in the extremely high average or category.
The results showed that WISC-V is an appropriate tool for assessing cognitive functioning of
the children in a culture that is different from where it was developed and normed. The time
taken by the children in Kenya to complete the 10 subtests was almost the same as that taken
by the standardization norms. This research did not control for the socio-economic variables,
parental level of education and genetic influences on intelligence. It was assumed that the
children came from more or less similar socio-economic backgrounds because they were in
high cost schools in the Sub County. However, it would not be wrong to assume that the
schools may have poached and sponsored bright children from poor backgrounds to boost
their mean scores.
WISC-V makes provision for use of Ancillary subtests for clinical diagnoses of giftedness or
learning difficulties. Children with the very low scores would have benefitted from the
administration of these subtests to find out the exact area of difficulty. However, this was not
captured in the main objective, which was the adoption and assessment of learners’ FSIQ on
African Journal of Clinical Psychology Copyright 2018 by Daystar University, 44400, 00100 ISSN: 978-9966-936-05-9: 2018 Vol. 01, Issue 02 School of Human & Social Sciences
WISC-V. Future studies may consider diagnoses of the children with scores in the extreme
categories.
Conclusion
Intelligence is an essential component in every person’s life. It is measured by the means of
cognitive ability tests. In the West, there are varieties of standardized intelligence tests,
including, WISC-V. In this study, learners obtained FSIQ scores, which were in the average
range (M = 92.98, SD = 10.51). The composite scores formed a normal curve. These compare
appropriately with the standardization norms whose mean is 100 with a standard deviation of
15 (Wechsler, 2014; Kaufman et al., 2016).
Future studies should consider controlling for extraneous variables such as the socio-
economic status, among others. Other studies reported excluding children with very low
scores. Since some of the children with extremely low scores in this study were repeating
class six, consideration of whether to include their scores in the final tally or not should be
made in future.
The schools in Kenya may consider adopting standardized tests, such as WISC-V to place
learners early enough, especially now that there is change towards Competency Based
Curriculum (CBC). CBC aims at identifying learners’ talents well in advance so as to avoid
wastage and frustration caused by making children to repeat classes only for them to end up
scoring very low marks at the end of the primary school cycle.
African Journal of Clinical Psychology Copyright 2018 by Daystar University, 44400, 00100 ISSN: 978-9966-936-05-9: 2018 Vol. 01, Issue 02 School of Human & Social Sciences
References
Benson, E. (2003, February). Intelligence across cultures: Research in Africa, Asia and Latin America is showing how culture and intelligence interact.
Bickel, A. (2015). WISC-IV test performance of Grade 3 Xhosa- speaking children. University of Fort Hare.
Cattell, R. B. (1967). The theory of fluid and crystallized general intelligence checked at the
5-6 year-old level. British Journal of Educational Psychology, 37(2), 209–224. http://doi.org/10.1111/j.2044-8279.1967.tb01930.x
Corwin, B. (2002). From the Binet-Simon to the Wechsler–Bellevue: Tracing the history of
intelligence testing. Journal of Clinical and Experimental Neuropsychology, 24(3), 383–405. Retrieved from http://www.tandfonline.com/doi/pdf/10.1076/jcen.24.3.383.981
Flanagan, D.P., McGrew, K.S., & Ortiz, S. O. (2000). The Wechsler intelligence scales and
Gf-Gc theory: A contemporary approach to interpretation. (B. Pascal, Ed.). Boston: Allyan and Bacon.
Gottfredson, L. S. (1998). The general intelligence factor. Scientific American, Human
Intelligence, 24–30. Kaufman, A.S., Railford, S. E. & Coalson, D. L. (2016). Review of the Wechsler Intelligence
Scale for Children- Fifth Edition: Critique, commentary, and independent analyses. In M. W. Canivez, G. L & Watkins (Ed.), Intelligent testing with the WISC-V (pp. 683–702). Hoboken, NewJersey. Retrieved from https://www.researchgate.net/profile/Marley_Watkins/publication/294260976_Review_of_the_Wechsler_Intelligence_Scale_for_Children- Fifth_Edition_Critique_Commentary_and_Independent_Analyses/links/56bf9d1508ae44da37fa6d85/Review-of-the-Wechsler-Intelligence-Scale-for-Children-Fifth-Edition-Critique-Commentary-and-Independent-Analyses.pdf
Konald, T. R. & Canivez, G. L. (2010). Differential relationships between WISC-IV and
WIAT-II Scales: An evaluation of potentially moderating child demographics. Educational and Psychological Measurement, 70(4), 613–627. http://doi.org/DOI: 10.1177/0013164409355686
Kyllonen, P. & Kell, H. (2017). What is fluid intelligence? Can it be improved? In M. Rosén
(Ed.), Cognitive Abilities and Educational Outcomes, Methodology of Educational Measurement and Assessment. (pp. 15–37). Princeton: Springer International Publishing. http://doi.org/10.1007/978-3-319-43473-5_2
Niolon, R. (2005). How does culture effect IQ scores? Retrieved May 30, 2017, from
http://www.psychpage.com/learning/library/intell/biased2.html Pearson. (2015). WISC®-V Canadian F requently Asked Questions. Retrieved March 1,
African Journal of Clinical Psychology Copyright 2018 by Daystar University, 44400, 00100 ISSN: 978-9966-936-05-9: 2018 Vol. 01, Issue 02 School of Human & Social Sciences
2017, from https://www.pearsonclinical.ca/content/dam/school/global/clinical/canada/programs/wisc5/wisc-v-cdn-faqs.pdf
PsychCorp. (2015). WISC-V interpretive report: WISC-V interpretive considerations for
Laurie Jones (6/1/2015). New York. Retrieved from http://images.pearsonclinical.com/images/assets/wisc-v/WISC-VInterpretiveReportSample-1.pdf
Rushton, J. P. & Jensen, A. R. (2005). Thirty years of research on race differences in
cognitive ability. Psychology, Public Policy, and Law, 11(2), 235–294. http://doi.org/10.1037/1076-8971.11.2.235
Rushton, J. P. (2001). Black±White diff erences on the g-factor in South Africa: a ``Jensen
Eff ect’’ on the Wechsler Intelligence Scale for Children revised. Personality and Individual Differences, 31, 1227–1232. Retrieved from http://philipperushton.net/wp-content/uploads/2015/02/iq-race-south-africa-rushton-personality-individual-differences-12-2001.pdf
Sandhu, I. K. (2014). Descriptive dlassification of the WISC V. Retrieved August 6, 2017,
from http://www.brainy-child.com/experts/classification-of-WISC-V.shtml Schneider, J. & McGrew, K. (2013). The Cattell-Horn-Carroll (CHC) model of intelligence
v2.2: A visual tour and summary. In D. & H. P. Flanagan (Ed.), Contemporary Intellectual Assessment: Theories, Tests, and Issues (Third, pp. 99–144). New York: Guilford. Retrieved from http://www.iapsych.com/chcv2.pdf
Schwehr, E. (2015). IQ: What is it and what does it mean? In 2015-2016 Seminar Series (pp.
1–40). Groves Academy. Shuttleworth-Edwards A. B. S. & Van de-Merwe. (2015). WAIS-III and WISC-IV South
African cross-cultural normative data stratified for quality education. In F. R. Ferraro (Ed.), Minority and cross-cultural aspects of neuropsychological assessment: enduring and emerging trends (pp. 72–75). Amazon: Psychological Press.
Sternberg, R.J, Grigorenko, E. L. & Bundy, D. A. (2001). The Predictive value of IQ.
Merrill-Palmer Quarterly 47.1, 47(1), 1–41. Van Tonder, P. (2007). WISC-IV performance of South Africa Grade 7 English and Xhosa
speaking children with advantaged vesus disadvantaged education. Rhodes. Wechsler, D. (2014). Wechsler Intelligence Scale for Children-Fifth Edition (WISC-V)
(Fifth). Bloomington: Pearson Education, Inc. Weiss, L. G., Saklofske, D.H., Holdnack, J.A. & Prifitera, A. (2016). WISC-V Assessment
and interpretataion sceintist-practitioner perspective, 1–425.

African Journal of Clinical Psychology Copyright 2018 by Daystar University, 44400, 00100 ISSN: 978-9966-936-05-9: 2018 Vol. 01, Issue 02 School of Human & Social Sciences