
Adequacy of environmental releases to the upper ...
46
Transcript of Adequacy of environmental releases to the upper ...


The adequacy of environmental releases
to the
upper Murrumbidgee River
Snowy Scientific Committee December 2010
Canberra
Prepared for the
NSW Water Administration and Ministerial Corporation

COVER PHOTOGRAPH
The Murrumbidgee River immediately downstream of Tantangara Dam.
Photograph provided by Mark Lintermans.
CITATION
This report should be cited as:
Snowy Scientific Committee (2010). The adequacy of environmental flows to the upper Murrumbidgee
River. Report SSC_4. Prepared by the Snowy Scientific Committee for the Water Administration
Ministerial Corporation of New South Wales. Canberra. December 2010.
SNOWY SCIENTIFIC COMMITTEE
The Snowy Scientific Committee is (in alphabetical order)
Mike Curll
Wayne Erskine
Arlene Harris-Buchan
Noel Kesby / Brett Miners
Sam Lake
Jane Roberts (Chair)

EXECUTIVE SUMMARY
[1] This report assesses the adequacy of environmental releases to the Murrumbidgee River
downstream of Tantangara Dam. These environmental releases are part of a long-term
restoration program for “montane rivers” affected by the Snowy Mountains Scheme. No new
work was done for this assessment. All information and data used come from existing
documents.
[2] The adequacy of environmental releases, and of the management and institutional
arrangements that make these effective is evaluated in three ways. Releases (environmental and
riparian) are compared with recommendations of the Expert Panel made prior to the Snowy
Water Inquiry. Monitoring is compared with the specifications agreed to in the Snowy Water
Inquiry and Outcomes Implementation Deed (SWIOID). Institutional arrangements are
considered from the perspective of how well these provide for or protect environmental releases.
The term institutional arrangements refers broadly to works, agreements and policies involving
both private and public sectors, under the SWIOID, the Snowy Water Licence and the NSW
Water Act.
[3] Environmental releases were lower than expected and delayed relative to the schedule given in
the SWIOID, presumably because of low allocations to Snowy River Increased Flows (SRIF) to
which these environmental flows are pegged. Riparian releases may be contributing to river
health by maintaining longitudinal connectivity but until the gauging network is improved by the
installation of a gauge between Tantangara Dam and Mittagang Crossing, this is speculative.
[4] No flow response monitoring program is in place although a pilot has been done, due to
limited resources. This agreement in the SWIOID has not been met.
[5] Institutional arrangements to protect environmental releases, both now and into the future, are
poor.
[6] Seven recommendations are made. Recommendations 1 and 2 address hydrology and target
the need to improve basic understanding. Recommendations 3 and 4 address the environmental
releases, specifically calling for them to be increased and protected. Recommendations 5, 6 and 7
target ecological management and in particular the outstanding need for a secure flow response
monitoring program, suggesting an option is expected to be cost-effective.
[7] The existing ecological objectives given in the SWIOID and the environmental flow
recommendations made the 1997 Expert Panel are not evaluated.

ACKNOWLEDGEMENTS
The Snowy Scientific Committee would like to thank the following persons and organisations for
helpful discussions and provision of data:
Lee Bowling, NSW Office for Water
Max Butler, Cooma Shire Council
Brian Chillen, Cooma Water Treatment Plant
Bruce Chessman, NSW Department of Environment, Climate Change & Water
Danielle Doughty, NSW Office of Water
Ken Gillespie, NSW Office of Water
Dean Gilligan, NSW Industry & Investment
Lorraine Hardwicke, NSW Office for Water
Evan Harrison, University of Canberra
Mark Lintermans, University of Canberra
Richard Marchant, Museum of Victoria
Andrew Nolan, Snowy Hydro Limited
Phil Taylor, ALS Water Resources Group
Michael Wilson, Murray-Darling Basin Authority

Adequacy of Releases: Upper Murrumbidgee River
TABLE OF CONTENTS
Section 1: Introduction 1
[1.1] Purpose and Scope of this Report 1
Section 2: Flow Regime and River Condition 4
[2.1] Flow Regime 4 [2.2] River Condition 7
Section 3: Flow Rehabilitation 11
[3.1] Environmental Flow Recommendations 11 [3.2] Environmental Objectives 12 [3.3] Environmental Releases 13 [3.4] Evaluation 15 [3.4] Conclusions 16
Section 4: Monitoring Responses 17
[4.1] Flow Response Monitoring 17 [4.2] Other Monitoring 17 [4.3] Conclusions 20
Section 5: Institutional Arrangements 21
[5.1] Releases 21 [5.2] Losses, Diversions and Implications 24 [5.3] Feedback 25 [5.4] Infrastructure and Delivery 26 [5.5] Future Issues 26 [5.6] Conclusions 27
Section 6: Findings and Recommendations 28
[6.1] Findings 28 [6.2] Recommendations 29
References 31
Appendix 1: Time Series @ Mittagang Crossing 33
Appendix 2: Timing of Releases 34
Appendix 3: Channels in the catchment 36
Appendix 4: Releases and Flows 39

Adequacy of Releases: Upper Murrumbidgee River
1
Section 1: Introduction
[1.1] Purpose and Scope of this Report This report addresses one of the principal functions of the Snowy Scientific Committee, as
specified under section 57 (3) of the Snowy Hydro Corporatisation Act 1997, namely “to provide advice on the adequacy of releases of water for environmental reasons following assessment of available information.”
It considers the adequacy of the environmental releases to the upper Murrumbidgee River from
Tantangara Dam. This is the second such report from the Snowy Scientific Committee addressing
this function. The first one considered environmental releases from Jindabyne Dam to the Snowy
River (SSC 2008).
This report takes the same approach as the first report, in that it considers adequacy in terms of
both the drivers of river environmental condition (in this case, the environmental flow regime) and
the responses to environmental flows (in this case, habitat, biota, and water quality). Flow is
recognised here as a driver or “master variable” that limits the distribution and abundance of
riverine species and regulates the ecological integrity of flowing water systems (Poff et al. 1997).
This dual approach is merited because concentrating on only drivers or only responses would give
an incomplete assessment. Environmental flow releases from Tantangara Dam have begun
relatively recently and riverine biota and processes have had very little time to react. Their flow
responses, if there are any as yet, will be just beginning and are likely to be undetectable.
In keeping with the first adequacy report, adequacy is also interpreted to refer to institutional
arrangements that can affect the efficacy of environmental releases. This effect may be negative,
as impediments or barriers, or positive, as safeguards. Institutional arrangements for
environmental flow delivery have been severely tested during the recent exceptionally dry period.
Central to this assessment of adequacy is the recognition that restoration to a pristine or pre-
Snowy Mountain Scheme (SMS) state is not expected. What is expected, however, is to recover a
proportion of the river’s lost capacity to sustain native biodiversity and ecological processes, and
to do this as effectively as possible with the environmental releases available.
Approach Adequacy is assessed in different ways.
First, adequacy is assessed by comparing ‘expected’ against ‘observed’ flow regime, where
‘expected’ means the environmental flows recommended and ‘observed’ means the current flow
regime of the upper Murrumbidgee River. The current flow regime is described, and then
compared with recommendations by the expert panel (Pendlebury et al.1997) and environmental
objectives set down in the SWIOID (2002).
The adequacy of the recommendations themselves is not evaluated here. At some point in the
future these will need to be reviewed, as will the environmental objectives, and if necessary be
refined and revised to take into account new knowledge, new understanding and new context, as
climate changes.
Second, adequacy of environmental flows is assessed in terms of observed and expected ecological
responses, similar to a flow response monitoring programs. This includes an evaluation of
monitoring programs in the study area to determine their relevance and suitability for monitoring
flow responses.

Adequacy of Releases: Upper Murrumbidgee River
2
Finally, institutional arrangements are considered and reviewed to determine whether or not they
safeguard the delivery of environmental flows to the upper Murrumbidgee River.
No original work was commissioned for this evaluation of adequacy. The report relies on
publications and existing information.
Table 1: Study area
Sites mentioned in this report, giving the gauging station number where appropriate, along the Murrumbidgee River from Tantangara Dam to Naas River confluence. ‘gs’ means gauging station. Information collated from Pendlebury et al.(1997), Young et al.(2004).
Site River distance
(km) from Dam
Catchment area upstream (km2)
(as %)
Tributaries coming in upstream of site
Percentage of pre-
Tantangara flow diverted
Tantangara 470 or 9.1% Tantangara Ck, Hillas Plains Ck, Nungar Ck
99
Yaouk 776 or 15.1% 73
Goorudee River 53
Mittagang Crossing (gs 410033)
1810 or 35.2% Yaouk Ck, Alum Ck, Goorudee River, Slacks Ck, Long Corner Ck, Caddicat Ck, Bridle Ck
63
Numeralla River 121
Billilingra (gs 410050)
3550 or 69.1% Cooma Ck, Numeralla River 46
Naas River 185
Study Area The area considered is the upper Murrumbidgee River, from Tantangara Dam to the ACT border
(Table 1, Figure 1).
The Expert Panel (Pendlebury et al.1997) partitioned this into three reaches:
Reach 1: Tantangara Dam to Murrells Crossing
Reach 2: Murrells Crossing to Billilingra Gorge
Reach 3: Billilingra Gorge to Angle Crossing
A slightly different partitioning was used in a study contributing to the Snowy Water Inquiry
(Young et al.2004):
Reach 1: Tantangara Dam to Goorudee River (53 km)
Reach 2: Goorudee River to Numeralla River (68 km)
Reach 3: Numeralla River to Naas River junction (74 km)

Adequacy of Releases: Upper Murrumbidgee River
3
Figure 1: The upper Murrumbidgee catchment
The upper Murrumbidgee catchment showing Tantangara Dam, GS 410033 (Mittagang Crossing), Cooma, Murrell’s Crossing upstream of the Numeralla River confluence, and the principal tributaries to the Murrumbidgee River between Cooma and Canberra. From Olley and Wasson (2003).
Adequacy of Releases: Upper Murrumbidgee River
4
Section 2: Flow Regime and River Condition
[2.1] Flow Regime This description of flow regimes for the upper Murrumbidgee relies on the analyses done for the
expert panel assessment of 1996 (Pendlebury et al.1997). A graphical indication of the change in
flow regime, pre-Snowy Mountain Scheme (SMS) to post-SMS, at Mittagang Crossing is given for
two ten-year periods in Appendix 1.
Flow regime pre-SMS Flows in the upper Murrumbidgee catchment are largely driven by high winter-spring rainfall and
spring snow melt, with occasional summer rain events.
Before the construction of Tantangara Dam and diversion of stored water to Eucumbene, the flow
regime was strongly seasonal, highly variable, with a persistent low summer base-flow, all
indicating a repeatedly flow-disturbed but perennial system (Appendix 1).
The main characteristics of the pre-SMS flow regime for the Tantangara area, as inferred from
inflows to Tantangara Dam over a 38-year period from 1958 to 1996 (Pendlebury 1997), are:
winter-spring floods;
small events (eg peaking at 2000 ML day) were frequent and typically short (120 in 38 years)
small events (eg 20 GL in total volume) occurred throughout the year but were considerably
fewer in February, whereas slightly larger events (eg 20 to 40 GL in volume) were concentrated in
the late autumn to early summer period;
very large events (eg peaking at 10,000 ML day) were infrequent but lasted longer (10 events
in 38 years, duration about 55 days) and were generally high volume (eg more than 100 GL per
event);
intervals of about 30 days between events occurred nearly twice a year on average (about 70
times in 38 years) and intervals of about 90 days occurred about once a year (about 40 times in 38
years);
intervals between flood events of 300 days occurred about once in 12 years;
high base-flows in winter and low but persistent base-flows in summer; the 95%ile being 300
and 530 ML day for August-September, and 25 and 20 ML day for February-March.
Flow regime post-SMS to 1995 Descriptions of post-SMS flow regimes for the upper Murrumbidgee up to 2010 have not been
published. The description below draws on analyses by Pendlebury et al.(1997) so is based on
flow data up to 1995 and does not incorporate the recent very dry period in south-eastern
Australia.
Since 1960, Tantangara Dam has captured and diverted nearly all its inflows to Eucumbene
(Table 1), except for small volumes released to meet minimum flow targets at Mittagang Crossing,
and spills. Spills have occurred three times since dam construction was completed, in 1962, 1975
and 1992 (Pendlebury et al.1997, p2). The consequence of such highly effective flow capture is
that the Murrumbidgee River downstream of Tantangara is no longer characterised by strong

Adequacy of Releases: Upper Murrumbidgee River
5
disturbances down the main stem and flow-related disturbances are the result of tributary inflows.
At Mittagang Crossing, there still is a seasonal signal but it is muted compared with pre-SMS
(Appendix 1) because discharge is so severely reduced in volume.
The effects of Tantangara Dam on flow regime are gradually lessened downstream due to
contributions from tributaries further downstream, but are not negated. The river is starved of
sediments, at least until the Numeralla confluence.
Thus the main characteristics of the post-SMS flow regime as inferred for the Murrumbidgee
River at Mittagang Crossing by comparing flow analyses for 1926-1960 with 1961-1995
(Pendlebury 1997) are:
retention of seasonal pattern with winter-spring peak but considerably reduced;
a four-fold reduction in the occurrence of higher flows; flows exceeding 2000 ML day occur
approximately 5% of the time (compared with approximately 20% of the time pre-SMS);
fewer flow events of all sizes, but particularly the largest events (volumes greater than 60 GL)
which occurred 9 times in 1961-1995 compared with 39 times in 1926-1960; for this, an event is
defined as a peak of 2500 ML day lasting at least 2 days and a minimum of 1250 ML day;
very few flood events with sustained duration: only 5 events lasting 30 days and 20 events
lasting 10 days (compared with over 30 and over 70 such events pre-SMS)
reduced base-flows in all seasons but particularly in winter, with 95%iles for August and
September being only 190 and 280 ML day (compared with 420 and 520 ML day pre-SMS).
Releases from Tantangara In average and low rainfall years, Tantangara Dam is 100% effective at capturing inflows (Table
1). Two types of releases are made to off-set or compensate for inflow capture.
One is the riparian releases which target consumptive use. These releases are made so as to
maintain a minimum flow at Mittagang Crossing of 31.8 ML day and 17.1 ML day at Cotter
Crossing in the ACT, and are capped to a maximum of 83 ML day or storage inflow, whichever is
the lesser (Pendlebury et al.1997, p2). Releases require some skill: the volumes to be released are
small relative to the current outlet capacity and the need to release has to be anticipated: under
low-flow conditions, travel time from Tantangara Dam to Mittagang Crossing is in the order of 5
to 7 days (Andrew Nolan, pers. comm. 2010)
The other is environmental releases which are part of the Snowy Montane Rivers Increased Flows
(SMRIF).
These two types of releases are distinct in terms of their volume and timing. Riparian releases
have ranged from 0.6 to 5.3 GL per year since 1993-1994, with an annual average of 2.8 GL
(Figure 2) whereas environmental releases have ranged from 3.6 to 13.9 GL since 2005-6, with an
annual average of 7.7 GL.
Riparian releases are made mostly in summer and autumn, at discharge rates that are generally
lower than 50 ML day (Figure 3), whereas environmental releases have been made in the spring
and have had maximum flows exceeding 100 ML day in spring of 2007, 2008 and 2009.

Adequacy of Releases: Upper Murrumbidgee River
6
Tantangara Releases: 1991-2008
0
3
6
9
12
15
1991
1992
1993
1994
1995
1996
1997
1998
1999
2000
2001
2002
2003
2004
2005
2006
2007
2008
Calendar Year
GL
Rip Releases Environmental Releases
Figure 2: Total (GL) releases from Tantangara for calendar years 1991-2008 inclusive
Annual totals of riparian and environmental releases for eighteen years. Data provided by Snowy Hydro Limited.
The release pattern for riparian releases varies enormously between years (Figure 3, Appendix 2),
occurring sometimes as a single sustained period over 5 to 7 months (as in 1997-1998 and 2006-
2007), and sometimes as multiple periods of shorter duration (as in 1994-1995 and 2004-2005).
Thus, there have been many periods and some years when riparian releases were not made and it
is likely that the uppermost sections of the Murrumbidgee River, upstream of significant
tributaries, either did not flow or were very shallow. In contrast, in the first four years of
environmental releases, there has been very little variability in timing, and the releases have been
concentrated in the same three months of spring (Appendix 2).
Implications of releases for the river When constructed, the release system at Tantangara Dam1 was designed as a conduit known as
the river outlet, at the base of the dam wall. As required by the Snowy Water Licence (SWL
2002), this release system was changed in order to be able to release water from above the
thermocline. The new intake tower has telescoping inlet shutters that allow it to draw water from
the surface of the reservoir. This is then released through the same river outlet. These works have
been completed and the new offtake system is operational for environmental releases.
1 Tantangara Dam: Information on Tantangara Dam design and release capacity taken from a presentation
made to the Snowy Scientific Committee “Jindabyne Dam and Tantangara Dam outlet works” by Brian
Mayhew, Andrew Nolan and Jason Venables of Snowy Hydro Limited on 11th May 2009.

Adequacy of Releases: Upper Murrumbidgee River
7
Tantangara Releases: 1993/4-2000/1estimated daily rates
0
50
100
150
1/05/93 1/05/94 1/05/95 1/05/96 1/05/97 1/05/98 1/05/99 1/05/00
estim
ated
ML
day
Figure 3: Pattern of riparian releases
Time series of riparian releases from Tantangara Dam over seven water years from 1993/94 to 2000/01 (ie before environmental releases began), showing duration, timing and approximate daily flow rate. Data provided by Snowy Hydro Ltd.
The implications of the original outlet system are that releases, for whatever purpose, would have
been from bottom waters. Because Tantangara Dam is known to thermally stratify in spring
(Barlow et al.2005), releases made over the warmer months would have had the characteristics of
hypolimnetic water, so would probably be cooler than natural river water, and hypoxic or possibly
anoxic. In contrast, the modified outlet system releases draws on the epilimnion and near surface
waters.
The effect of riparian and environmental releases on the river and river ecology will be strongest in
the reaches most impacted by river capture and diversion.
[2.2] River Condition The condition of the Murrumbidgee River downstream of Tantangara Dam was first described by
the Expert Panel (Pendlebury et al.1997) by integrating information and interpreting condition
directly in terms of flow history. This report remains the principal source of information on the
ecological and physical condition of the river.
Expert Panel assessment of autumn 1996 The Expert Panel made their field assessments in late April – early May 1996. The flow regime
context for their appraisal was: 30 years of regulation and diversions had elapsed; the preceding
two years had been low-flow years; but 6 months previously, flows at Mittagang Crossing
exceeded 5000 ML day briefly in October and again in December 1995 (Appendix 1). Also, it was
a year when riparian releases were not much called on (Figure 3).
The Expert Panel found that the upper Murrumbidgee River was showing classic symptoms of
chronic flow reduction with sediment in-filling, channel contraction, reduced habitat volume and
diversity, and the development of a littoral and fringing perennial vegetation associated with stable
flows. These symptoms were particularly well-developed in Reach 1 between Tantangara Dam
and Murrell’s Crossing (Pendlebury et al.1997).

Adequacy of Releases: Upper Murrumbidgee River
8
The geomorphological assessment (Erskine 1997) noted that the bed of the river “….has a significant amount of fine-grained sediment infilling the voids between gravels and is often covered by filamentous algae and a thick veneer of biogenic sediment. This sediment storage reflects decreased flushing due to flood suppression. The frequency and duration of bed mobility have decreased significantly. It also seems likely that the pool-riffle sequence, especially in the floodplain reaches, is not being maintained for the same reason.” Channel contraction below the Dam is occurring, with the development of a muddy
littoral fringe which is being colonized by terrestrial plants and “sediment deposition in the mid
channel area of runs and shallow pools is also being colonized by macrophytes (predominantly water lily)”
Erskine (1997). It was concluded that “flood suppression by flow regulation is a significant issue to be addressed by environmental flows and has been responsible for channel contraction, fine-grained sediment storage in the bed and a possible reduction in the depth of pools”.
In Reach 1, the macro-invertebrate fauna (Marchant 1997) contained elements of what would be
expected for a montane river, except for the complete lack of any filter-feeding insects: no
hydropsychid caddis or simuliid black fly larvae were collected. Further downstream the macro-
invertebrate fauna was typical of slow-flowing conditions. The fish fauna (Brown 1997) was
dominated by introduced species (rainbow trout, brown trout and goldfish) but there was also an
important relic population of Macquarie perch, described as being “found throughout this reach” (a
statement subsequently confirmed by M. Lintermans 2010), as well as Mountain galaxiids,
Australian smelt and possibly Two-spined Blackfish. In the gorge above Mittagang Crossing,
trout cod, brown trout, Macquarie perch and galaxiids have been sampled.
Plant communities had several characteristics that are either alien to a montane river or else
present in an abundance that was not typical of a montane river (Banks 1997): downward (0.2 m
vertical) colonisation by foliose lichens on boulders; stream banks densely vegetated (eg cover of
this report) with shrubs and grasses to the water line; River Tea tree Leptospermum obovatum and
Alpine Bottlebrush Callistemon sieberi colonising gravel bars; large beds of a floating macrophyte,
the waterlily Entire Marshwort Nymphoides geminata, up to tens of metres long, fringing the
channel, willows Salix spp. establishing vegetatively within the river bed, and on riverbanks
downstream of Murrell’s Crossing. These are largely attributable to lack of scouring flows.
Studies since 1996 Since 1996, there have been two assessments of river condition for the upper Murrumbidgee River
(Young et al.2004, Davies et al.2008) using a referential approach, and one considering the
physical characteristics of the drainage network (Wilkinson et al.2004).
The first (Young et al.2004), which was a background study for developing a means of assessing
flow scenarios for the Snowy Water Inquiry, combined hydrological data with field appraisals and
literature on vegetation, macro-invertebrates, fish and geomorphology into a River Condition
Index (RCI), and concluded that condition was about the average for river reaches affected by the
Snowy Mountains Scheme (Young et al. 2004).
The second, the Sustainable Rivers Audit (SRA) reported on condition for each Valley in the
Murray-Darling Basin (Davies et al.2008). The SRA concluded that the macro-invertebrate
assemblages and fish assemblages in the upper Murrumbidgee were in poor to very poor condition
(Davies et al. 2008).
Finally, an analysis of the drainage network to prioritise sites for channel rehabilitation works
(Wilkinson et al.2004) found that although the riparian zone was reasonably well-vegetated, there
were areas with bank erosion problems, and that the river had a high sediment load downstream
of its confluence with the Numeralla River (Appendix 3).

Adequacy of Releases: Upper Murrumbidgee River
9
Knowledge of river condition is also informed by studies on individual taxa such as fish (Morris et
al.2001, Gilligan 2005, Lintermans 2005), macro-invertebrates (Marchant and Hehir 2002,
Harrison et al. 2008), willows (Cremer 1999) and on water quality (Barlow et al.2005). These have
confirmed and re-inforced the findings of the Expert Panel. Particularly interesting amongst these
are the syntheses of water quality given by Barlow et al. (2005), statements regarding the
importance of fish communities (Morris et al.2001), and the ‘legacy’ factor in river degradation
(Olley and Wasson 2000).
Water quality shows progressive downstream changes, into the Dam, in the Dam and
downstream of the Dam. Thus, the quality of water flowing into Tantangara Dam is generally
‘good’ (Barlow et al. 2005), with low to moderate total phosphorus, extremely low total nitrogen,
low turbidity and low dissolved salts. Water quality deteriorates within the Dam, due to thermal
stratification, and the resulting de-oxygenation of waters below the thermocline can result in
nutrient release from sediments. Thermal stratification may not persist, hence temperature and
other water quality problems normally associated with hypolimnetic releases may be only
temporary. Dissolved oxygen may persist as a problem, however, as the surface waters are lower
than expected in dissolved oxygen. This may be due to the highly organic content in the water, as
indicated by its brown colour. The low volumes released from the Dam lead the authors (Barlow
et al.2005) to conclude that dam water probably has little effect on downstream river. This may
certainly be true when considering the entire river from Tantangara Dam to the ACT border but it
oversimplifies the potential for impact downstream of the Dam. A gradual deterioration in water
quality was noted down to Mittagang Crossing and was attributed to diffuse natural catchment
inputs of nutrients, conductivity and turbidity.
The fish community in the Murrumbidgee River in the vicinity of Cooma is recognised as
important for native fish, based on published and unpublished data and excluding translocated
and stocked species (Morris et al. 2001). The area has contemporary records of Macquarie perch
Macquaria australasica an endangered species listed under the EPBC Act (Figure 4).
Current condition of upland rivers is, in general, a legacy of several factors, the main one being
grazing riparian vegetation during dry periods and droughts. As a contribution to in-channel
sediment loads, headward erosion and channel incision resulting from grazing effects far exceed
the effects of climate variability and river regulation. Reaches within the drainage network which
are sediment-starved, for example downstream of Tantangara Dam, are localised (Olley and
Wasson 2000). According to these authors, in the early stages of European settlement, the
Murrumbidgee River was a bedrock, cobble and gravel bedded river, indicating that its capacity to
transport sediment far exceeded its supply.

Adequacy of Releases: Upper Murrumbidgee River
10
Figure 4: Macquarie Perch in the upper Murrumbidgee Survey of the upper Murrumbidgee catchment for threatened fish in 1998 and 1999 showing sites where Macquarie perch was present (blue dots) and absent (black dots). Provided by Mark Lintermans, University of Canberra.
Endangered Species and Communities The occurrence of endangered aquatic and amphibious biota, but particularly fish, has been
summarised and reviewed in a number of reports, covering federal (Williams and Russell 2009)
and state and territory (Barlow et al. 2005, Lintermans 2002, Morris et al. 2001, Gilligan 2005).
The most recent of these (Williams and Russell 2009) focused on Matters of National
Environmental Significance (MNES) as listed under the EPBC Act, so covered heritage, wetlands,
ecological communities, plants, fish, frogs, reptiles, birds and mammals. The official search tool is
quite precautionary in that it has a wide scope and tends to return several MNES that are
inappropriate on account of being not directly hydrologically connected to the Murrumbidgee
River (such as alpine bogs), connected but quite remote (such as Five Bough and Tuckerbil
Swamps in the Riverina), or typical of habitats not associated with the upper Murrumbidgee River
(such as floodplain wetlands).
This filtering process resulted in just four aquatic and amphibious MNES for the Murrumbidgee
between Tantangara and Burrunjuck Dams: three fish (Murray cod, Macquarie perch, Trout cod)
and one frog (Yellow-spotted tree frog) last observed in the 1970s. No plants, no Ramsar
wetlands, no ecological communities, no reptiles and no mammals listed as MNES were
suspected of being there.

Adequacy of Releases: Upper Murrumbidgee River
11
Section 3: Flow Rehabilitation This section presents environmental flow recommendations and objectives and compares the
releases to date with the recommendations.
[3.1] Environmental Flow Recommendations The Expert Panel (Pendlebury et al.1997) made four recommendations regarding environmental
flows for the Murrumbidgee River between Tantangara Dam and the ACT border. Three relate to
discharge and one is to do with the off-take and water quality2. The flow recommendations and
flow components that they refer to are summarised below (Table 2). Recommendation 2 refers to
three flow components so is sub-divided into 2a, 2b and 2c.
As noted in the 2010-2011 release recommendations for Tantangara (SSC 2010), the Expert Panel
recommendations targeted five flow components (base-flows, seasonal patterns, freshes, daily
variability and high flow events).
Table 2: Environmental flow recommendations
Environmental flow recommendations for the Murrumbidgee River between Tantangara Dam and the ACT border, as made by the Expert Panel (Pendlebury et al. 1997).
Recommendation and
Flow Component
Target Expected Benefits and Rationale
Recommendation 1
Maintain summer base-flows (January-April)
Flow: Maintain flow at a minimum depth of 0.4 to 0.5 m during January-April, which is assumed to be in the order of 50-80 ML day released from Tantangara (but requiring confirmation)
Site: Downstream (8-10 km ) of Tantangara Dam
Increases habitat available and habitat diversity for fish and macro-invertebrates by increasing:
Depth water in-channel
Wetted perimeter
Velocity and turbulence
Hydraulic diversity
Improves habitat quality for fish and macro-invertebrates by reducing:
Temperature and oxygen stress
Recommendation 2a
Re-instate seasonal pattern
Flow: Mimic seasonal flow pattern with peak in September and minimum in February-March.
Higher flows in winter-spring will improve habitat conditions by:
Providing opportunities for fish movement consistent with natural conditions
Removal some silt and fine-grained sediment
Providing spawning opportunities for fish that utilise clean gravels
Recommendation 2b (contd.)
Spring-early Summer
Flow: Flows of 250-350 ML day for 2-4 weeks once epilimnion temperature exceeds 16.5 deg C
Will provide conditions suitable for spawning and subsequent larval development for Macquarie Perch
2 Recommendation 8: The Tantangara Dam river outlet structure should be modified or replaced to ensure
that all releases to the upper Murrumbidgee River are drawn from the epilimnion (surface water above the
thermocline when the dm thermally stratifies.

Adequacy of Releases: Upper Murrumbidgee River
12
Recommendation and
Flow Component
Target Expected Benefits and Rationale
Fresh Site: Mittagang Crossing
Recommendation 2c (contd.)
Ensure daily variability
Flow: Mimic daily variability in all months by basing daily flow releases on natural inflow patterns including periods of low inflows.
Recommendation 3
Spring ‘fresh’ or ‘high flow event’
Flow: Event with a peak in range 4-6 GL per day lasting 6-7 days, in spring (August-October), annually
Site: Tantangara to downstream of Numeralla confluence
Will maintain channel by:
arresting and preventing siltation
arresting and preventing encroachment by riparian vegetation
arresting and preventing encroachment by aquatic (in-channel) vegetation
Will improve habitat especially for fish and results in ecological disturbance by:
Mobilising gravels
Entraining and scouring silt and fine organic matter from gravels
Providing conditions suitable for upstream fish movements
[3.2] Environmental Objectives
SWIOID (2002) The SWIOID (2002) gives strong directions and a firm timetable on setting environmental
objectives, and their management.
All rivers receiving Snowy Montane Rivers Increased Flows (SMRIF), which includes
environmental releases from Tantangara Dam, are to have three general environmental objectives
(‘general’ because they apply to all rivers receiving SMRIF), as follows, in order of priority:
to protect endangered / threatened species
to maintain natural habitats
to maintain wilderness and national parks values.
No guidance is offered on how to interpret these objectives, on what is meant by ‘natural habitats’
and how these should be distinguished from ‘wilderness and national parks values’. In addition to
these three general objectives, each river receiving SMRIF, such as the upper Murrumbidgee
downstream of Tantangara Dam, is to have:
a set of objectives for the environmental flows, together with performance measures
a riverine management strategy that specifically addresses the management of habitat, native
plant and animal species, introduced plants and animal species, and river banks.

Adequacy of Releases: Upper Murrumbidgee River
13
The time-tabling for producing these is before the second anniversary of Corporatisation, ie before
28th June 2004 (Section 2.3, Annexure Two, SWIOID 2002).
Also under the SWIOID (Annexure Two, Part One, Clause 9.1 and 9.2), the three governments
agreed that:
New South Wales must measure the environmental benefits of the Snowy Montane Rivers
Increased Flows on an on-going basis
New South Wales must as soon as practicable give to the parties and the Water Consultation
and Liaison Committee a copy of the data generated by them from time to time.
No advice or guidance is given in the SWIOID as to what environmental flow releases need to be
made. This responsibility had been already given to the Snowy Scientific Committee under earlier
legislation. However, the works required for Tantangara Dam require modifying the outlet to
enable releases of 2 GL per day from above the thermocline. This is a clear indication that the
SWIOID recognises the need for flushing flows.
[3.3] Environmental Releases Environmental releases have been made from Tantangara Dam since 2005. As stated above,
environmental releases (Table 3) are greater than riparian releases (Figure 2). Currently, SMRIF
is partitioned between the Goodradigbee and Murrumbidgee Rivers, therefore what is released
from Tantangara does not equal the SMRIF for that year.
Table 3: Volume of environmental flows released from Tantangara
Release data extends to end of October 2009 and are not complete. Data provided by Snowy Hydro Limited.
Water year September October November Total GL for Year
2005-06 1.2 1.3 1.1 3.6
2006-07 1.8 2.5 2.4 6.7
2007-08 4.05 4.7 4.7 13.9
2008-09 1.5 3.7 1.3 6.5
2009-10 n.a. n.a. n.a. 13.15
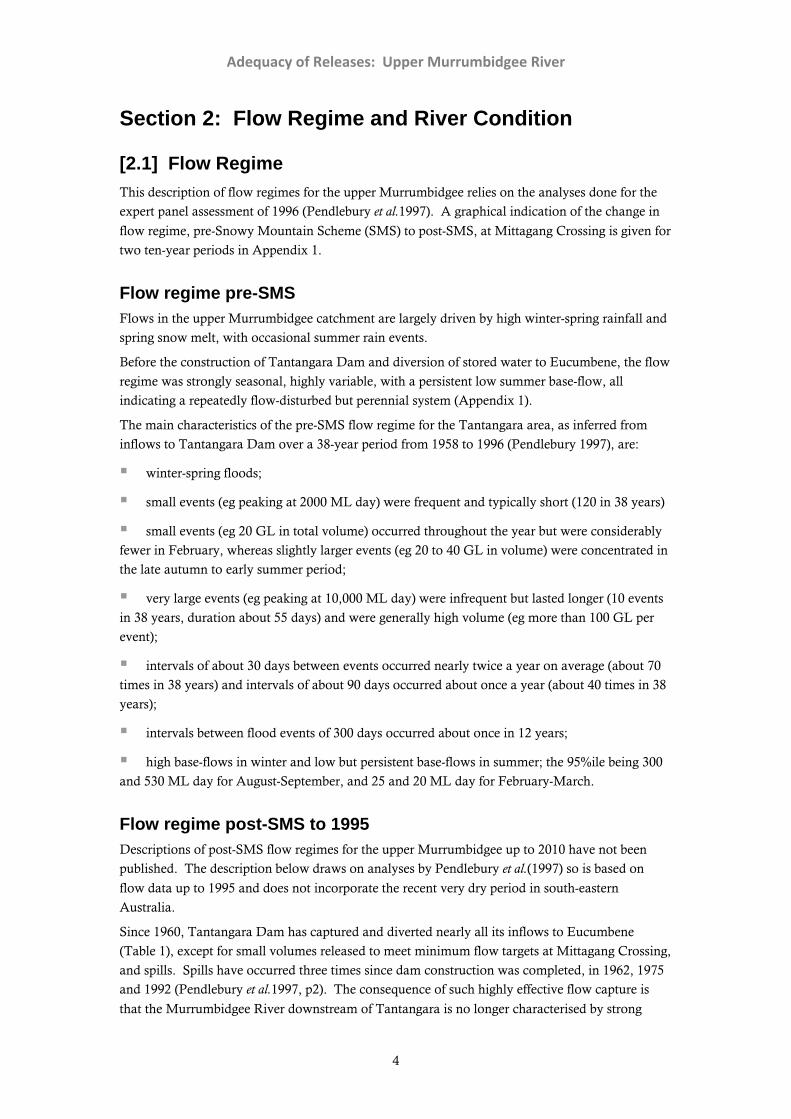
For the first four years, releases were made with limited operational flexibility using pre-
determined settings, and this resulted in fairly uniform discharges for unspecified periods, with no
attempt at mimicking monthly or weekly variability. However, it is not definite that Tantangara
releases were as constant from day to day as shown in Figure 4. The plotted data are estimated
daily releases, ie the total volume released over the month is known and the data provided are in
fact a monthly total divided by the number of days, hence the apparently uniform release rate.
Adequacy of Releases: Upper Murrumbidgee River
14
Spring Environmental Releases
0
50
100
150
200
250
1/08
/05
15/0
8/05
29/0
8/05
12/0
9/05
26/0
9/05
10/1
0/05
24/1
0/05
7/11
/05
21/1
1/05
5/12
/05
19/1
2/05
Estim
ated
dis
char
ge (M
L da
y) 2005
2006
2007
2008
Figure 4: Estimated daily releases
Environmental releases for the first four years were made over the same 3-month timeframe, from the beginning of September to end of November. The flows plotted above are estimated daily flows (see text). Data provided by Snowy Hydro Limited.
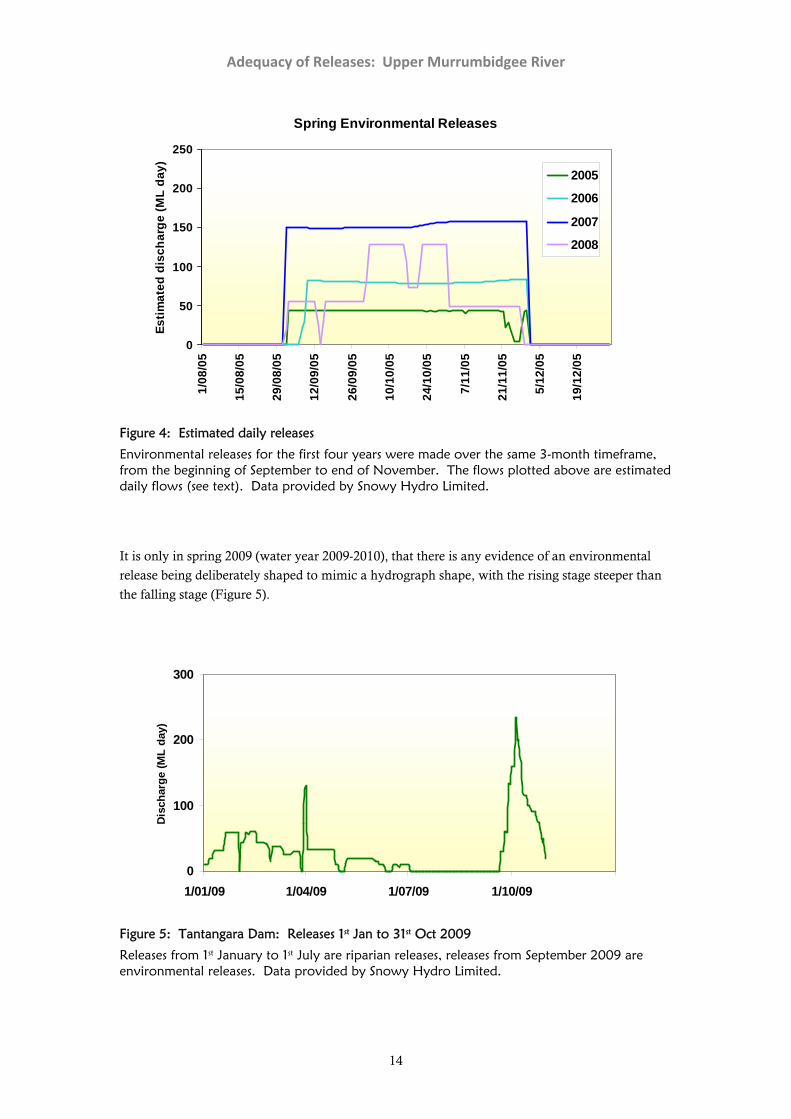
It is only in spring 2009 (water year 2009-2010), that there is any evidence of an environmental
release being deliberately shaped to mimic a hydrograph shape, with the rising stage steeper than
the falling stage (Figure 5).
0
100
200
300
1/01/09 1/04/09 1/07/09 1/10/09
Disc
harg
e (M
L da
y)
Figure 5: Tantangara Dam: Releases 1st Jan to 31st Oct 2009
Releases from 1st January to 1st July are riparian releases, releases from September 2009 are environmental releases. Data provided by Snowy Hydro Limited.
Adequacy of Releases: Upper Murrumbidgee River
15
[3.4] Evaluation The adequacy of environmental releases to date is assessed by comparing all releases from
Tantangara Dam (environmental and riparian) with recommendations made by the Expert Panel
(Table 2) and with the objectives set down in the SWIOID (2002).
Environmental Releases Recommendation 1 on Summer Baseflows: No environmental releases have been made in
January-April period.
Recommendation 2a on Seasonal Pattern: Environmental releases in the first four years do
not show a seasonal peak (Figure 4) but they do provide higher flows in winter-spring relative to
the rest of the year. A peak is evident in 2009-10 (Figure 5), however it is quite small. At 234.6
ML day, this ‘peak’ is less than the 95% estimated for Tantangara Dam inflows (Table 5.4 in
Pendlebury et al.1997).
Recommendation 2b on Spring-early Summer fresh: There is no evidence of an
environmental release equivalent to a Spring-early Summer fresh being made at a time likely to
encourage spawning in Macquarie perch.
Recommendation 2c on Daily variability: There is no evidence of attempting to introduce
daily or even weekly variability into the release pattern (Figure 5).
Recommendation 3 on Spring fresh or high flow event: There is no evidence of a high flow
event in any year. The highest flows achieved to date in the environmental releases are only 234.6
ML day, far below the target of 4-6,000 ML day.
In summary, environmental releases to date have provided flows in winter-spring that were higher
than previously so have produced a seasonal pattern (Recommendation 2a in Table 2). The other
flow components have not been met.
The low volume of environmental water available (Table 3) has contributed to not being able to
provide summer baseflows, a spring-summer fresh and a high flow event in addition to seasonal
pattern. Recommendation 1 alone, which is for 50-80 ML day for four months, requires 6-9 GL.
SMRIF is pegged to SRIF, so like SRIF and the Snowy River downstream of Jindabyne Dam,
environmental volumes from Tantangara have been affected by the capping effect of repaying the
Mowamba Borrow (SSC 2009) as much as by the low allocations in the irrigation valleys.
Riparian Releases Riparian releases target consumptive users and are not part of environmental flows but delivery of
riparian releases may benefit the river environment.
For example, riparian releases in the summer-autumn months may help to provide summer
baseflows and so maintain a continuous flowing channel down to Mittagang Crossing, and so
ensure longitudinal connectivity and maintenance of pools. Without these releases, the river in
the 8-10 km immediately below the Dam wall is at risk of becoming disconnected and even drying
up. Any potentially positive effect may be negated by the size of these releases, and the quality of
the water. As riparian releases are generally less than 50 ML day, they are equivalent to
exceptionally low pre-SMS flows (95%ile or less). As such, riparian releases may be providing
continuous but warm and shallow habitat.
This evaluation focuses on volumes and timing only.
Adequacy of Releases: Upper Murrumbidgee River
16
Recommendation 1 on Summer Baseflows: Riparian releases contribute to summer
baseflows but do not satisfy this recommendation because they are not continuous throughout the
4-month period (Figure 3, Appendix 2), and are low volume, usually less than 50-80 ML day
suggested.
It is not possible to determine if riparian releases achieved the target depth of 0.4 to 0.5 m in the 8-
10 km downstream of Tantangara Dam, due to the lack of hydraulic information.
Recommendation 2a on Seasonal Pattern: Riparian releases are made mostly over the
warmer months so do not contribute to re-instating the required seasonal pattern.
Recommendation 2b on Spring-early Summer fresh: Riparian releases are generally small
and tend to be continuous so do not contribute to being a spring or summer fresh.
Recommendation 2c on Daily variability: Releases are variable (Figure 3) on a short-time-
scale so probably do contribute daily or weekly variability into the release pattern, albeit
unintentionally.
Recommendation 3 on Spring fresh or high flow event: Riparian releases are generally too
small and tend to be continuous so do not contribute to being a spring or summer fresh.
[3.4] Conclusions This assessment of the adequacy of environmental releases from Tantangara Dam makes two
significant findings.
First, that the first five years of environmental releases have met only one (seasonal pattern) of the
five flow recommendations made by the Expert Panel (Table2).
Second, that riparian releases may be contributing to some flow components (maintaining
summer baseflows, short-term variability) and therefore to some of the recommendations made by
the Expert Panel. However this is not entirely certain and is based on inference rather than direct
observations. Determining the environmental value of the riparian releases requires either an
additional gauge between Tantangara Dam and Mittagang Crossing or hydraulic modelling.

Adequacy of Releases: Upper Murrumbidgee River
17
Section 4: Monitoring Responses This section considers monitoring because provides feedback on recommendations and on
management activities, making it an essential part of flow management.
[4.1] Flow Response Monitoring
Dedicated Flow Response Monitoring Programs The need for a dedicated flow response monitoring program was anticipated by the Expert Panel
(Pendlebury et al. 1997). Recommendation number 12 was that: “A benchmark monitoring
program be undertaken to quantify the existing ecology and morphology of the upper
Murrumbidgee River. This should be supported by an ongoing program to assess the impacts of
the environmental flow releases recommended above, and to assist in adaptive management of
flow regimes.”
Although a major flow response monitoring program, the Integrated Monitoring of
Environmental Flows (IMEF), was established across New South Wales to support the Water
Reform program to improve river health, it did not include the upper Murrumbidgee River. This
was because IMEF targets regulated rivers, where ‘regulated’ has a state-specific meaning of rivers
downstream of state-owned storages rather than the more widely-used meaning of rivers that are
regulated. Thus, in official state terminology, the upper Murrumbidgee is not recognised as
regulated because it is downstream of a dam owned by Snowy Hydro Limited. It therefore
requires a separately-resourced and specially dedicated effort to establish a flow-response
monitoring program, that has not yet eventuated.
In anticipation of the need to address flow responses and monitoring, a pilot study was done in
the upper Murrumbidgee (Simon Williams, December 2009), targeting the spring release,
establishing water quality loggers (turbidity and dissolved oxygen), and applying the same
assessment protocol as used for other montane streams. Development of the pilot study into a
structured monitoring program is hampered by lack of resources.
[4.2] Other Monitoring This section considers other monitoring programs to evaluate, in broad terms, their potential for
monitoring the effects of environmental releases from Tantangara Dam.
Hydrology Monitoring discharge as mean daily flow at different points downstream of Tantangara Dam is
essential for compliance reasons such as ensuring the delivery and passage of environmental
releases, and as feedback on what flow components are being provided, and as evaluation of flow
recommendations.
Records of releases from Tantangara Dam are maintained by Snowy Hydro Limited. Originally
these were recorded as monthly totals but are now maintained as daily records. Discharge
between Tantangara Dam and the upstream ACT border is continuously monitored by the NSW
Office of Water at two gauging stations along the Murrumbidgee River, 410033 Mittagang
Crossing and 410050 Billilingra. The current hydrographic network is much smaller than it once
was, and there is considerable archived flow data from discontinued stations.
Adequacy of Releases: Upper Murrumbidgee River
18
The gauging network is adequate for the study area downstream of Mittagang Crossing.
The lack of a gauging station for the 50+ km between Tantangara Dam and Mittagang
Crossing constrains any understanding of environmental releases in this part of the river, which is
the most degraded. It also constrains understanding the effects, positive or negative, of riparian
releases and makes it difficult to understand the role of tributary inflows relative to environmental
releases.
Hydraulic information is needed for this part of the Murrumbidgee River. This was flagged
by the Expert Panel (Pendlebury et al.1997) and remains an outstanding knowledge gap and
weakness.
Macro-invertebrates Monitoring of macro-invertebrates is currently being done as part of the Sustainable Rivers Audit
(SRA), a long-term Basin-wide river health monitoring program (Davies et al.2008), currently
administered by the Murray-Darling Basin Authority. The monitoring design is rotational, with
fixed and re-randomised sites that are sampled every two years, and stratified random based on
Valleys and Zones within each Valley. The Montane Zone in the Murrumbidgee Valley includes
the river upstream of NSW-ACT border, and has sites on the main channel of the Murrumbidgee
River and also its tributaries.
A macro-invertebrate monitoring program has recently been initiated at ten sites between
Tantangara Dam and Angle Crossing by ACTEW3. This commenced in November 2008, which
was the fourth year of environmental releases from Tantangara Dam (Figure 2) and will continue
for three years when it will be reviewed. Sampling and analysis follows ACT AUSRIVAS
protocols (twice a year, identification to family). The purpose is to establish baseline conditions
prior to release of ACTEW-owned water from Tantangara Dam.
Macro-invertebrate monitoring being done by the SRA is not at the temporal and spatial
scales needed for flow response monitoring, and therefore not useful for evaluating releases from
Tantangara Dam.
Macro-invertebrate monitoring organised by ACTEW is being done at temporal and spatial
scales suitable for flow-response monitoring, however it began after environmental releases began
so does not have a ‘before’ data set and is for a fixed term only.
Fish The only programs monitoring fish assemblages in the upper Murrumbidgee River are the
Sustainable Rivers Audit (SRA) and the benchmarking project (Gilligan 2005). The annual fish
monitoring referred to by Brown (1997) above and below Mittagang Crossing appears to have
ceased.
The overall purpose and basic design of the fish theme in the SRA is as for macro-invertebrates,
except that there only seven sites are sampled and these are sampled every three years (Davies et
al.2008). Variables recorded include species abundance, size and condition of individuals. The
techniques used, electro-fishing and bait traps, have a sampling bias a slight bias but are used
consistently. The overall purpose of the benchmarking project was to set a valley-wide benchmark
3 Murrumbidgee monitoring: Phil Taylor, ALS, pers. comm.., 22nd September 2010.
Adequacy of Releases: Upper Murrumbidgee River
19
in 2004 against which large-scale changes in composition and abundance could be evaluated in
future (Gilligan 2005).
Targetted monitoring of rare and endangered species is done by NSW Industry and Investments
(eg Gilligan 2005) and by individuals. The targetted monitoring by NSW I & I does not include
sites in the Murrumbidgee River upstream of the ACT. The valley-wide benchmarking of 2004
did include sites in the upper Murrumbidgee for tracking species listed as rare and endangered
under the NSW Fisheries Management Act 1994: like the other benchmarking sites, the probable
sampling interval is 10 years.
The endangered fish species Macquarie perch Macquaria australasica has been monitored, resources
permitting, between 1998 and 2009 (Mark Lintermans, pers. comm., January 2010). Although
irregular, this monitoring provides a relatively long data set on abundance, population status and
general condition of Macquarie perch, using techniques appropriate to Macquarie perch.
Fish monitoring programs being done by the SRA and by NSW I & I provide useful context
but are not at the temporal and spatial scales needed for flow response monitoring, and therefore
not useful for evaluating releases from Tantangara Dam.
The intermittent monitoring of Macquarie perch could be used as a firm foundation for
tracking its abundance, recruitment and condition in response to environmental releases.
Water Quality Water quality monitoring of the Murrumbidgee River upstream of the ACT is done by several
organisations: Snowy Hydro Limited monitors the releases from Tantangara Dam, Cooma-
Monaro Shire Council monitors the quality of water pumped from the Murrumbidgee River at
Mittagang Crossing, the NSW Office of Water (NOW) maintains a reduced network of
monitoring sites in its capacity as the government agency responsible for water, and ACTEW
monitors nutrients and TSS as part of its recently-established macro-invertebrate monitoring down
the Murrumbidgee River.
The NSW Office of Water has the largest number of sites and the biggest data archive, however
the number of monitoring sites that are routinely monitored has been chronically reduced over the
last 10-15 years, when the Murrumbidgee catchment used to have 52 sites monitored every two
weeks (Lorraine Hardwick, pers. comm. February 2010).
Tantangara Dam: Water quality of Tantangara Dam is monitored at four sites: two within
Tantangara Dam (Dam wall, Nungar Creek confluence), one inflow (Murrumbidgee River above
the storage) and one outflow (river outlet releases). Physico-chemical parameters were monitored
at the surface at all four sites, approximately monthly (conductivity, temperature, dissolved
oxygen, pH and water clarity as Secchi depth) for the period 2000-2008. Within the storage,
physico-chemical parameters have been monitored down profiles, at 1 m intervals, at two sites
approximately monthly (depth, temperature, electrical conductivity, dissolved oxygen, turbidity as
NTU and pH), from 1999 to date. Grab samples, both surface and 6 m integrated, have been
collected from all four sites approximately monthly for laboratory analysis (algae, chlorophyll-a,
conductivity, pH, total P and total N, and sometimes also for turbidity as NTU, conductivity and
suspended solids), since 1998.
Sampling record is relatively short, beginning only about ten or so years ago. Although sampled
monthly, data sets are not complete with some seasons (winter) and years (2004-2005) being
undersampled.

Adequacy of Releases: Upper Murrumbidgee River
20
Murrumbidgee River: Monitoring done by the NSW Office of Water has a strong emphasis on
physico-chemical attributes. Two sites, Mittagang Crossing (410033) and Angle Crossing
(410213), are monitored for temperature, dissolved oxygen, electrical conductivity, pH, total
suspended solids, turbidity, total nitrogen and total phosphorus (Lee Bowling, NOW, 18th
February 2010). In addition, selected attributes (temperature and electrical conductivity) are
continuously logged at several sites. Cell counts, of blue-green algae only, are done for just one
station, Mittagang Crossing (Lee Bowling, NOW, 18th February 2010). Water quality data are
archived.
Cooma-Monaro Shire Council extracts water from the Murrumbidgee River and monitors this
daily for colour, turbidity, alkalinity and temperature, and monthly for total nitrogen, total
phosphorus and counts of blue-green algae (Brian Chillen, Cooma Water Treatment, pers. comm..
21st Feb 2010). This data record extends back about ten years.
As part of adhering to ACT AUSRIVAS protocols, ACTEW-AGL monitors nutrients and TSS
twice a year as part of its macro-invertebrate monitoring. These data are used to inform ecological
models and are too infrequent to be useful for flow response monitoring.
Water quality monitoring and profiling in Tantangara Dam and in the outlet is valuable in
setting broad conditions for environmental releases.
Daily water quality logging by NOW covers basic water quality and is probably adequate for
tracking flow effects in the Murrumbidgee River downstream of Cooma.
The daily water quality monitoring by Cooma Shire Council is relatively long record that
could be useful for detecting trends, dependent on the location of the sampling site and how well it
relates to the river.
These data are owned by different organisations, and access to these is not guaranteed.
There is no water quality monitoring for the Murrumbidgee River between Tantangara Dam
and around Cooma. This is a significant gap. It limits interpretation of ecological responses,
especially in relation to flows.
[4.3] Conclusions This exploration and review of current monitoring makes three significant findings.
The first is that there is no dedicated, securely-funded monitoring program covering ecological
and geomorphological responses to environmental releases from Tantangara Dam down the
Murrumbidgee River. The current monitoring by NSW Office of Water is resource-constrained
and this limits its scope. Responses in the recent pilot study are not directly linked to the
objectives given in the SWIOID (2002).
The second is that there are monitoring programs covering water quality, macro-invertebrates and
fish, and that these provide background on river condition. Most of this monitoring is done at
time-scales and with a sampling design that is not useful for flow response monitoring, and none
of it is consistent with the objective of protecting endangered and threatened species.
The third is that some monitoring is being done by a number of organisations. The consequences
are that the relevant data and knowledge are dispersed, that sampling is not integrated, and there
are no procedures or authorities to convert knowledge and data into feedback. Feedback with a
view to improvement is one of the primary reasons for doing flow response monitoring.
Adequacy of Releases: Upper Murrumbidgee River
21
Section 5: Institutional Arrangements This section considers how effectively current institutional arrangements and instruments care for
and protect flows in the upper Murrumbidgee River.
[5.1] Releases Because Tantagara Dam is highly effective at capturing run-off (Table 1), the river downstream of
the dam is starved of water, and its condition is determined by controlled releases from the dam
and by tributary in-flows. Uncontrolled releases (spills, Section 2.1) also contribute to river
condition but these are not considered here. Spills have occurred only rarely and are likely to
always be rare, given that the dam is operated by Snowy Hydro to harvest water and deliver it to
Eucumbene Dam.
Currently there are two types of controlled releases, riparian releases and environmental releases.
The colloquial term, riparian releases is used here interchangeably with Base Passing Flows
because, according to the proposed variation to Clause 12 of the Snowy Water Licence (eg p12
NSW Office of Water 2009a), riparian releases are to be accounted for as Base Passing Flows.
At some time in the future, there will be another type of controlled release, viz releases for urban
and domestic use in the Canberra-Queanbeyan area. The delivery of this urban supply is
considered below (Section 5.5).
Base Passing Flows Riparian releases are made from Tantangara Dam by Snowy Hydro Limited, operating under its
License (SWL 2002) and also at the direction of the NSW Office of Water.
As described above (Section 2.1), riparian releases are made from Tantangara Dam in order to
maintain a minimum flow of 31.8 ML day at Mittagang Crossing near Cooma, and 17.1 ML day
at Cotter Crossing in the ACT (Pendlebury et al.1997). The conditions for release are tightly
specified (eg Pendlebury et al.1997), with the maximum effectively set at 83 ML per day. The
long-term average Base Passing Flow out of Tantangara, up until the beginnings of the recent
drought, was 2 GL per water year (SWIOID 2002), but has since increased to 2.8 GL due to
higher demands. The total volume released has been highly variable between years (Figure 2).
Base Passing Flows are generally released in the warmer months, however the timing, duration
and number of releases per year is highly variable, and not always in response to flows at
Mittagang Crossing (Appendix 3).
Base Passing Flows are intended to maintain minimum landholder access consistent with the
domestic and stock rights for landholders with river frontage (Section 52, Water Management Act
2000). Base Passing Flows from Tantangara Dam also provide urban water supply for Cooma (eg
p12 NSW Office of Water 2009a).
It is possible that riparian releases may have or may have had a positive effect on the river,
particularly in reaches that are chronically affected by water diversion where, for example, they
could improve longitudinal connectivity and help to maintain a lotic (rather than lentic) character.
However, this is not a certainty, as these will be dependent on or modified by hydraulic
characteristics of the channel and the quality of the releases (temperature).
The over-riding consideration is that riparian releases are made to satisfy downstream demand (ie
are based on volumetric considerations), and are not made to satisfy or respect environmental or
ecological criteria (ie velocity, temperature, pattern).

Adequacy of Releases: Upper Murrumbidgee River
22
Environmental Releases Dedicated environmental releases are made to the Murrumbidgee River. For any given water
year, the volume available is determined by procedures set down in the SWIOID (2002), and the
release pattern is determined by the Snowy Scientific Committee as required under the Snowy
Corporatisation Act 1997. These environmental releases are in addition to Base Passing Flows
(SWIOID 2002, Clause 1.1, Annexure Two).
Volume: The maximum annual volume that will be available as environmental release to the
upper Murrumbidgee River is 27 GL (SWIOID, Annexure Three), which is equivalent to 30% of
its long-term average natural flow.
This volume is well-short of the volume needed to supply individual flow components such as
seasonal pattern (approx 50-110 GL) or a high flow (channel maintenance) event of sufficient size
and duration (approx 24-42 GL). This short-fall can be expected to compromise rehabilitation of
the upper Murrumbidgee River.
Delivery of Volume: The intention in the SWIOID was that this volume be delivered to the
Murrumbidgee River incrementally in the seven years following corporatisation, so that releases
would rise from 0 GL in 2002, to 5 GL in 2005-06, 20 GL in 2006-07 and reach 27 GL in 2008-
2009 (Table 4).
Table 4: Progressive increase in volume of SMRIF following corporatisation
Progressive increase in environmental volumes for the Murrumbidgee River and for total SMRIF for the ten years following corporatisation, which was on 28th June 2002. Taken from Annexure Three in SWIOID (2002).
Year 1 2 3 4 5 6 7 8 9 10
Murrumbidgee River (GL)
0 0 0 5 20 20 27 27 27 27
SMRIF (GL) 7 7 7 12 55 55 70 99 106 118
In practice, as shown by the description of the release pattern up to and including 2009-2010
(Section 3.3, Figures 4 and 5), environmental releases have been considerably less than anticipated
and as of 2010-2011 Water year (SSC 2010) they have not yet reached 20 GL, the target for the
fifth year following corporatisation (Figure 2, Tables 3 and 4). This delay has been due to a
combination of the dry conditions prevailing since 2002, and the fact that SMRIF is pegged to
Snowy River Increased Flows (at least until Snowy River Apportioned Entitlements exceed 142
GL per annum) and that these have been effectively capped at 38 GL by the requirement to repay
the Mowamba Borrow (SSC 2009) and low allocations along the western rivers.
The upper Murrumbidgee River is one of four montane rivers scheduled to receive environmental
flows, the others being the Goodradigbee, Geehi and parts of the Snowy River above Jindabyne
Dam (Annexure Three of SWIOID). The collective term for these environmental volumes is
Snowy Montane Rivers Increased Flows (SMRIF) and its final total volume is 118 GL (Table 4).
This is also to be delivered incrementally, but taking ten years (ie to June 2012) to reach final
target volume rather than seven as for the upper Murrumbidgee (Table 4).
SMRIF is shared amongst four montane rivers. A specification for sharing was agreed to under
the SWIOID (Table 5) but is not rigid and can be amended, as has already happened with
environmental releases for 2010-2011 (SSC 2010). Compared with the SWIOID (2002), the
Adequacy of Releases: Upper Murrumbidgee River
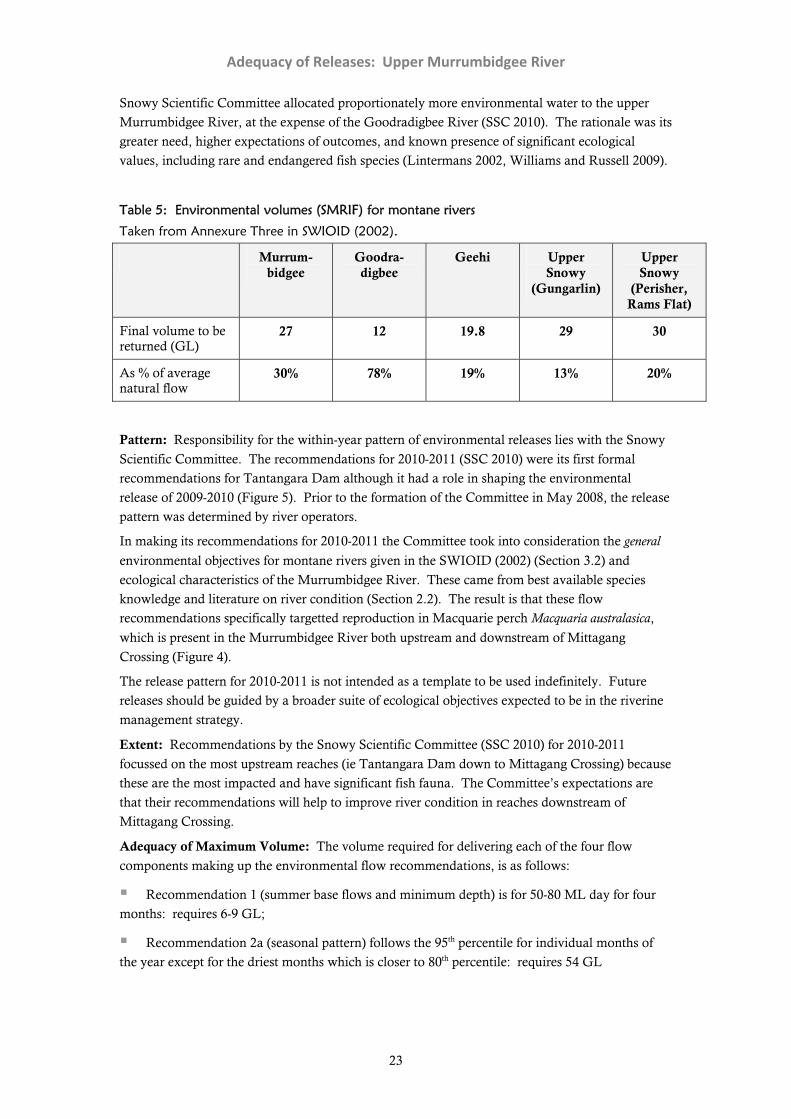
23
Snowy Scientific Committee allocated proportionately more environmental water to the upper
Murrumbidgee River, at the expense of the Goodradigbee River (SSC 2010). The rationale was its
greater need, higher expectations of outcomes, and known presence of significant ecological
values, including rare and endangered fish species (Lintermans 2002, Williams and Russell 2009).
Table 5: Environmental volumes (SMRIF) for montane rivers
Taken from Annexure Three in SWIOID (2002).
Murrum-bidgee
Goodra-digbee
Geehi Upper Snowy
(Gungarlin)
Upper Snowy
(Perisher, Rams Flat)
Final volume to be returned (GL)
27 12 19.8 29 30
As % of average natural flow
30% 78% 19% 13% 20%
Pattern: Responsibility for the within-year pattern of environmental releases lies with the Snowy
Scientific Committee. The recommendations for 2010-2011 (SSC 2010) were its first formal
recommendations for Tantangara Dam although it had a role in shaping the environmental
release of 2009-2010 (Figure 5). Prior to the formation of the Committee in May 2008, the release
pattern was determined by river operators.
In making its recommendations for 2010-2011 the Committee took into consideration the general
environmental objectives for montane rivers given in the SWIOID (2002) (Section 3.2) and
ecological characteristics of the Murrumbidgee River. These came from best available species
knowledge and literature on river condition (Section 2.2). The result is that these flow
recommendations specifically targetted reproduction in Macquarie perch Macquaria australasica,
which is present in the Murrumbidgee River both upstream and downstream of Mittagang
Crossing (Figure 4).
The release pattern for 2010-2011 is not intended as a template to be used indefinitely. Future
releases should be guided by a broader suite of ecological objectives expected to be in the riverine
management strategy.
Extent: Recommendations by the Snowy Scientific Committee (SSC 2010) for 2010-2011
focussed on the most upstream reaches (ie Tantangara Dam down to Mittagang Crossing) because
these are the most impacted and have significant fish fauna. The Committee’s expectations are
that their recommendations will help to improve river condition in reaches downstream of
Mittagang Crossing.
Adequacy of Maximum Volume: The volume required for delivering each of the four flow
components making up the environmental flow recommendations, is as follows:
Recommendation 1 (summer base flows and minimum depth) is for 50-80 ML day for four
months: requires 6-9 GL;
Recommendation 2a (seasonal pattern) follows the 95th percentile for individual months of
the year except for the driest months which is closer to 80th percentile: requires 54 GL

Adequacy of Releases: Upper Murrumbidgee River
24
Recommendation 2b (early summer fresh to trigger spawning) means 250-350 Ml day at
Mittagang Crossing for 2-4 weeks in spring/early summer: requires between 3.5-9.8 GL (without
considering ramping up or down);
Recommendation 3 (high flow event), with a peak of 4-6 GL day lasting 6-7 days: requires
24-42 GL (without considering ramping up or down).
However, the volume to achieve a high flow event is now different from what was recommended.
The recently-constructed outlet from Tantangara Dam is not capable of releasing 4-6 GL day and
instead has a maximum release capacity of 1.5 to 2.640 ML day, depending on water level in the
storage.
Recommendation 3 (high flow event, revised downwards), with a peak of 2 GL day, lasting
6-7 days at least (without considering ramping up or down): requires a minimum of 12-14 GL.
Being smaller, this revised high flow event will not achieve as much as the original high flow
recommendation. This can be compensated for, but only partly, by either extending the duration
or repeating the event: however investigations, such as hydraulic modelling, would be needed to
specify alternative parameters.
Of these four recommendations, Recommendation 2a alone exceeds the maximum environmental
flow volume of 27 GL allocated to the Murrumbidgee (Table 4). Hence it is clear that the share of
SMIRF allocated to the Murrumbidgee River is too small to satisfy the needs identified by the
Expert Panel.
[5.2] Losses, Diversions and Implications Losses and diversions need to be considered in relation to environmental flows because
collectively these influence how far downstream environmental benefits can be expected. Due to
the number of tributary inflows downstream of Tantangara Dam (Figure 1), the Murrumbidgee
River is considered a gaining stream (eg CSIRO 2008, in relation to Mittagang Crossing to
Billilingra). Losses have not been much considered, and information on transmission losses is
scant.
When modelling flow scenarios for the ACT Future Water Options, Barlow et al.(2005) drew on
studies done by Snowy Mountains Hydro-Electricity Authority (SMHEA) some thirty-five years
earlier, and made the following assumptions: that annual losses between Tantangara Dam and
Mittagang Crossing were equivalent to 2.64 GL; and that annual losses between Tantangara Dam
and Tharwa were equivalent to 8.9 GL (Barlow et al.2005). No seasonal pattern was given. The
estimate of 8.9 GL, which included evaporation, groundwater loss, water pumped by farmers and
Cooma town water supply, was described as “conservative” on account of having been calculated
under drought conditions (Barlow et al.2005). These estimates must certainly be conservative
relative to contemporary situation, given that demands such as irrigation and town water supply
will have increased substantially in 35 years.
Base Passing Flows are intended to maintain minimum landholder access consistent with the
domestic and stock rights for landholders with river frontage (Section 52, Water Management Act
2000) but in the upper Murrumbidgee they are also a town water supply (for Cooma). Within the

Adequacy of Releases: Upper Murrumbidgee River
25
study area, there are 51 unregulated access licenses4, with a total potential extractive volume of
11.6 GL per year between Tantangara Dam and Tharwa.
The actual volumes diverted out of the river, whether by landholders or for town water supply,
and their seasonal pattern is not known or not available. The data available from thirty-five years
ago strongly suggest that total diversions could far exceed the contemporary average annual
riparian release. This could impact on the river itself if diversions draw on environmental
releases.
Water Sharing Plans Water-sharing plans are the principal instrument used by the NSW government to achieve an
agreed balance between different water users such as diverters and the environment. There is a
water-sharing plan for the Murrumbidgee River that has been in place since 2004 (DWE 2009) but
it applies only to the ‘regulated’ part of the river, ie to the Murrumbidgee River downstream of
Burrinjuck Dam.
Advice from NSW Office of Water (Danielle Doughty, September 2010, pers. comm.) is that a
water-sharing plan “Murrumbidgee Unregulated and Alluvial Water Sharing Plan” is currently
being prepared. A draft will be released in December 2010 for public comment, until February
2011, and should come into effect in July 2011.
Environmental releases from Tantangara Dam are intended to provide benefit throughout the
study area. For its part, the ACT government has already made clear its commitment to
environmental releases that enter the ACT: “The ACT ensures that environmental flow requirements in the rivers for which it has responsibility are met by flows under the control of the ACT. In consequence, environmental flows from NSW upstream would pass through the ACT unaffected by activity in the ACT.”
(ACT 2006).
[5.3] Feedback Monitoring is critical as it provides feedback, and the SWIOID (2002) maps out its expectations
on this topic. These are that monitoring is to include objectives, a riverine management strategy
with performance measures for each river receiving an environmental release, an adaptive
framework, and data are to be shared amongst the parties. The SWIOID (2002) also sets out a
timeframe for completing the strategy (within two years of corporatisation, ie by 28th June 2004)
and specifies that it is the role of the NSW government to “measure the environmental benefits of
the Snowy Montane Rivers Increased Flows on an ongoing basis”. The adaptive element is
specifically included in the provision for change, if there is any “scientific evidence that Snowy
Montane Rivers Increased Flows along a particular river or combination of rivers harm native
species” (Paragraph 8.4, Part One, Annexure Two).
These expectations are generally sensible and universally accepted as basic good practice (eg
Lindenmayer and Likens 2010). Regrettably, they have not been implemented. The upper
Murrumbidgee does not currently have a management strategy, nor a set of river-specific
objectives, nor a set of flow-related performance measures. The pilot study does not have a
species focus, so the efficacy of the flow recommendations on endangered species is not known;
4 Unregulated access licenses: information on number, and allocation volume supplied by Ken Gillespie,
Department of Water and Energy, June 2009.

Adequacy of Releases: Upper Murrumbidgee River
26
and if there are any negative consequences of environmental flows on native species, then these
also remain unknown. The long-term vision is for a hydraulic model of certain reaches.
[5.4] Infrastructure and Delivery The release of poor water quality at low temperatures was identified by the Expert Panel as a
major constraint in rehabilitating the upper Murrumbidgee River (Pendlebury et al.1997). To
rectify this, Snowy Hydro was required to construct an outlet “capable of releasing water from
above the thermocline” and “of sufficient size to enable a flow rate of at least 2 GL day (SWL
2002). The result was a variable intake tower, complete with trash racks, which was completed in
2005.
Tantangara Dam now has the capacity to release maximum flows of 1500 ML day when the
storage is at Minimum Operating Level (MOL), rising to 2460 ML day when at full supply level
(FSL) (Andrew Nolan, pers. comm., May 2009). It is also capable of delivering flow variability,
with releases as low as 1 ML day and capacity to change outlet volumes at short notice.
Although the works undertaken by Snowy Hydro have addressed the requirements of its licence, it
is evident that its capacity to deliver 2000 ML day, as required for channel maintenance
(Pendlebury et al.1997), is dependent on the state of the storage. In practice, water levels in
Tantangara are kept low, and storage levels have not exceeded 40% capacity since 19975. Thus
the likelihood of delivering channel maintenance flows to the upper Murrumbidgee River is low
and will continue to be low, unless operating practices can be changed.
[5.5] Future Issues
Meeting urban demand The ACT and surrounds is an expanding urban population, and the largest residential
concentration in the Murray-Darling Basin. To meet future needs, the ACT water authority
(ACTEW) has resolved on augmenting Cotter Dam and has purchased water from licences
holders downstream of Burrunjuck Dam, to be stored in Tantangara Dam. The volume is
variously described as 11 GL (Barlow et al.2005) or as 12 GL of general security and 2 GL of high
security water (Danielle Doughty, September 2010, pers. comm.).
As pointed out above, Tantangara Dam diverts about 99% of inflows out of the Murrumbidgee
Valley and hence the river downstream of the Dam is chronically reduced. Thus, in a situation
similar to riparian releases, the effect of delivering this urban water supply is potentially positive
for the river environment, when considered in terms of volume.
Delivery of urban water could affect other flow components and hence affect the flow regime. It
is well-known, for example Mitta Mitta River downstream of Dartmouth Dam, Murray River
downstream of Hume Dam, that using rivers as a natural carrier to deliver supply water will result
in environmental degradation if not managed properly. The process for delivering this water from
Tantangara Dam down river to the ACT is not yet established, and is currently the subject of
negotiations involving the purchaser (ACTEW), the operator (Snowy Hydro Limited), and the
agency responsible for rivers (NSW Office of Water).
5 Snowy Hydro website: http://www.snowyhydro.com.au/default.asp . Lake Level calculator page,
accessed 1st October 2010.

Adequacy of Releases: Upper Murrumbidgee River
27
Negotiations between the parties will need to consider the pattern of delivery and its ecological
implications. Examples of issues include: avoiding stable flows and stable stages; and making
sure that demands for delivery at short-notice are consistent with the intent of environmental
releases schedules into the AWOP, and do not obscure flow components.
Climate Change At this point in time, there is a degree of uncertainty as to likely effects of climate change on yield
in the Murrumbidgee River catchment. Likely change (increase or decrease) depends on which
global climate model has been used, and outcomes are reported in terms of majority or consensus
amongst models, as if these were a truly random population. For example, using a number of
global climate models, the Sustainable Yields Project (CSIRO 2008) found that a decrease in run-
off and in winter rainfall was more likely than not. Although all authors (eg CSIRO 2008, CSIRO
2009, Vaze et al. 2008) emphasise the uncertainty, there is a consistent message that run-off is
likely to be reduced, to some degree.
If moderate reductions in run-off and a shift in seasonal distribution of rainfall does eventuate in
the next 20-30 years, then the flow characteristics of many streams can be expected to change. In
particular, smaller streams will be at risk of shifting from being permanent to intermittent or even
episodic. This could change the relationships between the main channel and its tributaries, for
example, concentrating refuges within the main river.
Future environmental objectives and priorities for the Murrumbidgee River may need to be quite
different from contemporary objectives and priorities.
[5.6] Conclusions The adequacy of the institutional arrangements in relation to environmental releases to the upper
Murrumbidgee River is poor, which is disappointing.
The three government agreement reached and recorded in the SWIOID allocates only 27 GL to
the river which is less than half of what the river needs. The low environmental releases are
supplemented by riparian releases but these are unlikely to do much to address the shortfall in
environmental volume relative to requirements, however the benefits of the riparian releases are
likely to be small (because they are so low), temporary (being restricted to certain times of the
year) and limited (the target being Cooma water supply), so of little benefit downstream of
Mittagang Crossing. Moreover, the environmental releases are currently not much protected, and
could be totally harvested. Regrettably, the effectiveness of the releases is not known and will
remain unknowable until a monitoring program with a flow-response feedback loop is securely
established.
The upper Murrumbidgee appears to be in an administrative and managerial void, with no Water
Sharing Plan (hence no protection), no river management strategy or ecological guidelines (no
direction for management) and no means of responding to future stresses and demands.

Adequacy of Releases: Upper Murrumbidgee River
28
Section 6: Findings and Recommendations
[6.1] Findings
Adequacy Overview Overall, the record is generally not good.
In terms of hydrology, the max volume to be allocated is less than required, and the rate of
delivery has been less than expected, and consequently the delivery of flow components to date
has been compromised. The required infrastructure works at Tantangara Dam have been
completed but the maximum release capacity of the new outlet is smaller than was anticipated
(Table 2) and this compromises the delivery of one flow component, high flow event. Riparian
releases have the potential to contribute to maintaining summer base flows and providing some
variability, but only over a restricted part of the river, at particular times of the year, and not in
any planned way: hence these need to be managed and delivered effectively. The same is
expected to be true for releases for urban (ACT) supply, which is currently in the future, and again
this will need to be managed effectively.
On the management side, there has been no progress in protecting environmental releases or
monitoring their effectiveness. A riverine management strategy has not been developed,
ecological monitoring has begun but is not consistent with the content and focus agreed to in the
SWIOID, and a Water Sharing Plan is being developed but is unlikely to be gazetted until
sometime in 2011. The other ecological monitoring and benchmarking programs in place for the
upper Murrumbidgee River will provide useful context and long-term interpretation of river
condition but do not offer direct feedback on the effectiveness of environmental releases from
Tantangara Dam.
Volume and SMRIF The low volume of environmental releases to date, and the fact that the release delivery is four
years behind what was expected (Table 4) can be attributed to recent dry conditions. However
focusing on drought, low run-off, low allocations, and the fact that SRIF was capped by the
Mowamba Borrow until August 2010, obscures the very real worry that low volume is also a
concern for the future. A simple comparison between what is needed and what is to be available
shows that 27 GL is not enough to deliver all the flow components making up the flow regime for
a river.
Restoration of the upper Murrumbidgee River clearly requires more than 27 GL. Additional
volumes could be obtained by re-distributing the 118 GL of the SMRIF (Table 5) amongst the
montane rivers. The basis for the current distribution pattern is uncertain. Moreover, there are
real opportunities to do this, as the SMRIF is not fixed and the SWIOID (2002) makes explicit
provision for change.
Efficacy of Environmental Releases Assessing the effectiveness of environmental releases, both in the long-term and in the short-term
as feedback, is limited by resource constraints within the state government agencies with primary
responsibility for rivers and the in-stream environment. This means that a different kind of flow

Adequacy of Releases: Upper Murrumbidgee River
29
response monitoring is needed, one that is unlike the whole-of-system perspective of the Snowy
Flow Response Monitoring and Modelling program.
One possibility is to have a dual approach, and separate long-term effectiveness and river
condition from short-term feedback. This would be consistent with the adaptive management
framework proposed by Lindemeyer and likens (2010).
In the case of long-term effectiveness, for example, there is opportunity to use large-scale river
health monitoring programs being run by other organisations as a backbone and to build this ie by
piggybacking to conform with river-specific needs. This would mean relying on ecological
programs such as the SRA, or periodic re-visits to benchmarking sites for fish assemblages
(Gilligan 2005) and the macro-invertebrate monitoring program established by ACTEW, and
making state-wide monitoring programs, such as water quality and hydrology, more effective.
Short-term feedback could be restricted to the more responsive and dynamic environmental
variables with specific causal links to flow or flow effects, such as silt accumulation and removal,
in-filling, scouring and entrainment, temperature changes, changes in biofilm load on gravels and
their composition. Including the population structure of endangered (MNES) aquatic species
known to de dependent on particular flow conditions to breed and recruit would help make this
consistent with the SWIOID (2002). Preparation of a ‘long list’ of the most appropriate variables
could be done by conceptual modelling to target flow-related hypotheses, and this could be culled
into a short-list by considering cost-effectiveness.
The feasibility of this approach would be increased by investment in hydrographic and hydraulic
infrastructure.
Safe-guarding the flow regime Environmental releases are just one management strategy for improving the poor condition of the
upper Murrumbidgee River but any benefits from environmental releases can only be realised if
these are protected, and if the flow regime of the river is also protected.
Recent environmental releases target the river between Tantangara Dam and Mittagang Crossing
because that is where the need is greatest, and where the benefits will be most readily detected.
However, there is still a need for flow restoration downstream of Mittagang Crossing, and the
benefit of the releases is expected to be felt downstream of Mittagang Crossing. In particular,
need to ensure that high flow releases travel intact beyond Mittagang Crossing, as the disturbance
effects resulting from scouring and entrainment are also there.
[6.2] Recommendations The following seven recommendations arise out of this review and the points made above.
Hydrology and hydraulics The reach between Tantangara Dam and Mittagang Crossing is poorly understood but is
important as it is the most impacted by Tantangara Dam yet still retains nationally endangered
species such as Macquarie perch. The interplay between riparian releases and tributary inflows,
and between transmission losses and extraction have potential to change the flow regime, and this
can determine how much the next major downstream tributary, the Numeralla River, affects the
condition of the main stem. Lack of hydraulic modelling is a constraint on making informed flow
recommendations, and will make effective integration of different parcels of water (urban supply,
riparian releases, environmental releases, natural inflows) quite challenging.

Adequacy of Releases: Upper Murrumbidgee River
30
Recommendation 1: Re-instate the gauge at Yaouk.
Recommendation 2: Accelerate the development of a hydraulic model for the upper
Murrumbidgee River, and in particular from Tantangara Dam to Mittagang Crossing.
Environmental Releases The maximum volume (27 GL) scheduled for environmental release under the SWIOID (2002)
for the upper Murrumbidgee is inadequate to deliver all flow components, making it essential that
environmental releases are protected from extraction.
Recommendation 3: Explore possibilities for sharing SMRIF amongst the four montane rivers
with a view to substantially increasing the proportion and hence also the volumetric allocation to
the upper Murrumbidgee River.
Recommendation 4: Protect environmental releases first, by accelerating the development of
Water Sharing Plans; and second, by developing means for protecting environmental releases
from consumptive use.
Ecological Management The study area is information poor and would benefit from encouraging academic involvement or
collaborative projects between ACT and NSW-based institutions. This lack of basic knowledge is
not commensurate with the status of the Murrumbidgee River as one of the high profile and
significant rivers in the Murray-Darling Basin, and it prejudices responsible and effective
management. Although the following recommendations appear to emphasise management,
gaining knowledge through monitoring, investigation, inventory and research should be
considered as being or primary importance.
Recommendation 5: Fund, commit to and implement a flow response monitoring program. A
two-tier approach to flow-response monitoring is suggested as a cost-effective model that separates
long-term trend and contextual information from short-term flow-related responses and tracking
the status of listed aquatic species.
Recommendation 6: Schedule a review process for flow objectives and ecological priorities
within the next five years, for 2015.
Recommendation 7: Develop a means for integrating the various demands on Tantangara
releases whilst optimising flow release for environmental benefit.

Adequacy of Releases: Upper Murrumbidgee River
31
References ACT (2006). 2006 Environmental flow guidelines. ACT government. January 2006.
Banks J. (1997). Status of riparian vegetation of the upper Murrumbidgee River. Pages 72-81 in Pendlebury et
al.(1997).
Barlow A, Norris R, Wilkinson L, Osborne W, Lawrence I, Lowery D, Linke S, DeRose R, Wilkinson S and
Olley J (2005). Appendix H: Aquatic Ecology Study. Report on the existing aquatic ecology that may be
affected by each of the proposed future water supply options. Draft Environmental Impact
Statement. ACTEW Corporation. April 2005.
Brown P. (1997). The effects of flow regulation on the fish ecology of the upper Murrumbidgee River. Pages 86-94 in
Pendlebury et al.(1997).
Cremer K (1999). Willow management for Australian rivers. Natural Resource Management. December 1999.
CSIRO (2009). Advice on defining climate scenarios for use in the Murray-Darling Basin Authority’s Plan modelling.
A report from CSIRO to the Murray-Darling Basin Authority. MDBA Technical Report Series:
Basin Plan: BP01. July 2009.
CSIRO (2008). Water availability in the Murrumbidgee. A report to the Australian Government from the
CSIRO Murray-Darling Basin Sustainable Yields Project. CSIRO, Australia.
Davies P, Harris J, Hillman T and Walker K (2008). A report on the ecological health of rivers in the Murray-
Darling Basin, 2004-2007. Prepared by the Independent Sustainable Rivers Audit Group for the
Murray-Darling Basin Ministerial Council. Canberra. June 2008.
DWE (2009). Water sharing in the Murrumbidgee Regulated River. Progress Report 2004 to 2008. Department of
Water and Energy. May 2009.
Erskine WD (1997). Application of geomorphology in the determination of environmental flows on the upper
Murrumbidgee River. Pages 46-66 in Pendlebury et al.(1997).
Gilligan D (2005). Fish communities of the Upper Murrumbidgee catchment: status and trends. NSW Department
of Primary Industries. Fisheries Final Report Series. Number 75. March 2005.
Harrison ET, Norris RH and Wilkinson SN (2008). Can an indicator of river health be related to
assessments from a catchment-scale sediment model? Hydrobiologia 600, 49-64.
Lindenmayer DB and Likens GE (2010). Effective ecological monitoring. CSIRO Publishing, Collingwood.
Lintermans M (2002). Fish in the upper Murrumbidgee catchment. A review of current knowledge. Environment
ACT.
Lintermans M (2005). Fish Impact Study. a review of potential impacts on fish and crayfish of future water supply
options for the Australian Capital Territory. Prepared by Environment ACT. April 2005.
Marchant R (1997). Macroinvertebrates of the upper Murrumbidgee River. Pages 82-85 in Pendlebury et al.(1997).
Marchant R & Hehir G (2002). The use of AUSRIVAS predictive models to assess the response of lotic
macroinvertebrates to dams in south-east Australia. Freshwater Biology 47, 1033-1050.
Morris SA, Pollard DA, Gehrke PC and Pogonoski JJ (2001). Threatened and potentially threatened freshwater
fishes of coastal New South Wales and the Murray-Darling Basin. Report to Fisheries Action Program and
World Wide Fund for Nature. Project No. AA 0959.98.
NSW Office of Water (2009a). Final Report. Five-year review of the Snowy Hydro Water Licence. Licence review.
May 2002 to May 2007. NSW Office of Water through the Department of Environment, Climate
Change and Water. November 2009.
NSW Office of Water (2009b). Proposed variation of the Snowy Hydro Water Licence: In accordance with clause
26(1)(b), and (e) of the Snowy Hydro Corporatisation Act 1997 (NSW). NSW Office of Water through the
Department of Environment, Climate Change and Water. November 2009.
Olley JM and Wasson RJ (2003). Changes in the flux of sediment in the Upper Murrumbidgee catchment,
southeastern Australia, since European settlement. Hydrological Processes 17: 3307-3320.
Pendlebury P (1997). Hydrology report to the upper Murrumbidgee River Expert Panel. Pages 28-45 in Pendlebury
et al.(1997).

Adequacy of Releases: Upper Murrumbidgee River
32
Pendlebury P, Erskine WD, Olley J, Banks J, Marchant R and Brown P (1997). Expert Panel Environmental
Flow Assessment of the Upper Murrumbidgee River. Prepared for the NSW Environmental Protection
Authority. December 1997.
Poff, N.L., Allan, J.D., Bain, M.B., Karr, J.R., Prestegaard, K.L., Richter, B.D., Sparks, R.E. and
Stromberg, J.C. (1997). The natural flow regime. Bioscience 47: 769-784.
SSC (2008). Adequacy of environmental flows to the Snowy River. Report SSC_1. Prepared by the Snowy
Scientific Committee for the Water Administration Ministerial Corporation. Canberra. October
2008.
SSC (2009). The Mowamba Borrow and its effect on rehabilitating the Snowy River. SSC Options Paper_1.
Options Paper submitted to NSW Office of Water. December 2009.
SSC (2010). Environmental Releases from Jindabyne and Tantangara Dams: Recommendations for 2010-2011.
Report SSC_3. Prepared for the NSW Water Administration Ministerial Corporation. Canberra.
August 2010. .
SWIOID (2002). Snowy Water Inquiry Outcomes Implementation Deed. New South Wales Government. Dated
3 June 2002.
SWL (2002). Snowy Water Licence. Issued 30 May 2002. Issued under part 5 of the Snowy hydro
Corporatisation Act 1997 (NSW).
Vaze J, Teng J, Post D, Chiew F, Perraud J-M and Kirono D (2008). Future climate and run-off projections
(~2030) for New South Wales and the Australian Capital Territory. NSW Department of Water and
Energy, Sydney.
Wilkinson S, Jansen A, Watts R, Read A and Miller T (2004). Techniques for targeting protection and
rehabilitation of riparian vegetation in the middle and upper Murrumbidgee catchment. CSIRO Land and
Water Technical Report 37/04. October 2004.
Williams S and Russell M (2009). Assessment of matters of National Environmental Significance in the Snowy and
Montane Rivers. Snowy River Recovery, Snowy flow response monitoring and modelling. NSW
Office of Water Sydney. December 2009.
Young WJ, Chessman BC, Erskine WD, Raadik TA, Wimbush DJ, Tilleard J, Jakeman AJ, Varley I and
Verhoeven J (2004). Improving expert panel assessments through the use of a composite River
Condition Index – the case of the rivers affected by the Snowy Mountains Hydro-Electric Scheme,
Australia. River Research and Applications 20: 733-750.

Adequacy of Releases: Upper Murrumbidgee River
33
Appendix 1: Time Series @ Mittagang Crossing
Murrumbidgee River @ Mittagang Crossing (gs 410033)
Murrumbidgee River @ Mittagang Xing: 1930-1939
0
2000
4000
6000
8000
10000
1/01/1930 1/01/1931 1/01/1932 1/01/1933 1/01/1934 1/01/1935 1/01/1936 1/01/1937 1/01/1938 1/01/1939
Murrumbidgee River @ Mittagang Xing: 1991-2000
0
2000
4000
6000
8000
10000
1/01/1991 1/01/1992 1/01/1993 1/01/1994 1/01/1995 1/01/1996 1/01/1997 1/01/1998 1/01/1999 1/01/2000
ML
day

Adequacy of Releases: Upper Murrumbidgee River
34
Appendix 2: Timing of Releases
History of Releases from Tantangara Dam
Table A2: Releases from Tantangara Dam, 1 May 1993 to 31 October 2009
Periods per water year for riparian and environmental releases. Releases going beyond the water year (after 30 April) or starting before (1 May) are shown in brackets, and the entry is repeated for the following water year. Data provided by Snowy Hydro Limited.
Water year Riparian Environmental
1993-1994 10 January to 13 April
1994-1995 29 September to 6 October
20 December to 27 December
3 January to 23 January
20 February to 2 March
13 March to (3 May)
1995-1996 (13 March) to 3 May
1996-1997 19 December to 27 December
21 January to 6 March
18 March to (11 June)
1997-1998 (18 March) to 11 June
2 December to (24 June)
1998-1999 (2 December) to 24 June
15 February to 29 March
13April to 14 April
1999-2000 7 February to 18 February
22 February to 13 March
2000-2001 3 January to 30 January
2001-2002 22 December to 5 February
21 March to (15 May)
2002-2003 (21 March) to 15 May
18 March to 2 December
13 December to (4 June)
2003-2004 (13 December) to 4 June
10 February to 18 April
24 April to (31 May)
2004-2005 (24 April) to 31 May
3 June to 6 June
8 June to 9 June
13 April to 19 April
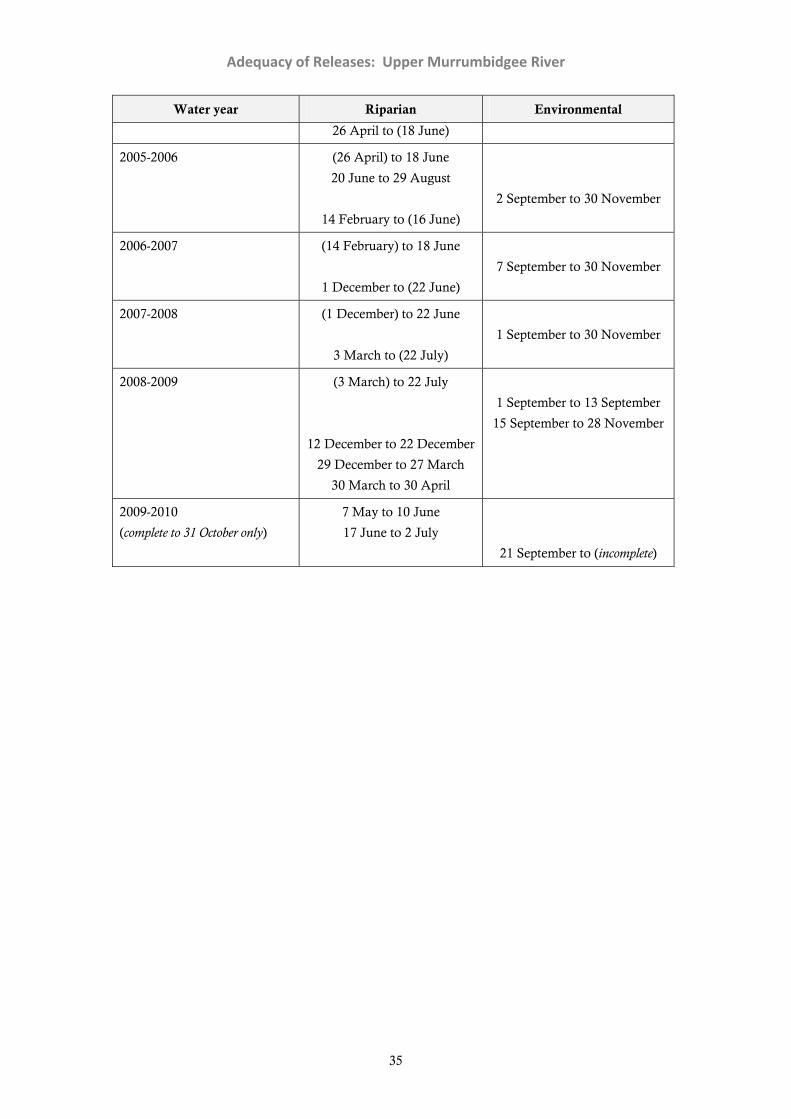
Adequacy of Releases: Upper Murrumbidgee River
35
Water year Riparian Environmental
26 April to (18 June)
2005-2006 (26 April) to 18 June
20 June to 29 August
14 February to (16 June)
2 September to 30 November
2006-2007 (14 February) to 18 June
1 December to (22 June)
7 September to 30 November
2007-2008 (1 December) to 22 June
3 March to (22 July)
1 September to 30 November
2008-2009 (3 March) to 22 July
12 December to 22 December
29 December to 27 March
30 March to 30 April
1 September to 13 September
15 September to 28 November
2009-2010
(complete to 31 October only)
7 May to 10 June
17 June to 2 July
21 September to (incomplete)

Adequacy of Releases: Upper Murrumbidgee River
36
Appendix 3: Channels in the catchment
A GIS analysis (Wilkinson et al 2004) of drainage network characteristics used remote sensing
imagery and SEDNET to produce a series of maps showing drainage network characteristics.
Excerpts from these are reproduced here.
Figure A3a: Condition of the upper Murrumbidgee River catchment
Clip from Wilkinson et al.(2004) showing broad categories of percent cover of riparian vegetation (left) and estimated bank erosion rates (right) for the Murrumbidgee catchment upstream of Burrunjuck Dam (at top left). Tantangara Dam is lower left, west of the ACT. Key: Riparian vegetation (as percent cover within 40m of channel): Red = 0 to 0.1, Yellow -= 0.1 to 0.4, Green = 0.4 to 1. Key: Bank erosion (as average metres per year): Blue = 0 to 0.01, Green = 0.01 to 0.03, Red = 0.03 to 0.57.

Adequacy of Releases: Upper Murrumbidgee River
37
Figure A3b: Condition of the upper Murrumbidgee River catchment
Clip from Wilkinson et al.(2004) showing broad categories of hillslope erosion (left) and gully density (right) for the Murrumbidgee catchment upstream of Burrunjuck Dam (at top left). Tantangara Dam is lower left, west of the ACT. Key: Hillslope erosion (as tonnes per hectare per year): Green = 0 to 2, yellow = 2 to 7, and pink = 7 to 263. Key: Gully density (as km per km2): Green = 0.02, pale yellow = 0.2 to 0.78, pale orange = 0.78 to 1.12, pink = 1.13 to 2.2, and pale lilac = Reserves.

Adequacy of Releases: Upper Murrumbidgee River
38
Figure A3c: Condition of the upper Murrumbidgee River catchment
Clip from Wilkinson et al.(2004) showing broad categories of sediment load for the Murrumbidgee catchment upstream of Burrunjuck Dam (at top left). Tantangara Dam is lower left, west of the ACT. Key: average sediment load (as kilotonnes per year): Blue = 0 to 3, Green = 3 to 100, Red = 100 to 530.

Adequacy of Releases: Upper Murrumbidgee River
39
Appendix 4: Releases and Flows
Summer 2006
0
25
50
75
100
125
150
175
1/02
/06
8/02
/06
15/0
2/06
22/0
2/06
1/03
/06
8/03
/06
15/0
3/06
22/0
3/06
29/0
3/06
5/04
/06
12/0
4/06
19/0
4/06
26/0
4/06
3/05
/06
10/0
5/06
17/0
5/06
24/0
5/06
31/0
5/06
7/06
/06
14/0
6/06
21/0
6/06
28/0
6/06
flow
ML
day
Tantangara Releases Mittagang Flows
Figure A4: Riparian releases and flows at Mittagang Crossing
Time series showing how flow at Mittagang Crossing is both trigger and response to riparian releases from Tantangara Dam.


![Capital Adequacy (E) Task Force - National Association of ... · Capital Adequacy (E) Task Force . RBC Proposal Form [ ] Capital Adequacy (E) Task Force ... LR004 – Mortgages –](https://static.fdocuments.in/doc/165x107/5f0a28317e708231d42a4995/capital-adequacy-e-task-force-national-association-of-capital-adequacy-e.jpg)