Addressing key social determinants of health: what role ... · PDF fileAddressing key social...
125
Addressing key social determinants of health: what role can ward-based outreach teams play? David Sanders Emeritus Professor: School of Public Health University of the Western Cape Member of Global Steering Council, Peoples Health Movement A WHO Collaborating Centre for Research and Training in Human Resources for Health
Transcript of Addressing key social determinants of health: what role ... · PDF fileAddressing key social...

Addressing key social determinants of health: what role can ward-based outreach teams play?
David Sanders Emeritus Professor: School of Public Health
University of the Western Cape Member of Global Steering Council,
Peoples Health Movement
A WHO Collaborating Centre for Research and Training in
Human Resources for Health

Outline of Presentation
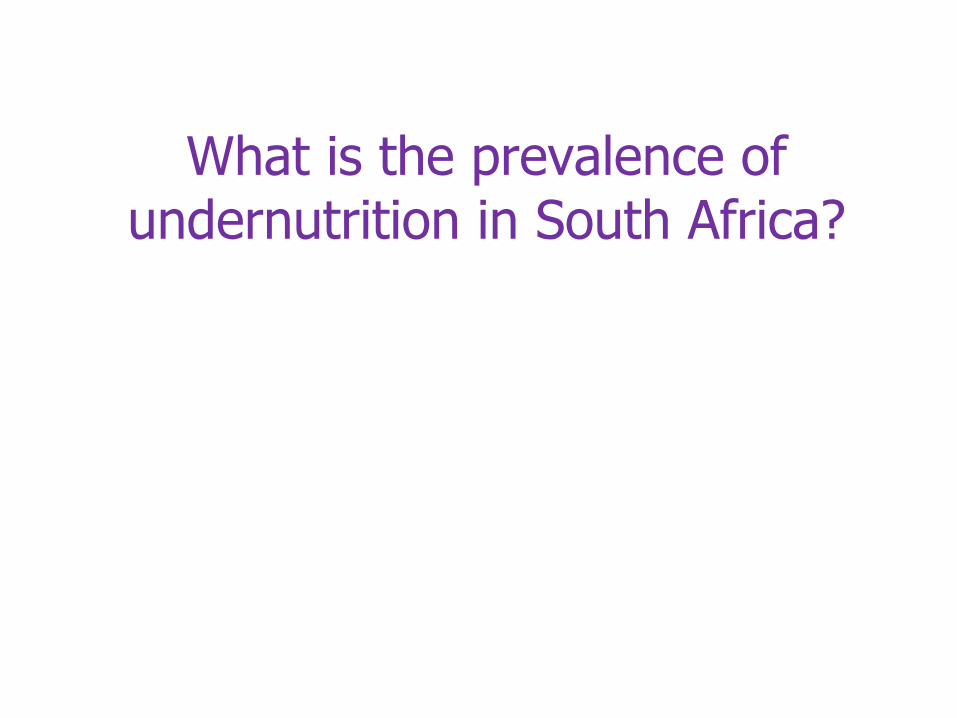
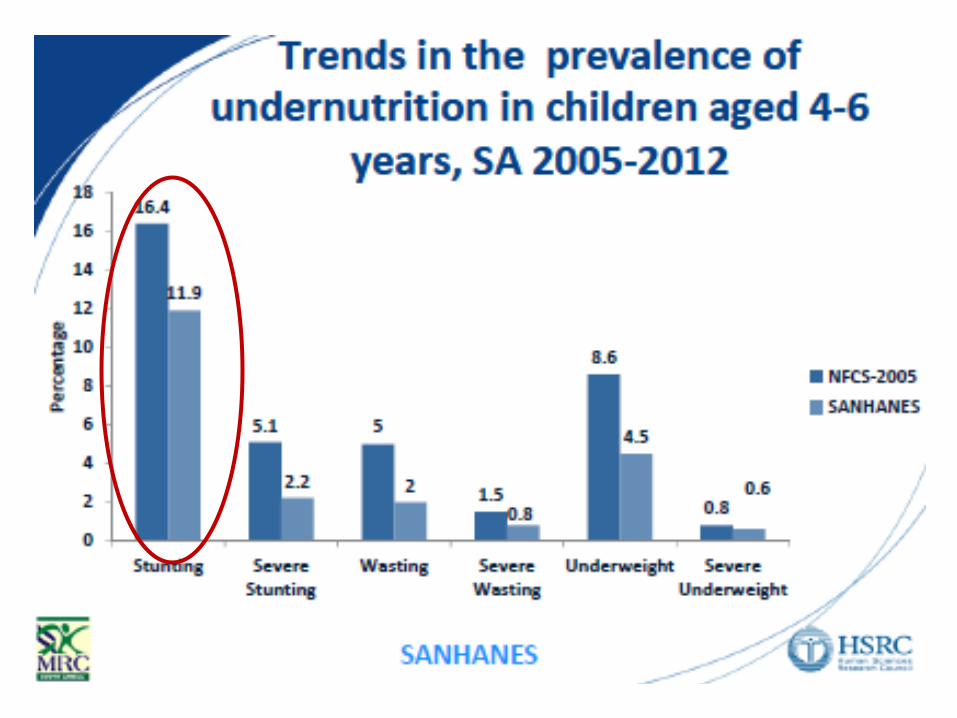
n The significance of nutritional status in South Africa’s health situation
n Prevalence, trends and determinants of undernutrition and hunger
n Prevalence trends and determinants of overweight/obesity
n Dietary factors and the food environment in overweight/obesity and their social and structural determinants
n Possible interventions to address the ‘double burden’ of malnutrition including the role of WBOTs

Causes of under-five deaths in South Africa
• Neonatal causes; pneumonia, diarrhoea and other child illness; and HIV/AIDS each account for 30% of U5 deaths
• According to Child PIP 60% of children were underweight and a third were severely malnourished Based on SA Burden of Disease estimates for 2000
Lancet Vol 371 April 12, 2008, 1294-1304
What is the prevalence of undernutrition in South Africa?


Imagine a stroll by the river …
You notice a movement in the water, it is a baby, drowning! … then another infant, half-submerged, floats down in the water struggling for life … followed by 5, 10 more -- and more and more and more
You become very good at saving drowning children, develop new methods & technology, teach others, attend international conferences
but more and more and more and more come struggling down …
Photo: L Reynolds

Structural Societal
Behavioural Biological
Burden of Disease study, PGWC
DOWNSTREAM UPSTREAM

Breast Feeding in South Africa
Duration of Breastfeeding • Only 8 percent of infants under 6 months are
exclusively breastfed and a further 19 percent are almost exclusively breastfed with the addition of water only.
• Addition of other liquids whilst breastfeeding starts very early in South Africa.
DHS 2003

Food security
• Food security exists when all people at all times have physical and economic access to sufficient, safe and nutritious food to meet their dietary needs and food preferences for an active and healthy life.
• This definition has been identified with the four dimensions of food security: availability, access, stability and utilisation. It embodies the food and care-related aspects of good nutrition (Committee on World Food Security 1996, 2012)
• Food insecurity can be chronic, temporal, temporary or cyclical
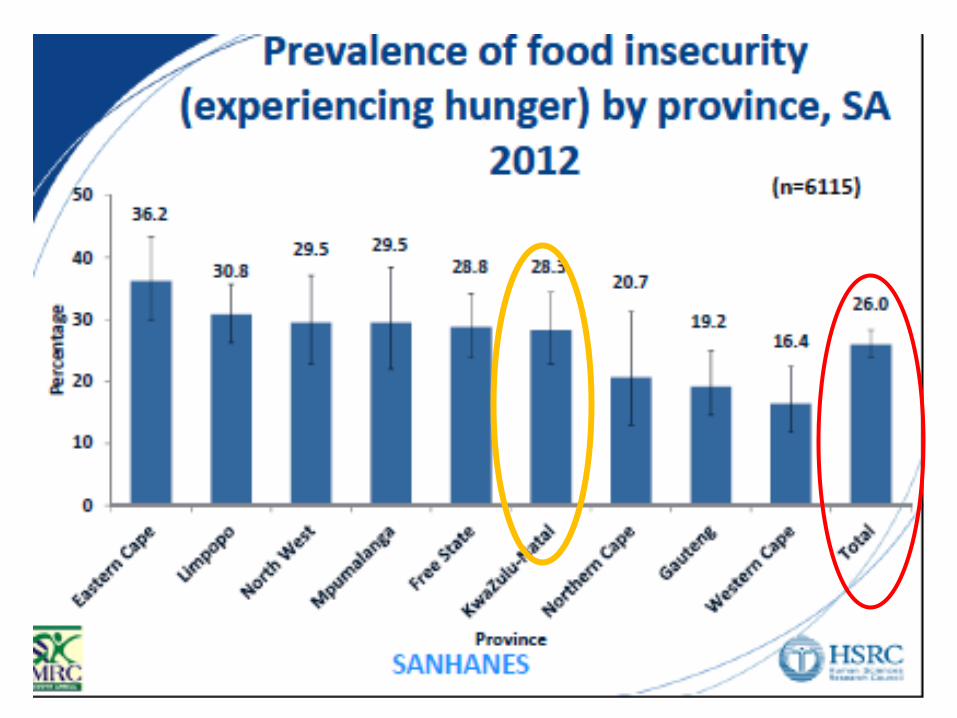
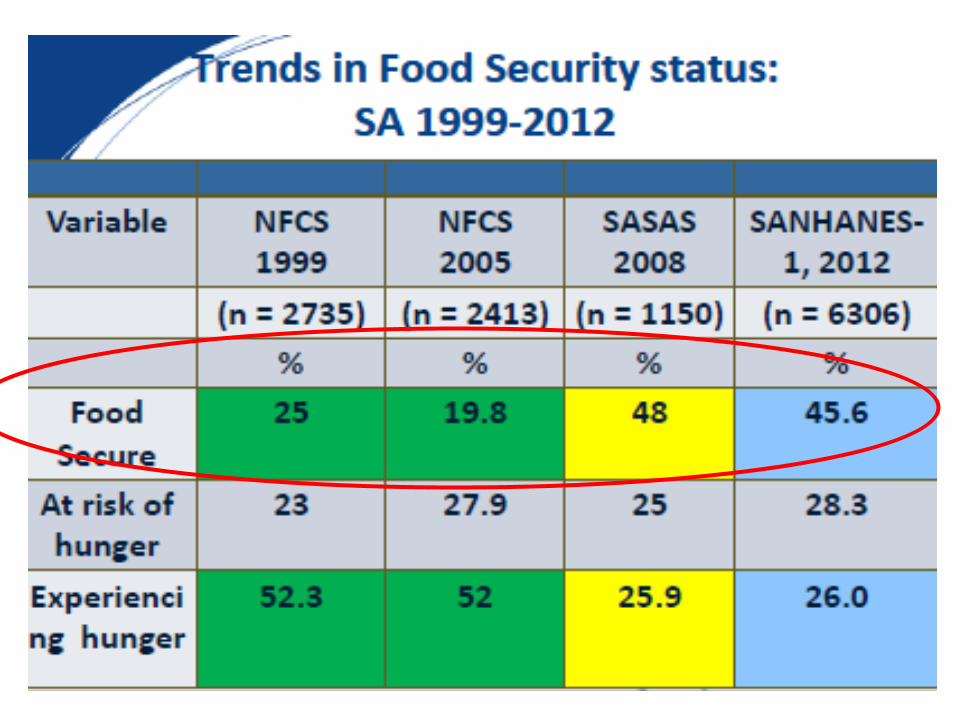
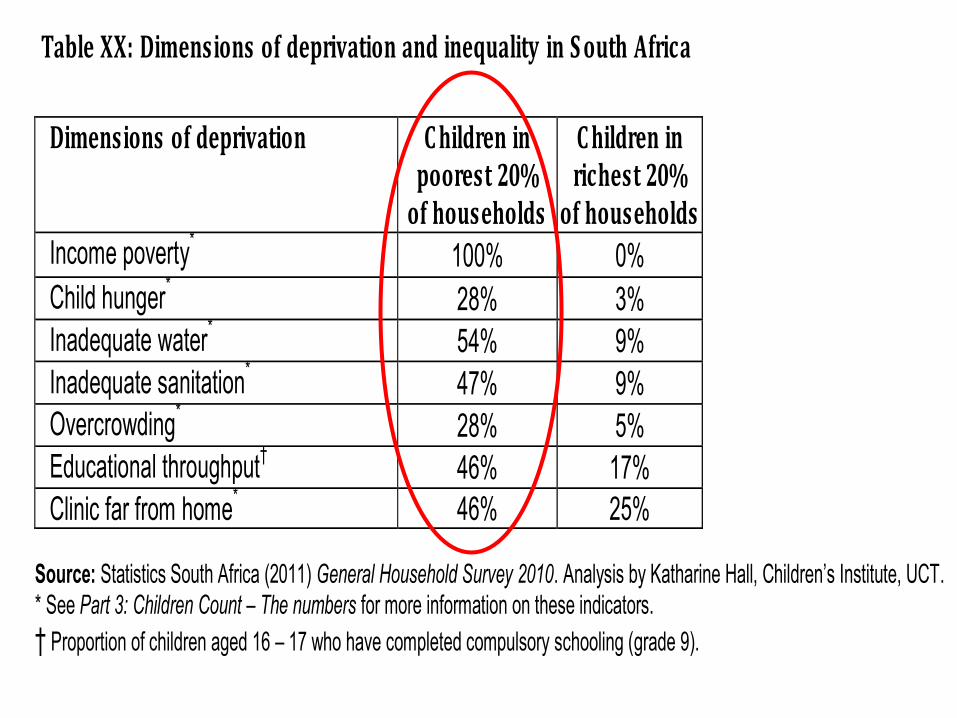
Table XX: Dimensions of deprivation and inequality in South Africa Dimensions of deprivation Children in
poorest 20% of households
Children in richest 20% of households
Income poverty* 100% 0% Child hunger* 28% 3% Inadequate water* 54% 9% Inadequate sanitation* 47% 9% Overcrowding* 28% 5% Educational throughput† 46% 17% Clinic far from home* 46% 25%
Source: Statistics South Africa (2011) General Household Survey 2010. Analysis by Katharine Hall, Children’s Institute, UCT. * See Part 3: Children Count – The numbers for more information on these indicators. † Proportion of children aged 16 – 17 who have completed compulsory schooling (grade 9).

Child poverty in South Africa remains extremely high. In 2010, six out of every 10 children lived in households with an income of less than R575 per person per month. Stark racial disparities persist, with 67% of African children living in poor households compared to only 4% of White children
Statistics South Africa (2011) General Household Survey 2010

Inequality persists • The poorest 10% of
households received less than 0.5% of all income
• 90% of households received 55% of all income
• The income of the wealthiest group is 88 times greater than that of the poorest decile
Stats SA, 2013, MDG Report


Non-communicable Diseases, overweight and obesity in South Africa

Figure 2. Diabetes prevalence based on 1985 WHO criteria presented by age categories for men and women in 1990 and 2008/09.
Peer N, Steyn K, Lombard C, Lambert EV, et al. (2012) Rising Diabetes Prevalence among Urban-Dwelling Black South Africans. PLoS ONE 7(9): e43336. doi:10.1371/journal.pone.0043336 http://www.plosone.org/article/info:doi/10.1371/journal.pone.0043336


Obesity Trends* Among U.S. Adults BRFSS, 1986
(*BMI ≥30, or ~ 30 lbs. overweight for 5’ 4” person)

Obesity Trends* Among U.S. Adults BRFSS, 1987
(*BMI ≥30, or ~ 30 lbs. overweight for 5’ 4” person)

Obesity Trends* Among U.S. Adults BRFSS, 1988
(*BMI ≥30, or ~ 30 lbs. overweight for 5’ 4” person)
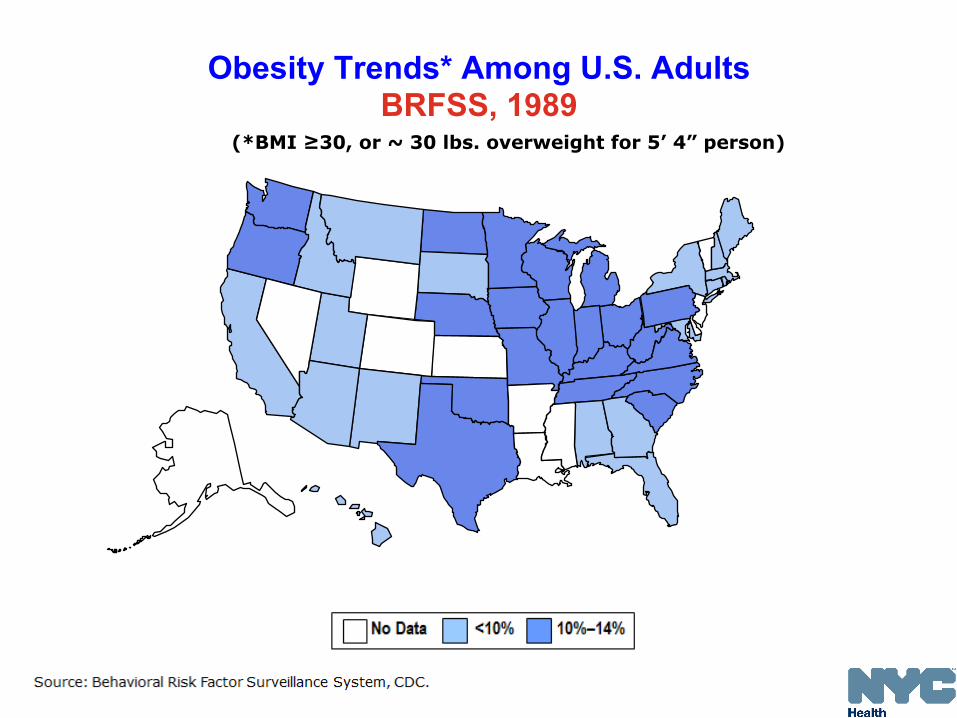
Obesity Trends* Among U.S. Adults BRFSS, 1989
(*BMI ≥30, or ~ 30 lbs. overweight for 5’ 4” person)

Obesity Trends* Among U.S. Adults BRFSS, 1990
(*BMI ≥30, or ~ 30 lbs. overweight for 5’ 4” person)

Obesity Trends* Among U.S. Adults BRFSS, 1991
(*BMI ≥30, or ~ 30 lbs. overweight for 5’ 4” person)

Obesity Trends* Among U.S. Adults BRFSS, 1992
(*BMI ≥30, or ~ 30 lbs. overweight for 5’ 4” person)
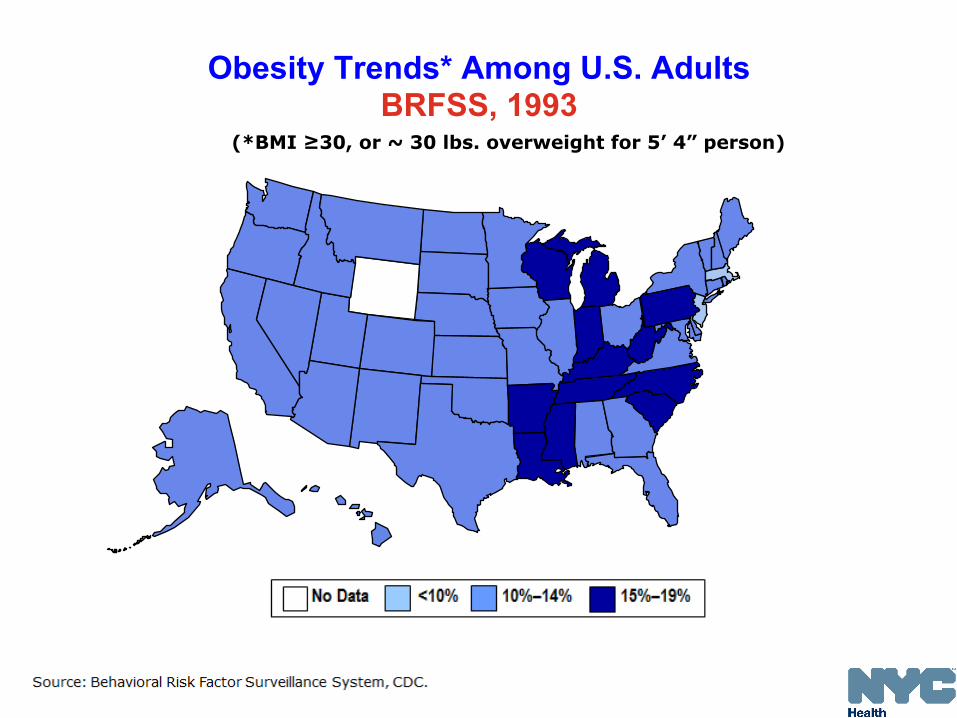
Obesity Trends* Among U.S. Adults BRFSS, 1993
(*BMI ≥30, or ~ 30 lbs. overweight for 5’ 4” person)
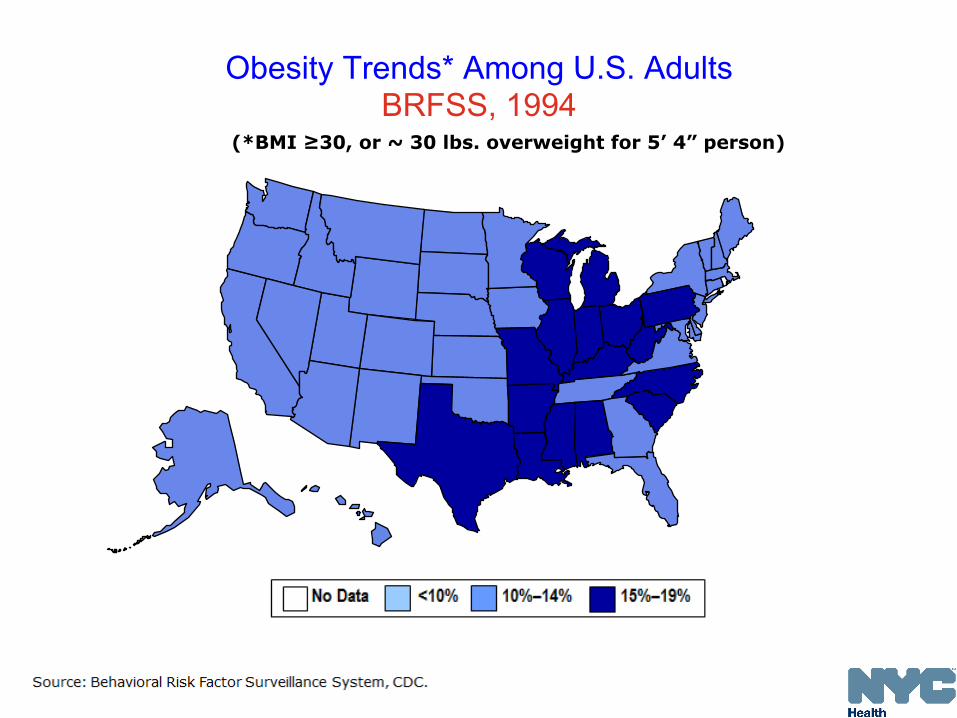
Obesity Trends* Among U.S. Adults BRFSS, 1994
(*BMI ≥30, or ~ 30 lbs. overweight for 5’ 4” person)
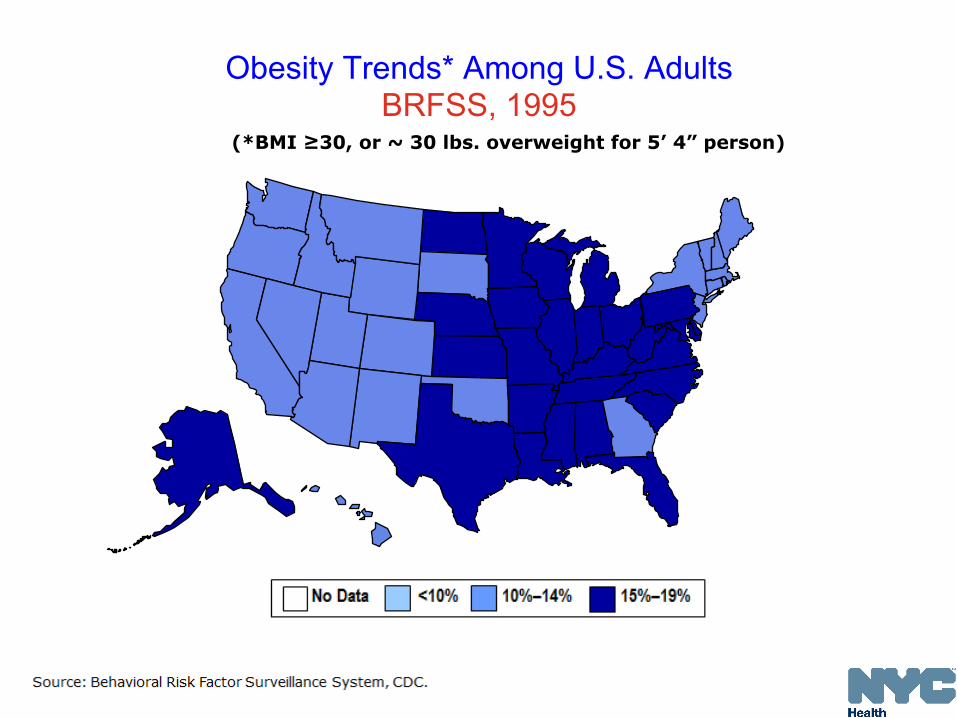
Obesity Trends* Among U.S. Adults BRFSS, 1995
(*BMI ≥30, or ~ 30 lbs. overweight for 5’ 4” person)

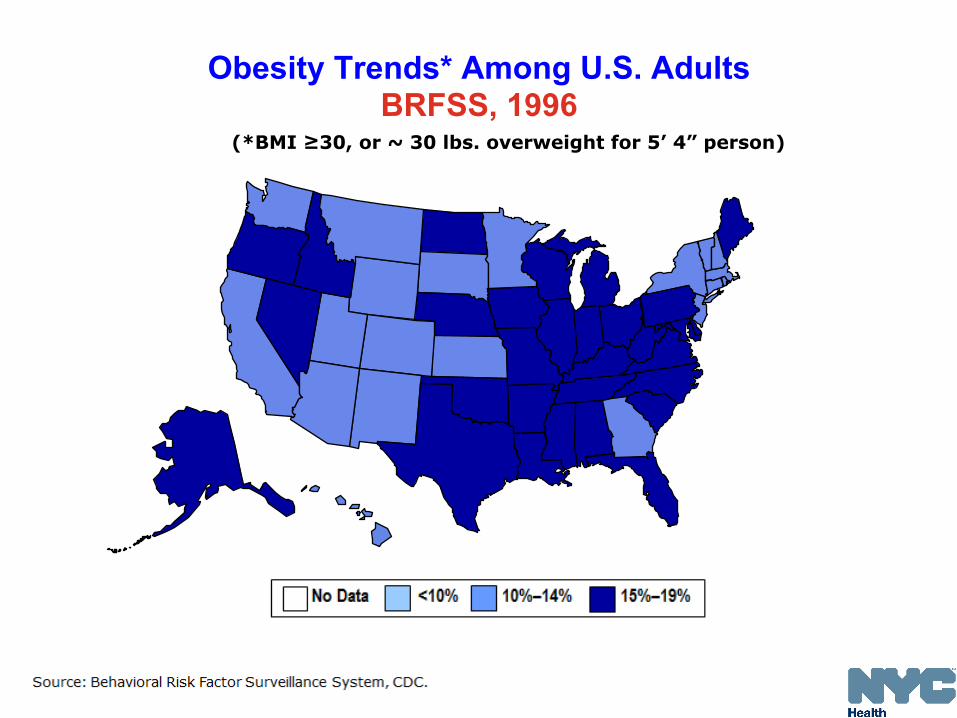
Obesity Trends* Among U.S. Adults BRFSS, 1996
(*BMI ≥30, or ~ 30 lbs. overweight for 5’ 4” person)
Obesity Trends* Among U.S. Adults BRFSS, 1996
(*BMI ≥30, or ~ 30 lbs. overweight for 5’ 4” person)

Obesity Trends* Among U.S. Adults BRFSS, 1997
(*BMI ≥30, or ~ 30 lbs. overweight for 5’ 4” person)

Obesity Trends* Among U.S. Adults BRFSS, 1998
(*BMI ≥30, or ~ 30 lbs. overweight for 5’ 4” person)

Obesity Trends* Among U.S. Adults BRFSS, 1999
(*BMI ≥30, or ~ 30 lbs. overweight for 5’ 4” person)

Obesity Trends* Among U.S. Adults BRFSS, 2000
(*BMI ≥30, or ~ 30 lbs. overweight for 5’ 4” person)

Obesity Trends* Among U.S. Adults BRFSS, 2001
(*BMI ≥30, or ~ 30 lbs. overweight for 5’ 4” person)
(*BMI ≥30, or ~ 30 lbs. overweight for 5’ 4” person)
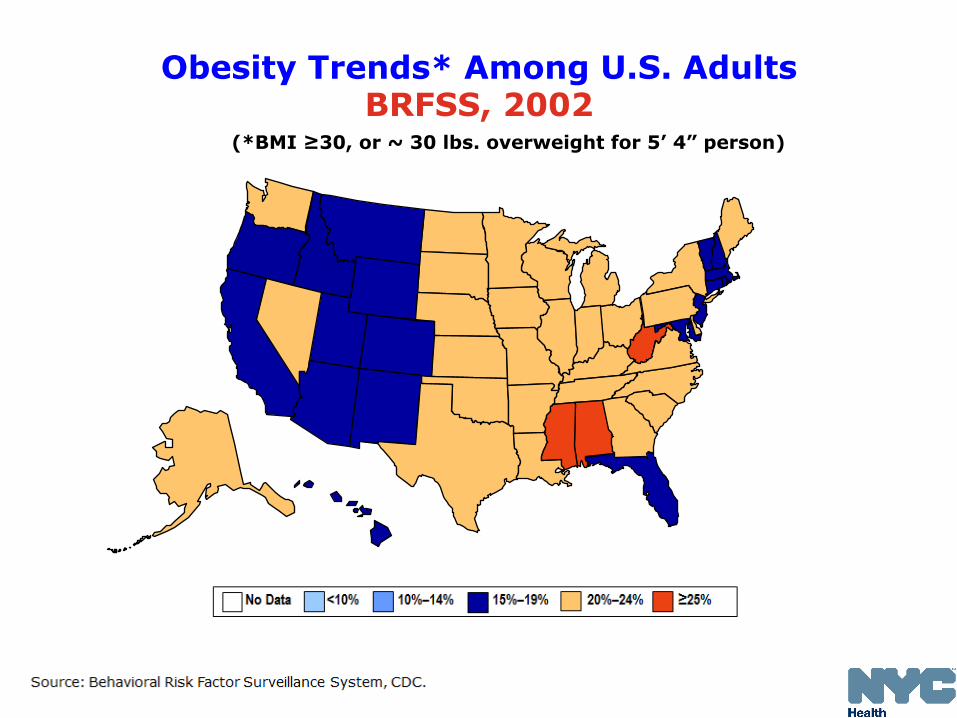
Obesity Trends* Among U.S. Adults BRFSS, 2002

Obesity Trends* Among U.S. Adults BRFSS, 2003
(*BMI ≥30, or ~ 30 lbs. overweight for 5’ 4” person)
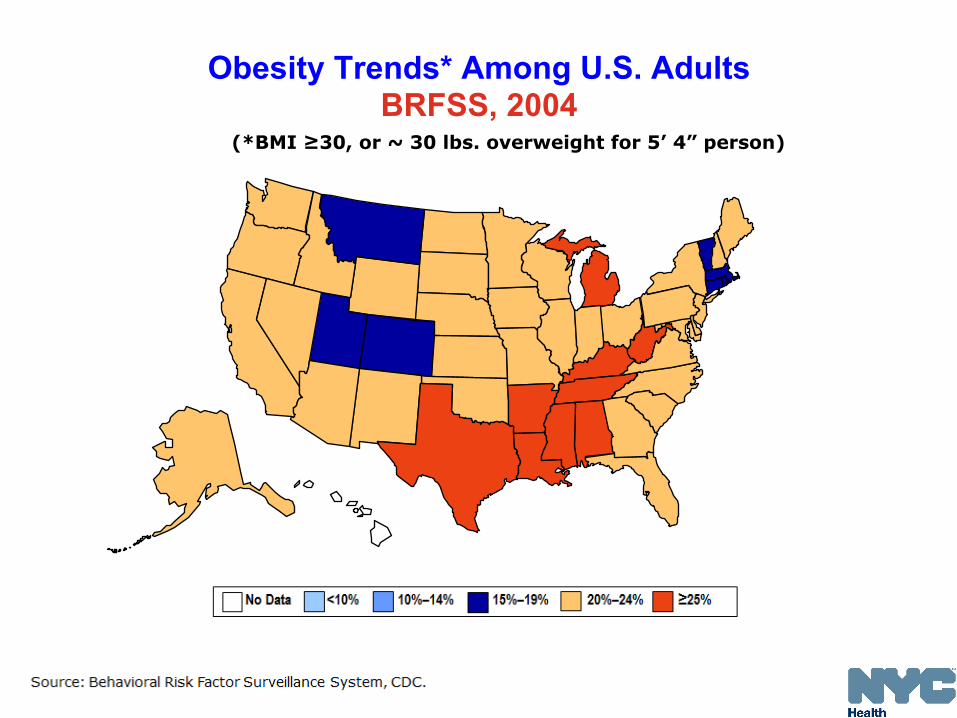
Obesity Trends* Among U.S. Adults BRFSS, 2004
(*BMI ≥30, or ~ 30 lbs. overweight for 5’ 4” person)

Obesity Trends* Among U.S. Adults BRFSS, 2005
(*BMI ≥30, or ~ 30 lbs. overweight for 5’ 4” person)

Obesity Trends* Among U.S. Adults BRFSS, 2006
(*BMI ≥30, or ~ 30 lbs. overweight for 5’ 4” person)

Obesity Trends* Among U.S. Adults BRFSS, 2007
(*BMI ≥30, or ~ 30 lbs. overweight for 5’ 4” person)

Obesity Trends* Among U.S. Adults BRFSS, 2008
(*BMI ≥30, or ~ 30 lbs. overweight for 5’ 4” person)
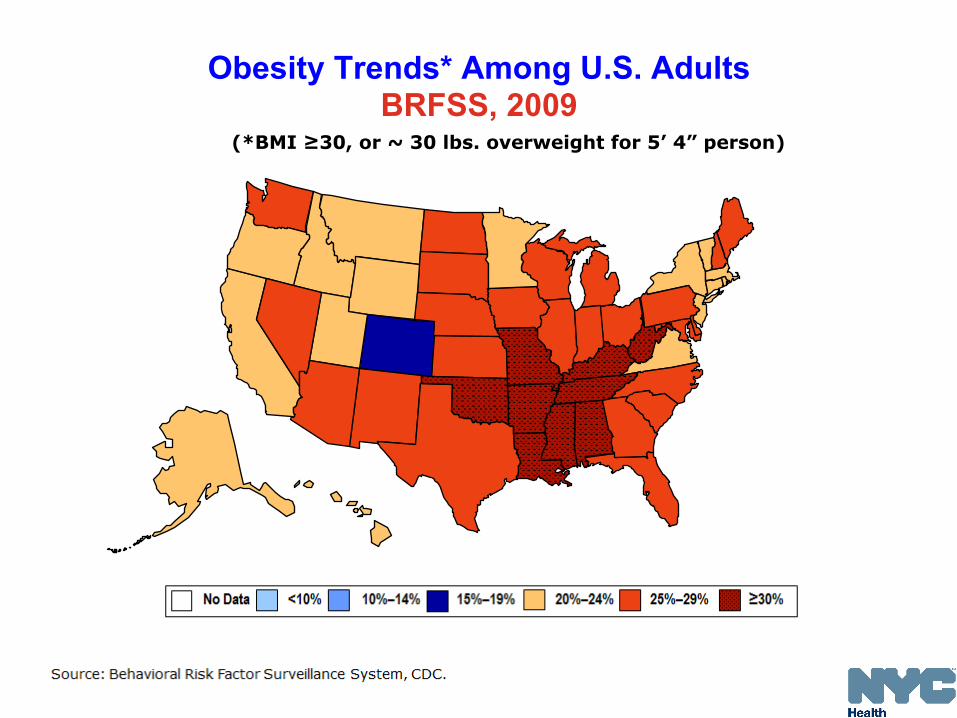
Obesity Trends* Among U.S. Adults BRFSS, 2009
(*BMI ≥30, or ~ 30 lbs. overweight for 5’ 4” person)

Obesity Trends* Among U.S. Adults BRFSS, 2010
(*BMI ≥30, or ~ 30 lbs. overweight for 5’ 4” person)


Determinants of ‘Overnutrition’ in South Africa

Structural Societal
Behavioural Biological
Burden of Disease study, PGWC
DOWNSTREAM UPSTREAM

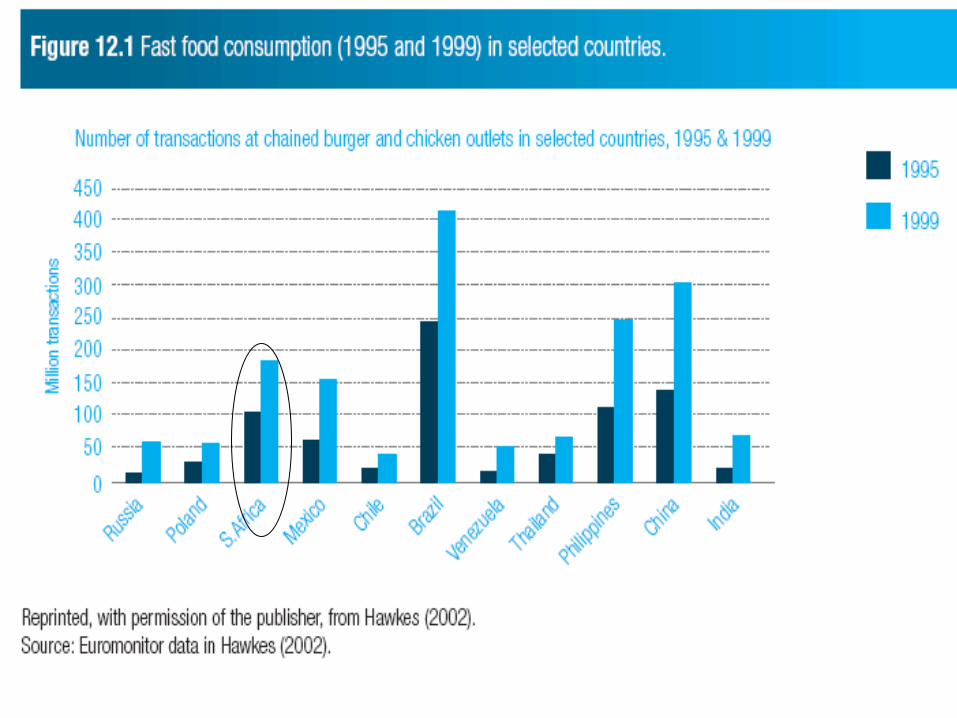
Consumption of sweet beverages and confectionery § Compared with a worldwide average of 89 in 2010
South Africans consumed 254 Coca-Cola products per person per year, an increase from around 130 in 1992 and 175 in 1997.
§ In 2010, up to half of young people were reported to consume fast foods, cakes and biscuits, cold drinks,
and sweets at least four days a week. § Carbonated drinks are now the third most commonly
consumed food/drink item among very young urban South African children (aged 12–24 months)—less than maize meal and brewed tea, but more than
milk . Hawkes C. (2002), Coca-Cola Company (2010) Theron et al (2007), Reddy et al. (2010)
54

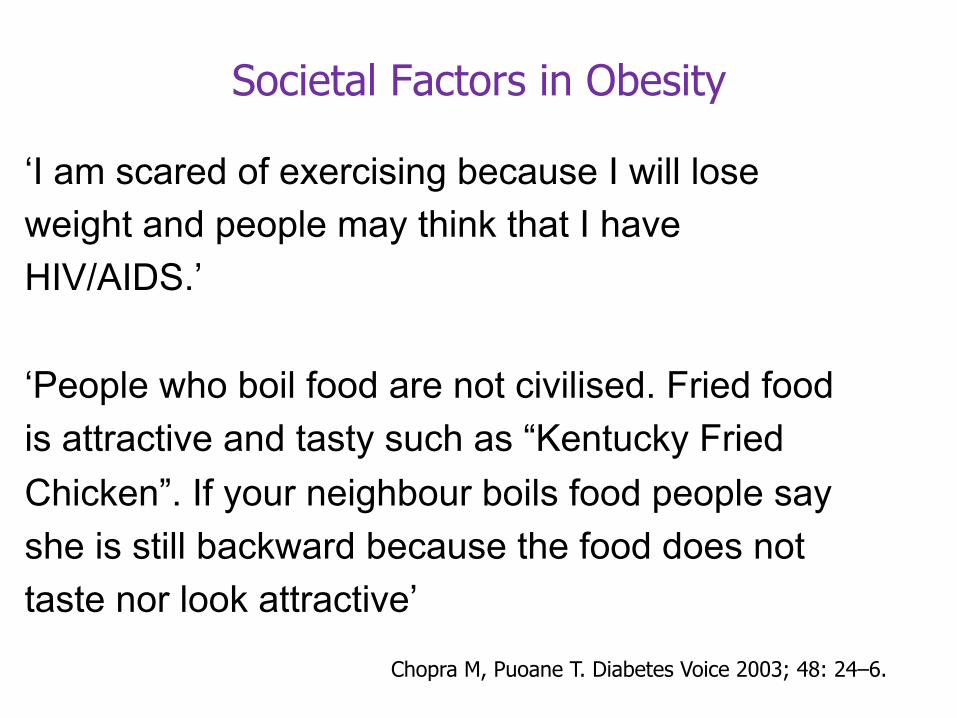
‘I am scared of exercising because I will lose weight and people may think that I have HIV/AIDS.’ ‘People who boil food are not civilised. Fried food is attractive and tasty such as “Kentucky Fried Chicken”. If your neighbour boils food people say she is still backward because the food does not taste nor look attractive’
Chopra M, Puoane T. Diabetes Voice 2003; 48: 24–6.
Societal Factors in Obesity


Structural Factors in Obesity

Market Sizes - Historic - Retail Value RSP - R mn - Current Prices
Category 2004 2005 2006 2007 2008 2009
Packaged food 69475 74462 78929 84062 92671 101192
Source: Packaged Food: Euromonitor from trade sources/national statistics Source: Packaged Food: Euromonitor from trade sources/national statistics

Packaged Food Sales in South Africa
The largest ten packaged food companies account for 51.8% of total packaged food sales. This is greater than the global average (globally in 2007, ten companies accounted for around 26% of the processed foods market).
Euromonitor InternaFonal, ETC Group (2008)


From a Nestlé press release: Vevey, February 21, 2008 “Popularly positioned products (PPPs). Products aimed at lower income consumers in the developing world, will continue to grow strongly in 2008 and beyond. Nestlé PPPs, which mostly consist of dairy products, Nescafé and Maggi culinary products, grew by over 25% to reach around CHF 6 billion in sales in 2007. The overall market for such products in Asia, Africa and Latin America is estimated at over CHF 80 billion.”

0
50000000
100000000
150000000
200000000
250000000
300000000
1992
1993
1994
1995
1996
1997
1998
1999
2000
2001
2002
2003
2004
2005
2006
Value of imports from world in Rand
Bread, Pastry, Cakes, Biscuits and Other Baker's Wares

Rapid growth of supermarkets in South Africa
• Supermarkets now share at least 50-‐60% of food sales in South Africa, with the majority of this growth occurring aOer 1994
• In a recent study, nearly two-‐thirds of households in a rural area in South Africa were now buying their food at supermarkets
Number of households in two rural areas in Transkei, Eastern Cape going to supermarkets
Xume Luzie Total
Percent of total
78.4% 50.0% 64.8%
Source: D'Haese, Marijke, and Guido Van Huylenbroeck. "The rise of supermarkets and changing expenditure paDerns of poor rural households case study in the Transkei area, South Africa." Food Policy 30 (2005): 97-‐113.
0%
10%
20%
30%
40%
Japan U.S. South Africa
Percent increase:
1999- 2005
Source: Euromonitor International, 2007
Growth in Supermarket Food Sales

Expansion of Supermarkets in Cape Town
Battersby, AFSUN

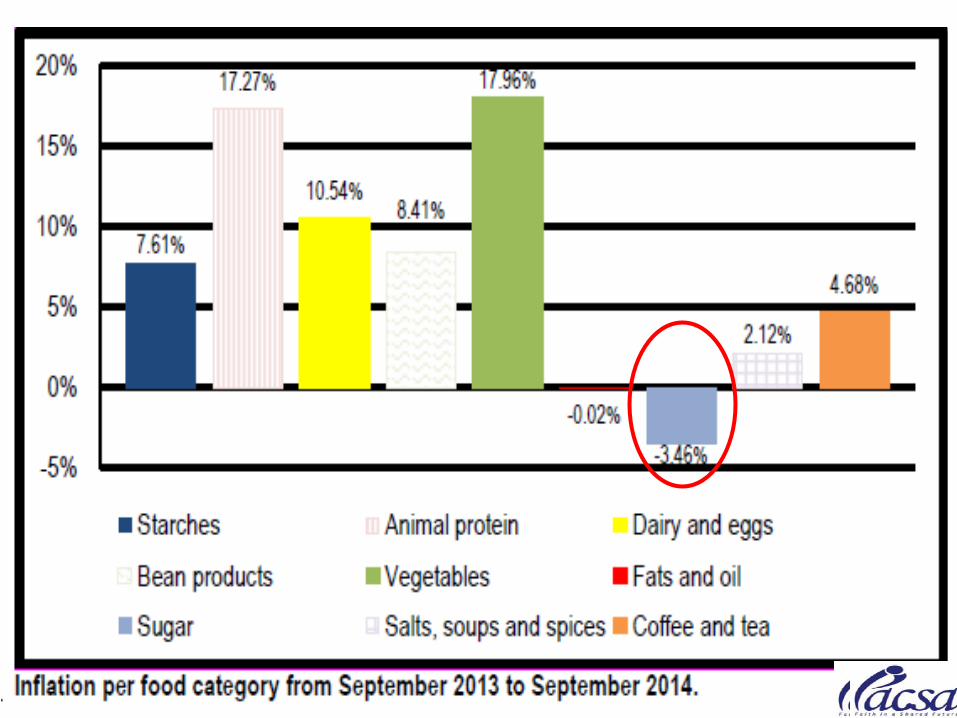
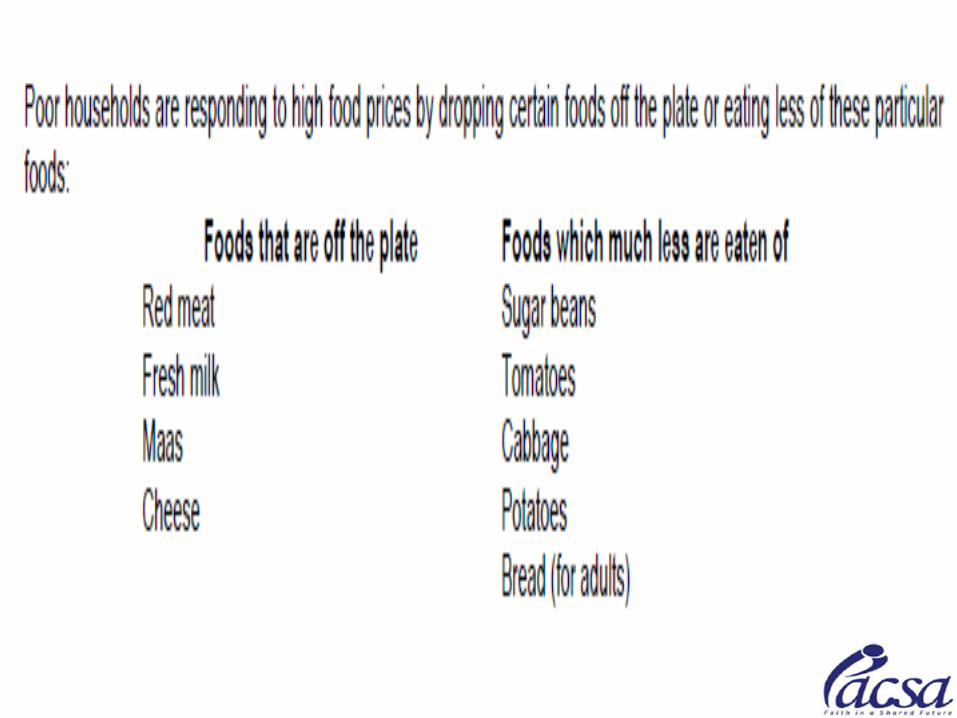
The consequences… • Rural consumers pay almost R6 more than urban
consumers for the same food basket. The poor households spent 33% of their income on food, compared to 11% for the non-poor
• Healthier foods typically cost between 10% and 60%
more when compared on a weight basis (R per 100g) and between 30% and 110% more when compared based on the cost of food energy (R per 100 kJ)
• Children from the most food insecure households are
most at risk of under-nutrition whilst adult women in the same households are often most at risk of obesity (NFCS 1999, 2005; SANHANES 2012)

Total imports of soft drinks and processed snack foods into South Africa and other SADC countries
Source: FAOSTAT detailed trade data

Structural Determinants of ‘Overnutrition’ Regionally and
Globally

Regional trade and investment policies in SADC since 1990
• early 1990s: ongoing liberalization associated with multilateral trade negotiations
• 1996: SADC trade agreement signed
• 1997-2003: South Africa strengthens investment policy and signs 22 Bilateral Investment Agreements
• 1999: South Africa signs bilateral agreement with European Union (EU)
• 2000: SADC trade protocol comes into effect; Government of South Africa strengthens support for regional export and investment
• 2002: new Southern Africa Customs Union Agreement completed
• 2007: Interim Economic Partnership Agreement concluded between EU and Botswana, Lesotho, Namibia, Swaziland and Mozambique
• 2008: SADC Free Trade Area completed (except for Angola, Democratic Republic of the Congo, Seychelles)

“Transnational corporations .have flourished as trade liberalization has
broadened and deepened. The revenues of Wal-Mart, BP, Exxon
Mobil, and Royal Dutch/Shell Group all rank above the GDP of countries such as Indonesia, Norway, Saudi
Arabia, and South Africa (EMCONET, 2007).
The combination of binding trade agreements .. and increasing
corporate power and capital mobility have arguably diminished individual countries’ capacities to ensure that
economic activity contributes to health equity, or at least does not
undermine it”.
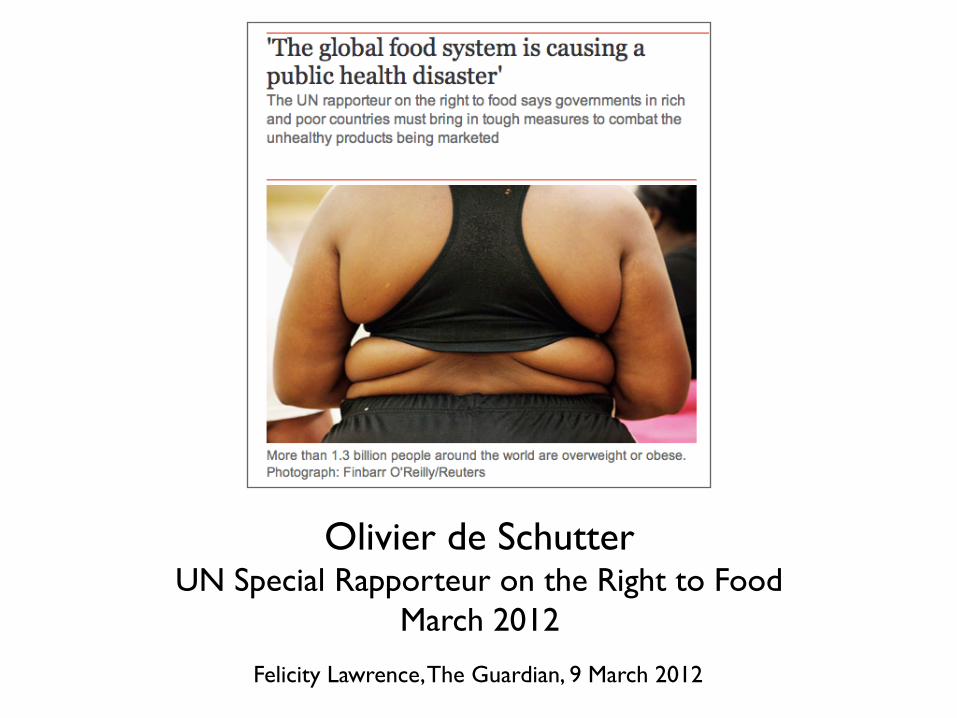
Olivier de SchutterUN Special Rapporteur on the Right to Food
March 2012
Felicity Lawrence, The Guardian, 9 March 2012
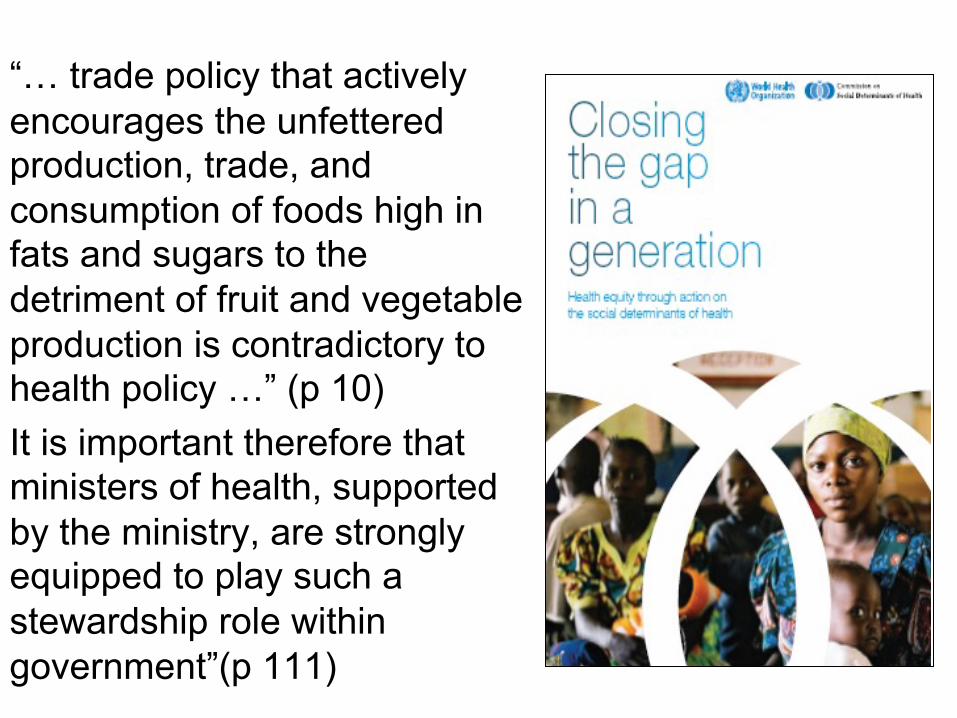
“… trade policy that actively encourages the unfettered production, trade, and consumption of foods high in fats and sugars to the detriment of fruit and vegetable production is contradictory to health policy …” (p 10) It is important therefore that ministers of health, supported by the ministry, are strongly equipped to play such a stewardship role within government”(p 111)
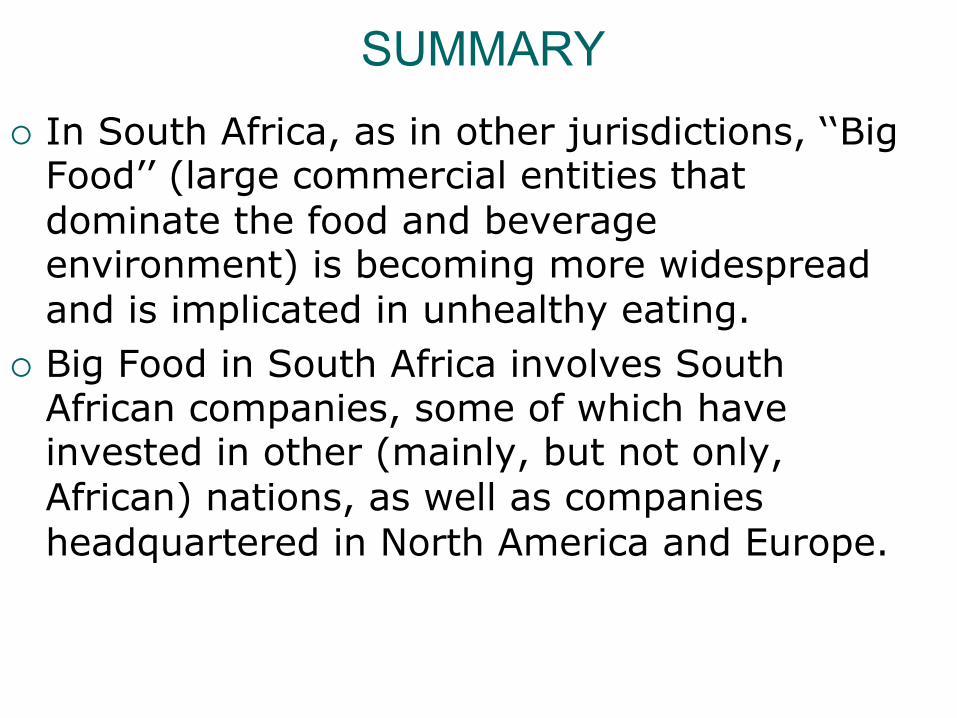
SUMMARY ¡ In South Africa, as in other jurisdictions, ‘‘Big
Food’’ (large commercial entities that dominate the food and beverage environment) is becoming more widespread and is implicated in unhealthy eating.
¡ Big Food in South Africa involves South African companies, some of which have invested in other (mainly, but not only, African) nations, as well as companies headquartered in North America and Europe.
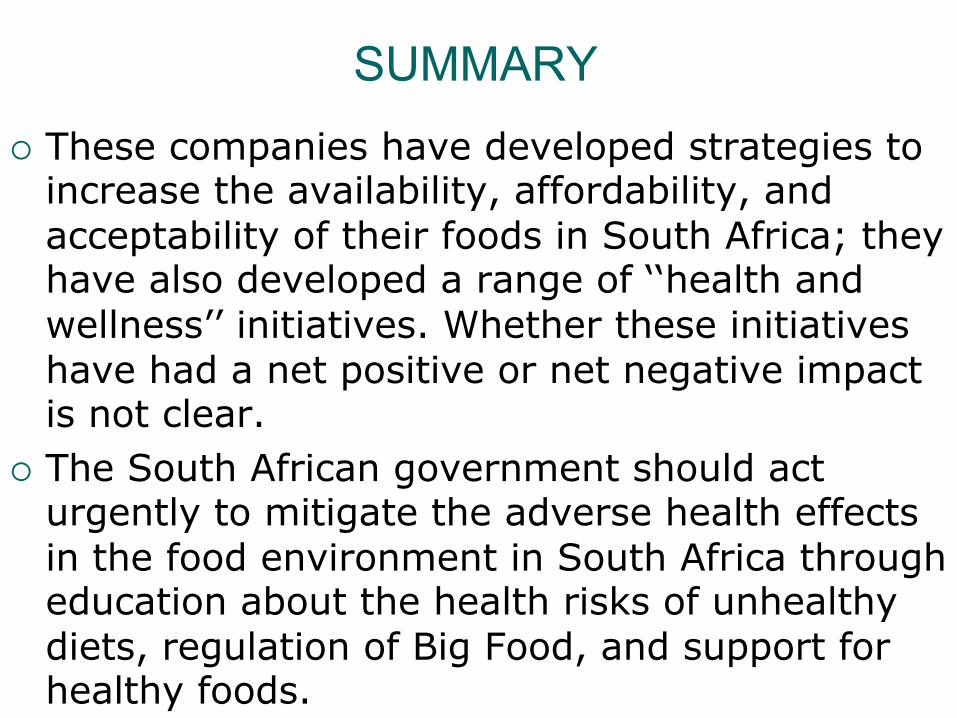
SUMMARY ¡ These companies have developed strategies to
increase the availability, affordability, and acceptability of their foods in South Africa; they have also developed a range of ‘‘health and wellness’’ initiatives. Whether these initiatives have had a net positive or net negative impact is not clear.
¡ The South African government should act urgently to mitigate the adverse health effects in the food environment in South Africa through education about the health risks of unhealthy diets, regulation of Big Food, and support for healthy foods.

Priority Actions Needed
Policy advocacy and social action to address environmental and social determinants

“The health sector is a defender of health, advocate
of health equity, and negotiator for broader societal objectives. It is important therefore that
ministers of health, supported by the ministry, are strongly equipped to
play such a stewardship role within government”(p 111)

Policy Actions to Combat Stunting and ’Overnutrition’
• Raise awareness of deteriorating food environment amongst health workers and general population • Review local government policies and regulations around vending eg in and around schools and advertising, especially to kids. • Review School Nutrition Programme and invest in community infrastructure for sport, recreation and improved personal safety • Analyse pricing incentives/disincentives to tax unhealthy and subsidise healthy foods • Review trade policy, especially wrt food trade • Challenge inequitable macroeconomic regime through
evidence-based advocacy and social mobilisation

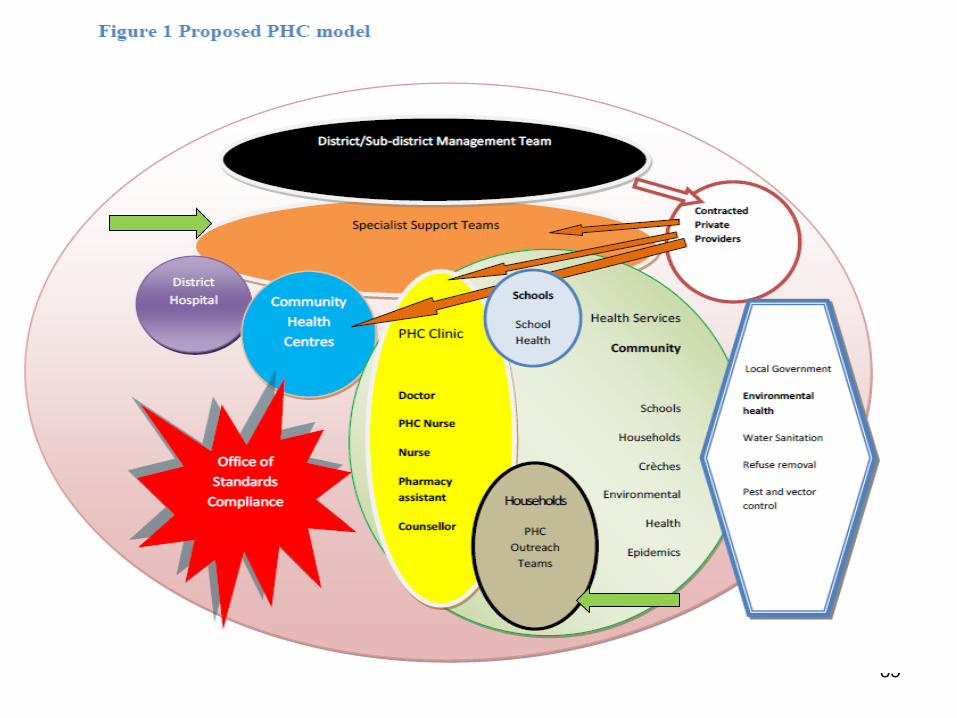
‘Re-‐engineering PHC’

Three streams for Re-engineering PHC
(a) a ward based PHC outreach team for each electoral ward;
(b) strengthening school health services; and
(c) district based clinical specialist teams with an initial focus on improving maternal and child health.
84
85

86 1 CHW: 1200 people

CHW roles in South Africa currently
• Focusses on assessment and referral • No curaFve funcFons • Advising families where CHWs could be delivering the intervenFons themselves:
“Inform the mothers of deworming at least twice a year and to ensure the child gets vitamin A and other necessary micronutrient supplements.” Very recently permission has been granted for CHWs to dispense Vit A and anFhelminthics.

“Liberator or lackey” (David Werner, 1981)
n The early literature emphasises the role of the CHWs as not only (and possibly not even primarily) a health care provider, but also as an advocate for the community and an agent of social change: n functioning as a community mouthpiece to fight against
inequities and advocate community rights and needs to government structures.
n This view is also reflected in the Alma Ata Declaration which identified CHWs as one of the cornerstones of comprehensive primary health care.

Factors influencing success of CHW programmes Poli%cal and Community factors
Large trials in Nepal have demonstrated a 30% reducMon in newborn mortality simply by facilitaFon of women’s groups involving pregnant women.
‘Women’s groups in Malawi and Nepal are increasing the important capaciFes within communiFes, such as the ability to idenMfy maternal and neonatal health problems and their root causes; the ability to mobilise resources necessary for improving the health of mothers and newborn infants; the internal and external social
networks they can draw on when needed; and the development of strong local leaders who have the moFvaFon and drive to improve maternal and neonatal health in the community.’
Rosato et al, Lancet 2008; 372: 962–71

How will REPHC address Social determinants?
• Presently the responsibility is allocated to WBOTs (CHWs) and Local Government
• Have CHWs the training and authority to address SDH?
• Does Local govt have outreach and capacity to address SDH?
• Are communiFes able to influence acFon on SDH? Does REPHC focus enough on ‘community parFcipaFon’ and structures eg health commicees?
The status of community representation health committees
• Eight of the nine provinces have legislation, draft legislation or guidelines. One province is in the process of creating a legislative framework by amending its Health Facility Boards Act.
• In 2008 only 57% of facilities had clinic committees
• Concerted efforts are required to activate/strengthen health committees

Key actions to equip WBOTs to address SDH
• Expand training of CHWs and their supervisors in SDH.
• Focus on strengthening clinic/health committees • Raise awareness of communities (through their
structures) of negative impact of SDH • Define local actions that can be taken to address
SDH and enrol assistance of relevant sectors eg environmental health, agriculture, social development, education
• CHWs to work with communities (and school communities) in taking action, including social mobilisation

Social mobilisation is essential for the realisation of human rights

PEOPLE´S HEALTH MOVEMENT
The Peoples Health Movement (PHM) is a large global civil society network of health activists supportive of the WHO policy of Health for All and organised to combat the economic and political causes of deepening inequalities in health worldwide and revitalise the implementation of WHO’s strategy of Primary Health Care.
www.phmovement.org

PHM: The Global Health Watch Research , Analysis and Watching
GHW is a platform of resistance to the neo-liberal dominance of health.
www.ghwatch.org

“Should medicine fulfill its great ends, it must enter into the larger political and social life of our time; it must indicate the barriers which obstruct the normal completion of the life-cycle and remove them.” - Rudolf Virchow
Local interventions: an example from New York City

Fight for Calorie Labeling in NYC
• 2006 – NYC BOH adopts calorie labeling rule, making NYC the first locality to require chain FSEs to post calorie information on menus
• 2007 – First lawsuit against BOH in attempt to stop calorie labeling
• 2008 – NYC BOH adopts revised calorie labeling rule, implementation begins
• 2009 – Calorie labeling rule is upheld by US Court of Appeals, Second Circuit, creating a legal framework for others to follow

Menu Labeling becomes National Trend

Calorie Labeling Becomes a National Model
• 2009 – Seattle requires calorie labeling on restaurant menus
• 2010 – Menu labeling requirements included in the Affordable Care Act
• 2014 – Federal regulations issued requiring all chain restaurants/retailers to post calorie information
• 2015 – Federal regulation effective December 1

Calorie Labels Increase Awareness
• Labels increase awareness – Exposure to calorie
labels is critical to educating consumers about calorie content
• Studies have shown customers using labels purchase fewer calories – Patrons who used calorie
information purchased > 100 fewer calories

Calorie Awareness Campaign

Majority of New Yorkers Find Calorie Labeling Useful
Useful, 79%
Not Useful, 19%
Don't Know/ No Answer,
2%
2011: Do you think the New York City law requiring fast-food restaurants to post calorie information is useful or not useful?

Improving the hospital management of severe child malnutrition

AN EXAMPLE OF EFFECTIVENESS RESEARCH: MT. FRERE HEALTH DISTRICT
n Eastern Cape Province, South Africa
n Former apartheid-era homeland
n Estimated Population: 280,000
n Infant Mortality Rate: 99/1000
n Under 5 Mortality Rate: 108/1000

CASE FATALITY IN RURAL HOSPITALS
PRE-INTERVENTION CFRs
Mary Teresa 46% Sipetu 25% Holy Cross 45% St Margaret’s 24% St. Elizabeth’s 36% Taylor Bequest 21% Mt. Ayliff 34% Greenville 15% St. Patrick’s 30% Rietvlei 10% Bambisana 28%
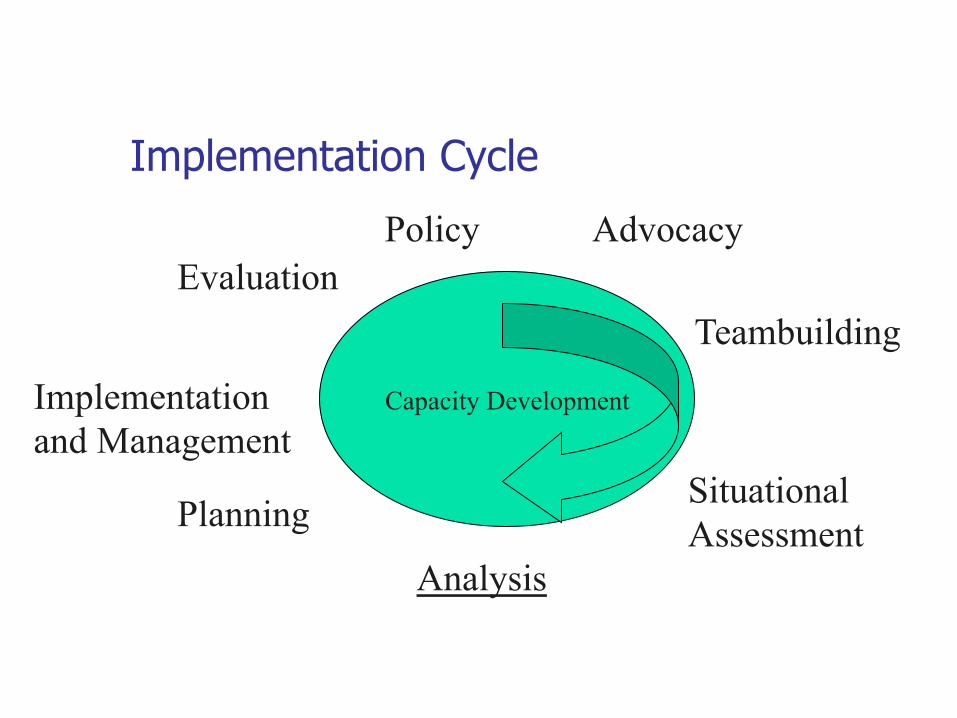
Implementation Cycle
Capacity Development
Advocacy
Teambuilding
Analysis
Situational Assessment Planning
Implementation and Management
Evaluation Policy

WHO 10-STEPS PROTOCOL – Nutrition component of hospital level IMCI
Step 1 Treat/prevent hypoglycaemia
Step 2: Treat/prevent hypothermia
Step 3: Treat/prevent dehydration
Step 4: Correct electrolyte imbalance
Step 5. Treat/prevent infection
Step 6. Correct micronutrient deficiencies
Step 7. Cautious feeding
Step 8. Catch-up growth
Step 9. Stimulation, play and loving care
Step 10. Preparations for discharge

Comparison of recommended and actual practices
SITUATIONAL ANALYSIS
IMPLEMENTATION
Recommended practice
Practice prior to intervention
Perceived barriers to quality care
Programme intervention
Changes reported at follow up visits
Step 1: Treat/prevent hypoglycaemia Feed every 2 hours during the day and night. Start straight away.
Children were left waiting in the queue in the outpatient department and during admission procedures. In the wards, they were not fed for at least 11 hours at night Hypoglycaemia not diagnosed
Lack of knowledge about risks of hypoglycaemia Lack of knowledge about how to prevent it Shortage of staff especially during the night No supplies for testing for hypoglycaemia
Training to explain why malnourished children are at increased risk Training on how to prevent and treat hypoglycaemia Motivated for more night staff in paediatric wards Motivated the Department of Health to provide resources (10% glucose and Dextrostix.)
Malnourished children fed straightaway and 3 hourly during day and night. The number of night staff was increased Dextrostix and 10% glucose obtained

Evaluation of Implementation n Major improvements:
n Separate HEATED wards n 3 hourly feedings with appropriate special formulas and
modified hospital meals n Increased administration of vitamins, micronutrients and
broad spectrum antibiotics n Improved management of diarrhea & dehydration with
decreased use of IV hydration n Health education & empowerment of mothers
n Problems still existed: n Intermittent supply problems for vitamins and micro-
nutrients n Power cuts – no heat n Poor discharge follow-up n Staff shortage, of both doctors and nurses, and resultant low
morale and QOC Ashworth et al, Lancet 2004; 363:1110-1115
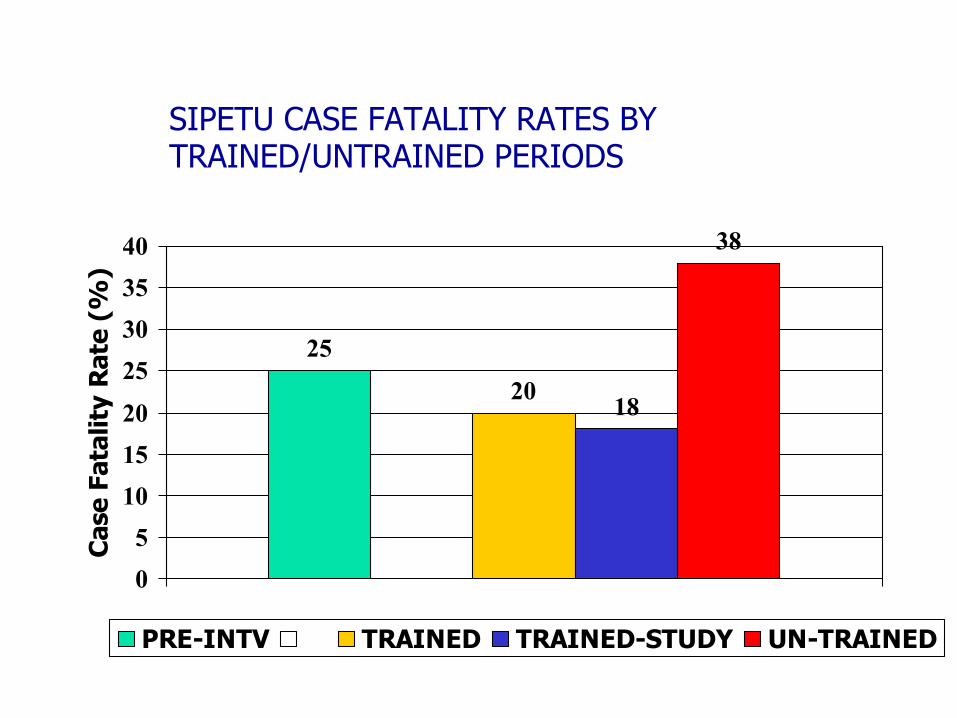
SIPETU CASE FATALITY RATES BY TRAINED/UNTRAINED PERIODS
25
20 18
38
05101520
25303540
Cas
e Fa
talit
y R
ate
(%)
PRE-INTV TRAINED TRAINED-STUDY UN-TRAINED

DIFFERENCES IN TREATMENT
Treatment Trained Un-Trained P-Value KCl 78% 13% p=0.0000 Broad Spectrum Antbx 47% 15% p=0.0001 IV Hydration 5% 6% p=0.774 Vitamin A 92% 76% p=0.0115 *No change in diagnoses, severity, co-morbidity or nursing care related
to 10-steps across the two time periods.

Quote from a COSMO “There wasn’t enough emphasis on patient management in
a lower level institution, our training was mostly theoretical. Most patients are filtered out at lower level, therefore students don’t see them.
It’s not so much WHAT as WHERE the training takes place… The environment here is very different from both RXH and
Pretoria Academic. Some of the antibiotics we were taught to use aren’t available so we have to look for alternatives.
The sister is teaching me a lot -- I’m learning more than I ever learnt in my whole training!”
Community service doctor working at Sipetu Hospital, Tabankulu, Eastern Cape
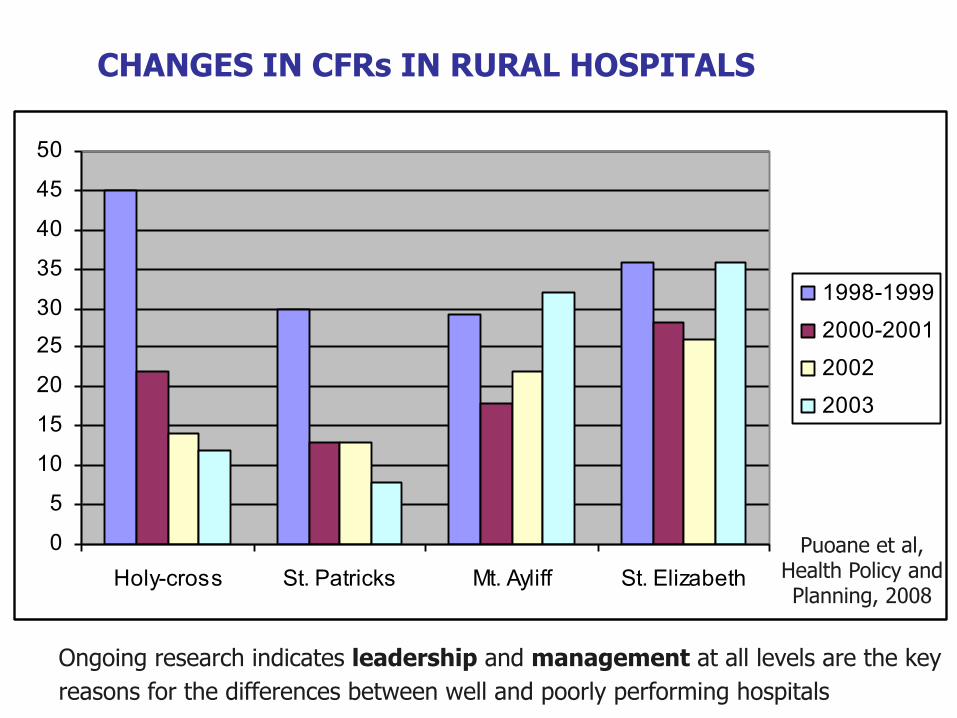
CHANGES IN CFRs IN RURAL HOSPITALS
0
5
10
15
20
25
30
35
40
45
50
Holy-cross St. Patricks Mt. Ayliff St. Elizabeth
1998-1999
2000-2001
2002
2003
Ongoing research indicates leadership and management at all levels are the key reasons for the differences between well and poorly performing hospitals
Puoane et al, Health Policy and Planning, 2008
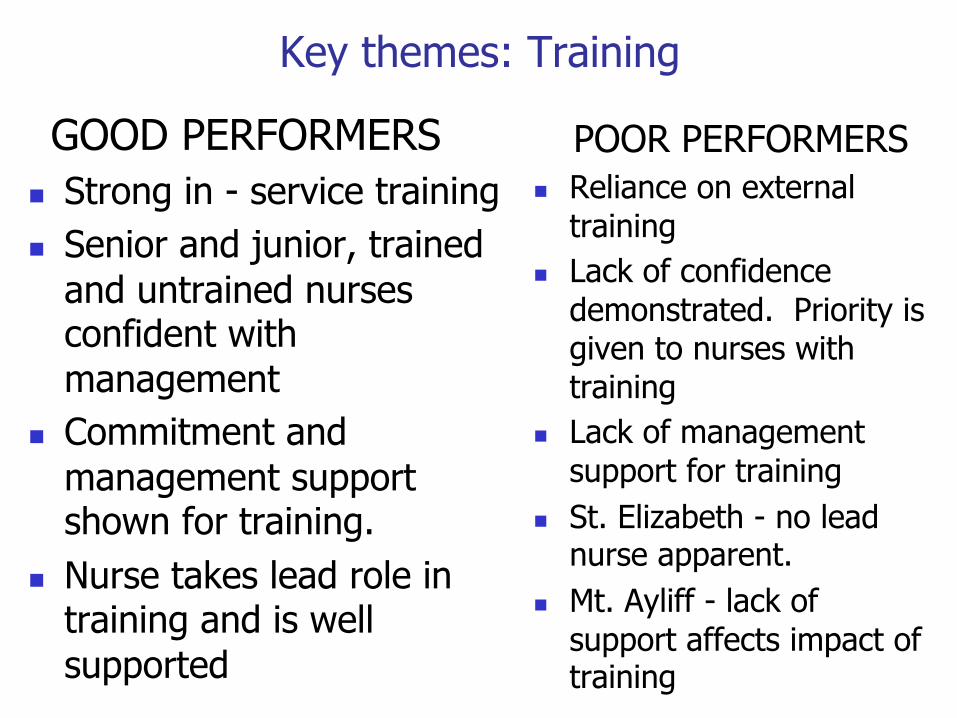
Key themes: Training
GOOD PERFORMERS n Strong in - service training n Senior and junior, trained
and untrained nurses confident with management
n Commitment and management support shown for training.
n Nurse takes lead role in training and is well supported
POOR PERFORMERS n Reliance on external
training n Lack of confidence
demonstrated. Priority is given to nurses with training
n Lack of management support for training
n St. Elizabeth - no lead nurse apparent.
n Mt. Ayliff - lack of support affects impact of training

EVALUATION OF STEP 10
n To determine Household Food Security(HHFS), caregiver knowledge & factors associated with malnutrition
n To look at the rate of recovery & health status at 1 month
& 6 months post discharge

STUDY POPULATION
POST DISCHARGE HOME VISITS(HV) n At 1 month (n) = 30 n At 6 month (n) = 24

Average No. of people 8
Average No. of children < 6 2.5
Female Headed HH 40 %
Residing in mud houses 82 %
Subsistence Crop Production 83 %
Livestock keeping 90 %
Average family income R550 ($90)
DEMOGRAPHIC & SOCIO-ECONOMIC FACTORS

n 76% remembered key messages about food fortification
n 71% of caregivers unable to implement acquired knowledge of feeding practices
CAREGIVER KNOWLEDGE OF NUTRITION
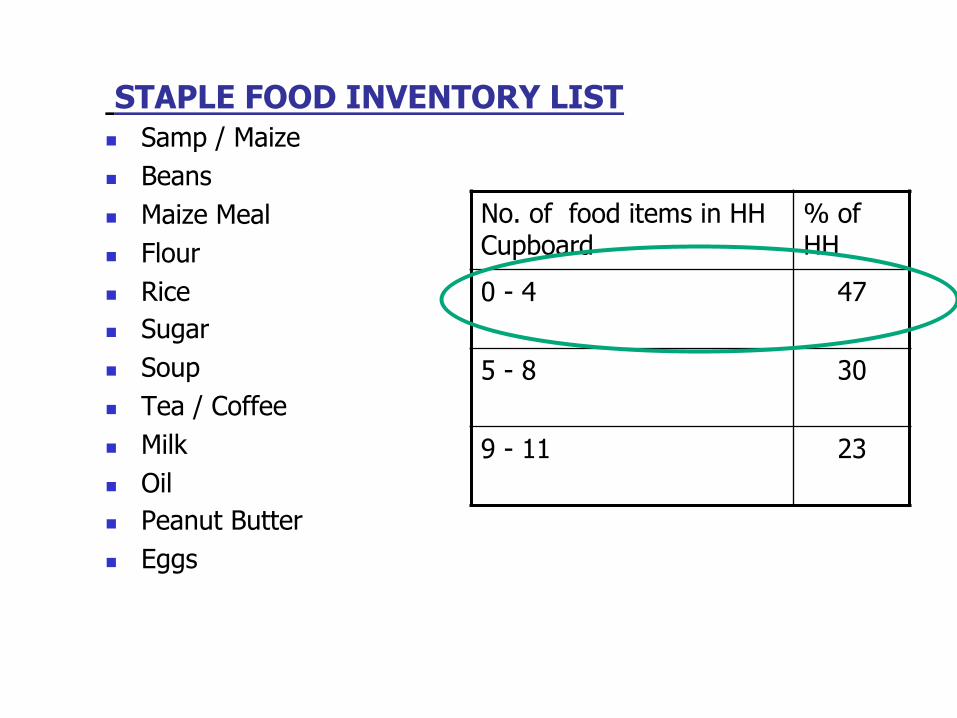
STAPLE FOOD INVENTORY LIST n Samp / Maize n Beans n Maize Meal n Flour n Rice n Sugar n Soup n Tea / Coffee n Milk n Oil n Peanut Butter n Eggs
No. of food items in HH Cupboard
% of HH
0 - 4 47
5 - 8 30
9 - 11 23

HOUSEHOLD SOURCE OF INCOME
n PENSION GRANT 40 % n MIGRANT LABOURERS 25 % n NO INCOME FAMILIES 20 % n DOMESTIC WORKERS 15 % n CHILD SUPPORT GRANT (CSG) 0 % n ANTI POVERTY PROGRAMME 0 % CSG – Children aged 0-9 years in families earning less than R800 per month eligible CSG - currently R160 ($26)

Implementation Cycle
Capacity Development
Advocacy
Teambuilding
Analysis
Situational Assessment Planning
Implementation and Management
Evaluation Policy

Advocacy Component
n Presentation of data to Government Commission on Social Welfare
n Partnership with ACESS resulted in TV documentary – ‘Special Assignment’ – elicited unexpected response from both public and government
n Minister of Social Development visited Mt Frere and ordered mobile team in to process CSGs
n Questions in Parliament re child welfare n Massive Child Support Grant Campaign in E. Cape, October
2002

EMPTY STOMACHS: Year-old Samkelo is one of nine children that his jobless grandmother,
Nofuduka Mbulawe, has to feed
Picture: Richard Shorey
Sunday, September 22 2002
Starving to death on arable land
Poverty is killing children in the Eastern Cape. But breaking out of
its grip is no easy task, write Thabo Mkhize and Heather
Robertson
A nutrition study by the University of Western Cape showed that Samkelo is one of the more fortunate -
166 babies at 11 hospitals in the northeastern district have died of malnutrition
ONE-year-old Samkelo Mbulawe has only a
tattered blanket to cover his distended stomach and flaking skin. He has just returned home after two months in the Mount Ayliff Hospital where he was
treated for kwashiorkor, a form of malnutrition.

% Change in CSG Beneficiaries Per Province from Dec 2001 to Oct 2002
31.4
61.1
38.5
21.8
36.3 3631
44.8
56.3
40.2
0
10
20
30
40
50
60
70
EC L KZN NW MP FS NC GT WC S.A
Province
Perc
ent C
hang
e
Source of data: SOCPEN daily records: 19/12/2001 and 3/10/02 in T. Guthrie, UCT & ACESS, Feb. 2003


![MASTER THESIS [ABSTRACT] DETERMINANTS OF ROLE …essay.utwente.nl/78042/2/AbstractVanLoo_MScPA_BMS.pdf · MASTER THESIS [ABSTRACT] DETERMINANTS OF ROLE CONFLICT AND ROLE AMBIGUITY](https://static.fdocuments.in/doc/165x107/5f4007cef70f9a59852728d7/master-thesis-abstract-determinants-of-role-essay-master-thesis-abstract-determinants.jpg)