Determinants of the role of gender on adoption of row ...
25
Ethiop. J. Sci & Technol 12(1): 19-43, 2019 19 Determinants of the role of gender on adoption of row planting of tef [Eragrostis tef (Zucc.) Trotter] in central Ethiopia Almaz Giziew 1,* and Begashaw Mebrate 2 l Bahir Dar University, College of Agriculture and Environmental Sciences, Department of Rural Development and Agricultural Extension, Ethiopia. Email: [email protected]; Cell phone number: +251913356360 2 Adventist Development and Relief Agency (ADRA), Agriculture Development Officer, Awra Woreda, Afar Region, Ethiopia. Email: [email protected], Cell phone number: 09233660397 ABSTRACT Teff is a major indigenous cereal crop in Ethiopia, produced for household consumption and income generation. The determinant factors of adoption of teff row planting by female farmers vis-à-vis their male counterparts are not understood. Therefore, a survey was conducted to identify factors that determine adoption of teff row planting technology in a gender perspective in Moretna Jiru district, North Shoa, Ethiopia. A random sample of 131 male and 31 female headed households were randomly taken from four kebeles (lowest administrative unit) of the district. Primary data was collected from sample respondents and secondary data from various other sources. Descriptive statistics and Tobit regression were used in data analysis. Tobit regression was used to identify determinant factors of adoption. The findings of the marginal effect revealed that 81% of the female headed households (FHH) had favorable attitude towards the technology, a year increase in schooling increased the intensity of use of the technology by 39% and one ha increase in land holding size increased it by 30%. With regard to male headed households (MHH), positive attitude towards the technology increased the intensity of use of the technology by 39%, getting extension service by 38% and increase in education by 24%. In conclusion, extension agents should work hard with female headed farmers and ensure the implementation of teff row planting technology by strengthening FTCs via improved resources. Keywords: Adoption, Gender, Intensity of Adoption, Marginal effect, Tobit DOI: https://dx.doi.org/10.4314/ejst.v12i1.2 * Corresponding author: [email protected]
Transcript of Determinants of the role of gender on adoption of row ...

Ethiop. J. Sci & Technol 12(1): 19-43, 2019 19
Determinants of the role of gender on adoption of
row planting of tef [Eragrostis tef (Zucc.) Trotter] in
central Ethiopia
Almaz Giziew1,* and Begashaw Mebrate2
lBahir Dar University, College of Agriculture and Environmental Sciences,
Department of Rural Development and Agricultural Extension, Ethiopia.
Email: [email protected]; Cell phone number: +251913356360 2Adventist Development and Relief Agency (ADRA), Agriculture
Development Officer, Awra Woreda, Afar Region, Ethiopia. Email:
[email protected], Cell phone number: 09233660397
ABSTRACT
Teff is a major indigenous cereal crop in Ethiopia, produced for household
consumption and income generation. The determinant factors of adoption of
teff row planting by female farmers vis-à-vis their male counterparts are not
understood. Therefore, a survey was conducted to identify factors that
determine adoption of teff row planting technology in a gender perspective
in Moretna Jiru district, North Shoa, Ethiopia. A random sample of 131 male
and 31 female headed households were randomly taken from four kebeles
(lowest administrative unit) of the district. Primary data was collected from
sample respondents and secondary data from various other sources.
Descriptive statistics and Tobit regression were used in data analysis. Tobit
regression was used to identify determinant factors of adoption. The findings
of the marginal effect revealed that 81% of the female headed households
(FHH) had favorable attitude towards the technology, a year increase in
schooling increased the intensity of use of the technology by 39% and one ha
increase in land holding size increased it by 30%. With regard to male headed
households (MHH), positive attitude towards the technology increased the
intensity of use of the technology by 39%, getting extension service by 38%
and increase in education by 24%. In conclusion, extension agents should
work hard with female headed farmers and ensure the implementation of teff
row planting technology by strengthening FTCs via improved resources.
Keywords: Adoption, Gender, Intensity of Adoption, Marginal effect, Tobit
DOI: https://dx.doi.org/10.4314/ejst.v12i1.2
* Corresponding author: [email protected]

Almaz Giziew and Begashaw Mebrate 20
INTRODUCTION
Teff (Eragrostis teff) is cereal grain native to Ethiopia. It is one of the
most common and favorite food of majority Ethiopians. Adopting teff
technologies could significantly enhance poverty reduction and
economic growth. Women in Ethiopia account for fifty percent of the
country’s population. The Ethiopian government took women
farmers as strategy to reduce poverty and hunger. Hence, women’s
empowerment is crucial for poverty reduction and for accomplishing
Millennium Development Goals. Unequal participation of women in
adoption of agricultural technologies hampers economic growth of a
country. On the other hand, equal participation of men and women in
adoption of crop production contributes greatly for solving Ethiopia’s
economic growth problem (MoFED, 2010; ATA, 2016).
Teff planting methods such as broadcasting, row planting and
transplanting are some of the factors that affect teff production. Most
farmers practice traditional method of planting by broadcasting of teff
seeds at a seed rate of 25 to 30 kg ha-1 (Berhe and Zena, 2008).
Broadcasting wastes seeds unnecessarily (increases cost of
production), creates excess seedling density and intensifies inter-plant
competition (for nutrients, water, sunlight and carbon dioxide).
Because of high plant density, plant lodging is likely to happen in a
broadcast teff, eventually reducing the yield (Berhe, 2009).
Compared to broadcasting method, row planting gives better yield.
To minimize lodging, low seed rate, row planting, late sowing and
application of plant growth regulators were used (Abebe and
Workayehu, 2015). Row planting of teff, rather than broadcasting
method, improves production and productivity (ATA, 2013a). The
Ethiopian government promoted these new technologies on a large
scale. Since 2013, teff row planning method was adopted by almost
2.5 million teff growers through the national extension system and
farm radio partnerships (ATA, 2013a; Vandercasteelen et al., 2016).
As a result, average grain yield increased from 12.6 to about 21
quintals/ha or by 70% (ATA, 2013b). Broadcasting method gave an
average grain yield of 17.1 q/ha. Yield of row planting method
reached about 24 q/ha and the net revenue was 20% larger than the
traditional broadcasting method (Behailu, 2014).

Ethiop. J. Sci & Technol 12(1): 19-43, 2019 21
Row planting method has now become the latest farming technology
aggressively promoted for adoption by smallholder farmers in
Ethiopia (Geremew et al., 2016). According to Moretna Jiru District
Office of Agriculture (2014) report, MoA and ATA introduced teff
row planting technology in 2012 to the district and it was first applied
on selected Farmer Training Center (FTCs) (row planting and
transplanting of seedlings). After that, the district agriculture office
continued to scale up the adoption of the technology to the entire
kebeles. Despite such interventions, adoption of row planting
technology in Ethiopia and specifically in the study district is still
low. However, continued investments by the Government have
helped farmers increase their crop production and productivity by
adopting yield-enhancing inputs so that farmers can benefit from
economies of scale (ATA, 2016).
In Moretna Jiru district, teff is also grown by female-headed
households. Therefore, it was found advisable to study the
determinant factors of adoption of female farmers vis-à-vis their male
counterparts in the area where gender dis-aggregated information is
missing. Farmers in the study area have started adopting teff row
planting technology. However, adoption of this technology alone is
not enough to achieve the desired level of yield unless farmers
properly apply the different components of the technology, i.e., the
package, based on recommendations. Row planting technology and
its impact on household income has been investigated before (Fufa et
al., 2011; Vandercasteelen et al., 2013; Behailu, 2014; Yonas, 2014;
Debelo, 2015; Geremew et al., 2016; Begashaw, 2018). However,
these studies did not show factors influencing adoption and its
intensity in a gender perspective. No empirical information exists
about the determinants of adoption and its use intensity in a gender
dimension. The objective of the survey was, therefore, to identify
gender related factors that determine adoption of teff row planting
technology in Moretna Jiru district of Ethiopia.

Almaz Giziew and Begashaw Mebrate 22
MATERIALS AND METHODS
A survey was conducted in Moretna Jiru district, North Shoa Zone,
Amhara National Regional Sate, Ethiopia, in 2016/17 cropping year.
Moretna Jiru district encamps 20 kebeles (18 rural and 2 small town)
with a total population of 105,980 people and an area of 661.2 km2
(District Agriculture Office, 2016).
The district is known cereals producing area, especially wheat and
teff. In 2016 alone, a little over 6 thousand ha of land was allotted for
teff, a third of which was row-planted and the rest broadcast (District
Agriculture Office, 2016).
Figure 1. Location map of the study area (Moretena Jiru district)
Sampling procedure
A multi-stage sampling technique was employed. Moretna Jiru
woreda was purposively selected as potential area for teff production.
Teff row planting technology has been introduced there before and
practiced for years now. The district is the best known for cereal
production in the North Shoa Zone.
Ethiop. J. Sci & Technol 12(1): 19-43, 2019 23
In the second stage, kebeles were stratified as highland and lowland
agro-ecological zones. In the third stage, out of a total of 18 kebeles,
4 kebeles were randomly selected, i.e., two from the highland and
two from the lowland.
At the fourth stage, teff grower household heads of each selected rural
kebele were identified in collaboration with kebele leaders, key
informants and development agents of the respective kebeles. At the
fifth stage, teff growers in the selected kebeles were stratified as male-
headed and female- headed households. Finally, the number of
respondents for male-headed households (MHH) was determined by
using probability proportional to size sampling procedure. With
reference to the sample selection of female-headed households
(FHH), the same procedure was followed as male-headed households
(MHH). Finally, respondents from each selected kebele were
identified using probability proportional to population size random
sampling technique to get a total sample size of 164 households (131
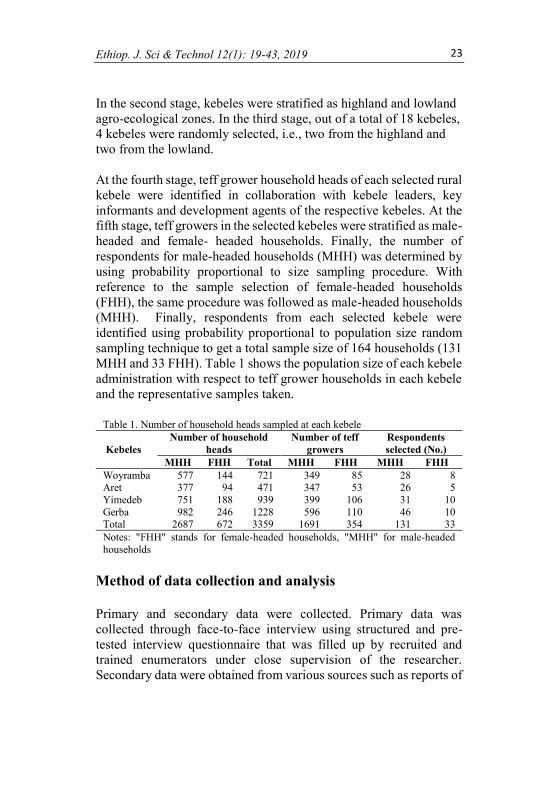
MHH and 33 FHH). Table 1 shows the population size of each kebele
administration with respect to teff grower households in each kebele
and the representative samples taken.
Table 1. Number of household heads sampled at each kebele
Kebeles
Number of household
heads
Number of teff
growers
Respondents
selected (No.)
MHH FHH Total MHH FHH MHH FHH
Woyramba 577 144 721 349 85 28 8 Aret 377 94 471 347 53 26 5
Yimedeb 751 188 939 399 106 31 10
Gerba 982 246 1228 596 110 46 10 Total 2687 672 3359 1691 354 131 33
Notes: "FHH" stands for female-headed households, "MHH" for male-headed
households
Method of data collection and analysis
Primary and secondary data were collected. Primary data was
collected through face-to-face interview using structured and pre-
tested interview questionnaire that was filled up by recruited and
trained enumerators under close supervision of the researcher.
Secondary data were obtained from various sources such as reports of
Almaz Giziew and Begashaw Mebrate 24
district office of agriculture, CSA reports, district administrative
office, previous research findings, the internet and other published
and unpublished materials which are found to be relevant to the study.
The data were analyzed using SPSS version 21 and STATA 11
software. Quantitative data analysis was employed by using simple
descriptive statistics such as percentage, mean, frequency and
standard deviations. By classifying the respondents into different
adoption groups, F-test, t-test, and Chi-square tests were employed to
determine differences or relationships. In addition, Tobit statistical
model was used to determine the relative influence of various
explanatory variables on the dependent variable.
Analytical techniques
Adoption is a decision to make full use of an innovation (Rogers,
1983). Before analyzing the determinants of adoption, it is important
to assess the level of adoption for each farm household. Accordingly,
farmers who were not growing teff in row planting method were
considered as non-adopters, while farmers who were growing teff in
row with some of the recommended agronomic practices were
considered as adopters. Among improved agronomic practices
(planting methods, spacing, seed rate, weeding rate and fertilizer rate)
were currently practiced by farmers who planted teff in rows.
Adoption index scores were calculated by adding up the adoption
quotient of each practice and dividing it by number of adopted
practices of each respondent. The adoption quotient of each practices
was calculated by taking the ratio of actual rate applied to the
recommended rate. In this study, adoption index was used to measure
the extent of adoption at the time of the survey for multiple practices
(package), which shows to what extent the respondent farmer has
adopted the most set of packages. In order to identify the intensity of
adoption of new technology, adoption index of individual farmers
was developed with the help of the following formula (Singh, 1992).
The index for each respondent farmer was estimated as:
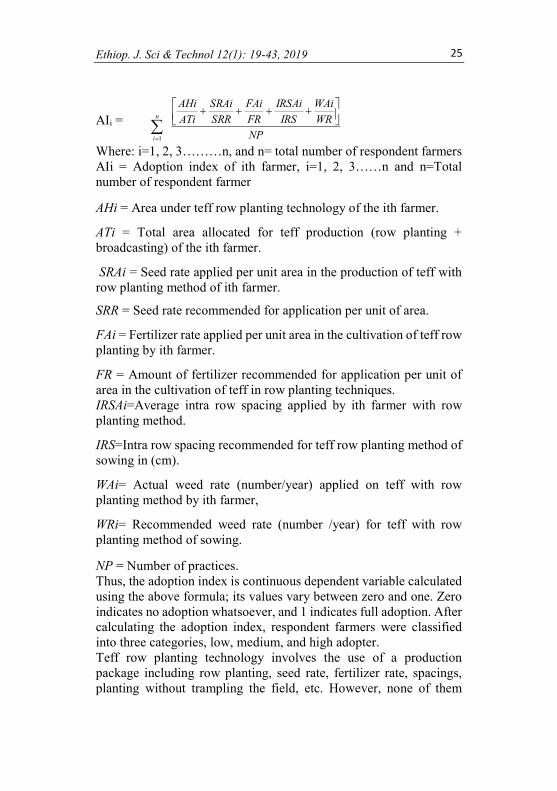
Ethiop. J. Sci & Technol 12(1): 19-43, 2019 25
AIi =
Where: i=1, 2, 3………n, and n= total number of respondent farmers
AIi = Adoption index of ith farmer, i=1, 2, 3……n and n=Total
number of respondent farmer
AHi = Area under teff row planting technology of the ith farmer.
ATi = Total area allocated for teff production (row planting +
broadcasting) of the ith farmer.
SRAi = Seed rate applied per unit area in the production of teff with
row planting method of ith farmer.
SRR = Seed rate recommended for application per unit of area.
FAi = Fertilizer rate applied per unit area in the cultivation of teff row
planting by ith farmer.
FR = Amount of fertilizer recommended for application per unit of
area in the cultivation of teff in row planting techniques.
IRSAi=Average intra row spacing applied by ith farmer with row
planting method.
IRS=Intra row spacing recommended for teff row planting method of
sowing in (cm).
WAi= Actual weed rate (number/year) applied on teff with row
planting method by ith farmer,
WRi= Recommended weed rate (number /year) for teff with row
planting method of sowing.
NP = Number of practices.
Thus, the adoption index is continuous dependent variable calculated
using the above formula; its values vary between zero and one. Zero
indicates no adoption whatsoever, and 1 indicates full adoption. After
calculating the adoption index, respondent farmers were classified
into three categories, low, medium, and high adopter.
Teff row planting technology involves the use of a production
package including row planting, seed rate, fertilizer rate, spacings,
planting without trampling the field, etc. However, none of them
NP
WR
WAi
IRS
IRSAi
FR
FAi
SRR
SRAi
ATi
AHin
i
++++
=1

Almaz Giziew and Begashaw Mebrate 26
trampled their fields and therefore trampling was not considered in
calculating adoption index. Teff production and productivity depends
on the extent to which a household has practiced the recommended
improved agronomic practices. The level of adoption of row planting
by farmers may vary depending on demographic and socioeconomic
variables, although institutional and environmental factors also
influence level of adoption. The actual adoption index score ranges
from 0 to 1. The sample households’ index scores were categorized
into four adopter groups’ namely non adopter, low, medium and high
adopter. Adoption index score of zero point implies non-adoption of
the row planting technology and greater than zero (>0 and ≤ 1)
implies adopters with any of the three adoption categories namely low
adopters, medium adopters and high adopters.
Operational definition of variables
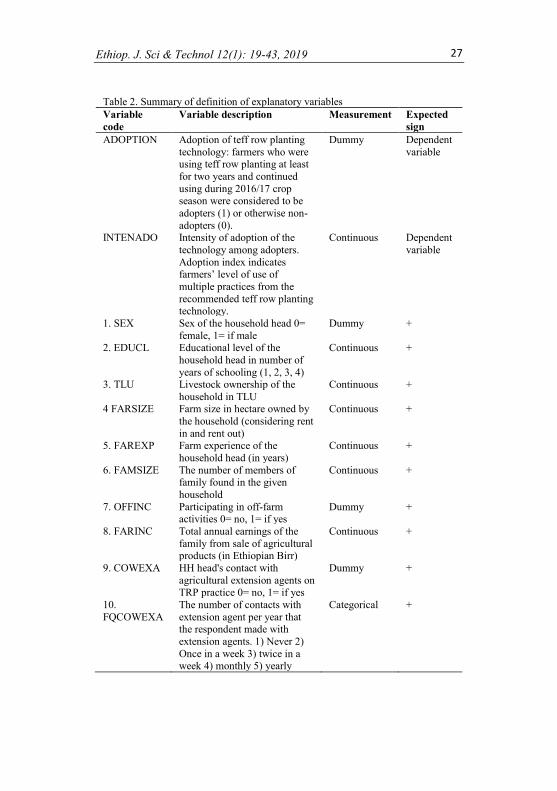
Table 2 presents the operational definition of dependent and
independent variables with its expected sign and measurement types.
RESULTS AND DISCUSSION
Status of adoption and intensity of adoption
In this study, teff row planting technology encompasses use of
different practices of a production package including row planting,
seed rate, intra-row spacing and fertilizer application. Teff row
planting production package includes four practices that are
recommended by research system. Out of these, only row planting,
seed rate, intra-row spacing and fertilizer application were used for
calculating adoption index.
The final adoption indexes of sampled adopter households were
categorized into three adopter groups namely low, medium and high.
The non-adopter group was given a score of 0 and kept as separate
category to investigate factors influencing adoption of row planting
production package.
Ethiop. J. Sci & Technol 12(1): 19-43, 2019 27
Table 2. Summary of definition of explanatory variables
Variable
code
Variable description Measurement Expected
sign
ADOPTION Adoption of teff row planting
technology: farmers who were using teff row planting at least
for two years and continued
using during 2016/17 crop season were considered to be
adopters (1) or otherwise non-
adopters (0).
Dummy Dependent
variable
INTENADO Intensity of adoption of the
technology among adopters.
Adoption index indicates farmers’ level of use of
multiple practices from the
recommended teff row planting technology.
Continuous Dependent
variable
1. SEX Sex of the household head 0=
female, 1= if male
Dummy +
2. EDUCL Educational level of the
household head in number of
years of schooling (1, 2, 3, 4)
Continuous +
3. TLU Livestock ownership of the
household in TLU
Continuous +
4 FARSIZE Farm size in hectare owned by
the household (considering rent
in and rent out)
Continuous +
5. FAREXP Farm experience of the
household head (in years)
Continuous +
6. FAMSIZE The number of members of family found in the given
household
Continuous +
7. OFFINC Participating in off-farm activities 0= no, 1= if yes
Dummy +
8. FARINC Total annual earnings of the
family from sale of agricultural products (in Ethiopian Birr)
Continuous +
9. COWEXA HH head's contact with
agricultural extension agents on
TRP practice 0= no, 1= if yes
Dummy +
10.
FQCOWEXA
The number of contacts with
extension agent per year that the respondent made with
extension agents. 1) Never 2)
Once in a week 3) twice in a week 4) monthly 5) yearly
Categorical +

Almaz Giziew and Begashaw Mebrate 28
11. ATIIDMO
Participation of respondents in demonstrations at kebele level
including the FTC
demonstration. 0 for non-participants and 1 for
participants.
Dummy +
12. DISTNM Distance to the nearest market from dwelling areas (in km)
Continuous -
13.
MASMIEX
The exposure of HH head mass
media, 0= no, 1= if yes
Dummy +
14. ACCTCR HH head's access credit, 0= no,
1= if yes
Dummy +
15. MEISEM Participation of HH in seed multiplication groups, 0 = no,
1= if yes
Dummy +
16. ATFTRP: Attitude of respondents towards teff row planting
technology (measured using
Likert rating scale).
Categorical +
This makes up four distinct categories across which adoption and
intensity of adoption of row planting production package were
assessed. The adoption index score ranges used to classify
respondents into non-adopters was 0, low adopters was 0.01-0.33,
medium adopters was 0.34-0.66 and high adopters was 0.67-1.00
(Table 3).
Adoption index score ranges from 0 to1. Adoption index score of 0
point implies non-adoption of row planting method but they might be
adopting other practices of the production package and adoption
index value of 1 implies adoption according to recommendation. For
FHH, mean adoption index score of non-adopters was 0.0, low-
adopters was 0.29, medium adopters was 0.59 and high adopter
groups was 0.00 and for MHH it was 0.0 for non-adopters, 0.29 for
low, 0.46 for medium and 0.79 for high-adopters (Table 3).
According to the results of the one-way analysis of variance, adoption
index scores significantly varied among the four adopter categories
(F=766.5, P=000 for FHH and F= 943.9, P=000 for MHH). Adoption
varied with among sample farmers.

Ethiop. J. Sci & Technol 12(1): 19-43, 2019 29
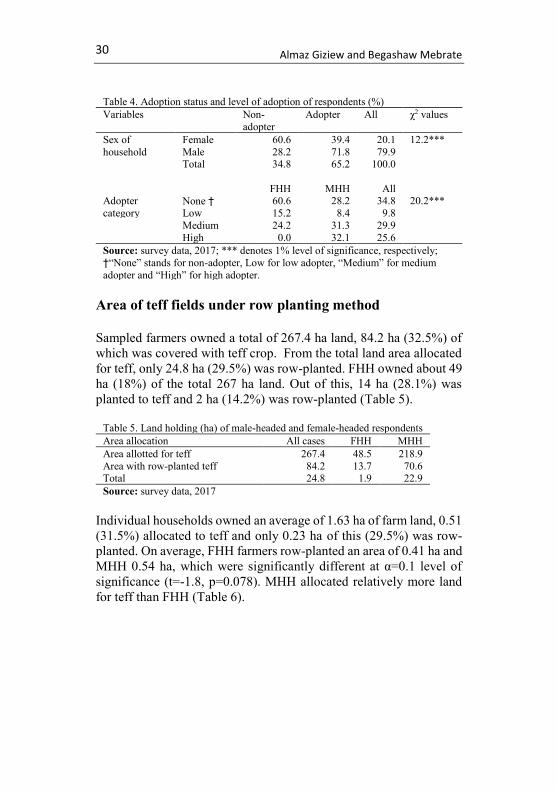
Some 80% of 164 farmers interviewed were male-headed and the rest
20% female-headed households. The area was generally dominated
numerically by male-headed households. Just 107 (65.2%) of them
adopted the technology and 57 (34.8%) did not (Table 4). With
respect to gender, majority (87.9%) of the adopters were male-headed
households. Majority (60.6%) of FHH were non-adopters while about
72% of MHH were adopters. There were no high adopters among the
FHH adopters. Adoption status and head of the household were
significantly associated (χ2 value = 12.17, P=0.000) (Table 4). That
means gender of the household matters in adoption, i.e., women were
less adopters than men. Male farmers had access to information, the
exposure to participating in attending extension events than the
female-headed households. As a result, men had higher probability of
becoming adopters than female-headed households. Similar results
were reported in previous studies (Behailu, 2014; Fitsum, 2016;
Begashaw, 2018).
Table 3. Distribution of respondents by level of adoption
Adopter
Category
N % Adoption index
range
Non-adopters 57 34.8 0.0 Low adopters 16 9.8 0.01-0.33
Medium adopters 49 29.9 0.34-0.66
High adopters 42 25.6 0.67-1.00 Total 164 100.0 0-1
Mean adoption index FHH MHH All cases
Non-adopters 0.00 0.00 0.00
Low adopters 0.29 0.29 0.29 Medium adopters 0.59 0.46 0.48
High adopters 0.00 0.79 0.79
Total 0.19 0.42 0.38 F-Value 766.5*** 943.9*** 1194.5***
Source: survey data, 2017. *** denotes 1% level of significance.
Almaz Giziew and Begashaw Mebrate 30
Table 4. Adoption status and level of adoption of respondents (%)
Variables Non-
adopter
Adopter All χ2 values
Sex of
household
Female 60.6 39.4 20.1 12.2***
Male 28.2 71.8 79.9 Total 34.8 65.2 100.0
FHH MHH All Adopter
category None † 60.6 28.2 34.8 20.2***
Low 15.2 8.4 9.8
Medium 24.2 31.3 29.9
High 0.0 32.1 25.6
Source: survey data, 2017; *** denotes 1% level of significance, respectively;
†“None” stands for non-adopter, Low for low adopter, “Medium” for medium
adopter and “High” for high adopter.
Area of teff fields under row planting method
Sampled farmers owned a total of 267.4 ha land, 84.2 ha (32.5%) of
which was covered with teff crop. From the total land area allocated
for teff, only 24.8 ha (29.5%) was row-planted. FHH owned about 49
ha (18%) of the total 267 ha land. Out of this, 14 ha (28.1%) was
planted to teff and 2 ha (14.2%) was row-planted (Table 5).
Table 5. Land holding (ha) of male-headed and female-headed respondents
Area allocation All cases FHH MHH
Area allotted for teff 267.4 48.5 218.9
Area with row-planted teff 84.2 13.7 70.6 Total 24.8 1.9 22.9
Source: survey data, 2017
Individual households owned an average of 1.63 ha of farm land, 0.51
(31.5%) allocated to teff and only 0.23 ha of this (29.5%) was row-
planted. On average, FHH farmers row-planted an area of 0.41 ha and
MHH 0.54 ha, which were significantly different at α=0.1 level of
significance (t=-1.8, p=0.078). MHH allocated relatively more land
for teff than FHH (Table 6).

Ethiop. J. Sci & Technol 12(1): 19-43, 2019 31
Components of the package included seed rate, fertilizer and spacing.
Seed rate recommendations in the study area for row planted teff was
3 kg/ha for light and 5 kg/ha for black soils. The intra-row spacing of
the crop was 20 cm. Fertilizer rate was 50-100 kg/ha UREA and 100
kg/ha DAP (BOAD Moretna Jiru District, 2016). The mean adoption
level of area covered by row Teff sowing of respondents were 0 .15
and 0.24ha for FHH and MHH, respectively (Appendix Table 1).
The average seeding rate was 1.43 kg for FHH and 2.55 kg for sample
household. There was significant variation among seed rate adopter
categories in terms of their seeding rate. This is evident from results
of one-way ANOVA which indicated the presence of significant
mean difference in seeding rate applied between FHH and MHH
adopter categories (F = 74.98, P=0.0045 and F = 77.63, P=0.000).
Access to credit significantly varied between the two groups at 10%
level of significance. Majority (69.7%) FHH did not use credit while
49% of MHH used credit services (Table 7). Only 23.8% of the
respondents have attended field demonstrations on teff row planting
method (Table 7). Only 6.1% of FHH and 28.2% of MHH
participated in demonstrations. Some 57.6% of FHH and 77.8% of
MHH respondents had positive attitude towards teff row planting
technology related with teff yield increment (Table 7). As to
educational status, about 64% of FHH and 76% of MHH were
illiterate. Although all female-headed farmers got extension service
on teff row planting method, 30.3% of this group obtained the service
once in a month, whereas 43.5% of MHH accessed it at least once in
a week.
Table 6. Mean area coverage of teff production of sample adopter households
Variables Male
(N=131)
Female
(N=33)
All cases
(N=164)
t-value
Area of teff (ha) 0.54 0.41 0.51 -1.80*
Row planted (ha) 0.24 0.15 0.23 -1.50 Total (ha) 1.67 1.47 1.63 -1.13
Source: survey data, 2017. * denotes 10% level of significance.

Almaz Giziew and Begashaw Mebrate 32
Table 7. Summary of chi-square test results of respondents
Lists of variables FHH
(N=33)
(%)
MHH
(N=131)
(%)
All
cases
(N=164)
χ2-value
Mass media
exposure
No 39.4 42.0 41.5 0.07
Yes 60.6 58.0 58.5
Credit use No 69.7 51.1 54.9 0.66* Yes 30.3 48.9 45.1
Seed multiplication
No 48.5 59.5 57.3 1.32 Yes 51.5 40.5 42.7
Field demonstrations
No 93.9 71.8 76.2 7.16***
Yes 6.1 28.2 23.8
Off-farm activity No 87.9 87.0 87.2 0.02
Yes 12.1 13.0 12.8
Advisory service No 0.0 7.6 6.1 2.68*
Yes 100 92.4 93.9
Attitude Strongly
disagree
6.1 5.3 5.5 8.98*
Disagree 18.2 9.9 11.6
No opinion 18.2 6.9 9.1 Agree 57.6 67.9 65.9
Strongly
agree
0.0 9.9 7.9
Frequency of
contact
Never 0.0 9.2 7.3
18.05***
Once in a
week
18.2 43.5 38.4
twice in a
week
27.3 17.6 19.5
Monthly 30.3 23.7 25.0
Yearly 24.2 6.1 9.8
Education Illiterate 36.4 23.7 26.2
11.57** Read & write
39.4 32.8 34.1
Primary (1-
4)‡
0.0 17.6 14.0

Ethiop. J. Sci & Technol 12(1): 19-43, 2019 33
Regarding the distance taken to travel from home to the nearest
market, sample farmers reported that they had to travel an average of
34.8 km. For FHH, average distance that a farmer had to travel to the
nearest market was 32.2 km and MHH 45 km.
Average farm income for sample households was 38,092.32
Birr/year, whereas the mean farm income for FHH was Birr
29,130.30 and that of MHH was 40,349.92 (Table 8). Incomes
significantly varied between groups (t= 2.35, P=0.025).
Determinants of adoption and intensity of adoption
Estimates of the variables expected to contribute for the adoption and
intensity of adoption of teff row planting technology package is
displayed in Table 9. A total of 16 explanatory variables were
included into the econometric model out of which six variables in the
pool data, five variables in MHH and twelve variables in FHH were
found to significantly influence adoption and intensity of teff row
planting technology package. For the FHH, four variables were
excluded from regression due to lack of variability, i.e., getting
extension service, frequency of contact with extension agents,
Secondary (5-8)
24.2 16.8 18.3
Tertiary (9-
10)
0.0 9.2 7.3
Source: survey data, 2017. *** denotes 1%, ** 5% and * 10% level of
significance; ‡Primary, secondary and tertiary stand for primary, secondary and tertiary cycles.
Table 8. Summary of t-test results of respondents
Variables Male
(N=131)
Female
(N=33)
All cases
(N=164)
t-value
Experience‡ 22.92 21.21 22.57 -0.781
Distance 32.20 45.00 34.77 2.03**
Livestock 3.48 3.06 3.40 -1.26
Farm size, ha 1.67 1.47 1.63 -1.13
Family size 4.72 4.61 4.70 -.321 Income (Birr) 40,350 29,130 38,092 -2.35**
‡Experience stands for farming experience, Distance for Distance to plot in km,
Livestock for livestock unit (TLU) owned.
Source: Survey data, 2017; ** denotes 5% level of significance.

Almaz Giziew and Begashaw Mebrate 34
attending demonstrations and participating in off-farm income
generating activities.
Effect of gender: This variable influenced the adoption decision
positively and significantly. The positive sign of the coefficient
indicates that male-headed households were more likely to adopt teff
row planting technology package than female-headed household
heads. The model showed that male gender was found to have 21%
contribution to adoption and intensity of use of teff row planting
technology package. The possible explanation might be male headed
households have better access to information, agricultural inputs and
resource endowments. Similar results were reported before (Techane,
2002; Almaz, 2011; Begashaw, 2018). The econometric result
indicates that the educational level of both FHH and MHH household
had positive and significant influence on the likelihood of adoption of
row planting technology for which educational level accounted for 10
% and 25% of the variation in adoption and intensity of adoption of
teff row planting of MHH AND FHHH, respectively. The positive
association suggests that the likelihood of adopting row planting
technology increases as educational level of farmers increases. This
finding is in agreement with previous studies (Mulugeta, 2009;
Almaz, 2011).
Land holding positively influenced adoption of teff row planting and
its intensity. Land holding accounted for about 7% for MHH and 15%
for FHH of the variation in adoption and intensity of adoption of teff
row planting production package. Contrary to the hypothesis,
livestock holding of sample population for both FHH and MHH is
negatively and significantly associated with adoption and intensity of
teff row planting technology. Consequently, livestock ownership
accounted for about 4% for MHH and 7% for FHH of the variation in
the adoption and intensity of adoption. The probable reason might be
teff row planting method is labor intensive. Farmer’s contact with
extension agents was found to be positive and significant to influence
on MHH adoption decision of row planting technology (Table 9). The
positive association indicates that as farmers’ contact with extension
agents’ increase, the likelihood of adoption increases. This variable
accounted for about 24% of the variation in the adoption and intensity
of adoption.

Ethiop. J. Sci & Technol 12(1): 19-43, 2019 35
The result of Tobit model showed that attitude towards teff row
planting technology is positively and significantly related with
adoption of the package. The above finding implies that those
individuals who have unfavorable attitude towards the technology
package usually create resistance to accept new ideas and innovations
thereby retard the processes of change towards which interventions in
rural development are geared. This implies need to change negative
attitude held by non-adopters of the technology package. The result
from this test in the model shows that attitude towards teff row
planting technology package was found to have 23% for FHH and
37% for MHH contribution to adoption and intensity of use of teff
row planting package. The result of this study goes along with
previous findings (Ebrahim, 2006; Mekonnen, 2007; Rahmeto,
2007). As expected, in FHH sample respondents, participated in seed
multiplication, use of credit, farming experience, and on-farm income
had positive influence on adoption and intensity of adoption of row
planting package. Participation in seed multiplication accounted for
about 23%, use of credit for 16% and farming experience for 4% of
the variation in adoption and intensity of adoption (Table 9).
Farm distance to home was negatively and significantly associated
with the probability of adoption and extent of use of row planting
package of teff (Table 9). The negative association indicates that as
distance to the plot decreases, the likelihood of adopting the package
increases. Distance accounted for about 1% of the variation in the
adoption and intensity of adoption.
In contrast to common knowledge, family size and mass media
exposure had negative influence on adoption and intensity of
adoption. The negative association means that the likelihood of
adopting row planting package declines with increasing family size
and exposure to mass media. Further study is required. As indicated
in Table 10 below, a higher marginal effect was accounted to sex of
the household head and the result showed that being male headed
household had influence on the intensity of use of adopting teff row
planting technology which increases by 35%, keeping other variables
constant. The effect is very immense as compared to the changes
resulting from other significant variables implying that priority
should be given to improving women participation in adoption of
Almaz Giziew and Begashaw Mebrate 36
agricultural technology in general and Teff row planting technology
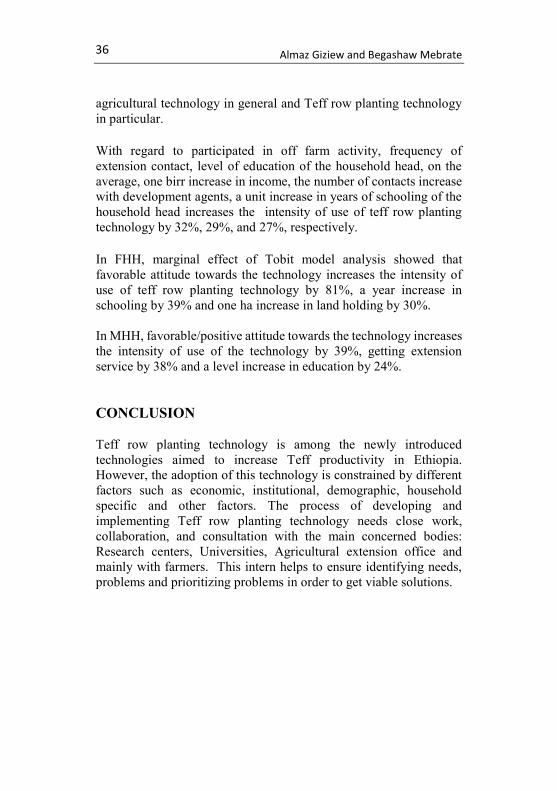
in particular. With regard to participated in off farm activity, frequency of
extension contact, level of education of the household head, on the
average, one birr increase in income, the number of contacts increase
with development agents, a unit increase in years of schooling of the
household head increases the intensity of use of teff row planting
technology by 32%, 29%, and 27%, respectively.
In FHH, marginal effect of Tobit model analysis showed that
favorable attitude towards the technology increases the intensity of
use of teff row planting technology by 81%, a year increase in
schooling by 39% and one ha increase in land holding by 30%.
In MHH, favorable/positive attitude towards the technology increases
the intensity of use of the technology by 39%, getting extension
service by 38% and a level increase in education by 24%.
CONCLUSION
Teff row planting technology is among the newly introduced
technologies aimed to increase Teff productivity in Ethiopia.
However, the adoption of this technology is constrained by different
factors such as economic, institutional, demographic, household
specific and other factors. The process of developing and
implementing Teff row planting technology needs close work,
collaboration, and consultation with the main concerned bodies:
Research centers, Universities, Agricultural extension office and
mainly with farmers. This intern helps to ensure identifying needs,
problems and prioritizing problems in order to get viable solutions.

Ethiop. J. Sci & Technol 12(1): 19-43, 2019 37
Table 9. Determinants of adoption and intensity of adoption
Explanatory
variable
Pooled (N=164) MHH (N=131) FHH (N=33)
Coefficient Marginal effect Coefficient Marginal effect Coefficient Marginal effect
SEX 0.21(0.07)*** 0.21 ------ ------ ------ -----
EDUCA 0.12(0.02)*** 0.12 0.10(0.03)*** 0.10 0.25(6.4E-11)*** 0.25
EXPE 0.00(0.00) 0.00 0.00(0.00) 0.00 0.04(8.6E-12) *** 0.04
DISDC 0.00(0.00) -0.00 0.00(0.00) 0.00 -0.01(2.9E-12) *** -0.01
TLU -0.02(0.02) -0.02 -0.04(0.02)** -0.04 -0.07(4.3E-11) *** -0.07 LANDH 0.04(0.03) 0.04 0.07(0.04)* 0.07 0.15(1.6E-10) *** 0.15
FAMS 0.02(0.02) 0.02 0.02(0.02) 0.02 -0.14(5.3E-11) *** -0.14
INCOM 0.00(0.00) -0.00 0.00(0.00) 0.00 0.00(6.9E-15) *** 0.00 EXTEN 0.26(0.11)** 0.26 0.24 (0.11)** 0.24 ----- -------
FEXTEN -0.05(0.03)* -0.05 -0.03(0.03) -0.03 ------ -------
DEMON -0.03(0.06) -0.03 -0.01(0.06) -0.01 ------ ------- OFFIN 0.14(0.07)** 0.14 0.11(0.08) 0.11 ------- -------
ATTIUD 0.37(0.05)*** 0.37 0.37(0.05)*** 0.37 0.23(5.8E-11) *** 0.23
SEED 0.08(0.06) 0.08 0.06(0.07) 0.06 0.23(2.1E-10) *** 0.23 MASS 0.05(0.07) 0.05 0.07(0.07) 0.07 -0.22(2.0E-10) *** -0.22
CREDIT 0.03(0.05) 0.29 0.03(0.06) 0.03 0.16(1.3E-10) *** 0.16
CONSTANT -1.83(0.23)*** - -1.55(0.22)*** - -1.33(2.4E-10) *** ------
LR χ2(16) = 189.82***
Log likelihood = -31.61
Pseudo R2 = 0.75
LR χ2(16) = 135.99***
Log likelihood = -27.06
Pseudo R2 = 0.72
LR χ2(16) = 76.80***
Log likelihood = 226.22
Pseudo R2 = 10.37
Source: survey data, 2017. *** denotes 1%, ** 5% and * 10% level of significance.

Almaz Giziew and Begashaw Mebrate 38
Table 10. Marginal effects of determinant variables
Variables pooled
(N=164)
Change in the intensity of
adoption*
(Pooled (N=164)
Variables
MHH
(N=131)
Change in the
intensity of adoption*
MHH
Variables
FHH
(N=33)
Change in the intensity of
adoption* FHH
SEX 0.35 EDUCA 0.24 EDUCA 0.39
ATTIUD 0.11 TLU -0.05 EXPE 0.03
EDUCA 0.27 LAND 0.08 DISDC 0.00 EXTEN -0.04 EXTEN 0.38 TLU -0.06
FEXTEN 0.29 ATTIUD 0.39 LANDH 0.30
OFFINCO 0.32 FAMS -0.19 INCOM 0.01
ATTIUD 0.81
SEED 0.25 MASS -0.21
CREDIT 0.16
Source: survey data, 2017.

Ethiop. J. Sci & Technol 12(1): 19-43, 2019 39
Majority of FHH respondents were non-adopters. Besides the mean
teff row planting technology by FHH is below the recommendation.
Hence, attention should be given for female household by
empowering them to participate in Teff row planting technology.
Extension agents should work hard with female-headed farmers and
to ensure the implementation of Teff row planting technology based
on recommendation there by strengthen FTCs in well-coordinated
manner by fulfilling the necessary materials to increase adoption rate
of the technology. The government extension workers should focus
to facilitate and organize field days of Teff row planting method at
different stage of agronomic practice near the farmers’ locality. This
practical lesson can initiate and convince the non-adopters to apply
the technology based on its recommendation.
ACKNOWLEDGMENTS
We would like to thank those who helped us to collect the data and
all respondents who devoted their time in replying for the interview
schedule.
REFERENCES
Almaz, G. (2011). Adoption of improved chickpea technology packages in
East Shewa, Ethiopia Journal of Agricultural Extension Management
12(1): 20-3
ATA (Agricultural Transformation Agency). (2013a). Results of 2012 New
Tef Technologies Demonstration Trials Draft Report VF. Addis Ababa,
Ethiopia.
ATA (Agricultural Transformation Agency). (2013b). Working Strategy for
Strengthening Ethiopian’s Tef Value Chain Vision, Systemic Challenges,
and Prioritized Interventions. Addis Ababa, Ethiopia
ATA (Agricultural Transformation Agency). (2016). Transforming
Agriculture in Ethiopia. Annual report 2015/2016. [accessed online on
26/10/2016].
Abebe, B and Workayehu, T. (2015). Effect of method of sowing and time of
di-ammonium phosphate (dap) fertilizer application, on yield and yield
components of tef (Eragrostis tef) Trotter) at Shebedino, Southern

Almaz Giziew and Begashaw Mebrate 40
Ethiopia. Advanced Crop Science Technology 3: 168. doi:10.4172/2329-
8863.1000168
Begashaw, M. (2018). Determinants of adoption of teff (Eragrostis tef) row
planting technology in Moretna Jiru Woreda, North Shoa Zone of
Amhara Regional State, Ethiopia. MSc thesis Bahir Dar University,
Ethiopia. 122pp
Behailu, G. (2014). Assessment of factors affecting farmers’ adoption level
of row planting technology and yield improvement on the production of
Eragrostis tef [Zucc.]: The case of Minjar Shenkora Woreda, Amhara
Region, Ethiopia. Addis Ababa University.
Berhe, T and Zena, N. (2008). Results in a trial of system of teff
intensification (STI) at Debre Zeit, Ethiopia.
Berhe, T. (2009). Recent Developments in tef, Ethiopia’s most important
cereal and gift of the world. CIIFAD Forum Seminar, Addis Ababa,
Ethiopia.
BOAD (Bureau of Agriculture and Rural Development). (2016). Annual
report, North Shoa, Moretna Jiru district.
Debelo, D. (2015). Does adoption of quncho tef increases farmers’ crops
income? Evidence from small holder farmers in Wayu Tuqa District,
Oromia Regional State, Ethiopia. Journal of Economics and Sustainable
Development 6(17): 87-102
Ebrahim, J. (2006). Adoption of diary innovation: Its income and gender
implication in Adami Tulu District, Ethiopia. An M.Sc. Thesis Haramaya
University, Ethiopia.
Fistum, M. (2016). Analysis of factors affecting adoption of soya bean
production technology in Pawe District, Metekel Zone of Benishangul
Gumz Regional State, Ethiopia. World Scientific News 53(3): 122-137
Fufa, B., Behute, B. Simons, R and Berhe, T. (2011). Tef diagnostic report:
strengthening the tef value chain in Ethiopia. Addis Ababa, Ethiopia.
Pages: 1560-1599.
Geremew, K. Abdi Bedilu, M. and Workineh, M. (2016). Analysis of
smallholder farmer’s adoption and continued application of teff row
planting technique in Wolaita Zone, Southern Ethiopia. International
Journal of Advanced R 7(3): 1370-1375.
MoFED (Ministry of Finance and Economic Development), 2010. Federal
democratic republic of Ethiopia: Global agricultural and food security
program, Addis Ababa.
Moretena Jiru Woreda Office of Agriculture. (2014). Annual Agriculture
Report. Enewari, Ethiopia. Unpublished.
Moretena Jiru Woreda office of Agriculture. (2016). Annual Agriculture
Report. Enewari, Ethiopia. Unpublished.
Mekonnen, S. (2007). Assessment of factors influencing adoption of
integrated striga management technologies of sorghum in Habro and
Ethiop. J. Sci & Technol 12(1): 19-43, 2019 41
Fedis Woredas, Oromia region. An M.Sc. Thesis, Haramaya University,
Ethiopia.
Mulugeta, A. (2009). Determinants of intensity of adoption of old coffee
stumping technology in Dale Woreda, SNNPS, Ethiopia. M.SC. Thesis,
Haramaya University.
Rahmeto, N. (2007). Determinants of adoption of improved haricot bean
production package in Alaba Special Woreda, Southern Ethiopia. An M.
Sc Thesis, Haramaya University, Ethiopia.
Rogers, E and Shoe Maker, F. (1983). Communication of innovation: A cross
cultural approach. 3rd. Ed. New York: The Free Press.
Singh, S.N. (1992). Achievement motivation scale: In UDAI PAREEK and
T.V., RAO. Handbook of Psychological and Social Instruments.
Ahmedabad, Indian Institute of Management.
Techane, A. (2002). Determinants of fertilizer adoption in Ethiopia: The case
of major cereal producing areas. An M. Sc Thesis Submitted to the School
of Graduate Studies of Haramaya University, Ethiopia.130pp
Vandercasteelen, J., Mekdim, D., Bart, M. and Alemayehu, S. (2016). Row
planting teff in Ethiopia: Impact on farm-level profitability and labor
allocation. Summary of ESSP Working Paper 92.
Yonas, B. (2014). The Impact of row planting of teff crop on rural household
income: A case of Tahtay Maychew district, Tigray, Ethiopia. M.Sc.
Thesis, Mekele University, Ethiopia.

Almaz Giziew and Begashaw Mebrate 42
Appendix Table 1. Adoption of raw teff planting technologies
Technology
groups
Adopter
category
FHH MHH All cases
N Mean SD N Mean SD N Mean SD
Row planted area
Non-adopter 20 0.00 0.00 37 0.00 0.00 57 0.00 0.00
Low 5 0.04 0.01 11 0.05 0.02 16 0.05 0.02 Medium 8 0.22 0.17 41 0.19 0.13 49 0.19 0.13
High 0 0.00 0.00 42 0.35 0.27 42 0.35 0.27
Total 33 0.15 0.16 131 0.24 0.22 164 0.23 0.22 F-value = 5.26** F-value = 12.81*** F-value = 16.51***
Seeding
rate
Non-adopter 53 0.00 0.00 37 0.00 0.00 57 0.00 0.00
Low 2 0.31 0.39 11 0.58 0.36 16 0.49 0.38 Medium 5 2.13 0.35 41 1.33 0.67 49 1.46 0.69
High 0 0.00 0.00 42 4.26 1.66 42 4.26 1.66
Total 100 1.43 0.98 131 2.55 1.97 164 2.42 1.91 F-value = 74.98** F-value = 77.63*** F-value = 92.51***
Spacing (intra
row)
Non-adopter 21 0.00 0.00 37 0.00 0.00 57 0.00 0.00
Low 5 20.00 0.00 11 17.73 2.61 16 18.44 2.39 medium 8 16.25 2.31 41 25.43 3.45 49 18.47 3.42
High 0 0.00 0.00 42 50.83 5.05 42 18.07 5.05
Total 33 17.69 2.60 131 34.67 4.16 164 18.31 4.00 F-value = 12.69*** F-value = 0.56NS F-value = 0.12 NS
Fertilizer (URA) Non-adopter 20 0.00 0.00 37 0.00 0.00 57 0.00 0.00
Low 5 4.24 5.26 11 7.39 5.24 16 6.41 5.29 Medium 8 31.25 11.57 2 25.43 13.17 49 26.38 12.99
High 0 0.00 0.00 74 50.83 22.84 42 50.83 22.84 Total 33 20.86 16.57 96 34.67 23.48 107 32.99 23.14
F-value = 23.56*** F-value = 46.62***

Ethiop. J. Sci & Technol 12(1): 19-43, 2019 43
Fertilizer (DAP) Non -adopter 20 0.00 0.00 37 0 0.00 57 0.00 0.00 Low 5 4.48 5.04 11 11 9.66 16 8.04 6.92
Medium 8 43.75 11.57 41 41 28.41 49 30.92 14.87
High 0 0.00 0.00 42 42 60.68 42 60.68 34.18 Total 33 28.65 21.95 131 94 40.64 164 39.18 30.33
F-value = 50.23*** F-value = 27.01*** F-value = 3.61***
Weeding Frequency
Non-adopter 22 0.00 0.20 69 0.00 0.00 91 0.00 0.00 Low 5 2.40 0.89 11 2.00 0.77 16 2.13 0.81
Medium 6 1.33 0.52 34 1.85 0.70 40 1.78 0.70
High 0 0.00 0.00 17 1.65 0.70 17 1.65 0.70 Total 33 1.82 0.87 131 1.82 0.71 131 1.82 0.73
F-value = 50.23*** F-value = 0.9NS F-value = 2.00NS
Teff row
planting
technology
package
Non-adopter 20 0.00 0.00 37 0.00 0.00 57 0.00 0.00
Low 5 0.31 0.39 11 0.29 0.03 16 0.29 0.03 Medium 8 2.13 0.35 41 0.46 0.08 49 0.48 0.09
High 0 0.00 0.00 42 0.79 0.08 42 0.79 0.08
Total 33 1.43 0.98 131 0.42 0.32 164 0.38 0.32 F-value = 766.46*** F-value = 943.93*** F-value = 1194.54***
Source: Own survey data, 20017; ***= the mean difference is significant at less 1% level