ADDITIONAL SPITZER IRS SPECTROSCOPY OF THREE …
7
The Astrophysical Journal, 710:325–331, 2010 February 10 doi:10.1088/0004-637X/710/1/325 C 2010. The American Astronomical Society. All rights reserved. Printed in the U.S.A. ADDITIONAL SPITZER IRS SPECTROSCOPY OF THREE INTERMEDIATE POLARS: THE DETECTION OF A MID-INFRARED SYNCHROTRON FLARE FROM V1223 SAGITTARII ∗ Thomas E. Harrison 1 , Jillian Bornak 1 , Michael P. Rupen 2 , and Steve B. Howell 3 1 Department of Astronomy, New Mexico State University, P.O. Box 30001, MSC 4500, Las Cruces, NM 88003-8001, USA; [email protected], [email protected] 2 National Radio Astronomy Observatory, 1003 Lopezville Road, Socorro, NM 87801, USA; [email protected] 3 WIYN Observatory and National Optical Astronomy Observatories, 950 North Cherry Avenue, Tucson, AZ 85726, USA; [email protected] Received 2009 September 9; accepted 2009 December 15; published 2010 January 18 ABSTRACT We present new Spitzer Infrared Spectrograph (IRS) observations of three intermediate polars: V1223 Sgr, EX Hya, and V603 Aql. We detected a strong, fading flare event from V1223 Sgr. During this event, the flux declined by a factor of 13 in 30 minutes. Given the similarity in the slope of its mid-infrared spectrum during this event to that of AE Aqr, we suggest that this event was caused by transient synchrotron emission. Thus, V1223 Sgr becomes the third cataclysmic variable known to be a synchrotron source. We were unable to confirm the mid-infrared excess noted by Harrison et al. (Paper I) for EX Hya, suggesting that this object is either not a synchrotron source, or is slightly variable. Due to a very high background, V603 Aql was not detected in the long-wavelength regions accessible to the IRS. Given the recent detection of SS Cygni at radio wavelengths during outburst, we extract archival Spitzer IRS spectra for this source obtained during two successive maxima. These spectra do not show a strong excess, but without simultaneous data at shorter wavelengths, it is not possible to determine whether there is any contribution to the mid-infrared fluxes from a synchrotron jet. Key words: infrared: stars – stars: individual (V603 Aquilae, SS Cygni, PQ Geminorum, EX Hydrae, V1223 Sagittarii) 1. INTRODUCTION Intermediate polars (IPs) are a heterogeneous subclass of cata- clysmic variable (CV) with magnetic white dwarf primaries that are accreting matter from low mass, late-type secondary stars. They can be differentiated from the highly magnetic “polars” in that they exhibit X-ray periodicities that are substantially shorter than their orbital periods. These periods are believed to be due to the accretion region(s) rotating into the line of sight. Thus, unlike polars, their white dwarfs are rotating asynchronously (see Ramsay et al. 2008, and references therein). In addition, the X-ray spectra of IPs tend to be harder than those of po- lars. It is believed that the magnetic field strength of the white dwarf in IPs is lower than in polars based on the lack of strong polarization or discrete cyclotron harmonics in their optical/ near-infrared spectra (Wickramasinghe et al. 1991). In the typi- cal polar, the accretion stream is captured close to the secondary star, and funneled directly onto the white dwarf. In the majority of IPs, a truncated accretion disk appears to be present, and the capture of the inner portion of this stream at the magnetospheric radius creates accretion “curtains” that absorb some of the soft X-ray flux, hardening their spectra (see Hellier et al. 1996, and references therein). Harrison et al. (2007, hereafter “Paper I”) used mid-infrared spectra obtained by the Infrared Spectrograph (IRS) on Spitzer to search for cyclotron emission from 11 IPs. If the magnetic field strength of the white dwarfs in IPs was B 1 MG, cyclotron harmonic emission (even if optically thick) would appear in the ∗ Includes observations obtained at the Gemini Observatory, which is operated by the Association of Universities for Research in Astronomy, Inc., under a cooperative agreement with the NSF on behalf of the Gemini partnership: the National Science Foundation (United States), the Science and Technology Facilities Council (United Kingdom), the National Research Council (Canada), CONICYT (Chile), the Australian Research Council (Australia), Minist´ erio da Ci ˆ encia e Tecnologia (Brazil), and Ministerio de Ciencia, Tecnolog´ ıa e Innovaci´ on Productiva (Argentina). 5–21 μm bandpass. No evidence for cyclotron emission from these 11 systems was found, with the result being that their mid-IR spectra were simple power-law extrapolations of their optical/near-IR spectral energy distributions (SEDs). In that study, however, three systems proved to be interesting: AE Aqr, EX Hya, and V1223 Sgr. AE Aqr exhibited a dramatic upturn in its spectrum beyond 14 μm, which was clearly the detection of optically thin synchrotron emission from this system. Both EX Hya and V1223 Sgr showed a flattening of their spectra at the red ends of their IRS spectra, suggesting that they might also be synchrotron sources. If either EX Hya or V1223 Sgr were synchrotron sources like AE Aqr, than their spectra should exhibit a dramatic upturn in flux at the longest wavelengths (∼38 μm) accessible with the IRS. Thus, we initiated a new study to obtain deeper IRS spectra in the long-wavelength bandpasses of the IRS for both systems. In addition, we obtained identical observations for V603 Aql, the optically brightest IP. AE Aqr has long been known as the only CV that had detectable synchrotron emission. It has been expected by some (e.g., Livio 1999; Soker & Lasota 2004) that CVs should be synchrotron sources, and the identification of such emission would show that all accreting binaries with compact primaries emit such radiation. With the recent detection of a synchrotron jet from SS Cygni during outburst (K¨ ording et al. 2008), one of the previously unique features of AE Aqr has been matched. The question still remains as to the universality of synchrotron emission from CVs. As shown by the results for low mass X-ray binaries (Migliari & Fender 2006; Gallo et al. 2007; Gelino et al. 2010), the mid-infrared is an ideal bandpass in which to search for optically thin synchrotron emission. In addition to the new observations of EX Hya, V1223 Sgr, and V603 Aql, we present archival Spitzer observations of SS Cygni that show a weak mid-IR excess that we discuss in the context of the synchrotron jet detected for this system. We describe these observations in the following section, where we 325
Transcript of ADDITIONAL SPITZER IRS SPECTROSCOPY OF THREE …

The Astrophysical Journal, 710:325–331, 2010 February 10 doi:10.1088/0004-637X/710/1/325C© 2010. The American Astronomical Society. All rights reserved. Printed in the U.S.A.
ADDITIONAL SPITZER IRS SPECTROSCOPY OF THREE INTERMEDIATE POLARS: THE DETECTION OF AMID-INFRARED SYNCHROTRON FLARE FROM V1223 SAGITTARII∗
Thomas E. Harrison1, Jillian Bornak
1, Michael P. Rupen
2, and Steve B. Howell
31 Department of Astronomy, New Mexico State University, P.O. Box 30001, MSC 4500, Las Cruces, NM 88003-8001, USA; [email protected], [email protected]
2 National Radio Astronomy Observatory, 1003 Lopezville Road, Socorro, NM 87801, USA; [email protected] WIYN Observatory and National Optical Astronomy Observatories, 950 North Cherry Avenue, Tucson, AZ 85726, USA; [email protected]
Received 2009 September 9; accepted 2009 December 15; published 2010 January 18
ABSTRACT
We present new Spitzer Infrared Spectrograph (IRS) observations of three intermediate polars: V1223 Sgr, EX Hya,and V603 Aql. We detected a strong, fading flare event from V1223 Sgr. During this event, the flux declined by afactor of 13 in 30 minutes. Given the similarity in the slope of its mid-infrared spectrum during this event to that ofAE Aqr, we suggest that this event was caused by transient synchrotron emission. Thus, V1223 Sgr becomes thethird cataclysmic variable known to be a synchrotron source. We were unable to confirm the mid-infrared excessnoted by Harrison et al. (Paper I) for EX Hya, suggesting that this object is either not a synchrotron source, oris slightly variable. Due to a very high background, V603 Aql was not detected in the long-wavelength regionsaccessible to the IRS. Given the recent detection of SS Cygni at radio wavelengths during outburst, we extractarchival Spitzer IRS spectra for this source obtained during two successive maxima. These spectra do not show astrong excess, but without simultaneous data at shorter wavelengths, it is not possible to determine whether thereis any contribution to the mid-infrared fluxes from a synchrotron jet.
Key words: infrared: stars – stars: individual (V603 Aquilae, SS Cygni, PQ Geminorum, EX Hydrae, V1223Sagittarii)
1. INTRODUCTION
Intermediate polars (IPs) are a heterogeneous subclass of cata-clysmic variable (CV) with magnetic white dwarf primaries thatare accreting matter from low mass, late-type secondary stars.They can be differentiated from the highly magnetic “polars” inthat they exhibit X-ray periodicities that are substantially shorterthan their orbital periods. These periods are believed to be dueto the accretion region(s) rotating into the line of sight. Thus,unlike polars, their white dwarfs are rotating asynchronously(see Ramsay et al. 2008, and references therein). In addition,the X-ray spectra of IPs tend to be harder than those of po-lars. It is believed that the magnetic field strength of the whitedwarf in IPs is lower than in polars based on the lack of strongpolarization or discrete cyclotron harmonics in their optical/near-infrared spectra (Wickramasinghe et al. 1991). In the typi-cal polar, the accretion stream is captured close to the secondarystar, and funneled directly onto the white dwarf. In the majorityof IPs, a truncated accretion disk appears to be present, and thecapture of the inner portion of this stream at the magnetosphericradius creates accretion “curtains” that absorb some of the softX-ray flux, hardening their spectra (see Hellier et al. 1996, andreferences therein).
Harrison et al. (2007, hereafter “Paper I”) used mid-infraredspectra obtained by the Infrared Spectrograph (IRS) on Spitzer tosearch for cyclotron emission from 11 IPs. If the magnetic fieldstrength of the white dwarfs in IPs was B � 1 MG, cyclotronharmonic emission (even if optically thick) would appear in the
∗ Includes observations obtained at the Gemini Observatory, which isoperated by the Association of Universities for Research in Astronomy, Inc.,under a cooperative agreement with the NSF on behalf of the Geminipartnership: the National Science Foundation (United States), the Science andTechnology Facilities Council (United Kingdom), the National ResearchCouncil (Canada), CONICYT (Chile), the Australian Research Council(Australia), Ministerio da Ciencia e Tecnologia (Brazil), and Ministerio deCiencia, Tecnologıa e Innovacion Productiva (Argentina).
5–21 μm bandpass. No evidence for cyclotron emission fromthese 11 systems was found, with the result being that theirmid-IR spectra were simple power-law extrapolations of theiroptical/near-IR spectral energy distributions (SEDs). In thatstudy, however, three systems proved to be interesting: AE Aqr,EX Hya, and V1223 Sgr. AE Aqr exhibited a dramatic upturn inits spectrum beyond 14 μm, which was clearly the detection ofoptically thin synchrotron emission from this system. Both EXHya and V1223 Sgr showed a flattening of their spectra at thered ends of their IRS spectra, suggesting that they might also besynchrotron sources.
If either EX Hya or V1223 Sgr were synchrotron sources likeAE Aqr, than their spectra should exhibit a dramatic upturn influx at the longest wavelengths (∼38 μm) accessible with theIRS. Thus, we initiated a new study to obtain deeper IRS spectrain the long-wavelength bandpasses of the IRS for both systems.In addition, we obtained identical observations for V603 Aql,the optically brightest IP.
AE Aqr has long been known as the only CV that haddetectable synchrotron emission. It has been expected by some(e.g., Livio 1999; Soker & Lasota 2004) that CVs should besynchrotron sources, and the identification of such emissionwould show that all accreting binaries with compact primariesemit such radiation. With the recent detection of a synchrotronjet from SS Cygni during outburst (Kording et al. 2008), oneof the previously unique features of AE Aqr has been matched.The question still remains as to the universality of synchrotronemission from CVs. As shown by the results for low mass X-raybinaries (Migliari & Fender 2006; Gallo et al. 2007; Gelino et al.2010), the mid-infrared is an ideal bandpass in which to searchfor optically thin synchrotron emission.
In addition to the new observations of EX Hya, V1223 Sgr,and V603 Aql, we present archival Spitzer observations of SSCygni that show a weak mid-IR excess that we discuss in thecontext of the synchrotron jet detected for this system. Wedescribe these observations in the following section, where we
325

326 HARRISON ET AL. Vol. 710
Table 1Spitzer Observation Journal and Program Object Characteristics
Object Obs. Date U.T. Start LL2 LL1 Porb Pspin
(No. × Exp. Time) (No. × Exp. Time) (hr) (minutes)
V603 Aql 2008 Nov 13 04:49:54 30 × 121.9 s 30 × 121.9 s 3.32 61EX Hya 2009 Feb 21 18:18:27 30 × 121.9 s 30 × 121.9 s 1.64 67V1223 Sgr 2008 Nov 6 21:57:49 30 × 121.9 s 30 × 121.9 s 3.37 61
present new near-infrared spectra of V1223 Sgr, EX Hya, andPQ Gem, present the results for the Spitzer observations inSection 3, discuss these results in Section 4, and present ourconclusions in Section 5.
2. OBSERVATIONS
2.1. Spitzer Observations
The IRS on the Spitzer Space Telescope has been describedby Houck et al. (2004). The IRS provides spectra from 5.2 to38 μm at resolutions of R ∼ 90 and 600. The data for the IPspresented below were all obtained in the low-resolution mode.Because the signal-to-noise ratio (S/N) of the IRS spectra forV603 Aql, EX Hya, and V1223 Sgr were all rather low in ourfirst effort (we did not even detect V603 Aql beyond 14 μm), weincreased the total, on-source exposure times from 1200 s usedin the first epoch LL2 (14–21 μm) bandpass observations, to3657 s used here. In addition, we obtained new observations inthe LL1 (19.5–38 μm) bandpass, duplicating the LL2 exposuretimes for the three IPs. For each object, observations at two slitpositions were obtained so as to allow for proper sky subtraction.The observation log can be found in Table 1.
We extracted all of the spectra using the SPICE packageafter constructing median sky images that were subsequentlysubtracted off of the individual spectra. In the case of V1223 Sgr,for which we extract temporally resolved spectra, we performedthe additional process of applying a “rogue pixel mask” (usingb2_rmask_IRS56) to the data using the IDL software routine“IRSCLEAN”.4 This step helps eliminate spurious pixels in thedata that can impart emission or absorption features to low S/Nspectra.
As described later, we detected both EX Hya and V1223 Sgrin both the LL1 and LL2 spectra, including an apparent transientevent in the LL2 data of the latter object. We did not, however,detect V603 Aql even though it is visually brighter than eitherEX Hya or V1223 Sgr. The mid-IR background in the regionaround V603 Aql is very high, and thus we were unable toinvestigate its spectrum to the same low flux levels as the othertwo sources.
2.2. Near-infrared Spectra
In Paper I, we presented near-IR spectra for five of the 11IPs surveyed there. In order to present a fuller picture of thisclass of objects, we present similar spectra of three of the IPsin that paper for which we did not have data at that time: EXHya, V1223 Sgr, and PQ Gem. These data were obtained usingGNIRS5 on Gemini-south. GNIRS produces cross-dispersedspectra covering the J, H, and K bands, and we used the 0.′′3 slitand the 32 l mm−1 grating to produce a dispersion of R ≈ 3400
4 http://ssc.spitzer.caltech.edu/archanaly/contributed/irsclean/IRSCLEAN_MASK.html5 http://www.gemini.edu/sciops/instruments/gnirs
Table 2GNIRS Observation Journal
Object Obs. Date U.T. Start No. of Exposures Exp. Time (s)
V1223 Sgr 2007 Mar 29 07:52:52 24 122PQ Gem 2007 Mar 30 00:12:04 30 122EX Hya 2007 Mar 30 02:08:03 50 120
in the K band. These observations were obtained under the“poor weather” proposal GS-2007A-Q-70. The seeing was quitepoor (FWHM = 1.′′8) during these observations, but the skiesappeared to be photometric, as the fluxes of the individualspectra did not vary dramatically between exposures. A logof these observations is presented in Table 2. These data werereduced using IRAF, and tellurically corrected using A0V starsthat were observed shortly before, or after, the program object.After division by the A0V star, the spectra were multiplied bya model atmosphere spectrum of Vega in order to reduce theimpact of the H i absorption lines present in the telluric standardstar spectra.
These spectra are presented in Figure 1 and cover therange from 8200 Å to 2.5 μm in five spectral orders. Theplotted spectra have been truncated in regions (near the endsof the various orders) where the S/N was very poor. Roughestimates of the K-band magnitudes indicate that both PQ Gem(K ∼ 12.3), and V1223 Sgr (K ∼ 12.3) were at similarbrightness levels to the values listed in the Two Micron AllSky Survey (2MASS) catalog. EX Hya, however, was 2 magbrighter (K ∼ 9.5) than its 2MASS value. The AAVSOdatabase indicates that EX Hya was at the visual maximumof an outburst at the time of the GNIRS observations. Like theresults presented in Paper I, these spectra show no evidence forcyclotron emission in the covered wavelength interval. All ofthe prominent emission lines are due to H i and He i. All threeobjects have an emission line at 1.163 μm that we attribute toHe ii. EX Hya also shows evidence for He ii emission at 2.19 μm,but this line is blended with the broad H i Br γ emission line. Allthree objects have a weak emission line at 1.1755 μm that doesnot appear to be due to either hydrogen or helium. As noted inPaper I, in quiescence, the secondary star in EX Hya is visiblein the near-IR. As shown in Figure 1(a), even in the middleof an outburst, there is evidence for absorption from the watervapor features at 1.38 and 1.90 μm, as well as the Na i doubletat 2.2 μm.
3. RESULTS
For this second epoch of Spitzer observations, we obtaineddouble the exposure time of the original LL2 observations, andan identical amount of observation time in the LL1 bandpass ina hope to provide a higher S/N detection of the long-wavelengthspectra of the three IPs. Unfortunately, as noted above, we didnot detect V603 Aql in either bandpass due to a very high mid-infrared background. The galactic latitude of V603 Aql is onlyb = +0.◦8, and the IRAS maps show significant 25 and 60 μm

No. 1, 2010 ADDITIONAL SPITZER IRS SPECTROSCOPY OF THREE INTERMEDIATE POLARS 327
Figure 1. GNIRS spectra of EX Hya, V1223 Sgr, and PQ Gem. The spectrain the individual orders have been normalized for presentation purposes. Inaddition, we have added an inset into the K-band panel for EX Hya to show thatthe Na i doublet at 2.20 μm is clearly visible.
emission at this location. We did detect both EX Hya and V1223Sgr in both bands, and present those results here.
3.1. EX Hya
As noted in Paper I, EX Hya has the longest white dwarfspin period (Pspin = 67 minutes) of any of our program objects.In fact, the ratio of its spin period to the orbital period, Pspin/Porb = 0.68, is the largest of all of the conventional IPs (seethe tabulation by Norton et al. 2004). EX Hya also has a largeorbital inclination angle, i = 77◦ (Ritter & Kolb 2003), andthis is evident from the double peaked emission lines seen inthe near-IR spectrum shown in Figure 1(a). But the emissionline profiles change dramatically over an orbit. Our GNIRSdata spanned 1.5 orbital periods of EX Hya, and we show theevolution of the spectra in the K band over this time period inFigure 2. Belle et al. (2005) present the evolution of the lineprofiles of the optical H i lines over a full orbit of EX Hya, andthe behavior of those lines was remarkably similar to that of theinfrared line profiles.
In Paper I, we found a weak excess in the LL2 data for EXHya. We reproduce the observed SED of EX Hya in Figure 3.The black, filled circles in this diagram are the data fromPaper I. While the LL2 spectrum in the first epoch data wasclearly visible, the fluxes of the individual resolution elementsin the extracted spectrum had S/N ∼ 1. Thus, the spectrumwas rebinned into 1 μm wavelength intervals to produce thedata points in Figure 3. Superficially, the second epoch spectralooked to have a similar S/N, even though the exposure time
Figure 1. (Continued)
328 HARRISON ET AL. Vol. 710
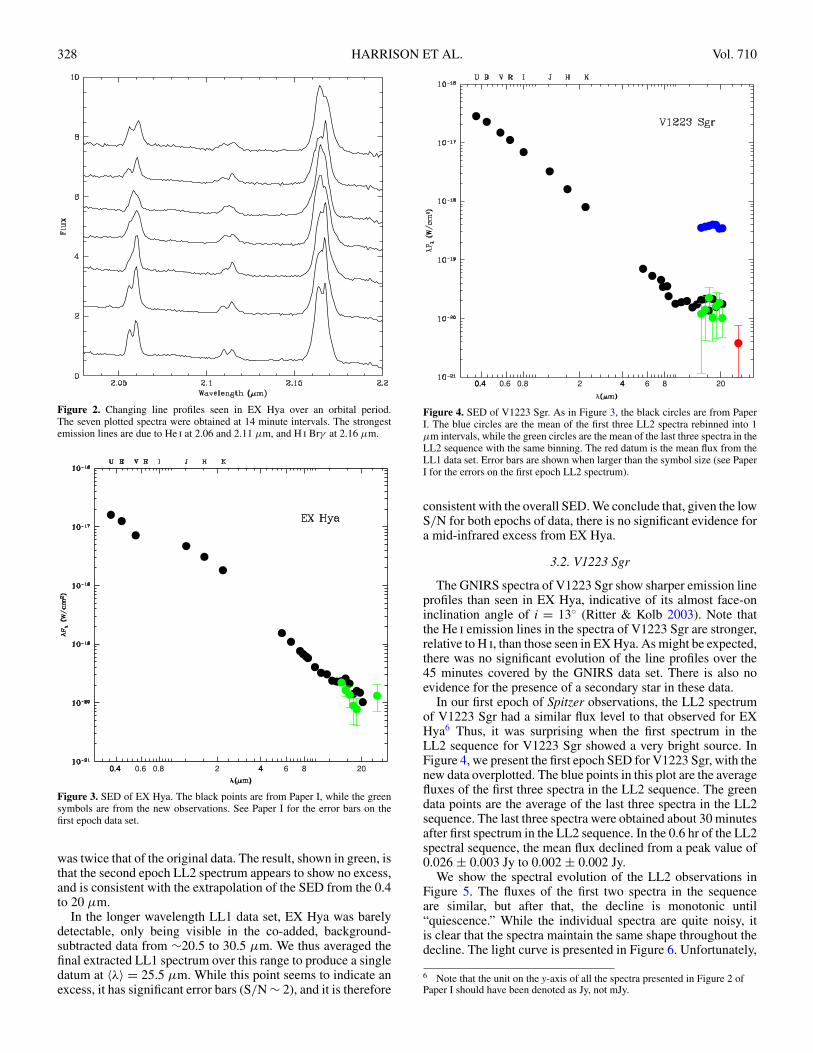
Figure 2. Changing line profiles seen in EX Hya over an orbital period.The seven plotted spectra were obtained at 14 minute intervals. The strongestemission lines are due to He i at 2.06 and 2.11 μm, and H i Brγ at 2.16 μm.
0.4 0.6 0.80.4 2 4 6 84 20
Figure 3. SED of EX Hya. The black points are from Paper I, while the greensymbols are from the new observations. See Paper I for the error bars on thefirst epoch data set.
was twice that of the original data. The result, shown in green, isthat the second epoch LL2 spectrum appears to show no excess,and is consistent with the extrapolation of the SED from the 0.4to 20 μm.
In the longer wavelength LL1 data set, EX Hya was barelydetectable, only being visible in the co-added, background-subtracted data from ∼20.5 to 30.5 μm. We thus averaged thefinal extracted LL1 spectrum over this range to produce a singledatum at 〈λ〉 = 25.5 μm. While this point seems to indicate anexcess, it has significant error bars (S/N ∼ 2), and it is therefore
0.4 0.6 0.80.4 2 4 6 84 20
Figure 4. SED of V1223 Sgr. As in Figure 3, the black circles are from PaperI. The blue circles are the mean of the first three LL2 spectra rebinned into 1μm intervals, while the green circles are the mean of the last three spectra in theLL2 sequence with the same binning. The red datum is the mean flux from theLL1 data set. Error bars are shown when larger than the symbol size (see PaperI for the errors on the first epoch LL2 spectrum).
consistent with the overall SED. We conclude that, given the lowS/N for both epochs of data, there is no significant evidence fora mid-infrared excess from EX Hya.
3.2. V1223 Sgr
The GNIRS spectra of V1223 Sgr show sharper emission lineprofiles than seen in EX Hya, indicative of its almost face-oninclination angle of i = 13◦ (Ritter & Kolb 2003). Note thatthe He i emission lines in the spectra of V1223 Sgr are stronger,relative to H i, than those seen in EX Hya. As might be expected,there was no significant evolution of the line profiles over the45 minutes covered by the GNIRS data set. There is also noevidence for the presence of a secondary star in these data.
In our first epoch of Spitzer observations, the LL2 spectrumof V1223 Sgr had a similar flux level to that observed for EXHya6 Thus, it was surprising when the first spectrum in theLL2 sequence for V1223 Sgr showed a very bright source. InFigure 4, we present the first epoch SED for V1223 Sgr, with thenew data overplotted. The blue points in this plot are the averagefluxes of the first three spectra in the LL2 sequence. The greendata points are the average of the last three spectra in the LL2sequence. The last three spectra were obtained about 30 minutesafter first spectrum in the LL2 sequence. In the 0.6 hr of the LL2spectral sequence, the mean flux declined from a peak value of0.026 ± 0.003 Jy to 0.002 ± 0.002 Jy.
We show the spectral evolution of the LL2 observations inFigure 5. The fluxes of the first two spectra in the sequenceare similar, but after that, the decline is monotonic until“quiescence.” While the individual spectra are quite noisy, itis clear that the spectra maintain the same shape throughout thedecline. The light curve is presented in Figure 6. Unfortunately,
6 Note that the unit on the y-axis of all the spectra presented in Figure 2 ofPaper I should have been denoted as Jy, not mJy.

No. 1, 2010 ADDITIONAL SPITZER IRS SPECTROSCOPY OF THREE INTERMEDIATE POLARS 329
14 16 18 200
0.01
0.02
0.03
Figure 5. Temporal evolution of the first six LL2 spectra, and the mean of thefinal three spectra. The spectra were obtained at 2.5 minute intervals. A least-squares fit to the third spectrum (red) is plotted, and then scaled to the sixthspectrum to demonstrate that the spectra maintained the same shape throughoutthe initial decline.
we did not capture the entire event, so we do not know the peakflux, but the similar fluxes of the first two spectra in the sequencemay indicate that these observations were close to the peak fluxof this event and, if true, suggests that it did not greatly exceed0.03 Jy.
By the time of the LL1 observations, V1223 Sgr had fadedto the point where it was almost undetectable. Like the dataset for EX Hya, we have produced an average flux for the LL1data, and this flux is consistent with a simple extension of theoptical/near-IR SED.
4. DISCUSSION
The inference from the first epoch Spitzer observations of EXHya and V1223 Sgr was that they had mid-infrared excessesbeyond 14 μm, similar in shape to that observed for the muchbrighter IP AE Aqr. Our second epoch observations do notconfirm the excess for EX Hya, suggesting that this object iseither slightly variable, or that the excess derived from the firstepoch observations was in error due to flux calibration issuesthat could arise for such a faint source. Due to a very highmid-infrared background, we were unable to detect V603 Aql.The second epoch observations of V1223 Sgr were far moreinteresting, in that we were fortunate enough to detect the declinefrom a “flare” from this source.
What was the nature of this event? If we take the averageof the last few LL2 spectra and call that quiescence, thenV1223 Sgr brightened by at least a factor of 13. As noted inHarrison et al. (2004), a visual flare of Δv = 1.2 mag was
Figure 6. Light curve of V1223 Sgr using the mean LL2 flux from eachindividual spectrum.
observed by van Amerongen & van Paradijs (1989), but thisappears to be the only “outburst” of this amplitude ever seenfor this object. The AAVSO light curve shows that V1223 Sgris usually found within ±0.5 mag of V = 13.0. Unfortunately,we do not have simultaneous AAVSO data at the epoch of theSpitzer observations. However, accretion disk events are mostdramatic in the optical and UV for CVs, and it strains credulitythat an event of this type could create a 2.8 mag change in themid-infrared (note the changing SED for SS Cyg, discussedbelow).
Given that the spectral slope of the LL2 data for V1223 Sgrand AE Aqr are identical, Fν ∝ ν−0.7, suggests that the bestexplanation for the flaring event from V1223 Sgr is opticallythin synchrotron emission. But before we make this leap, weinvestigate whether this flare could be consistent with free–freeemission, perhaps from some type of transient accretion diskwind. The Hubble Space Telescope parallax (Beuermann et al.2004) shows that V1223 Sgr is at a distance of 500 pc. Atthis distance, assuming an isotropic source, the differential LL2luminosity at the peak was L = 1.2 × 1032 erg s−1.
We estimate that the semimajor axis of the V1223 Sgr systemis 0.006 AU. If we assume that the accretion disk extends to60% of this radius, and we use a cylindrical volume with aheight equal 0.1 Rdisk, we get a volume of V ∼ 8 × 1031 cm3.Following the example of Kording et al. (2008), we will assumethat 10−8 M�, approximately one year of mass accretion for thissystem, is involved in this wind. This leads to a density of ne =2.6 × 10⁻⁷ cm−3. The total luminosity of this emitting volumeis Lff ≈ 8.7 × 10⁻⁷ erg s−1. As discussed by Kording et al.,to even get close to explaining the observed flux by free–freeemission will require collimation of the wind into very smallopening angles, while carrying the entire accreted mass. Such amodel is highly unrealistic.
The solution, of course, is evident by comparing the behaviorof V1223 Sgr to AE Aqr, an IP that has been shown to be asynchrotron source. For example, Dubus et al. (2004) show thatAE Aqr is highly variable in the mid-infrared at a level similar towhat we have found for V1223 Sgr. They found that at 17.5 μm(corresponding to the mean wavelength of the LL2 spectra),

330 HARRISON ET AL. Vol. 710
Figure 7. AAVSO light curve of SS Cyg during the time of the two Spitzerobservations (arrowed).
AE Aqr has an average flux of 26.8 mJy, though the peak fluxexceeded 40 mJy. We found that the mean flux for AE Aqr fromthe LL2 data presented in Paper I was 33 mJy. These values aresimilar to the peak flux observed for V1223 Sgr. The difference,of course, is that V1223 Sgr is five times more distant than AEAqr, and thus is much more luminous. Unfortunately, we do nothave sufficient wavelength coverage (compared to Dubus et al.2007) to more fully explore their similarities. We conclude thatthe best model to explain the Spitzer observations of V1223 Sgrare that they are due to the detection of optically thin synchrotronemission, presumably in a collimated outflow.
4.1. Spitzer and IRAS Observations of SS Cygni
With the radio detection of SS Cyg, and the proven capabili-ties of the IRS in detecting optically thin synchrotron emission,it is worthwhile to examine the mid-infrared data set for this sys-tem. Fortuitously, SS Cyg was observed with the IRS (PI: Fron-ing) on two separate occasions very close to the visual maximaof two successive outbursts (see Figure 7). We have extractedthe IRS low-resolution SL2 (5.2 μm � λ � 7.7 μm) and LL1data sets for both epochs and present those spectra in Figure 8.We also have extracted the higher resolution “SH” spectrum(9.9 μm � λ � 19.8 μm) for the first epoch. As shown in thefigure, the SL2 spectrum for JD2453559 has a much lower flux,and is inconsistent with the other IRS data sets. There appearedto be a tracking issue for this particular observation, as the re-sulting spectrum was dramatically broader than it should havebeen, and even with enlarging the extraction width in the SPICEprogram, we could not extract a spectrum with the correct flux.Both LL1 data sets appear to have identical fluxes and spectralshapes, and the SH data set for JD2453559 appears to smoothlytransition between the SL2 data set for JD2453592, and both ofthe LL1 spectra. Thus, the mid-IR spectra for both epochs werevery similar.
As shown in this figure, the outburst photometry (fromSzkody 1977) for SS Cyg can be fitted by a single temperature(10,500 K) blackbody (with AV = 0.12), from the U band
0.4 0.6 0.80.4 2 4 6 84 20 40
Figure 8. Spitzer IRS spectra of SS Cyg for JD2453559 (blue) and JD2453592(green). As noted in the text, there was an apparent tracking issue during theSL2 spectrum for JD2453559, and its flux is much lower than expected. Theblue and green filled circles correspond to the V-band magnitudes at the time ofthe Spitzer observations. The black star symbols are outburst UBV RI JHKLphotometry from Szkody (1977). These data have been fit by a reddened(AV = 0.12 mag) blackbody with Teff = 10,500 K. The black filled circlesare the quiescent photometry from Dubus et al. (2004), including the “flare”they observed at 11.6 μm. The red stars are the expected fluxes from a K5dwarf normalized to the K-band magnitude, with mid-infrared fluxes estimatedusing the Spitzer STAR-PET (http://ssc.spitzer.caltech.edu/tools/starpet/) tool.The open squares with error bars are the IRAS measurements from Jamesonet al. (1987).
through the L band. The quiescent photometry (from Dubuset al. 2004) is shown as filled black circles. As discussed inHarrison et al. (2007), the quiescent SED is dominated by theK5 secondary star from I through K, but shows a weak excessbeyond 3 μm. They modeled this excess with an optically thinbremsstrahlung component. Note that Dubus et al. also observedhighly variable 11.7 μm emission from SS Cyg, the peak fluxof which is also plotted in Figure 8. If one adds the quiescentK star SED to the 10,500 K blackbody model, the IRS datacan be explained, and there is no evidence for an excess in themid-IR spectra. Obviously, the fit of such a model depends onhow well this hot blackbody represents the outburst fluxes inthe mid-infrared, and its actual normalization at the time of theSpitzer observations.
Also plotted in Figure 8 is the average of the IRAS detectionsof SS Cyg from Jameson et al. (1987). As demonstrated in theirFigure 1, the IRAS detections of SS Cyg took place earlier in theoutburst than the Spitzer observations presented above, and moreclosely correspond to the period in the outburst where the peakradio flux was observed by Kording et al. (2008). Jameson et al.invoked a dust shell model to explain the IRAS detections, as
No. 1, 2010 ADDITIONAL SPITZER IRS SPECTROSCOPY OF THREE INTERMEDIATE POLARS 331
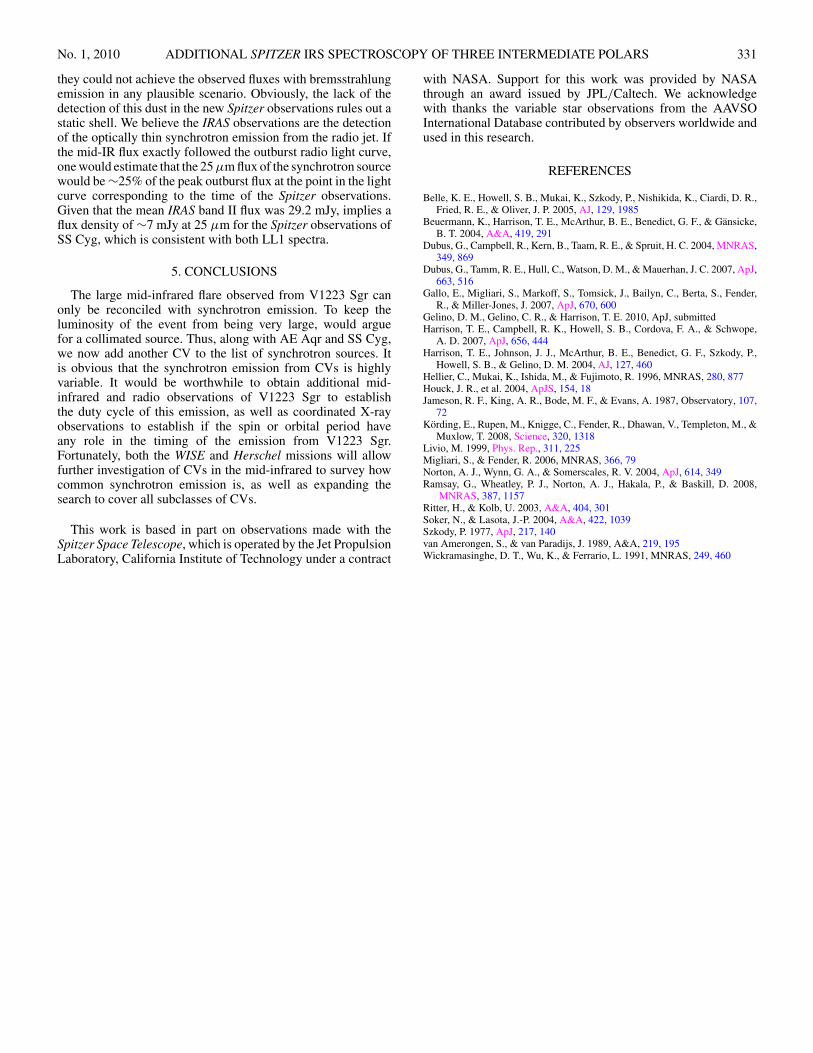
they could not achieve the observed fluxes with bremsstrahlungemission in any plausible scenario. Obviously, the lack of thedetection of this dust in the new Spitzer observations rules out astatic shell. We believe the IRAS observations are the detectionof the optically thin synchrotron emission from the radio jet. Ifthe mid-IR flux exactly followed the outburst radio light curve,one would estimate that the 25 μm flux of the synchrotron sourcewould be ∼25% of the peak outburst flux at the point in the lightcurve corresponding to the time of the Spitzer observations.Given that the mean IRAS band II flux was 29.2 mJy, implies aflux density of ∼7 mJy at 25 μm for the Spitzer observations ofSS Cyg, which is consistent with both LL1 spectra.
5. CONCLUSIONS
The large mid-infrared flare observed from V1223 Sgr canonly be reconciled with synchrotron emission. To keep theluminosity of the event from being very large, would arguefor a collimated source. Thus, along with AE Aqr and SS Cyg,we now add another CV to the list of synchrotron sources. Itis obvious that the synchrotron emission from CVs is highlyvariable. It would be worthwhile to obtain additional mid-infrared and radio observations of V1223 Sgr to establishthe duty cycle of this emission, as well as coordinated X-rayobservations to establish if the spin or orbital period haveany role in the timing of the emission from V1223 Sgr.Fortunately, both the WISE and Herschel missions will allowfurther investigation of CVs in the mid-infrared to survey howcommon synchrotron emission is, as well as expanding thesearch to cover all subclasses of CVs.
This work is based in part on observations made with theSpitzer Space Telescope, which is operated by the Jet PropulsionLaboratory, California Institute of Technology under a contract
with NASA. Support for this work was provided by NASAthrough an award issued by JPL/Caltech. We acknowledgewith thanks the variable star observations from the AAVSOInternational Database contributed by observers worldwide andused in this research.
REFERENCES
Belle, K. E., Howell, S. B., Mukai, K., Szkody, P., Nishikida, K., Ciardi, D. R.,Fried, R. E., & Oliver, J. P. 2005, AJ, 129, 1985
Beuermann, K., Harrison, T. E., McArthur, B. E., Benedict, G. F., & Gansicke,B. T. 2004, A&A, 419, 291
Dubus, G., Campbell, R., Kern, B., Taam, R. E., & Spruit, H. C. 2004, MNRAS,349, 869
Dubus, G., Tamm, R. E., Hull, C., Watson, D. M., & Mauerhan, J. C. 2007, ApJ,663, 516
Gallo, E., Migliari, S., Markoff, S., Tomsick, J., Bailyn, C., Berta, S., Fender,R., & Miller-Jones, J. 2007, ApJ, 670, 600
Gelino, D. M., Gelino, C. R., & Harrison, T. E. 2010, ApJ, submittedHarrison, T. E., Campbell, R. K., Howell, S. B., Cordova, F. A., & Schwope,
A. D. 2007, ApJ, 656, 444Harrison, T. E., Johnson, J. J., McArthur, B. E., Benedict, G. F., Szkody, P.,
Howell, S. B., & Gelino, D. M. 2004, AJ, 127, 460Hellier, C., Mukai, K., Ishida, M., & Fujimoto, R. 1996, MNRAS, 280, 877Houck, J. R., et al. 2004, ApJS, 154, 18Jameson, R. F., King, A. R., Bode, M. F., & Evans, A. 1987, Observatory, 107,
72Kording, E., Rupen, M., Knigge, C., Fender, R., Dhawan, V., Templeton, M., &
Muxlow, T. 2008, Science, 320, 1318Livio, M. 1999, Phys. Rep., 311, 225Migliari, S., & Fender, R. 2006, MNRAS, 366, 79Norton, A. J., Wynn, G. A., & Somerscales, R. V. 2004, ApJ, 614, 349Ramsay, G., Wheatley, P. J., Norton, A. J., Hakala, P., & Baskill, D. 2008,
MNRAS, 387, 1157Ritter, H., & Kolb, U. 2003, A&A, 404, 301Soker, N., & Lasota, J.-P. 2004, A&A, 422, 1039Szkody, P. 1977, ApJ, 217, 140van Amerongen, S., & van Paradijs, J. 1989, A&A, 219, 195Wickramasinghe, D. T., Wu, K., & Ferrario, L. 1991, MNRAS, 249, 460