
ADDITION OF HYDROGEN TO GASOLINE-FUELLED 4 STROKE SI …umpir.ump.edu.my/id/eprint/1107/4/MOHD ASWAD...
84
ADDITION OF HYDROGEN TO GASOLINE-FUELLED 4 STROKE SI ENGINE USING 1-DIMENSIONAL ANALYSIS MOHD ASWAD BIN ABD WAHAB Thesis submitted in fulfilment of the requirements for the award of the degree of Bachelor of Mechanical Engineering Faculty of Mechanical Engineering UNIVERSITI MALAYSIA PAHANG NOVEMBER 2009
Transcript of ADDITION OF HYDROGEN TO GASOLINE-FUELLED 4 STROKE SI …umpir.ump.edu.my/id/eprint/1107/4/MOHD ASWAD...

ADDITION OF HYDROGEN TO GASOLINE-FUELLED 4 STROKE SI ENGINE USING 1-DIMENSIONAL ANALYSIS
MOHD ASWAD BIN ABD WAHAB
Thesis submitted in fulfilment of the requirements for the award of the degree of
Bachelor of Mechanical Engineering
Faculty of Mechanical Engineering UNIVERSITI MALAYSIA PAHANG
NOVEMBER 2009
2
SUPERVISOR’S DECLARATION
I hereby declare that I have checked this project and in my opinion, this project is
adequate in terms of scope and quality for the award of the degree of Bachelor of
Mechanical Engineering.
Signature:
Name of Supervisor: Muhamad Mat Noor
Position:Lecturer
Date: 24 November 2009

3
STUDENT’S DECLARATION
I hereby declare that the work in this project is my own except for quotations and
summaries which have been duly acknowledged. The project has not been accepted for
any degree and is not concurently submitted for award of other degree.
Signature:
Name: Mohd Aswad Bin Abd Wahab
ID Number: MA 06064
Date: 24 November 2009

4
Dedicate to my beloved dad,lovely mom and my honour siblings
5
ACKNOWLEDGEMENTS
First and foremost, grateful to Allah SWT for making it possible for me to complete this project on time. It is pleasure to acknowledge the help and support of everyone concerned with this project. To my father, mother and brothers who have been so keen in helping and encouraging me during the several months it took me to complete this thesis.
I would like to thank and express my deepest appreciation to my supervisor, Mr. Muhamad bin Mat Noor for providing me opportunity for his helpful reviews, comments and suggestion during the progression of this project. I am truly grateful for his progressive vision about my training in science, his tolerance of my naïve mistakes, and his commitment to my future career. I also sincerely thanks for the time spent proofreading and correcting my many mistakes. Finally, My sincere thanks go to my friends Mr. Amirul Amir and Mr. Adzahari, members of the staff of the Mechanical Engineering Department, UMP : Mr. Fadzil bin Abdul Rahim and Mr Aguk that help me a lot in GT-Power learning process and guide.

6
ABSTRACT
This thesis was about simulation analysis on 4 stroke single cylinder engine by 1-Dimensional software. Objective of this thesis is to investigate the effect of NOx emission when hydrogen addition is added to the engine and relation between hydrogen addition and cylinder temperatures. Through these objectives, result of the project can obtain by using 1-Dimensional analysis software. GT-Power software is 1-Dimensional analysis software used in this project. GT-Power was used to develop a baseline design engine in order to do a simulation for 4 stroke single cylinder engine. Air-fuel ratios for hydrogen-gasoline mixture are calculated to get the stoichiometric for mixture. In this thesis, air-fuel ratio is used as parameters in GT-Power software. Default parameter in the GT-Power software was used as an engine parameter in this thesis. The ratio of hydrogen-gasoline fuel also must be change at SI-inject which is intake valve in GT-Power software. With using default parameter from GT-Power software, a baseline design engine can be developed before run the simulations. After finish the simulation, the results are plotted by using Microsoft Excel. There are many result can be obtained by using GT-Power software but for this simulation, result of NOx emission and temperature are to be consider in this project. These 2 analyses were performed at 3 different engine speeds which are 1000 rpm, 3000 rpm and 5000 rpm, and at 10 until 20 air-fuel ratio. The result shown NOx emissions increased with the increase of hydrogen addition due to the raised cylinder temperature.

7
ABSTRAK
Tesis ini adalah tentang analisis simulasi pada enjin 4 lejang, satu silinder oleh perisian 1-Dimensi. Objektif dari tesis ini adalah untuk meneliti kesan daripada emisi NOx ketika Selain hidrogen ditambah kepada enjin dan hubungan antara penambahan hidrogen dan suhu silinder. Melalui matlamat ini, hasil daripada projek boleh memperoleh dengan menggunakan analisis perisian 1-Dimensi. GT-Power perisian adalah 1-Dimensional perisian analisis yang digunakan dalam projek ini. GT-Power digunakan untuk membangunkan rekaan asas enjin sebelum simulasi dilakukan terhadap enjin 4 lejang, satu silinder. Nisbah udara-bahan bakar untuk campuran hidrogen-petrol dikira untuk mendapatkan stoikiometrik untuk campuran. Dalam tesis ini, nisbah udara-bahan api digunakan sebagai parameter dalam GT-Power perisian. Default parameter dari perisian GT-Power digunakan sebagai peramter enjin dalam tesis ini. Nisbah bahan bakar hidrogen-petrol juga harus diubah pada SI-Inject iaitu injap intake dalam perisian GT-Power. Dengan menggunakan parameter daripada perisian GT-Power , sebuah dasar enjin dapat dibangunkan sebelum simulasi dijalankan. Setelah selesai simulasi, hasilnya diplot dengan menggunakan Microsoft Excel. Ada banyak keputusan boleh diperolehi dengan menggunakan GT-Power perisian namun untuk simulasi ini, hasil daripada emisi NOx dan suhu harus dipertimbangkan dalam projek ini. 2 analisis ini dilakukan pada 3 kelajuan enjin yang berbeza adalah 1000 rpm, 3000 rpm dan 5000 rpm, dan pada 10 hingga 20 nisbah udara-bahan api. Keputusannya menunjukkan bahawa emisi NOx meningkat dengan pertambahan hydrogen disebabkan meningkatnya suhu didalam silinder.
8
TABLE OF CONTENTS
Page
SUPERVISOR’S DECLARATION ii
STUDENT’S DECLARATION iii
ACKNOWLEDGEMENTS v
ABSTRACT vi
ABSTRAK vii
TABLE OF CONTENTS viii
LIST OF TABLES xi
LIST OF FIGURES xii
LIST OF SYMBOLS xii
LIST OF NOMENCLATURE xii
LIST OF ABBREVIATIONS xiv
CHAPTER 1 INTRODUCTION
1.1 Project Background 1
1.1.1 Internal Combustion Engine 1
1.1.2 4 Stroke Engine 2
1.1.3 Spark Ignition 3
1.1.4 Fuel Injection 4
1.2 Problem Statement 4
1.3 Objectives of Study 5
1.4
1.5
1.6
Scopes of Study
Project Purpose
Project’s Aim
5
5
5
CHAPTER 2 LITERATURE REVIEW
2.1 Introduction 6
2.2 Application of hydrogen on conventional engine 6
9
2.2.1 Hydrogen Application in S.I Engines 7
2.3
2.4
Properties Of Hydrogen
Hydrogen As Dedicated Fuel
8
11
2.5 Advantage Of Using Hydrogen As Fuel
2.5.1 Disdvantage Of Using Hydrogen As Fuel
12
12
2.6 Previous Research 13
2.6.1 Past research involving hydrogen addition to gasoline engine 13
2.6.2 Addition of hydrogen on gasoline fuelled SI engine 16
2.7 NOx Emission 17
2.8 Comparison the combustion between the gasoline and hydrogen 18
2.8.1 Introduction 18
2.8.2 Chemical Bonding Energies 19
2.8.3 Comparison of Energies Released by Gasoline Combustion
and by Hydrogen Fuel Cells
20
2.8.4 Comparison of Water Produced by Gasoline Combustion
and by Hydrogen Fuel Cells
21
2.8.5 The Significance of the Large Water Ratio for Hydrogen Fuel
Cells Compared to Gasoline Combustion
21
2.9 1-DIMENSIONAL ANALYSIS 22
2.9.1 Design of Experiments 22
CHAPTER 3 RESEARCH METHODOLOGY
3.1 Introduction 24
3.2
3.3
3.4
Project Flow Chart
Numerical Flow Analysis
Measuring The Engine Parameter
25
26
27
3.5 Develop GT-Power Model 28
3.6 Mapping the engine in 1-D 30
3.6.1 Basic 4 stroke single cylinder model(Gasoline Fuel) 30
3.7 Simulation On Gasoline Engine 33
3.8 Simulation on Gasoline engine with addition of hydrogen fuel 37

10
3.9 Interpreting Data 41
CHAPTER 4 RESULTS AND DISCUSSION
4.1 Introduction 42
4.2 Result 42
4.2.1 At 1000 RPM(low engine speed) 42
4.2.2 At 3000 RPM(medium engine speed) 47
4.2.3 At 5000 RPM(high engine speed) 51
4.3 Discussion 55
4.3.1 Effect of NOx emission on Air-Fuel Ratio 55
4.3.2 Effect of NOx emission on Cylinder Temperature 56
CHAPTER 5 CONCLUSION AND RECOMMENDATIONS
5.1 Introduction 57
5.2 Conclusion 57
5.3 Recommendation 58
REFERENCES 59
APPENDICES
A1-A7 Figures 61
B1-B4 Calculation Table 66
C1-C2 Gantt Chart FYP 68

11
LIST OF TABLES
Tables No. Title Page 2.1 Listing of hydrogen properties along with methane, propane and
gasoline for comparison 16
2.2 Following energies of carbon bonds 19 2.3 Other bond energies 19 2.4 Gasoline combustion and bond energy 20 2.5 Bond energy table 20 2.6 The ratio of water produced to fuel mass for the two cases 21
3.1 Cylinder Geometric 28 3.2 Port/Runner geometrics 28 3.3 Int/Exh Valve geometrics 28 4.1 Data distribution for 0% hydrogen addition (1000 rpm) 41 4.2 Data distribution for 5% hydrogen addition (1000 rpm) 42 4.3 Data distribution for 10% hydrogen addition (1000 rpm) 42 4.4 Data distribution for 15% hydrogen addition (1000 rpm) 42 4.5 Data distribution for 20% hydrogen addition (1000 rpm) 43 4.6 Data distribution for 0% hydrogen addition (3000 rpm) 46 4.7 Data distribution for 5% hydrogen addition (3000 rpm) 46 4.8 Data distribution for 10% hydrogen addition (3000 rpm) 46 4.9 Data distribution for 15% hydrogen addition (3000 rpm) 47 4.10 Data distribution for 20% hydrogen addition (3000 rpm) 47
12
4.11 Data distribution for 0% hydrogen addition (5000 rpm) 50 4.12 Data distribution for 5% hydrogen addition (5000 rpm) 50 4.13 Data distribution for 10% hydrogen addition (5000 rpm) 51 4.14 Data distribution for 15% hydrogen addition (5000 rpm) 51 4.15 Data distribution for 20% hydrogen addition (5000 rpm) 51
LIST OF FIGURES
Figure No. Title Page 1.1 Cross-section view 4 stroke engine 3 3.1 Cylinder Head 26 3.2 Cylinder Blocks 26 3.3 GT-Power mapping for 4 stroke engine 29 3.4 EngCylNOx reference 32 3.5 NOx reference object 33 3.6 Cylinder part comb 33 3.7 NOx mass fraction (burned) 34 3.8 Sensor edit 34 3.9 Run Simulation button 35 3.10 Running of the 1-D Simulation 35 3.11 Open GT-Post button 36 3.12 Air-Fuel Ratio 38 3.13 AFR as a parameter 38 3.14 H2-Vapor 39

13
3.15 Indolene(gasoline) vapor properties 39 4.1 NOx concentration vs AFR(1000 rpm) 43 4.2 NOx concentration vs equivalent ratio(1000 rpm) 43 4.3 Figure 4.3: Cylinder temperature vs AFR(1000 rpm) 44 4.4 NOx concentration vs AFR(3000 rpm) 46 4.5 NOx concentration vs equivalent ratio(3000 rpm) 47 4.6 Cylinder temperature vs AFR(3000 rpm) 47 4.7 NOx concentration vs AFR(5000 rpm) 50 4.8 NOx concentration vs equivalent ratio(5000 rpm) 50 4.9 Cylinder temperature vs AFR(5000rpm) 51
LIST OF SYMBOLS
Φ Equivalent ratio > More than < Less than
LIST OF NOMENCLATURE
CH4 Methane C3H8 Propane C8H18 Gasoline CO2 Carbon dioxide CO Carbon oxide
14
NOX Nitrogen Oxides N2 Nitrogen
LIST OF ABBREVEATIONS
AFR Air-Fuel ratio
BMEP Brake mean effective pressure
CFD Computational Fluid Dynamics
Deg C Degree Celcius
DOE Design of experiment
EGR Exhaust gas circulation
Env Environment
Exvalve Exhaust valve
Exhport Exhaust port
Exhrunner Exhaust runner
FProp Gas Fluid properties gas
FPropLiqIncom
p
Fluid properties liquid incompressible
FKM Fakulti Kejuruteraan Mekanikal
H2 Hydrogen
HC Hydro Carbon
ICE Internal Combustion Engine
Intrunner Intake runner
Ign Ignore
Intvalve Intake valve
Intport Intake port
PPM Parts per million
SI Spark ignition

15
Vap Vapor

16
CHAPTER 1
INTRODUCTION
1.1 PROJECT BACKGROUND
1.1.1 Internal Combustion Engine
The Internal Combustion Engine (ICE) is a heat engine that converts chemical
energy in a fuel into mechanical energy, usually made available on rotating output shaft.
Chemical energy of the fuel is the first converted to thermal energy by mean of
combustion or oxidataion with air inside the engine. The thermal energy raises the
temperature and pressure of the gas within the engine, and the high pressure gas then
expands against the mechanical mechanism of the engine. This expansions is converted
by mechanical linkage of the engines to rotating crankshaft, which is the output of the
engine. The crankshaft, in turn is connected to transmission and power train to transmit
the rotating mechanical energy to the desire final use. For engines this will often be the
propulsion of a vehicle (Williard W. Pulkrabek, 2004).
Most Internal Combustion Engine are reciprocating engines having piston and
reciprocate back and forth in cylinder internally within the engine. Reciprocating
engines can have one cylinder or many, up to 20 or more. The cylinder can be arranged
in many different geomatric configurations (Williard W. Pulkrabek, 2004).
The term internal combustion engine usually refers to an engine in which
combustion is intermittent, such as the more familiar four-stroke and two-stroke piston
engines, along with variants, such as the Wankel rotary engine. A second class of
internal combustion engines use continuous combustion: gas turbines, jet engines and

17
most rocket engines, each of which are internal combustion engines on the same
principle .
The internal combustion engine (or ICE) is quite different from external
combustion engines, such as steam or Stirling engines, in which the energy is delivered
to a working fluid not consisting of, mixed with or contaminated by combustion
products. Working fluids can be air, hot water, pressurised water or even liquid sodium,
heated in some kind of boiler by fossil fuel, wood-burning, nuclear, solar etc .
1.1.2 4 Stroke Engine
The four stroke internal combustion engines has to do 4 things to complete one
cycle. The four stroke internal combustion engine which uses petrol as the burning fuel
is known as four stroke petrol engine. The fuel actually used in the engine is the mixture
of petrol and air (oxygen, used to ignite petrol).Four stroke engine includes the
following strokes;
1. Intake or Suction Stroke
The piston starts at TDC, the intake valve opens and the piston moves down to
let the engine to take in a cylinder-full of fuel (mixture of air and petrol). This is the
intake stroke. Only the tiniest drop of gasoline needs to be mixed into the air for this to
work. The piston is connected to crankshaft with the help of connecting rod. This
crankshaft is further transforms the mechanical work into desired output.
2. Compression Stroke
Then in the compression stroke the piston moves back up to the extreme top
position which compress the fuel (air + petrol mixture). The use or benefit of
compression is to make the explosion more powerful. This stroke increases the
temperature of fuel which
produces large amount of heat during ignition
18
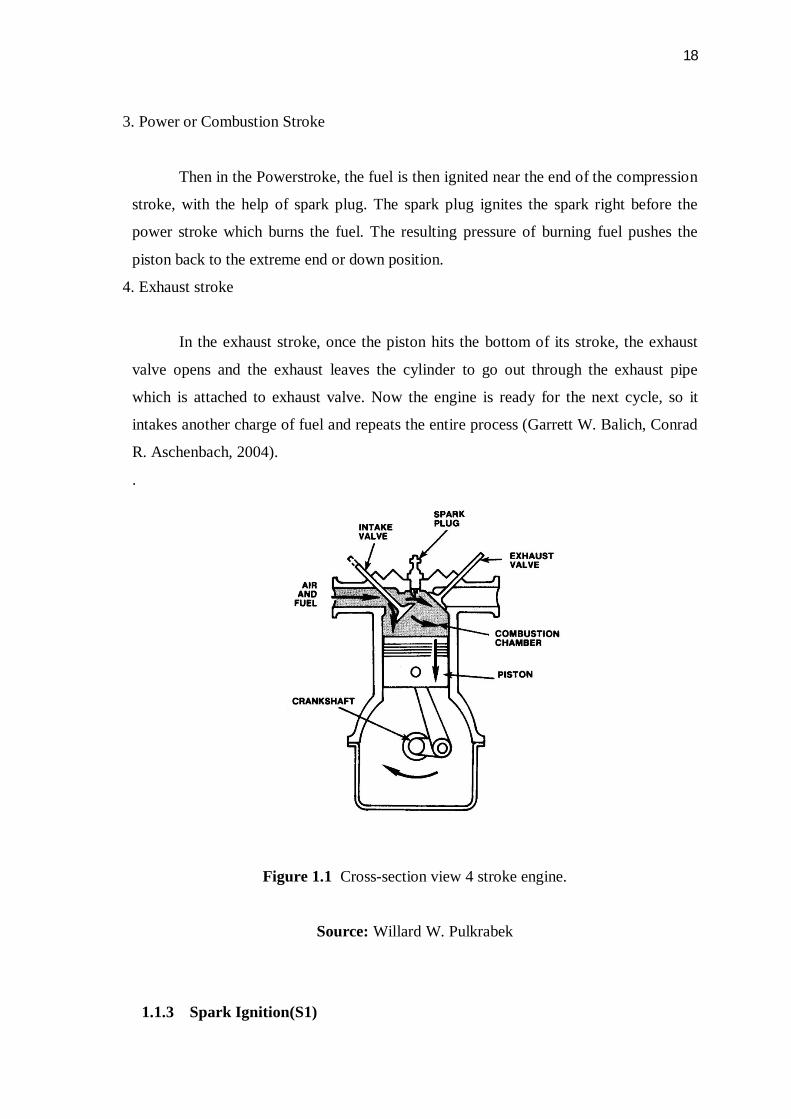
3. Power or Combustion Stroke
Then in the Powerstroke, the fuel is then ignited near the end of the compression
stroke, with the help of spark plug. The spark plug ignites the spark right before the
power stroke which burns the fuel. The resulting pressure of burning fuel pushes the
piston back to the extreme end or down position.
4. Exhaust stroke
In the exhaust stroke, once the piston hits the bottom of its stroke, the exhaust
valve opens and the exhaust leaves the cylinder to go out through the exhaust pipe
which is attached to exhaust valve. Now the engine is ready for the next cycle, so it
intakes another charge of fuel and repeats the entire process (Garrett W. Balich, Conrad
R. Aschenbach, 2004).
.
Figure 1.1 Cross-section view 4 stroke engine.
Source: Willard W. Pulkrabek
1.1.3 Spark Ignition(S1)
19
An SI engine starts the combustion process in each cycle by use of spark plug. The
spark plug gives a high-voltage electrical discharge between two electrodes which ignites
the air- fuel mixture in the combustion chamber surrounding the plug. In early engine
development, before the invention of the electric spark plug, many forms of torch holes
were used to initiate combustion from an external flame (John B. Heywood, 1988).
1.1.4 Fuel Injection
Fuel injection systems work by delivering a metered air and fuel mixture to the
engine for combustion. The incoming air is controlled through a throttle body, usually
controlled with butterfly valves. The incoming air is then metered through a sensing
device and an appropriate mass of fuel is added to the air stream through an electrically
controlled injector.
Similarly to the carburetor, the most important task of the modern fuel injection
system is to deliver a stoichiometric mixture of fuel and air to the engine for
combustion, This stoichiometric mixture is achieved by electronically controlling the
timing of the injectors from the start to the end of fuel injection, which combat the
various needs of the engine operation under varying conditions. To achieve the
necessary symmetry in the electronic fuel injection system, the fuel must be delivered to
the system continuously and reliably without pulsation at a controlled constant pressure
with a fuel pump. The fuel must be closely metered and delivered in an atomized form
into the engine manifold through injectors without liquid fuel entering the manifold.
And lastly, a multitude of sensors for monitoring the environmental and engine
conditions must be able to send accurate information to an engine management
computer which must accurately run the whole fuel injection system (Garrett W. Balich,
Conrad R. Aschenbach, 2004).
1.2 PROBLEM STATEMENT
Air pollutants cause health problems and smog. As concerns over how emissions
from mobile sources affect the environment and human health, and the supply of

20
conventional fuel diminishes, researchers are constantly striving towards developing
more efficient combustion while decreasing emissions. Hydrogen has an attractive
properties which is clean and renewable. As a result, it has been used as a fuel in
internal combustion engines, fuel cells and as an additive to conventional fuels such as
gasoline or methane (T. D’Andrea, P.F. Henshaw, D.S.-K. Ting, 2004).
1.3– OBJECTIVE PROJECT
Objectives of this project:
1) To investigate effect of hydrogen addition to gasoline fuel on NOx emission of
4stroke SI engine based on GT-Power simulation.
2) To assess the influence of hydrogen addition to the cylinder temperature.
1.4– PROJECT SCOPE
Scopes of this project:
1) Study about 4 stroke single cylinders Spark Ignition engine.
2) 1-Dimensional analysis for 4 stroke engine based on GT-Power software.
3) Simulation engine using default parameter from tutorial.
4) Investigate on NOx emission when hydrogen are added to gasoline fuel
5) Investigate on NOx concentration and temperature to Air-Fuel Ratio and
equivalent ratio
6) Run the simulation at 3 different engine speeds.
1.5 PROJECT PURPOSE
The purpose of this research is to investigate the effect of hydrogen addition on
combustion and emissions when added to a gasoline-fuelled SI engine based on GT-
Power software.
1.6 PROJECT’S AIM
This thesis should work well and will finish on time. The knowledge from this
project supposedly can be applied when practical soon for next semester.

21
CHAPTER 2
2.1 INTRODUCTION
Combustion of fossil fuels has caused serious problems to the environment and
the geopolitical climate of the world. The main negative effects on the environment by
Fossil fuel combustion are emissions of NOx, CO, CO2, and unburned hydrocarbons.
The main negative effect of burning fossil fuel on the geopolitical climate is the lack in
supply of these fuels and the effect pollution has on politics. There are several possible
solutions to alleviate the problems of using fossil fuels, but most of them would require
years of further development and additional infrastructure. This method involves
burning hydrogen gas along with hydrocarbon fuels in engines. The principle of this
mode of combustion is to add a percentage of hydrogen gas to the combustion reactions
of either compression or spark ignition engines. The addition of hydrogen has been
shown to decrease the formation of NOx, CO and unburned hydrocarbons. Studies have
shown that added hydrogen in percentages as low as 5-10% percent of the hydrocarbon
fuel can reduce that hydrocarbon fuel consumption. The theory behind this concept is
that the addition of hydrogen can extend the lean operation limit, improve the lean burn
ability, and decrease burn duration. (Jacob Wall, 2008).
2.2 APPLICATION OF HYDROGEN ON CONVENTIONAL ENGINE
As a promising fuel, H2 can be used in traditional internal combustion engine,
gas turbine and also the innovative fuel cell. Among these, operation of the most fuel
cells requires pure H2. The presence of other components such as CO could deactivate
significantly the catalyst of fuel cells and reduce significantly the service life. Such an

22
excessively demanding requirement for high purity H2 makes the operation of hydrogen
fuel cells economically uncompetitive though high thermal efficiency could be achieved
without formation of pollutant. In comparison to fuel cells, internal combustion engine
can burn almost any low purity H2 even with the presence of quiet a large amount of
diluents. For example, the reformed gas containing mainly H2 with the presence of CO,
CO2, H2O and N2, has been demonstrated as a good fuel showing H2-like desirable
combustion properties. The application of H2 or its mixtures with traditional fuels offers
also opportunity of optimizing engine performance and reducing exhaust emissions.
Considering the significant difference of spark ignition gasoline engine and
compression ignition diesel engine, the H2 application in these engines has been
reviewed, respectively (Das, L.M, 1990) .
2.2.1 Hydrogen Application in S.I Engines
Most of the past research on H2 as a fuel focused on its application in S.I.
engines. It has long been recognized as a fuel having some unique and highly desirable
properties, such as low ignition energy, and very fast flame propagation speed, wide
operational range. H2 has also been demonstrated being able to supporting a
propagating flame at extremely lean mixture, which is a very attractive property of H2
as S.I. engine fuel. The extensive research pure H2 as fuel has led to the development
and successful marketing of hydrogen engine. For example, Ford developed P2000
hydrogen engine, which was used to power Ford’s E-450 Shuttle Bus (Li, H.L, Karim,
G.A, 2005). BMW developed a 6 liter, V-12 engine using liquid H2 as fuel. With an
external mixture formation system, this engine has a power out about 170 kW and an
engine torque of 340 N.m. Most of the research associated with H2 application in S.I.
engines focused on its substitution to gasoline, which is called H2 enriching process.
The extensive researches in this area have demonstrated that H2 enriching help to
improve the performance of S.I. engine for the following reasons: (1) Enhancing the
flame propagation rate: the propagation rate of H2 flame is about 4 times that of
traditional fuels. The addition of hydrogen to traditional fuel was shown to enhance the
flame propagation rate; (2) Expended lean operational region: the past experiments have
demonstrated the super capability of H2 in supporting flame propagation at very lean
mixture. The addition of H2 to traditional fuels has been show to expend the operational

23
region toward the leaner mixture, which is very important to obtain extremely low NOx
emissions; (3) Improving combustion stability (less cycle to cycle variation ) and
enhancing combustion efficiency with reduced emissions of CO and HC. Detailed
information can be found in the literature (White C.M., Steeper, R.R., and Lutz, A.E,
2006)
2.3 PROPERTIES OF HYDROGEN
The properties of hydrogen are detailed in Section 1. The properties that
contribute to its use as a combustible fuel are its:
• wide range of flammability
• low ignition energy
• small quenching distance
• high autoignition temperature
• high flame speed at stoichiometric ratios
• high diffusivity
• very low density
Wide Range of Flammability
Hydrogen has a wide flammability range in comparison with all other fuels. As a
result, hydrogen can be combusted in an internal combustion engine over a wide range
of fuel-air mix-tures. A significant advantage of this is that hydrogen can run on a lean
mixture. A lean mixture is one in which the amount of fuel is less than the theoretical,
stoichiometric or chemically ideal amount needed for combustion with a given amount
of air. This is why it is fairly easy to get an engine to start on hydrogen.

24
Generally, fuel economy is greater and the combustion reac-tion is more complete when
a vehicle is run on a lean mix-ture. Additionally, the final combustion temperature is
generally lower, reducing the amount of pollutants, such as nitrogen oxides, emitted in
the exhaust. There is a limit to how lean the engine can be run, as lean operation can
sig-nificantly reduce the power output due to a reduction in the volumetric heating value
of the air/fuel mixture.
Low Ignition Energy
Hydrogen has very low ignition energy. The amount of energy needed to ignite
hydrogen is about one order of magnitude less than that required for gasoline. This
enables hydrogen engines to ignite lean mixtures and ensures prompt ignition.
Unfortunately, the low ignition energy means that hot gases and hot spots on the
cylinder can serve as sources of igni-tion, creating problems of premature ignition and
flashback. Preventing this is one of the challenges associated with run-ning an engine
on hydrogen. The wide flammability range of hydrogen means that almost any mixture
can be ignited by a hot spot.
Small Quenching Distance
Hydrogen has a small quenching distance, smaller than gasoline. Consequently,
hydrogen flames travel closer to the cylinder wall than other fuels before they
extinguish. Thus, it is more difficult to quench a hydrogen flame than a gasoline flame.
The smaller quenching distance can also increase the tendency for backfire since the
flame from a hydrogen-air mixture more readily passes a nearly closed intake valve,
than a hydrocarbon-air flame.
High Autoignition Temperature
Hydrogen has a relatively high autoignition temperature. This has important
implications when a hydrogen-air mix-ture is compressed. In fact, the autoignition
temperature is an important factor in determining what compression ratio an engine can
use, since the temperature rise during com-pression is related to the compression ratio.
The temperature rise is shown by the equation:
where:
25
V1/V2 = the compression ratio
T1 = absolute initial temperature
T2 = absolute final temperature
γ = ratio of specific heats
The temperature may not exceed hydrogen’s autoignition temperature without causing
premature ignition. Thus, the absolute final temperature limits the compression ratio.
The high autoignition temperature of hydrogen allows larger compression ratios to be
used in a hydrogen engine than in a hydrocarbon engine.
This higher compression ratio is important because it is re-lated to the thermal
efficiency of the system. On the other hand, hydrogen is difficult to ignite in a
compression ignition or diesel configuration, because the temperatures needed for those
types of ignition are rela-tively high.
High Flame Speed
Hydrogen has high flame speed at stoichiometric ratios. Un-der these conditions,
the hydrogen flame speed is nearly an order of magnitude higher (faster) than that of
gasoline. This means that hydrogen engines can more closely approach the
thermodynamically ideal engine cycle. At leaner mixtures, however, the flame velocity
decreases significantly.
High Diffusivity
Hydrogen has very high diffusivity. This ability to disperse in air is considerably
greater than gasoline and is advanta-geous for two main reasons. Firstly, it facilitates the
forma-tion of a uniform mixture of fuel and air. Secondly, if a hydrogen leak develops,
the hydrogen disperses rapidly. Thus, unsafe conditions can either be avoided or
minimized.
Low Density
Hydrogen has very low density. This results in two problems when used in an
internal combustion engine. Firstly, a very large volume is necessary to store enough
26
hydrogen to give a vehicle an adequate driving range. Secondly, the energy density of a
hydrogen-air mixture, and hence the power output, is reduced.
2.4 HYDROGEN AS DEDICATED FUEL
Hydrogen’s unique properties as a fuel in ICE give it a significant advantage
over other fuels including gasoline, diesel, methane or ethanol. An overview of the
characteristics of hydrogen as a fuel for SI engines was presented by (Karim, G.A,
2003). Hydrogen possesses some features that make it really attractive: enabling fast,
close to constant volume combustion, high combustion efficiency and low emissions.
These advantages include the possibility of reaching a near zero emissions of the
regulated emissions of CO and HC while simultaneously eliminating CO2 emissions,
and greatly improved cold start capability.
2H2 + O2 2H2O
Hydrogen’s combustion properties enable the development of an engine that
would meet all current and future emissions standards at a price comparable to current
engines with cheaper after treatment devices. The flame speed of hydrogen is higher and
hydrogen allows operation with significantly higher excess air ratios than conventional
hydrocarbon fuels. This enables extended lean burn operation of the engine, potentially
leading to a drastic reduction of NOx emissions because of the lower combustion tem-
peratures. High diffusivity and low quenching distance avoids poor vaporization
problems. Emissions of CO and HC are practically eliminated with hydrogen fuelled
ICE, as the only source of carbon will be the lubricating oil. When hydrogen burns, the
main chemical reaction that takes place is shown in Eq. (1), showing the lack of carbon
bearing compounds. For the same reason the engine does not emit CO2. The only non-
trivial exhaust gas emissions will be the NOx, which result from the oxidation of
atmospheric nitrogen under high temperatures. It will be shown below that with
hydrogen fuelled ICE operation and a very lean mixture this pollutant can be reduced to
near-zero levels. The ignition energy for hydrogen is low, however the temperature
required for auto ignition is significantly higher than that of conventional hydrocarbon
fuels. Therefore, SI engines using hydrogen fuel require a less energetic plug that

27
permits a shorter plug gap without auto ignition of the fuel/air mixtures before the spark
occurs. A comprehensive review of hydrogen fuelled ICEs was presented (White C.M.,
Steeper, R.R, and Lutz, A.E, 2006)
2.5 ADVANTAGE OF USING HYDROGEN AS FUEL
There are many advantages of using hydrogen as fuel that we should know, below some
of this advantages:
Hydrogen is a very clean fuel that produces minimal emissions when combusted
directly or in combination with hydrocarbon fuels.
Hydrogen can be produced anywhere in the world
If Hydrogen is used in place of fuel, hydrogen fuel cells will cost a lot less than
filling up a tank of gasoline.
Whey hydrogen is used in a fuel cell, the only byproducts are heat and water.
Typical gasoline powered cars only use about 20% of the fuel to power the car.
With hydrogen fuel cell cars, around 40-60% of the fuel is used to power the
electric motor.
Reduced dependency on foreign oil. The hydrogen used for powering hydrogen
fuel cell cars can be made from a variety of sources including water. This means
that there will be less dependence on foreign oil for gasoline.
Use of hydrogen energy will cut down on atmospheric pollution
Hydrogen is safer than gasoline, diesel, or natural gas.
High energy content per volume when stored as a liquid. This would give a large
vehicle range for a given fuel tank capacity.
2.5.1 Disadvantage Of Using Hydrogen As Fuel
Beside of that, there is also disadvantage of using hydrogen as fuel.
Hydrogen is most commonly separated by a reforming process that uses natural
gas and other fossil fuels. Supplies of natural gas are becoming harder to obtain,
and coal is a source of major pollution.
The technology to produce, store, and transport hydrogen power at an efficient
cost is not yet available and will not likely be for a long while.

28
It takes more energy to make Hydrogen than you get from it.
A hydrogen fuel cell car will not be able to travel as far on a tank of fuel as a
traditional gasoline powered car. The fuel cell cars are not equipped to store the
amount of hydrogen needed for long distances, so you would need to fill up
more often.
If you live in an area where the temperature gets down to freezing, you might
have a problem with your hydrogen fuel cell car. Since these cars have water in
the fuel cell system constantly, there is a risk it could freeze. Also, the hydrogen
fuel cell car has to be at a certain temperature to perform well.
Requirement of heavy, bulky fuel storage in vehicle and at the service station.
Hydrogen can be stored either as a cryogenic liquids or as a compressed gas. If
stored as liquid, it would have to be kept under pressure at very low temperature.
This would require a thermally super-insulted fuel tank. Storing in gas phase
would require a high pressure vessel with limited capacity.
Poor engine volumetric efficiency. Any time a gaseous fuel is used in an engine,
the fuel will displace some of the inlet air and poorer volumetric efficiency will
result.
Fuel cost would be high at present-day technology and availability.
High NOx emissions because of high flame temperature (V Ganesan, 2003).
2.6 PREVIOUS RESEARCH
2.6.1 Past research involving hydrogen addition to gasoline engine
Work concentrating on the reduction in fuel consumption with the addition of
hydrogen has been previously conducted. Lucas and Richards (Lucas GG, Richards
WL, 1982) ran an engine on what they called “dual fuel”. The engine was fuelled by
hydrogen only while idling and then was run with a constant hydrogen flow rate to
which gasoline was added as the load increased. The dual fuelling reduced fuel
consumption by up to 30% . The higher thermal efficiency found was a result of the
engine being able to run at wide open throttle throughout the load range, minimizing
heat losses to coolant and pumping losses. Combustion was maintained throughout the
load range due to the wide flammability limit and high flame speed of hydrogen. As a

29
result of lean operation, CO emissions were reduced due to an increase in completeness
of combustion and NOx decreased due to a reduction in the peak in-cylinder
temperatures. Similarly, May and Gwinner (May H, Gwinner D, 1983) used hydrogen
with excess air for starting and idling an SI engine. At part load both hydrogen and
gasoline were supplied to the engine and at full load gasoline alone fuelled the engine to
avoid a power loss. A 25% improvement in efficiency was found at part load due to the
ability to operate at full throttle and emissions were reduced due to the lower fuel/air
equivalence ratios.
Stebar and Parks (Stebar RF, Parks FB, 1974) used hydrogen-supplemented fuel
as a means of extending the lean limit of operation in a gasoline engine in order to
control NOx . A single-cylinder engine was tested while adding 10% hydrogen by mass
of fuel. The lean limit was extended from (Φ=0:89) to 0.55 reducing NOx emissions to
near minimal levels. However, as a consequence of running on lean mixtures, the HC
emissions increased. The effect of hydrogen addition on the combustion processes was
also examined by Apostolescu and Chiriac (Apostolescu N, Chiriac R, 1996), who
studied the effect of adding hydrogen to a gasoline fuelled single cylinder passenger car
engine at mid- and light-load operation. They were able to shorten combustion duration
with the addition of hydrogen and thus reduced cycle-to-cycle variability and extended
the lean limit of operation. Interestingly, when adding 1.5% and 3% H2 by mass to a
gasoline fuelled SI engine, they saw close to the same decrease in the crank angle
duration required to burn the 6rst 10% of the charge. There was, however, a noticeable
difference in the decrease of the 10–90% burn duration for varying hydrogen additions
(1.5% versus 3%), with a greater decrease as the hydrogen addition increased.
Unburned hydrocarbon emissions were reduced while operating with excess air;
however, the NOx emissions tended to increase at those same conditions. Only at very
low fuel/air equivalence ratios (Φ≈ 0:7) did the NOx emissions decrease at which point
the HC emissions increased. Rauckis and McLean (Rauckis MJ, McLean WJ, 1979)
investigated the effect of supplementing indolene (automotive test fuel) with hydrogen
on the burn duration in an SI engine while varying the equivalence ratio and hydrogen
energy fraction from5% to 28%. The added hydrogen led to improved efficiency and
reduced cycle-to-cycle variation. They found that the main e8ects of the hydrogen
addition were a substantial decrease in the 0–2% burn duration, a smaller reduction in
30
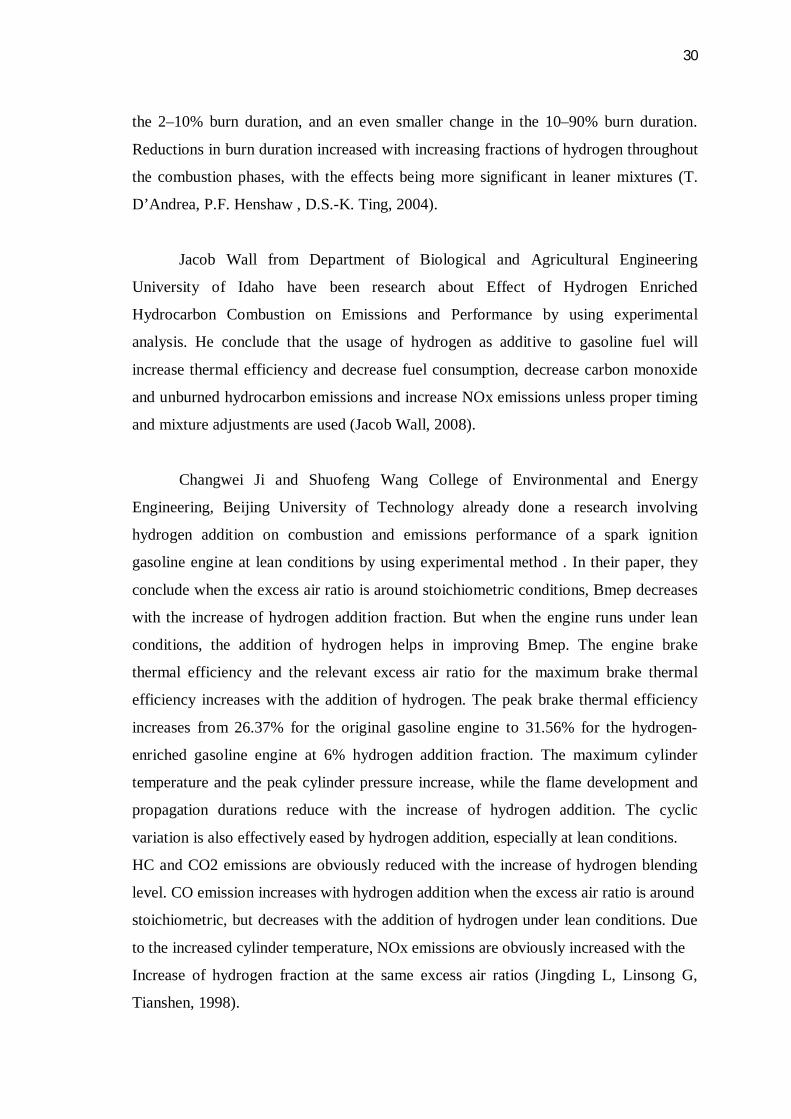
the 2–10% burn duration, and an even smaller change in the 10–90% burn duration.
Reductions in burn duration increased with increasing fractions of hydrogen throughout
the combustion phases, with the effects being more significant in leaner mixtures (T.
D’Andrea, P.F. Henshaw , D.S.-K. Ting, 2004).
Jacob Wall from Department of Biological and Agricultural Engineering
University of Idaho have been research about Effect of Hydrogen Enriched
Hydrocarbon Combustion on Emissions and Performance by using experimental
analysis. He conclude that the usage of hydrogen as additive to gasoline fuel will
increase thermal efficiency and decrease fuel consumption, decrease carbon monoxide
and unburned hydrocarbon emissions and increase NOx emissions unless proper timing
and mixture adjustments are used (Jacob Wall, 2008).
Changwei Ji and Shuofeng Wang College of Environmental and Energy
Engineering, Beijing University of Technology already done a research involving
hydrogen addition on combustion and emissions performance of a spark ignition
gasoline engine at lean conditions by using experimental method . In their paper, they
conclude when the excess air ratio is around stoichiometric conditions, Bmep decreases
with the increase of hydrogen addition fraction. But when the engine runs under lean
conditions, the addition of hydrogen helps in improving Bmep. The engine brake
thermal efficiency and the relevant excess air ratio for the maximum brake thermal
efficiency increases with the addition of hydrogen. The peak brake thermal efficiency
increases from 26.37% for the original gasoline engine to 31.56% for the hydrogen-
enriched gasoline engine at 6% hydrogen addition fraction. The maximum cylinder
temperature and the peak cylinder pressure increase, while the flame development and
propagation durations reduce with the increase of hydrogen addition. The cyclic
variation is also effectively eased by hydrogen addition, especially at lean conditions.
HC and CO2 emissions are obviously reduced with the increase of hydrogen blending
level. CO emission increases with hydrogen addition when the excess air ratio is around
stoichiometric, but decreases with the addition of hydrogen under lean conditions. Due
to the increased cylinder temperature, NOx emissions are obviously increased with the
Increase of hydrogen fraction at the same excess air ratios (Jingding L, Linsong G,
Tianshen, 1998).

31
2.6.2 Addition of hydrogen on gasoline fuelled SI engine
Using hydrogen as an additive offers the possibility of enhancing the mixture by
taking advantage of properties from both fuels. The properties of hydrogen along with
those of methane, propane and gasoline are listed for comparison in Table 1. Hydrogen
has a flame speed more than five times greater than the hydrocarbon fuels listed here.
Also, it has a lean limit (mixture at which flame will not propagate due to excess air) of
Φ= 0:1, much lower than the theoretical limit of gasoline (Φ = 0:6). Theoretically, it is
possible to extend the lean limit of the mixture, by adding a small amount of hydrogen
to a liquid or gaseous hydrocarbon fuel. Operating with abundant excess air ensures
more complete combustion, improves efficiency and results in a decrease in peak
temperatures, which aids in lowering NOx , while eliminating problems commonly
associated with operating on lean mixtures (Stebar RF, Parks FB and Apostolescu N,
Chiriac R, 1974 and 1996). Secondly, the higher flame speed increases the rate of
combustion of the mixture and lowers cycle-to-cycle variations (Varde KS and Bell SR,
Gupta M, 1981 and 1997). Hydrogen has a higher diffusivity compared to hydrocarbon
fuels, which improves mixing, enhances turbulence and increases homogeneity in the
charge. The lower ignition energy requirement for hydrogen ensures prompt ignition
and eases cold starts. The quenching gap refers to the largest passage that will
extinguish a flame. The smaller quenching gap exhibited by hydrogen in comparison to
gasoline means that the flame could travel closer to the cylinder wall and farther into
crevices resulting in more complete combustion. Hydrogen does, however, have a lower
heating value per mole than the hydrocarbon fuels, and therefore a power decrease
would occur as the hydrogen is substituted for a hydrocarbon fuel.
Table 2.1: Listing of hydrogen properties along with methane, propane and gasoline for
comparison.
Properties Hydrogen Methane Propane Gasoline
Chemical formula H2 CH4 C3H8 (C8H18)
Minimum ignition energy (mJ) 0.02 0.29 0.26 0.24
a. Flame speed (cm/s) 237 42 46 41.5

32
b. Diffusion coefficient (cm2=s) 0.61 0.16 0.12 0.05
Quenching gap (cm) 0.06 0.2 0.2 0.2
Higher heating value (MJ/kg) 142 55 50.4 (47.3)
Lower heating value (MJ/kg) 120 50.4 46.4 (44)
Molecular weight 2.02 16.04 44.1 ≈ 107 (114)
Lower heating value (kJ/mol) 286 802 2043 (5100)
a = at 20 deg C
b = at stoichiometric conditions
2.7 NOx EMISSION
Exhaust gases of an engine can have up to 2000 ppm of oxides nitrogen. Most of
this will be nitrogen oxide (NO), with a small amount of nitrogen dioxide (NO2), and
traces of other nitrogen-oxygen combinations. These all grouped together as NOx
emission. NOx is undesirable emission, and regulations that strict the allowable amount
continue to become more stringent. Release NOx reacts in the atmosphere to form
ozone and is one of major causes of photochemical smog.
NOx is created mostly from nitrogen in the air. Nitrogen can also be found in
fuels blends, which any contain trace amounts of NH3, NC and HCN, but this would
contribute only to a minor degree. There are a number of possible reactions that form
NO, all of which are probably occurring during the combustion process and
immediately after. These include but are not limited to,
O + N2 NO + N (1)
N + O2 NO + O (2)
N + OH NO + H (3)
NO, in turn, can then further react to form NO2 by various means, including the
following:
NO + H2O NO2 + H2 (4)

33
NO + O2 NO2 + O (5)
Atmospheric nitrogen exists as stable diatomic molecule at low temperatures, and
only very small trace amounts of oxides of nitrogen are found. However, at the very
high temperatures that occur in the combustion chamber of an engine, some diatomic
nitrogen (N2) breaks downs to monatomic nitrogen (N), which is reactive:
N2 2N (6)
The chemical equilibrium for eq(6) is highly dependent on temperature, with a
much more significant amount of N generated in the 2500-3000 K temperature range
that can exist in an engine. Other gases that stable at low temperatures, but become
reactive and contribute to the formation of NOx at high temperatures, include oxygen
and water vapor, which break down as follows:
O2 2O (7)
H2O OH + 1/2H2 (8)
Eqs. (6-8) all reacts much further to the right as high combustion chamber temperatures
are reached. The higher the combustion reaction temperatures, the more diatomic
nitrogen, N2, will dissociate to monatomic nitrogen, N, and the more NOx will be
formed. At low temperatures very little NOx is created (Williard W. Pulkrabek, 2004).
Below there is full chemical reaction on how NOx form when gasoline blend with
hydrogen react with present of air:
mix
[FUEL] + [HYDROGEN] + [AIR] → HC + CO + CO2 + H2O + NOx
2.8 COMBUSTION COMPARISON BETWEEN THE GASOLINE AND
HYDROGEN
2.8.1 Introduction

34
Idealize gasoline to be octane: C8H18 . When octane combusts O2 is taken from the air
and the following
reactions hold:
2C8H18 + 25O2 16CO2 + 18H2O
and
2C8H18 + 17O2 16CO + 18H2O.
(Neglect the latter CO production reaction, since it occurs rarely.)
When a hydrogen fuel cell produces energyO2 is taken from the air and the following
reaction holds:
2H2 + O2 2H2O.
2.8.2 Chemical Bonding Energies
Table 2.2: Following energies of carbon bonds
Type of bond Bond Energy (kiloJoule/mole)
single 314
double 611
triple 837
Table 2.3: Other bond energies
Type of bond Bond Energy (kiloJoule/mole)
C-H 413
H-H 436
O-O 146
O=O 498
C-O 358
C=O(CO2) 803
C=O(other) 741-749
H-O 464
35
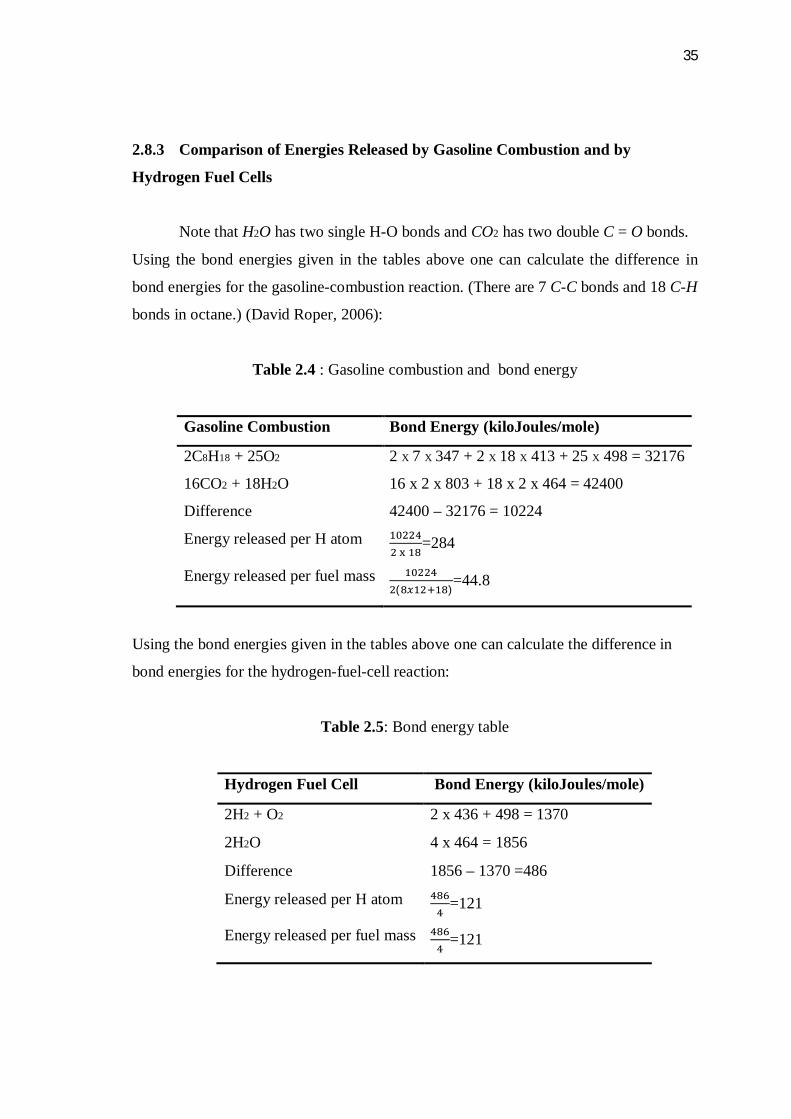
2.8.3 Comparison of Energies Released by Gasoline Combustion and by
Hydrogen Fuel Cells
Note that H2O has two single H-O bonds and CO2 has two double C = O bonds.
Using the bond energies given in the tables above one can calculate the difference in
bond energies for the gasoline-combustion reaction. (There are 7 C-C bonds and 18 C-H
bonds in octane.) (David Roper, 2006):
Table 2.4 : Gasoline combustion and bond energy
Gasoline Combustion Bond Energy (kiloJoules/mole)
2C8H18 + 25O2 2 X 7 X 347 + 2 X 18 X 413 + 25 X 498 = 32176
16CO2 + 18H2O 16 x 2 x 803 + 18 x 2 x 464 = 42400
Difference 42400 – 32176 = 10224
Energy released per H atom ଵଶଶସଶ ୶ ଵ଼
=284
Energy released per fuel mass ଵଶଶସଶ(଼௫ଵଶାଵ଼)
=44.8
Using the bond energies given in the tables above one can calculate the difference in
bond energies for the hydrogen-fuel-cell reaction:
Table 2.5: Bond energy table
Hydrogen Fuel Cell Bond Energy (kiloJoules/mole)
2H2 + O2 2 x 436 + 498 = 1370
2H2O 4 x 464 = 1856
Difference 1856 – 1370 =486
Energy released per H atom ସ଼ସ
=121
Energy released per fuel mass ସ଼ସ
=121
36
Thus, gasoline combustion releases ଶ଼ସଵଶଵ
=2.35times as much energy per hydrogen atom
and ସସ.଼ଵଶଵ
=0.370 ீ.ா௬ு.ா௬
times as much energy per fuel mass as a hydrogen fuel cell
does. Both reactions produce water; gasoline also produces carbon dioxide (David
Roper, 2006).
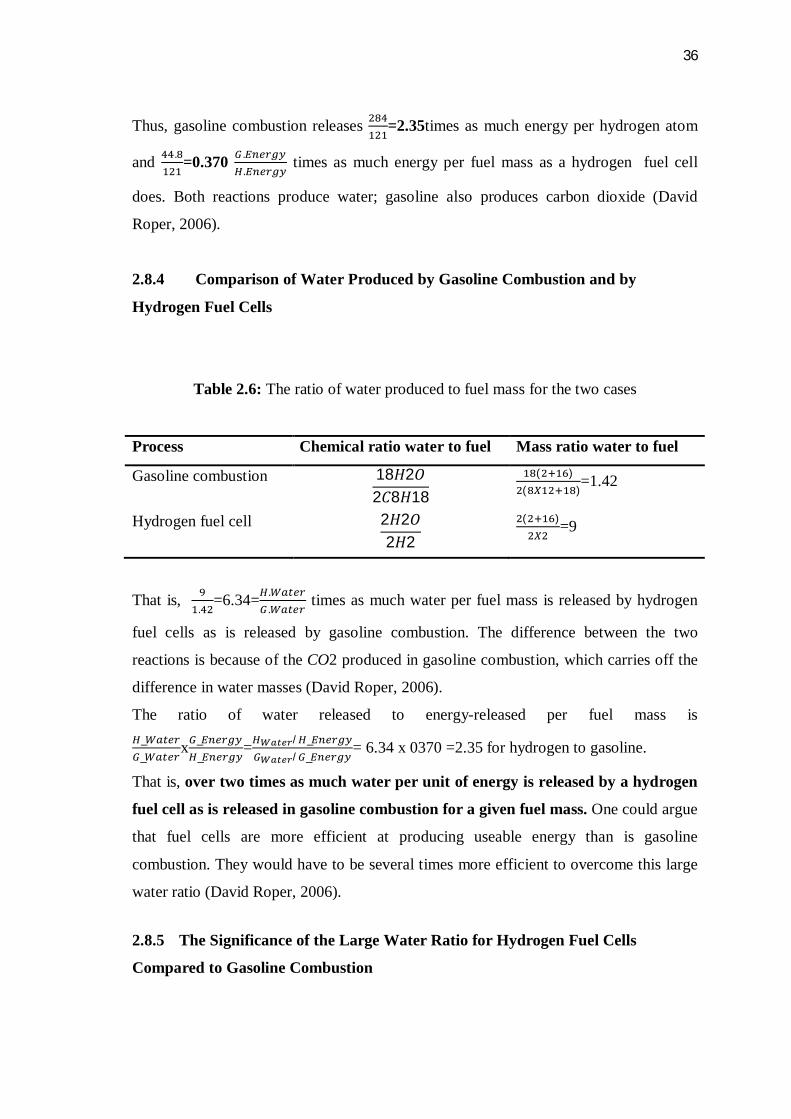
2.8.4 Comparison of Water Produced by Gasoline Combustion and by
Hydrogen Fuel Cells
Table 2.6: The ratio of water produced to fuel mass for the two cases
Process Chemical ratio water to fuel Mass ratio water to fuel
Gasoline combustion 182ܱܪ 18ܪ8ܥ2
ଵ଼(ଶାଵ)ଶ(଼ଵଶାଵ଼)
=1.42
Hydrogen fuel cell 22ܱܪ2ܪ2
ଶ(ଶାଵ)ଶଶ
=9
That is, ଽଵ.ସଶ
=6.34=ு.ௐ௧ீ.ௐ௧
times as much water per fuel mass is released by hydrogen
fuel cells as is released by gasoline combustion. The difference between the two
reactions is because of the CO2 produced in gasoline combustion, which carries off the
difference in water masses (David Roper, 2006).
The ratio of water released to energy-released per fuel mass is ு_ௐ௧ீ_ௐ௧
xீ_ா௬ு_ா௬
=ுೈೌ/ு_ா௬ீೈೌ/ீ_ா௬
= 6.34 x 0370 =2.35 for hydrogen to gasoline.
That is, over two times as much water per unit of energy is released by a hydrogen
fuel cell as is released in gasoline combustion for a given fuel mass. One could argue
that fuel cells are more efficient at producing useable energy than is gasoline
combustion. They would have to be several times more efficient to overcome this large
water ratio (David Roper, 2006).
2.8.5 The Significance of the Large Water Ratio for Hydrogen Fuel Cells
Compared to Gasoline Combustion

37
The exhaust of gasoline combustion is at a temperature of a few hundred degrees
Celsius. So the water comes out as vapor, along with the carbon dioxide, both of which
are potent greenhouse gases. The operating temperature of a hydrogen alkaline fuel cell
is 50-250 degrees Celsius. So the water comes out as a hot liquid or as low temperature
steam, to be deposited on or above the roadway. So over two times as much low-
temperature water per energy released is emitted by a hydrogen fuel cell compared to
the high-temperature water vapor emitted by gasoline combustion. This would cause
dangerous driving conditions on roads, especially during cold weather. However, it
could have positive effects for railroad and water transportation (David Roper, 2006).
2.1 1-DIMENSIONAL ANALYSIS
2.9.1 Design of Experiments
There are many types of engine analysis software, one of them is GT-Power. GT-
Power is one of the commonly software to design a 1-Dimensional engine. Previous
researchers had successfully combine the 1-dimensional simulation and Design of
Experiments (DOE) techniques to design and optimize the performance of four stroke
inline 4 cylinders engine. The benefit when using DOE are it may enable an
optimization range to be studied using fewer experiments and it also reveals the
interactions between different variables (Zabidi Bin Mohamad, 2008).
GT-POWER is specifically designed for steady state and transient simulations,
and can be used for analysis of engine/ power train control. It is applicable to all types
of I.C. engines, and it provides the user with many components to model any advanced
concept. In an application, GT-Power can be used for a wide range activities relating to
engine design and turning, valve profile and timing optimization, turbocharger
matching, EGR system performance , manifold wall temperature, CFD studies
conjunction with Star-CD, thermal analysis of cylinder components, combustion
analysis, design of active and passive control system, intake and exhaust noise analysis,
design of resonators and silencer for noise control and transient turbocharger response
(Semin, Abdul R. Ismail and Rosli A. Bakar,2008).

38
In this study, the GT-Power 1-Dimensional computation model are dedicated
gasoline engine with addition of hydrogen will be developed by using default parameter
in GT-Power tutorial. The GT-Power engine computational model is used to simulate
NOx emission characteristics of Spark Ignition engine. Simulation will be run on 5
different cases which are percentage of hydrogen added to the engine with 5%
increment in each case and the engine will be run on 1000(low engine speed), 3000
rpm(medium engine speed) and 5000 rpm(high engine speed).
39
CHAPTER 3
METHODOLOGY
3.1 INTRODUCTION
This chapter will further describe the study of gasoline engine with addition of
hydrogen fuel based on 1-Dimensional simulation GT-Power software. In order to
finish this project, methodology is one of the most important thing to be considered to
ensure that the project run smoothly and get expected result which is needed. For this
chapter, it will be discussing about the process of the project due to flow chart or more
specifically due to Gantt chart. In this methodology, there are several steps must
followed to ensure that the objective of the project achieved start from literature review,
finding until submit the report. All of the process like measuring the parameter,
mapping the engine and simulate the model will be explained clearly in this chapter.
Also, software were used for this project will be described. Below are the steps of the
the project which briefly into flow chart schematic diagram.

40
3.2 PROJECT FLOW CHART
Figure 3.1: Flow Chart of the Project
Start
Literature Review
Methodology
Parameter selection
Develop the GT-Power model
1-Dimensional simulation
Result Comparison
Discussion
Submit Report
End
YES
NO

41
3.3 NUMERICAL FLOW ANALYSIS
Figure 3.2: Numerical Flow Chart analysis
GT-Power studying
Develop GT-Model
Result
Run Simulation on Gasoline engine With added hydrogen
fuel
Result and discussion
YES
NO
Study on 4 stroke SI engine
Acceptable Result
Conclusion and recommendation
NO
YES
Start
Run Simulation on Gasoline engine
End

42
3.4 MEASURING THE PARAMETER
The parameter of the engine can be measured in two ways. Firstly, the
conventional method where a veneer caliper is used to measure the real engine’s
parameter. All of the parameters required to simulate the engine in 1-Dimensional
modeling such as bore, stroke, diameter exhaust, intake, valve, length of connecting rod
and etc. All of this component will be measured precisely using the veneer caliper twice
to get more accurate value.
Secondly, using the solidworks drawing where all the parameters can be
obtained directly from the 3-D drawing. The function of this way is to compare the
value obtained from conventional method and by using solidworks drawing. But in this
project, parameter for engine were taken from GT-Power tutorial and not measured
from those above 2 methods. It is because there is some problem cause measuring the
parameter from real engine cannot be perform.
Figure 3.1: cylinder head Figure 3.2: Engine block
Source: FKM Lab Source: FKM Lab
43
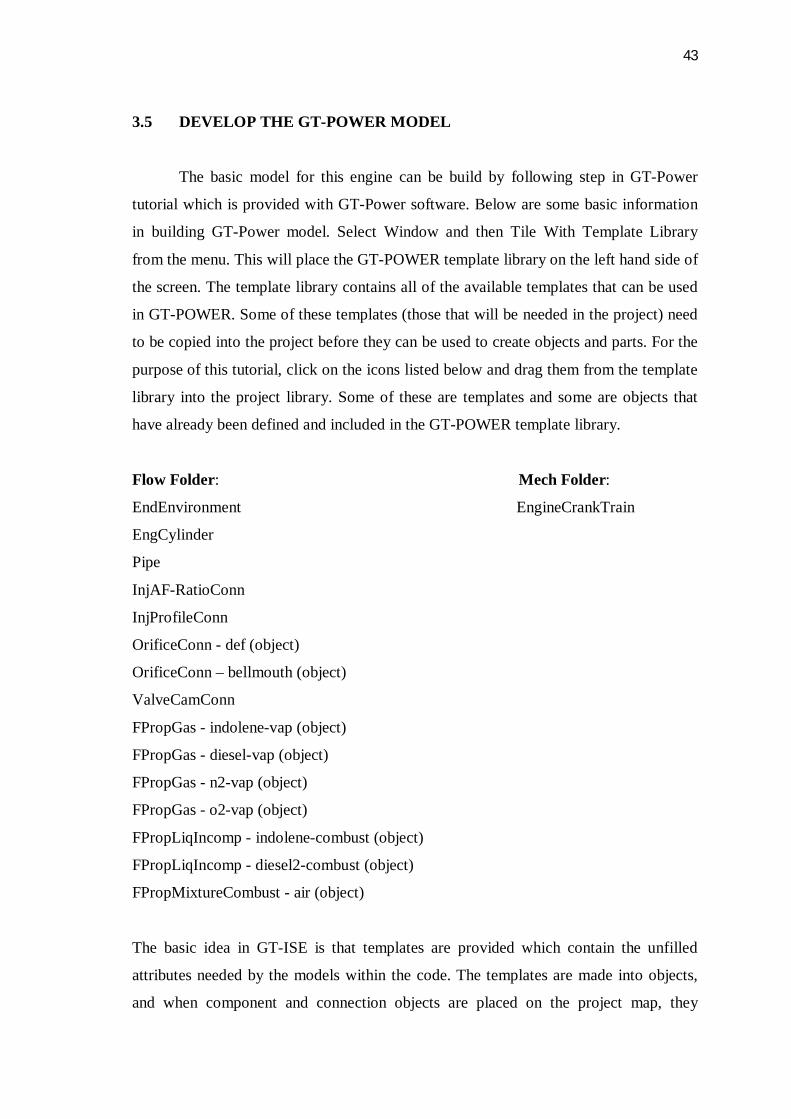
3.5 DEVELOP THE GT-POWER MODEL
The basic model for this engine can be build by following step in GT-Power
tutorial which is provided with GT-Power software. Below are some basic information
in building GT-Power model. Select Window and then Tile With Template Library
from the menu. This will place the GT-POWER template library on the left hand side of
the screen. The template library contains all of the available templates that can be used
in GT-POWER. Some of these templates (those that will be needed in the project) need
to be copied into the project before they can be used to create objects and parts. For the
purpose of this tutorial, click on the icons listed below and drag them from the template
library into the project library. Some of these are templates and some are objects that
have already been defined and included in the GT-POWER template library.
Flow Folder: Mech Folder:
EndEnvironment EngineCrankTrain
EngCylinder
Pipe
InjAF-RatioConn
InjProfileConn
OrificeConn - def (object)
OrificeConn – bellmouth (object)
ValveCamConn
FPropGas - indolene-vap (object)
FPropGas - diesel-vap (object)
FPropGas - n2-vap (object)
FPropGas - o2-vap (object)
FPropLiqIncomp - indolene-combust (object)
FPropLiqIncomp - diesel2-combust (object)
FPropMixtureCombust - air (object)
The basic idea in GT-ISE is that templates are provided which contain the unfilled
attributes needed by the models within the code. The templates are made into objects,
and when component and connection objects are placed on the project map, they
44
become parts. These objects and parts may call reference objects. At this point the only
reference templates and objects in the project are those that describe the air and fuel
properties. During the course of building the model many more of the reference
templates will be used; however, these are automatically imported into the project at the
time they are first called. All the parameters and value are set at each part like in the
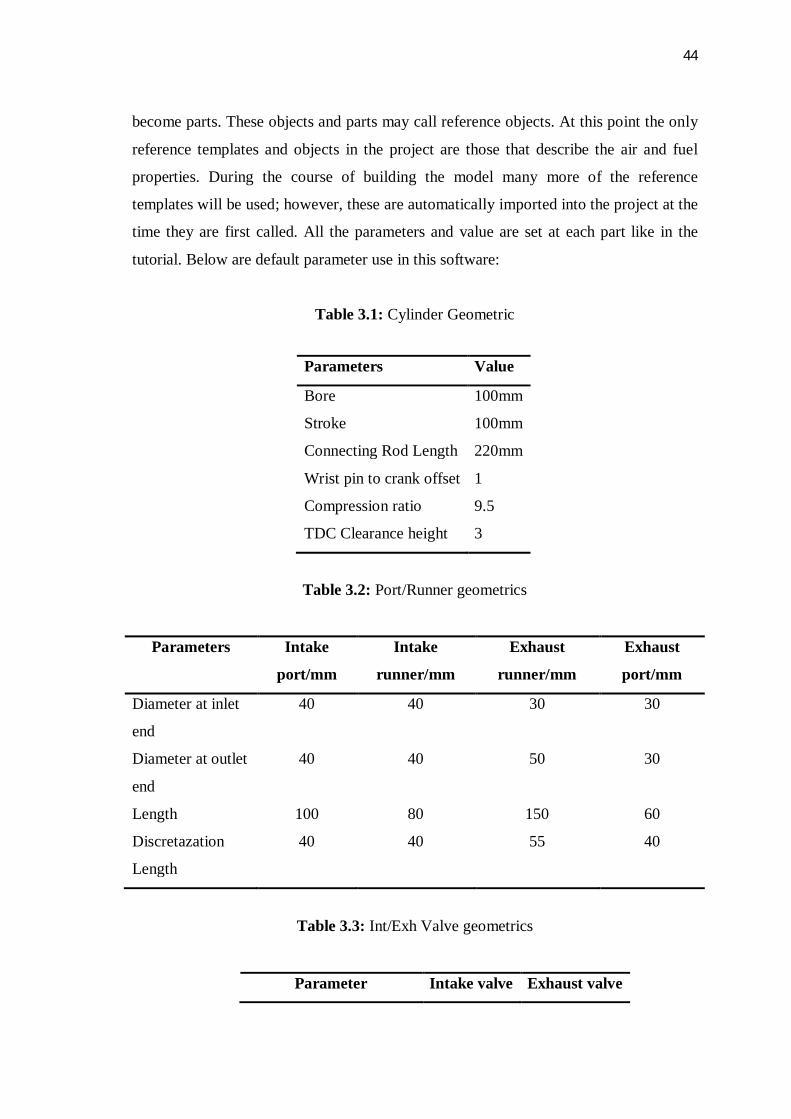
tutorial. Below are default parameter use in this software:
Table 3.1: Cylinder Geometric
Table 3.2: Port/Runner geometrics
Parameters Intake
port/mm
Intake
runner/mm
Exhaust
runner/mm
Exhaust
port/mm
Diameter at inlet
end
40 40 30 30
Diameter at outlet
end
40 40 50 30
Length 100 80 150 60
Discretazation
Length
40 40 55 40
Table 3.3: Int/Exh Valve geometrics
Parameter Intake valve Exhaust valve
Parameters Value
Bore 100mm
Stroke 100mm
Connecting Rod Length 220mm
Wrist pin to crank offset 1
Compression ratio 9.5
TDC Clearance height 3

45
Valve reference diameters 45.5 37.5
Valve lash 0.1 0.1
Cam timing angle 239 126
3.6 MAPPING THE ENGINE IN 1-D
3.6.1 Basic 4 stroke single cylinder model(Gasoline Fuel)
After finished to set all the parameter an option GT-Power model, it is now time
to place parts on the project map and connect the components together. Click and hold
on the ‘End Environment’ object named "env" and drop it on the middle left side of the
map. Repeat this with the items listed, in the order listed, from left to right:
intrunner, intport, intvalve, cylinder, exhvalve, exhport, exhrunner, env
Now the components need to be connected together. In the tool bar for GT-ISE,
there is a button called Create Links which needs to be pressed. Once this is done the
mouse pointer turns into crosshairs. This can also be done by right clicking anywhere on
the project map and selecting Create Link Mode. Click on the part created from the
“env” object and then on the part created from the “intrunner” object. A default orifice
connection was placed between the ‘End Environment’ and the first pipe. Continue the
same step until all part are connected together.
46
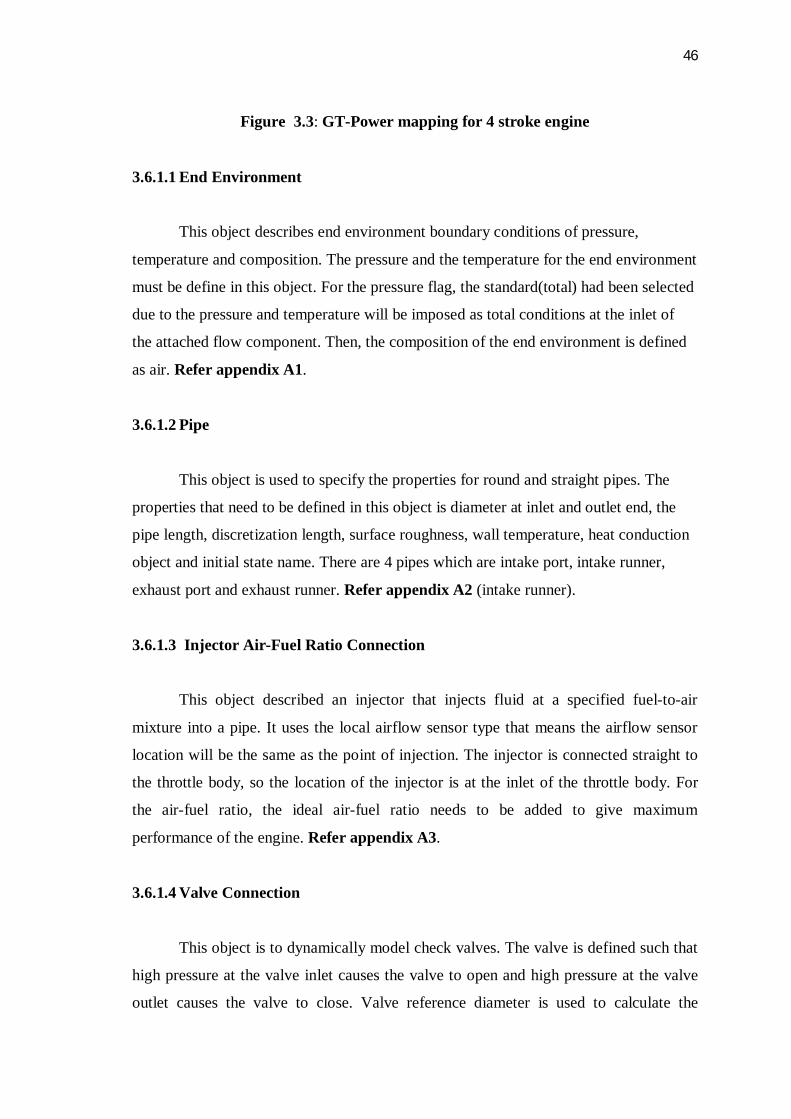
Figure 3.3: GT-Power mapping for 4 stroke engine
3.6.1.1 End Environment
This object describes end environment boundary conditions of pressure,
temperature and composition. The pressure and the temperature for the end environment
must be define in this object. For the pressure flag, the standard(total) had been selected
due to the pressure and temperature will be imposed as total conditions at the inlet of
the attached flow component. Then, the composition of the end environment is defined
as air. Refer appendix A1.
3.6.1.2 Pipe
This object is used to specify the properties for round and straight pipes. The
properties that need to be defined in this object is diameter at inlet and outlet end, the
pipe length, discretization length, surface roughness, wall temperature, heat conduction
object and initial state name. There are 4 pipes which are intake port, intake runner,
exhaust port and exhaust runner. Refer appendix A2 (intake runner).
3.6.1.3 Injector Air-Fuel Ratio Connection
This object described an injector that injects fluid at a specified fuel-to-air
mixture into a pipe. It uses the local airflow sensor type that means the airflow sensor
location will be the same as the point of injection. The injector is connected straight to
the throttle body, so the location of the injector is at the inlet of the throttle body. For
the air-fuel ratio, the ideal air-fuel ratio needs to be added to give maximum
performance of the engine. Refer appendix A3.
3.6.1.4 Valve Connection
This object is to dynamically model check valves. The valve is defined such that
high pressure at the valve inlet causes the valve to open and high pressure at the valve
outlet causes the valve to close. Valve reference diameter is used to calculate the
47
effective flow area from the discharge coefficient arrays. The upstream pressure area is
the pressure area on the valve that is acted upon to close the valve. There 2 valves which
are intake valve and exhaust valve. Refer appendix A4.
3.6.1.5 Engine Crankcase
This object is used to model crankcase chambers. The crankcase must be
modeled for 4 stroke engine. The parameters that needed to be defined in engine
crankcase are bore, compression ratio stroke, connecting rod length, TDC clearance
height and Wrist Pin to Crank Offset. TDC Clearance Height is cylinder clearance
height from the top of the piston to the e top of the cylinder wall when the piston is at
TDC. This attribute is used to calculate the cylinder wall surface area used for in-
cylinder heat transfer calculations .Wrist Pin to Crank Offset is wrist pin offset relative
to the crankshaft axis when the wrist-pin bearing position on the piston end is projected
toward the crankshaft on a line parallel to the cylinder axis (positive to the thrust side).
Refer appendix A5.
3.6.1.6 Engine Cylinder
This object is used to specify the attribute of the engine cylinder. The important
parameters that need to be defined are the cylinder geometry, wall temperature, heat
transfer and combustion objects. Most of the parameters in the engine cylinder need to
be defined by another reference such as “geom”,”air-fuel”,”intake”,”cyltwall”,”htr”,
”comb”. Refer appendix A6.
3.6.1.7 Engine Crankshaft
This object specifies the attributes of an engine’s crank train. The crank train
model the crank slider mechanism and crankshaft which translates the torques generated
directly from the pressure acting on each piston in the cylinders into the crankshaft
output torque. The important parameters need to be defined are engine type whether 2-
stroke or 4 stroke, number of cylinder in the engine, configuration of whether in-line or
V, the engine speed, and the start of cycle. Refer to appendix A7

48
3.7 SIMULATION ON GASOLINE ENGINE
After finish mapping the 4 stroke engine, the simulation of the engine will be
carried out. To trace the presence of NOx emission some step must be done in order to
get graph NOx emission. From GT-Power library at left, there are flow, mechanical,
electrical, thermal, analysis. General and control. Choose flow and then find
EngCylNOx, see Figure 3.4. Next drag this reference to the GT-Power library .Before
that, change name to NOx and there are 3 attribute change all that from ’ign’ to ‘1’ see
Figure 3.5 . After that, go to mapping choose cylinder, see 3 box at left below of
cylinder part. There are 3 which are main, model and plot option. Choose model, then
choose comb, see Figure 3.6. Next, press comb and it appear 3 box at left below which
are main, option and advanced. Choose advance, and at NOx reference object change
from ‘ign’ to ‘NOx’. Next, find sensor component from GT-Power library and drag to
template and name it as ‘NOx_sensor’. After that, drag this sensor to the mapping and
placed at above ‘exhport’. Linked the sensor with ‘exhport’ if box appear, choose port
number 6 which is NOx mass fraction (burned) see Figure 3.7. Clicked sensor at map,
then change sensor location from ‘ign’ to ‘1’ and sensed quantity named as ‘prod_no’
see Figure 3.8.
The engine must be defined to operate for certain RPM, for this thesis there are 3
different RPM which are 1000 rpm(low engine speed), 3000 rpm(medium engine
speed) and 5000 rpm(high engine speed).First, run at 1000 rpm(low engine speed) then
continue to 3000 rpm(medium engine speed) and 5000 rpm(high engine speed). To run
the simulation, a yellow button as shown in Figure 3.9 will be clicked. When run the
simulation, black box with the parameter and the definition of the engine as shown in
Figure 3.10 will appear. After the simulation finish, the result and output of the engine
can be displayed with the clicking of open GT-Post button as shown in Figure 3.11.

49
Figure 3.4 : EngCylNOx reference
Figure 3.5: NOx reference object
Figure 3.6: Cylinder part comb

50
Figure 3.7: NOx mass fraction (burned)
Figure 3.8: Sensor edit

51
Figure 3.9: Run Simulation button
Figure 3.10: Running of the 1-D Simulation
52
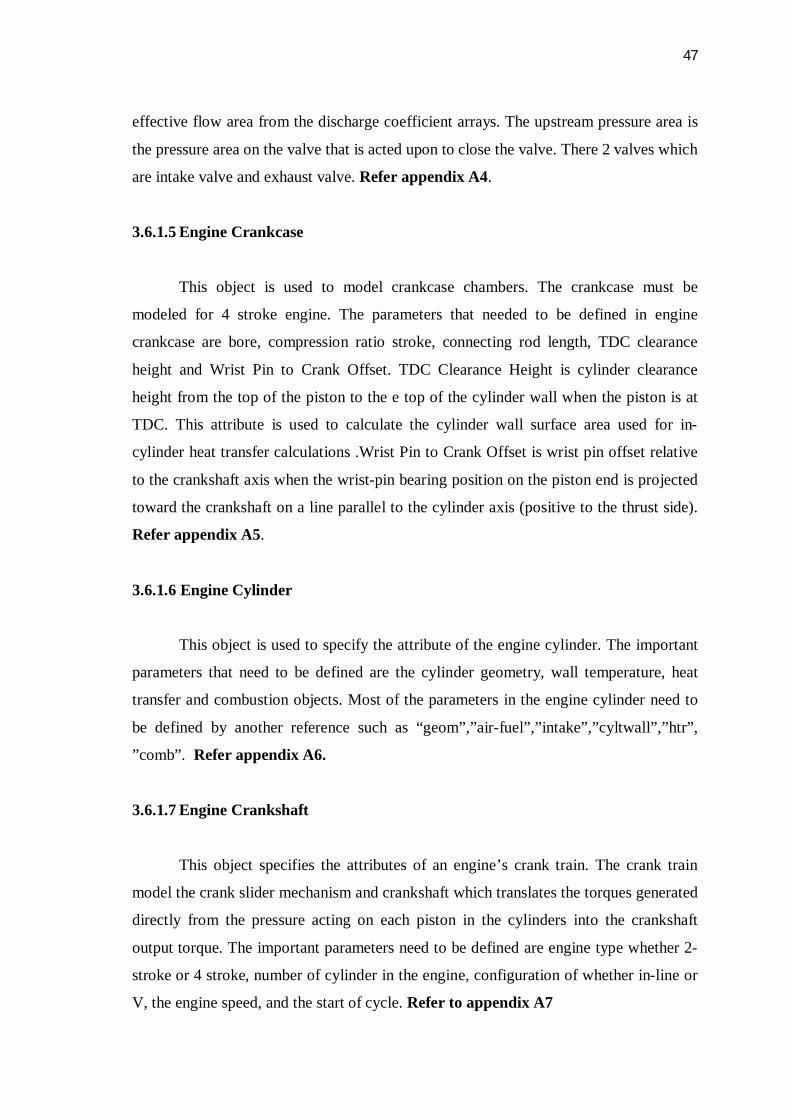
Figure 3.11: Open GT-Post button
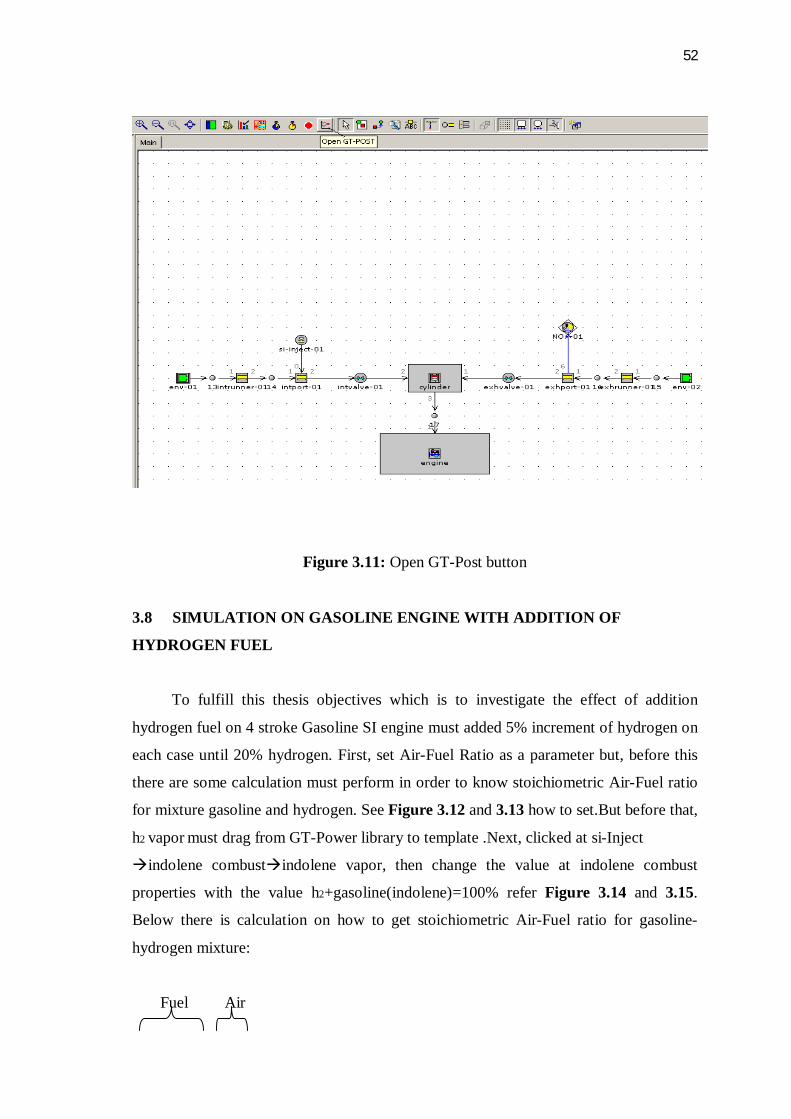
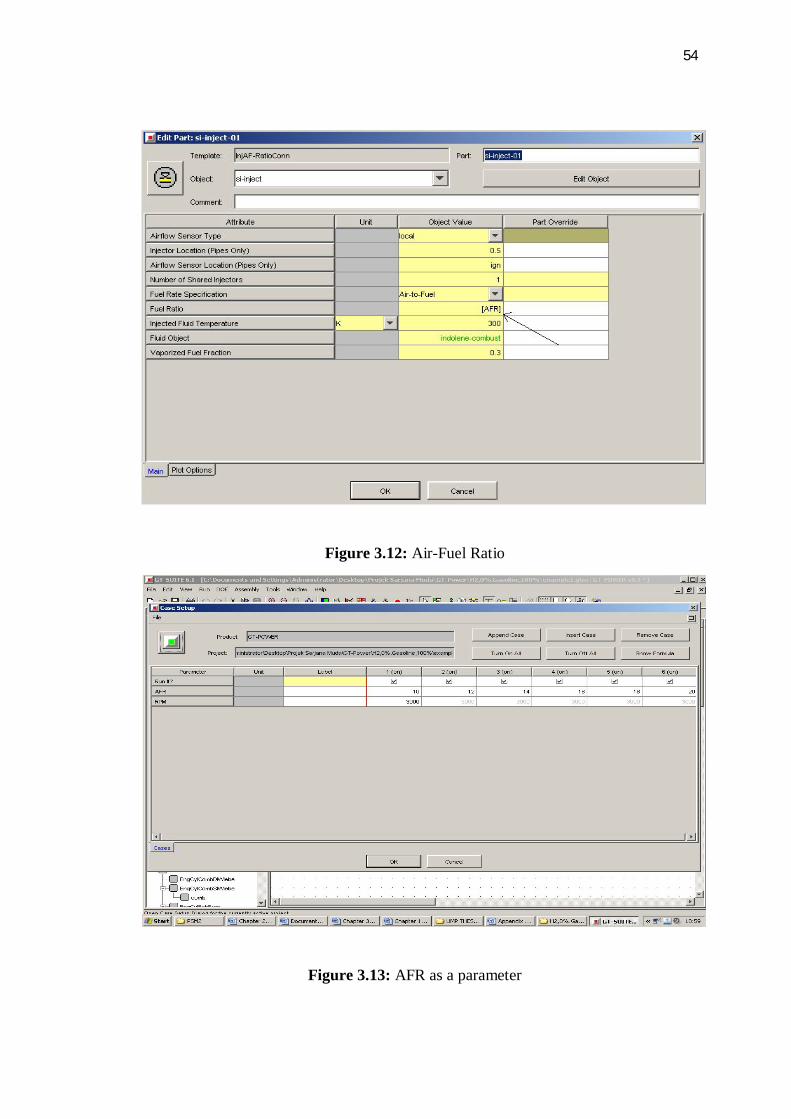
3.8 SIMULATION ON GASOLINE ENGINE WITH ADDITION OF
HYDROGEN FUEL
To fulfill this thesis objectives which is to investigate the effect of addition
hydrogen fuel on 4 stroke Gasoline SI engine must added 5% increment of hydrogen on
each case until 20% hydrogen. First, set Air-Fuel Ratio as a parameter but, before this
there are some calculation must perform in order to know stoichiometric Air-Fuel ratio
for mixture gasoline and hydrogen. See Figure 3.12 and 3.13 how to set.But before that,
h2 vapor must drag from GT-Power library to template .Next, clicked at si-Inject
indolene combustindolene vapor, then change the value at indolene combust
properties with the value h2+gasoline(indolene)=100% refer Figure 3.14 and 3.15.
Below there is calculation on how to get stoichiometric Air-Fuel ratio for gasoline-
hydrogen mixture:
Fuel Air

53
C8H18 + H2 +13O2 8CO2 + 10H2O
(Molar mass number C=12, O=16, H=1)
Gasoline( C8H18) Hydrogen (H2) Oxygen (13O2)
(12X18) + (18X1) 2X1 13(16X2)
114 2 416
For mixture(Fuel): For Oxygen(Air):
C8H18 + H2 = 114 + 2 = 116 13O2 = 416
Oxygen-Fuel mass ratio:
ସଵଵଵ
=3.59kg
So, we need 3.59 kg of oxygen for every 1 kg of fuel. Since, 23.2 mass percent of air is
actually oxygen, we need:
So, 15.47 for every 1kg of mixture(gasoline-hydrogen). So the stoichiometric air-fuel
ratio of fuel(gasoline-hydrogen) is 15.47. For the parameters, AFR are set to 10 until 20.
Left side Right side
C=8 C=8
H=20 H=20
O=26 O=26
54
Figure 3.12: Air-Fuel Ratio
Figure 3.13: AFR as a parameter

55
Figure 3.14: H2-Vapor
Figure 3.15: Indolene(gasoline) vapor properties

56
After change the value properties of gasoline (indolene) vapor, start the simulation same
with step before. The table for calculation all 4 cases are in shown in appendix 8.
3.9 INTERPRETING DATA
From the raw result that will be displaced after the simulation, the results will be
arranged in order and interpreted. All of the results will be discussed for the reasons and
factors that lead to the output. Also, all the results that come out will be discussed in
terms of their functions and relations to each other.

57
CHAPTER 4
4.1 INTRODUCTION
In this chapter, all the raw results will be arranged and the selected findings will be
discussed briefly to give the proper explanation about the process and the important
point in the results. Below there are the resulted get after running the simulation at 3
different RPM with AFR range from 10 to 20 and after adding hydrogen fuel until 20
percent. The data get from GT-Power software are plotted by using Microsoft Excel so
it looks more understanding.
4.2 RESULT
4.2.1 At 1000 RPM(low engine speed)
Result for NOx and temperature at 1000 rpm(low engine speed)
Equivalent ratio, Φ = AFR stoichiometric / AFR actual
*Air-Fuel Ratio at stoichiometric = 15.47
Table 4.1: Data distribution for 0% hydrogen addition
H2,0%
NOx concentration
(ppm)
Air Fuel
Ratio(actual)
Equivalent
ratio,Φ
Cylinder Temperature
(K)
98.28 10 1.547 588.89
979.78 12 1.289 1337.41
1687.9 14 1.105 1955.88
2187.89 16 0.967 2315.32
1787.9 18 0.859 1987.53

58
1367.88 20 0.774 1616.86
Table 4.2: Data distribution for 5% hydrogen addition
H2,5%
NOx concentration
(ppm)
Air Fuel
Ratio(actual)
Equivalent
ratio,Φ
Cylinder Temperature
(K)
401.3 10 1.547 1019.36
1267.32 12 1.289 1643.86
1979.89 14 1.105 2155.72
2479.88 16 0.967 2424.25
2012.17 18 0.859 2149.71
1606.01 20 0.774 1828.22
Table 4.3: Data distribution for 10% hydrogen addition
H2,10%
NOx concentration
(ppm)
Air Fuel
Ratio(actual)
Equivalent
ratio,Φ
Cylinder Temperature
(K)
689.23 10 1.547 1307.1
1456.23 12 1.289 1832.28
2199.11 14 1.105 2307.25
2678.89 16 0.967 2514.22
2171.45 18 0.859 2323.69
1791.18 20 0.774 2032.83
Table 4.4: Data distribution for 15% hydrogen addition
H2,15%
NOx concentration
(ppm)
Air Fuel
Ratio(actual)
Equivalent
ratio,Φ
Cylinder Temperature
(K)
923.76 10 1.547 1676.15
1672.9 12 1.289 2064.49
59
2348.9 14 1.105 2468.8
2849.76 16 0.967 2636.74
2401.78 18 0.859 2499.84
2017.78 20 0.774 2330.59
Table 4.5: Data distribution for 20% hydrogen addition
H2,20%
NOx concentration
(ppm)
Air Fuel
Ratio(actual)
Equivalent ratio,Φ Cylinder
Temperature (K)
1116.8 10 1.547 1925.44
1895.87 12 1.289 2250.2
2574.87 14 1.105 2603.73
3049.78 16 0.967 2712.96
2689.56 18 0.859 2619.13
2339.78 20 0.774 2522.05
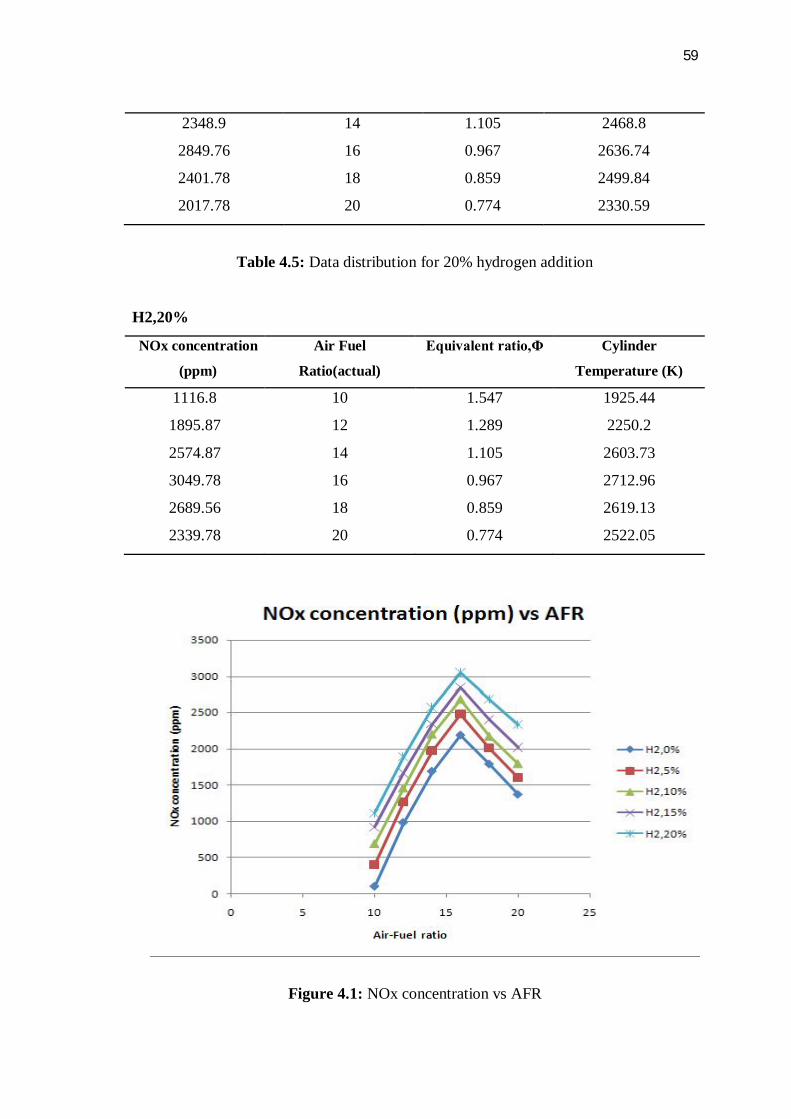
Figure 4.1: NOx concentration vs AFR

60
Figure 4.2: NOx concentration vs equivalent ratio
Figure 4.3: Cylinder temperature vs AFR

61
From figure 4.1, the entire graphs are shown in increasing before decreasing
when air-fuel ratio is increase. For the beginning when there is no hydrogen added to
the gasoline engine, at AFR 10 NOx concentration is 98.28 ppm and maximum
concentration occur at AFR 16 which is 1367.88 ppm. After 5 percent added, there are
slightly increasing in NOx concentration and the maximum concentration occur at AFR
16 which is 1606.01 ppm. For 10 and 15 percent hydrogen added the maximum
concentration occurred at 16 AFR which are 1791.18 ppm and 2017.78 ppm
respectively. Lastly, for 20 percent hydrogen added, maximum concentration occurred
at 16 AFR which is 2339.78 ppm.
From figure 4.2, all of the graph is increase with increasing of equivalent ratio
but it decrease at certain point of equivalent ratio and the maximum concentration
always occurred at 0.967 Φ where for 0 percent hydrogen added, maximum
concentration is 2187.89 ppm. For 5 percent hydrogen added, the highest concentration
is 2479.88 ppm. For 10 percent hydrogen added, the maximum concentration is 2678.89
ppm. For 15 percent hydrogen added, the highest concentration is 2849.76 ppm. For 20
percent hydrogen added, the maximum concentration is 3049.78 ppm.
From figure 4.3, the entire graph is increasing before it decrease at certain point.
For 0 percent hydrogen added, the lowest temperature occurred at 10 AFR which is
588.89 K while the highest occurred at 16 AFR which is 2315.32 K. For 5 percent
hydrogen added, minimum temperature occurred at 10 AFR which is 1019.36 K while
maximum occurred at 16 AFR which is 2424.25 K. For 10 percent hydrogen added, the
lowest temperature occurred at 10 AFR which is 1307.1 K while the highest occurred at
16 AFR which is 2514.22 K. For 15 percent hydrogen added, the lowest temperature
occurred at 10 AFR which is 1676.15 K while the highest occurred at 16 AFR which is
2636.74 K. For 20 percent hydrogen added, minimum temperature occurred at 10 AFR
which is 1925.44 K while maximum occurred at 16 AFR which is 2712.96 K.

62
4.2.2 At 3000 RPM(medium engine speed)
Result for NOx and temperature at 3000 rpm(medium engine speed)
Table 4.6: Data distribution for 0% hydrogen addition
H2,0%
NOx concentration
(ppm)
Air Fuel
Ratio(actual)
Equivalent
ratio,Φ
Cylinder Temperature
(K)
98.28 10 1.547 588.89
979.78 12 1.289 1337.41
1687.9 14 1.105 1955.88
2187.89 16 0.967 2315.32
1787.9 18 0.859 1987.53
1367.88 20 0.774 1616.86
Table 4.7: Data distribution for 5% hydrogen addition
H2,5%
NOx concentration
(ppm)
Air Fuel
Ratio(actual)
Equivalent
ratio,Φ
Cylinder Temperature
(K)
401.3 10 1.547 1019.36
1267.32 12 1.289 1643.86
1979.89 14 1.105 2155.72
2479.88 16 0.967 2424.25
2012.17 18 0.859 2149.71
1606.01 20 0.774 1828.22
Table 4.8: Data distribution for 10% hydrogen addition
H2,10%
NOx concentration
(ppm)
Air Fuel
Ratio(actual)
Equivalent
ratio,Φ
Cylinder Temperature
(K)
689.23 10 1.547 1307.1
63
1456.23 12 1.289 1832.28
2199.11 14 1.105 2307.25
2678.89 16 0.967 2514.22
2171.45 18 0.859 2323.69
1791.18 20 0.774 2032.83
Table 4.9: Data distribution for 15% hydrogen addition
H2,15%
NOx concentration
(ppm)
Air Fuel
Ratio(actual)
Equivalent
ratio,Φ
Cylinder Temperature
(K)
923.76 10 1.547 1676.15
1672.9 12 1.289 2064.49
2348.9 14 1.105 2468.8
2849.76 16 0.967 2636.74
2401.78 18 0.859 2499.84
2017.78 20 0.774 2330.59
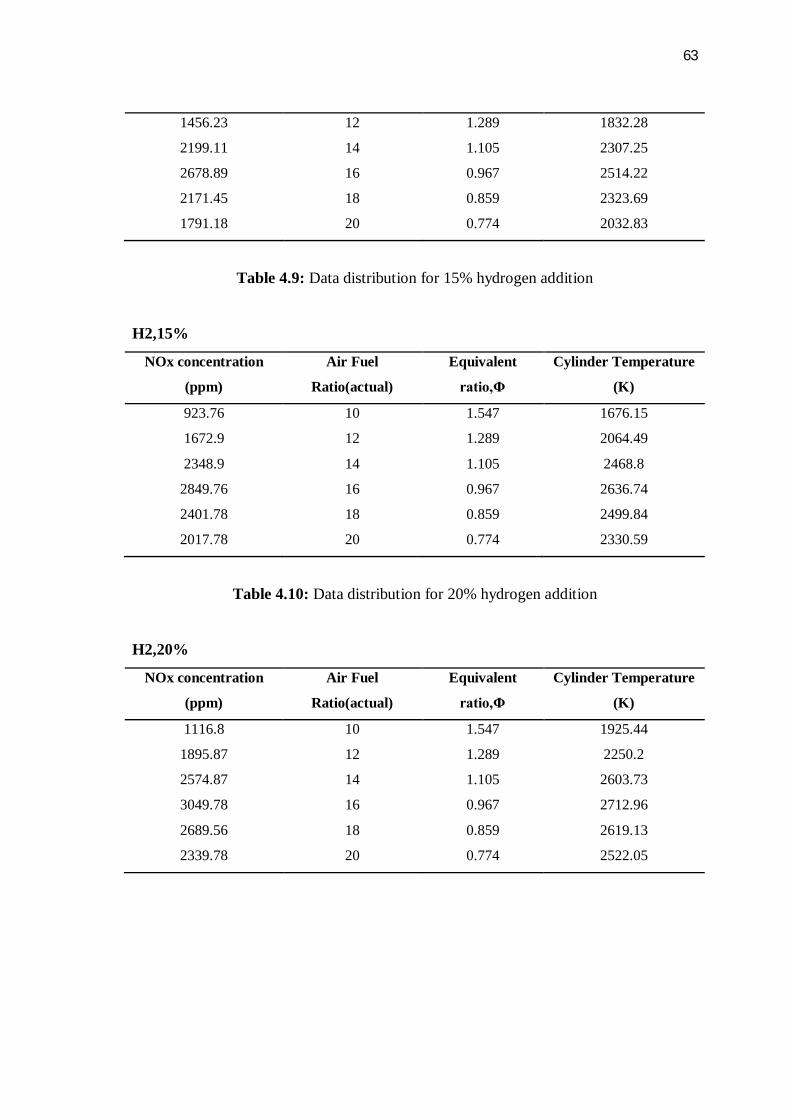
Table 4.10: Data distribution for 20% hydrogen addition
H2,20%
NOx concentration
(ppm)
Air Fuel
Ratio(actual)
Equivalent
ratio,Φ
Cylinder Temperature
(K)
1116.8 10 1.547 1925.44
1895.87 12 1.289 2250.2
2574.87 14 1.105 2603.73
3049.78 16 0.967 2712.96
2689.56 18 0.859 2619.13
2339.78 20 0.774 2522.05
64
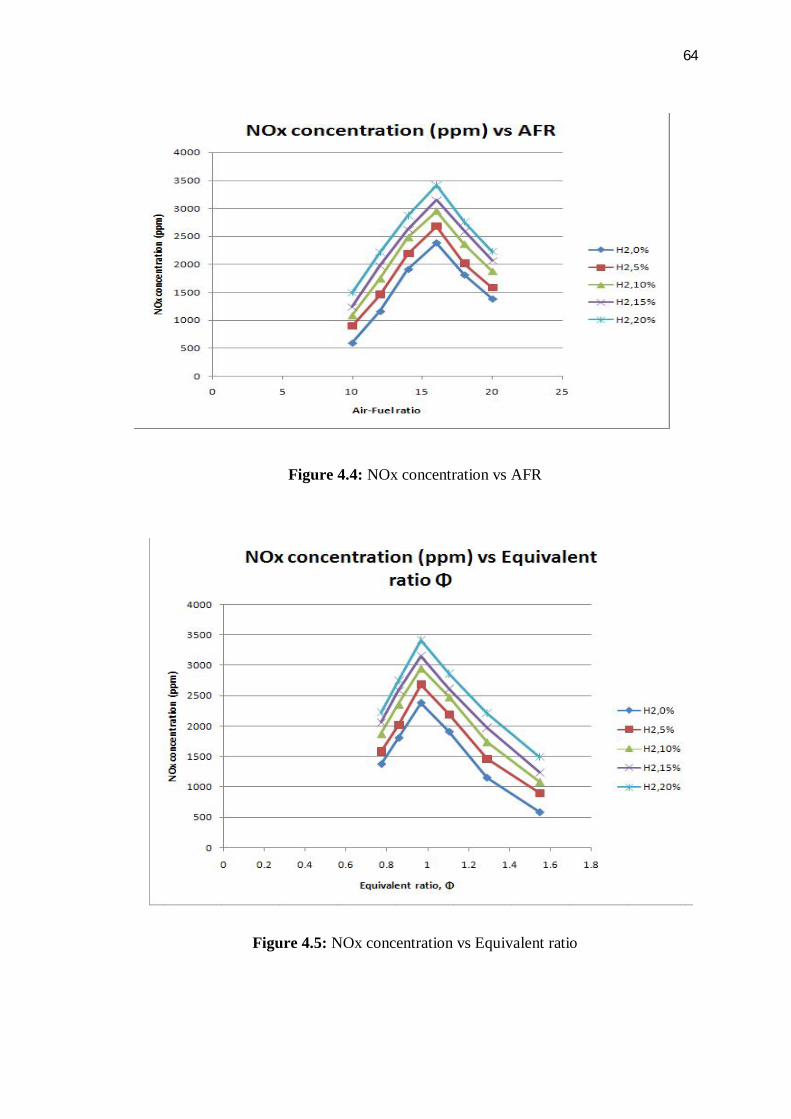
Figure 4.4: NOx concentration vs AFR
Figure 4.5: NOx concentration vs Equivalent ratio

65
Figure 4.6: Temperature vs AFR
From figure 4.4, the entire graph is shown in increasing before decreasing when
air-fuel ratio is increase. For the beginning when there is no hydrogen added to the
gasoline engine, maximum concentration occurred at AFR 16 which is 2379.89 ppm.
After 5 percent added, there are slightly increasing in NOx concentration and the
maximum concentration occurred at AFR 16 which is 2678.81 ppm. For 10 percent
hydrogen added the highest concentration occurred at 16 AFR which are 2950.77 ppm.
For 15 and 20 percent hydrogen added, maximum concentration occurred at 16 AFR
which is 3148.87 ppm and 3414.56 ppm respectively.
From figure 4.5, the entire graph is increase with increasing of equivalent ratio
but it decrease at certain point of equivalent ratio. For 0 percent hydrogen added,
maximum NOx concentration occurred at 0.964 Φ which is 2379.89 ppm. For 5 percent
hydrogen added, the highest NOx concentration occurred at 0.964 Φ which is 2678.81
ppm. For 10 percent hydrogen added, peak NOx concentration occurred at 0.964 Φ
which is 2950.77 ppm. For 15 percent hydrogen added, maximum NOx concentration
occurred at 0.964 Φ which is 3148.87 ppm. For 20 percent hydrogen added, the highest
NOx concentration occurred at 0.964 Φ which is 3414.56 ppm.
66
From figure 4.6, the entire graph is increasing before it decreases at certain
point. For 0 percent hydrogen added, the lowest temperature occurred at 10 AFR which
is 1618 K while the highest occurred at 16 AFR which is 2365.32 K. For 5 percent
hydrogen added, minimum temperature occurred at 10 AFR which is 1849.45 K while
maximum occurred at 16 AFR which is 2459.88 K. For 10 percent hydrogen added, the
lowest temperature occurred at 10 AFR which is 2006.94 K while the highest occurred
at 16 AFR which is 2581.41 K. For 15 percent hydrogen added, the lowest temperature
occurred at 10 AFR which is 2110.2 K while the highest occurred at 16 AFR which is
2776.52 K. For 20 percent hydrogen added, minimum temperature occurred at 10 AFR
which is 2271.18 K while maximum occurred at 16 AFR which is 2876.59 K.
4.2.3 At 5000 RPM(high engine speed)
Result for NOx and temperature at 5000 rpm(high engine speed)
Table 4.11: Data distribution for 0% hydrogen addition
H2,0%
NOx concentration
(ppm)
Air Fuel
Ratio(actual)
Equivalent
ratio,Φ
Cylinder Temperature
(K)
707.8 10 1.547 1416.86
1456.58 12 1.289 1987.53
2116.38 14 1.105 2455.88
2587.98 16 0.967 2665.32
1994.6 18 0.859 2357.41
1408.87 20 0.774 1918
Table 4.12: Data distribution for 5% hydrogen addition
H2,5%
NOx concentration
(ppm)
Air Fuel
Ratio(actual)
Equivalent
ratio,Φ
Cylinder Temperature
(K)
998.81 10 1.547 1665.21
1770.33 12 1.289 2183.42
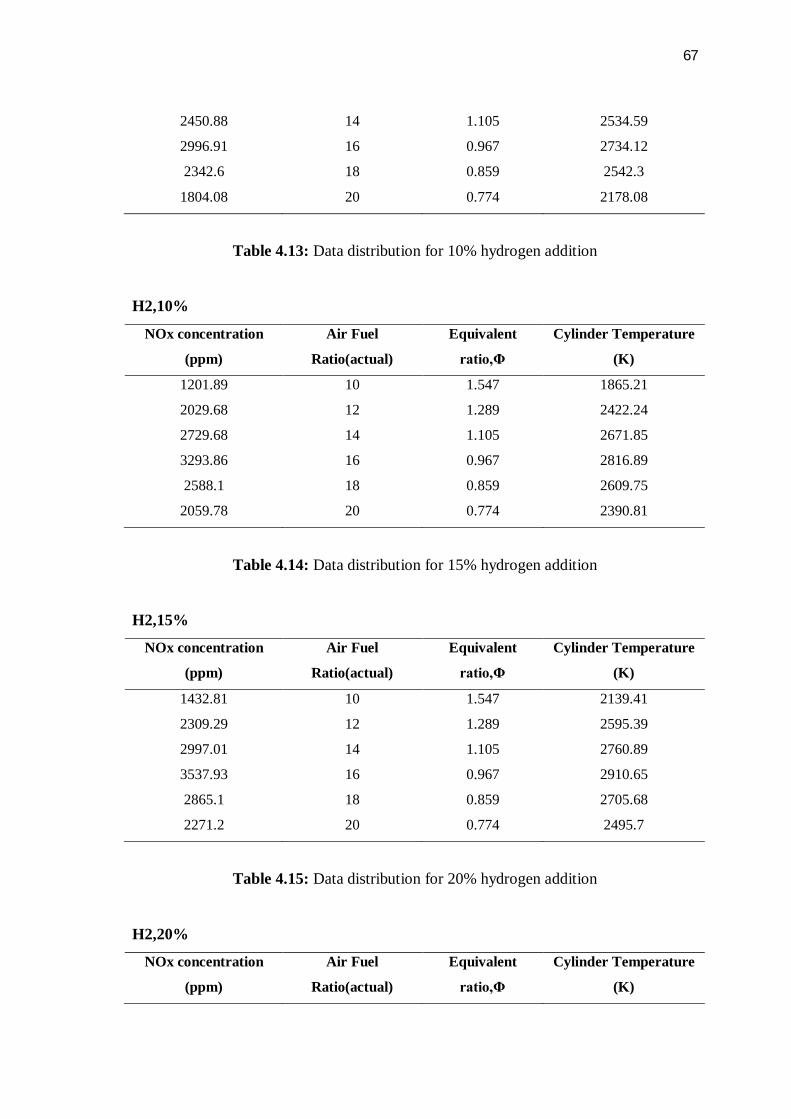
67
2450.88 14 1.105 2534.59
2996.91 16 0.967 2734.12
2342.6 18 0.859 2542.3
1804.08 20 0.774 2178.08
Table 4.13: Data distribution for 10% hydrogen addition
H2,10%
NOx concentration
(ppm)
Air Fuel
Ratio(actual)
Equivalent
ratio,Φ
Cylinder Temperature
(K)
1201.89 10 1.547 1865.21
2029.68 12 1.289 2422.24
2729.68 14 1.105 2671.85
3293.86 16 0.967 2816.89
2588.1 18 0.859 2609.75
2059.78 20 0.774 2390.81
Table 4.14: Data distribution for 15% hydrogen addition
H2,15%
NOx concentration
(ppm)
Air Fuel
Ratio(actual)
Equivalent
ratio,Φ
Cylinder Temperature
(K)
1432.81 10 1.547 2139.41
2309.29 12 1.289 2595.39
2997.01 14 1.105 2760.89
3537.93 16 0.967 2910.65
2865.1 18 0.859 2705.68
2271.2 20 0.774 2495.7
Table 4.15: Data distribution for 20% hydrogen addition
H2,20%
NOx concentration
(ppm)
Air Fuel
Ratio(actual)
Equivalent
ratio,Φ
Cylinder Temperature
(K)

68
1659.89 10 1.547 2489.59
2583.42 12 1.289 2719.68
3290.47 14 1.105 2904.51
3867.63 16 0.967 3073.22
3092.87 18 0.859 2850.02
2470.9 20 0.774 2654.93
Figure 4.7: NOx concentration vs AFR

69
Figure 4.8: NOx concentration vs Equivalent ratio
Figure 4.9: Temperature vs AFR
From figure 4.7, the entire graph is shown in increasing before decreasing when
air-fuel ratio is increase. Starting with no hydrogen added to the gasoline engine,
maximum concentration occurs at AFR 16 which is 2216.38 ppm. After 5 percent
added, there are slightly increasing in NOx concentration and the maximum
concentration occur at AFR 16 which is 2750.88 ppm. For 10 percent hydrogen added
there are slightly difference where maximum concentration occurred at 16 AFR which
are 3029.68 ppm. For 15 and 20 percent hydrogen added, maximum concentration
occurred at 16 AFR which is 3537.01 ppm and 3990.47 ppm respectively.
From figure 4.8, the entire graph is increase with increasing of equivalent ratio
but it decrease at certain point of equivalent ratio. For 0 percent hydrogen added,
maximum NOx concentration occurred at 0.964 Φ which is 2587.98 ppm. For 5 percent
hydrogen added, the highest NOx concentration occurred at 0.964 Φ which is 2996.91
ppm. For 10 percent hydrogen added the peak NOx concentration occurred at 0.964 Φ

70
which is 3293.86 ppm. For 15 percent hydrogen added, maximum NOx concentration
occurred at 0.964 Φ which is 3537.93 ppm. For 20 percent hydrogen added, highest
NOx concentration occurred at 0.964 Φ which is 3867.63 ppm.
From figure 4.9, the entire graph is increasing before it decreases at certain
point. For 0 percent hydrogen added, the lowest temperature occurred at 10 AFR which
is 1416.86 K while the highest occurred at 16 AFR which is 2665.32 K. For 5 percent
hydrogen added, minimum temperature occurred at 10 AFR which is 1665.21 K while
maximum occurred at 16 AFR which is 2734.12 K. For 10 percent hydrogen added, the
lowest temperature occurred at 10 AFR which is 1865.21 K while the highest occurred
at 16 AFR which is 2816.89 K. For 15 percent hydrogen added, the lowest temperature
occurred at 10 AFR which is 2139.41 K while the highest occurred at 16 AFR which is
2910.65 K. For 20 percent hydrogen added, minimum temperature occurred at 10 AFR
which is 2489.59 K while maximum occurred at 16 AFR which is 3073.22 K.
4.3 DISCUSSION
4.3.1 Effect of NOx emission on Air-Fuel Ratio
From those graph it can be seen that while operating close to stoichiometric
conditions the addition of hydrogen has little impact on the NOx concentration.The
highest NOx concentration mostly found at 16 AFR which is about 0.964 Φ where near
to stoichiometric AFR which is 15.47. As described in the theory NOx concentration
has a maximum in the fuel-lean zone ( Φ < 1). This maximum comes from the amount
of excess oxygen existing in the fuel-lean region (Changwei Ji, Shuofeng Wang, 2009).
And at for Φ > 1, it seems that NOx cencentration decrease or less than fuel-lean region.
It is because a fuel-rich air-fuel ratio does not have enough oxygen to react with all the
carbon and hydrogen, and both HC and CO emissions increase. Although the hydrogen-
enriched engine ejects more NOx emissions when the excess air ratio is around
stoichiometric conditions, NOx emissions for all hydrogen enrichment levels drop to an
acceptable value when the engine runs under rich conditions, (Φ > 1).

71
4.3.2 Effect of NOx emission on Cylinder Temperature
The generation of NOx emission is a function of the combustion temperature
(Williard W. Pulkrabek, 2004), being greatest near stoichiometric conditions when
temperatures are the highest. Peak emission occurs at slightly lean conditions, where the
combustion temperature is high and there is an excess of oxygen react with the nitrogen
(John B. Heywood, 1988). Beside that the increment of NOx emission is increasing
with increasing of hydrogen addition to the gasoline engine. Because temperatures
cylinder is raised after hydrogen addition. So NOx emissions increase with the increase
of hydrogen addition level (Changwei Ji, Shuofeng Wang, 2009). With increasing of
hydrogen addition level, the relevant excess air ratio for the maximum NOx emissions
slightly increase. The possible explanation could be that the higher hydrogen addition
fraction is, the more air is needed for hydrogen to be fully burnt to produce higher in-
cylinder temperature. Because of the existence of inhomogeneity of gasoline–hydrogen–
air mixture in the cylinder, a larger excess air ratio is needed for the hydrogen contained
in the gasoline–hydrogen–air mixture a larger hydrogen addition fraction to be fully
combusted to produce a maximum cylinder temperature. So the higher hydrogen
addition fraction is, the larger excess air ratio is required to accomplish the maximum
cylinder temperature and form the maximum NOx emissions. From the result also, NOx
emission is slightly increase with increasing the engine speed because the NOx
concentration of the three different engine speed are differ from each other. As increase
an engine speed the NOx emission also increase.
72
CHAPTER 5
CONCLUSION
5.1 INTRODUCTION
The 1-D simulation is essential to model or to analyze the engine. From the 1-D
simulation, the information and performance of the engine can be obtained. From the
analysis of the engine, optimum engine speed for the operating condition of the engine
can be determined. Also, any other performances and analysis can be obtained like NOx
concentration emission, brake specific fuel consumption, pressure and temperature at
combustion chamber also can be determined.
5.2 CONCLUSION
For this thesis, the effect of hydrogen addition to gasoline fuel on NOx emission
are investigated. The analysis was performed by using GT-Power simulation software
with default parameters. From this analysis, NOx emission is increasing with percentage
of hydrogen fuel addition. Also, the temperatures have big influence in NOx formation
whereas with the addition of hydrogen causes an increase in peak burned gas
temperatures. Consequently, the hydrogen addition level will increase cylinder
temperature and increase favours the formation of NO over NO2 and also causes an
increase in NO formation rates. NOx formations also depends on pressure, air-fuel ratio,
and combustion time within the cylinder and the chemical reactions not being
instantaneous.

73
5. 3 RECOMMENDATION
As a recommendation, at some point, there are some recommendations in order
to overcome the constraints during the simulations. This recommendation can be used
for the future in order to improve this project so that more successfully and to achieve
quality finding.
For this study it is important to get more precise result, the simulation result
should be compare with the experimental result so that the result get from the 1 of the
method not very far different.
Besides that, the simulation must conduct on real baseline engine design which
is used parameter measured from real engine in order to get a better result and easier to
do a comparison with the experimental result.

74
REFERENCES
Apostolescu N, Chiriac R. A study of combustion of hydrogen-enriched gasoline in a spark ignition engine. SAE Paper 1996; 960603.
Bell SR, Gupta M, Extension of the lean operating limit for natural gas fuelling of a spark ignited engine using hydrogen blending. Combust Sci and Tech 1997;123:23–48
Das, L.M., “Hydrogen Engines: A Review of the Past and A Look into the Future”, International Journal of Hydrogen Energy, Vol. 15, No. 6, pp.425-443, 1990
Jacob Wall, Effect of Hydrogen Enriched Hydrocarbon Combustion on Emissions and Performance, Department of Biological and Agricultural Engineering University of Idaho, 2008.
Effect of hydrogen addition on combustion and emissions performance of a spark ignition gasoline engine at lean conditions, Changwei Ji*, Shuofeng Wang, College of Environmental and Energy Engineering, Beijing University of Technology, Beijing 100124, China.
Gasoline Vs Hydrogen Fuel Cell, L. David Roper, [email protected], 20 January 2006
Hydrogen internal combustion engine for stationary applications, A. Boyano *, A. Fernandez, P. de la Vega Guascor R+D, Technological Park of Alava, C/Leonardo da Vinci 15, 1015 Miñano, Spain.
Jingding L, Linsong G, Tianshen D. Formation and restraint of toxic emissions in hydrogen–gasoline mixture fueled engines. International Journal Hydrogen Energy 1998.
Karim, G.A., “Hydrogen as a spark ignition engine fuel, International Journal of Hydrogen Energy, Vol. 28 (2003).
Li, H.L. and Karim, G.A. 2005, “An Experimental Investigation of S.I. Engine Operations on Lean Gaseous Fuels Mixtures”, Transaction of SAE, Journal of Engines, Vol. 114-3 (2005).
Lucas GG, Richards WL. The hydrogen/petrol engine—the means to give good part- load thermal efficiency. SAE Paper 1982; 820315.
May H, Gwinner D. Possibilities of improving exhaust emissions and energy consumption in mixed hydrogen gasoline operation. International Journal Hydrogen Energy, 1983.
Heywood, J.B. 1988. Internal combustion engine fundamentals. USA: McGraw-Hill.

75
Modelling NOx-Formation in Combustion Processes, Christian Schwerdt, Department of Automatic Control Lund University, June 2006.
Munshi, S.R., et al., “Hydrogen Blended Natural Gas Operation of a Heavy Duty Turbo-Charged Lean Burn Spark Ignition Engine”, SAE Paper 2004.
Rauckis MJ, McLean WJ. The effect of hydrogen addition on ignition delays and flame propagation in spark ignition engines. Combust Science Technology 1979;19:207–16.
Simulation Investigation of Intake Static Pressure of CNG Engine, (1)Semin, (2)Abdul R. Ismail and (2)Rosli A. Bakar, Department of Marine Engineering, Institute of Technology Sepuluh Nopember, Surabaya 60111, Indonesia, Faculty of Mechanical Engineering, University Malaysia Pahang, Locked Bag 12, 25000 Kuantan, Pahang, Malaysia.
Stebar RF, Parks FB. Emission control with lean operation using hydrogen- supplemented fuel. SAE Paper 1974; 740187.
The addition of hydrogen to a gasoline-fuelled SI engine, T. D’Andreaa, P.F. Henshawa D.S.-K. Tingb aCivil and Environmental Engineering, University of Windsor, 401, Sunset Avenue, Windsor, ON, Canada N9B 3P4 bMechanical, Materials and Automotive Engineering, University of Windsor, Windsor, ON, Canada N9B 3P4, 2004.
The Gasoline 4-Stroke Engine for Automobiles, Garrett W. Balich and Conrad R. Aschenbach Department of Aerospace and Mechanical Engineering University of Notre Dame Notre Dame, IN 46556, May 6, 2004
Topinka, J., Gerty, M.D., and Heywood, J.B Knock Behavior of a Lean-Burn, H2 and CO-Enhanced, SI Gasoline Engine Concept”, SAE Paper 2004-01-0975
Varde KS. Combustion characteristics of small spark ignition engines using hydrogen supplemented fuel mixtures. SAE Paper 1981; 810921.
V Ganesan, Professor Department Of Mechanical Engineering, Indian Institute Of Technology, Madras Chennai – Internal Combustion Engines Second Editions, Tata McGraw Hill, 2003.
White C.M., Steeper, R.R., and Lutz, A.E., “The hydrogen-fuelled internal combustion engine: a technical review”. International Journal of Hydrogen Energy 31 (2006).
Zabidi Bin Mohamad, University Malaysia Pahang 2008, Investigation of 1- Dimensional analysis for two-stroke spark ignition(SI) engine.

76
APPENDIX A
1)
2)
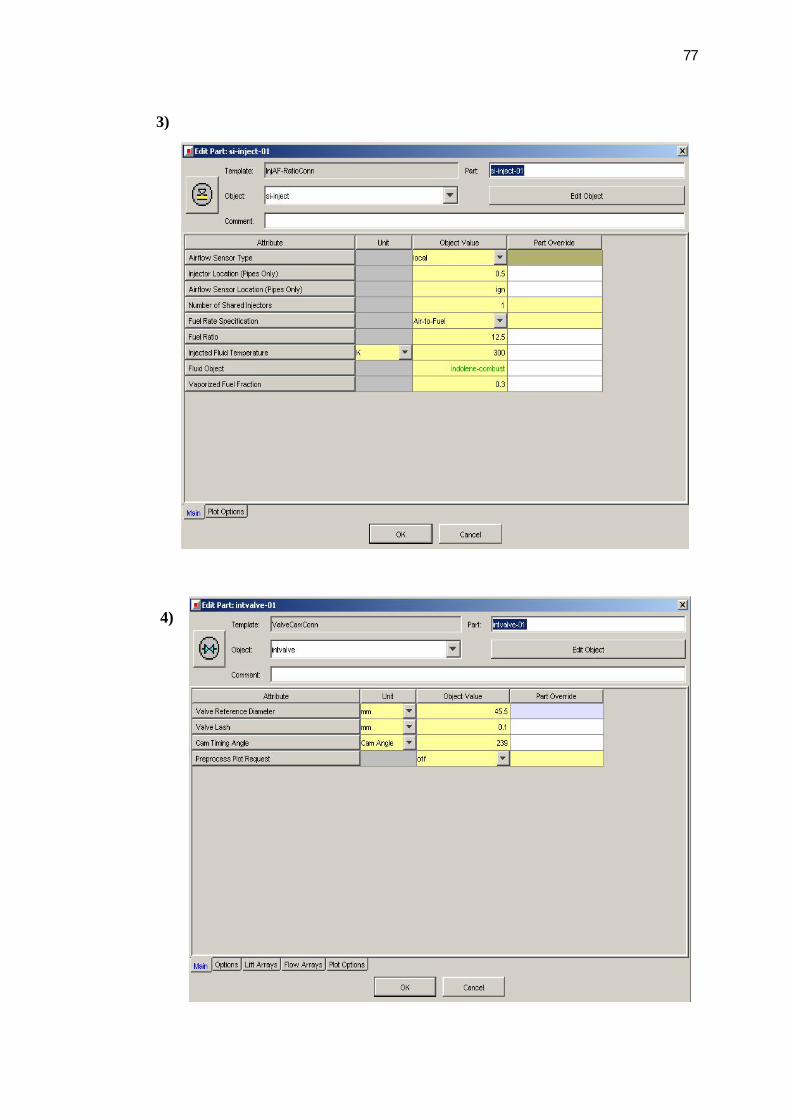
77
3)
4)
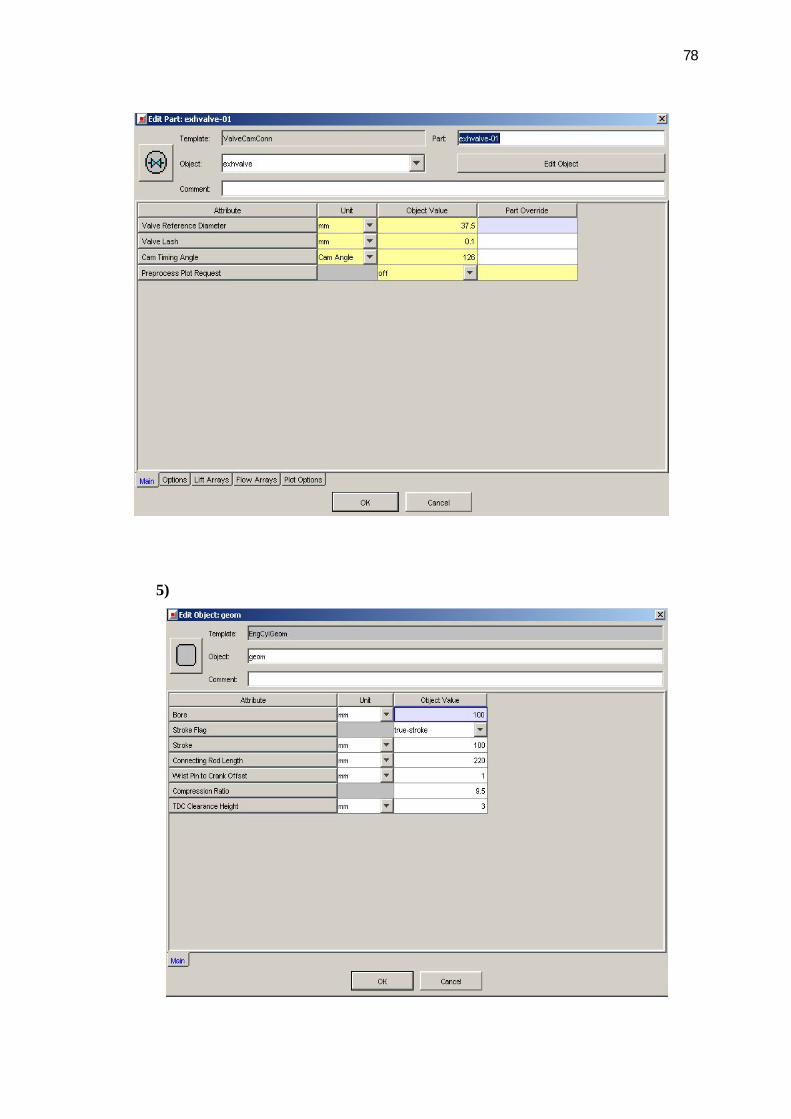
78
5)

79
6)
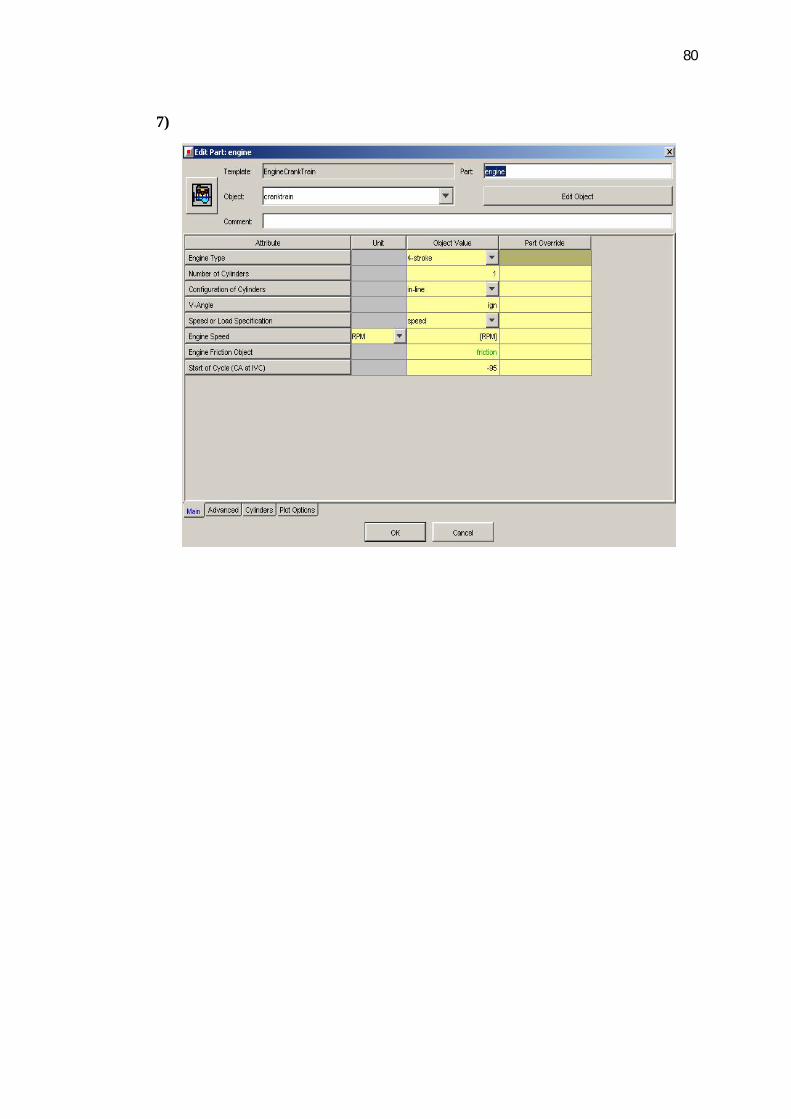
80
7)

81
APPENDIX B
1)
#Case 1 Ratio hydrogen vapor to gasoline vapor
Attribute
Properties
Hydrogen vapor Gasoline vapor
Total 100% 0% 5% 100% 95%
Carbon atom
per molecule
0 0 7.93 7.5335 7.5335
Hydrogen atom
per molecule
2 0.1 14.8 14.06 14.16
Oxygen atom
per molecule
0 0 0 0 0
Nitrogen atom
per molecule
0 0 0 0 0
Lower heating
value
1.1994e+8
J/Kg
5.997e+6
J/Kg
4.395e+7
J/Kg
4.17525e+7
J/Kg
4.77495e+7
J/Kg
Critical
temperature
33.2 K 1.66 K 568.8 K 540.36 K 542.02 K
Critical pressure 13 bar 0.65 bar 24.9 bar 23.655 bar 24.305 bar
Minimum valid
temperature
100 K 5 K 100 K 95 K 100 K
Maximum valid
temperature
4000 K 200 K 1200 K 1140 K 1340 K
Minimum valid
pressure
0.01 bar 0.0005 bar 0.01 bar 0.0095 bar 0.01 bar
Maximum valid
pressure
300 bar 15 bar 300 bar 285 bar 300 bar
#Case 2
Attribute
Properties
Hydrogen vapor Gasoline vapor
Total 100% 0% 10% 100% 90%

82
Carbon atom per
molecule
0 0 7.93 7.137 7.137
Hydrogen atom per
molecule
2 0.2 14.8 13.32 13.52
Oxygen atom per
molecule
0 0 0 0 0
Nitrogen atom per
molecule
0 0 0 0 0
Lower heating value 1.1994e+8
J/Kg
1.1994e+7
J/Kg
4.395e+7
J/Kg
3.9555e+7
J/Kg
5.1549e+7
J/Kg
Critical temperature 33.2 K 3.32 K 568.8 K 511.92 K 515.24 K
Critical pressure 13 bar 1.3 bar 24.9 bar 22.41 bar 23.71 bar
Minimum valid
temperature
100 K 10 K 100 K 90 K 100 K
Maximum valid
temperature
4000 K 400 K 1200 K 1080 K 1480 K
Minimum valid
pressure
0.01 bar 0.001 bar 0.01 bar 0.009 bar 0.01 bar
Maximum valid
pressure
300 bar 30 bar 300 bar 270 bar 300 bar
#Case 3
Attribute
Properties
Hydrogen vapor Gasoline vapor
Total 100% 0% 15% 100% 85%
Carbon atom per
molecule
0 0 7.93 6.7495 6.7495
Hydrogen atom
per molecule
2 0.3 14.8 12.58 12.88
Oxygen atom per
molecule
0 0 0 0 0
Nitrogen atom per
molecule
0 0 0 0 0
Lower heating
value
1.1994e+8
J/Kg
1.7991e+7
J/Kg
4.395e+7
J/Kg
3.73575e+7
J/Kg
5.53485e+7
J/Kg
Critical 33.2 K 4.98 K 568.8 K 483.48 K 488.46 K

83
temperature
Critical pressure 13 bar 1.95 bar 24.9 bar 21.165 bar 23.115 bar
Minimum valid
temperature
100 K 15 K 100 K 85 K 100 K
Maximum valid
temperature
4000 K 600 K 1200 K 1020 K 1620 K
Minimum valid
pressure
0.01 bar 0.00015 bar 0.01 bar 0.0085 bar 0.01 bar
Maximum valid
pressure
300 bar 45 bar 300 bar 255 bar 300 bar
#Case 4
Attribute
Properties
Hydrogen vapor Gasoline vapor
Total 100% 0% 20% 100% 80%
Carbon atom per
molecule
0 0 7.93 6.344 6.344
Hydrogen atom per
molecule
2 0.4 14.8 11.84 12.24
Oxygen atom per
molecule
0 0 0 0 0
Nitrogen atom per
molecule
0 0 0 0 0
Lower heating
value
1.1994e+8
J/Kg
2.3988e+7
J/Kg
4.395e+7
J/Kg
3.516e+7
J/Kg
5.9148e+7
J/Kg
Critical temperature 33.2 K 6.64 K 568.8 K 455.04 K 461.68 K
Critical pressure 13 bar 2.6 bar 24.9 bar 19.92 bar 22.52 bar
Minimum valid
temperature
100 K 20 K 100 K 80 K 100 K
Maximum valid
temperature
4000 K 800 K 1200 K 960 K 1760 K
Minimum valid
pressure
0.01 bar 0.002 bar 0.01 bar 0.008 bar 0.01 bar
Maximum valid
pressure
300 bar 60 bar 300 bar 240 bar 300 bar
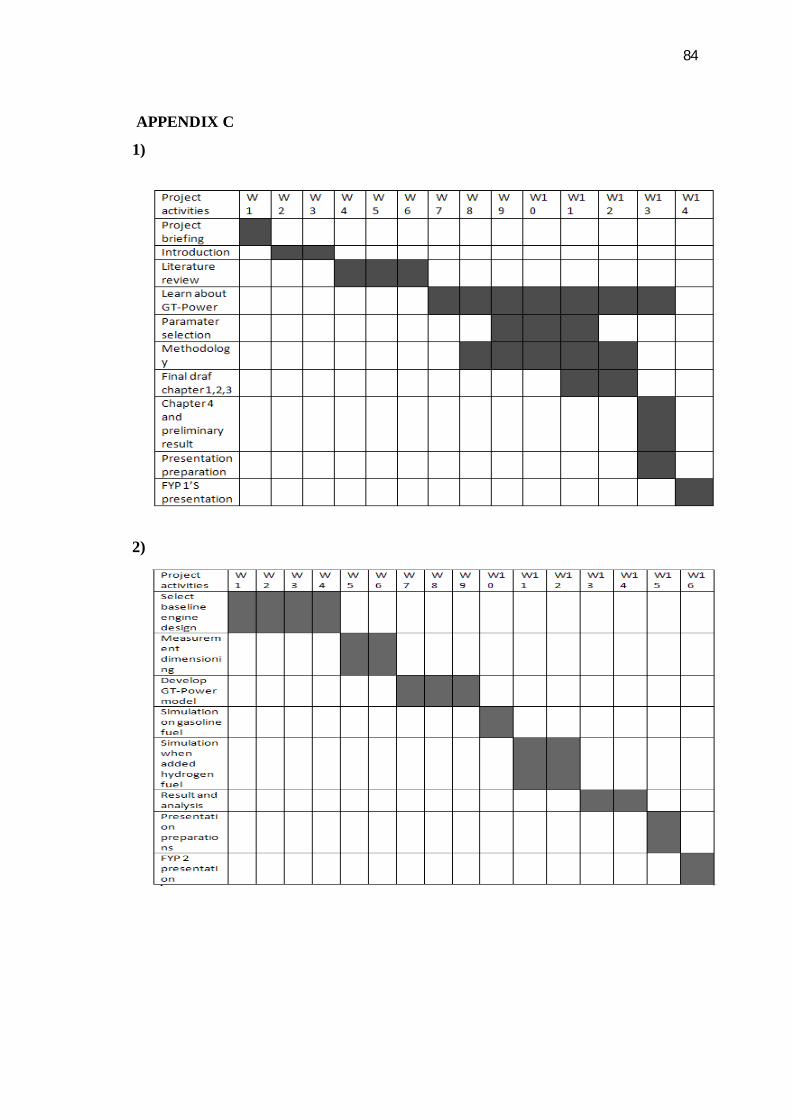
84
APPENDIX C
1)
2)