ADC_Fetal & Neonatal _March2009
111
Egyptian_Pediatric yahoo group http://health.groups.yahoo.com/group/ egyptian_pediatric/ Egyptian_Pediatric yahoo group http://health.groups.yahoo.com/group/ egyptian_pediatric/
-
Upload
ravi-mandyam -
Category
Documents
-
view
128 -
download
1
Transcript of ADC_Fetal & Neonatal _March2009

Egyptian_Pediatric yahoo group
http://health.groups.yahoo.com/group/egyptian_pediatric/
Egyptian_Pediatric yahoo group
http://health.groups.yahoo.com/group/egyptian_pediatric/

Journal of the Royal College of
Paediatrics and Child Health
Editor-in-Chief
Howard Bauchner
Deputy Editors
Patrick CartlidgeImti ChoonaraMartin Ward Platt
Commissioning Editor
Patrick Cartlidge
Perspectives Editor
Ieuan Hughes
Editorial Office
Archives of Disease in ChildhoodBMJ Publishing Group LtdBMA HouseTavistock SquareLondon WC1H 9JR, UKT: +44 (0)20 7383 6331F: +44 (0)20 7383 6668E: [email protected]
ISSN: 0003-9888 (print)ISSN: 1359-2998 (online)
Impact factor 2.342
Disclaimer: ADC is published by BMJ PublishingGroup Ltd (a wholly owned subsidiary of the BritishMedical Association) and the Royal College ofPaediatrics and Child Health. The owners granteditorial freedom to the Editor of ADC. ADC followsguidelines on editorial independence produced bythe World Association of Medical Editors and thecode on good publication practice of the Committeeon Publication Ethics.
ADC is intended for medical professionals and isprovided without warranty, express or implied.Statements in the journal are the responsibility of theirauthors and advertisers and not authors’ institutions,the BMJ Publishing Group, the Royal College ofPaediatrics and Child Health or the BMA unlessotherwise specified or determined by law.Acceptance of advertising does not implyendorsement.
To the fullest extent permitted by law, the BMJPublishing Group shall not be liable for any loss, injuryor damage resulting from the use of Heart or anyinformation in it whether based on contract, tort, orotherwise. Readers are advised to verify anyinformation they choose to rely on.
Copyright E2009 BMJ PublishingGroupand RoyalCollege of Paediatrics and Child Health. All rightsreserved; no part of this publication may bereproduced, stored in a retrieval system, ortransmitted in any form or by any means, electronic,mechanical, photocopying, recording, or otherwisewithout prior permission.
ADC is published by BMJ Publishing Group Ltd,typeset by The Charlesworth Group, and printed in theUK on acid-free paper from sustainable forests byCambrian Printers Limited, Aberystwyth, UK.
ADC Fetal & Neonatal Edition (USPS No: 015-715) ispublished bimonthly by BMJ Publishing Group anddistributed in the USA by SPP, 75 Aberdeen Road,Emigsville, PA 17318. Periodicals postage paid atEmigsville, PA. POSTMASTER: sendaddress changesto Archives of Disease in Childhood, PO Box 437,Emigsville, PA 17318-0437, USA.
FantomsF79 M Ward Platt
Original articlesF80 The effect of two levels of pressure support
ventilation on tidal volume delivery and minuteventilation in preterm infantsS Gupta, S K Sinha, S M Donn
F84 Volume-guarantee ventilation: pressure maydecrease during obstructed flowK I Wheeler, C J Morley, C O F Kamlin,P G Davis
F87 Oxygen saturation and heart rate during deliveryroom resuscitation of infants ,30 weeks’gestation with air or 100% oxygenJ A Dawson, C O F Kamlin, C Wong, A B te Pas,C P F O’Donnell, S M Donath, P G Davis,C J Morley
F92 No change in developmental outcome withincubator covers and nesting for very preterminfants in a randomised controlled trialC M Maguire, F J Walther, P H T van Zwieten,S Le Cessie, J M Wit, S Veen, On behalf of theLeiden Developmental Care Project
F98 Psychological stress of parents of preterm infantsenrolled in an early discharge programme fromthe neonatal intensive care unit: a prospectiverandomised trialP Saenz, M Cerda, J L Dıaz, P Yi, M Gorba,N Boronat, P Barreto, M Vento
F105 Risk of stillbirth and neonatal death linked withmaternal mental illness: a national cohort studyS King-Hele, R T Webb, P B Mortensen,L Appleby, A Pickles, K M Abel
F111 Impact of shielding parenteral nutrition from lighton routine monitoring of blood glucose andtriglyceride levels in preterm neonatesM Khashu, A Harrison, V Lalari, J-C Lavoie,P Chessex
F116 Random safety audits in the neonatal unitL Lee, S Girish, E van den Berg, A Leaf
F120 Enteral feeding regimens and necrotisingenterocolitis in preterm infants: a multicentrecase–control studyG Henderson, S Craig, P Brocklehurst, W McGuire
F124 Cytokine gene polymorphisms in preterm infantswith necrotising enterocolitis: genetic associationstudyG Henderson, S Craig, R J Baier, N Helps,P Brocklehurst, W McGuire
F129 Neonatal extracorporeal membrane oxygenation:practice patterns and predictors of outcome inthe UKA Karimova, K Brown, D Ridout, W Beierlein,J Cassidy, J Smith, H Pandya, R Firmin,M Liddell, C Davis, A Goldman
F133 Sleeping position, oxygenation and lung function inprematurely born infants studied post termT Saiki, H Rao, F Landolfo, A P R Smith,S Hannam, G F Rafferty, A Greenough
F138 How common are rib fractures in extremely lowbirth weight preterm infants?D Smurthwaite, N B Wright, S Russell,A J Emmerson, M Z Mughal
F140 Mortality of twin and singleton livebirths under30 weeks’ gestation: a population-based studyB Ray, M P Ward Platt
F144 Neonatal infections in AsiaR Tiskumara, S H Fakharee, C Q Liu,P Nuntnarumit, K M Lui, M Hammoud,J K F Lee, C B Chow, A Shenoi, R Halliday,D Isaacs, on behalf of APNIS (Asia-PacificNeonatal Infections Study)
Short reportsF149 Neonatal blood pressure waves are associated
with surges of systemic noradrenalineB Wefers, S Cunningham, R Stephen, N McIntosh
F152 Early individualised parenteral nutrition forpreterm infantsS Eleni-dit-Trolli, E Kermorvant-Duchemin,C Huon, M Mokthari, K Husseini, M-L Brunet,C Dupont, A Lapillonne
PostScriptF154 Impact of delayed screening for prolonged
jaundice in the newbornM Tyrell, S Hingley, C Giles, J O Menakaya
F154 Hydrocortisone treatment for severe evolvingbronchopulmonary dysplasia and cerebralhaemodynamicsG Cambonie, R Mesnage, C Milesi, A Rideau,C Veyrac, J-C Picaud
F155 Differences between the amino acid concentra-tions of umbilical venous and arterial bloodH Tsuchiya, K Matsui, T Muramatsu, T Ando,F Endo
F156 Comparison of peripheral and cerebral tissueoxygenation index in neonatesK Grossauer, G Pichler, G Schmolzer, H Zotter,W Mueller, B Urlesberger
F156 Correction
Images in neonatal medicineF104 The seasonal orchidometer
C Durand, J Gibbs
F137 Depressed skull fracture in a newborn babyS T Dharmaraj, N D Embleton, A Jenkins, G Jones
This article has been chosen by the Editor to be of special interestor importance and is freely available online.
Articles carrying the Unlocked Logo are freely available onlineunder the BMJ Journals unlocked scheme.See http://adc.bmj.com/info/unlocked.dtl
C O P E C O M M I T T E E O N P U B L I C A T I O N E T H I C S
This journal is a member of and subscribes to the principles of theCommittee on Publication Ethics
www.publicationethics.org.uk
Contents Volume 94 Number 2 | ADC Fetal and Neonatal Edition March 2009

doi:10.1136/adc.2008.140921 2009;94;F104 Arch. Dis. Child. Fetal Neonatal Ed.
C Durand and J Gibbs
The seasonal orchidometer
http://fn.bmj.com/cgi/content/full/94/2/F104Updated information and services can be found at:
These include:
Rapid responses http://fn.bmj.com/cgi/eletter-submit/94/2/F104
You can respond to this article at:
serviceEmail alerting
the top right corner of the article Receive free email alerts when new articles cite this article - sign up in the box at
Notes
http://journals.bmj.com/cgi/reprintformTo order reprints of this article go to:
http://journals.bmj.com/subscriptions/ go to: Archives of Disease in Childhood - Fetal and Neonatal EditionTo subscribe to
on 5 March 2009 fn.bmj.comDownloaded from

22. Forcada-Guex M, Pierrehumbert B,Borghini A,et al. Early dyadic patterns of mother-infantinteractions and outcomes of prematurity at 18 months. Pediatrics 2006;118:e107–14.
23. Arnaud F. Discharge of very preterm infants from neonatology: check list. J GynecolObstet Biol Reprod 2004:S108–10.
24. Sauve R, Lee SK. Neonatal follow-up programmes and follow-up studies: Historicaland current perspectives. Paediatr Child Health 2006;11:267–70.
25. Executive Committee of the Connecticut Chapter of the AAP. NeonatalIntensive care Unit (NICU). Discharge Guidelines 2005.
26. Kotagal UR, Perlstein PH, Gamblian V, et al. Description and evaluation of aprogramme for the early discharge of infants from a neonatal intensive care unit.J Pediatr 1995;127:285–90.
27. Casiro OG, McKenzie Me, McFadyen L, et al. Earlier discharge with community-based intervention for low birth weight infants: a randomized trial. Pediatrics1993;92:128–34.
28. Raddish M, Merrit TA. Early discharge of premature infants. A critical analysis. ClinPerinatol 1998;25:499–520.
29. Melnyk BM, Feinstein NF, Alpert-Gillis L, et al. Reducing premature infants’ length ofstay and improving parents’ mental health outcomes with the creating opportunitiesfor parent empowerment (COPE) neonatal intensive care unit programme: arandomized, controlled trial. Pediatrics 2006;118:e1414–27.
30. Allen EC, Manuel JC, Legault C, et al. Perception of child vulnerability amongmothers of former premature infants. Pediatrics 2004;113:267–73.
31. Spear ML, Leef K, Epps S, et al. Family reactions during infants’ hospitalization in theneonatal intensive care unit. Am J Perinat 2002;19:205–13.
32. Wigert H, Johansson R, Berg M, et al. Mothers’ experiences of havingtheir newborn child in a neonatal intensive care unit. Scand J Caring Sci2006;20:35–41.
33. Vento M, Saenz P, Valle S, et al. Early discharge programme from the NICU with co-operation of the Primary Care Paediatrician. EPAS 2006;595535.204.
34. Garel M, Bahaud M, Blondel B. Consequences for the family of a very preterm birthtwo months after discharge. Results of EPIPAGE qualitative study. Arch Pediatr2004;11:1299–307.
The seasonal orchidometer
In springtime, as crocuses emerge, daffodils blossom and lambsgambol in the fields, paediatricians’ thoughts naturally turn toorchidometers. A seminal paper in 2001 elegantly demonstratedhow a Teaser sweet could be substituted for an 8 mlorchidometer bead.1 This provided grateful paediatricians witha readily available means to assess mid-puberty in adolescentboys as well as a source of sustenance at the end of a busy clinic.To the dismay of many paediatricians, by 2007 the testicularTeaser had mutated into a flat-bottomed dome that retained itsedible qualities but was quite useless as an orchidometersubstitute.2 The manufacturer was urged to reinstate Teasersto their former aesthetic and functional glory. Fortunately, asshown in the illustration, the Teaser has been refashioned intoits celebrated orchidometer shape, although somewhat dimin-ished as a 6 ml rather than 8 ml orchidometer bead, along withGalaxy, Mars and Milky Way mini eggs. Furthermore, theEastertide appearance of the Cadbury mini creme egg providesan excellent substitute for the 10 ml orchidometer bead with allthe tactile and edible qualities so well described in relation tothe Teaser. The standard Cadbury creme egg, although slightlytoo large to substitute as an orchidometer bead, is a usefulindicator of a pathologically enlarged testis. Each spring,paediatricians should grasp this seasonal opportunity of anedible orchidometer with both hands. We’ve got the balls—let’snot be afraid to use them.
C Durand, J Gibbs
Department of Paediatrics, Countess of Chester Hospital, Chester, Cheshire, UK
Correspondence to: J Gibbs, Department of Paediatrics, Countess of ChesterHospital, Liverpool Road, Chester CH2 1UL, Cheshire, UK ; [email protected]
Acknowledgements: Thanks to R Cooke for his photographic expertise and forrefraining from eating the artwork.
Competing interests: None.
Arch Dis Child Fetal Neonatal Ed 2009;94:F104. doi:10.1136/adc.2008.140921
REFERENCES1. Bhalla P, Sally, Pippa, et al. An inexpensive and edible aid for the diagnosis of puberty
in the male: multispecies evaluation of an alternative orchidometer. BMJ2001;323:1486.
2. Williams G, Dharmaraj P. Dissent of the testis. BMJ 2007;335:1287.
Figure 1 The seasonal orchidometer.
Images in neonatal medicine
Original article
F104 Arch Dis Child Fetal Neonatal Ed March 2009 Vol 94 No 2
on 5 March 2009 fn.bmj.comDownloaded from

doi:10.1136/adc.2007.135459 online 10 Nov 2008;
2009;94;F105-F110; originally publishedArch. Dis. Child. Fetal Neonatal Ed. S King-Hele, R T Webb, P B Mortensen, L Appleby, A Pickles and K M Abel
maternal mental illness: a national cohort studyRisk of stillbirth and neonatal death linked with
http://fn.bmj.com/cgi/content/full/94/2/F105Updated information and services can be found at:
These include:
References
http://fn.bmj.com/cgi/content/full/94/2/F105#BIBL
This article cites 27 articles, 13 of which can be accessed free at:
Rapid responses http://fn.bmj.com/cgi/eletter-submit/94/2/F105
You can respond to this article at:
serviceEmail alerting
the top right corner of the article Receive free email alerts when new articles cite this article - sign up in the box at
Notes
http://journals.bmj.com/cgi/reprintformTo order reprints of this article go to:
http://journals.bmj.com/subscriptions/ go to: Archives of Disease in Childhood - Fetal and Neonatal EditionTo subscribe to
on 5 March 2009 fn.bmj.comDownloaded from

Risk of stillbirth and neonatal death linked withmaternal mental illness: a national cohort study
S King-Hele,1 R T Webb,1,3 P B Mortensen,2 L Appleby,1 A Pickles,3 K M Abel1
c Additional tables arepublished online only at http://adc.bmj.com/content/vol94/issue2
1 Centre for Women’s MentalHealth, University ofManchester, Manchester, UK;2 National Centre for Register-Based Research, University ofAarhus, Aarhus, Denmark;3 Biostatistics/HealthMethodology Research Group,University of Manchester,Manchester, UK
Correspondence to:Dr K M Abel, Centre forWomen’s Mental Health,University of Manchester, 2ndFloor East, University Place,Oxford Road, Manchester M139PL, UK. [email protected]
Accepted 22 August 2008Published Online First10 November 2008
ABSTRACTBackground: Babies of mothers with psychotic disordersare known to have higher rates of poor obstetric outcome,including higher mortality rates.Objective: To estimate risks of stillbirth and neonataldeath by specific causes in babies of mothers withhistories of severe mental illness, relative to the generalpopulation.Methods: A cohort of 1.45 million live births and 7021stillbirths during 1973–98 was identified from Danishnational registers. These registers were linked to identifybabies who were stillborn or died neonatally afterexposure to maternal psychiatric illness.Results: Risks of stillbirth and neonatal death were raisedfor virtually all causes of death for all of the maternalpsychiatric diagnostic categories. For most causes ofdeath, offspring of women with schizophrenia and relateddisorders had no greater risks of stillbirth or neonataldeath than offspring of women with other maternalpsychiatric disorders (eg, neonatal death (NND) due toimmaturity: relative risks (95% CI) schizophrenia andrelated disorders: 1.1 (0.4 to 3.5), affective disorders: 2.0(1.2 to 3.5)). There was a greater risk of fatal congenitalmalformation associated with a history of maternalaffective disorder (stillbirth 2.4 (1.1 to 5.1), NND 2.1 (1.4to 3.3)) or schizophrenia and related disorders (stillbirth2.4 (0.8 to 7.6), NND 2.2 (1.1 to 4.1)) than with maternalalcohol/drug-related disorders (stillbirth 1.2 (0.4 to 3.8),NND 1.1 (0.6 to 2.2)).Conclusions: Higher risk of perinatal loss may be linkedto factors associated with maternal psychiatric illness ingeneral, such as insufficient attendance for antenatal careand unhealthy lifestyles rather than the maternal mentalillness itself.
Raised risks of perinatal death in babies of womenwith psychiatric illness have been found in anumber of studies.1–4 Gaining a greater under-standing of these risks is an important publichealth concern, especially since increasing numbersof mentally ill women now become pregnant.5
Previous research has found raised risks of perinataldeath associated with maternal schizophrenia,1–3
maternal psychotic disorder4 and parental schizo-phrenia,2 6 7 and raised risks of stillbirth amongwomen with affective or substance-related dis-orders in the general US population.8 Our researchhas suggested that higher risks of neonatal deathare associated with maternal affective or alcohol/drug-related disorders than with maternal schizo-phrenia and related disorders.2 Several studies havefound no evidence of raised risks for either stillbirthor neonatal death in the offspring of women witheither schizophrenia,9 bipolar or unipolar disorders9
or affective psychosis adjusted for a range offactors including maternal smoking history.10
The psychiatric journals have tended to concen-trate on associations between psychiatric diagnoses(especially schizophrenia) and poor birth out-comes: Bennedsen et al found raised risks ofcongenital malformations in babies of womenwith schizophrenia in Denmark,11 but paediatricpublications have focused on the effects of drugand alcohol misuse on birth outcomes. Manystudies have identified maternal substance abuseduring pregnancy as a risk factor for a range of poorbirth outcomes such as congenital malformationsof varying type and severity, prematurity andperinatal death.12–15
In this study we aimed to examine a range ofspecific causes of perinatal death in babies ofwomen with psychiatric inpatient histories,including substance-related disorders. We exam-ined the problem of rarity of exposure (severematernal mental illness) and rarity of outcome(perinatal death) by using data from the largepopulation registers available in Denmark.
METHODS
Study cohortWe identified all live and stillbirths between 1January 1973 and 31 December 1998 using datafrom the Danish Civil Registration System.16 EachDanish resident is assigned a unique number whichmay be used to link information about the
What is already known on this topic
c A number of studies have linked raised risks ofperinatal death to serious mental illness in themother; a few studies have not found raisedrisks in this population.
c Maternal substance and alcohol abuse duringpregnancy has been linked to raised risks ofbabies having poor birth outcomes.
What this study adds
c The degree of raised perinatal mortality risklinked with serious maternal mental disorderdoes not vary greatly or systematically by causeof death or by type of mental illness.
c This lack of specificity suggests that multiplecausal mechanisms are involved and thatcomplex approaches to intervention aretherefore required.
Original article
Arch Dis Child Fetal Neonatal Ed 2009;94:F105–F110. doi:10.1136/adc.2007.135459 F105
on 5 March 2009 fn.bmj.comDownloaded from

individual between different registers to a high degree ofcompleteness. We used the Central Population Register contain-ing the date of birth, death and emigration of each person livingin Denmark, the Psychiatric Central Register recording diag-noses for all psychiatric inpatient admissions since 1969,17 theCause of Death Register18 and the Medical Births Register,19
which record the cause of death or stillbirth, respectively, since1973. The International Classification of Diseases (ICD) 8threvision20 was used from 1 January 1973 to 31 December 1993and the 10th revision21 thereafter. We used 1 January 1973 as thestudy entry date because the Medical Births Register wascomputerised from that date. Causes of stillbirth were notrecorded in the Medical Births Register after 31 December 1996.A stillbirth is recorded in Denmark when the fetus is lost at28 weeks’ gestation or later.22 A neonatal death is one thatoccurs during the first 28 days of life.
We restricted our cohort to singleton births since observationsfrom multiple birth sets are not statistically independent. Weidentified 7021 stillbirths between 1 January 1973 and 31December 1996, and 1 450 329 live births between 1 January1973 and 31 December 1998.
Exposure status and maternal psychiatric admissionBabies were ‘‘exposed’’ to maternal mental illness if theirmother was admitted to hospital with any psychiatric illness (orspecific diagnostic category) before the offspring date of birth(live or stillborn). Diagnoses of maternal mental illness werecategorised using ICD-8 and ICD-10 codes below; we includedall admissions for psychiatric disorders in women aged 16 yearsand over. These groups of codes were selected for reasons ofclinical relevance, and have been used in other Danish registrystudies.2
c Schizophrenia and related disorders: (schizophrenia, schizo-phrenia-like disorders and schizoaffective disorders) ICD-8:295, 296.8, 297, 298.39, 301.83; ICD-10: F20–F29.
c Affective disorders: (bipolar disorder and other affectivedisorders) ICD-8: 296.09, 296.19, 296.29, 296.39, 296.99,298.09, 298.19, 300.49, 301.19; ICD-10: F30–F39.
c Alcohol/drug-related disorders: alcohol-related disorders: ICD-8: 291, 303; ICD-10: F10 and drug-related disorders: ICD-8:294.3, 304, 980.09; ICD-10: F11–F16, F18–F19.
Cause-of-death classificationsWe classified causes of death according to the ICD codes for theprimary cause of stillbirth or neonatal death that were recordedin the national registers. The ICD-8 and ICD-10 codes used ineach category of stillbirth and neonatal death are shown in theAppendix, table A1. These codes were selected by an obste-trician (Dr Louise Kenny; see ‘‘Acknowledgements’’) on thebasis of clinical relevance.
ModellingWe used Poisson regression (STATA, version 8.0) to estimaterelative risks of mortality in the offspring of mothers previouslyadmitted with mental illness, compared with unexposedoffspring. We compared the cause-specific stillbirth rates andneonatal mortality in exposed versus unexposed populations,with relative risks estimated as risk ratios. The risk of stillbirthwas calculated as the number of deaths divided by the numberof live and stillbirths; risk of neonatal death was the number ofdeaths over the number of live births. Using Poisson modelsthese risk ratios were adjusted for 5-year period bands. Weadditionally adjusted for maternal age at birth for stillbirths,and maternal age at birth, birth order and offspring sex for livebirths (these additional adjustments made no material differ-ence to the effect and variance estimates, and so these resultsare not included in this paper).
A previous study using the same dataset to 1993 estimatedrelative risks of stillbirth and neonatal death using generalisingestimating equation methods to take account of familialclustering effects.11 Since most perinatal deaths occurred duringthe early part of the period, and the previous study found littledifference between results using this method and those thatmade no such adjustment, we chose not to use methods whichaccount for within-family correlation. This decision was furthersupported by prior validation work conducted by one of thisstudy’s coauthors (RTW) using the same study cohort wereport in this paper.23
RESULTS
StillbirthsOf the 7021 stillbirths, 188 were exposed to a history of anymaternal psychiatric admission before birth. Of these mothers,
Figure 1 Relative risks of stillbirth tomothers admitted with psychiatric illnesscompared with the Danish generalpopulation, 1973–96. Maternalpsychiatric history and cause of stillbirth:Affect, affective disorders; Alc/drug,alcohol or drug-related disorders; Schizo,schizophrenia and related disorders.
Original article
F106 Arch Dis Child Fetal Neonatal Ed 2009;94:F105–F110. doi:10.1136/adc.2007.135459
on 5 March 2009 fn.bmj.comDownloaded from

19 had been admitted for schizophrenia and related disorders, 47for affective disorders and 38 for alcohol/drug-related disorders.Figure 1 and supplementary table 1 (online only) show therelative risks of cause-specific stillbirth linked with maternaladmission for specific psychiatric disorders, compared with thegeneral population.
The risks of stillbirth are raised for each of the causes of deathfor all of the maternal psychiatric diagnostic categories. Some ofthe relative risks are more than twofold but we found nopattern of raised risks by either cause of stillbirth or maternaldiagnostic category. Maternal psychiatric history of alcohol/drug-related disorder is associated with a greater than twofoldincreased risk of stillbirth due to complications of delivery(relative risk (RR) = 2.3, 95% confidence interval (CI) 1.2 to 4.2)and similar raised risks for stillbirth due to congenitalmalformations of the fetus in women with histories of affectivedisorders (RR = 2.4, 95% CI 1.1 to 5.1). Non-significant raisedrisks were seen in women with schizophrenia and relateddisorders, where there were only three women in the exposedgroup (RR = 2.4, 95% CI 0.8 to 7.6, n = 3). ‘‘All other causes ofstillbirth’’ include those due to injury to the mother or due tomaternal illness. We found sevenfold and twofold raised risks,respectively, for these causes of death (injury to mother:RR = 7.5, 95% CI 2.9 to 19.0, n = 5; maternal illness:RR = 2.5, 95% CI 1.3 to 4.8, n = 10).
Neonatal deathsOf the 6646 neonatal deaths, 201 were of offspring of motherswho were previously admitted for any psychiatric illness (22with maternal schizophrenia and related disorders, 66 withmaternal affective disorders and 55 with maternal alcohol/drug-related disorders). Figure 2 and supplementary table 2 (onlineonly) show the relative risks of cause-specific neonatal deathlinked with history of maternal admission for specific psychia-tric disorders, compared with the general population.
The relative risk of each cause of neonatal death for each typeof maternal psychiatric history was raised, with one exception.This was neonatal death due to anoxia and birth injury to theinfant brain in children of women with histories of schizo-phrenia and related disorders (RR = 0.9, 95% CI 0.2 to 3.7).
Compared with the general population, a maternal history ofalcohol/drug-related disorder was associated with a greater thanthreefold raised risk of both neonatal death due to anoxia andbirth injury to the brain (RR = 3.4, 95% CI 2.1 to 5.6), and‘‘other conditions originating in the perinatal period’’ (RR = 3.8,95% CI 2.1 to 6.9). We found greater than doubled risks ofneonatal death in babies of women with histories of affectivedisorders for death due to anoxia and birth injury to the brain(RR = 2.6, 95% CI 1.6 to 4.3), ‘‘other conditions originating inthe perinatal period’’ (RR = 2.3, 95% CI 1.2 to 4.7) andcongenital malformations (RR = 2.1, 95% CI 1.4 to 3.3). Ahistory of schizophrenia and related disorders is associated withgreater than doubled risks of neonatal death due to congenitalmalformations compared with the general population(RR = 2.2, 95% CI 1.1 to 4.1).
Similarities between risks of stillbirth and neonatal deathAcross the maternal diagnostic categories, there were similarpatterns of relative risks between stillbirth and neonatal deathfrom congenital malformations, and between stillbirth due tocomplications of delivery, which include anoxia and birth injuryto the brain, and neonatal death as a result of anoxia and birthinjury to the brain.
DISCUSSION
Main findingsWe observed raised risks of stillbirth and neonatal death for eachcause of death and for all maternal psychiatric histories, withonly one exception. In addition, we did not find higher risks ofstillbirth or neonatal death in babies of women with schizo-phrenia and related disorders compared with the otherpsychiatric disorders. A markedly raised risk of stillbirth afterinjury to the mother was indicated amongst women with anypsychiatric admission history, compared with the generalpopulation, but this result was based on just five deaths inthe exposed population. A history of maternal schizophreniaand related disorder or maternal affective disorder was found tobe a greater risk factor for perinatal death due to congenitalmalformation than maternal history of substance-related
Figure 2 Neonatal deaths: relative risksof mortality for offspring of mothersadmitted with psychiatric illnesscompared with the Danish generalpopulation, 1973–98. Maternalpsychiatric history and cause of neonataldeath: Affect, affective disorders; Alc/drug, alcohol or drug-related disorders;Schizo, schizophrenia and relateddisorders.
Original article
Arch Dis Child Fetal Neonatal Ed 2009;94:F105–F110. doi:10.1136/adc.2007.135459 F107
on 5 March 2009 fn.bmj.comDownloaded from

disorders. Our results are consistent with previous studiesreporting raised risks of stillbirth and neonatal death inoffspring of women with schizophrenia.1
Strengths and limitationsData were collected prospectively over a 26-year period and arebased on the whole population of Denmark, allowing us toexamine cause-specific outcomes for a range of mental illnesses.A limitation is that we examined offspring outcomes formothers with a history of inpatient admission for severepsychiatric illness, so our results possibly cannot be generalisedto those with less serious mental illness. For this investigationwe had no data to examine whether mothers smoked, drankalcohol or took illicit drugs during pregnancy, and no measuresof socioeconomic status. Prescription of psychotropic drugs,mothers’ physical health status in pregnancy and antenatal careattendance record were also not available from the studyregisters.
Bennedsen et al found comparable point estimates of relativerisk of all-cause stillbirth and neonatal death associated withmaternal schizophrenia using the same data from the Danishregisters over a shorter time period.11 Our study reports relativerisks associated with the wider diagnostic range of maternalschizophrenia and related disorders and over a longer timeperiod, increasing the power of the study.
Since psychiatric data begin from 1969, only the previous 4years of psychiatric history were known for women who gavebirth in 1973, whereas the psychiatric history of women givingbirth in later years was known for a much longer time period.However, any underascertainment of maternal mental illness inthe earlier years would tend to underestimate relative risks inthis period and overall. The number of beds available forpsychiatric patients has decreased since the 1970s.24 Theperinatal mortality rate has also fallen; in our birth cohortthere was an approximate 20% fall in the stillbirth rate betweenthe early 1970s and late 1990s, while the neonatal death rate fellby more than 50%. This study allowed for these cohort effectsin its design by adjusting for period as a covariate.
Timing of psychiatric illness and perinatal deathThis study limited stillbirths and neonatal deaths in the exposedpopulation to those that occurred at some time after anadmission for psychiatric illness, in order to prevent reversecausality bias.25 We thereby aimed to estimate risks associatedwith known serious mental illness before death, and specificallyto exclude mental illness that may in part have beenprecipitated by the loss of a child. Using national Danishregistry data, Li et al reported raised risks of maternal psychiatrichospitalisation in these circumstances.26
Poor lifestyle choices and antenatal careThe general nature of the raised risks seen across all maternaldisorder categories suggests the involvement of risk factorsrelated to the psychiatric population itself, rather than tospecific diagnostic groups. Likely contributory factors to theseraised risks in this population include poor lifestyle choices suchas antenatal smoking and drinking,27 28 and the relatively lowsocioeconomic status of many people with mental healthproblems.29
Raised risks due to complications of delivery, anoxia and birthinjury to the infant brain may be related to poor uptake ofprenatal care in some sections of the psychiatric population.Previous research in the USA has identified psychiatric illness
and substance abuse as a risk factor for receiving inadequateantenatal care30 and other research indicates that late bookingand fewer antenatal visits increase the incidence of babies bornwith low or very low birth weight or preterm birth.29
Conversely, perhaps greater care is taken with women withschizophrenia and similar disorders, illnesses that are regardedas particularly serious. We had no information about the natureof the injuries of the women who lost babies owing to injury tothe mother and, in particular, whether the injuries weresustained accidentally or by violent assault.
Congenital malformationsA maternal history of schizophrenia or affective disorder is agreater risk factor for perinatal death from congenital mal-formations than a maternal history of substance-relatedpsychiatric disorders. The mechanism for this is unclear. Onepossible explanation might be the use of prescribed psychotropicdrugs during pregnancy. Little research has been conducted inthis field and our results require confirmation by replicationusing other datasets.
CONCLUSIONFuture research is required to replicate our findings, particularlywhere we found high relative risks for small numbers ofstillbirths or neonatal deaths in the exposed population. Theraised risks related to psychiatric disorders are probably theresult of a range of factors including social problems which canbe hard to deal with. However, women who have contact withmental health services are a readily identifiable group for whomextra care during and after pregnancy may reduce preventableperinatal deaths. Our results indicate that obstetric, paediatricand mental health workers should be aware that women withmental health problems are in particular need of goodreproductive health planning and antenatal care, ideallyprovided by multidisciplinary teams that can care for theircomplex range of physical and mental needs during pregnancy.
Acknowledgements: We thank Dr Louise Kenny for classifying the stillbirths andneonatal deaths into appropriate cause-of-death categories. We also acknowledge thecontribution of Heine Gøtzsche and Thomas Munk Laursen for linking registers,supplying data and answering queries. In accordance with Danish legislation thisproject was approved by the Danish Data Protection Agency and the relevant Registerauthorities.
Funding: The study was funded by project grant 073935 from the Wellcome Trust,England and by the Stanley Medical Research Institute, Chevy Chase, Maryland.
Competing interests: None.
REFERENCES1. Nilsson E, Lichtenstein P, Cnattingius S, et al. Women with schizophrenia:
pregnancy outcome and infant death among their offspring. Schizophr Res2002;58:221–9.
2. Webb RT, Abel KM, Pickles AR, et al. Mortality risk among offspring of psychiatricinpatients: a population-based follow-up to early adulthood. Am J Psychiatry2006;163:2170–7.
3. Sobel D. Infant mortality and malformations in children of schizophrenic women:preliminary data and suggested research. Psychiatr Q 1961;35:60–4.
4. Howard LM, Goss C, Leese M, et al. Medical outcome of pregnancy in women withpsychotic disorders and their infants in the first year after birth. Br J Psychiatry2003;182:63–7.
5. Oates M. Patients as parents: The risk to children. Br J Psychiatry Suppl1997;170:22–7.
6. Rieder RO, Rosenthal D, Wender P, et al. The offspring of schizophrenics. Fetal andneonatal deaths. Arch Gen Psychiatry 1975;32:200–11.
7. Modrzewska K. The offspring of schizophrenic parents in a North Swedish isolate.Clin Genet 1980;17:191–201.
8. McCabe JH, Martinsson L, Lichtenstein P, et al. Adverse pregnancy outcomes inmothers with affective psychosis. Bipolar Disord 2007;9:305–9.
Original article
F108 Arch Dis Child Fetal Neonatal Ed 2009;94:F105–F110. doi:10.1136/adc.2007.135459
on 5 March 2009 fn.bmj.comDownloaded from

9. Jablensky AV, Morgan V, Zubrick SR, et al. Pregnancy, delivery, and neonatalcomplications in a population cohort of women with schizophrenia and major affectivedisorders. Am J Psychiatry 2005;162:79–91.
10. Gold KJ, Dalton VK, Schwenk TL, et al. What causes pregnancy loss? Pre-existingmental illness as in independent factor. Gen Hosp Psychiatry 2007;29:207–13.
11. Bennedsen BE, Mortensen PB, Olesen AV, et al. Congenital malformations,stillbirths, and infant deaths among children of women with schizophrenia. Arch GenPsychiatry 2001;58:674–9.
12. Jones KL, Smith DW, Ulleland CN, et al. Pattern of malformation in offspring ofchronic alcoholic mothers. Lancet 1973;1:1267–71.
13. Handler A, Kistin N, Davis F, et al. Cocaine use during pregnancy: perinataloutcomes.[see comment]. Am J Epidemiol 1991;133:818–25.
14. Ostrea EM, Jr., Brady M, Gause S, et al. Drug screening of newborns by meconiumanalysis: a large-scale, prospective, epidemiologic study. Pediatrics 1992;89:107–13.
15. Gillogley KM, Evans AT, Hansen RL, et al. The perinatal impact of cocaine,amphetamine, and opiate use detected by universal intrapartum screening.Am J Obstet Gynecol 1990;163:1535–42.
16. Pedersen CB, Gotzsche H, Moller JO, et al. The Danish Civil Registration System: acohort of eight million persons. Dan Med Bull 2006;53:441–9.
17. Munk-Jorgensen P, Mortensen PB. The Danish Psychiatric Central Register. DanMed Bull 1997;44:82–4.
18. Juel K, Helweg-Larsen K. The Danish registers of causes of death. Dan Med Bull1999; 46:354–7.
19. Knudsen LB, Olsen J. The Danish Medical Birth Registry. Dan Med Bull1998;45:320–3.
20. WHO. ICD-8 international classification of diseases. Geneva: World HealthOrganization, 1965.
21. WHO. ICD-10 international classification of diseases. Geneva: World HealthOrganization, 1992.
22. Kesmodel U, Wisborg K, Olsen SF, et al. Moderate alcohol intake during pregnancyand the risk of stillbirth and death in the first year of life. Am J Epidemiol2002;155:305–12.
23. Webb R. Mortality in the offspring of people admitted for psychiatrictreatment: a national cohort study. PhD thesis, University of Manchester, 2007.
24. Søgaard HJ, Godt HH, Blinkenberg S. Trends in psychiatric hospitalization andchanges in admission patterns in two counties in Denmark from 1977 to 1989. SocPsychiatry Psychiatr Epidemiol 1992;27:263–9.
25. Marquis GS, Habicht JP, Lanata CF, et al. Association of breastfeeding and stuntingin Peruvian toddlers: an example of reverse causality bias. Int J Epidemiol1997;26:349–56.
26. Li J, Laursen TM, Precht DH, et al. Hospitalization for mental illness among parentsafter the death of a child. N Engl J Med 2005;352:1190–6
27. Murray JL, Bernfield M. The differential effect of prenatal care on the incidence oflow birth weight among blacks and whites in a prepaid health care plan. N Engl J Med1988;319:1385–91.
28. Lasser K, Boyd JW, Woolhandler S, et al. Smoking and mental illness: a population-based prevalence study. JAMA 2000;284:2606–10.
29. Hudson CG. Socioeconomic status and mental illness: tests of the social causationand selection hypotheses. Am J Orthopsychiatry 2005;75:3–18.
30. Kelly RH, Danielsen BH, Golding JM, et al. Adequacy of prenatal care among womenwith psychiatric diagnoses giving birth in California in 1994 and 1995. Psychiatr Serv1999;50:1584–90.
APPENDIXTable A1 shows the classification of causes of stillbirth and neonatal death.
Table A1 Classification of causes of stillbirth and neonatal death*
Cause of death Description and comments ICD-10 1994-8{ ICD-8 1973–93{
Stillbirths
Antenatal complications Includes:Placental abruption and infarctionPoor growth of placentaInteruterine growth restrictionPre-eclampsiaPrematurity
P01.1-P01.5, P01.8, P02.0-P02.7,P03.0, P03.1, P03.8, P05.0-P05.2,P05.9, P07.3
762.1–762.3, 762.9, 769.0, 769.1, 770.0–770.2,770.8–771.1, 771.9, 776.1, 776.2, 777.0
Complications of delivery Includes:AnoxiaHypoxiaProlapse of umbilical cordDifficult labour with various problems such asmalposition of fetus and birth injury without mentionof cause
O69.8, P20.1, P20.9, P24.0 634.3, 764.4, 764.9, 765.0, 765.1, 765.4, 765.9,766.0, 766.3, 766.4, 766.9, 767.0, 767.4, 767.9,768.0,768.3–768.5, 768.9, 769.2, 769.4, 769.5,769.9, 772.0, 772.8, 772.9, 776.0, 776.3, 776.4,776.9
Congenital malformations ofthe fetus
Includes:Spina bifidaCongenital anomalies of the heart, digestive system,urinary system, etc
Q00.0–Q99.9 740.0–759.9
Maternal illness Includes:Congenital heart disease of the motherChronic hypertension of the motherMaternal diabetesRubellaAn operation
P00.0–P00.4, P00.8, P00.9 760.0–760.5, 761.1– 761.3, 761.6, 761.7, 761.9
Injury to mother Neither ICD-8 nor ICD-10 codes specify the type orcause of the injury to the mother which leads to thestillbirth
P00.5 761.5
All other causes of stillbirth Includes:Unknown causes of deathCancersPostmaturityHaemorrhages
E88.9, P04.3, P23.9, P35.9, P37.9,P39.2, P39.9, P50.3, P52.5, P52.8,P55.0, P54.9, P55.9, P56.0, P70.1,P70.2, P83.2, P95.9
775.0, 775.9, 778.0, 778.2, 779.0, 779.9, 795.0,170.6, 192.2, 199.1, 228.0, 320.9, 593.2, 778.0,778.1, 778.2, 778.9
Neonatal deaths
Immaturity related conditions Includes:Incompetent cervixPremature rupture of membranesRespiratory distress of newborn
P01.0, P01.1, P07.2, P07.3, P220,P228, P22.9
769.0, 769.1, 776.1, 776.2, 777.0
Anoxia and birth injury to thebrain
Includes:Difficult labour with malposition of fetus withasphyxia, anoxia or hypoxiaBirth asphyxia
P10.3, P20.0, P20.9, P21.0, P21.9 765.4, 766.0, 766.4, 767.0, 767.4, 768.0, 772.0,776.3, 776.9
Continued
Original article
Arch Dis Child Fetal Neonatal Ed 2009;94:F105–F110. doi:10.1136/adc.2007.135459 F109
on 5 March 2009 fn.bmj.comDownloaded from

Table A1 Continued
Cause of death Description and comments ICD-10 1994-8{ ICD-8 1973–93{
Other conditions originatingin the perinatal period
Includes:Other maternal conditions unrelated to pregnancyConditions of placenta, placental infarctionConditions of umbilical cordAspiration of contents of birth canalCardiovascular disorders originating in the perinatalperiod
All other codes within P00.0–P99.9not included in either immaturity oranoxia and birth injury to the brain
All other codes within 760.0–779.9 not included ineither immaturity or anoxia and birth injury to thebrain
Congenital malformations Includes:Spina bifidaCongenital anomalies of the heart, digestive system,urinary system, etc
Q00.0–Q99.9 740.0–759.9
All other causes of death(exposed population only{)
Includes:Unknown causes of death and cancers
C76.7, D33.1, G71.1, X990 009.2, 038.9, 258.9, 273.9, 280.0, 285.9, 320.8,320.9, 466.9, 486.0, 567.0, 795.0, 795.8, 796.2,910.5, 913.9, 962.0
*These were the codes used for any maternal psychiatric illness. Owing to small numbers, we grouped together the maternal illnesses, injury to mother and all other causes ofstillbirth categories for specific psychiatric diagnoses; {the codes are only those reported in the medical births or cause-of-death registers as the primary cause of stillbirth or deathin Denmark 1973–98; {the codes in the unexposed population are too numerous to be included in this table. They may be obtained from the corresponding author.
Drug and Therapeutics Bulletin (DTB)
Your key source of unbiased, independent adviceFor over 45 years DTB has been an independent, indispensable part of evidence-based clinical practice.DTB offers healthcare professionals detailed assessment of, and practical advice on, individualmedicines and other treatments, groups of treatment and the overall management of disease.
DTB is now also available online at http://dtb.bmj.com:c browse or search all DTB content from the latest issue back to 1994c email alerting, sophisticated searching, RSS feeds and full text links from cited referencesc interactive services such as My Folders for quick access to articles that you have viewed previously
and My Searches to save and re-use useful searchesc comment online on any DTB article
To subscribe, or for further information, please visit http://dtb.bmj.com
Original article
F110 Arch Dis Child Fetal Neonatal Ed 2009;94:F105–F110. doi:10.1136/adc.2007.135459
on 5 March 2009 fn.bmj.comDownloaded from
doi:10.1136/adc.2007.135327 online 23 Jul 2008;
2009;94;F111-F115; originally publishedArch. Dis. Child. Fetal Neonatal Ed. Chessex Minesh Khashu, Adele Harrison, Vikki Lalari, Jean-Claude Lavoie and Philippe
triglyceride levels in preterm neonateson routine monitoring of blood glucose and Impact of shielding parenteral nutrition from light
http://fn.bmj.com/cgi/content/full/94/2/F111Updated information and services can be found at:
These include:
References
http://fn.bmj.com/cgi/content/full/94/2/F111#BIBL
This article cites 27 articles, 7 of which can be accessed free at:
Rapid responses http://fn.bmj.com/cgi/eletter-submit/94/2/F111
You can respond to this article at:
serviceEmail alerting
the top right corner of the article Receive free email alerts when new articles cite this article - sign up in the box at
Notes
http://journals.bmj.com/cgi/reprintformTo order reprints of this article go to:
http://journals.bmj.com/subscriptions/ go to: Archives of Disease in Childhood - Fetal and Neonatal EditionTo subscribe to
on 5 March 2009 fn.bmj.comDownloaded from

Impact of shielding parenteral nutrition from light onroutine monitoring of blood glucose and triglyceridelevels in preterm neonates
Minesh Khashu,1 Adele Harrison,1 Vikki Lalari,1 Jean-Claude Lavoie,2 Philippe Chessex1
1 Division of Neonatology,Children’s and Women’s HealthCentre of BC, University ofBritish Columbia, Vancouver, BC,Canada; 2 Department ofPediatrics, CHU Sainte–Justine,University of Montreal, QC,Canada
Correspondence to:Philippe Chessex, Division ofNeonatology, Children’s andWomen’s Health Centre of B.C.,4480 Oak St, Vancouver, BC,Canada, V6H 3V4; [email protected]
Accepted 3 July 2008Published Online First23 July 2008
ABSTRACTBackground: Premature infants are vulnerable tocomplications related to oxidative stress. Exposure to lightincreases oxidation products in solutions of totalparenteral nutrition (TPN) such as lipid peroxides andhydrogen peroxide. Oxidative stress impairs glucoseuptake and affects lipid metabolism. Hypothesis: productsof photo-oxidation contaminating TPN affect lipid meta-bolism.Objective: Evaluate the effect of photoprotection of TPNin preterm infants on plasma glucose and triglyceride (TG)concentrations.Design: Secondary analysis of a prospective studyallocating preterm infants to light-exposed (LE, n = 32) orlight-protected (LP, n = 27) TPN.Setting: Level III NICU referral centre for patients ofBritish Columbia.Patients: Preterm infants requiring TPN.Interventions and outcome measures: TG and bloodglucose measured during routine monitoring while on fullTPN were compared between LE and LP.Results: Clinical characteristics were similar between thetwo groups (gestational age 28¡1 wk; birth weight:1.0¡0.1 kg). Nutrient intakes from TPN and fromminimal enteral nutrition were comparable between LEand LP. Blood glucose was higher in preterm infantsreceiving LE (p,0.001). The accumulation of TG withincreasing lipid intake was twice as high with LEaccounting for significantly higher TG levels on days 8 and9 (p,0.05).Conclusions: Failure to photoprotect TPN may causealterations in intermediary metabolism. Shielding TPNfrom light provides a potential benefit for preterm infantsby avoiding hypertriglyceridaemia allowing for increasedsubstrate delivery.
Early nutrition is associated with marked long-term benefits for preterm infants.1 2 In view of thesmall gastric capacity and functional immaturity ofthe gastrointestinal tract, very low birth weightpremature infants require total parenteral nutri-tion (TPN) to help achieve adequate nutritionalintakes until full enteral feeds can be established.
Exposure of TPN to ambient light generatesorganic peroxides3 4 and hydrogen peroxide(H2O2)5 6 that represent an oxidative load7 whichcould be of significance in preterm infants whohave immature antioxidant defences.8 Photo-sensi-tised riboflavin present in parenteral multivitaminpreparations (MVP) catalyses electron transferbetween electron donors such as vitamin C, aminoacids or lipids6 and dissolved oxygen producingH2O2. Shielding TPN from light protects the
solution from the generation of peroxides.9 10 Theinfusion of light-exposed (LE) MVP or H2O2
induces comparable oxidative responses in lungsof guinea pig pups.11 12 In the liver13 and plasma14 ofthese animals, the infusion of LE MVP is associatedwith increased triglyceride (TG) concentrationsuggesting that peroxides infused with TPN mightinterfere with lipid metabolism. Furthermore,oxidative stress impairs glucose uptake in muscleand fat15; therefore, we questioned whether thegeneration of oxidants in TPN could influenceparameters frequently used to monitor the ade-quacy of the metabolic response.
The aforementioned studies and results from ourtrial to evaluate effects of photoprotection of TPNon clinical and biochemical endpoints16–18 promptedus to test in a post hoc analysis whether photo-protection of TPN in preterm infants affectsintermediary metabolism resulting in alterationsin plasma glucose and TG concentrations.
METHODSWe conducted a prospective study in whichpreterm infants were allocated to LE and light-protected (LP) TPN to compare the effects ofshielding TPN on clinical16 17 and on biochemicalendpoints.18 Infants admitted to the NICUbetween 2001 and 2004 and requiring TPN wereeligible for the study. Infants with multiplecongenital anomalies, and those who wereunstable (requiring vasopressors, inhaled nitricoxide or paralysis) or had sepsis were excluded.Allocation to TPN regimens was carried out in the
What is already known on this topic
c Light exposure increases the products ofoxidation in total parenteral nutrition.
c Oxidative stress affects glucose and lipidmetabolism.
What this study adds
c Failure to photoprotect total parenteral nutrition(TPN) causes alterations in routine monitoring ofblood glucose and plasma triglycerides.
c Shielding TPN from light decreases theaccumulation of triglycerides allowing forincreased parenteral delivery of energy in theform of lipid emulsion.
Original article
Arch Dis Child Fetal Neonatal Ed 2009;94:F111–F115. doi:10.1136/adc.2007.135327 F111
on 5 March 2009 fn.bmj.comDownloaded from

pharmacy prior to commencement of the multivitamin/aminoacid/dextrose parenteral nutrition (PN) solution using a compu-ter-generated randomisation sequence. PN was initiated frombirth with amino acid/dextrose solution providing 2.25 g/kg/dof amino acids. Following introduction of micronutrients,minerals, vitamins and lipids on day 2, TPN was increased dailyto achieve full intakes of amino acids, glucose and fat. Lipid wasinitiated at 0.5 g/kg/d in infants with a birth weight ,1000 g, andat 1 g/kg/d in infants .1000 g. PN was increased daily untilachieving full TPN intake: 130 ml/kg/day of amino acid/dextrosesolution + 1.5 ml/kg/day of multivitamins (MVP: Multi-12Pediatric, Sandoz, Montreal, QC, Canada) and 20 ml/kg/day of20% lipid solution (Intralipid 20%, Pharmacia Upjohn, LIEU)introduced into the venous line close to the site of infusion in thebaby. Full TPN consisted of amino acids: 3.5–4 g/kg/d, glucose:12–15 g/kg/d and fat: 3–4 g/kg/d. Light protection of TPN wasstarted with the initiation of MVP and lipids in the regimen.Photoprotection was started from the moment of preparation inthe pharmacy and continued throughout the delivery of thesolution to the infant. Shielding from light was achieved usingprotective covering for the TPN bags and syringes and ambertubing (Codan Santa Ana, California, USA); therefore, in the LPgroup both the amino acid–dextrose solution as well as the lipidemulsion were shielded from light. This procedure decreases theamount of infused peroxides.10 As part of monitoring of TPN, TGswere routinely measured with each increase in lipid intake untilreaching full TPN; blood glucose was measured daily when bloodglucose was in normal range (.2.6 or ,10) or with every changein glucose infusion when blood glucose was outside this range.
Enteral nutrition was initiated within 48 h of birth in stablepreterm infants according to a protocol described previously.17
Infants who were not tolerating advancement of early enteralnutrition progressed to full TPN. Daily nutrient intake,parenteral and enteral, was monitored in LE and LP until fullTPN was achieved, around days 7–9 after birth.
To test whether photoprotection of TPN in preterm infantsaffects plasma TGs, a post hoc analysis of TG concentrationswas performed in a subgroup of preterm infants receiving LP orLE. In view of the influence of enteral nutrition on plasma TG,only infants on minimal intakes of enteral feeds (,5 ml/kg/d)were included in this analysis. Plasma accumulation of TG wasobtained by calculating the slope of plasma TG concentrations(TG, mM) as a function of the amount of lipids received (g/kg/d)during the preceding 24 h. A similar post hoc analysis of bloodglucose was performed.
Analytical proceduresTG concentrations were determined on 10 ml of plasma using acolorimetric commercial kit (VITROS Chemical Products TRIGkit, Ortho-Clinical Diagnostics Inc, Rochester, New York, USA).Blood glucose was obtained by point of care testing using theSure StepFlexH (Life Scan, Canada Ltd, Burnaby, BC, Canada).In these subjects point of care testing correlated with laboratoryglucose oxidase technique (y = 0.88x+0.1, r2 = 0.95, n = 200).
Statistical analysisPlasma TG, blood glucose and nutrient intakes (daily averages)were analysed by factorial ANOVA (days 6 light exposure).Student’s t test was used to compare slopes. Chi2 was used tocompare proportions of hypoglycaemia and hyperglycaemiadeterminations. Data are presented as mean ¡ SEM and thethreshold of significance was set at p,0.05.
RESULTSSixty-two neonates allocated to LP and 66 randomised to LEwere recruited to a study aimed at determining the effects ofphotoprotecting TPN on nutrient handing.16 17 Of that initialgroup, 32 LP subjects and 27 LE subjects received full TPN andwere therefore included in the present secondary analysis. Meangestational age (LE: 28¡1 vs LP: 28¡1 wk), birth weight(1.0¡0.1 vs 1.0¡0.1 kg), initial severity of illness index SNAP IIscore19 (LE: 24¡4 vs LP: 18¡2), did not differ between infantsreceiving full TPN. Figure 1 documents that there was nodifference between LE and LP in the progression over time of theintravenous macronutrient intakes. Upon reaching full TPNmean (SD) intravenous intakes for LE vs LP on day 7 of life wereas follows: glucose: 13.9 (0.5) vs 13.2 (0.4) g/kg/d; amino acids:2.9 (0.1) vs 2.9 (0.1) g/kg/d; lipids: 2.5 (0.2) vs 2.7 (0.1) g/kg/d;MVP: 1.2 (0.1) vs 1.3 (0.1) ml/kg/d. Figure 2 shows that thevolume of enteral feeds was ,5 ml/kg/d and similar betweenboth groups.
Effect of light exposure on plasma triglyceride concentrationPlasma TG was compared for the first 9 days of life, while onfull TPN. After that age the increasing volume of enteral feeds
Figure 1 Macronutrient intakes as a function of postnatal age. There wasno difference in macronutrient intakes between LE and LP. Data expressedas mean ¡ SEM. LE, infants receiving light-exposed parenteral nutrition(open circle; sample size: 27–32). LP, infants receiving light-protectedparenteral nutrition (dark circle; sample size: 20–27).
Original article
F112 Arch Dis Child Fetal Neonatal Ed 2009;94:F111–F115. doi:10.1136/adc.2007.135327
on 5 March 2009 fn.bmj.comDownloaded from

(.5 ml/kg/d) given every 1–2 h would interfere with TGconcentrations. The linearity of the relationship between meanplasma TG and postnatal age (y = 0.11x + 0.47) was significantonly in infants receiving LE (r2 = 0.78, p,0.01) (fig 3).
The influence of iv lipid intake on plasma TG was evaluatedby calculating the individual slope of plasma TG (mM) on theamount of lipids received (g/kg) during the preceding 24 h. Themean (SEM) slope for each group was statistically differentfrom zero (p,0.01) (LE = 0.238 (0.062); LP = 0.095 (0.032));the mean slope for the LE group was 2.5 times higher than forthe LP group.
The significant (p,0.05) interaction between light exposureand postnatal age allowed us to compare postnatal days,individually. On days 8 and 9 of life, mean (SD) plasma TG was
higher in the group receiving LE TPN (1.5 (0.3) vs 0.9 (0.1),p,0.01 and 1.4 (0.2) vs 0.9 (0.1), p,0.05, respectively).
Effect of light exposure on blood glucose concentrationOverall, mean (SEM) blood glucose measured over the first9 days of life was significantly higher (p,0.001) in LE (6.6 (0.2)mM, n = 215) compared to LP (6.0 (0.1) mM, n = 240).Significant logarithmic relationships between mean daily bloodglucose and postnatal age were found for both LE (y = 1.14Ln(x)+ 4.75, r2 = 0.62, p,0.05) and LP (y = 0.82Ln(x) + 4.86, r2 = 0.64,p,0.05) (fig 4) documenting that blood glucose continued torise with age in spite of the levelling off of glucose intake afterday 5 of life (fig 1). There was no interaction between lightexposure and days. The number of subjects presenting withhyperglycaemia (.10 mM) was not significantly differentbetween LE (11/32) and LP (6/27). The number of data pointsin the hyperglycaemia range was significantly higher (p,0.05)in LE: 103/570 compared to LP: 45/512; however, the number ofsubjects requiring insulin because of hyperglycaemia was notsignificantly different (LE: n = 6/32 vs LP: n = 4/27). Whensubjects who required insulin were excluded from this analysis,in order to isolate the effect of photoprotection on blood glucosefrom any further outside influence, there was no statisticallysignificant difference in mean (SEM) blood glucose between LE(6.1 (0.2) mM, n = 161) and LP (5.9 (0.1) mM, n = 212) over thefirst 9 days of life.
DISCUSSIONFailure to shield TPN from light contributed to high bloodglucose and plasma TG compared to newborn infants receivingphotoprotected TPN. The same phenomenon observed inanimals receiving TPN,14 supports the hypothesis that lightexposure of TPN has an effect on intermediary metabolism. Inview of concerns of TPN-induced lipid dysregulation, plasmaTG concentration is routinely monitored. An upper limit of1.7 mM is considered safe in neonates.20 Once this threshold isreached, further increase in energy provided by the fat emulsion
Figure 2 Enteral feeding volumes as a function of postnatal age. Eachcircle represents a sample size of 14–20 infants. There was no differencebetween LE and LP. Data expressed as mean ¡ SEM. LE, infantsreceiving light-exposed parenteral nutrition (open circle). LP, infantsreceiving light-protected parenteral nutrition (dark circle).
Figure 3 Plasma triglyceride concentrations as a function of postnatalage. The linear relation between TG and postnatal age was significant inthe LE group (y = 0.11x + 0.47, r2 = 0.78, p,0.01) but not in the LPgroup (y = 0.02x + 0.76, r2 = 0.26). The factorial ANOVA demonstrateda significant (*p,0.05) interaction between LE and day of life. Plasmatriglyceride concentrations were higher in LE group on days 8(**: p,0.01) and 9 (*: p,0.05). Data expressed as mean ¡ SEM(sample size = 8–16). LE, infants receiving light-exposed parenteralnutrition (open circle). LP, infants receiving light-protected parenteralnutrition (dark circle).
Figure 4 Blood glucose concentrations as a function of postnatal age.The factorial ANOVA demonstrated that overall blood glucoseconcentrations were higher (p,0.05) in LE (y = 1.14 Ln(x) + 4.75,r2 = 0.62, p,0.05) compared to LP (y = 0.82 Ln(x) + 4.86, r2 = 0.64,p,0.05) and that there was no interaction with days of life. Thecorrelations between average daily blood glucose and postnatal agewere significant (p,0.05). No interaction was found between lightexposure and days. Data expressed as mean ¡ SEM (sample size =9–15). LE, infants receiving light-exposed parenteral nutrition (opencircle). LP, infants receiving light-protected parenteral nutrition (darkcircle).
Original article
Arch Dis Child Fetal Neonatal Ed 2009;94:F111–F115. doi:10.1136/adc.2007.135327 F113
on 5 March 2009 fn.bmj.comDownloaded from

is curtailed until lipid clearance improves; therefore, shieldingTPN from light provides a potential benefit for preterm infants.By avoiding hypertriglyceridaemia it will allow for increasedintake of the lipid emulsion at a time when optimising theprovision of energy is important to initiate and sustaingrowth.21
The two groups of infants (LE and LP) were similar in termsof gestational age, birth weight, and severity of illness,intravenous and enteral feeds; thus, the differences noted inthe TG and blood glucose concentrations appear to be related tothe degree of light exposure of TPN. Exposure of TPN to lightgenerates oxidants in the form of peroxides and results in loss ofantioxidant vitamins.4 Peroxide concentrations range from 255to 400 mM in LE TPN solutions, while they range from 100 to175 mM3 6 10 16 in photoprotected preparations. The differencesin intermediary metabolism might be associated with differ-ences in peroxides or to other light-induced byproductsgenerated in the TPN solution.22 23
The difference in blood glucose observed between LE and LP isstatistically significant, but it is questionable whether this is ofclinical relevance since there was no difference in the need forinsulin or the number of subjects treated for hypoglycaemia;however, the higher blood glucose observed during LE fits withthe observations that oxidative stress impairs glucose uptake inmuscle and fat.15 Since this post hoc analysis involves a fairlysmall number of subjects it should be viewed as hypothesisgenerating. Although the actual mechanisms involved inproducing these results are currently unclear, several specula-tions can be entertained. H2O2 inhibits insulin receptor bindingand insulin receptor autophosphorylation24 proving thatincreased reactive oxygen species secretion into peripheral bloodis involved in induction of insulin resistance25; therefore, LETPN, which is associated with higher H2O2 content, mightinduce a state of insulin resistance as blood glucose continues torise after day 5 of life although glucose intake levels off (fig 4).
The liver plays a central role in lipid homeostasis. Itconstitutes the major site of lipogenesis and very-low-densitylipoprotein (VLDL) production involved in lipid transport.12 13
The light-induced hepatic triglyceride accumulation14 couldresult from enhanced lipogenesis and/or decreased mitochon-drial beta oxidation of fatty acids26 27 and/or inhibition oftriglyceride hydrolase and/or diminished VLDL secretion. Theobserved accumulation of plasma TG (fig 3) could be explainedby a stimulation of lipogenesis, and/or a lower hepatic uptake.This is supported first by the fact that the difference in plasmaTG was observed only after 1 week on TPN and second by theobservation that the plasma TG/lipid intake ratio increasedfaster with LE. The absence of effect of light/peroxides ontriglyceride hydrolase14 suggests that the initial step of transportof TG through the endoplasmic reticulum to the VLDL is notinvolved, which is clearly supported by elevated plasma TGlevels. Plasma cholesterol would have informed on the impact oflight on the clearance of lipoproteins in which case both TG andcholesterol would have been affected. The higher blood glucoseassociated with elevated TG is more characteristic of themetabolic syndrome, which is associated with insulin resistance.Conversely, with lipogenesis from glucose one would haveexpected to find a decrease in circulating glucose rather than thesignificantly higher blood glucose observed with LE.
There is a risk of selection bias when performing a non-pre-specified post hoc analysis on a subgroup. Therefore, alimitation of this report might stem from the fact that resultsare derived from a subgroup that represents close to half of theoriginal trial group.16 In view of the confounding influence of
enteral nutrition on plasma TG levels in patients who are fedevery 2 h, we opted to test the effect of photoprotection on TGin the present subgroup of infants (fig 3) because they receivedfull TPN with minimal enteral support (,5 ml/kg/d). It isreassuring however that we found for the original trial group(LE: n = 58; LP: n = 56) an effect of photoprotection on plasmaTG that was in the same direction as in the subgroup on days 8and 9 (data not shown). On the other hand, there was nodifference in blood glucose between LE and LP in the originalgroup.
Our study adds to the list of potential complicationsassociated with failure to protect TPN from light exposure16 17
and adds credence to the positive impact that photoprotectionof TPN may have on clinical endpoints, especially in this fragilepopulation. Ethical limitations related to blood sampling in sucha vulnerable population, favour investigation of the mechanismsunderlying these findings in an animal model14; however, theaforementioned complications associated with failure of lightprotection of TPN and the impact of being able to increaseenergy intake early in life beg for further research in the form ofa multicentre randomised trial to confirm the effects ofphotoprotection of TPN on clinical outcomes in pretermnewborns.
Funding: This work was supported by the Canadian Institutes of Health Research(grant: MOP 53270).
Competing interests: None.
Ethics approval: The study was approved by the Clinical Research Ethics Board ofthe University of British Columbia, and by the Clinical Research Committee of theChildren’s and Women’s Health Centre of BC.
Patient consent: Parental written informed consent was obtained prior to enrolment.
REFERENCES1. Hack M, Schlechter M, Cartar L, et al. Growth of very low birth infants to age 20
years. Pediatrics 2003;112:e30–8.2. Ehrenkranz RA, Dusick AM, Vohr BR, et al. Growth in the neonatal intensive care
unit influences neurodevelopmental and growth outcomes of extremely low birthweight infants. Pediatrics 2006;117:1253–61.
3. Neuzil J, Darlow BA, Inder TE, et al. Oxidation of parenteral lipid emulsion byambient and phototherapy lights: potential toxicity of routine parenteral feeding.J Pediatr 1995;126:785–90.
4. Silvers KM, Sluis KB, Darlow BA, et al. Limiting light-induced lipid peroxidation andvitamin loss in infant parenteral nutrition by adding multivitamin preparations toIntralipid. Acta Pediatr 2001;90:242–9.
5. Lavoie JC, Belanger S, Spalinger M, et al. Admixture of a multivitamin preparation toparenteral nutrition: The major contributor to in vitro generation of peroxides.Pediatrics 1997;99:E61–70.
6. Laborie S, Lavoie JC, Chessex P. Paradoxical role of ascorbic acid and riboflavin insolutions of total parenteral nutrition: Implication in photoinduced peroxidegeneration. Pediatr Res 1998;43:601–6.
7. Laborie S, Lavoie JC, Chessex P. Increased urinary peroxides in newborn infantsreceiving parenteral nutrition exposed to light. J Pediatr 2000;136:628–32.
8. Lavoie JC, Chessex P. Gender and maturation affect glutathione status in humanneonatal tissues. Free Radic Biol Med 1997;23:648–57.
9. Knafo L, Chessex P, Rouleau T, et al. Association between hydrogen peroxyde-dependent byproducts of ascorbic acid and increased hepatic acetyl-CoA carboxylaseactivity. Clin Chem 2005;51:1462–71.
10. Laborie S, Lavoie JC, Pineault M, et al. Protecting solutions of parenteral nutritionfrom peroxidation. J Parenter Enteral Nutr 1999;23:104–8.
11. Lavoie JC, Rouleau T, Gagnon C, et al. Photoprotection prevents TPN-induced lungprocollagen mRNA in newborn guinea pigs. Free Radic Biol Med 2002;33:512–20.
12. Lavoie JC, Laborie S, Rouleau T, et al. Peroxide-like oxidant response in lungs ofnewborn guinea pigs following the parenteral infusion of a multivitamin preparation.Biochem Pharmacol 2000;60:1297–303.
13. Chessex P, Lavoie JC, Rouleau T, et al. Photooxidation of parenteral multivitaminsinduces hepatic steatosis in a neonatal guinea pig model of intravenous nutrition.Pediatr Res 2002;52:958–63.
14. Lavoie JC, Rouleau T, Khashu M, et al. Peroxide contamination of TPN solutionsleads to perturbation of endogenous lipid metabolism and plasma triglycerideaccumulation in preterm infants. PAS 2005;57:1523 (Abstract).
15. Rudich A, Tirosh A, Potashnik R, et al. Prolonged oxidative stress impairs insulininduced GLLJT 4 translocation in 3T3-L1 adipocytes. Diabetes 1998;47:1562–9.
Original article
F114 Arch Dis Child Fetal Neonatal Ed 2009;94:F111–F115. doi:10.1136/adc.2007.135327
on 5 March 2009 fn.bmj.comDownloaded from

16. Khashu M, Harrison A, Lalari V, et al. Photoprotection of parenteral nutritionenhances advancement of minimal enteral nutrition in preterm infants. SeminPerinatol 2006;30:139–45.
17. Chessex P, Harrison A, Khashu M, et al. In preterm neonates, is the risk ofdeveloping bronchopulmonary dysplasia influenced by the failure to protect totalparenteral nutrition from exposure to ambient light? J Pediatr 2007;151:213–14.
18. Harrison A, Khashu M, Friel J, et al. Variations in metabolic response to TPN are influencedmore by gender than by light exposure. J Pediatr Gastroenterol Nutr 2007;45:577–81.
19. Richarson DK, Corcoran JD, Escobar GJ, et al. SNAP-II and SNAPPE-II: Simplifiednewborn illness severity and mortality risk scores. J Pediatr 2001;138:92–100.
20. Putet G. Lipid metabolism of the micropremie. Clin Perinatol 2000;27:57–69.21. Chessex P, Reichman BL, Verellen GJ, et al. Influence of postnatal age, energy
intake, and weight gain on energy metabolism in the very low-birth-weight infant.J Pediatr 1981;99:761–6.
22. Lavoie JC, Chessex P, Rouleau T, et al. Light-induced byproducts of vitamin C inmultivitamin solutions. Clin Chem 2004;50:135–40.
23. Lavoie JC, Rouleau T, Chessex P. Interaction between ascorbate and light-exposedriboflavin induces lung remodeling. J Pharamcol Exp Ther 2004;311:634–9.
24. Gardner CD, Eguchi S, Reynolds CM, et al. Hydrogen peroxide inhibits insulinsignaling in vascular smooth muscle cells. Exp Biol Med 2003;228:836–42.
25. Takeda E, Arai H, Yamamoto H, et al. Control of oxidative stress and metabolichomeostasis by the suppression of postprandial hyperglycemia. J Med Invest2005;52:259–65.
26. Romeo C, Eaton S, Quant PA, et al. Neonatal oxidative liver metabolism: Effects ofhydrogen peroxide, a putative mediator of septic damage. J Pediatr Surg1999;34:1107–11.
27. Fukumoto K, Pierro A, Spitz L, et al. Cardiac and renal mitochondria responddifferently to hydrogen peroxide in suckling rats. J Surg Res 2003;113:146–50.
Quality & Safety in Health Care
Quality & Safety in Health Care is a leading international peer-review journal in the growing area ofquality and safety improvement. It provides essential information for those wanting to reduce harm andimprove patient safety and the quality of care. The journal reports and reflects research, improvementinitiatives and viewpoints and other discursive papers relevant to these crucial aims with contributionsfrom researchers, clinical professionals and managers and experts in organisational development andbehaviour.
qshc.bmj.com
Original article
Arch Dis Child Fetal Neonatal Ed 2009;94:F111–F115. doi:10.1136/adc.2007.135327 F115
on 5 March 2009 fn.bmj.comDownloaded from

doi:10.1136/adc.2007.131052 online 1 Aug 2008;
2009;94;F116-F119; originally publishedArch. Dis. Child. Fetal Neonatal Ed. L Lee, S Girish, E van den Berg and A Leaf
Random safety audits in the neonatal unit
http://fn.bmj.com/cgi/content/full/94/2/F116Updated information and services can be found at:
These include:
References
http://fn.bmj.com/cgi/content/full/94/2/F116#BIBL
This article cites 5 articles, 3 of which can be accessed free at:
Rapid responses http://fn.bmj.com/cgi/eletter-submit/94/2/F116
You can respond to this article at:
serviceEmail alerting
the top right corner of the article Receive free email alerts when new articles cite this article - sign up in the box at
Topic collections
(371 articles) Editor's choice � Articles on similar topics can be found in the following collections
Notes
http://journals.bmj.com/cgi/reprintformTo order reprints of this article go to:
http://journals.bmj.com/subscriptions/ go to: Archives of Disease in Childhood - Fetal and Neonatal EditionTo subscribe to
on 5 March 2009 fn.bmj.comDownloaded from

Random safety audits in the neonatal unit
L Lee, S Girish, E van den Berg, A Leaf
Neonatal Unit, SouthmeadHospital, Bristol, UK
Correspondence to:LLeona Lee, Neonatal Unit,University Hospital of NorthStaffordshire, Stoke-on-TrentST4 5QG, UK; [email protected]
Accepted 18 June 2008Published Online First1 August 2008
ABSTRACTBackground: Random safety audits have been shown tobe effective in improving standards of practice in high-riskindustries. They are process audits rapidly performedduring real-time clinical activity, with immediate feedback,allowing for immediate change of practice.Aim: Based on a concept described by the Vermont-Oxford Network, we aimed to introduce random safetyaudits to our unit to improve infection control and routineneonatal care.Method: We designed simple data collection tables toaudit 11 infection control and four routine care standards.Audits were undertaken during the weekly grand round.Immediate feedback was given.Results: In 6 months we completed three cycles of 15audits each. Complete results were available for 14audits. The compliance with the infection controlstandards improved from a median of 70% (range 20%–100%) to 95% (range 66%–100%). The results of theroutine care standards were more variable.Conclusion: We have shown that this innovative methodof random safety audits is effective in quickly improvingpractice. We believe this to be due to the instantfeedback, continued emphasis on infection control andgood clinical practice, and improved teamwork.
Audit is one of the key components of any clinicalgovernance strategy1 and is used throughout theNHS for ensuring maintenance of standards. Thetraditional model of medical audit is often unsa-tisfactory for junior staff in 6-month posts as thereis insufficient time to see changes implemented, are-audit carried out and ‘‘closure of the audit loop’’.They thus get little ownership of, or satisfactionfrom, their audit, which has been shown to beimportant2 if we are to avoid the danger of auditbecoming a chore instead of a useful tool forimproving practice.
We describe the use of ‘‘random safety audits’’which overcome many of the negative aspects ofthe traditional audit. They are adapted fromindustry3 where they have been very effectiveprocess audits: checklists are compiled for each of anumber of pre-identified error-prone activities. Toperform the audit, a checklist is chosen at randomand the auditors then go to that point in theprocess to directly engage staff in an immediatereview of the work in progress relative to thechecklist endpoints. The idea in industry is thatthis will identify error and error-prone situationsand increase safety awareness of workers ‘‘on theshop floor’’.
This method of auditing is attractive in clinicalpractice for many reasons. First, the audits are in‘‘real time’’, assessing actual practice. Second, theimmediacy of feedback allows for immediateawareness and change in practice where necessary.
A formal action plan can be made and circulatedand the standard can be re-audited within a shorttimeframe — typically weeks. Ursprung andcolleagues have shown that it is feasible to adaptthis process for neonatal intensive care unit(NICU) practice.4
Our aim was to adapt random safety audits foruse in our own neonatal unit and to analyse theeffects on practice, focusing particularly on issuesrelated to nosocomial infection.
METHODWe chose 15 audit standards: 11 that were part ofour infection control strategy and four routine carestandards that were considered suitable for thismethod of audit (table 1).
The standards were chosen by the medical staffin consultation with the nursing team to ensurethat the audit standards were correct reflections ofwhat was recognised to be best practice.
Southmead is a Level 3 NICU with sevenintensive care cots, five high-dependency and 14special care cots. The audits were performed bymedical and nursing staff working within the unit.
In order to ease the process and reduce the timetaken to perform and report the audits, wedesigned clear, simple data collection tables andfound that even complicated guidelines could betranslated into a simple-to-use table. Figure 1shows the lipid prescription guideline and the tabledesigned for the audit, as an example.
Two standards were audited each week duringthe grand round when the greatest number of staffwould be present. Since this was always the sameday of the week, staff were aware when auditswould be taking place but not which topics werebeing performed. Standards to be audited werechosen in a non-random manner from the 15
What is already know on this topic
Audit is an essential part of clinical governancestrategy to improve practice.
What this study adds
c A random safety audit can be performed, andfeedback given, in one morning.
c Use of random safety audits enables high auditturnover and loop closure.
c Random safety audits can effectively improvepractice.
Original article
F116 Arch Dis Child Fetal Neonatal Ed 2009;94:F116–F119. doi:10.1136/adc.2007.131052
on 5 March 2009 fn.bmj.comDownloaded from

topics. Each was audited once before repeating the cycle of 15audits. After the first cycle of 15 audits, staff were aware of thetopics to be audited, but not which audits were being carriedout on a particular day.
If there was non-compliance with standards this wasdiscussed at the time with the relevant staff member.Feedback was given in a non-judgemental way and designedto encourage compliance with the standard rather thanresentment. All staff were treated in the same way. We alsotried to engage the staff in discussing the reasons for non-compliance to encourage greater ownership of the process.
As well as the immediate feedback, at the end of the wardround, we summarised the results and disseminated them bypersonally informing the staff, and by use of a template posterdesigned for displaying results on a designated audit noticeboard. For each topic, we had a laminated eye-catchingphotograph which could be stuck onto the poster to attractattention of those walking past. Results were also summarisedin the staff communication book by the end of the day to tryand ensure wide dissemination of information.
Any changes to policy were discussed at the monthlyneonatal unit audit meeting.
The audits were approved by the North Bristol Trust AuditDepartment.
RESULTSIn 6 months we completed three cycles of auditing 15 standardsmaking a total of 45 audits. Unfortunately, one set of results forthe leaning topic were mislaid and therefore we report completeresults for 14 topics.
The results of the audits of infection control standardsshowed compliance in the first cycle ranging from 20% to 100%(see table 2). These figures improved or remained the same in allbut one of the standards (fig 2). The overall improvement inperformance expressed as a median and range is shown in fig 3.
The results of the audits of routine care standards were morevaried and are presented in table 3.
DISCUSSIONWe have shown that random safety audits can improvecompliance with unit guidelines and protocols. We had greatestsuccess with our infection control standards. The only infectioncontrol standard that appeared to show a marked fall incompliance was lipid prescribing. However the fall from 100%compliance in the second audit to 66% compliance in the thirdaudit represented small numbers of 3/3 and 2/3. At the time ofthe audits, our unit particularly focused on infection control,and the introduction of random safety audits was part of thiscampaign. We had chosen to focus on infection control as a
Figure 1 Transformation of a complicated lipid prescription guideline (inset) into an easy-to-use audit table. DIC, disseminated intravascularcoagulation; TPN, total parenteral nutrition; VLBW, very low birth weight.
Original article
Arch Dis Child Fetal Neonatal Ed 2009;94:F116–F119. doi:10.1136/adc.2007.131052 F117
on 5 March 2009 fn.bmj.comDownloaded from

result of benchmarking in the Vermont Oxford Network andthe idea for random safety audits came from the VON 5thAnnual Quality Congress in 2004. This pre-existing emphasismay partly explain the greater improvement in compliance ascompared with the routine care standards. In the context ofinfection control, Kilbride et al5 have described the importanceof a ‘‘habit for change’’ and a ‘‘habit for systems thinking’’, thatis, considering the small processes that contribute to the overallcare. We already had a habit for change as part of our infectioncontrol campaign and the random safety audits were part of the‘‘habit for systems thinking’’.
Compliance with routine care standards did not show thesustained improvement of the infection control standards.Although the actual numbers in the results seemed moredisappointing, the process still had many positive outcomes.Guidelines were discussed and plans made to clarify andformalise changes, such as in oxygen saturation limits andfirst-day checks. For example, the reason for incomplete first-day checks was often that the infant was too unstable forcomplete examination on admission. Therefore we planned toreview first-day checks on a weekly basis. Confusion in theoxygen saturation guideline was highlighted and this was in the
process of review. These discussions led to greater under-standing of our practice and what our guidelines should be.
Another possible reason for poor compliance in the routinestandards was that they were more focused on junior medicalstaff work — compared to the infection control standards thatwere multidisciplinary — and there was a change-over of juniorstaff between the first and second audits. We feel that the quickturn-around and re-auditing by random safety audits had animportant role to play here in highlighting areas for improve-ment and in stressing our commitment to maintenance ofstandards especially for those who are new to the unit and inshort-term jobs.
There are possible limitations to using random safety audits.One is that it requires dedicated staff to maintain themomentum. However, our experience is that these audits arewell received and considered to be a very effective form of auditand therefore, we hope that they would be embraced by otherunits or departments. Although we concentrated on neonataltopics, Ursprung et al4 showed that they could be adapted formore general measures including the processes of ordering andobtaining results of investigations, communication problemsand equipment problems. A second concern may be that theyare time-consuming but we found that if well prepared, theprocess of doing the audits was very quick. Dissemination ofresults also took little time once the results poster was designed
Table 1 Audit standards
Infection control standards
There should be no soft toys in intensive care cots
All sleeves should be rolled above the elbows
No wrist watches are to be worn
No rings with stones are to be worn
There should be no leaning on incubators
There should be no foil bowls (used for warming milk) left at the sinks
Lipid should be prescribed as per protocol
There should be a documented antibiotic plan
All stethoscope bells should be kept in the incubator/cot
Each cot should have its own bottle of alcohol gel in its own bracket
Each baby should have its own tube of paraffin (used for heel prick blood tests)
Routine care standards
Central venous access should be documented clearly in the notes
First-day checks should be complete
Vitamins and supplements should be prescribed according to protocol
Oxygen saturation limits should be set according to protocol
Figure 2 The results of random safetyaudits on infection control standards.
Figure 3 Median and range of results for percentage compliance withinfection control standards.
Original article
F118 Arch Dis Child Fetal Neonatal Ed 2009;94:F116–F119. doi:10.1136/adc.2007.131052
on 5 March 2009 fn.bmj.comDownloaded from

and photographs of the audits were obtained. The most time-consuming area will be collating the results to show trends overtime but this is a worthwhile investment for improving patientsafety.
Another potential limitation is that staff may have looked tosee what was being audited and then tried to improve theirperformance prior to being audited. To minimise this whenperforming audits of the environment, we tried to completeaudits of all of the relevant areas prior to giving feedback.Although we may not have been able to completely rule out anyquick alterations prior to our audit, at the very least, the processof performing the audit reminded the staff of what theguidelines should have been and produced a positive change inbehaviour.
Perhaps the greatest concern is that random safety auditsmay be punitive. This should not be the case if they are done inthe correct spirit of working together to improve the care ofpatients. The NHS aims to foster a positive environment toenhance working practices rather than one where blame isapportioned.6 We did not experience adverse reactions from thestaff. Indeed our experience was that the medical and nursingstaff were very supportive of this style of audit and that theygenerated informal conversation both before and after theaudits. Concerns regarding the audits were generally regardingthe clarity of guidelines and so the audits provided a forum forre-writing of guidelines where appropriate. Because of theimmediate feedback and the demonstration of improvement inadherence to guidelines, medical staff in particular found thisform of audit to be logical and appealing.
We did not directly involve families in these audits but theywere aware of the processes, particularly regarding handwashing and jewellery, and reacted positively to the overallaim of improving quality of care.
In summary the benefits to our unit were: increasedawareness of infection control measures, improvement ininfection control practices, continued emphasis on infectioncontrol and general good clinical practice, clarification ofguidelines and improved team working. We would stronglyrecommend this form of audit to other units.
Competing interests: None.
REFERENCES1. Halligan A, Donaldson L. Implementing clinical governance: turning vision into reality.
Br Med J 2001;322:1413–17.2. Cook S, Spreadbury P. Audit for a purpose. Physiotherapy 1995;81:182–4.3. Juran JM, Gyrna FM. Juran’s quality control handbook. 4th edn. New York: McGraw
Hill, 1988.4. Ursprung R, Gray JE, Edwards JD, et al. Real time patient safety audits: improving
safety every day. Qual Saf Health Care 2005;14:284–9.5. Kilbride HW, Powers R, Wirtschafter DD, et al. Evaluation and development of
potentially better practices to prevent neonatal nosocomial bacteremia. Pediatrics2003;111:504–18.
6. Scally G, Donaldson LJ. Clinical governance and the drive for quality improvement inthe new NHS in England. Br Med J 1998;317:61–5 (4 July).
Table 2 Results of the infection control standards
Audit standard
Results (compliant/total observations)
1st audit 2nd audit 3rd audit
Soft toys 15/24 17/17 15/15
Sleeves and watches 18/20 20/21 23/24
Stethoscope bells 7/7 6/7 12/13
Hand washing 10/13 14/16 11/13
Sterilium 21/25 16/17 21/22
Paraffin 4/7 6/8 6/7
Foil bowls 3/14 17/17 12/12
Rings with stones 17/20 20/21 12/12
Lipid protocol 3/5 3/3 2/3
Antibiotic use 1/5 4/4 4/4
Table 3 Results of the routine care audits
Audit standard
Results
1st audit 2nd audit 3rd audit
All babiesshould havedocumentedfirst-daychecks
Fully complete 12/20 9/20 6/17
Partiallycomplete
5/20 9/20 10/17
Not done 3/20 2/20 1/17
Long-line tippositionsshould bedocumented inthe notes
2/3 2/4 1/2
Oxygensaturationlimits should beset accordingto guidelines
Upper limits 2/9 8/8 3/6
Lower limits 3/9 5/8 4/6
Vitamins andnutritionalsupplements tobe prescribedas per protocol
11/13 6/10 20/20
Original article
Arch Dis Child Fetal Neonatal Ed 2009;94:F116–F119. doi:10.1136/adc.2007.131052 F119
on 5 March 2009 fn.bmj.comDownloaded from

doi:10.1136/adc.2007.119560 online 3 Sep 2007;
2009;94;F120-F123; originally publishedArch. Dis. Child. Fetal Neonatal Ed. G Henderson, S Craig, P Brocklehurst and W McGuire
case�control studyenterocolitis in preterm infants: a multicentre Enteral feeding regimens and necrotising
http://fn.bmj.com/cgi/content/full/94/2/F120Updated information and services can be found at:
These include:
References
http://fn.bmj.com/cgi/content/full/94/2/F120#BIBL
This article cites 27 articles, 14 of which can be accessed free at:
Rapid responses http://fn.bmj.com/cgi/eletter-submit/94/2/F120
You can respond to this article at:
serviceEmail alerting
the top right corner of the article Receive free email alerts when new articles cite this article - sign up in the box at
Notes
http://journals.bmj.com/cgi/reprintformTo order reprints of this article go to:
http://journals.bmj.com/subscriptions/ go to: Archives of Disease in Childhood - Fetal and Neonatal EditionTo subscribe to
on 5 March 2009 fn.bmj.comDownloaded from

Enteral feeding regimens and necrotisingenterocolitis in preterm infants: a multicentrecase–control study
G Henderson,1 S Craig,2 P Brocklehurst,3 W McGuire4
1 Griffith University, Brisbane,Australia; 2 Royal JubileeMaternity Hospital, Belfast,Northern Ireland, UK; 3 NationalPerinatal Epidemiology Unit,Oxford, UK; 4 Australian NationalUniversity, Canberra, Australia
Correspondence to:W McGuire, Centre for NewbornCare, The Canberra Hospital,ACT 2606, Australia; [email protected]
Accepted 8 August 2007Published Online First3 September 2007
ABSTRACTBackground: Most preterm infants who developnecrotising enterocolitis (NEC) have received enteralfeeds. Uncertainty exists about which aspects of thefeeding regimen affect the risk of NEC.Aim: To examine associations between various enteralfeeding practices and the development of NEC in preterminfants.Methods: Multicentre case–control study. 53 preterminfants with NEC were enrolled together with agestational age frequency-matched control without NECfrom a randomly selected neonatal unit. Clinical andfeeding data were extracted and compared between thegroups.Results: Significantly fewer cases than controls hadreceived human breast milk (75% vs 91%; OR 0.32, 95%CI 0.11 to 0.98). The day on which enteral feeding wasstarted did not differ significantly (mean (SD) days afterbirth: cases 2.9 (2.8) and controls 2.8 (1.8)). The mean(SD) duration of trophic feeding (,1 ml/kg/h) wassignificantly shorter in the cases (3.3 (3.1) days) thancontrols (6.2 (6.7) days) (mean difference (MD) 22.9,95% CI 24.9 to 20.9) days. Cases were fully fedsignificantly earlier than controls (mean (SD) days afterbirth: cases 9.9 (4.2) and controls 14.3 (9.8); MD 24.4,95% CI 27.3 to 21.5).Conclusions: These data suggest that the duration oftrophic feeding and rate of advancement of feed volumesmay be modifiable risk factors for NEC in preterm infants.Further randomised controlled trials are warranted toassess the effect of different rates of feed advancementon the incidence of NEC, as well as other outcomes.
Most preterm infants who develop necrotisingenterocolitis (NEC) will have received enteral feeds.The timing of the introduction of milk feeds, andtheir rate of advancement, may be importantdeterminants of the risk of NEC.1–3 However,prospective studies have so far provided onlylimited evidence about the effect of differententeral feeding strategies on the risk of NEC inpreterm infants.4–7 Thus there is a need for furtherrandomised controlled trials to determine howdifferent feeding regimens for preterm infantsaffects their risk of developing NEC. Data fromobservational studies may inform the developmentof such trials, and identify and prioritise specificinterventions for assessment. However, examina-tion of associations between different feedingpractices and NEC has been limited for tworeasons. Studies based in centres or networkswhere feeding protocols for preterm infants arestandardised cannot examine whether different
feeding regimens affect the risk of NEC. Studiesfrom larger neonatal networks generally useroutinely collected data but these datasets containonly limited information on infants’ enteral feed-ing regimens.8 9
This case–control study was undertaken in 10independent neonatal centres, where there wasevidence of marked variation in feeding practiceswith respect to type of milk used, timing ofintroduction of enteral feeds, and the rate of feedadvancement.10 Controls from a separate unit toeach individual case were randomly selected toallow determination of any associations betweenthe different feeding practices and the developmentof NEC.
METHODSWe conducted a case–control study in 10 neonatalunits (appendix 1) in the north of Britain betweenJanuary 2004 and December 2005. The Northernand Yorkshire multicentre research ethics commit-tee approved the study.
Cases were preterm infants (,37 completedweeks’ gestation) with NEC diagnosed usingmodified Bell criteria or at laparotomy or autopsyexamination (table 1).11
When a case was reported, a participatingneonatal centre was randomly selected and acontrol infant who had not developed NEC wasidentified. Controls were more than 34 weeks’postmenstrual age at recruitment and thereforeunlikely to develop NEC subsequently. Cases andcontrols were frequency matched for gestationalage at birth in one of three bands (,28 weeks,
What is already known on this topic
c Inter-unit variation in the incidence if NEC inpreterm infants is not fully explained by casemix.
c Enteral feeding regimens for preterm infantsaffect the risk of development of NEC but currentdata are insufficient to guide clinical practice.
What this study adds
c The duration of trophic feeding and rate ofadvancement of enteral feeding may bemodifiable risk factors for the development ofNEC in preterm infants.
Original article
F120 Arch Dis Child Fetal Neonatal Ed 2009;94:F120–F123. doi:10.1136/adc.2007.119560
on 5 March 2009 fn.bmj.comDownloaded from
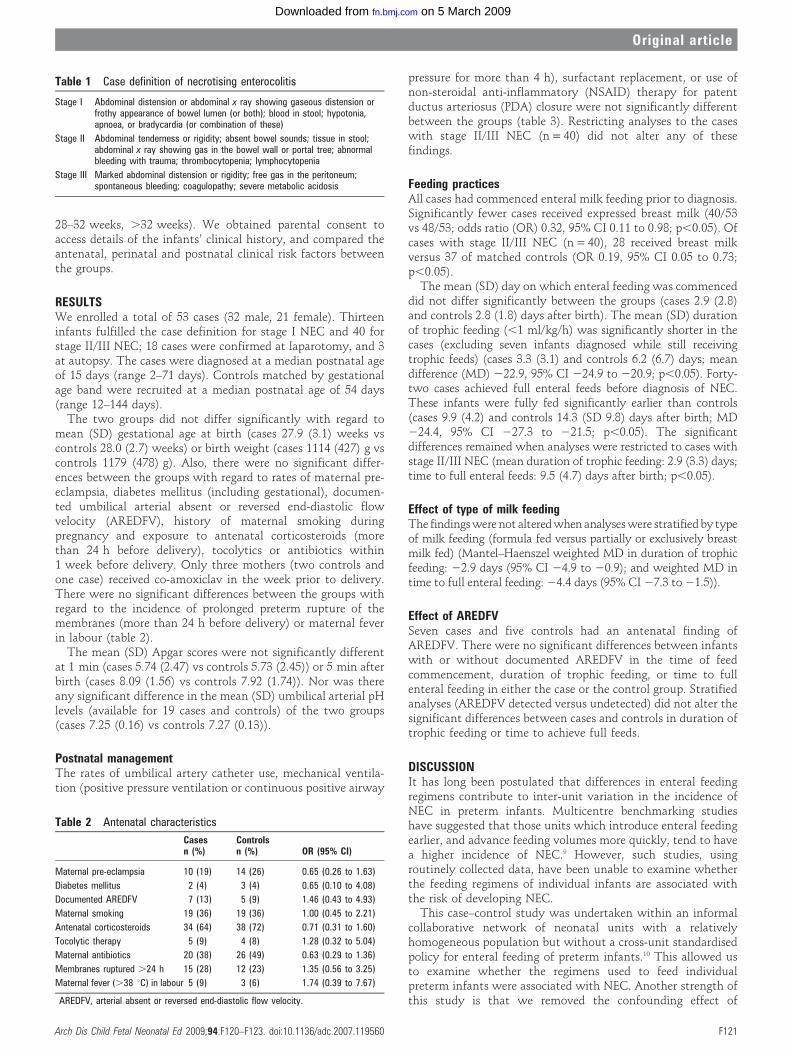
28–32 weeks, .32 weeks). We obtained parental consent toaccess details of the infants’ clinical history, and compared theantenatal, perinatal and postnatal clinical risk factors betweenthe groups.
RESULTSWe enrolled a total of 53 cases (32 male, 21 female). Thirteeninfants fulfilled the case definition for stage I NEC and 40 forstage II/III NEC; 18 cases were confirmed at laparotomy, and 3at autopsy. The cases were diagnosed at a median postnatal ageof 15 days (range 2–71 days). Controls matched by gestationalage band were recruited at a median postnatal age of 54 days(range 12–144 days).
The two groups did not differ significantly with regard tomean (SD) gestational age at birth (cases 27.9 (3.1) weeks vscontrols 28.0 (2.7) weeks) or birth weight (cases 1114 (427) g vscontrols 1179 (478) g). Also, there were no significant differ-ences between the groups with regard to rates of maternal pre-eclampsia, diabetes mellitus (including gestational), documen-ted umbilical arterial absent or reversed end-diastolic flowvelocity (AREDFV), history of maternal smoking duringpregnancy and exposure to antenatal corticosteroids (morethan 24 h before delivery), tocolytics or antibiotics within1 week before delivery. Only three mothers (two controls andone case) received co-amoxiclav in the week prior to delivery.There were no significant differences between the groups withregard to the incidence of prolonged preterm rupture of themembranes (more than 24 h before delivery) or maternal feverin labour (table 2).
The mean (SD) Apgar scores were not significantly differentat 1 min (cases 5.74 (2.47) vs controls 5.73 (2.45)) or 5 min afterbirth (cases 8.09 (1.56) vs controls 7.92 (1.74)). Nor was thereany significant difference in the mean (SD) umbilical arterial pHlevels (available for 19 cases and controls) of the two groups(cases 7.25 (0.16) vs controls 7.27 (0.13)).
Postnatal managementThe rates of umbilical artery catheter use, mechanical ventila-tion (positive pressure ventilation or continuous positive airway
pressure for more than 4 h), surfactant replacement, or use ofnon-steroidal anti-inflammatory (NSAID) therapy for patentductus arteriosus (PDA) closure were not significantly differentbetween the groups (table 3). Restricting analyses to the caseswith stage II/III NEC (n = 40) did not alter any of thesefindings.
Feeding practicesAll cases had commenced enteral milk feeding prior to diagnosis.Significantly fewer cases received expressed breast milk (40/53vs 48/53; odds ratio (OR) 0.32, 95% CI 0.11 to 0.98; p,0.05). Ofcases with stage II/III NEC (n = 40), 28 received breast milkversus 37 of matched controls (OR 0.19, 95% CI 0.05 to 0.73;p,0.05).
The mean (SD) day on which enteral feeding was commenceddid not differ significantly between the groups (cases 2.9 (2.8)and controls 2.8 (1.8) days after birth). The mean (SD) durationof trophic feeding (,1 ml/kg/h) was significantly shorter in thecases (excluding seven infants diagnosed while still receivingtrophic feeds) (cases 3.3 (3.1) and controls 6.2 (6.7) days; meandifference (MD) 222.9, 95% CI 224.9 to 220.9; p,0.05). Forty-two cases achieved full enteral feeds before diagnosis of NEC.These infants were fully fed significantly earlier than controls(cases 9.9 (4.2) and controls 14.3 (SD 9.8) days after birth; MD224.4, 95% CI 227.3 to 221.5; p,0.05). The significantdifferences remained when analyses were restricted to cases withstage II/III NEC (mean duration of trophic feeding: 2.9 (3.3) days;time to full enteral feeds: 9.5 (4.7) days after birth; p,0.05).
Effect of type of milk feedingThe findings were not altered when analyses were stratified by typeof milk feeding (formula fed versus partially or exclusively breastmilk fed) (Mantel–Haenszel weighted MD in duration of trophicfeeding: 22.9 days (95% CI 24.9 to 20.9); and weighted MD intime to full enteral feeding: 24.4 days (95% CI 27.3 to 21.5)).
Effect of AREDFVSeven cases and five controls had an antenatal finding ofAREDFV. There were no significant differences between infantswith or without documented AREDFV in the time of feedcommencement, duration of trophic feeding, or time to fullenteral feeding in either the case or the control group. Stratifiedanalyses (AREDFV detected versus undetected) did not alter thesignificant differences between cases and controls in duration oftrophic feeding or time to achieve full feeds.
DISCUSSIONIt has long been postulated that differences in enteral feedingregimens contribute to inter-unit variation in the incidence ofNEC in preterm infants. Multicentre benchmarking studieshave suggested that those units which introduce enteral feedingearlier, and advance feeding volumes more quickly, tend to havea higher incidence of NEC.9 However, such studies, usingroutinely collected data, have been unable to examine whetherthe feeding regimens of individual infants are associated withthe risk of developing NEC.
This case–control study was undertaken within an informalcollaborative network of neonatal units with a relativelyhomogeneous population but without a cross-unit standardisedpolicy for enteral feeding of preterm infants.10 This allowed usto examine whether the regimens used to feed individualpreterm infants were associated with NEC. Another strength ofthis study is that we removed the confounding effect of
Table 1 Case definition of necrotising enterocolitis
Stage I Abdominal distension or abdominal x ray showing gaseous distension orfrothy appearance of bowel lumen (or both); blood in stool; hypotonia,apnoea, or bradycardia (or combination of these)
Stage II Abdominal tenderness or rigidity; absent bowel sounds; tissue in stool;abdominal x ray showing gas in the bowel wall or portal tree; abnormalbleeding with trauma; thrombocytopenia; lymphocytopenia
Stage III Marked abdominal distension or rigidity; free gas in the peritoneum;spontaneous bleeding; coagulopathy; severe metabolic acidosis
Table 2 Antenatal characteristics
Casesn (%)
Controlsn (%) OR (95% CI)
Maternal pre-eclampsia 10 (19) 14 (26) 0.65 (0.26 to 1.63)
Diabetes mellitus 2 (4) 3 (4) 0.65 (0.10 to 4.08)
Documented AREDFV 7 (13) 5 (9) 1.46 (0.43 to 4.93)
Maternal smoking 19 (36) 19 (36) 1.00 (0.45 to 2.21)
Antenatal corticosteroids 34 (64) 38 (72) 0.71 (0.31 to 1.60)
Tocolytic therapy 5 (9) 4 (8) 1.28 (0.32 to 5.04)
Maternal antibiotics 20 (38) 26 (49) 0.63 (0.29 to 1.36)
Membranes ruptured .24 h 15 (28) 12 (23) 1.35 (0.56 to 3.25)
Maternal fever (.38 uC) in labour 5 (9) 3 (6) 1.74 (0.39 to 7.67)
AREDFV, arterial absent or reversed end-diastolic flow velocity.
Original article
Arch Dis Child Fetal Neonatal Ed 2009;94:F120–F123. doi:10.1136/adc.2007.119560 F121
on 5 March 2009 fn.bmj.comDownloaded from

gestational age by frequency matching. Since short gestationremains the single most important determinant of the risk ofNEC in preterm infants, older studies that matched solely forbirth weight may have been subject to bias.12
We found that feeding with human breast milk wasassociated with lower risk of NEC, consistent with findingsfrom previous observational studies.13 14 Although this associa-tion may, in part, be due to other confounding variables, recentmeta-analyses of randomised trials have also indicated thatfeeding preterm infants with breast milk reduces their risk ofdeveloping NEC.15–17 These findings endorse the current practiceof encouraging mothers to express breast milk for their preterminfants, and of supporting them to do so with evidence-basedinterventions.18–20 The question of whether donor breast milk isthe best alternative when maternal milk is not available requiresconsideration of feasibility, costs, acceptability and the effect onother important outcomes, principally nutrient intake, growthand development.
We did not find any evidence that commencing enteral feedswithin the first few days after birth was associated with the riskof NEC. However, we did find that the subsequent feedingexperience of these infants differed significantly between casesand controls. Cases received about three days of trophic feeds onaverage compared with six days in controls. The rate of feedsadvancement was faster in cases, and infants achieved fullenteral feeding on average about 5 days earlier than controls.
These findings should be interpreted cautiously. We haveaccounted for the major confounding variable, gestational age atbirth, by frequency matching our cases with controls. However,although we did not find any significant differences in otherpotential antenatal and perinatal risk factors between thegroups, unknown confounding variables may have affected thestudy results. In common with all unblinded studies of enteralfeeding in preterm infants, two other sources of bias exist.
First, clinicians may have been more likely to investigate anddiagnose NEC in infants they considered to be at higher risk, forexample infants fed only formula milk (surveillance bias). Asecond major potential source of bias in feeding studies is the‘‘substrate effect’’. Since the generation of gas in the bowel wall(pneumatosis intestinalis) or portal tract requires the presenceof milk substrate, there may be a tendency to diagnose stage II/III NEC more often in infants who have received more enteralfeeds.4–6 Our primary analyses therefore included infants withall stages of NEC rather than only those where the diagnosiswas ‘‘confirmed’’ radiologically. However, the differences wedetected in duration of trophic feeding and time to full feedingpersisted when analyses were restricted to infants with stage II/III NEC.
We did not find any evidence that an antenatal finding ofAREDFV was associated with the risk of NEC in this study.However, the 95% CI for the effect size was wide because fewparticipants in either group had documented AREDFV. Previousobservational studies that have examined associations betweenAREDFV and the risk of developing NEC have reported
inconsistent findings.21 This may be related to differences instudy design, especially with regard to management ofconfounding variables that are risk factors for NEC. Notably,none of the studies that have used a study design thataccounted for birth weight and gestational age found asignificant association between AREDFV and NEC.22–24 Thisuncertainty may be resolved, and clinical practice betterinformed, when the findings of an ongoing multicentrerandomised controlled trial comparing early versus delayedenteral feeding for infants with AREDFV become available (seeAbnormal Enteral Doppler Prescription Trial: http://www.npeu.ox.ac.uk/adept/).
Although these and other data suggest that the more rapidadvancement of enteral feeding volumes beyond trophic feeds isassociated with a higher risk of developing NEC, a firm practicerecommendation can only be made when sufficient data fromrandomised controlled trials are available. The currentlyavailable trial data indicate that compared with enteral fasting,trophic feeding reduces the time to full feeding and the length ofhospital stay without increasing in the risk of NEC.6 In addition,infants of mothers who express breast milk for early trophicfeeding are more likely to receive breast milk as their ongoingprincipal form of nutrition.25 However, the only trial that hascompared trophic feeding with progressive advancement ofenteral feeds in preterm infants was stopped early because of aborderline significant higher incidence of NEC in the advancedfeeding group.7 There is a high chance that this represents aspurious result.26 Furthermore the findings of this single-centrestudy are unlikely to be widely generalisable—the trial excludedsmall for gestational age infants, enteral feeds were notintroduced at all until about 10 days after birth in both casesand control groups, and fewer than a third of the studyparticipants received breast milk.
A large multicentre trial of progressive advancement ofenteral feeds versus prolonged trophic feeding appears to be aresearch priority. Because of the potential for feeding interven-tions to affect other competing outcomes (such as duration ofuse of parenteral nutrition, the risk of nosocomial infection,length of hospital stay),27 as well as the problems inherent inminimising bias in (unblinded) feeding studies, it is recom-mended that any future trials should also aim to assess theeffect on objective outcomes including mortality and longer-term neurological disability.6
Acknowledgements: We thank the local investigators in the participating centres: SAinsworth, S Bali, B Holland, S Kinmond, N Matta, M Schwager, C Skeoch, B Stensonand G Stewart.
Funding: The study was funded by Tenovus (Scotland). The funder had no role in thecollection, analysis and interpretation of data, or in the writing of the report and thedecision to submit the paper for publication. The National Perinatal Epidemiology Unitreceives funding from the Department of Health. The views expressed in thispublication are those of the authors and not necessarily those of the Department ofHealth.
Competing interests: None.
Ethics approval: The Northern and Yorkshire multicentre research ethics committeeapproved the study.
REFERENCES
1. Cooke RJ, Embleton ND. Feeding issues in preterm infants. Arch Dis Child FetalNeonatal Ed 2000;83:F215–18.
2. Williams AF. Early enteral feeding of the preterm infant. Arch Dis Child FetalNeonatal Ed 2000;83:F219–20.
3. Patole SK, de Klerk N. Impact of standardised feeding regimens on incidence ofneonatal necrotising enterocolitis: a systematic review and meta-analysis ofobservational studies. Arch Dis Child Fetal Neonatal Ed 2005;90:F147–51.
Table 3 Postnatal management
Casesn (%)
Controlsn (%) OR (95% CI)
Mechanical ventilation 47 (89) 46 (87) 1.19 (0.37 to 3.82)
Surfactant replacement 41 (77) 42 (79) 0.89 (0.36 to 2.26)
Umbilical artery catheter 25 (47) 22 (42) 1.26 (0.58 to 2.71)
NSAID treatment for PDA 13 (25) 22 (42) 0.46 (0.20 to 1.05)
NSAID, non-steroidal anti-inflammatory drug; PDA, patent ductus arteriosus.
Original article
F122 Arch Dis Child Fetal Neonatal Ed 2009;94:F120–F123. doi:10.1136/adc.2007.119560
on 5 March 2009 fn.bmj.comDownloaded from

4. Bombell S, McGuire W. Delayed introduction of progressive enteral feeds to preventnecrotising enterocolitis in very low birth weight infants. Cochrane Database Syst Rev2008;(2):CD001970.
5. McGuire W, Bombell S. Slow advancement of enteral feed volumes to preventnecrotising enterocolitis in very low birth weight infants. Cochrane Database Syst Rev2008;(2):CD001241.
6. Tyson JE, Kennedy KA. Trophic feedings for parenterally fed infants. CochraneDatabase Syst Rev 2005;(3):CD000504.
7. Berseth CL, Bisquera JA, Paje VU. Prolonging small feeding volumes early in lifedecreases the incidence of necrotizing enterocolitis in very low birth weight infants.Pediatrics 2003;111:529–34.
8. Guthrie SO, Gordon PV, Thomas V, et al. Necrotizing enterocolitis among neonates inthe United States. J Perinatol 2003;23:278–85.
9. Uauy RD, Fanaroff AA, Korones SB, et al. Necrotizing enterocolitis in very low birthweight infants: biodemographic and clinical correlates. National Institute of Child Healthand Human Development Neonatal Research Network. J Pediatr 1991;119:630–8.
10. Boyle EM, Menon G, Elton R, et al. Variation in feeding practice in preterm and lowbirth weight infants in Scotland. Early Hum Dev 2004;77:125–6.
11. Walsh MC, Kliegman RM. Necrotizing enterocolitis: treatment based on stagingcriteria. Pediatr Clin North Am 1986;33:179–201.
12. McKeown RE, Marsh TD, Amarnath U, et al. Role of delayed feeding and of feedingincrements in necrotizing enterocolitis. J Pediatr 1992;121:764–70.
13. Beeby PJ, Jeffery H. Risk factors for necrotising enterocolitis: the influence ofgestational age. Arch Dis Child 1992;67:432–5.
14. Lucas A, Cole TJ. Breast milk and neonatal necrotising enterocolitis. Lancet1990;336:1519–23.
15. Chauhan M, Henderson G, McGuire W. Enteral feeding for very low birthweight infants:reducing the risk of enterocolitis. Arch Dis Child Fetal Neonatal Ed 2008;93:F62–6.
16. Boyd CA, Quigley MA, Brocklehurst P. Donor breast milk versus infant formula forpreterm infants: a systematic review and meta-analysis. Arch Dis Child Fetal NeonatalEd 2006;92:F169–75.
17. Quigley MA, Henderson G, Anthony MY, et al. Formula milk versus donor breast milkfor feeding preterm or low birth weight infants. Cochrane Database Syst Rev2007:(4):CD0029714.
18. Jones E, Dimmock PW, Spencer SA. A randomised controlled trial to comparemethods of milk expression after preterm delivery. Arch Dis Child Fetal Neonatal Ed2001;85:F91–5.
19. Fewtrell MS, Loh KL, Blake A, et al. Randomised, double blind trial of oxytocin nasalspray in mothers expressing breast milk for preterm infants. Arch Dis Child FetalNeonatal Ed 2006;91:F169–74.
20. Jones E, Spencer SA. Optimising the provision of human milk for preterm infants.Arch Dis Child Fetal Neonatal Ed 2007;92:F236–8.
21. Dorling J, Kempley S, Leaf A. Feeding growth restricted preterm infants withabnormal antenatal Doppler results. Arch Dis Child Fetal Neonatal Ed2005;90:F359–63.
22. Malcolm G, Ellwood D, Devonald K, et al. Absent or reversed end diastolic flowvelocity in the umbilical artery and necrotising enterocolitis. Arch Dis Child1991;66:805–7.
23. Wilson DC, Harper A, McClure G. Absent or reversed end-diastolic velocity in theumbilical artery and necrotising enterocolitis. Arch Dis Child 1991;66:1467.
24. Adiotomre PN, Johnstone FD, Laing IA. Effect of absent end diastolic flow velocityin the fetal umbilical artery on subsequent outcome. Arch Dis Child 1997;76:F35–8.
25. Schanler RJ, Shulman RJ, Lau C, et al. Feeding strategies for premature infants:randomised trial of gastrointestinal priming and tube-feeding method. Pediatrics1999;103:434–9.
26. Montori VM, Devereaux PJ, Adhikari NK, et al. Randomized trials stopped early forbenefit: a systematic review. JAMA 2005;294:2203–9.
27. Flidel-Rimon O, Friedman S, Lev E, et al. Early enteral feeding and nosocomial sepsisin very low birth weight infants. Arch Dis Child Fetal Neonatal Ed 2004;89:F289–92.
APPENDIX 1
Participating centres (local investigators)c Royal Jubilee Maternity, Belfast (Dr S Craig)c Princess Royal Maternity Hospital, Glasgow (Dr N Matta)c Queen Mother’s Hospital, Glasgow (Dr B Holland)c Ninewells Hospital, Dundee (Dr M Schwager)c Royal Infirmary, Edinburgh (Dr B Stenson)c Forth Park Hospital, Kirkcaldy (Dr S Ainsworth)c Antrim Hospital, Antrim (Dr S Bali)c Ayrshire Central Hospital, Irvine (Dr S Kinmond)c Royal Victoria Infirmary, Newcastle (Dr S Oddie)c Royal Alexandra Hospital, Paisley (Dr G Stewart)
Original article
Arch Dis Child Fetal Neonatal Ed 2009;94:F120–F123. doi:10.1136/adc.2007.119560 F123
on 5 March 2009 fn.bmj.comDownloaded from

doi:10.1136/adc.2007.119933 online 3 Sep 2007;
2009;94;F124-F128; originally publishedArch. Dis. Child. Fetal Neonatal Ed. G Henderson, S Craig, R J Baier, N Helps, P Brocklehurst and W McGuire
studyassociationwith necrotising enterocolitis: genetic
Cytokine gene polymorphisms in preterm infants
http://fn.bmj.com/cgi/content/full/94/2/F124Updated information and services can be found at:
These include:
References
http://fn.bmj.com/cgi/content/full/94/2/F124#BIBL
This article cites 29 articles, 10 of which can be accessed free at:
Rapid responses http://fn.bmj.com/cgi/eletter-submit/94/2/F124
You can respond to this article at:
serviceEmail alerting
the top right corner of the article Receive free email alerts when new articles cite this article - sign up in the box at
Notes
http://journals.bmj.com/cgi/reprintformTo order reprints of this article go to:
http://journals.bmj.com/subscriptions/ go to: Archives of Disease in Childhood - Fetal and Neonatal EditionTo subscribe to
on 5 March 2009 fn.bmj.comDownloaded from

Cytokine gene polymorphisms in preterm infantswith necrotising enterocolitis: genetic associationstudy
G Henderson,1 S Craig,2 R J Baier,3 N Helps,4 P Brocklehurst,5 W McGuire6
c Additional data are publishedonline only at http://adc.bmj.com/content/vol94/issue2
1 Department of HealthSciences, Griffith University,Brisbane, Australia; 2 RegionalNeonatal Unit, Royal JubileeMaternity Hospital, Belfast, UK;3 Department of Paediatrics,University of Manitoba, Canada;4 The Sequencing Service,College of Life Sciences,University of Dundee, UK;5 National Perinatal EpidemiologyUnit, University of Oxford, UK;6 Centre for Newborn Care,Australian National University,Canberra, Australia
Correspondence to:Dr W McGuire, Centre forNewborn Care, The CanberraHospital, ACT 2606, Australia;[email protected]
Accepted 13 August 2007Published Online First8 November 2007
ABSTRACTBackground: The inflammatory cytokine cascade isimplicated in the pathogenesis of necrotising enterocolitis(NEC). Genetic association studies of cytokine poly-morphisms may help to detect molecular mechanismsthat are causally related to the disease process.Aim: To examine associations between the commongenetic variants in candidate inflammatory cytokine genesand NEC in preterm infants.Methods: Multi-centre case–control and genetic asso-ciation study. DNA samples were collected from 50preterm infants with NEC and 50 controls matched forgestational age and ethnic group recruited to a multi-centre case–control study. Ten candidate single-nucleo-tide polymorphisms in cytokines previously associatedwith infectious or inflammatory diseases were genotyped.The findings were included in random-effects meta-analyses with data from previous genetic associationstudies.Results: All allele distributions were in Hardy–Weinbergequilibrium. None of the studied cytokine polymorphismswas significantly associated with NEC. Four previousgenetic association studies of cytokine polymorphismsand NEC in preterm infants were found. Meta-analyseswere possible for several single-nucleotide polymorph-isms. These increased the precision of the estimates ofeffect size but did not reveal any significant associations.Conclusions: The available data are not consistent withmore than modest associations between these candidatecytokine variant alleles and NEC in preterm infants. Datafrom future association studies of these polymorphismsmay be added to the meta-analyses to obtain moreprecise estimates of effects sizes.
Necrotising enterocolitis (NEC) is a major cause ofdeath and disability in preterm infants but itspathogenesis is incompletely understood. Gutimmaturity and sub-optimal gut perfusion, exacer-bated by enteral feeding, may be important.Additional factors, including enteric or systemicinfection, may then precipitate a cascade ofinflammatory events leading to the clinical andpathological end point of NEC.1
Evidence exists for the involvement of severalhost inflammatory mediators in the final commonpathway leading to NEC. Plasma concentrationsand tissue expression of the proinflammatorycytokines, tumour necrosis factor (TNF), interleu-kin (IL)-1b, IL6, IL8 and IL18, are increased ininfants with NEC.2–4 Proinflammatory effects aremodulated by receptor antagonists and regulationof receptors as well as by the effects of anti-inflammatory cytokine cascades, principally
IL10.5 6 Studies using animal models have sug-gested that modulating the inflammatory cytokinecascade may be a beneficial adjunctive strategy fortreating preterm infants with NEC.7–9
In investigating the contribution of these com-plex cytokine cascades to the pathogenesis of NEC,it is difficult to distinguish molecular mechanismsthat are causal from those that are epiphenomenaof the disease process. Raised plasma and tissueconcentrations of inflammatory mediators may bea consequence, rather than the cause, of thedisease. An alternative strategy that obviates theseproblems is to examine whether the risk of NEC isassociated with genetic factors that regulatecytokine production or function. This approachhas been used to study the role of inflammatorymediators in a number of diseases associated withpreterm birth, including NEC.10–12
Here we have examined associations betweenvariants in candidate cytokine genes with suscept-ibility to NEC in preterm infants recruited to amulti-centre case–control study. We focused oncommon single-nucleotide polymorphisms (SNPs)that are of likely or proved functional significance,or have plausible disease associations describedpreviously. As genetic association studies in thisfield are often limited by small sample sizes and areunderpowered to exclude modest associations,where possible, we have quantitatively synthesisedthe study findings with data from other studies inorder to provide a more precise estimate of theeffect size.13
METHODSA case–control study of NEC in preterm infantswas conducted in 10 neonatal units in the north ofBritain between January 2004 and December 2005.
What is already known on this topic
c Inflammatory cytokine cascades may play a keyrole in the pathogenesis of necrotisingenterocolitis (NEC) in preterm infants.
c Genetic association studies may help todistinguish causal molecular mechanisms fromepiphenomena.
What this study adds
None of the candidate cytokine polymorphisms sofar studied is significantly associated with NEC.
Original article
F124 Arch Dis Child Fetal Neonatal Ed 2009;94:F124–F128. doi:10.1136/adc.2007.119933
on 5 March 2009 fn.bmj.comDownloaded from

Briefly, cases were preterm infants with NEC diagnosed usingmodified Bell criteria or at laparotomy or autopsy examination.Controls were infants who had not developed NEC by34 weeks’ postmenstrual age. Cases and controls were fre-quency-matched for gestational age at birth. More details of themethods are published elsewhere.14 The Northern & Yorkshiremulti-centre research ethics committee approved the study.
A dried blood sample from each infant was collected on filterpaper (Whatman FTA, Whatman International, Maidstone,Kent, UK). DNA was extracted using the REDExtract-N-AmpBlood PCR kit (Sigma Chemicals, Poole, Dorset, UK). Therelevant sequences were amplified by PCR, and the productssequenced in an automated sequencer using a standardSNaPshot run setup (see online supplement for PCR SNPprimer sequences and PCR run conditions). Alleles wereassigned with the ABI GeneMapper software and recheckedmanually. Data were analysed combining individuals homo-zygous and heterozygous for the variant allele into a singleexposure class.
Meta-analysisMedline (1966–2007) and EMBASE (1980–2007) were searchedfor genetic association studies using the following text wordsand MeSH terms: [Enterocolitis, Necrotizing OR necrotisingenterocolitis OR NEC] AND [Polymorphism, Genetic ORCytokines/genetics]. References in previous reviews and studies
were examined. Abstracts presented at the Society for PediatricResearch and European Society for Pediatric Research between1995 and 2006 were searched.
For each potentially eligible study, information on setting,design, inclusion/exclusion criteria and genotyping method wasextracted. Study investigators were contacted to obtain addi-tional information if necessary. Case–control and cohort studieswere eligible for inclusion provided that (a) NEC was definedusing standard criteria (Bell staging or modifications), (b) theenrolment of participants was not made on the basis of priorknowledge of genotype, (c) genotyping had been blinded toclinical status, (d) the study reported the ethnic ancestry ofparticipants, (e) the reported genotype distributions were inHardy–Weinberg equilibrium, and (f) the report provided datasufficient to calculate an odds ratio (OR). Included data weresynthesised in random-effects meta-analyses—that is, with no apriori assumption of effect homogeneity—using RevMan soft-ware (version 4.2). Heterogeneity was assessed using the x2 test(p,0.1 considered significant).
RESULTS
Genetic association studyTen polymorphisms were genotyped in 50 cases and 50 matchedcontrols (table 1). Allele distribution was in Hardy–Weinbergequilibrium for all polymorphisms. The proportion of infantswith the variant allele did not differ significantly between casesand controls for any of the comparisons (table 2). The findingsdid not change when analysis was restricted to infants withstage 2/3 NEC (n = 38).
Table 1 Location of candidate single-nucleotide polymorphism (SNP)relative to transcription start site
CytokineSNP position(major/minor allele) Putative effect of minor allele
TNF 2238 (G/A) Increased transcription15*
TNF 2308 (G/A) Increased transcription15 16*
IL1b 231 (T/C) Decreased transcription17
IL1b 2511 (C/T) Increased transcription17
IL4 receptor a +1902 (G/A) Enhanced signalling18
IL6 2174 (G/C) Increased production19
IL8 2251 (T/A) Increased production20
IL10 21082 (G/A) Reduced transcription21
IL18 2137 (G/C) Reduced transcription22
IL18 2607 (C/A) Reduced transcription22
*Cell/stimulus specific.IL, interleukin; TNF, tumour necrosis factor.
Table 2 Variant cytokine genotypes in cases and controls
Allele Cases Controls OR (95% CI)
TNF (2308A) 19 (38%) 17 (34%) 1.19 (0.53 to 2.69)
TNF (2238A) 6 (12%) 9 (18%) 0.62 (0.20 to 1.90)
IL1 (231G) 28 (56%) 33 (66%) 0.66 (0.29 to 1.47)
IL1 (2511T) 30 (60%) 33 (66%) 0.77 (0.24 to 1.74)
IL4R (+1902G) 15 (30%) 13 (26%) 1.22 (0.51 to 2.93)
IL6 (2174C) 37 (74%) 34 (68%) 1.34 (0.56 to 3.19)
IL8 (2251A) 36 (72%) 40 (80%) 0.64 (0.25 to 1.63)
IL10 (21082G) 39 (78%) 38 (76%) 1.12 (0.44 to 2.84)
IL18 (2137C) 20 (40%) 25 (50%) 0.67 (0.30 to 1.47)
IL18 (2607A) 31 (62%) 30 (60%) 1.09 (0.49 to 2.43)
IL, interleukin; IL4R, interleukin 4 receptor; TNF, tumour necrosis factor.
Table 3 Cytokine genetic association studies in NEC
Reference
Country andpredominantethnic groups Participants Design (cases/controls) Alleles studied
23–25 Hungary/Caucasian BW,1500 g
NEC = Bell stage 1–3
Case–control (46/90) TNF (2308A)
TNF (2238A)
IL4R (+1902G)
IL6 (2174C)
IL10 (21082G)
IL18 (2607A)26 USA/Caucasian and
African–AmericanBW,1250 g
NEC = Bell stage 1–3
Prospective cohort (39/102) TNF (2308A)
TNF (2238A)27,28 USA/Caucasian and
African–AmericanBW,1500 g
Mechanically ventilated
NEC = Bell stage 1–3
Retrospective cohort (26/262) TNF (2308A)
IL6 (2174C)
IL10 (21082G)29 Germany/Caucasian GA,32 weeks
NEC = Bell stage 1–3Retrospective cohort (9/64) TNF (2308A)
IL10 (21082G)
BW, birth weight; GA, gestational age; IL, interleukin; IL4R, interleukin 4 receptor; NEC necrotising enterocolitis; TNF, tumournecrosis factor.
Original article
Arch Dis Child Fetal Neonatal Ed 2009;94:F124–F128. doi:10.1136/adc.2007.119933 F125
on 5 March 2009 fn.bmj.comDownloaded from

Systematic literature searchFour genetic association studies of cytokine polymorphisms andNEC in preterm infants were found (table 3).23–29
Meta-analysesTNF (2308A), TNF (2238A), IL6 (2174C) and IL10 (21082A)Random-effects meta-analyses of data from this study withthose from previous studies did not reveal any significantdifferences (fig 1). None of the meta-analyses revealedsignificant heterogeneity.
IL4 receptor (+1902G)The only previous study to have examined the association of theIL4 receptor (+1902G) with NEC reported that the variant allele
was significantly less common in cases than controls (cases 10/46; controls 37/90; OR 0.40 (95% CI 0.18 to 0.90)).25 We did notfind any significant difference in the present study (cases 15/50;controls 13/50; OR 1.22 (95% CI 0.51 to 2.93)). Meta-analysis ofcombined data did not find a significant association (pooled OR0.66 (95% CI 0.37 to 1.18)).
IL18 (2607A)One study (in a post hoc analysis) reported that the proportionof infants homozygous for the IL18 (2607A) allele (AAgenotype) was significantly higher in infants with stage 3NEC (cases 4/8; controls 7/90; OR 11.9 (95% CI 2.4 to 57.9)).24
We did not find a significant difference in the present study(cases 1/7; controls 7/50; OR 0.77 (95% CI 0.08 to 7.12)). When
Figure 1 Meta-analyses (randomeffects) of genetic association studies. IL,interleukin; TNF, tumour necrosis factor.a, African–American; b, Caucasian.
Original article
F126 Arch Dis Child Fetal Neonatal Ed 2009;94:F124–F128. doi:10.1136/adc.2007.119933
on 5 March 2009 fn.bmj.comDownloaded from

these data were meta-analysed, the association was notstatistically significant (pooled OR 3.36 (95% CI 0.21 to 53.6)).
DISCUSSIONThe available data suggest that these common cytokine geneticpolymorphisms are not strongly associated with the risk of NECin preterm infants. In most cases, the estimates of effect sizesuggest that modest effects have not been missed. For someassociations, use of meta-analytical techniques commonly usedfor synthesising the findings of controlled trials allowed us toincrease the precision of the estimates. Meta-analyses werepossible because the studies recruited broadly similar popula-tions of infants using standard case definitions of NEC asinclusion criteria. Controls were selected from ethnically similarpopulations, or data provided to allow stratified analysis byethnic background to account for the potential confoundingeffect of population admixture.13 Although data were pooledfrom different study designs, we did not find statistical evidenceof heterogeneity in the meta-analyses, suggesting that theseestimates are reliable.
The TNF promoter polymorphisms (2308A and 2238A) havebeen the most commonly studied cytokine gene variants. Ourfindings are consistent with those of three previous studies,which did not detect any significant associations withNEC.23 24 29 Although the estimates of effect size from eachindividual study were wide, meta-analysis of all of these datasuggests that, if any associations do exist, they are likely to bevery modest. This lack of association does not rule out thepossibility that TNF and other proinflammatory cytokines areimportant in the pathogenesis of NEC in preterm infants. Trueassociations may exist but with very modest effect sizes toosmall to be excluded by the available data. Alternatively, it maybe that the candidate polymorphisms that we have studied arenot directly involved in gene regulation, or that any functionaleffect is dependent on the haplotypic background for whichneither we, nor others, have data.
Meta-analysis of association studies also suggests that thecommon IL6 (2174C) SNP is very unlikely to increase suscept-ibility to NEC. However, the lower bound of the 95% CI for theOR was consistent with a modest protective effect (halving ofodds). Evidence exists that this polymorphism increases IL6production in neonatal lymphocytes stimulated with lipopoly-saccharide.17 Carriage of the variant is associated with protectionagainst invasive infection in preterm infants, presumably byenhancing the immune response.30 Although it is biologicallyplausible that a polymorphism that enhances the inflammatoryresponse may increase the risk (or severity) of NEC, anotherpossibility is that such a polymorphism may reduce the risk ofNEC by preventing enteric or systemic infections that trigger theinflammatory cascade. Similarly, the IL10 (21082A) variant hasbeen associated with an increase in susceptibility to late-onsetinvasive infection in preterm infants.28 Meta-analysis of data fromfive studies did not reveal a significant association with NEC, butthe upper bound of the 95% CI of the OR (2.6) does not exclude amodest effect size. Data from future association studies may beadded to this meta-analysis to increase the precision of theseestimates of effect size.
Only two studies have previously reported significantassociations between cytokine polymorphisms and NEC.Treszl and colleagues found that genetic variation in the IL4receptor (+1902G) was associated with a lower risk of NEC.25
The investigators suggested that the enhanced production of IL4protected the immature gastrointestinal tract from inflamma-tion and that screening for this allele would allow targeted
surveillance and intervention to prevent NEC in at-risk infants.In the present study, and on meta-analysis of data from bothstudies, we did not find a significant association, suggesting thatsuch an approach is not justified at present.
The same investigators reported an association betweenhomozygosity of the IL18 (2607A) allele with stage 3 NEC.24
However, this association appears to have been the result of apost hoc subgroup analysis, and therefore may have beenspurious. We did not detect a similar effect, and meta-analysingthe data suggests there to be no significant association withNEC. These findings support the need to confirm reports ofgenetic associations in independent populations, particularly ifthe first reported effect size is modest, derived from a post hocor subgroup analysis, and was detected as part of a largerassociation study where multiple comparisons were made.13
Genetic association studies may also be useful in examiningthe role of other inflammatory mediators in the pathogenesis ofNEC. Candidates for further investigation include platelet-activating factor (a phospholipid with complex biologicalfunctions that may be a key mediator in the process leadingto NEC), cyclo-oxygenase-2, and various forms of nitric oxidesynthase that mediate the downstream vascular effects of theinflammatory cascade.1 Such studies should aim to study similarpopulations of infants (using standard case definitions) and usemeasures to avoid confounding, particularly ethnic heterogene-ity. The use of family-based studies, which allow multiplegenetic markers to be examined without the possibility ofconfounding due to population admixture, may be particularlysuitable for investigating complex diseases of preterm infants.
Acknowledgements: We thank the principal investigators of the cited geneticassociation studies for providing further data for inclusion in the meta-analyses.
Funding: The study was funded by Tenovus (Scotland). The funder had no role in thecollection, analysis and interpretation of data, or in the writing of the report and thedecision to submit the paper for publication. The National Perinatal Epidemiology Unitreceives funding from the Department of Health. The views expressed in thispublication are those of the authors and not necessarily those of the Department ofHealth.
Competing interests: None.
REFERENCES1. Martin CR, Walker WA. Intestinal immune defences and the inflammatory response
in necrotising enterocolitis. Semin Fetal Neonatal Med 2006;11:369–77.2. Harris MC, Costarino AT Jr, Sullivan JS, et al. Cytokine elevations in critically ill
infants with sepsis and necrotizing enterocolitis. J Pediatr 1994;124:105–11.3. Viscardi RM, Lyon NH, Sun CC, et al. Inflammatory cytokine mRNAs in surgical
specimens of necrotizing enterocolitis and normal newborn intestine. Pediatr PatholLab Med 1997;17:547–59.
4. Halpern MD, Holubec H, Dominguez JA, et al. Up-regulation of IL-18 and IL-12 in theileum of neonatal rats with necrotizing enterocolitis. Pediatr Res 2002;51:733–9.
5. Edelson MB, Bagwell CE, Rozycki HJ. Circulating pro- and counterinflammatorycytokine levels and severity in necrotizing enterocolitis. Pediatrics 1999;103:766–71.
6. Ng PC, Li K, Wong RP, et al. Proinflammatory and anti-inflammatory cytokineresponses in preterm infants with systemic infections. Arch Dis Child Fetal NeonatalEd 2003;88:F209–13.
7. Travadi J, Patole S, Charles A, et al. Pentoxifylline reduces the incidence andseverity of necrotizing enterocolitis in a neonatal rat model. Pediatr Res2006;60:185–9.
8. Halpern MD, Clark JA, Saunders TA, et al. Reduction of experimental necrotizingenterocolitis with anti-TNF-alpha. Am J Physiol Gastrointest Liver Physiol2006;290:G757–64.
9. Ozturk H, Dokucu AI, Ogun C, et al. Protective effects of recombinant humaninterleukin-10 on intestines of hypoxia-induced necrotizing enterocolitis in immaturerats. J Pediatr Surg 2002;37:1330–3.
10. Lin HC, Tsai FJ, Tsai CH, et al. Cytokine polymorphisms and chronic lung disease insmall preterm infants. Arch Dis Child Fetal Neonatal Ed 2005;90:F93–4.
11. Bokodi G, Derzbach L, Banyasz I, et al. Association of interferon gamma T+874A andinterleukin 12 p40 promoter CTCTAA/GC polymorphism with the need for respiratorysupport and perinatal complications in low birthweight neonates. Arch Dis Child FetalNeonatal Ed 2007;92:F25–9.
12. Harding D. Impact of common genetic variation on neonatal disease and outcome.Arch Dis Child Fetal Neonatal Ed 2007;92:F408–13.
Original article
Arch Dis Child Fetal Neonatal Ed 2009;94:F124–F128. doi:10.1136/adc.2007.119933 F127
on 5 March 2009 fn.bmj.comDownloaded from

13. Hanchard NA. Genetic susceptibility and single-nucleotide polymorphisms. SeminFetal Neonatal Med 2005;10:283–9.
14. Henderson G, Craig S, Brocklehurst P, et al. Enteral feeding regimens andnecrotising enterocolitis in preterm infants: multi-centre case-control study. Arch DisChild Fetal Neonatal Ed 2008;93:in press.
15. Bayley JP, de Rooij H, van den Elsen PJ, et al. Functional analysis of linker-scanmutants spanning the 2376, 2308, 2244, and 2238 polymorphic sites of the TNF-alpha promoter. Cytokine 2001;14:316–23.
16. Wilson AG, Symons JA, McDowell TL, et al. Effects of a polymorphism in the humantumor necrosis factor alpha promoter on transcriptional activation. Proc Natl Acad SciUSA 1997;94:3195–9.
17. Chen H, Wilkins LM, Aziz N, et al. Single nucleotide polymorphisms in the humaninterleukin-1B gene affect transcription according to haplotype context. Hum MolGenet 2006;15:519–29.
18. Kruse S, Japha T, Tedner M, et al. The polymorphisms S503P and Q576R in theinterleukin-4 receptor alpha gene are associated with atopy and influence the signaltransduction. Immunology 1999;96:365–71.
19. Kilpinen S, Hulkkonen J, Wang XY, et al. The promoter polymorphism of theinterleukin-6 gene regulates interleukin-6 production in neonates but not in adults. EurCytokine Netw 2001;12:62–8.
20. Hull J, Thomson A, Kwiatkowski D. Association of respiratory syncytial virusbronchiolitis with the interleukin 8 gene region in UK families. Thorax2000;55:1023–7.
21. Turner DM, Williams DM, Sankaran D, et al. An investigation of polymorphism in theinterleukin-10 gene promoter. Eur J Immunogenet 1997;24:1–8.
22. Giedraitis V, He B, Huang WX, et al. Cloning and mutation analysis of the human IL-18 promoter: a possible role of polymorphisms in expression regulation.J Neuroimmunol 2001:112:146–52.
23. Treszl A, Kocsis I, Szathmari M, et al. Genetic variants of the tumour necrosis factor-alpha promoter gene do not influence the development of necrotizing enterocolitis.Acta Paediatr 2001;90:1182–5.
24. Heninger E, Treszl A, Kocsis I, et al. Genetic variants of the interleukin-18 promoterregion (2607) influence the course of necrotising enterocolitis in very low birthweight neonates. Eur J Pediatr 2002;161:410–11.
25. Treszl A, Heninger E, Kalman A, et al. Lower prevalence of IL-4 receptor alpha-chaingene G variant in very-low-birth-weight infants with necrotizing enterocolitis. J PediatrSurg 2003;38:1374–8.
26. Kazzi SNJ, Kim O, Quasney MH. Do alleles of tumour necrosis factor gene affect thesusceptibility and/or severity of necrotizing enterocolitis? Pediatr Res 2004;55:2754.
27. Hedberg CL, Adcock K, Martin J, et al. Tumor necrosis factor alpha- 2308polymorphism associated with increased sepsis mortality in ventilated very low birthweight infants. Pediatr Infect Dis J 2004;23:424–8.
28. Baier RJ, Loggins J, Yanamandra K. IL-10, IL-6 and CD14 polymorphisms and sepsisoutcome in ventilated very low birth weight infants. BMC Med 2006;4:10.
29. Dordelmann M, Kerk J, Dressler F, et al. Interleukin-10 high producer allele andultrasound-defined periventricular white matter abnormalities in preterm infants: apreliminary study. Neuropediatrics 2006;37:130–6.
30. Harding D, Dhamrait S, Millar A, et al. Is interleukin-6 2174 genotypeassociated with the development of septicemia in preterm infants? Pediatrics2003;112:800–3.
Stay a step ahead with Online First
We publish all our original articles online before they appear in a print issue. This means that the latestclinical research papers go straight from acceptance to your browser, keeping you at the cutting edgeof medicine. We update the site weekly so that it remains as topical as possible. Follow the Online Firstlink on the home page and read the latest research.
Original article
F128 Arch Dis Child Fetal Neonatal Ed 2009;94:F124–F128. doi:10.1136/adc.2007.119933
on 5 March 2009 fn.bmj.comDownloaded from

doi:10.1136/adc.2008.141051 online 1 Oct 2008;
2009;94;F129-F132; originally publishedArch. Dis. Child. Fetal Neonatal Ed. Firmin, M Liddell, C Davis and A Goldman A Karimova, K Brown, D Ridout, W Beierlein, J Cassidy, J Smith, H Pandya, R
UKthepractice patterns and predictors of outcome in
Neonatal extracorporeal membrane oxygenation:
http://fn.bmj.com/cgi/content/full/94/2/F129Updated information and services can be found at:
These include:
References
http://fn.bmj.com/cgi/content/full/94/2/F129#BIBL
This article cites 17 articles, 8 of which can be accessed free at:
Rapid responses http://fn.bmj.com/cgi/eletter-submit/94/2/F129
You can respond to this article at:
serviceEmail alerting
the top right corner of the article Receive free email alerts when new articles cite this article - sign up in the box at
Notes
http://journals.bmj.com/cgi/reprintformTo order reprints of this article go to:
http://journals.bmj.com/subscriptions/ go to: Archives of Disease in Childhood - Fetal and Neonatal EditionTo subscribe to
on 5 March 2009 fn.bmj.comDownloaded from

Neonatal extracorporeal membrane oxygenation:practice patterns and predictors of outcome in the UK
A Karimova,1 K Brown,1 D Ridout,2 W Beierlein,1 J Cassidy,3 J Smith,3 H Pandya,4
R Firmin,4 M Liddell,5 C Davis,5 A Goldman1
1 Cardiac Critical Care and ECMOunit, Great Ormond StreetHospital for Children, London,UK; 2 Centre for PaediatricEpidemiology and Biostatistics,Institute of Child Health, London,UK; 3 Department of PICU andECMO, Freeman Hospital,Newcastle upon Tyne, UK;4 Department of ECMO, GlenfieldHospital, Leicester, UK;5 Department of PaediatricSurgery and ECMO, RoyalHospital for Sick Children,Yorkhill, Glasgow, UK
Correspondence to:A Karimova, Cardiothoracic Unit,Great Ormond Street Hospital forChildren, Great Ormond Street,London WC1N 3JH, UK;[email protected]
Accepted 9 August 2008Published Online First1 October 2008
ABSTRACTObjective: To review the UK neonatal extracorporealmembrane oxygenation (ECMO) service and identifypredictors of outcome.Design: Retrospective review of the national cohort.Patients and interventions: 718 neonates receivedECMO for respiratory failure between 1993 and 2005.Measurements and results: Diagnoses were: 48.0%meconium aspiration syndrome (97.1% survivors), 15.9%congenital diaphragmatic hernia (CDH; 57.9% survivors),15.9% sepsis (62.3% survivors), 9.5% persistent pul-monary hypertension (79.4% survivors), 5.6% respiratorydistress syndrome (92.5% survivors) and 5.1% congenitallung abnormalities (24.3% survivors). The overall survivalrate of 79.7% compared favourably with the worldwideExtracorporeal Life Support Organization (ELSO) Registry.Over the period of review, pre-ECMO use of advancedrespiratory therapies increased (p,0.001), but ECMOinitiation was not delayed (p = 0.61). The use of veno-venous (VV) ECMO increased (p,0.001) and average runtime fell (p = 0.004). Patients treated with VV ECMO hada survival rate of 87.7% compared with 73.4% in theveno-arterial (VA) ECMO group; only 42.4% of thoseneeding conversion from VV to VA ECMO survived. In non-CDH neonates, lower birth weight, lower gestational age,older age at ECMO and higher oxygenation index (OI)were associated with increased risk of death. In CDHneonates, lower birth weight and younger age at ECMOwere identified as risk factors for death.Conclusion: The UK neonatal ECMO service achievesgood outcomes and with overall survival rate reaching80% compares favourably with international results.Advanced respiratory therapies are used widely in UKECMO patients. Identification of higher OI and older age atECMO as risk factors in non-CDH neonates reinforces theimportance of timely referral for ECMO.
Extracorporeal membrane oxygenation (ECMO)was introduced in the UK in 1989 for thetreatment of neonates with acute hypoxic respira-tory failure (AHRF). Between 1993 and 1995 theUK Collaborative ECMO Trial was conducted,1
showing a marked survival, and survival withoutdisability, benefit of ECMO over conventionaltreatment, which has been maintained to 7 years’follow up.1 2 As a result of the UK ECMO Trial, theDepartment of Health established a nationalservice for neonatal ECMO with four centres:Glasgow, Newcastle, Leicester and London.
Over the past 15 years, advanced respiratorytherapies for neonates with AHRF have evolved, inparticular high-frequency oscillatory ventilation(HFOV), inhaled nitric oxide (iNO) and surfac-tant.3–6 Related to this, there has been worldwide
reduction in the use of ECMO for neonatal ARHF,reported by the ELSO registry.7–10
This paper aims to describe and evaluate the useof ECMO for neonatal AHRF in the UK since theservice was set up in 1993. Furthermore, we set outto establish the risk factors for death in thesepatients.
METHODSWe included all neonates treated with ECMO forAHRF in the UK between January 1993 andDecember 2005. Neonates with congenital heartdisease were excluded.
The following data were collected for eachneonate:c Pre-ECMO characteristics: diagnosis, sex, age
(0–28 days), gestational age, maximum oxyge-nation index (OI), use of iNO, surfactant andHFOV. Diagnosis was categorised as one of:
– meconium aspiration syndrome (MAS);
– persistent pulmonary hypertension of thenewborn (PPHN);
– sepsis (bacterial or viral);
– respiratory distress syndrome (RDS, pre-viously known as hyaline membrane disease);
– congenital diaphragmatic hernia (CDH);
What is already known on this topic
c ECMO is a lifesaving therapy for term neonateswith severe acute hypoxic respiratory failure andwas introduced to the UK in 1989.
c Alternate treatments including inhaled nitricoxide, high frequency oscillation and surfactanthave been introduced in the past decade, leadingto reduction of extracorporeal membraneoxygenation (ECMO) cases worldwide.
What this study adds
c Survival rates for neonatal ECMO in the UKcompare favourably with International Registryresults.
c In non-CDH patients, higher OI and older age atECMO initiation are identified as two significantrisk factors for death, reinforcing importance of atimely ECMO referral.
Original article
Arch Dis Child Fetal Neonatal Ed 2009;94:F129–F132. doi:10.1136/adc.2008.141051 F129
on 5 March 2009 fn.bmj.comDownloaded from

– ‘‘others’’ (including congenital lung dysplasias such assurfactant protein B deficiency, alveolar-capillary dyspla-sia and congenital lymphangiectasia).
c ECMO characteristics: type of ECMO used: veno-venous(VV) or veno-arterial (VA), and length of ECMO run.
c Outcome measure: survival to hospital discharge.
Statistical analysisSummaries are expressed as median values with interquartileranges (IQRs). For investigation of variation within the cohort,the Mann–Whitney test was used to compare skewed databetween groups, and the Kruskal–Wallis test was used wherethere were more than two groups. For frequency data, a x2 testwas used to test for association between two factors and a x2
test for trend was performed where one of the factors wasordered, for example the year of treatment with ECMO.Spearman rank correlation coefficient was used to test for atrend over time for continuous factors. Investigation of riskfactors for death was performed using logistic regressionanalysis and fractional polynomials were used to obtain thebest fitting model for total length of time on ECMO. Since theCDH group differed from the rest in terms of ECMO benefit inthe UK ECMO trial1 and CDH patients are distinguishable atthe time of ECMO referral, risk factors for death were analysedseparately in the CDH and non-CDH patients.
RESULTS
Cohort characteristicsIn total, 718 neonates (399 boys, 319 girls) were treated withECMO for AHRF between 1993 and 2005. The median birthweight was 3.3 kg (IQR 2.9, 3.7), gestational age 40 weeks (IQR38, 41) and patient age when ECMO was initiated was 24 h(IQR 20, 50).
The most common diagnosis leading to ECMO was MAS(n = 345; 48.0% patients), followed by CDH (n = 114; 15.9%),sepsis (n = 114; 15.9%), PPHN (n = 68; 9.5%) RDS (n = 40;6.6%) and others (n = 37; 5.1%). The spectrum of diagnosesremained fairly constant over the study period except for RDS,where the relative proportion decreased from 9.4% in 1996 to5.9% in 2005 (p,0.01). Overall survival to discharge was 79.7%,with significant differences in survival rates for differentdiagnoses (see table 1).
The degree of respiratory failure was determined by highestpre-ECMO OI: the median highest OI was 48 (IQR 35, 65); thehighest OI was noted to decrease over the study period(p,0.001). There was a difference in the pre-ECMO OI of thedifferent diagnostic groups, with CDH patients having a medianOI of 53 (IQR 39, 68), MAS patients having a median OI of 48
(IQR 35, 65) and RDS having a median OI of 42 (IQR 35, 52)(p = 0.03).
With respect to ECMO support, in 413 (57.6%) patientsmanaged on VV ECMO the survival rate was 362/413 (87.7%)compared with a survival rate of 193/263 (73.4%) among the263 (36.8%) patients who were managed on VA ECMO. Forty(5.6%) patients needed conversion from VV to VA ECMO; thesurvival rate for these was only 17/40 (42.5%). The proportionof VV ECMO was the highest in MAS patients (75.4% cases)and the lowest in sepsis (38.6%) and CDH (36.3%) patients(table 1). Notably, of those needing conversion from VV to VA,18% were patients from the ‘‘others’’ diagnostic group. Themedian length of the ECMO run was 119 h (IQR 84, 180). Thelength of ECMO run related to both diagnosis and type ofECMO (VV or VA) support: VV runs were significantly shorter(109 h (IQR 77, 156)) than VA runs (136 h (IQR 94, 203))(p,0.001); the differences between the diagnoses are shown intable 1.
Risk factors for mortalityPre-ECMO risk factorsIn the non-CDH group of patients (MAS, PPHN, sepsis, RDSand others), lower birth weight, lower gestational age, older ageat ECMO initiation and higher OI were all associated withincreased risk of death. In the CDH patients, only lower birthweight and younger age at ECMO initiation were identified asrisk factors for death. The age at which ECMO was initiatedproved to be a strong risk factor for death in both non-CDH andCDH patients, but of note, in opposite directions (table 2).
ECMO-related risk factorsBoth the type of ECMO and the length of ECMO run weresignificantly associated with outcome. In the non-CDH group,patients managed on VV ECMO had a better survival rate(90.9%) compared with those that had VA ECMO (77.8%)(p,0.001). Unsurprisingly, neonates treated on VA ECMO weresicker, for example in MAS patients on VA ECMO the OI washigher (57 (IQR 44, 80)) than in the VV group (45 (IQR 32, 61))(p,0.001). In the CDH patients the survival rate was similar
Table 1 Characteristics of the cohort
Diagnosis No (%)SurvivorsNo (%)
OIMedian (IQR)
Run timemedian (IQR)
Veno-venousECMONo (%)
Meconium aspiration syndrome 345 (48.0) 335 (97.1) 48 (35, 65) 100 (78, 138) 260 (75.4)
Congenital diaphragmatic hernia 114 (15.9) 66 (57.9) 53 (39, 68) 196 (120, 341) 41 (36.0)
Sepsis 114 (15.9) 71 (62.3) 44 (31, 69) 135 (84, 187) 44 (38.6)
Persistent pulmonary hypertension of thenewborn
68 (9.5) 54 (79.4) 44 (31, 63) 115 (84, 149) 31 (45.6)
Respiratory distress syndrome 40 (5.6) 37 (92.5) 42 (35, 52) 108 (86, 161) 18 (45)
Other 37 (5.1) 9 (24.3) 54 (41, 90) 210 (156, 336) 19 (51.4)
ECMO, extracorporeal membrane oxygenation; OI, oxygenation index; IQR, interquartile range.
Table 2 Univariate analysis of pre-ECMO risk factors
Parameter
Non-CDH(n = 604)OR (95% CI)
Non-CDHp value
CDH(n = 114)OR (95% CI)
CDHp value
Birth weight (g) 0.49 (0.33 to 0.74) 0.001 0.43 (0.20 to 0.94) 0.03
Gestational age(weeks)
0.80 (0.72 to 0.89) ,0.001 1.03 (0.85 to 1.25) 0.75
Age (days) 1.17 (1.11 to 1.24) ,0.001 0.73 (0.59 to 0.91) 0.005
OI (per 5 units) 1.03 (1.00 to 1.07) 0.06 1.01 (0.93 to 1.10) 0.84
Original article
F130 Arch Dis Child Fetal Neonatal Ed 2009;94:F129–F132. doi:10.1136/adc.2008.141051
on 5 March 2009 fn.bmj.comDownloaded from

regardless of type of ECMO: survival was 58.5% in the VVECMO group and 60.9% in the VA ECMO group (p = 0.81).Conversion from VV to VA ECMO carried a significantmortality risk for both CDH and non-CDH patients(p,0.001). The length of ECMO run had significant associationwith outcome in all groups of patients, showing bimodaldistribution: there was a higher mortality risk with very shortruns and with runs of extended length. This reflects early deathsin neonates with severe end organ injury and late deaths inthose who failed to recover despite a long ECMO run (fig 1).
Changes in ECMO practice over timeWhilst the ECMO trial was in progress (1993–5), approximately30 neonates with AHRF were treated with ECMO per year: thislow number reflects the fact that only half were randomised toECMO. Following the trial, the number of runs per yearstabilised from 1996. During the last 2 years of the study, 2004–5,the numbers decreased slightly to 53 and 51 ECMO cases perannum, respectively (fig 2).
With respect to pre-ECMO management, the use of advancedrespiratory therapies (iNO, HFOV and surfactant) significantlyincreased over the study period. In contrast to the beginning ofthe study period (1993–5), when the use of iNO, HFOV andsurfactant pre-ECMO was minimal, in 2005, iNO use rose to92.2%, HFOV to 60.8% and surfactant to 62.8% (p,0.001).When the potential effects of this were reviewed, it was notedthat the highest pre-ECMO OI decreased over the study period,from a median OI of 57 (49, 86) in 1993 to a median OI of 45(IQR 36, 62) in 2005 (p,0.001). The age when ECMO wasinitiated did not alter over the study period (p = 0.85).
When ECMO practice and outcome were evaluated, it wasnoted that ECMO runs became significantly shorter over thestudy period (p = 0.004) and the use of VV ECMO increasedsignificantly (p,0.001). While VV ECMO was used in only36.7% of patients during the ECMO trial from 1993 to 1995, VVECMO use increased to 74% between 2003 and 2005 (p,0.001).Despite this increase in the use of VV ECMO, the conversionrate from VV to VA ECMO did not change over the studyperiod (p = 0.59). There was a trend towards increasedmortality over the study period (p = 0.06) and notable annualfluctuations: while the survival rate was 82–88% between 1993and 1998, it fell to a minimum of 71.2% in 1999, and thenimproved to 78.8% and 80.4% in 2004 and 2005, respectively.We analysed data from 1999 looking for reasons for the worseoutcome that year and failed to identify any risk factor.
DISCUSSIONAs far as we are aware this is the first detailed review of anational ECMO service. Our data show that outcome for UKpatients considered by diagnosis is overall better than thatreported by the international ELSO Registry apart from sepsis(ELSO 75% vs UK 62.3%) and the ‘‘others’’ group (64% vs24.3%).7 The ELSO Registry reports sepsis and pneumonia(survival 59%) separately, whereas these were combined in ourdataset. The narrow case definition for the ‘‘others’’ group inour cohort meant that this group contained only neonates withirreversible congenital lung dysplasias that have a very pooroutcome.11
Several US studies have reported the widespread use ofadvanced respiratory therapies prior to ECMO initiation and anassociated reduction in neonatal ECMO cases.8–10 Our studyconfirms that these treatments are commonly used in UKECMO candidates, although we have not seen a clear downturnin ECMO cases. There has been concern that the morewidespread use of iNO and HFOV in the UK might lead to adelay in initiation of ECMO support. Given the observedrelationship between older age at ECMO initiation in non-CDHneonates and higher mortality risk, which was also reported byGill et al12 from the US, this would have been an importantdrawback. We were pleased to note that the increased use ofadvanced respiratory therapies prior to ECMO in the UK wasassociated with improved oxygenation (OI), but no trendtowards later initiation of ECMO over time. This is in keepingwith studies in term non-CDH neonates that indicate advancedrespiratory therapies, particularly iNO, are associated with animprovement in OI and a reduction in need for ECMO, but haveno effect on mortality.5 13
Given the significant changes in pre-ECMO managementover the study period, the population treated during the UKECMO trial (1994–5) is likely to have differed to the populationtreated with ECMO in 2005, and this must be considered wheninterpreting our data. For instance, the observed reduction in OIover time could be perceived as a lowering of the threshold forECMO and inclusion of ‘‘less sick patients’’. We consider itmore likely that the reduction in OI reflects the increased use ofiNO and HFOV, and that the babies needing ECMO support inthe current era, were in fact sicker than those needing ECMO 10years ago. Indeed some authors have suggested that theimprovement in oxygenation observed with iNO should beused as a window for safer ECMO cannulation and that
Figure 1 Probability of death plotted against the duration of ECMO runin hours.
Figure 2 Number of ECMO runs by calendar year: 1989–2005.
Original article
Arch Dis Child Fetal Neonatal Ed 2009;94:F129–F132. doi:10.1136/adc.2008.141051 F131
on 5 March 2009 fn.bmj.comDownloaded from

neonates treated with HFOV and iNO should be considered forECMO at a lower OI than those treated conventionally.9 14
A trend towards increased mortality in neonatal ECMO hasbeen observed by ELSO10 and was also suggested by our data. Inthe ELSO registry, this trend in mortality has been attributed toan increasing proportion of CDH babies treated with ECMO,but in the UK this was not the case since the diagnostic case mixwas stable. We therefore speculate that the mortality trend inthe UK is another reflection of the fact that the neonates whorequired ECMO despite the current aggressive pre-ECMOmanagement strategies had a greater severity of illness.
With respect to the support approach, in the UK there hasbeen a switch to VV ECMO in recent years. The proportion ofVV ECMO in the neonatal population differs from theworldwide experience and the US experience reported by theELSO registry, which indicate that VA ECMO still remains thepredominant mode of support.7 15 Although VV ECMO hassome theoretical advantages over VA (such as avoidance ofinstrumentation of a carotid artery) and is associated with animproved survival and reduced neurological morbidity com-pared with VA, the improved survival for VV ECMO is biasedby the selection of less sick neonates for VV compared with VAECMO.16 In the UK, VA ECMO is essentially reserved forinfants who cannot be cannulated for VV ECMO for technicalreasons or who have severe myocardial dysfunction andcardiovascular instability. It is worth noting that the patientswho require VV to VA conversion have the worst outcome of allgroups and it is important to note that the rate of conversionhas not changed over the study period, indicating that selectionof candidates for VV ECMO over VA ECMO in the UK is fairlyrobust.
Our data regarding risk factors for outcome is informative toclinicians considering inclusion – exclusion criteria for neonatalECMO. For example, the higher mortality in CDH neonatesneeding very early ECMO initiation likely reflects deaths inneonates with severe pulmonary hypoplasia and no tolerancefor mechanical ventilation from birth. These data may help thebedside clinician to recognise the CDH neonates with irrever-sible forms of lung hypoplasia and therefore avoid futile ECMOruns. Following the UK ECMO trial, an OI of 40 has been usedas a key threshold for ECMO referral.1 The relationship betweenhigher OI and mortality in non-CDH neonates reinforces thecontinued relevance of this parameter in the current era: in ourstudy every 5-point increase in OI raised the risk of death by 5%.Furthermore, older age at ECMO initiation proved to bestrongly associated with poor outcome in non-CDH patients.Similar findings have been noted in other studies particularly inpatients ventilated for more than a week before ECMO.12 17 18
This underlines the importance of timely ECMO referral in thenon-CDH patients.
The length of ECMO run had important association withoutcome in both CDH and non-CDH patients, showingbimodal distribution. We observed a similar relationshipbetween ECMO run duration and outcome in cardiac ECMOcases, where early deaths were due to severe end organ damageand later deaths were predominantly due to failure to recover.19
In this neonatal cohort, most of the early deaths within 24 h ofECMO initiation were due to withdrawal of ECMO support inpatients in whom severe brain injury became apparent. LongerECMO runs were also associated with lower survival rates, forexample, the estimated survival rate after 2 weeks on ECMOdropped to 57% for non-CDH and 42% for CDH patients. In
our experience the failure to wean from ECMO after severalweeks of support usually signifies irreversible lung pathology.While the benefit of continuing ECMO support has to becarefully judged on individual basis, in those patients who fail tocome off ECMO in an expected time frame every attemptshould be made to reach the correct diagnosis and aggressivelytreat the underlying pathology.
CONCLUSIONThe UK neonatal ECMO service achieves good outcomes whencompared with international results, with the overall survival todischarge rate reaching 80%. Advanced respiratory therapies areused widely in UK ECMO patients. Identification of higher OIand older age at ECMO initiation as two risk factors in the non-CDH patients reinforces the importance of timely referral forECMO.
Competing interests: The authors have no financial relationship or commercialassociation that might pose a conflict of interest in connection with this article.
The study was registered with and granted approval by the Research andDevelopment Office at the Institute of Child Health, London, UK.
REFERENCES1. UK Collaborative ECMO Trail Group. UK collaborative randomised trial of neonatal
extracorporeal membrane oxygenation. Lancet 1996;348:75–82.2. McNally H, Bennett CC, Elbourne D, et al. United Kingdom collaborative randomized
trial of neonatal extracorporeal membrane oxygenation: follow-up to age 7 years.Pediatrics 2006;117:e845–54.
3. Konduri GG, Solimano A, Sokol GM, et al. A randomized trial of early versus standardinhaled nitric oxide therapy in term and near-term newborn infants with hypoxicrespiratory failure. Pediatrics 2004;113(3 Pt 1):559–64.
4. Barefield ES, Karle VA, Phillips JB 3rd, et al. Inhaled nitric oxide in term infants withhypoxemic respiratory failure. J Pediatr 1996;129:279–86.
5. Clark RH, Kueser TJ, Walker MW, et al. Low-dose nitric oxide therapy for persistentpulmonary hypertension of the newborn. Clinical Inhaled Nitric Oxide Research Group.N Engl J Med 2000;342:469–74.
6. Clark RH, Yoder BA, Sell MS. Prospective, randomized comparison of high-frequencyoscillation and conventional ventilation in candidates for extracorporeal membraneoxygenation. J Pediatr 1994;124:447–54.
7. Extracorporeal Life Support Organization. ECMO registry report of theExtracorporeal Life Support Organization, International summary. Ann Arbor, MI, 2006.
8. Hintz SR, Suttner DM, Sheehan AM, et al. Decreased use of neonatal extracorporealmembrane oxygenation (ECMO): how new treatment modalities have affected ECMOutilization. Pediatrics 2000;106:1339–43.
9. Fliman PJ, deRegnier RA, Kinsella JP, et al. Neonatal extracorporeal life support:impact of new therapies on survival. J Pediatr 2006;148:595–9.
10. Roy BJ, Rycus P, Conrad SA, et al. The changing demographics of neonatalextracorporeal membrane oxygenation patients reported to the Extracorporeal LifeSupport Organization (ELSO) Registry. Pediatrics 2000;106:1334–8.
11. Cassidy J, Smith J, Goldman A, et al. The incidence and characteristics of neonatalirreversible lung dysplasia. J Pediatr 2002;141:426–8.
12. Gill BS, Neville HL, Khan AM, et al. Delayed institution of extracorporeal membraneoxygenation is associated with increased mortality rate and prolonged hospital stay.J Pediatr Surg 2002;37:7–10.
13. The Neonatal Inhaled Nitric Oxide Study Group (NINOS). Inhaled nitric oxideand hypoxic respiratory failure in infants with congenital diaphragmatic hernia.Pediatrics 1997;99:838–45.
14. Kossel H, Bauer K, Kewitz G, et al. Do we need new indications for ECMO inneonates pretreated with high-frequency ventilation and/or inhaled nitric oxide?Intensive Care Med 2000;26:1489–95.
15. Extracorporeal Life Support Organization. ECMO registry report of theExtracorporeal Life Support Organization, United States trends. Ann Arbor, MI, 2007.
16. Khambekar K, Nichani S, Luyt DK, et al. Developmental outcome in newborn infantstreated for acute respiratory failure with extracorporeal membrane oxygenation:present experience. Arch Dis Child Fetal Neonatal Ed 2006;91:F21–5.
17. Kugelman A, Gangitano E, Taschuk R, et al. Extracorporeal membrane oxygenation ininfants with meconium aspiration syndrome: a decade of experience with venovenousECMO. J Pediatr Surg 2005;40:1082–9.
18. Lewis DA, Gauger P, Delosh TN, et al. The effect of pre-ECLS ventilation time onsurvival and respiratory morbidity in the neonatal population. J Pediatr Surg1996;31:1110–14; discussion 1114–15.
19. Chaturvedi RR, Macrae D, Brown KL, et al. Cardiac ECMO for biventricular heartsafter paediatric open heart surgery. Heart 2004;90:545–51.
Original article
F132 Arch Dis Child Fetal Neonatal Ed 2009;94:F129–F132. doi:10.1136/adc.2008.141051
on 5 March 2009 fn.bmj.comDownloaded from

doi:10.1136/adc.2008.141374 2009;94;F133-F137 Arch. Dis. Child. Fetal Neonatal Ed.
Greenough T Saiki, H Rao, F Landolfo, A P R Smith, S Hannam, G F Rafferty and A
in prematurely born infants studied post termSleeping position, oxygenation and lung function
http://fn.bmj.com/cgi/content/full/94/2/F133Updated information and services can be found at:
These include:
References
http://fn.bmj.com/cgi/content/full/94/2/F133#BIBL
This article cites 23 articles, 10 of which can be accessed free at:
Rapid responses http://fn.bmj.com/cgi/eletter-submit/94/2/F133
You can respond to this article at:
serviceEmail alerting
the top right corner of the article Receive free email alerts when new articles cite this article - sign up in the box at
Notes
http://journals.bmj.com/cgi/reprintformTo order reprints of this article go to:
http://journals.bmj.com/subscriptions/ go to: Archives of Disease in Childhood - Fetal and Neonatal EditionTo subscribe to
on 5 March 2009 fn.bmj.comDownloaded from

Sleeping position, oxygenation and lung function inprematurely born infants studied post term
T Saiki, H Rao, F Landolfo, A P R Smith, S Hannam, G F Rafferty, A Greenough
MRC-Asthma Centre, Division ofAsthma, Allergy and LungBiology, King’s College London,UK
Correspondence to:Professor A Greenough, RegionalNeonatal Intensive Care Centre,4th Floor Golden Jubilee Wing,King’s College Hospital, DenmarkHill, London SE5 9RS, UK; [email protected]
Accepted 10 August 2008
ABSTRACTObjective: To determine the effect of sleeping positionon the lung function of prematurely born infants whenpost term, whether any effect was similar to that beforedischarge from the neonatal unit, and if it differedaccording to bronchopulmonary (BPD) status.Design: Prospective study.Setting: Tertiary neonatal unit.Patients: Twenty infants, median gestational age 30weeks (range 25–32); 10 had BPD.Interventions: Before neonatal unit discharge (medianage 36 weeks postmenstrual age (PMA)) and when postterm, infants were studied prone and supine, eachposition maintained for 3 h.Main outcome measures: Oxygen saturation wasmonitored continuously and, at the end of each 3 h period,functional residual capacity (FRC) and compliance (CRS) andresistance (RRS) of the respiratory system were measured.Results: At a median of 36 weeks PMA and 6 weeks later(post term), respectively, oxygen saturation (98% vs 96%,p = 0.001; 98% vs 97%, p = 0.011), FRC (26 vs24 ml/kg, p,0.0001; 35 vs 31 ml/kg, p = 0.001) and CRS(3.0 vs 2.4 ml/cm H2O, p = 0.034; 3.7 vs 2.5 ml/cm H2O,p = 0.015) were higher in the prone than the supineposition. In the prone position, both BPD and non-BPDinfants had significantly greater FRCs on both occasions andoxygen saturation at 36 weeks PMA, but oxygen saturationwas significantly better post term only in non-BPD infants.Twelve infants had superior oxygen saturation and 17superior FRCs in the prone compared with the supineposition at both 36 weeks PMA and post term.Conclusions: These results suggest that lung functionimpairment does not explain why prematurely born infantsare at increased risk of sudden infant death syndrome inthe prone compared with the supine position.
The association of prone compared with supinesleeping and a higher rate of sudden infant deathsyndrome (SIDS) is well documented, the oddsratio for prone and side sleeping compared withsupine sleeping for the last sleep being 13.9.1 In theera since the reduce-the-risk campaigns, theadverse effect of the prone sleeping position hasbeen much greater in prematurely born infants, theodds ratio for SIDS being 48.4.1 Yet, we haveshown that, at 36 weeks postmenstrual age(PMA), prematurely born infants have significantlyhigher oxygen saturation and functional residualcapacity (FRC) in the prone compared with thesupine position.2 These results suggest that lungfunction impairment in the prone position maynot contribute to the risk of SIDS. There are,however, no data on the effect of sleeping positionon lung function in prematurely born infants postterm at the high risk age for SIDS,3 to confirm or
refute that hypothesis. As a consequence, an aim ofthis study was to assess the effect of sleepingposition on lung function of very prematurely borninfants when post term. By making paired mea-surements, we also aimed to determine whetherthe influence of positioning on lung function postterm was similar to that before neonatal unitdischarge. In addition, we wished to determine ifthe influence of positioning differed according tobronchopulmonary dysplasia (BPD) status.
PATIENTS AND METHODS
ProtocolInfants born before 33 weeks of gestational agewho were being prepared for discharge home were
What is already known on this topic
c Prematurely born infants, particularly if theysleep prone, have a much higher risk of suddeninfant death syndrome (SIDS) than infants bornat term.
c At 36 weeks postmenstrual age (PMA),prematurely born infants have superior lungfunction (higher oxygen saturation and lungvolume) in the prone compared with the supineposition.
c There are, however, no data on the effect ofposition on either oxygenation or lung volume inprematurely born infants at the high risk age forSIDS (6 weeks post term).
What this study adds
c Oxygenation, lung volume and compliance of therespiratory system have been shown to besignificantly higher both before neonatal unitdischarge (at a median of 36 weeks PMA) and6 weeks later (post term) in prematurely borninfants when nursed prone.
c There were, however, no significant correlationsbetween the changes in functional residualcapacity and changes in oxygen saturationlevels between positions at either age,suggesting that the improvement in oxygenationin the prone position is not due to improved lungvolume; it may be due to enhanced ventilation/perfusion ratios.
c These results suggest that impairment of lungfunction does not explain why prematurely borninfants are at increased risk of SIDS in the pronecompared with the supine position.
Original article
Arch Dis Child Fetal Neonatal Ed 2009;94:F133–F137. doi:10.1136/adc.2008.141374 F133
on 5 March 2009 fn.bmj.comDownloaded from

eligible for entry into the study. Parents were approached andthe study design explained to them once their infant wastolerating three-hourly feeds. If informed, written parentalconsent was obtained, the infant was included in the study. Thestudy was approved by the King’s College Hospital FoundationTrust Research Ethics Committee.
Infants were studied on the neonatal unit and subsequentlyat follow-up 6 weeks later (post term) in an infant sleep andlung function laboratory. They were studied on both occasionsboth supine and prone, each position being maintained for 3 h.None of the infants were sedated. The order in which thepositions were examined was randomised between infants.Oxygen saturation was continuously monitored using a pulseoximeter (Ohmeda Biox 3740; BOC Health Care, Louisville,Colorado, USA) and a reusable infant saturation probe (Flex II).The accuracy of the Ohmeda Biox oximeter was ¡2.1%between oxygen saturation levels of 80% and 89.9% and¡1.5% between 90% and 100%. Saturations were recordedcontinuously over a 3 h period in each position, and meansaturation was obtained using the Alice 4 sleep study system(Alice Recording System, Host version 1.8.52; Respironics,Carlsbad, California, USA). As we wished to compare the effectof posture on oxygen saturation for each 3 h study period, theaveraging time for the pulse oximeter was set to 12 s tominimise the influence of motion artefacts and give a betterpresentation of oxygen saturation across the study period. Theneonatal unit’s policy was to keep the oxygen saturation ofoxygen-dependent infants at a minimum of 92%. To achievethis, the nurses adjusted the amount of supplementary oxygenthat the infant received through their nasal cannulae.
At the end of each 3 h period, lung volume and compliance(CRS) and resistance (RRS) of the respiratory system weremeasured. Lung volume was assessed by measurement of FRCusing a helium gas dilution technique and a specially designedinfant circuit (total volume 95 ml).2 The FRC system (Series7700; Equilibrated Biosystems Inc, Melville, New York, USA)contained a rebreathing bag as the system reservoir. A facemask(Rendell Baker, Laerdal, Norway) was held snugly over theinfant’s nose and mouth; silicone putty was used around themask to achieve a tight seal. The facemask was connected to therebreathing bag via a three-way valve. The FRC systemcontained a helium analyser (Equilibrated Biosystems Inc,Series 7700) with a digital display. During the measurement,if there was no change in the helium concentration over a 15 speriod, equilibration was deemed to have occurred. The initialand equilibration helium concentrations were used inthe calculation of FRC, which was corrected for oxygen
consumption (assumed to be 7 ml/kg/min)4 and for bodytemperature, pressure and water vapour-saturated conditions.FRC was measured twice in each position, and the results of thepaired measurements were meaned and related to body weight.The coefficient of repeatability of FRC in non-ventilated infantsis 3.9 ml/kg.5
CRS and RRS were assessed using a single occlusiontechnique. Air flow was recorded using a pneumotachograph(Mercury F10L; GM Engineering, Kilwinning, UK) inserted intothe facemask and differential pressure transducer (range:¡2 cm H2O, MP45; Validyne Corporation, Northridge,California, USA). Airway pressure was measured from a sideport on the pneumotachograph using a differential pressuretransducer (range: ¡100 cm H2O, MP45; ValidyneCorporation). The signals were amplified (CD280; ValidyneCorporation) and displayed in real time on a computer runningLabview software (version 4.0; National Instruments, Austin,Texas, USA) with 100 Hz analog-to-digital sampling (DAQ16XE-50; National Instruments). Tidal volume was obtained byintegration of the flow signal using the Labview software.Occlusions were performed at end inspiration, which wasidentified from the flow signal. The distal end of thepneumotachograph was briefly occluded, and only breaths witha pressure plateau of at least 100 ms were used in thecalculation of CRS and RRS. The mean CRS and RRS in eachposture were calculated from at least five technically acceptableocclusions, and the results for a particular posture then meaned.The mean intrasubject coefficients of variation of the CRS andRRS measurements were 14% and 19%, respectively.
Statistical analysisDifferences were assessed for statistical significance using thepaired Wilcoxon signed sum rank test or Mann–Whitney U testas appropriate. Spearman’s correlation coefficients were calcu-lated to determine the strength of any relationships betweenany differences in FRC and oxygen saturation results betweenthe supine and prone positions at the two study occasions.
Sample sizePrematurely born, convalescent infants previously cared for onthe neonatal unit had a mean (SD) oxygen saturation of 93.8(3.8)% and a mean (SD) FRC of 27.2 (7.3) ml/kg. Recruitment
Table 1 Lung function according to position in the study population
Prone Supine p Value
Before neonatal unitdischarge
SaO2 (%) 98 (92–100) 96 (92–98) 0.001
FRC (ml/kg) 26 (23–32) 24 (20–27) ,0.0001
CRS (ml/cm H2O) 3.0 (1.1–5.7) 2.4 (1.4–4.7) 0.034
RRS (cm H2O/l/s) 87.2 (13.5–274.2) 73.3 (19.7–237) 0.698
Post term
SaO2 (%) 98 (92–100) 97 (90–99) 0.011
FRC (ml/kg) 35 (28–43) 31 (22–31) 0.001
CRS (ml/cm H2O) 3.7 (1.8–12.1) 2.5 (1.4–12.8) 0.015
RRS (cm H2O/l/s) 71.7 (12.2–152.3) 78.7 (43.2–154) 0.201
Data are median (range).CRS, compliance of the respiratory system; FRC, functional residual capacity; RRS,resistance of the respiratory system; SaO2, oxygen saturation.
Table 2 Oxygen saturation and lung volume according to position andbronchopulmonary dysplasia (BPD) status
Prone Supine p Value
With BPD
SaO2 (%)
Before neonatal unit discharge 94 (92–98) 94 (92–97) 0.032
Post term 98 (92–99) 97 (90–99) 0.281
FRC (ml/kg)
Before neonatal unit discharge 25 (23–32) 23 (20–25) 0.005
Post term 32 (28–43) 30 (22–35) 0.022
Without BPD
SaO2 (%)
Before neonatal unit discharge 99 (94–100) 96 (93–98) 0.007
Post term 99 (97–100) 97 (96–99) 0.009
FRC (ml/kg)
Before neonatal unit discharge 28 (26–32) 25 (22–27) 0.005
Post term 35 (28–38) 32 (27–35) 0.005
Data are median (range).CRS, compliance of the respiratory system; FRC, functional residual capacity; RRS,resistance of the respiratory system; SaO2, oxygen saturation.
Original article
F134 Arch Dis Child Fetal Neonatal Ed 2009;94:F133–F137. doi:10.1136/adc.2008.141374
on 5 March 2009 fn.bmj.comDownloaded from

of 20 patients allowed, with at least 80% power at the 5% level,detection of differences between positions equivalent to at leastone standard deviation of the measurements.
PatientsTwenty infants, median gestational age 28.5 weeks (range 25–32) and birth weight 1090 g (range 740–2030), were examined.All had had respiratory distress syndrome and, at initialexamination, had a median PMA of 36 weeks (range 35–40).Ten had BPD, being oxygen-dependent beyond 28 days6; theywere all oxygen-dependent at 36 weeks PMA, but not whenstudied post term. The infants with BPD were of lower birthweight than the non-BPD infants (median 909 g (range 740–1590) vs 1285 g (range 744–1992); p = 0.031) and were born atan earlier gestational age (27 weeks (range 25–30) vs 30 weeks(range 26–32); p = 0.003). The neonatal unit’s policy was toincrease the intervals between feeds more slowly in oxygen-dependent infants, and hence the infants with BPD achievedthree-hourly feeds later and were studied at an older PMA thanthe non-BPD infants (median 37 weeks (range 36–40) vs median36 weeks (range 35–37); p = 0.002). There was no significantdifference between the PMAs at the follow-up (post-term)measurements of the non-BPD and BPD infants: median43 weeks (range 40–52) for infants with BPD vs 43 weeks(range 42–49) for non-BPD infants (p = 0.677). The infants withBPD were ventilated for longer (median 9.5 days (range 0–40) vs0.5 days (range 0–7); p = 0.027), were supported for longer withcontinuous positive airway pressure (median 21.5 days (range9–55) vs 1 day (range 0–43); p = 0.007), and received supple-mentary oxygen for longer (median 77 days (range 45–131) vs4.5 days (range 0–62); p,0.001) than those who did not developBPD. None of the infants were receiving any medication oneither study occasion or were oxygen-dependent when exam-ined post term. There was no significant difference in thehaemoglobin concentrations between infants with and withoutBPD at the time of the first examination (median 11.3 g/dl(range 8.7–12.5) vs 10.45 g/dl (range 8.3–12.1); p = 0.449).
RESULTSAt a median of 36 weeks PMA and 6 weeks later (post term),respectively, overall the median oxygen saturation (p = 0.001,p = 0.011), FRC (p,0.0001, p = 0.001) and CRS (p = 0.034,p = 0.015) were higher in the prone than the supine position.There were no significant effects of positioning on RRS at eitherage (table 1). Differences in FRC with respect to position werestatistically significant at both ages in both sets of infants (withand without BPD) (table 2). The differences in oxygensaturation according to position were significantly differentbefore neonatal unit discharge in both groups. Post term,however, the difference in oxygen saturation according toposition was only statistically significant in the non-BPD group
(table 2). Seventeen infants had higher oxygen saturations andall 20 had higher FRCs in the prone compared with the supineposition at 36 weeks PMA, compared with 14 infants havinghigher oxygen saturations and 19 superior FRCs at 6 weeks postterm (table 3). Differences between the proportion of infantswho had higher oxygenation (p = 0.257) or FRC (p = 0.317) at36 weeks PMA or post term did not reach statistical signifi-cance. Twelve infants had higher oxygen saturations and 17infants superior FRCs in the prone compared with the supineposition at both 36 weeks PMA and 6 weeks post term. Therewere, however, no significant correlations between the differ-ences in the FRC and oxygen saturation levels between thesupine and prone positions at a median of 36 weeks PMA(r = 0.393, p = 0.086) or at post term (r = 0.092, p = 0.7).
DISCUSSIONWe have shown that, post term, oxygenation, lung volume andcompliance of the respiratory system were significantly greaterin the prone compared with the supine position in most of theprematurely born infants examined. In contrast, in healthy termborn neonates studied in the first 72 h after birth, lung volumeswere similar in the prone and supine positions,7 and, amonginfants studied at a median age of 2.4 months, no significanteffect of positioning on oxygenation saturation was noted.8 Thelatter study population, however, included infants born at termas well as those born prematurely, and, although the infantswere all at increased risk of SIDS (previously experienced anacute life-threatening event, inability to fall asleep in theirnormal position, very premature birth, upper airway obstruc-tion, or had a sibling who had died from SIDS), none hadrespiratory distress.8 In another study,9 no significant effect ofpositioning on transcutaneous oxygen levels was noted overallin infants born at term and studied at 2–11 months of age, butthere was a small advantage to using the prone position in thosewith a lower respiratory tract infection. None of the infantscurrently studied were oxygen-dependent when examined postterm, but all had had respiratory distress syndrome and half thepopulation had had BPD. Thus, a possible explanation for thedifferences in position-related effects on oxygen saturationbetween studies7–9 is the presence or absence of previous orcurrent lung disease. The impact of positioning on both lungvolume and oxygenation has rarely been examined. In one studyof ventilated infants and children, no significant effects wereseen except for improvements in oxygenation in the infantswith obstructive disease.10 The patient population,10 however,was older (age range 3–7.6 years) than the infants currentlystudied, and all of them were receiving neuromuscular blockingagents.
In addition to lung volume and oxygenation, CRS and RRSwere also measured, as we wished to assess postural-relatedeffects on lung function in prematurely born infants as fully aspossible. We saw significant changes in CRS, but not RRS, andat both ages. The likely explanation for the higher compliancevalues in the prone compared with the supine position is thehigher lung volume in the prone position. The lack of significantdifference in the resistance results may reflect that thismeasurement is less reproducible than the measurement ofCRS, but our sample size was sufficient to detect a 20%difference in RRS results. In addition, whereas RRS tended to behigher (non-significant) in the prone position before neonatalunit discharge, the reverse was found post term.
We did not measure the sleep states of the infants. Oxygenationis relatively stable during active and quiet sleep, but indeterminatesleep is associated with hypoxaemic episodes.11 The percentage of
Table 3 Effect of positioning on oxygen saturation andfunctional residual capacity (FRC)
Before neonatalunit discharge Post term
Oxygen saturation 17 (8) 14 (6)
FRC 20 (10) 19 (9)
Oxygen saturation and FRC 17 (8) 13 (5)
Data are the number of infants with BPD showing higher oxygensaturation and/or FRC levels in the prone position. The numbers ofinfants with BPD showing higher oxygen saturation and/or FRC inthe prone position are shown in parentheses.
Original article
Arch Dis Child Fetal Neonatal Ed 2009;94:F133–F137. doi:10.1136/adc.2008.141374 F135
on 5 March 2009 fn.bmj.comDownloaded from

time spent in indeterminate sleep, however, becomes less withincreasing maturity and occupies a relatively small amount ofsleeping time at 36 weeks PMA and post term.11 We havepreviously shown that indeterminate sleep is significantly morecommon in the supine than the prone position, but, even in thesupine position, indeterminate sleep made up only 3.7% ofsleeping time.12 In this study, we examined each infant for 3 h inboth the supine and prone position on each study occasion, andthus it seems unlikely that the occurrence of indeterminate sleephad an important influence on our results.
Our finding that oxygenation and FRC were greater in theprone than in the supine position both post term and at36 weeks PMA suggests that the higher lung volumes wereresponsible for the superior oxygenation in the prone position.Yet, there were no significant correlations between the changesin FRC and oxygen saturation between positions either postterm or at a median of 36 weeks PMA. It is possible that ourinability to find significant correlations reflects the number ofinfants studied, but Numa et al10 also reported a lack ofcorrelation between changes in FRC and oxygen saturationrelated to position in ventilated infants and children receivingneuromuscular blocking drugs. An alternative explanation forthe improvement in oxygenation in the prone position is betterventilation perfusion matching. Decreased intrapulmonaryshunting in the prone position has been shown in animalmodels,13 and a more uniform distribution of blood is expectedas gravitational forces oppose rather than augment differencesin pulmonary vascular resistance.10 Redistribution of ventila-tion, however, is the principal mechanism of improvedventilation perfusion matching in an oleic acid injury lungmodel.13 In addition, in infants of 32–36 weeks PMA, improve-ment in oxygen saturation in the prone compared with thesupine position was associated with less chest wall distortion,and hence the authors concluded that the improvement inoxygenation was due to enhanced ventilation/perfusion ratios.14
Chest wall and abdominal movements were measured bymercury strain gauges taped over the upper rib cage andabdomen.14 A limitation of the present study was that we didnot use such a system and thus are unable to comment onwhether the improvement in oxygenation demonstrated wasassociated with a reduction in chest wall distortion in the proneposition.
None of the infants when studied post term remainedoxygen-dependent. Yet, the effect of positioning post termdiffered according to BPD status—that is, significantly higheroxygen saturation levels occurred in the prone position in theno-BPD group only. This appears to contrast with our earlierfindings,15 16 in which we showed superior oxygenation in theprone position only in oxygen-dependent infants. In one of thestudies,15 the infants were only placed in each position for 1 h;hence, we recommended that infants should be monitored for alonger time period to be certain that longer periods of supinesleeping were not associated with loss of lung volume andhypoxaemia.17 In the second study,12 as in the present, infantswere examined in each position for 3 h; although effects wereonly statistically significant in one of the two groups, therewere trends in both. We therefore suggest that a diagnosis ofBPD is not an accurate predictor of the response of lung volumeand oxygen saturation to positioning. We also wished todetermine whether the influence of positioning on lungfunction post term was similar to that at 36 weeks PMA. Weshow that most very prematurely born infants have superiorlung function post term as well as at 36 weeks PMA in theprone position. How long this influence of positioning on lung
function of prematurely born infants persists merits investiga-tion. Our results are clinically important, as they emphasise topractitioners that prematurely born infants, when studied postterm, may have superior oxygenation in the prone position.Infants with acute respiratory insufficiency who can be care-fully monitored in the hospital environment may benefit fromprone positioning.
In conclusion, we have shown that lung function andoxygenation are superior in the prone compared with thesupine position post term in the majority of prematurely borninfants. These results suggest that impairment of lung functiondoes not explain why prematurely born infants are at increasedrisk of SIDS in the prone position. An alternative explanationfor the vulnerability of infants in the prone position isabnormalities of serotonergic transmission and autonomicdysfunction.18–23 The serotonergic (5 hydroxytryptamine, 5-HT) neurons in the medulla oblongata project extensively toautonomic and respiratory nuclei in the brainstem and help toregulate homoeostatic function.21 Altered 5-HT receptor bindingdensity in components of the medullary 5-HT system has beenfound in SIDS cases in two independent datasets.19 20
Polysomnographic sleep recordings of 18 future SIDS infantsshowed differences in their sympathovagal balance comparedwith controls.18 In addition, infants with apparent life-threatening events and obstructive sleep apnoeas have beenshown to have a reduced heart rate response to 45u head-uptilts,22 and decreased heart rate variability has been demon-strated in the prone position.23
Funding: TS is, and HR was, supported by the Foundation for the Study of InfantDeaths.
Competing interests: None.
Ethics approval: Obtained.
REFERENCES1. Oyen N, Makestad T, Skjaerven R, et al. Combined effects of sleeping position and
prenatal risk factors in sudden death syndrome: the Nordic Epidemiological SIDSStudy. Pediatrics 2007;100:613–19.
2. Bhat RY, Leipala JA, Singh NR, et al. Effect of posture on oxygenation, lung volumeand respiratory mechanics in premature infants studied before discharge. Pediatrics2003;112:29–32.
3. Malloy MH, Hoffman JH. Prematurity, sudden infant death syndrome and age ofdeath. Pediatrics 1995;95:464–71.
4. Hey EN. The relationship between environmental temperature and oxygenconsumption in the newborn baby. J Physiol 1969;200:589–603.
5. Dimitriou G, Greenough A, Laubscher B. Lung volume measurements immediatelyafter extubation by prediction of ‘‘extubation failure’’ in premature infants. PediatrPulmonol 1996;21:250–4.
6. Jobe AH, Bancalari E. Bronchopulmonary dysplasia. Am J Respir Crit Care Med2001;163:1723–9.
7. Aiton NR, Fox GF, Alexander J, et al. The influence of sleeping position on functionalresidual capacity and effective pulmonary blood flow in healthy neonates. PediatrPulmonol 1996;22:342–7.
8. Poets CF, Rudolph A, Neuberk Buch U, et al. Arterial oxygen saturation in infants atrisk of sudden infant death syndrome: influence of sleeping position. Acta Paediatr1995;84:379–82.
9. Levene S, McKenzie SA. Transcutaneous oxygen saturation in sleeping infants:prone and supine. Arch Dis Child 1990;65:524–6.
10. Numa AH, Hammer J, Newth CJL. Effect of prone and supine positions on functionalresidual capacity, oxygenation and respiratory mechanics in ventilated infants andchildren. Am J Respir Crit Care Med 1997;156:1185–9.
11. Lehtonen L, Martin RJ. Ontogeny of sleep and awake states in relation to breathingin preterm infants. Semin Neonatol 2004;3:229–38.
12. Bhat RJ, Hannam S, Pressler R, et al. Effect of prone and supine position on sleep,apneas and arousal in preterm infants. Pediatrics 2006;118:101–7.
13. Lamm WJE, Graham MM, Albert RK. Mechanisms by which the prone positionimproves oxygenation in acute lung injury. Am J Respir Crit Care Med 1994;150:184–93.
14. Martin RJ, Herrell N, Rubin D, et al. Effect of supine and prone positions onantenatal oxygen tension in the preterm infant. Pediatrics 1979;63:528–31.
15. Kassim Z, Donaldson N, Khetriwal B, et al. Sleeping position, oxygen saturation and lungvolume in convalescent, prematurely born infants. Arch Dis Child 2006;92:347–50.
Original article
F136 Arch Dis Child Fetal Neonatal Ed 2009;94:F133–F137. doi:10.1136/adc.2008.141374
on 5 March 2009 fn.bmj.comDownloaded from

16. Bhat RY, Leipala JA, Rafferty GF, et al. Survey of sleeping position recommendationsfor prematurely born infants on neonatal intensive care unit discharge. Eur J Pediatr2003;162:426–7.
17. Albert RK, Leasa D, Sanderson M, et al. The prone position improves arterialoxygenation and reduces shunt in oleic-acid-induced acute lung injury. Am Rev RespirDis 1987;135:628–33.
18. Franco P, Szliwowski H, Dramaix M, et al. Decreased autonomic responses to obstructivesleep events in future victims of sudden infant death syndrome. Pediatr Res 1999;46:33–9.
19. Kinney HC, Randall LL, Sleeper LA, et al. Serotonergic brainstem abnormalities inNorthern Plains Indians with the sudden infant death syndrome. J Neuropathol ExpNeurol 2003;62:1178–91.
20. Panigrahy A, Filiano J, Sleeper LA, et al. Decreased serotonergic receptor binding inrhombic lip-derived regions of the meduall oblongata in the sudden infant deathsyndrome. J Neuropathol Exp Neurol 2000;59:377–84.
21. Paterson DS, Trachtenberg FL, Thompson EG, et al. Multiple serotonergicbrainstem abnormalities in sudden infant death syndrome. JAMA2006;296:2124–32.
22. Harrington C, Kirjavainen T, Teng A, et al. Altered autonomic function and reducedarousability in apparent life-threatening event infants with obstructive sleep apnea.Am J Respir Crit Care Med 2002;165:1048–54.
23. Galland BC, Reeves G, Taylor BJ, et al. Sleep position, autonomic function andarousal. Arch Dis Child Fetal Neonatal Ed 1998;78:189–94.
Depressed skull fracture in a newbornbaby
A term baby was delivered by emergency caesarean section forfailure to progress with an unstable lie. Forceps or vacuumextractor was not used. She was born in good conditionrequiring no resuscitation. Initial examination revealed a largedepression over the right parietal bone measuring ,6 cm indiameter and 2 cm in depth (fig 1). A subsequent skullradiograph revealed a depressed skull fracture involving theright parietal bone (fig 2). Neurological examination wasnormal. Neurosurgical elevation of the fracture was performed2 weeks after birth with good postoperative recovery and noresidual neurological deficit.
The incidence of bone injuries during delivery has beendescribed as ,1 in 1000 live births. Of these, clavicular fracturesrepresent half of all cases, with depressed skull fracturesaccounting for ,11%.1 Intrauterine or obstetric depressed skullfractures diagnosed at birth may be ‘‘spontaneous’’ or ‘‘instru-ment associated’’. They have also been described as ‘‘neonatalskull depressions’’ or ‘‘ping pong’’ fractures and are due toinward buckling of the calvarial bones without an associatedcortical break.2 In babies with no abnormal neurological signs,expectant treatment has been associated with spontaneousresolution.3 Fracture reduction by neurosurgical elevationshould be considered when the depth is more than 2 cm.4
Reduction by vacuum extraction (obstetric vacuum or breast
milk extractor) has also been described.5 Persistent disabilitiesare rare, and fractures following instrumental deliveries aremore likely to be associated with intracranial lesions such assubdural haematomas.2
S T Dharmaraj,1 N D Embleton,1 A Jenkins,2 G Jones3
1 Royal Victoria Infirmary, Newcastle upon Tyne, UK; 2 Department of Neurosurgery,Newcastle General Hospital, Newcastle upon Tyne, UK; 3 Department of Paediatrics,Cumberland Infirmary, Carlisle, Cumbria, UK
Correspondence to: Dr S T Dharmaraj, Royal Victoria Infirmary, Queen Victoria Road,Newcastle upon Tyne NE1 4LP, UK; [email protected]
Competing interests: None.
Patient consent: Parental consent obtained.
Arch Dis Child Fetal Neonatal Ed 2009;94:F137. doi:10.1136/adc.2008.148718
REFERENCES1. Bhat BV, Kumar A, Oumachigui A. Bone injuries during delivery. Indian J Pediatr
1994;61:401–5.2. Dupuis O, Silveira R, Dupont C, et al. Comparison of ‘‘instrument-associated’’ and
‘‘spontaneous’’ obstetric depressed skull fractures in a cohort of 68 neonates.Am J Obstet Gynecol 2005;192:165–70.
3. Loeser JD, Kilburn HL, Jolley T. Management of depressed skull fracture in thenewborn. J Neurosurg 1976;44:62–4.
4. Hung KL, Liao HT, Huang JS. Rational management of simple depressed skullfractures in infants. J Neurosurg 2005;103:69–72.
5. Saunders BS, Lazoritz S, McArtor RD, et al. Depressed skull fracture in the neonate.Report of three cases. J Neurosurg 1979;50:512–14.
Figure 1 Clinical photograph showing a right parietal neonatal skulldepression.
Figure 2 Anteroposterior skull radiograph showing the right parietaldepressed skull fracture.
Images in neonatal medicine
Original article
Arch Dis Child Fetal Neonatal Ed March 2009 Vol 94 No 2 F137
on 5 March 2009 fn.bmj.comDownloaded from

doi:10.1136/adc.2008.148718 2009;94;F137 Arch. Dis. Child. Fetal Neonatal Ed.
S T Dharmaraj, N D Embleton, A Jenkins and G Jones
Depressed skull fracture in a newborn baby
http://fn.bmj.com/cgi/content/full/94/2/F137Updated information and services can be found at:
These include:
Rapid responses http://fn.bmj.com/cgi/eletter-submit/94/2/F137
You can respond to this article at:
serviceEmail alerting
the top right corner of the article Receive free email alerts when new articles cite this article - sign up in the box at
Notes
http://journals.bmj.com/cgi/reprintformTo order reprints of this article go to:
http://journals.bmj.com/subscriptions/ go to: Archives of Disease in Childhood - Fetal and Neonatal EditionTo subscribe to
on 5 March 2009 fn.bmj.comDownloaded from

16. Bhat RY, Leipala JA, Rafferty GF, et al. Survey of sleeping position recommendationsfor prematurely born infants on neonatal intensive care unit discharge. Eur J Pediatr2003;162:426–7.
17. Albert RK, Leasa D, Sanderson M, et al. The prone position improves arterialoxygenation and reduces shunt in oleic-acid-induced acute lung injury. Am Rev RespirDis 1987;135:628–33.
18. Franco P, Szliwowski H, Dramaix M, et al. Decreased autonomic responses to obstructivesleep events in future victims of sudden infant death syndrome. Pediatr Res 1999;46:33–9.
19. Kinney HC, Randall LL, Sleeper LA, et al. Serotonergic brainstem abnormalities inNorthern Plains Indians with the sudden infant death syndrome. J Neuropathol ExpNeurol 2003;62:1178–91.
20. Panigrahy A, Filiano J, Sleeper LA, et al. Decreased serotonergic receptor binding inrhombic lip-derived regions of the meduall oblongata in the sudden infant deathsyndrome. J Neuropathol Exp Neurol 2000;59:377–84.
21. Paterson DS, Trachtenberg FL, Thompson EG, et al. Multiple serotonergicbrainstem abnormalities in sudden infant death syndrome. JAMA2006;296:2124–32.
22. Harrington C, Kirjavainen T, Teng A, et al. Altered autonomic function and reducedarousability in apparent life-threatening event infants with obstructive sleep apnea.Am J Respir Crit Care Med 2002;165:1048–54.
23. Galland BC, Reeves G, Taylor BJ, et al. Sleep position, autonomic function andarousal. Arch Dis Child Fetal Neonatal Ed 1998;78:189–94.
Depressed skull fracture in a newbornbaby
A term baby was delivered by emergency caesarean section forfailure to progress with an unstable lie. Forceps or vacuumextractor was not used. She was born in good conditionrequiring no resuscitation. Initial examination revealed a largedepression over the right parietal bone measuring ,6 cm indiameter and 2 cm in depth (fig 1). A subsequent skullradiograph revealed a depressed skull fracture involving theright parietal bone (fig 2). Neurological examination wasnormal. Neurosurgical elevation of the fracture was performed2 weeks after birth with good postoperative recovery and noresidual neurological deficit.
The incidence of bone injuries during delivery has beendescribed as ,1 in 1000 live births. Of these, clavicular fracturesrepresent half of all cases, with depressed skull fracturesaccounting for ,11%.1 Intrauterine or obstetric depressed skullfractures diagnosed at birth may be ‘‘spontaneous’’ or ‘‘instru-ment associated’’. They have also been described as ‘‘neonatalskull depressions’’ or ‘‘ping pong’’ fractures and are due toinward buckling of the calvarial bones without an associatedcortical break.2 In babies with no abnormal neurological signs,expectant treatment has been associated with spontaneousresolution.3 Fracture reduction by neurosurgical elevationshould be considered when the depth is more than 2 cm.4
Reduction by vacuum extraction (obstetric vacuum or breast
milk extractor) has also been described.5 Persistent disabilitiesare rare, and fractures following instrumental deliveries aremore likely to be associated with intracranial lesions such assubdural haematomas.2
S T Dharmaraj,1 N D Embleton,1 A Jenkins,2 G Jones3
1 Royal Victoria Infirmary, Newcastle upon Tyne, UK; 2 Department of Neurosurgery,Newcastle General Hospital, Newcastle upon Tyne, UK; 3 Department of Paediatrics,Cumberland Infirmary, Carlisle, Cumbria, UK
Correspondence to: Dr S T Dharmaraj, Royal Victoria Infirmary, Queen Victoria Road,Newcastle upon Tyne NE1 4LP, UK; [email protected]
Competing interests: None.
Patient consent: Parental consent obtained.
Arch Dis Child Fetal Neonatal Ed 2009;94:F137. doi:10.1136/adc.2008.148718
REFERENCES1. Bhat BV, Kumar A, Oumachigui A. Bone injuries during delivery. Indian J Pediatr
1994;61:401–5.2. Dupuis O, Silveira R, Dupont C, et al. Comparison of ‘‘instrument-associated’’ and
‘‘spontaneous’’ obstetric depressed skull fractures in a cohort of 68 neonates.Am J Obstet Gynecol 2005;192:165–70.
3. Loeser JD, Kilburn HL, Jolley T. Management of depressed skull fracture in thenewborn. J Neurosurg 1976;44:62–4.
4. Hung KL, Liao HT, Huang JS. Rational management of simple depressed skullfractures in infants. J Neurosurg 2005;103:69–72.
5. Saunders BS, Lazoritz S, McArtor RD, et al. Depressed skull fracture in the neonate.Report of three cases. J Neurosurg 1979;50:512–14.
Figure 1 Clinical photograph showing a right parietal neonatal skulldepression.
Figure 2 Anteroposterior skull radiograph showing the right parietaldepressed skull fracture.
Images in neonatal medicine
Original article
Arch Dis Child Fetal Neonatal Ed March 2009 Vol 94 No 2 F137
on 5 March 2009 fn.bmj.comDownloaded from

doi:10.1136/adc.2007.136853 online 6 Aug 2008;
2009;94;F138-F139; originally publishedArch. Dis. Child. Fetal Neonatal Ed. D Smurthwaite, N B Wright, S Russell, A J Emmerson and M Z Mughal
birth weight preterm infants?How common are rib fractures in extremely low
http://fn.bmj.com/cgi/content/full/94/2/F138Updated information and services can be found at:
These include:
References
http://fn.bmj.com/cgi/content/full/94/2/F138#BIBL
This article cites 5 articles, 3 of which can be accessed free at:
Rapid responses http://fn.bmj.com/cgi/eletter-submit/94/2/F138
You can respond to this article at:
serviceEmail alerting
the top right corner of the article Receive free email alerts when new articles cite this article - sign up in the box at
Notes
http://journals.bmj.com/cgi/reprintformTo order reprints of this article go to:
http://journals.bmj.com/subscriptions/ go to: Archives of Disease in Childhood - Fetal and Neonatal EditionTo subscribe to
on 5 March 2009 fn.bmj.comDownloaded from

How common are rib fractures in extremely low birthweight preterm infants?
D Smurthwaite,1 N B Wright,2 S Russell,3 A J Emmerson,4 M Z Mughal1
1 Paediatric Medicine, St. Mary’sHospital for Women andChildren, Manchester, UK;2 Paediatric Radiology, RoyalManchester Children’s Hospital,Manchester, UK; 3 Perinatal &Paediatric Radiology, St. Mary’sHospital for Women andChildren, Manchester, UK;4 Neonatal Medicine, St. Mary’sHospital for Women andChildren, Manchester, UK
Correspondence to:Zulf Mughal, ConsultantPaediatrician & Honorary SeniorLecturer in Child Health,Department of Paediatrics, SaintMary’s Hospital for Women &Children, Hathersage Road,Manchester, M13 0JH UK; [email protected]
Accepted 11 July 2008Accept for Online First6 August 2008
ABSTRACTBackground: This study was prompted by incidentalfinding of healing rib fractures on chest radiographs of ex-preterm born infants, who were admitted to hospital withacute respiratory illnesses within a few weeks ofdischarge from the neonatal intensive care unit (NICU).Rib fractures in infants, particularly those situatedposteriorly, are considered to be specific for non-accidental injury (NAI).Methods: Retrospective examination of radiographs ofextremely low birth weight (ELBW) infants ((1000 g)with a gestation range of 22 of 33 weeks, cared for at atertiary NICU, between 1998 and 2002, and who hadsurvived >4 weeks.Results: Five out of 72 (7%) infants studied hadradiologically apparent rib fractures. None involved posteriorrib shafts. All infants with rib fractures died on the NICU.Conclusions: The possibility of NAI should be consideredin ex-ELBW infants found to have rib fractures.
Rib fractures in young infants, particularly thosesituated posteriorly, are considered to be specificfor non-accidental skeletal injury.1 Fractures at thissite are thought to occur due to the posterior shaftsof ribs levering over the transverse processes ofvertebrae, when the chest of a young infant ismanually squeezed.2 This study was prompted byour experience of the incidental finding of healingrib fractures on chest radiographs of ex-very lowbirth weight infants (VLBW; (1500 g) or extre-mely low birth weight infants (ELBW; (1000 g),who were admitted to hospital with acute respira-tory illnesses within a few weeks of discharge fromthe neonatal intensive care unit (NICU). Thisraised the question as to whether rib fractures inthese infants arose as a result of non-accidentalinjury (NAI), other trauma (for example cardio-pulmonary resuscitation (CPR)), or due to meta-bolic bone disease of prematurity (MBDP). MBDPis a condition of VLBW and ELBW infants,characterised by diminished bone strength, due tothe inadequate post-natal provision of bone miner-als and/or increased bone resorption. Rib fractureshave been described in VLBW infants with MBDP.The incidence of radiologically apparent rib frac-tures among VLBW infants receiving neonatal carein the mid- to late 1980s ranged from 2.1% to over30%.3 4 The aim of this retrospective study was toestablish the incidence and sites of radiologicallyapparent rib fractures in ELBW infants, receivingcontemporary neonatal care.
SUBJECTS AND METHODSChest radiographs of all ELBW infants cared for onour tertiary NICU between January 1998 and
December 2002 were examined for number andsites of rib fractures. During this 5-year period,1284 ELBW infants of 22 to 33 weeks’ gestationwere admitted to the NICU. Inclusion criteria forthe study were ELBW who:(a) were born at our Regional Perinatal centre or
transferred to the NICU within 2 weeks of life
(b) had survived for >4 weeks after birth
(c) were discharged home from NICU or died onthe NICU
(d) had a complete set of radiographs availablefor review
One hundred and six ELBW infants fulfilledcriteria (a) to (c), however, some of these infantsnever had chest radiographs taken and in othersradiographs taken could not be found. Chestradiographs of 72 ELBW infants who fulfilled theinclusion criteria were examined by a consultantpaediatric radiologist (NBW). Any ELBW infantfound to have rib fractures, and randomly selectedradiographs of infants without fractures (in total20% of all infants studied), had their radiographsreviewed by a consultant perinatal & paediatricradiologist (SR). The following clinical informationrelevant to causation of MBDP was extracted fromthe neonatal medical and nursing case records byone investigator (DS): gestation, birth weight,number of days of total parenteral nutrition(TPN), number of days of treatment with dexa-methasone (Dx), whether or not the infantsdeveloped chronic lung disease of prematurity(CLD; defined as the need for supplemental oxygen.30% at 28 days of age), number of doses offrusemide administered and the highest serumalkaline phosphatise activity. Information on
What is already known on this topic
1. Factures of ribs can occur in very low birthweight infants with metabolic bone disease ofprematurity.
2. In young infants, posterior rib fractures areconsidered to be specific of non-accidental injury.
What this study adds
1. Radiologically apparent rib fractures werepresent in 7% of extremely low birth weightpreterm infants who had survived >4 weeks.
2. No infant had posterior rib fractures and allinfants with rib fractures died on the neonatalintensive care unit.
Original article
F138 Arch Dis Child Fetal Neonatal Ed 2009;94:F138–F139. doi:10.1136/adc.2007.136853
on 5 March 2009 fn.bmj.comDownloaded from

number of episodes of CPR and their timing in relation toradiological appearance of rib fractures was collected. Similarinformation about insertion of chest drains to drain pneu-mothoraces and any episodes of cardiothoracic surgery was alsocollected.
Statistical analysis was performed using the SPSS (Version13) for Windows. The Mann–Whitney U test was used tocompare factors that are relevant to causation of MBDP inELBW infants with and without radiologically apparent ribfractures.
RESULTSOne thousand, seven hundred and sixty-two chest radiographsfrom 72 ELBW infants who met the inclusion criteria wereexamined. Their gestation ranged from 22 to 33 weeks and birthweight ranged from 450 to 990 g. Both the radiologists agreedthat five ELBW infants (7%) had rib fractures. According toNBW, 2 infants had single and 3 had multiple rib fractures,while according to SR, 3 had single and 2 had multiple fractures.The disagreement in one subject was caused by abnormalanterior rib ends, which were judged to be healing anterior ribfractures by NBW, while in SR’s opinion the abnormalappearance of the anterior rib ends was thought to be due toartefact (the tangential direction of the x ray beam in relation tothe rib ends, thereby producing the appearance of metaphysealfraying). All fractures were of anterior or lateral rib shafts; noinfant had a posterior rib fracture. Skeletons of all ELBW infantswith rib fractures and 60 out of 67 (89%) without rib fractureswere also judged to be osteopaenic by both the radiologists.Three of the five ELBW infants with rib fractures had receivedCPR, however, there was no temporal relationship betweenCPR events and appearance of rib fractures on radiographs.Likewise, there was no temporal relationship between insertionof chest drains and appearance of rib fractures on radiographs.All the ELBW infants with rib fractures died of complicationsassociated with prematurity prior to discharge from the NICU.
As shown in table 1, only the number of days of treatmentwith frusemide was different between those ELBW infants withand without rib fractures. The median peak serum alkalinephosphatase activity, number of days of total parenteralnutrition and number of days of treatment with Dx approachedstatistical significance.
DISCUSSIONRib fractures in young infants are generally considered to bespecific of non-accidental skeletal injury.1 In an abused childthey are frequently multiple (although they can be single),bilateral and most often sited posteriorly, near the costotrans-verse process articulation. Injuries at this site occur due toposterior shafts of ribs levering over the transverse processes of
vertebrae, when the chest of a young infant is squeezed. Theamount of force required to break ribs is considerable; theyoccur only rarely in other circumstances such as chestcompressions during CPR or in children who have sufferedsevere blunt chest trauma in a road traffic accident.5 Althoughmuch less common, pathological rib fractures can also occursecondary to conditions that result in bone fragility, such assevere forms of osteogenesis imperfecta and MBDP.3 4 6
Results of this study suggest that radiologically apparent ribfractures are rare in ELBW preterm infants receiving contempor-ary neonatal care. Furthermore, all the infants with rib fracturesin this study died before discharge from the NICU. None of thefractures found involved the posterior shafts of ribs, which areconsidered to be specific of NAI. We found that infants with ribfractures had received significantly higher doses of frusemide. Thismight be due to frusemide contributing to MBDP through causingloss of minerals from the skeleton. On the other hand, the numberof doses of frusemide might simply reflect the overall diseaseseverity in ELBW infants with rib fractures.
This study has a number of limitations. As this was aretrospective study, information about factors relevant tocausation of rib fractures, such as CPR, were obtained fromperusal of clinical notes. It was not documented in the casenotes whether the CPR was administered by compression of thesternum with the infant lying on his/her back, or using thehand-encircling technique.7 Acute rib fractures may not bedetectable on initial chest radiographs but become apparentlater due to callus formation. Consequently, rib fractures mayhave been missed in healthy infants in whom there were noclinical indications for performing delayed chest radiographs.Many of the ELBW infants in the non-rib fracture groupsurvived and so it is likely that towards the end of their stay onthe NICU they were well and would therefore not requirefurther chest radiographs to be taken. Thus it is entirely possiblethat a surviving ELBW infant might suffer a rib fracture ondischarge from the NICU. This question can only be answeredby a prospective study in which all ELBW infants underwentchest radiographs prior to, and at regular intervals afterdischarge from NICU.
In spite of these limitations, we recommend that when anELBW preterm infant, after discharge from the NICU is foundto have rib fractures, the possibility of NAI needs to beconsidered, irrespective of the neonatal history. This isparticularly the case when the rib fractures are sited posteriorly.
Acknowledgements: We thank Dr Alan Sprigg and Dr Stephen Chapman for theirvery helpful comments on the manuscript.
Competing interests: None declared.
Ethics approval: The study was approved by the Central Manchester Local ResearchEthics Committee [Ref. No. 03/CM/343].
REFERENCES1. Shouldice M, Huyer D. Non-accidental rib fractures. In: David TJ, ed. Recent
advances in paediatrics 18. Edinburgh: Churchill Livingston, 2000: 63–76.2. Kleinman PK, Marks SC Jr, Richmond JM, et al. Inflicted skeletal injury: a post-
mortem radiological-histopathologic study in 31 infants. AJR 1995;165:647–50.3. Amir J, Katz K, Grunebaum M, et al. Fractures in premature infants. J Paediatr Orthop
1988;8:41–4.4. Koo WK, Sherman R, Succop P, et al. Fractures and rickets in very low birth weight
infants: conservative management and outcome. J Pediatr Orthop 1989;9:326–30.5. Worlock P, Stower M, Barbor P. Patterns of fractures in accidental and non-
accidental injury in children: a comparative study. Br Med J 1986;293:100–2.6. Bishop N, Sprigg A, Dalton A. Unexplained fractures in infancy: looking for fragile
bones. Arch Dis Child 2007:92:189–282.7. Mackway-Jones K, Molynenx E, Philips B, et al, eds. Advanced paediatric life
support: the practical approach: In: Advanced life support group. Manchester, UK:Blackwell BMJ Books, 2005.
Table 1 Variables relevant to causation of metabolic bone disease ofprematurity in infants with and without rib fractures
Variable p Value
Birth weight p = 0.52
Gestation p = 0.22
Number of days of treatment with dexamethasone p = 0.07
Number of doses of administered frusemide p = 0.03
Highest serum alkaline phosphatase activity p = 0.08
Whether or not the infant developed chronic lung disease (need forsupplemental oxygen .30% at 28 days of age)
p = 0.36
Number of days of total parenteral nutrition p = 0.08
Original article
Arch Dis Child Fetal Neonatal Ed 2009;94:F138–F139. doi:10.1136/adc.2007.136853 F139
on 5 March 2009 fn.bmj.comDownloaded from

doi:10.1136/adc.2008.143016 online 6 Oct 2008;
2009;94;F140-F143; originally publishedArch. Dis. Child. Fetal Neonatal Ed. B Ray and M P Ward Platt
weeks’ gestation: a population-based studyMortality of twin and singleton livebirths under 30
http://fn.bmj.com/cgi/content/full/94/2/F140Updated information and services can be found at:
These include:
References
http://fn.bmj.com/cgi/content/full/94/2/F140#BIBL
This article cites 15 articles, 2 of which can be accessed free at:
Rapid responses http://fn.bmj.com/cgi/eletter-submit/94/2/F140
You can respond to this article at:
serviceEmail alerting
the top right corner of the article Receive free email alerts when new articles cite this article - sign up in the box at
Notes
http://journals.bmj.com/cgi/reprintformTo order reprints of this article go to:
http://journals.bmj.com/subscriptions/ go to: Archives of Disease in Childhood - Fetal and Neonatal EditionTo subscribe to
on 5 March 2009 fn.bmj.comDownloaded from

Mortality of twin and singleton livebirths under30 weeks’ gestation: a population-based study
B Ray,1 M P Ward Platt2
1 Royal Victoria Infirmary,Newcastle upon Tyne, UK;2 Newcastle University,Newcastle upon Tyne, UK
Correspondence to:M P Ward Platt, NewcastleUniversity, Newcastle uponTyne, UK; [email protected]
Accepted 22 August 2008Published Online First6 October 2008
ABSTRACTObjective: To determine the mortality rates of liveborntwins compared with singletons of less than 30 weeks’gestation in relation to gestational age, mode of deliveryand year of birth in a geographically defined population.Study design: Comparison of early neonatal, lateneonatal and infant death rates in 479 twin babies and1538 singletons, liveborn between 23 and 29 completedweeks of gestation in the north of England over twoepochs, 1998–2001 and 2002–5.Results: Twins and singletons had similar mortality ratesexcept at the extreme of gestation (23–25 weeks) wheretwins had higher infant mortality (OR 2.04, 95% CI 1.37 to3.02). This higher rate was attributable to early and lateneonatal deaths (OR 1.86, 95% CI 1.28 to 2.72, and 2.11,95% CI 1.13–3.94, respectively). When analysed in twoepochs, the excess mortality was confined to babies bornin 1998–2001. There was no effect of gender orchorionicity.Conclusions: The excess mortality among twins of lessthan 30 weeks’ gestation was confined to neonataldeaths in babies of 25 weeks or less, and to the earlierepoch (1998–2001). In the modern era, there appears tobe no excess mortality in neonates less than 30 weeks’gestation when compared with singletons.
The UK Birth Statistics in 2004 showed that thelikelihood of women having multiple births washigher at every age in 2004 than 10 years’previously, and data from our own region are inline with this continuing trend.1 Women aged 40and over experienced the highest multiple mater-nity rate (21.6/1000 all maternities).2 It is knownthat multiple pregnancies are associated with ahigher risk of perinatal death than singletons,which may be the result of many factors,3–5 butmany of the excess deaths are ultimately due toprematurity.6 7
Some of the existing studies of twinning inrelation to gestational age-specific mortality showthat extremely premature twins do not suffer moredeaths than singletons,8–10 but others have shownan increased mortality compared with single-tons.11 12 Furthermore, birth weight does notnecessarily account for any twin disadvantage invery preterm babies. Garite et al13 demonstratedthat statistically significant differences betweenmean weights of twins compared with singletonsoccur only from 32 weeks although Alexander etal14 suggested the difference may start at 28 weeksof gestation.
Most of the deaths in preterm babies now occurat gestational ages of 29 weeks or less, with verylow mortality from 30 weeks onwards.13 We there-fore focused this study on the mortality outcome
in liveborn twins and singletons born at less than30 completed weeks in a defined geographical area.We wished to ascertain any associations related tomode of delivery, gender and chorionicity. We alsoinvestigated any changes in gestation-specificmortality over the time course of the study(1998–2005).
METHODSTo ascertain the twins we used the MultiplePregnancy Register.1 To ascertain all deaths weused data from the Perinatal Morbidity andMortality Survey.15 The registers have beenapproved by ethics committees and have clearancefrom the Patient Information Advisory Group(PIAG) to hold named patient information withoutindividual consent under section 60 of the Healthand Social Care Act (2001).
Denominator data on numbers of singletonlivebirths were obtained from the Regional data-base of neonatal admissions for intensive care heldat the neonatal unit of Royal Victoria Infirmary,Newcastle upon Tyne. This database collects auditdata for all admissions for neonatal intensive carein the four regional neonatal intensive care units.We also enlisted the help of the special care units inthe other peripheral hospitals in the region toascertain the existence of any babies under30 weeks who were not transferred to one of the
What is already known on this topic
c There is contradictory evidence about thedifferential mortality of very preterm twins andsingletons.
c Monochorionic twins are thought to be atincreased risk of neonatal death compared todichorionic twins.
What this study adds
c The excess mortality among twins of less than30 weeks’ gestation was confined to neonataldeaths among babies of 25 weeks’ or lessgestation.
c The excess mortality among twins of less than25 weeks’ gestation was confined to the epoch1998–2001.
c Chorionicity has no effect on mortality amongliveborn very preterm twins.
Original article
F140 Arch Dis Child Fetal Neonatal Ed 2009;94:F140–F143. doi:10.1136/adc.2008.143016
on 5 March 2009 fn.bmj.comDownloaded from

four intensive care units and who would not have been capturedby the routine audit database; however, no patient identifiabledata were used nor did we access any health records.
The geographical area is that of North Cumbria,Northumberland, Tyne and Wear, Durham, Darlington andTeesside. We used data from January 1998 to December 2005and excluded all babies with significant congenital anomalies bycross-checking with the Northern Congenital AbnormalitySurvey (NORCAS) and using the definitions of the EuropeanSurveillance of Congenital Anomalies (EUROCAT) centralregistry (see http://www.eurocat.ulster.ac.uk/pdf/EUROCAT-Guide-1.3.pdf). We also excluded babies born in this region butresident outside it. Twinning was determined according to theorder of delivery. We categorised the timing of death using thestandard epidemiological definitions of early, late and post-neonatal death.
For analytical purposes, the babies were grouped by gesta-tional age bands 23–25, 26–27, and 28–29 weeks. Data are
presented as absolute numbers and rates per 1000 livebirths orper 1000 survivors where appropriate. Differences in outcomewere calculated using the Fisher exact test and are presented asodds ratio and confidence intervals. SPSS V.13.0 and Epi-infostatistical software were used to analyse the data.
RESULTSIn the 8-year period from January 1998 to December 2005, 2207babies were born alive at between 23 weeks and 29 weeks ofgestation in the region; 34 higher order multiple births wereexcluded from the study. In the remaining 2173 liveborn babies,1674 were singletons and 499 were twins. A total of 156 babies(singletons = 136, twin I = 7 and twin II = 13) were excludedfor congenital anomalies. This left a total of 479 twins (twin I= 245 and twin II = 234) who were compared with 1538singletons (fig 1).
The characteristics of the study population are presented intable 1. The median gestations, birth weights, gestationdistribution, gender ratio and rate of caesarean section deliveryare comparable between the groups. There was a malepreponderance of 56% in twins and 54% in singletons.
After subdividing into the gestation bands 23–25, 26–27, and28–29 weeks, the mortality outcome was computed for 0–7 days, 7–28 days, and 29–365 days (table 2). Twins had anoverall higher mortality rate compared with singletons only inthe 23–25 weeks band (OR 2.04), with the statisticallysignificant excess mortality confined to the early and lateneonatal periods.
Table 3 shows the effect on mortality rates by mode ofdelivery for twins and singletons. Only among the 23–25 weeksbabies was there any relationship with mode of delivery, babies
Figure 1 Distribution of cases.
Table 1 Demographic comparison between two groups
Twins Singletons
28–29 weeks (n (%)) 208 (43) 665 (43)
26–27 weeks (n (%)) 119 (25) 475 (31)
23–25 weeks (n (%)) 152 (32) 398 (26)
Total (n (%)) 479 (100) 1538 (100)
Gestational age (median) 27 27
Birth weight (median (range)) 980 (300–2290) 990 (183–2025)
Male gender (%) 56 54
Deliver by caesarean section(%)
41 41
Table 2 Early, late and post-neonatal deaths by gestational age
Gestation(weeks)
Early neonatal death Late neonatal death Post-neonatal death Total infant deaths in 1 year
Twin Singleton Twin Singleton Twin Singleton Twin Singleton
n (MR) n (MR)OR(95% CI) n (MR) n (MR)
OR(95% CI) n (MR) n (MR)
OR(95% CI) n (MR) n (MR)
OR95% CI)
28–29 7 (33) 33 (49) 0.67(0.29 to 1.50)
7 (34) 14 (22) 1.59(0.65 to 3.80)
1 (5) 13 (21) 0.24(0.04 to 1.45)
15 (72) 60 (90) 0.78(0.43 to 1.40)
26–27 17 (143) 64 (134) 1.06(0.60 to 1.89)
2 (20) 20 (49) 0.39(0.10 to 1.53)
2 (20) 19 (49) 0.40(0.10 to 1.57)
21 (176) 103 (216) 0.77(0.46 to 1.29)
23–25 79 (520) 146 (367) 1.86(1.28 to 2.72)
19 (260) 36 (143) 2.11(1.13 to 3.94)
6 (111) 23 (106) 1.05(0.40 to 2.60)
104 (684) 205 (515) 2.04(1.37 to 3.02)
n (MR), number (mortality rate expressed per 1000 livebirths in cases of total infant death and early neonatal death, and per 1000 survivors in cases of late neonatal death and post-neonatal death).
Original article
Arch Dis Child Fetal Neonatal Ed 2009;94:F140–F143. doi:10.1136/adc.2008.143016 F141
on 5 March 2009 fn.bmj.comDownloaded from

born vaginally having a mortality odds ratio of 4.06 (CI 2.46 to6.70) relative to caesarean section.
We did not find any effect of gender either for all gestations oramong babies of 23–25 weeks. There was no effect ofchorionicity. Figure 2 illustrates the gestational age-specificmortality for twins and singletons from 1998 to 2001 and 2002to 2005. There is noticeable improvement in both the twins andsingleton mortality outcome between the two epochs, withconvergence of outcomes at a gestation of 27 weeks.
DISCUSSIONWe have demonstrated that any disadvantage to being a twin,in this population of very premature babies, is confined to theextreme of viability and to the epoch of 1998 to 2001, ratherthan in more recent years. Indeed, inspection of fig 2 suggeststhat in the earlier epoch, the disadvantage to being a twinpersisted up to 26 weeks of gestation, and the impression givenby table 2, that the higher mortality is confined to 23–25 weeks,is an artefact of the pre-study choice of gestational age bands forthe analysis. The figure also suggests that any disadvantagefrom being a twin has now disappeared.
While it is true that in general twins have more congenitalanomaly than singletons, our data showed an opposite trend.This might have been because we have focused on a highlyselected set of births, those occurring very preterm. We are notaware of any other data in this highly selected group to suggestwhether the ratio of congenital anomaly in twins/singletons issimilar to or different from that when all babies are considered.Alternatively, perhaps the twins with congenital anomalies hadmore antenatal or early pregnancy loss, or that the reasons whysingletons and twins go into preterm labour may themselves bedifferent, which may also help to account for the unexpectedlydifferent rates of malformation in the two groups.Monochorionic twins are known to be at higher risk duringthe pregnancy, and it has been suggested (from unit-based data)that they suffer more postnatal deaths9 compared with
dichorionic twins, but our observations, confined to liveborntwins, have failed to confirm this.
The strength of our study is that it presents population-baseddata in a society where high-quality medical facilities are readilyaccessible to all. The neonatal service of the whole region isprovided by a single neonatal network, which assures a degreeof uniformity of management. The use of data from reliableregional databases, together with cross-checking at the level ofindividual units, means that we can be confident about thequality of the data.
Our study has a number of limitations. We may have misseda very small number of babies born outside the region tomothers resident in the region who received all their neonatalcare outside the region, which may affect our denominatornumbers. Although when considering the whole group wecompared 479 twins with 1538 singletons over an 8-year period,the numbers are quite small when they are subdivided intogroups. Hence some of our results need cautious interpretation.Also some data were missing such as birth weight (singletons4%), mode of delivery (singleton 16% and twins 7%) andchorionicity (17%). Furthermore our data do not allow us tocorrect for other confounders, but in any case this does notmatter for those more mature babies in whom being a twin orsingleton had no impact on mortality. It is only of importancewhen trying to explain the difference between twins andsingletons in the least mature babies, where there are too fewsubjects to allow for a meaningful multivariable analysis even ifwe had access to the relevant obstetric data.
We would be particularly cautious about reading too muchinto the findings for mode of delivery. In the first place thenumbers are small, and in the second, the decision-making forchoosing a particular mode of delivery is complex, so the factorsgiving rise to the apparent association probably have more to dowith the reasons for choosing the mode of delivery than thedelivery itself.
Our data are compatible with both the view that twins are ata disadvantage and the view that they are not. It all dependswhich period of time is chosen for study. However, we do notfeel that we can confirm the notion that twins actually dobetter than singletons.13 16 17 An analysis of birth registry data inSweden11 in 1992 showed similar findings to ours, although thismust be interpreted with caution because we defined our cohortin terms of gestational age, not birth weight. On the other hand,studies by Shinwell et al18 and Donovan et al19 using babies,1500 g showed no significant difference in the mortalityoutcome between singletons and twins. However, analysing ourown data by birth weight, with a cut-off at 700 g, gave a similarresult for the infant mortality rate among twins to that ofgestation (OR 2.39, 95% CI 1.47 to 3.86).
Finally, it is encouraging to note that the number of deaths inextreme preterm gestation appears to have fallen in twins as wellas singletons, and that the apparent disadvantage of very pretermtwins was greatly reduced in the more recent epoch (2002–5).
Table 3 Mortality by mode of delivery
Gestation inweeks
Vaginal delivery Caesarean section
Twinsn (MR)
Singletonsn (MR) OR (95% CI)
Twinsn (MR)
Singletonsn (MR) OR (95% CI)
28–29 7 (78) 25 (90) 0.86 (0.37 to 2.01) 8 (78) 18 (68) 1.16 (0.49 to 2.69)
26–27 12 (187) 41 (189) 0.99 (0.49 to 2.00) 9 (191) 35 (203) 0.93 (0.42 to 2.06)
23–25 78 (736) 96 (407) 4.06 (2.46 to 6.70) 14 (467) 38 (500) 0.87 (0.38 to 2.02)
n (MR), number (mortality rate expressed per 1000 livebirths).OR calculated using total infant deaths in each subgroup of gestation.
Figure 2 Mortality comparison of singletons and twins in two epochs(1998–2001 and 2002–5).
Original article
F142 Arch Dis Child Fetal Neonatal Ed 2009;94:F140–F143. doi:10.1136/adc.2008.143016
on 5 March 2009 fn.bmj.comDownloaded from

Acknowledgements: The authors are grateful for the assistance provided by MBythell and M Renwick at the Regional Maternity Survey Office.
Funding: Funding for the Northern Congenital Abnomality Survey is provided by theDepartment of Health.
Competing interests: None.
Ethics approval: The registers used in this study have been approved by ethicscommittees.
Patient consent: We used the Multiple Pregnancy Register and data from thePerinatal Morbidity and Mortality Survey. The registers have clearance from the PatientInformation Advisory Group (PIAG) to hold named patient information without individualconsent under section 60 of the Health and Social Care Act (2001).
REFERENCES1. Ward Platt MP, Glinianaia S, Rankin J, et al. The Multiple Pregnancy Register in the
North of England: an update and five-year results. Twin Res Hum Genet 2006;9:913–18.2. Office for National Statistics. Birth Statistics 2004 Series FM1 no.33. http://www.
statistics.gov.uk/statbase/Product.asp?vlnk = 5768 (accessed 7 Nov 2008).3. Powers WF, Kiley JL. The risks confronting twins: a national perspective. Am J
Obstet Gynecol 170:456–61.4. Sontag J, Waltz S, Schollmeyer T, et al. Morbidity and mortality of discordant twins
up to 34 weeks of gestational age. Eur J Pediatr 1996;155:224–9.5. Victoria A, Mora G, Arias F. Perinatal outcome, placental pathology and severity of
discordance in monochorionic and dichorionic twins. Obstet Gyenecol 2001;97:310–15.6. Sassoon DA, Castro LC, Davis JL, et al. Perinatal outcome in triplet versus twin
gestations. Obstet Gynecol 1990;75:817–20.7. Weissman A, Yoffe N, Jakobi P, et al. Management of triplet pregnancies in
1980s—are we doing better? Am J Perinatal 1991;8:333–7.
8. Wolf EJ, Vintzileos AM, Rosenkrantz TS, et al. A comparison of pre-dischargesurvival and morbidity in singletons and twin very-low-birth-weight infants. ObstetGynecol 1992;80:436–9.
9. Asztalos EV, Barret JF, Lacy M, et al. Evaluating 2-year outcome in twins(30 weeks gestation at birth: a regional perinatal unit’s experience. Twin Res2001;4:431–8.
10. Buekens P, Wilcox A. Why do small twins have a lower mortality rate than smallsingletons? Am J Obstetr Gynecol 1993;168:937–41.
11. Ericson A, Gunnarskog J, Kallen B, et al. A registry study of very low birth weight liveborn infants in Sweden, 1973–1988. Acta Obstet Gynaecol Scand 1992;71:104–11.
12. Synnes AR, Ling EW, Whitfield MF, et al. Perinatal outcomes of a large cohort ofextremely low gestational age infants (twenty-three to twenty-eight completedweeks of gestation). J Pediatr 1994;125(6 Pt 1):952–60.
13. Garite TJ, Clark RH, Elliott JP, et al. The Pediatrix/Obstetrix Perinatal ResearchGroup. Twins and triplets: the effect of plurality and growth on neonatal outcomecompared with singleton infants. Am J Obstet Gynecol 2004;191:700–7.
14. Alexander GR, Kogan M, Martin J, et al. What are the fetal growth patterns ofsingletons, twins and triplets in the United States? Clin Obstet Gynecol 1998;41:115–25.
15. North East Public Health Observatory. Perinatal mortality and morbidity survey.http://www.nepho.org.uk (accessed 7 Nov 2008).
16. Northern Regional Health Authority Coordinating Group. Perinatal mortality: acontinuing collaborative regional survey. BMJ 1984;288:1717–20.
17. Northern Regional Maternity Survey Office. Annual report, 2000. Newcastleupon Tyne, 2002.
18. Shinwell ES, Blickstein I, Lusky A, et al. Excess risk of mortality in very lowbirthweight triplets: a national, population based study. Arch Dis Child Fetal NeonatalEd 2003;88:F36–40.
19. Donovan EF, Ehrenkrantz RA, Shankaran S, et al. Outcomes of very low birth weighttwins cared for in the National Institute of Child Health and Human DevelopmentNeonatal Research Network’s intensive care units. Am J Obstet Gynecol1998;179:742–9.
Take advantage of BMJ Journals’ remarkable catalogue of titles with Related Collections
No busy professional has time to browse through all pertinent journals to find relevant articles, but withRelated Collections you no longer have to. Follow the ‘‘Related Collections’’ link from any article and usethe ‘‘Show Collections from other Journals’’ to expand your search across all BMJ Journals. Or simplyfollow the ‘‘Browse by topic’’ link on the home page. By setting up your own collections and receivingemail alerts every time an article is added to your chosen area, you can build up your own significantbody of knowledge.
Original article
Arch Dis Child Fetal Neonatal Ed 2009;94:F140–F143. doi:10.1136/adc.2008.143016 F143
on 5 March 2009 fn.bmj.comDownloaded from

doi:10.1136/adc.2008.139865 online 19 Sep 2008;
2009;94;F144-F148; originally publishedArch. Dis. Child. Fetal Neonatal Ed. (Asia-Pacific Neonatal Infections Study) F Lee, C B Chow, A Shenoi, R Halliday, D Isaacs and on behalf of APNIS R Tiskumara, S H Fakharee, C Q Liu, P Nuntnarumit, K M Lui, M Hammoud, J K
Neonatal infections in Asia
http://fn.bmj.com/cgi/content/full/94/2/F144Updated information and services can be found at:
These include:
References
http://fn.bmj.com/cgi/content/full/94/2/F144#BIBL
This article cites 14 articles, 2 of which can be accessed free at:
Rapid responses http://fn.bmj.com/cgi/eletter-submit/94/2/F144
You can respond to this article at:
serviceEmail alerting
the top right corner of the article Receive free email alerts when new articles cite this article - sign up in the box at
Notes
http://journals.bmj.com/cgi/reprintformTo order reprints of this article go to:
http://journals.bmj.com/subscriptions/ go to: Archives of Disease in Childhood - Fetal and Neonatal EditionTo subscribe to
on 5 March 2009 fn.bmj.comDownloaded from

Neonatal infections in Asia
R Tiskumara,1 S H Fakharee,2 C Q Liu,3 P Nuntnarumit,4 K M Lui,5 M Hammoud,6
J K F Lee,7 C B Chow,8 A Shenoi,9 R Halliday,1 D Isaacs,1,10 on behalf of APNIS (Asia-Pacific Neonatal Infections Study)
1 Children’s Hospital atWestmead, Westmead, NSW,Australia; 2 Mofid Children’sHospital, Teheran, Iran;3 Children’s Hospital of HebeiProvince, China; 4 RamathibodiHospital, Bangkok, Thailand;5 Centro Hospitalar Conde SaoJanuario, Macau SAR, China;6 Ab Sarah Maternity Hospital,Kuwait; 7 Kuala TerengganuHospital, Terengganu, Malaysia;8 Princess Margaret HospitalHKSAR, Hong Kong; 9 ManipalHospital, Bangalore, India;10 University of Sydney, Sydney,NSW, Australia
Correspondence to:Dr D Isaacs, Department ofInfectious Diseases, Children’sHospital at Westmead, LockedBag 4001, Westmead, NSW2145, Australia; [email protected]
Accepted 11 August 2008Published Online First19 September 2008
ABSTRACTObjective: To study the epidemiology (including inci-dence, antibiotic sensitivity and mortality) of neonatal unitinfections in countries in Asia.Methods: One year prospective study of neonatalinfections in eight neonatal units in Asia.Results: There were 453 episodes of sepsis affecting394 babies. Mortality from neonatal sepsis was 10.4%,with an incidence of 0.69 deaths/1000 live births. Group Bstreptococcus was the most common early-onsetorganism causing 38% of episodes of early-onset (,48 hold) sepsis, with a rate of 0.51 episodes per 1000 livebirths and a mortality of 22%. Gram-negative bacillaryearly-onset sepsis occurred at a rate of 0.15 episodes per1000 live births with a mortality of 12%. There were 406episodes of late-onset sepsis. The incidence was high at11.6 per 1000 live births, and mortality was 8.9%.Coagulase-negative staphylococcus caused 34.1% ofepisodes, whereas Staphlococcus aureus caused only5.4%. Gram-negative bacilli caused 189 episodes (46.6%).Only 44% of Gram-negative bacilli were sensitive to bothgentamicin and a third-generation cephalosporin, whereas30% were resistant to both antibiotics. Meningitisoccurred in 17.2% of episodes of late sepsis, with amortality of 20%.Conclusions: The incidence of late-onset sepsis washigher in Asia than in resource-rich countries, but theorganisms isolated and mortality were similar. Over half ofall Gram-negative bacilli were antibiotic resistant.
Neonatal infections are an important cause ofmortality and morbidity world wide. In their2000–2003 report, the World Health Organizationestimated that neonatal sepsis and pneumonia areresponsible for about 1.6 million deaths each year,mainly in resource-poor countries.1 Antibioticresistance is an important problem in resource-poor countries,2–5 and a survey of neonatologists inAsian countries suggested that there is a significantproblem with sepsis caused by multi-resistantGram-negative organisms and meticillin-resistantStaphylococcus aureus (MRSA).6 Previous studieshave reported rates of hospital-acquired neonatalinfections that are 3–20 times higher in resource-poor than resource-rich countries.3 The mostcommon reported organisms are Gram-negativebacilli and S aureus.3 Antibiotic resistance rates arehigh: in South-East Asia up to 86% of Klebsiellaspecies are resistant to cefotaxime and gentamicin,56% of Escherichia coli are resistant to gentamicin,and 28% of S aureus are resistant to meticillin.3
In this study, we look at the microorganisms(bacteria and fungi), the incidence and the mortal-ity of early-onset and late-onset neonatal sepsis in
mainly resource-poor countries in Asia, and atantibiotic-sensitivity patterns.
MATERIALS AND METHODSNeonatologists in Asia identified from a databaseof neonatologists working in level 3 neonatal units(defined as those that can manage babies withartificial ventilation) were invited to participate inthe study. Questionnaires were sent to thoseneonatologists who agreed.
Neonatal sepsis was defined as the pure growthof a single potentially pathogenic organism (bac-terium or fungus) from the blood of a baby whowas clinically septic according to defined criteria6 7
and had supportive laboratory evidence of sepsis(eg, one or more of low or high white cell count orabnormal immature: total (I:T) ratio, low platelets,or raised serum C-reactive protein, as definedpreviously).6 Laboratory variables were age-depen-dent. We did not further define clinical sepsis. Wedid not request two positive blood cultures becauseantibiotics are usually started empirically in Asiaafter only one set of blood cultures had been taken.Likely contaminants were excluded. The decisionas to whether a baby had true sepsis or if thecultured organism was a contaminant was madeby the local clinician, according to clinical judge-ment but using the above criteria. Early-onsetsepsis was defined as the onset of sepsis within48 h of delivery, and late-onset sepsis as the onsetof sepsis more than 48 h after delivery. Outcomewas defined as: died from sepsis, died possibly fromsepsis, died from unrelated cause, or survived.
What is already known on this topic
c Hospital-acquired infections with multi-resistantorganisms are common in resource-poor Asiancountries.
c Early-onset infections in Asia are caused bymultiple different pathogens.
What this study adds
c Although the rate of hospital-acquired infectionwith multi-resistant Gram-negative organisms inAsia was high, the organisms isolated andmortality were similar to those in developedcountries.
c Group B streptococcus was the most commoncause of early-onset sepsis.
Original article
F144 Arch Dis Child Fetal Neonatal Ed 2009;94:F144–F148. doi:10.1136/adc.2008.139865
on 5 March 2009 fn.bmj.comDownloaded from

Reported cases were excluded if they did not meet the definedcriteria for sepsis or if the data were inconsistent and could notbe verified. We relied on clinicians to report all cases of babieswith positive blood cultures and clinical sepsis, and we did notsearch microbiology records for unreported episodes of neonatalsepticaemia.
All babies with sepsis meeting our criteria on neonatal unitsin the study were included, regardless of their postnatal age.The babies were de-identified and recorded by their initials only.The following data on babies with neonatal sepsis werecollected: gestational age, birth weight, gender, and details ofwhether the baby was born in the hospital or outside thehospital and then transferred to the nursery. Denominator datawere collected on the number of babies managed at each site,categorised by birth weight. The age in days when the positiveblood culture was obtained was also recorded.
The organisms isolated on blood culture and their antibioticsensitivities were recorded. Local laboratories used recognisedmethods of antibiotic susceptibility testing, but these were notstandardised. For Gram-negative bacilli, data were only soughton sensitivity to third-generation cephalosporins (cefotaxime orceftazidime for Pseudomonas) and to gentamicin. The organismswere recorded as sensitive to both cephalosporin and gentami-cin, sensitive to cephalosporin and resistant to gentamicin,resistant to cephalosporin and sensitive to gentamicin, orresistant to both cephalosporin and gentamicin. For S aureus,data were requested on sensitivity to meticillin.
For each episode of sepsis, it was recorded whether or not alumbar puncture had been performed. The results of thecerebrospinal fluid (CSF) culture were recorded as well as thepresence of CSF leucocytosis (defined6 as a CSF white blood cellcount .100/ml). Meningitis was defined as the presence of anorganism cultured from CSF or the presence of CSF leucocytosisin the presence of a positive blood culture. Co-existingconditions associated with infection, such as pneumonia ornecrotising enterocolitis, were also recorded.
The data were recorded on standard proformas by localclinicians, and these were either posted or e-mailed back. Thedata were then collated into a dedicated database created for thepurpose. Mortality per 1000 live births was calculated usingonly data from neonatal units attached to maternity hospitals.Statistical calculations were performed using SPSS V15.
This study was approved by the ethics committee of theRoyal Alexandra Hospital for Children. Local sites were asked ifthey required local ethics approval and all felt that the RoyalAlexandra Hospital for Children ethics approval was sufficient.
RESULTSSeventeen level 3 neonatal units were approached. Data werereceived from eight units (47%), two from China and one eachfrom Hong Kong, India, Iran, Kuwait, Malaysia and Thailand.We present the prospective data from 1 January through 31December 2005. Five of the neonatal units were attached tomaternity units, and we were able to obtain the number of liveborn infants in the maternity unit over the year. The otherthree neonatal units only accepted babies born elsewhere. Theneonatal units had similar case mixes; all were able to ventilatepreterm babies and all cared for babies who underwentabdominal surgery.
There were 453 episodes of sepsis documented in the study,affecting 394 babies. The overall rate of a baby developing eitherearly or late sepsis in our study, calculated from neonatal unitsattached to maternity hospitals, varied from 3.0 per 1000 livebirths in Hong Kong to 15.0 per 1000 live births in Kuwait.
Forty-one babies had two episodes of infection, six had threeepisodes of infection, and one had five episodes of infection.There were 41 deaths reported as a direct result of sepsis, givinga mortality of 10.4%. If mortality in only the maternityhospitals was analysed, the overall mortality as a direct result ofsepsis can be expressed as 0.69 deaths/1000 live births. If weinclude deaths probably occurring as a result of sepsis in theanalysis, the overall mortality increases to 1 death/1000 livebirths.
The most common associated conditions or infections weremeningitis (76 episodes), pneumonia (49 episodes), necrotisingenterocolitis (38 episodes) and skin sepsis (12 episodes). Thirty-four of the 38 bacteraemic episodes of necrotising enterocolitis(89%) were associated with episodes of late infection, and 44 ofthe 49 episodes of pneumonia (90%) occurred in associationwith episodes of late infection. In 248 episodes of infection, noco-existing condition was recorded.
Early-onset sepsisEarly-onset infections, defined as infection with onset within2 days of birth (47 episodes in total), caused 10.4% of allinfections reported. The rate of early-onset sepsis from anyorganism was 0.72 infections/1000 live births. Six out of 47babies with early-onset sepsis died, a mortality of 13%. Twobabies with early-onset sepsis went on to have late-onset sepsis(one baby had one episode of late-onset sepsis, and one babyhad two episodes of late-onset sepsis).
Table 1 shows the organisms that caused early-onset sepsis.Group B streptococcus (GBS) was the most common organism,causing 18 out of 47 episodes of early-onset sepsis (38%). Therewere eight episodes of early GBS sepsis reported from Kuwait,five from Malaysia, four from Hong Kong, and one from China.Seventeen episodes of early-onset GBS infection occurred ininborn babies in maternity hospitals, giving an incidence of 0.51per 1000 live births for early-onset GBS. Four of the 18 babieswith early-onset GBS died, a mortality of 22%. This was higherthan the mortality from Gram-negative infection in early-onsetsepsis (2 of 16, 12.5%) and the total overall mortality in earlysepsis (12.8%), but the differences did not reach statisticalsignificance.
There were 17 early-onset episodes of Gram-negative bacillaryinfection. The most common Gram-negative bacillus in thisgroup was E coli (five episodes). The incidence of Gram-negativebacillary early-onset sepsis was 0.15 episodes per 1000 livebirths, and mortality was 12% (two deaths from 17 infections).
Sensitivities were reported for 16 episodes of early-onsetGram-negative bacillary sepsis. Seven organisms (44%) wereresistant to either a third-generation cephalosporin or gentami-cin, six organisms (37%) were resistant to both, and threeorganisms (19%) were sensitive to both antibiotics.
There were 30 episodes of early-onset sepsis in which Gram-positive organisms were isolated. Eighteen of these episodes
Table 1 Organisms causing early-onset sepsis
Organism n (%)
Group B streptococcus 18 (38)
Coagulase-negative staphylococcus 8 (17)
Escherichia coli 6 (13)
Staphylococcus aureus 2 (4)
Other Gram-negative bacilli 11 (23)
Other Gram-positive cocci 2 (4)
Total 47 (100)
Original article
Arch Dis Child Fetal Neonatal Ed 2009;94:F144–F148. doi:10.1136/adc.2008.139865 F145
on 5 March 2009 fn.bmj.comDownloaded from

(60%) were due to GBS. Eight episodes were reported to be dueto coagulase-negative staphylococcus (CONS), but we wereunable to exclude that they may have been contaminants. Oneof the two S aureus isolated in early sepsis was meticillinresistant.
Six episodes of early sepsis (12.8%) were associated withmeningitis (see below and table 5).
Late-onset sepsisThere were 406 episodes of late-onset sepsis, affecting 347babies. Gram-negative bacilli caused 189 (46.6%) of the episodes.Table 2 shows the organisms causing late-onset sepsis. Themost common Gram-negative bacillus was Klebsiella pneumoniae(69 episodes), followed by Enterobacter species (29) and E coli(26).
Sensitivities were recorded for 180 of the 189 Gram-negativebacilli (95.2%): 44% were sensitive to both gentamicin and to athird-generation cephalosporin, 27% were resistant to eithergentamicin (6%) or a third-generation cephalosporin (21%), and30% were resistant to both (table 3). Resistance was mostcommon in Bangalore, India, where 21 (75%) of 28 Gram-negative bacilli were resistant to both third-generation cepha-losporins and gentamicin, and only three (11%) were sensitiveto both.
There were 187 episodes of late-onset Gram-positive sepsis.CONS was the single most common isolate, causing 136episodes of Gram-positive sepsis (33.5% of all late sepsisepisodes). The next most common Gram-positive organismwas S aureus, accounting for 22 late-onset infections (5.4%).
Two of the 12 S aureus infections (17%) for which sensitivitieswere reported were meticillin resistant.
Regarding the 406 episodes of late-onset sepsis, 36 (8.9%)babies died as a direct result of sepsis. If the 18 babies whoprobably died from sepsis are included in the analysis, mortalityfrom late-onset sepsis increases to 13.3%. If the 136 episodes ofCONS infection are excluded from the total (because they arepotential contaminants), mortality as a direct result of sepsisincreases to 13.3% and as a direct result of definite plus probablesepsis to 20%. Gram-negative bacillary septicaemia had a highermortality as a direct result of infection (14.8%) than CONS(1.5%) and S aureus (4.5%), but this did not reach statisticalsignificance.
The incidence of late-onset infection was inversely propor-tional to birth weight (table 4). The proportion of babiesdeveloping late-onset sepsis varied from 2.0 per 1000 live birthsin Hong Kong to 22.0 per 1000 in Thailand. The overall figurewas 11.6 per 1000 live births (table 4).
MeningitisMeningitis was reported in 76 episodes of sepsis (16.8% of allepisodes) affecting 75 babies (table 5). Six of 47 babies withearly-onset sepsis (13%) were reported with meningitis com-pared with 70 of 406 episodes of late-onset sepsis (17.2%)(p.0.05). It was not possible to calculate the incidence ofmeningitis in early sepsis per 1000 live births, as none of theepisodes of meningitis occurred in a maternity hospital. One ofsix babies with early-onset meningitis died.
Seventy episodes of late sepsis (17.2%) were associated withmeningitis (table 5). Gram-negative bacilli caused 53 episodes oflate-onset meningitis (75.7%). Meningitis occurred in 28.0% ofthe 189 episodes of late-onset Gram-negative sepsis. Thepredominant species causing late-onset Gram-negative menin-gitis were Klebsiella (25, of which 23 were reported as Klebsiellapneumoniae) and E coli (nine episodes). Meningitis was reportedin 18 (9.6%) of 187 episodes of late-onset sepsis due to Gram-positive cocci: 10 were coagulase-negative staphylococci, two Saureus, and only one GBS (table 5). The reports of meningitisdue to CONS may represent contaminants, but we were unableto verify this. One episode of meningitis was caused by ananaerobe. We received no reports of fungal meningitis.
Meningitis was significantly more common with late-onsetGram-negative bacillary sepsis than with sepsis due to Gram-positive cocci (x2 = 11.3, p = 0.001).
The episodes of meningitis associated with late sepsis werespread across all gestations. One baby had two episodes of late-onset meningitis. Fourteen of 70 babies with late-onsetmeningitis died (20%).
DISCUSSIONThe rates of sepsis in our study varied from 2 per 1000 live birthsin Hong Kong to 22 per 1000 live births in Thailand, with anoverall figure of 11.6 per 1000 live births, a number dominatedby the data from Kuwait. Our study dealt with neonatal unitsand is not representative of neonatal sepsis in the community.The rates of sepsis we calculated were from units with attachedmaternity wards, and the figures we obtained were comparableto the reported overall incidence of neonatal sepsis in Asia, of7.1–38.0 per 1000 live births,2 8–12 and higher than the ratesusually reported from resource-rich countries in NorthAmerica,7 Europe7 and Australia6 of 1.0–8.1 per 1000 live births.The mortality figures in this study, of 13% for early sepsis and8.9% for late sepsis, are similar to recent mortality figures from
Table 3 Sensitivities of Gram-negative organisms causing late-onsetsepsis
Organism CSGS CSGR CRGS CRGR (%) Total
Acinetobacter species 6 4 7 3 (15) 20
Escherichia coli 14 1 5 5 (20) 25
Enterobacter species 11 2 12 3 (11) 28
Klebsiella species 35 2 2 31 (44) 70
Proteus species 0 0 2 1 (33) 3
Pseudomonas species 3 1 6 6 (37) 16
Serratia species 9 0 1 3 (23) 13
Other Gram-negative bacilli 1 0 2 2 (40) 5
Total 79 (44%) 10 (6%) 37 (21%) 54 (30) 180
C, third-generation cephalosporin (cefotaxime or ceftazidime for Pseudomonas); G,gentamicin; S, sensitive; R, resistant.
Table 2 Organisms causing late-onset sepsis
Organism n (%)
Coagulase-negative staphylococcus 136 (33.5)
Klebsiella species 69 (17.0)
Enterobacter species 29 (7.1)
Escherichia coli 26 (6.4)
Staphylococcus aureus 22 (5.4)
Acinetobacter species 21 (5.2)
Pseudomonas species 18 (4.4)
Serratia species 15 (3.7)
Other Gram-negative bacilli 10 (2.5)
Group B streptococcus 3 (0.7)
Other Gram-positive cocci 26 (6.4)
Candida species 25 (6.2)
Miscellaneous 6 (1.5)
Total 406 (100.0)
Original article
F146 Arch Dis Child Fetal Neonatal Ed 2009;94:F144–F148. doi:10.1136/adc.2008.139865
on 5 March 2009 fn.bmj.comDownloaded from

the USA,7 and are very similar to the Australian mortalityfigures for 1991–2 of 15% for early-onset sepsis and 9% for late-onset sepsis.6 The mortality from late-onset Gram-negativebacillary sepsis in the present study was also comparable torecent North American13 and Australian14 data.
The most common pathogen reported causing early-onsetsepsis in our study was GBS, responsible for 38.3% of earlysepsis. CONS was next most common, either due to rapid earlypostnatal acquisition of the organism or as blood culturecontaminants. E coli and other Gram-negative bacilli causedmost of the other early-onset infections. The pattern oforganisms identified in early sepsis in Asia in this study issimilar to that described in resource-rich countries.
The incidence of early-onset sepsis due to GBS in this studywas 0.51 per 1000 live births, which is lower than the incidencein the USA15 and Australia6 before the widespread use ofintrapartum antibiotics. GBS is usually reported to be anuncommon cause of early-onset sepsis in resource-poor coun-tries.2 8 In previous Asian studies, the incidence of early-onsetsepsis due to GBS was 0.1–0.27 cases per 1000 live births inThailand,9 0.11–1.39 in Taiwan,10 0.27 in Singapore11 and 0.4 inMalaysia.12 In contrast, the incidence of early-onset GBS diseasein the USA before the use of intrapartum antibiotics was 0.7–3.7per 1000 live births.15
The organisms causing late-onset infection in Asian neonatalunits in the present study were similar to those reported fromresource-rich countries since the 1980s, with CONS being themost common cause of infection, followed by Gram-negativebacilli.1 2 6
The proportion of babies with early-onset sepsis who hadmeningitis in our study (12.8%) was comparable to figures fromNorth America and Europe.12 The rate of meningitis in latesepsis (17.2%), however, was slightly higher than the rate of,10% generally reported from North America, Europe andAustralia.6 7 This was despite our use of stringent criteria (.100white cells/ml) to define meningitis, although lowering thesecriteria to .20 cells did not significantly alter our figures, asmost babies with meningitis grew organisms from CSF.Mortality from late-onset meningitis was 20% in the presentstudy, a rate that is perhaps surprisingly low and comparable tomortality in resource-rich countries.7 This may be due toselection bias and/or to a high quality of care in the nurseriesthat participated in the study.
Of the Gram-negative bacillary infections for which sensitiv-ities were reported, only 30% of Gram-negative organismsresponsible for late-onset sepsis and 19% of Gram-negativeorganisms responsible for early-onset sepsis were reported asbeing sensitive to both a third-generation cephalosporin andgentamicin. The rest were resistant to either antibiotic or both.This is in line with data from Asia suggesting very high rates ofantibiotic resistance among Gram-negative bacilli.3 8 16 In con-trast, only 17% of S aureus species responsible for late infectionthat were tested were meticillin resistant, whereas many Asianunits report higher rates of MRSA.16
The data we obtained were surprisingly similar to those fromresource-rich countries, in terms of the organisms isolated frombabies with early and late sepsis, the incidence of meningitis,and mortality from meningitis and overall sepsis. The majordifferences are that the rate of late-onset sepsis in Asia is higherthan in resource-rich countries and that a very high percentageof Gram-negative organisms are resistant to either gentamicinor a third-generation cephalosporin or both. However, this doesnot apparently result in increased mortality, at least in the unitsstudied here, although, because the incidence of sepsis is higherthan in resource-rich countries, more Asian babies are dyingfrom sepsis. Furthermore, if rates of antibiotic resistancecontinue to rise, we expect that mortality will also rise inAsia as clinicians run out of antibiotic options.
The present study is not a systematic survey of Asianneonatal units. Selection bias is one of the major criticisms ofthe study, and it is likely that the neonatal units reporting dataare better resourced than many other neonatal units in the samecountry and many others in the region. However, the data arerecent, prospective and from various centres and add valuableinformation on neonatal infections in Asia, particularly withregard to antibiotic resistance. One of the strengths of thisstudy is that it is an ongoing project, and hence there is thecapacity to monitor changes in pathogens and their changingantibiotic-resistance patterns with time. We intend to continuecollecting data for several years and to recruit more neonatalunits.
Table 5 Organisms causing meningitis
OrganismLate-onsetmeningitis
Early-onsetmeningitis
Acinetobacter species 3 –
Bacillus species 1 –
Coagulase-negative staphylococcus 10 1
Escherichia coli 9 1
Edwardsiella tarda 1 –
Enterobacter species 3 –
Haemophilus influenzae 1 –
Klebsiella species 25 2
Listeria species 1 –
Proteus species 1 –
Pseudomonas species 1 1
Salmonella species 1 –
Serratia marcescens 6 –
Staphylococcus aureus 2 1
Group B streptococcus 1 –
Streptococcus species 1 –
Total 70 6
Table 4 Proportion of babies admitted to neonatal intensive care who developed late-onset sepsis, by birthweight
Maternity hospital ,1000 g 1000–1499 g 1500–1999 g 2000–2499 g >2500 g Total
Centro Hospitalar Conde S Januario, China 4/6 0/14 1/32 0/23 0/333 5/408
Kuala Terengganu, Malaysia 4/35 5/87 7/294 5/564 12/3609 33/4589
Ramathibodi Hospital, Thailand 3/18 5/35 0/88 0/133 3/225 11/499
Ab Sarah Maternity Hospital, Kuwait 61/131 45/157 27/285 8/698 22/10211 163/11482
Princess Margaret Hospital, Hong Kong 3/22 1/19 1/100 3/1857 8/1998
Total 75/211 56/312 49/1234 40/16235 220/18976
% of total 35.5 17.9 4.0 0.25 1.2
Original article
Arch Dis Child Fetal Neonatal Ed 2009;94:F144–F148. doi:10.1136/adc.2008.139865 F147
on 5 March 2009 fn.bmj.comDownloaded from

Acknowledgements: This study was performed by the members of the Asia-PacificNeonatal Infections Study: R Tiskumara, R Halliday, D Isaacs (Children’s Hospital atWestmead, Sydney, Australia), SH Fakharee (Mofid Children’s Hospital, Teheran, Iran),C-Q Lui (Children’s Hospital of Hebei Province, China), P Nuntnarumit (RamathibodiHospital, Bangkok, Thailand), K-M Lui (Centro Hospitalar Conde Sao Januario, MacauSAR, China), M Hammoud, SK Seema, A Mazen (Ab Sarah Maternity Hospital,Kuwait), JFK Lee, SCO Zuraidan (Kuala Terengganu Hospital, Terengganu, Malaysia),CB Chow, CC Shek (Princess Margaret Hospital HKSAR, Hong Kong), A Shenoi, NNNagesh (Manipal Hospital, Bangalore, India). The study was unfunded, there are noknown conflicts of interest, and the data are provided through the generosity of theparticipants.
Competing interests: None.
Ethics approval: Obtained.
REFERENCES1. Bryce J, Boschi-Pinto C, Shibuya K, et al. WHO estimates of the causes of death in
children. Lancet 2005;365:1147–53.2. Vergnano S, Sharland M, Kazembe P, et al. Neonatal sepsis: an international
perspective. Arch Dis Child Fetal Neonatal Ed 2005;90:F220–4.3. Zaidi A, Huskins C, Thaver D, et al. Hospital-acquired neonatal infections in
developing countries. Lancet 2005;365:1175–89.4. Kapoor L, Randhawa V, Deb M. Microbiological profile of neonatal septicemia in a
pediatric care hospital in Delhi. J Commun Dis 2005;37:227–32.5. Waheed M, Laeeq A, Maqbool S. The etiology of neonatal sepsis and patterns of
antibiotic resistance. J Coll Physicians Surg Pak 2003;13:449–52.
6. Isaacs D, Barfield C, Grimwood K, et al. Systemic bacterial and fungal infections ininfants in Australian neonatal units. Med J Aust 1995;162:198–200.
7. Palazzi DL, Klein JO, Baker CJ. Bacterial sepsis and meningitis. In: Remington JS,Klein JO, Wilson CB, et al, eds. Infectious diseases of the fetus and newborn infant.6th edition. Philadelphia: Elsevier-Saunders, 2006:247–96.
8. Orsin D, Vergnano S, Anthony C. Serious bacterial infections in newborn infants indeveloping countries. Curr Opin Infect Dis 2004;17:217–24.
9. Yossuck P, Kanchana P. Neonatal group B streptococcal infection: incidence andclinical manifestation in Siriraj Hospital. J Med Assoc Thai 2002;85(Suppl2):S479–87.
10. Ho MY, Wu CT, Ku YT, et al. Group B Streptococcal infection in neonates: an 11-yearreview. Acta Paediatr Taiwan 1999;40:83–6.
11. Tan K, Tay L, Lin R, et al. Group B Streptococcal septicaemia/meningitis in neonatesin a Singapore teaching hospital. Aust N Z J Obstet Gynaecol 1998;38:418–23.
12. Lim CT, Thong MK, Parasakthi N, et al. Group B streptococcus: maternalcarriage rate and early neonatal septicaemia. Ann Acad Med Singapore1997;26:421–5.
13. Karlowicz MG, Buescher ES, Surka AE. Fulminant late onset bacterial infection in aneonatal intensive care unit, 1988–1997, and the impact of avoiding empiricvancomycin therapy. Pediatrics 2000;107:1387–90.
14. Gordon A, Isaacs D. Late onset Gram negative bacillary infection in Australia andNew Zealand 1992–2002. Pediatr Infect Dis J 2006;25:25–9.
15. Edwards MS, Nizet V, Baker CJ. Group B streptococcal infections. In: RemingtonJS, Klein JO, Wilson CB, et al, eds. Infectious diseases of the fetus and newborninfant. 6th edn. Philadelphia: Elsevier-Saunders, 2006:403–64.
16. Isaacs D. Unnatural selection: reducing antibiotic resistance in neonatal units. ArchDis Child Fetal Neonatal Ed 2006;91:F72–4.
Original article
F148 Arch Dis Child Fetal Neonatal Ed 2009;94:F144–F148. doi:10.1136/adc.2008.139865
on 5 March 2009 fn.bmj.comDownloaded from

doi:10.1136/adc.2007.123273 online 1 May 2008;
2009;94;F149-F151; originally publishedArch. Dis. Child. Fetal Neonatal Ed. B Wefers, S Cunningham, R Stephen and N McIntosh
with surges of systemic noradrenalineNeonatal blood pressure waves are associated
http://fn.bmj.com/cgi/content/full/94/2/F149Updated information and services can be found at:
These include:
References
http://fn.bmj.com/cgi/content/full/94/2/F149#BIBL
This article cites 7 articles, 2 of which can be accessed free at:
Rapid responses http://fn.bmj.com/cgi/eletter-submit/94/2/F149
You can respond to this article at:
serviceEmail alerting
the top right corner of the article Receive free email alerts when new articles cite this article - sign up in the box at
Notes
http://journals.bmj.com/cgi/reprintformTo order reprints of this article go to:
http://journals.bmj.com/subscriptions/ go to: Archives of Disease in Childhood - Fetal and Neonatal EditionTo subscribe to
on 5 March 2009 fn.bmj.comDownloaded from

Neonatal blood pressure waves are associated withsurges of systemic noradrenaline
B Wefers,1 S Cunningham,2 R Stephen,3 N McIntosh3
1 Department of Neonatology,Section of Child Life and Health,University of Edinburgh,Edinburgh, UK; 2 Department ofRespiratory and Sleep Medicine,Royal Hospital for Sick Children,Edinburgh, UK; 3 Department ofReproductive andDevelopmental Sciences,University of Edinburgh,Edinburgh, UK
Correspondence to:Birgit Wefers, NICU, NinewellsHospital and Medical School,Dundee DD1 9SY, UK;[email protected]
Accepted 2 April 2008Published Online First 2 April 2008
ABSTRACTNeonatal blood pressure (BP) waves have been linked toneonatal illness. We investigated plasma levels ofvasoactive hormones when BP waves were observed.Peak and trough noradrenaline levels correlated withmean BP (p = 0.028). There was no relationship toadrenaline, dopamine or endothelin levels.
Maintenance of blood pressure (BP) is importantfor perfusion of vital organs and avoidance ofperfusion-related brain injury in the newborn.Normal reference ranges relate to gestation andpostnatal age.1 Hypertensive neonatal BP waveshave previously been described2 and have beenlinked to more severe neonatal illness. An increasedrisk of cerebral pathology in these infants has beenpostulated. However the mechanism behind thesewaves is unclear. As BP control normally involves anumber of vasoactive chemicals, we aimed tomeasure these during the peaks and troughs ofthe waves.
METHODSThe infants were receiving intensive care becauseof prematurity or sickness and thus had contin-uous invasive measurement of BP. Measurementsare sampled each second and stored on ourcomputerised trend monitoring system (CPTM)with mean BP routinely displayed as a trend graphat the cot side. This revealed cyclical BP waves thatwere of a degree which led to clinical concern,especially with regards to possible effects oncerebral perfusion. It was therefore thought clini-cally important to try and explore the underlyingmechanisms. An example of the pattern is shownin fig 1. Paired blood samples (0.5–1 ml from theindwelling arterial line used for monitoring BP)were taken at the peak and trough of a BP wavewith parental permission in order to determine thecause of the waves. Samples were collected intocooled ethylenediaminetetraacetic acid tubes con-taining sodium metabisulphite, separated immedi-ately and stored at 270uC prior to analysis.Noradrenaline, adrenaline and dopamine weremeasured by reverse-phase, ion-pair high perfor-mance liquid chromatography (HPLC) with dual-electrode coulometric detection (which gave anadditional order of sensitivity compared to the moreusual amperometric electrochemical detection). Asimple solvent extraction technique was used toisolate the catecholamines from plasma prior to theirseparation by HPLC. Dihydroxybenzylamine wasused as the internal standard and the averagerecovery was 88.3% (n = 100). The limits of detec-tion were ,5 pg per injection for noradrenaline and
adrenaline and ,10 pg per injection for dopamine,and the inter-assay coefficients of variation fornoradrenaline, adrenaline and dopamine were1.6%, 2.9% and 3.4%, respectively.
Endothelin levels were measured by radioimmunoassay in a subgroup of samples obtainedfrom a single patient. The mean BP value recordedby the CPTM at the time of sampling wascorrelated to the vasoactive hormone levels usingthe Wilcoxon signed rank test.
RESULTSSeven paired sets of consecutive peak/trough bloodsamples were obtained from five infants withtypical hypertensive BP waves. In two infants wewere able to obtain two sets of peak/trough levels.In one infant we were able to obtain a total ofseven consecutive samples.
The results of the paired consecutive samples andassociated mean BP values are shown in table 1. Thefive infants had a median birth weight of 2620 g(interquartile range; IQR 956–3001) and mediangestation of 33 weeks (IQR 27–38). The medianwavelength of BP waves was 14.3 minutes (IQR7.3–16.2), with the median amplitude 13.2 mmHg(IQR 8.3–19.4). The median noradrenaline peak levelwas 10.5 nmol/l (IQR 5.1–38.1) and was signifi-cantly greater than the trough level 5.7 nmol/l (IQR3.1–25.8) (Wilcoxon signed rank test, p = 0.021). Inall cases the level at the wave peak was greater thanat the corresponding trough. There was no signifi-cant difference in the peak and trough levels of otherhormones; adrenaline was generally undetectable.Infant 2 had a total of seven blood samples takenover 3 h. These samples showed a significantcorrelation between noradrenaline and mean BP(r2 = 0.64, p = 0.0280). No significant correlationwas found between dopamine, adrenaline orendothelin levels and mean BP in this infant(r2 = 0.17, r2 = 0.03 and r2 = 0.04, respectively).
DISCUSSIONBP is usually maintained within a tight physiolo-gical range by a combination of physiologicalcontrol mechanisms. These include the autonomicnervous system, the cardiovascular system and theendocrine system. The stability of BP achieved inthis manner is important for the perfusion ofessential organs. We have previously describedhypertensive BP waves in both term and pretermnewborn infants, suggesting that under certaincircumstances this balanced regulation is dis-turbed.2 We have also previously described thatsuch hypertensive BP waves were associated withmore severe neonatal illness.2 Many of the neuraland endocrine controls of the cardiovascular
Short report
Arch Dis Child Fetal Neonatal Ed 2009;94:F149–F151. doi:10.1136/adc.2007.123273 F149
on 5 March 2009 fn.bmj.comDownloaded from

system have intrinsic rhythms which may be exaggerated byhypoxia.3 Repeated measurements of neonatal endocrine func-tion are scarce due to technical and ethical difficulties; howeverarginine vasopressin has previously been demonstrated toinduce BP waves.4
The advent of micro assays and the widespread use ofinvasive BP monitoring in Neonatal Intensive Care allowed usto investigate the relationship between some vasoactivehormones and BP waves in a small group of infants. Theseassays demonstrated a strong relationship between mean BPduring episodes of waves and serum noradrenaline levels.
Although a rise in noradrenaline levels was seen in two infantswhen a dopamine infusion was started (infants 1 + 5), therelationship between BP and noradrenaline was maintainedindependently. Both infants with two sets of peak and troughsamples showed a reduction in noradrenaline levels over time.The samples were taken at 8- and 4-minute intervals,respectively. This is in excess of the plasma noradrenalinehalf-life of 2–3 minutes described by Esler et al5 which wouldsuggest that the hypertensive BP waves were related to repeatednoradrenaline surges. In our opinion it is less likely that BPwaves induce surges in noradrenaline. Noradrenaline release can
Figure 1 31-week gestation infant withheart rate and mean blood pressure (BP)trend graphs over 6 h showing waves(the infant was not receiving inotropes).
Table 1 Infant characteristics and vasoactive hormone levels
InfantGestation(weeks)
Birthweight(g)
Wavelength(minutes)
Amplitude(mmHg)
Age(h) Peak/trough
mBP(mm Hg) NA (nmol/l) DA (nmol/l) A (nmol/l) Outcome
1 36 2620 16.2 31.4 31 p 69 118 280 ,0.1 Meconium aspiration,died 6 months
t 42 71.2 146 ,0.1
1 16.2 31.4 31 p 70 43.12 83 ,0.1
t 38 21.52 51 ,0.1
2 29 886 8.9 8.3 93 p 49 10.5 ,0.16 ,0.1 Problems of prematurity,normal at F/U
t 41 3.87 0.48 ,0.1
2 8.9 8.3 93 p 49 2.71 ,0.16 ,0.1
t 40 1.82 0.48 ,0.1
3 33 2960 14.3 8.3 60 p 42 3.97 257 ,0.1 Hydrops unknownaetiology, normal at F/U
t 36 2.42 269 ,0.1
4 28 560 16.2 13.2 192 p 43 6.3 1.4 ,0.1 Problems of prematurityand growth retardation,neurodevelopmentaldelay
t 34 5.7 0.7 ,0.1
5 40 2933 2.9 15.4 40 p 62 33.5 19 1 Birth asphyxia, outcomeunknown
t 48 30 21.1 0.8
A, adrenaline; DA, dopamine; F/U, follow-up; mBP, mean blood pressure; NA, noradrenaline; p, peak; t, trough.
Short report
F150 Arch Dis Child Fetal Neonatal Ed 2009;94:F149–F151. doi:10.1136/adc.2007.123273
on 5 March 2009 fn.bmj.comDownloaded from

be caused by raised intracranial pressure. This relationship wasfirst explored by Harris et al who mimicked the effect of thecontractions of labour on the fetal head in the near-term fetalsheep. They showed that phasic increase in intracranial pressurewas followed within 30 seconds by a rise in mean BP, but thatafter 10 cycles or so the rise in BP became tonic.6 This is differentto what we describe. In our infants we have no measures ofintracranial pressure, and would not a priori believe it to becycling. Lagercrantz’s group showed that there is a postnatalsurge of noradrenaline, which can be exaggerated by perinatalhypoxia (certainly present in some of our infants) but this surgelasts for hours or days, and we are not aware that cycles havebeen described within it.7 Noradrenaline is released as a stresshormone, and in a separate small number of infants we havefound that BP waves can be induced by a stressful event such asbradycardia, a blocked endotracheal tube or transient hypoxia.However infants demonstrating stress-induced BP waves hadwaves that were somewhat smaller in amplitude, median5 mmHg (IQR 5–10), and wavelength, median 1 minute (IQR0.6–7.8). Before firm conclusions could be drawn regarding therole of noradrenaline in the development of hypertensive BPwaves further investigation of vasoactive hormone levels and
other cardiovascular regulatory mechanisms would be neces-sary.
Acknowledgements: We would like to thank Dr Alberto Smith, Reader in VascularScience at Kings College London.
Competing interests: None declared.
REFERENCES1. Cunningham S, Symon AG, Elton RA, et al. Intra-arterial blood pressure reference
ranges, death and morbidity in very low birthweight infants during the first seven daysof life. Early Hum Dev 1999;56(2–3):151–65.
2. Cunningham S, Deere S, McIntosh N. Cyclical variation of blood pressure and heartrate in neonates. Arch Dis Child 1993;69:64–7.
3. Kocsis B, Fedina L, Pasztor E. Two phase change of sympathetic rhythms in brainischaemia, Cushing reaction and asphyxia. Am J Physiol 1989;256:R120–32.
4. Murata Y, Miyake Y, Yakamoto T, et al. Experimentally produced sinusoidal fetal heartrate pattern in the chronically instrumented fetal lamb. Am J Obstet Gynecol1985;153:693–702.
5. Esler M, Jennings G, Korner P, et al. Measurement of total and organ specificnorepinephrine kinetics in humans. Am J Physiol 1984;247:E21–8.
6. Harris AP, Koehler RC, Nishijima MK, et al. Circulatory dynamics during periodicintracranial hypertension in fetal sheep. Am J Physiol 1992;263:R95–102.
7. Soulier V, Dalmaz Y, Cottet-Emard JM, et al. Long-term influence of neonatal hypoxiaon catecholamine activity in carotid bodies and brainstem cell groups of the rat.J Physiol 1997;498:523–30.
Short report
Arch Dis Child Fetal Neonatal Ed 2009;94:F149–F151. doi:10.1136/adc.2007.123273 F151
on 5 March 2009 fn.bmj.comDownloaded from

doi:10.1136/adc.2007.136333 online 6 Oct 2008;
2009;94;F152-F153; originally publishedArch. Dis. Child. Fetal Neonatal Ed. Brunet, C Dupont and A Lapillonne S Eleni-dit-Trolli, E Kermorvant-Duchemin, C Huon, M Mokthari, K Husseini, M-L
preterm infantsEarly individualised parenteral nutrition for
http://fn.bmj.com/cgi/content/full/94/2/F152Updated information and services can be found at:
These include:
References
http://fn.bmj.com/cgi/content/full/94/2/F152#BIBL
This article cites 5 articles, 2 of which can be accessed free at:
Rapid responses http://fn.bmj.com/cgi/eletter-submit/94/2/F152
You can respond to this article at:
serviceEmail alerting
the top right corner of the article Receive free email alerts when new articles cite this article - sign up in the box at
Notes
http://journals.bmj.com/cgi/reprintformTo order reprints of this article go to:
http://journals.bmj.com/subscriptions/ go to: Archives of Disease in Childhood - Fetal and Neonatal EditionTo subscribe to
on 5 March 2009 fn.bmj.comDownloaded from

Early individualised parenteral nutrition for preterminfants
S Eleni-dit-Trolli,1 E Kermorvant-Duchemin,1,2 C Huon,1 M Mokthari,1 K Husseini,1
M-L Brunet,3 C Dupont,1,2 A Lapillonne1,2
1 APHP, Department ofNeonatology and Nutrition,Saint-Vincent de Paul Hospital,Paris, France; 2 Paris DescartesUniversity, Paris, France; 3 APHP,Parenteral Nutrition Unit, CochinHospital, Paris, France
Correspondence to:Professor A Lapillonne,Department of Neonatology andNutrition, Saint-Vincent de PaulHospital, 74 Avenue DenfertRochereau, 75014 Paris, France;[email protected]
Accepted 4 September 2008Published Online First6 October 2008
ABSTRACTConsiderable effort should be made to optimise parenteralnutrition of preterm infants in order to limit thedevelopment of postnatal growth restriction. A mono-centric before-and-after study design was used todetermine the effects of computerising parenteralnutrition ordering on the composition of parenteralnutrition (PN) solutions and early clinical outcomes ofpreterm infants born (28 weeks of gestation. Parenteralprotein intake during the first week of life and parenterallipid, glucose and energy intakes during the first andsecond week of life were significantly higher in infantsassessed after the introduction of computerised parent-eral nutrition ordering. This led to a significant reduction inthe cumulative energy deficit over the first 28 days of lifeand to an improvement in both early growth andpulmonary outcome. Computerising the PN orderingprocess improves the nutrient content of the PN solutionsand early postnatal outcome.
Postnatal growth deficit is the most commonlyobserved morbidity in very low birthweight(VLBW) infants and is due, at least in part, toinadequate early nutritional intake during hospita-lisation.1 In order to appropriately manage nutri-tional intake of VLBW infants, daily changes in thecomposition of parenteral nutrition (PN) areusually required, but the ordering of individualisedPN solutions is associated with a high incidence ofmedical errors and protocol deviations. Ourhypothesis was that optimisation of early PN byusing a computerised PN (CPN) ordering processwould improve early nutritional intake, reduceearly nutritional deficit, and, in turn, influenceearly growth and neonatal outcomes.
MATERIALS AND METHODSOn 6 June 2005, we implemented an automatedcomputerised calculation for determining, for eachinfant, the optimal daily PN solution according toour nutritional protocol. Before this date, allindividualised PN orders were calculated at thebedside, whereas, after this date, the desired PNintake was calculated using standardised spread-sheet software (Microsoft Excel), which takes intoaccount the desired total volume and nutrientintake, the nutrition provided by the enteralnutrition, and the volume of drugs prescribed.
A before-and-after monocentric study was car-ried out to determine the effects of the CPNordering process on nutritional intake and clinicaloutcome of VLBW infants during the first 28 daysof life. The inclusion criteria were birth at agestational age (28 weeks and admission to the
unit from the first day of life. Infants who hadcongenital malformations or metabolic disease,were transferred to another hospital, or died beforethe 28th day of life were excluded from the study.The last 20 preterm infants who matched theinclusion criteria and who were consecutivelyadmitted before the date of implementation ofthe CPN ordering system were included in thecontrol group, and the first 20 preterm infantsadmitted after this date were included in the CPNgroup. The nutritional protocol remainedunchanged during the two phases of the study.
Perinatal and nutritional data were collectedfrom medical records. Human milk was assumed tocontain 70 kcal/100 ml and 1.05 g protein/100 ml.Formula intakes were based on published manu-facturer’s figures. Weight was converted intostandard deviation scores (z scores). Cumulativeintakes over the first 28 days of life were obtainedby adding the daily enteral and parenteral intakesof the first 28 days of life. Actual daily intakes weresubtracted from recommended intake (120 kcal/kg/day for energy and 3.5 g/kg/day for protein) tocalculate daily deficits. These were subsequentlyadded together to calculate cumulative deficits.
The statistical analysis was carried out usingMinitab13.3 (Minitab Inc, State College,Pennsylvania, USA). Comparative analyses wereperformed using a x2 test, or an unpaired t testwhen appropriate. The level of significance wasfixed at p(0.05.
RESULTSMean (SD) birth weight and gestational age of the40 infants were 973 (208) g and 27.2 (0.9) weeks,respectively. Maternal and infant clinical charac-teristics, PN duration and parenteral fluid intakewere similar in the two groups (data not shown).
Improvement in early nutritional intakesParenteral protein intake during the first week oflife and parenteral lipid, glucose and energy intakesduring the first and second week of life weresignificantly higher in the CPN group than in thecontrol group (table 1).
Reduction in early nutritional deficitOwing to a higher parenteral intake over the first28 days, the cumulative total intake was signifi-cantly higher in the CPN group for lipid (+16%),carbohydrate (+8%) and energy (+11.5%), but thedifference did not reach significance for protein(+4%) (table 2). The 28-day cumulative energydeficit was significantly smaller in the CPN than in
Short report
F152 Arch Dis Child Fetal Neonatal Ed 2009;94:F152–F153. doi:10.1136/adc.2007.136333
on 5 March 2009 fn.bmj.comDownloaded from

the control group (252 (165) vs 2389 (344) kcal/kg, respec-tively; p = 0.001), whereas there was no protein deficit at28 days of life for either group (5 (8) vs 1 (7) g/kg; p = 0.096).
Improvement in early growth and neonatal outcomesThe importance of early weight loss was similar in both groups,but the time to regain birth weight was significantly shorter inthe CPN group (10.4 (2.5) vs 12.8 (3.3) days, p = 0.01). Therewas a trend for a higher weight gain (+6.5%; 11 (4.1) vs 13.2(3.8) days, p = 0.079) and a smaller loss of weight z scorebetween birth and the 28th day of life in the CPN group (20.76(0.24) vs 2 0.95 (0.39); p = 0.073). Other growth parameters didnot differ. The number of infants with necrotising enterocolitis,patent ductus arteriosus, nosocomial infection, intraventricularhaemorrhage, white matter disease, or a requirement for insulintherapy was similar in the two groups. The number of infantswith bronchopulmonary dysplasia (BPD) at 28 days of life wassimilar in the two groups (n = 14 vs 15), but the number ofthose with severe BPD (ie, need for ventilator support) wassignificantly lower in the CPN group (n = 0 vs 5; p = 0.049).
DISCUSSIONThis study shows that providing doctors with an adequate toolfor prescribing individualised PN is effective in improving thenutritional management of VLBW infants, which may lead, inturn, to better clinical outcome. Together with previouslyshown advantages of time saving, efficiency and accuracy ofcalculations, these data emphasise the need to computerise theprocess of ordering individualised PN.2
The difference between the two groups was more apparent forenergy intake than protein intake. This is not surprising, as thenutritional protocol used in the unit is very close to the mostrecent recommendations for protein and leads to no apparentprotein deficit over the first month of life. However, theintroduction of CPN ordering further improved early proteinintake. We postulate that the early loss of body protein wasminimised in our study, and this, in turn, may explain why thetime to regain birth weight was shorter and the loss of weight zscore is smaller than those in previously published studies.3 4
We also showed that the change in mode of PN ordering wasassociated with a reduction in the severity of BPD, although the
overall rate of infants with BPD remained unchanged. We cannotrule out the possibility that factors other than nutrition changedbetween the two study periods. However, our observations are inline with previous experimental and epidemiological studies,which have shown that early reduction in energy intake is a riskfactor for the development of BDP and that early inadequatenutrition, especially protein deficiency, affects lung cell divisionand diminishes alveolar formation and lung volume.5
Our data show the nutritional advantages of computerisingthe PN ordering process of individualised parenteral nutritionand also suggest advantages in terms of better clinical outcomefor VLBW infants.
Acknowledgements: We thank F Lemare, A Lescoat, J Rambaud, L Fellous, MMoreno and A Guiseppi for their contribution to the preparation of PN solutions, dataacquisition and/or infant management.
Competing interests: None.
REFERENCES1. Thureen P, Heird WC. Protein and energy requirements of the preterm/low
birthweight (LBW) infant. Pediatr Res 2005;57:95R–98R.2. Puangco MA, Schanler RJ. Computerized PN ordering optimizes timely nutrition
therapy in a neonatal intensive care unit. J Am Diet Assoc 1997;97:258–613. Embleton NE, Pang N, Cooke RJ. Postnatal malnutrition and growth retardation: an
inevitable consequence of current recommendations in preterm infants? Pediatrics2001;107:270–3.
4. Ehrenkranz R, Younes N, Lemons JA, et al. Longitudinal growth of hospitalized verylow birthweight infants. Pediatrics 1999;104:280–9.
5. Biniwale MA, Ehrenkranz RA. The role of nutrition in the prevention and managementof bronchopulmonary dysplasia. Semin Perinatol 2006;30:200–8.
Table 1 Weekly parenteral intakes received by preterm infants before(ie, control) and after (ie, CPN) the introduction of a computerisedparenteral nutrition (CPN) ordering process
WeekControl(n = 20)
CPN(n = 20) p Value
Protein (g/kg/week) 1 19.6 (3.7) 23.2 (3.0) 0.002
2 20.1 (3.0) 21.9 (4.8) 0.16
3 15.0 (8.5) 15.1 (9.4) 0.96
4 8.3 (8.5) 6.1 (8.6) 0.42
Glucose (g/kg/week) 1 65.4 (6.0) 79.1 (11.1) ,0.001
2 76.6 (17.8) 91.0 (23.1) 0.034
3 47.2 (29.5) 52.9 (34.1) 0.57
4 29.6 (29.6) 20.9 (30.0) 0.36
Lipid (g/kg/week) 1 5.2 (2.8) 15.9 (4.5) ,0.001
2 19.8 (9.5) 26.7 (3.6) 0.006
3 13.0 (11.2) 17.0 (9.4) 0.23
4 7.0 (8.2) 5.7 (9.0) 0.65
Energy (kcal/kg/week) 1 387 (50) 551 (78) ,0.001
2 565 (105) 692 (133) 0.002
3 368 (225) 425 (252) 0.45
4 214 (211) 159 (232) 0.44
Values are mean (SD).
Table 2 Cumulative parenteral, enteral and total intake during the first4 weeks of life received by 20 preterm infants before (ie, control) andafter (ie, CPN) the introduction of a computerised parenteral nutrition(CPN) ordering process
Control(n = 20)
CPN(n = 20)
pValue
Protein
Cumulative parenteral intake (g/kg) 62.9 (18.1) 66.2 (21.5) 0.60
Mean intake per day (g/kg) 2.2 (0.7) 2.4 (0.8)
Cumulative enteral intake (g/kg) 36.0 (18.8) 36.9 (16.9) 0.87
Mean intake per day (g/kg) 1.3 (0.7) 1.3 (0.6)
Cumulative total intake (g/kg) 98.9 (7.1) 103.1 (8.3) 0.09
Mean intake per day (g/kg) 3.5 (0.3) 3.7 (0.3)
Lipid
Cumulative parenteral intake (g/kg) 44.9 (22.1) 65.2 (22.0) 0.004
Mean intake per day (g/kg) 1.6 (0.8) 2.3 (0.7)
Cumulative enteral intake (g/kg) 75.4 (36.3) 73.8 (31.8) 0.88
Mean intake per day (g/kg) 2.7 (1.3) 2.6 (1.1)
Cumulative total intake (g/kg) 120.4 (30.9) 139.0 (18.2) 0.02
Mean intake per day (g/kg) 4.3 (1.1) 5.0 (0.7)
Glucose
Cumulative parenteral intake (g/kg) 218.8 (69.1) 243.9 (79.3) 0.29
Mean intake per day (g/kg) 7.8 (2.5) 8.7 (2.8)
Cumulative enteral intake (g/kg) 154.2 (77.1) 160.5 (64.8) 0.78
Mean intake per day (g/kg) 5.5 (2.8) 5.7 (2.3)
Cumulative total intake (g/kg) 373.0 (25.9) 404.5 (26.5) 0.001
Mean intake per day (g/kg) 13.3 (0.9) 14.4 (1.0)
Energy
Cumulative parenteral intake (kcal/kg) 1534 (480) 1827 (571) 0.087
Mean intake per day (kcal/kg) 55 (17) 65 (20)
Cumulative enteral intake (kcal/kg) 1437 (702) 1481 (605) 0.84
Mean intake per day (kcal/kg) 51 (25) 53 (22)
Cumulative total intake (kcal/kg) 2971 (344) 3308 (165) 0.001
Mean intake per day (kcal/kg) 106 (12) 118 (6)
Results are mean (SD) expressed as cumulative intake over the 4-week period and asmean intake per day during this period.
Short report
Arch Dis Child Fetal Neonatal Ed 2009;94:F152–F153. doi:10.1136/adc.2007.136333 F153
on 5 March 2009 fn.bmj.comDownloaded from

doi:10.1136/adc.2008.145268 2009;94;F154 Arch. Dis. Child. Fetal Neonatal Ed.
M Tyrell, S Hingley, C Giles and J O Menakaya
jaundice in the newbornImpact of delayed screening for prolonged
http://fn.bmj.com/cgi/content/full/94/2/F154Updated information and services can be found at:
These include:
References
http://fn.bmj.com/cgi/content/full/94/2/F154#BIBL
This article cites 4 articles, 3 of which can be accessed free at:
Rapid responses http://fn.bmj.com/cgi/eletter-submit/94/2/F154
You can respond to this article at:
serviceEmail alerting
the top right corner of the article Receive free email alerts when new articles cite this article - sign up in the box at
Notes
http://journals.bmj.com/cgi/reprintformTo order reprints of this article go to:
http://journals.bmj.com/subscriptions/ go to: Archives of Disease in Childhood - Fetal and Neonatal EditionTo subscribe to
on 5 March 2009 fn.bmj.comDownloaded from

LETTERS
Impact of delayed screening forprolonged jaundice in thenewborn
Jaundice persisting for longer than 14 days inthe newborn is a trigger to screen for seriousunderlying disorders such as biliary atresiaand other hepatobiliary disorders.1 However,screening too early could result in consider-able anxiety for the parents and unnecessarytests for the baby.2 We evaluated ourpractice of delaying screening tests for 1week after referral to assess its effect onbabies with prolonged jaundice.
METHODSThe outcome for all babies referred aged 14days to a dedicated prolonged jaundice clinicat Hillingdon Hospital, Middlesex, UKbetween 1 April 2006 and 31 July 2007 wasreviewed. The babies had a detailed clinicalassessment carried out the age of at least21 days by a paediatrician. All jaundicedbabies had additional screening investiga-tions (full blood count and film, liverfunction test, total and conjugated bilirubin,thyroid function test, blood group and directCoombs test, urine for reducing substancesand culture), and glucose-6-phosphate dehy-drogenase assay was carried out in at riskbabies. Babies with abnormal results werereferred immediately to a named consultantpaediatrician.
RESULTSA total of 183 (62% male) babies withprolonged jaundice lasting 2 weeks werereferred. The mean (SD) gestational agewas 38.1 (2.0) weeks, and the mean (SD)birth weight was 3170 (630) g. More thanhalf (59%) of the babies were exclusivelybreast fed, and the mode age at review was3 weeks (range 2–9). Jaundice had resolvedin 79 babies (43%) between day 14 (referralday) and day 21 (review day). Ninety-fourpersistently jaundiced babies were investi-gated, and pathology was identified in 16:direct Coombs test positive (5), cardiacmurmur (5), raised thyroid-stimulating hor-mone .6.5 mU/l (2), glucose-6-phosphatedehydrogenase deficiency (1), urinary tractinfection (1), failure to thrive (1) and bloodystools (1). Overall, 80% of the babies weredischarged after one visit. However, 18% ofbabies seen at 3 weeks and above wererecalled to clinic compared with 40% ofthose seen at 2 weeks or less. Biliary atresiawas not identified in any baby during thestudy.
DISCUSSIONThe 1-week deferment for assessment ofreferred babies resulted in resolution ofjaundice in nearly half of the babies (fig 1).All babies who attended the clinic were
evaluated clinically even if no further testswere carried out. This ensured that no co-morbidities were missed. The low pick-uprate for hepatobiliary abnormalities wassimilar to the findings observed byHannam et al.3 In addition, this studyenabled us to determine the effect of a 1-week delay for assessment on referrals to theprolonged jaundice clinic. During this inter-val, jaundice had resolved in many babies,reducing anxiety for parents, unnecessarytests to babies and the cost to the NHS.Biliary atresia is an important but raredisorder, which must be treated within8 weeks of life.1 This approach will notcompromise early detection of babies withhepatobiliary disorders, indeed it is consis-tent with recommendations for selectivescreening at 3 weeks.4
CONCLUSIONDelayed assessment of babies with pro-longed jaundice reduced significantly thenumber of babies that required screeninginvestigations without missing any impor-tant pathologies.
M Tyrell, S Hingley, C Giles, J O Menakaya
Department of Neonatal Paediatrics, Hillingdon Hospital,Uxbridge, UK
Correspondence to: Dr J O Menakaya, Department ofNeonatal Paediatrics, Hillingdon Hospital, Pield Heath Road,Uxbridge, Middlesex UB8 3NN, UK; [email protected]
Competing interests: None.
Accepted 21 July 2008
Arch Dis Child Fetal Neonatal Ed 2009;94:F154.doi:10.1136/adc.2008.145268
REFERENCES1. Kelly DA Davenport M. Current management of
biliary atresia. Arch Dis Child 2007;92:1132–5.2. Hall DMD, Michel J-M. Screening in infancy. Arch Dis
Child 1995;72:93–6.
3. Hannam S, McDonnell M, Rennie JM. Investigation ofprolonged neonatal jaundice. Acta Paediatr2000;89:694–7.
4. Mowat AP, Davidson LL, Dick MC. Earlieridentification of biliary atresia and hepatobiliarydisease: selective screening in the third week of life.Arch Dis Child 1995;72:90–2.
Hydrocortisone treatment forsevere evolvingbronchopulmonary dysplasia andcerebral haemodynamicsWe read with interest the paper byRademaker et al, in which the authors raisedthe question of replacing dexamethasonewith hydrocortisone to treat severe evolvingbronchopulmonary dysplasia (BPD).1 In2006, a national survey revealed that 91%of French neonatologists used betametha-sone for delayed treatment of BPD. FromOctober 2004 to June 2006, we treated 12infants with betamethasone for severe evol-ving BPD and observed a pronounceddecrease in cerebral blood flow velocities(CBFVs).2 Moreover, a quarter of thesepatients also presented an enlargement ofthe subarachnoid space and the lateralventricles, suggesting a transitory impair-ment in brain growth. These morphologicaland functional cerebral effects prompted usto replace betamethasone with hydrocorti-sone in .4-week-old infants who stillrequired the combination of high-frequencyoscillatory ventilation, inhaled nitric oxideand FiO2.50%. This change in corticosteroidwas the only modification in their ventila-tory care.
The hydrocortisone was administered infour intravenous injections daily for 6 days,at successive doses of 5, 5, 3, 3, 1 and 1 mg/kg/day (adapted from Lodygensky et al3).CBFVs were measured by Doppler ultraso-nography, using the computer-controlledpulsed High Q Auto Doppler Trace (PhilipsMedical Systems, Eindhoven, TheNetherlands) in the anterior cerebral arteryand the lenticulostriate artery. The anteriorhorn width and the pericerebral space weremeasured at the level of the interventricularforamen just before and after completion ofthe treatment and then every week untilterm, on ultrasound coronal scans. Signedpermission was obtained from the parents,and the study was approved by the ethicscommittee of our institution.
From July 2006 to September 2007, 12infants (median (range)) birth weight: 725(620–865) g, median (range) gestational age:25.9 (24.9–26.7) weeks) were enrolled at amedian (range) post-natal age of 31.1 (29.3–33.2) days. No significant variation inCBFVs or pulsatility index was observed ineither artery during hydrocortisone treat-ment (table 1). Before hydrocortisone, themean (SD) values for anterior horn widthand the pericerebral space were, respectively,1.30 (0.56) and 2.8 (0.9) mm and did notshow significant change thereafter.
Figure 1 Jaundice status at review of 183babies referred with prolonged jaundice. DNA,did not attend (and therefore jaundice status notknown).
PostScript
F154 Arch Dis Child Fetal Neonatal Ed March 2009 Vol 94 No 2
on 5 March 2009 fn.bmj.comDownloaded from

2009;94;F154-F155 Arch. Dis. Child. Fetal Neonatal Ed. G Cambonie, R Mesnage, C Milési, A Rideau, C Veyrac and J-C Picaud
haemodynamicsbronchopulmonary dysplasia and cerebral Hydrocortisone treatment for severe evolving
http://fn.bmj.com/cgi/content/full/94/2/F154-aUpdated information and services can be found at:
These include:
References
http://fn.bmj.com/cgi/content/full/94/2/F154-a#BIBL
This article cites 3 articles, 2 of which can be accessed free at:
Rapid responses http://fn.bmj.com/cgi/eletter-submit/94/2/F154-a
You can respond to this article at:
serviceEmail alerting
the top right corner of the article Receive free email alerts when new articles cite this article - sign up in the box at
Notes
http://journals.bmj.com/cgi/reprintformTo order reprints of this article go to:
http://journals.bmj.com/subscriptions/ go to: Archives of Disease in Childhood - Fetal and Neonatal EditionTo subscribe to
on 5 March 2009 fn.bmj.comDownloaded from

LETTERS
Impact of delayed screening forprolonged jaundice in thenewborn
Jaundice persisting for longer than 14 days inthe newborn is a trigger to screen for seriousunderlying disorders such as biliary atresiaand other hepatobiliary disorders.1 However,screening too early could result in consider-able anxiety for the parents and unnecessarytests for the baby.2 We evaluated ourpractice of delaying screening tests for 1week after referral to assess its effect onbabies with prolonged jaundice.
METHODSThe outcome for all babies referred aged 14days to a dedicated prolonged jaundice clinicat Hillingdon Hospital, Middlesex, UKbetween 1 April 2006 and 31 July 2007 wasreviewed. The babies had a detailed clinicalassessment carried out the age of at least21 days by a paediatrician. All jaundicedbabies had additional screening investiga-tions (full blood count and film, liverfunction test, total and conjugated bilirubin,thyroid function test, blood group and directCoombs test, urine for reducing substancesand culture), and glucose-6-phosphate dehy-drogenase assay was carried out in at riskbabies. Babies with abnormal results werereferred immediately to a named consultantpaediatrician.
RESULTSA total of 183 (62% male) babies withprolonged jaundice lasting 2 weeks werereferred. The mean (SD) gestational agewas 38.1 (2.0) weeks, and the mean (SD)birth weight was 3170 (630) g. More thanhalf (59%) of the babies were exclusivelybreast fed, and the mode age at review was3 weeks (range 2–9). Jaundice had resolvedin 79 babies (43%) between day 14 (referralday) and day 21 (review day). Ninety-fourpersistently jaundiced babies were investi-gated, and pathology was identified in 16:direct Coombs test positive (5), cardiacmurmur (5), raised thyroid-stimulating hor-mone .6.5 mU/l (2), glucose-6-phosphatedehydrogenase deficiency (1), urinary tractinfection (1), failure to thrive (1) and bloodystools (1). Overall, 80% of the babies weredischarged after one visit. However, 18% ofbabies seen at 3 weeks and above wererecalled to clinic compared with 40% ofthose seen at 2 weeks or less. Biliary atresiawas not identified in any baby during thestudy.
DISCUSSIONThe 1-week deferment for assessment ofreferred babies resulted in resolution ofjaundice in nearly half of the babies (fig 1).All babies who attended the clinic were
evaluated clinically even if no further testswere carried out. This ensured that no co-morbidities were missed. The low pick-uprate for hepatobiliary abnormalities wassimilar to the findings observed byHannam et al.3 In addition, this studyenabled us to determine the effect of a 1-week delay for assessment on referrals to theprolonged jaundice clinic. During this inter-val, jaundice had resolved in many babies,reducing anxiety for parents, unnecessarytests to babies and the cost to the NHS.Biliary atresia is an important but raredisorder, which must be treated within8 weeks of life.1 This approach will notcompromise early detection of babies withhepatobiliary disorders, indeed it is consis-tent with recommendations for selectivescreening at 3 weeks.4
CONCLUSIONDelayed assessment of babies with pro-longed jaundice reduced significantly thenumber of babies that required screeninginvestigations without missing any impor-tant pathologies.
M Tyrell, S Hingley, C Giles, J O Menakaya
Department of Neonatal Paediatrics, Hillingdon Hospital,Uxbridge, UK
Correspondence to: Dr J O Menakaya, Department ofNeonatal Paediatrics, Hillingdon Hospital, Pield Heath Road,Uxbridge, Middlesex UB8 3NN, UK; [email protected]
Competing interests: None.
Accepted 21 July 2008
Arch Dis Child Fetal Neonatal Ed 2009;94:F154.doi:10.1136/adc.2008.145268
REFERENCES1. Kelly DA Davenport M. Current management of
biliary atresia. Arch Dis Child 2007;92:1132–5.2. Hall DMD, Michel J-M. Screening in infancy. Arch Dis
Child 1995;72:93–6.
3. Hannam S, McDonnell M, Rennie JM. Investigation ofprolonged neonatal jaundice. Acta Paediatr2000;89:694–7.
4. Mowat AP, Davidson LL, Dick MC. Earlieridentification of biliary atresia and hepatobiliarydisease: selective screening in the third week of life.Arch Dis Child 1995;72:90–2.
Hydrocortisone treatment forsevere evolvingbronchopulmonary dysplasia andcerebral haemodynamicsWe read with interest the paper byRademaker et al, in which the authors raisedthe question of replacing dexamethasonewith hydrocortisone to treat severe evolvingbronchopulmonary dysplasia (BPD).1 In2006, a national survey revealed that 91%of French neonatologists used betametha-sone for delayed treatment of BPD. FromOctober 2004 to June 2006, we treated 12infants with betamethasone for severe evol-ving BPD and observed a pronounceddecrease in cerebral blood flow velocities(CBFVs).2 Moreover, a quarter of thesepatients also presented an enlargement ofthe subarachnoid space and the lateralventricles, suggesting a transitory impair-ment in brain growth. These morphologicaland functional cerebral effects prompted usto replace betamethasone with hydrocorti-sone in .4-week-old infants who stillrequired the combination of high-frequencyoscillatory ventilation, inhaled nitric oxideand FiO2.50%. This change in corticosteroidwas the only modification in their ventila-tory care.
The hydrocortisone was administered infour intravenous injections daily for 6 days,at successive doses of 5, 5, 3, 3, 1 and 1 mg/kg/day (adapted from Lodygensky et al3).CBFVs were measured by Doppler ultraso-nography, using the computer-controlledpulsed High Q Auto Doppler Trace (PhilipsMedical Systems, Eindhoven, TheNetherlands) in the anterior cerebral arteryand the lenticulostriate artery. The anteriorhorn width and the pericerebral space weremeasured at the level of the interventricularforamen just before and after completion ofthe treatment and then every week untilterm, on ultrasound coronal scans. Signedpermission was obtained from the parents,and the study was approved by the ethicscommittee of our institution.
From July 2006 to September 2007, 12infants (median (range)) birth weight: 725(620–865) g, median (range) gestational age:25.9 (24.9–26.7) weeks) were enrolled at amedian (range) post-natal age of 31.1 (29.3–33.2) days. No significant variation inCBFVs or pulsatility index was observed ineither artery during hydrocortisone treat-ment (table 1). Before hydrocortisone, themean (SD) values for anterior horn widthand the pericerebral space were, respectively,1.30 (0.56) and 2.8 (0.9) mm and did notshow significant change thereafter.
Figure 1 Jaundice status at review of 183babies referred with prolonged jaundice. DNA,did not attend (and therefore jaundice status notknown).
PostScript
F154 Arch Dis Child Fetal Neonatal Ed March 2009 Vol 94 No 2
on 5 March 2009 fn.bmj.comDownloaded from

Thus, even at pharmacological doses,hydrocortisone did not produce the consis-tent decrease in CBFVs observed withbetamethasone in comparable conditions.Decreased blood flow could be one of themechanisms involved in the deleteriouseffects of synthetic glucocorticoids on braindevelopment. From a haemodynamic pointof view, these results suggest the use ofhydrocortisone to rescue infants with severeBPD.
G Cambonie,1 R Mesnage,1 C Milesi,1 A Rideau,1
C Veyrac,2 J-C Picaud1
1 Neonatal Intensive Care Unit, Arnaud de VilleneuveHospital, University Hospital of Montpellier, Montpellier,France; 2 Department of Pediatric Radiology, Arnaud deVilleneuve Hospital, University Hospital of Montpellier,Montpellier, France
Correspondence to: Dr Gilles Cambonie, Unite deReanimation Neonatale, Pediatrie II, Hopital Arnaudde Villeneuve, 371 Avenue du Doyen G. Giraud,34295 Montpellier Cedex 5, France;[email protected]
Competing interests: None.
Ethics approval: The study was approved by the ethicscommittee of our institution.
Patient consent: Parental consent obtained.
Accepted 22 August 2008
REFERENCES1. Rademaker KJ, de Vries LS, Uiterwaal CS, et al.
Postnatal hydrocortisone treatment for chronic lungdisease in the preterm newborn and long-termneurodevelopmental follow-up. Arch Dis Child FetalNeonatal Ed 2008;93:F58–63.
2. Cambonie G, Mesnage R, Milesi C, et al.Betamethasone impairs cerebral blood flow velocitiesin very premature infants with severe chronic lungdisease. J Pediatr 2008;152:270–5.
3. Lodygensky GA, Rademaker K, Zimine S, et al.Structural and functional brain development afterhydrocortisone treatment for neonatal chronic lungdisease. Pediatrics 2005;116:1–7.
Differences between the aminoacid concentrations of umbilicalvenous and arterial bloodAmino acids are supplied to the fetus via theumbilical vein (UV). The difference betweenthe amino acid concentrations of the UVsand umbilical arteries (UAs), in other wordsthe umbilical amino acid flux, determines
which amino acids are required by the fetusand which ones are sufficient. We analysedamino acid concentrations in the UV andUA blood obtained at birth by using high-performance liquid chromatography(HPLC). We examined 31 singleton, full-term neonates appropriate for gestationalage (according to Japanese standards). TheFukuda Hospital Board approved the proto-col of this investigation. Informed consentwas obtained from all the mothers whoparticipated. The mothers underwent sched-uled caesarean sections (for breech position,history of caesarean section, or maternalpreference) and refrained from drinking oreating for at least 6 h before the operation.During the caesarean, the umbilical cord wasdouble-clamped by the obstetrician. UV andUA blood samples were obtained from thissegment of cord and were stored separatelyin test tubes containing ethylenediaminete-traacetic acid. Blood samples were centri-fuged (4uC, 20 min) immediately to removeprecipitated protein. The plasma was sepa-rated after centrifugation and mixed with 2volumes of 5% (w/w) trichloroacetic acid.The samples were kept in a freezer at 280uCuntil they were analysed by HPLC, using an
automatic amino acid analyser (L-8800;Hitachi, Tokyo, Japan).1 Both UV and UAsamples from each neonate were analysed inthe same HPLC run, with a variance of 1.4%.
Figure 1 shows the difference between theUV and UA amino acid concentrations (theumbilical flux) of the neonates. Cetin et al2
compared UV or UA plasma amino acidconcentrations of normal and gestationaldiabetes mellitus (GDM) pregnancies. Inplasma samples of GDM pregnancies, valine,methionine, phenylalanine, isoleucine, leu-cine, ornithine, glutamate, proline, andalanine were increased, whereas glutaminewas markedly decreased. They also showedthat umbilical venoarterial plasma aminoacid differences were not remarkably differ-ent from zero. However, many of the aminoacid flux patterns seen in fig 1 weresignificantly different (p,0.05) and seemedreasonable. All essential amino acids—lysine, valine, leucine, threonine, trypto-phan, histidine, isoleucine, phenylalanineand methionine—showed a positive differ-ence (positive flux). Alanine, which is themost gluconeogenic in fasting, showed thehighest flux. The excessive flow of lysineinto the fetus may be explained by thehypothesis that there is a greater proportionof lysine transporters (cationic amino acidtransporter) on the fetal side of placentathan on the maternal side.3 A negativedifference (negative flux) was seen withglutamic acid, taurine, glycine, etc.Negative flux of glutamic acid and serinemay reflect the fact that these amino acidsare produced in the fetal liver and notsupplied by the placenta.4
Our results confirm the differences inamino acid concentrations between UVand UA blood. Pathological conditions infetuses that may affect the differences in the
Table 1 Mean flow velocities and pulsatility index in the anterior cerebral artery and thelenticulostriate artery during hydrocortisone treatment
Baseline Day 1 Day 3 Day 5 ANOVA
ACA
MFV 18.4 (7.8) 19.0 (8.5) 17.9 (7.3) 18.6 (8.4) 0.17
PI 1.52 (0.37) 1.50 (0.32) 1.53 (0.35) 1.51 (0.43) 0.41
LSA
MFV 8.2 (3.6) 8.4 (2.5) 8.3 (3.0) 8.1 (3.3) 0.30
PI 0.94 (0.25) 0.92 (0.18) 0.94 (0.27) 0.93 (0.22) 0.29
Data are mean (SD). Each data point corresponds to an average of 792 (10) measurements in the ACA and 736 (9)measurements in the LSA. ACA, anterior cerebral artery; ANOVA, repeated-measure analysis of variance; LSA, lenticulostriateartery; MFV, mean flow velocity; PI, pulsatility index.
Figure 1 The umbilical flux of amino acids in fetuses. The umbilical flux denotes the differencebetween the concentration of each amino acid in the umbilical venous blood and the umbilicalarterial blood, in other words, the net uptake of each amino acid into the fetus. The medianvenoarterial difference with 95% confidence interval on either side is shown for each amino acidflux. Hyp, hydroxyproline; aAbu, a-aminobutyric acid; MEA, monoethanolamine.
PostScript
Arch Dis Child Fetal Neonatal Ed March 2009 Vol 94 No 2 F155
on 5 March 2009 fn.bmj.comDownloaded from
doi:10.1136/adc.2008.147256 2009;94;F155-F156 Arch. Dis. Child. Fetal Neonatal Ed.
H Tsuchiya, K Matsui, T Muramatsu, T Ando and F Endo
bloodconcentrations of umbilical venous and arterial Differences between the amino acid
http://fn.bmj.com/cgi/content/full/94/2/F155Updated information and services can be found at:
These include:
References
http://fn.bmj.com/cgi/content/full/94/2/F155#BIBL
This article cites 4 articles, 1 of which can be accessed free at:
Rapid responses http://fn.bmj.com/cgi/eletter-submit/94/2/F155
You can respond to this article at:
serviceEmail alerting
the top right corner of the article Receive free email alerts when new articles cite this article - sign up in the box at
Notes
http://journals.bmj.com/cgi/reprintformTo order reprints of this article go to:
http://journals.bmj.com/subscriptions/ go to: Archives of Disease in Childhood - Fetal and Neonatal EditionTo subscribe to
on 5 March 2009 fn.bmj.comDownloaded from

Thus, even at pharmacological doses,hydrocortisone did not produce the consis-tent decrease in CBFVs observed withbetamethasone in comparable conditions.Decreased blood flow could be one of themechanisms involved in the deleteriouseffects of synthetic glucocorticoids on braindevelopment. From a haemodynamic pointof view, these results suggest the use ofhydrocortisone to rescue infants with severeBPD.
G Cambonie,1 R Mesnage,1 C Milesi,1 A Rideau,1
C Veyrac,2 J-C Picaud1
1 Neonatal Intensive Care Unit, Arnaud de VilleneuveHospital, University Hospital of Montpellier, Montpellier,France; 2 Department of Pediatric Radiology, Arnaud deVilleneuve Hospital, University Hospital of Montpellier,Montpellier, France
Correspondence to: Dr Gilles Cambonie, Unite deReanimation Neonatale, Pediatrie II, Hopital Arnaudde Villeneuve, 371 Avenue du Doyen G. Giraud,34295 Montpellier Cedex 5, France;[email protected]
Competing interests: None.
Ethics approval: The study was approved by the ethicscommittee of our institution.
Patient consent: Parental consent obtained.
Accepted 22 August 2008
REFERENCES1. Rademaker KJ, de Vries LS, Uiterwaal CS, et al.
Postnatal hydrocortisone treatment for chronic lungdisease in the preterm newborn and long-termneurodevelopmental follow-up. Arch Dis Child FetalNeonatal Ed 2008;93:F58–63.
2. Cambonie G, Mesnage R, Milesi C, et al.Betamethasone impairs cerebral blood flow velocitiesin very premature infants with severe chronic lungdisease. J Pediatr 2008;152:270–5.
3. Lodygensky GA, Rademaker K, Zimine S, et al.Structural and functional brain development afterhydrocortisone treatment for neonatal chronic lungdisease. Pediatrics 2005;116:1–7.
Differences between the aminoacid concentrations of umbilicalvenous and arterial bloodAmino acids are supplied to the fetus via theumbilical vein (UV). The difference betweenthe amino acid concentrations of the UVsand umbilical arteries (UAs), in other wordsthe umbilical amino acid flux, determines
which amino acids are required by the fetusand which ones are sufficient. We analysedamino acid concentrations in the UV andUA blood obtained at birth by using high-performance liquid chromatography(HPLC). We examined 31 singleton, full-term neonates appropriate for gestationalage (according to Japanese standards). TheFukuda Hospital Board approved the proto-col of this investigation. Informed consentwas obtained from all the mothers whoparticipated. The mothers underwent sched-uled caesarean sections (for breech position,history of caesarean section, or maternalpreference) and refrained from drinking oreating for at least 6 h before the operation.During the caesarean, the umbilical cord wasdouble-clamped by the obstetrician. UV andUA blood samples were obtained from thissegment of cord and were stored separatelyin test tubes containing ethylenediaminete-traacetic acid. Blood samples were centri-fuged (4uC, 20 min) immediately to removeprecipitated protein. The plasma was sepa-rated after centrifugation and mixed with 2volumes of 5% (w/w) trichloroacetic acid.The samples were kept in a freezer at 280uCuntil they were analysed by HPLC, using an
automatic amino acid analyser (L-8800;Hitachi, Tokyo, Japan).1 Both UV and UAsamples from each neonate were analysed inthe same HPLC run, with a variance of 1.4%.
Figure 1 shows the difference between theUV and UA amino acid concentrations (theumbilical flux) of the neonates. Cetin et al2
compared UV or UA plasma amino acidconcentrations of normal and gestationaldiabetes mellitus (GDM) pregnancies. Inplasma samples of GDM pregnancies, valine,methionine, phenylalanine, isoleucine, leu-cine, ornithine, glutamate, proline, andalanine were increased, whereas glutaminewas markedly decreased. They also showedthat umbilical venoarterial plasma aminoacid differences were not remarkably differ-ent from zero. However, many of the aminoacid flux patterns seen in fig 1 weresignificantly different (p,0.05) and seemedreasonable. All essential amino acids—lysine, valine, leucine, threonine, trypto-phan, histidine, isoleucine, phenylalanineand methionine—showed a positive differ-ence (positive flux). Alanine, which is themost gluconeogenic in fasting, showed thehighest flux. The excessive flow of lysineinto the fetus may be explained by thehypothesis that there is a greater proportionof lysine transporters (cationic amino acidtransporter) on the fetal side of placentathan on the maternal side.3 A negativedifference (negative flux) was seen withglutamic acid, taurine, glycine, etc.Negative flux of glutamic acid and serinemay reflect the fact that these amino acidsare produced in the fetal liver and notsupplied by the placenta.4
Our results confirm the differences inamino acid concentrations between UVand UA blood. Pathological conditions infetuses that may affect the differences in the
Table 1 Mean flow velocities and pulsatility index in the anterior cerebral artery and thelenticulostriate artery during hydrocortisone treatment
Baseline Day 1 Day 3 Day 5 ANOVA
ACA
MFV 18.4 (7.8) 19.0 (8.5) 17.9 (7.3) 18.6 (8.4) 0.17
PI 1.52 (0.37) 1.50 (0.32) 1.53 (0.35) 1.51 (0.43) 0.41
LSA
MFV 8.2 (3.6) 8.4 (2.5) 8.3 (3.0) 8.1 (3.3) 0.30
PI 0.94 (0.25) 0.92 (0.18) 0.94 (0.27) 0.93 (0.22) 0.29
Data are mean (SD). Each data point corresponds to an average of 792 (10) measurements in the ACA and 736 (9)measurements in the LSA. ACA, anterior cerebral artery; ANOVA, repeated-measure analysis of variance; LSA, lenticulostriateartery; MFV, mean flow velocity; PI, pulsatility index.
Figure 1 The umbilical flux of amino acids in fetuses. The umbilical flux denotes the differencebetween the concentration of each amino acid in the umbilical venous blood and the umbilicalarterial blood, in other words, the net uptake of each amino acid into the fetus. The medianvenoarterial difference with 95% confidence interval on either side is shown for each amino acidflux. Hyp, hydroxyproline; aAbu, a-aminobutyric acid; MEA, monoethanolamine.
PostScript
Arch Dis Child Fetal Neonatal Ed March 2009 Vol 94 No 2 F155
on 5 March 2009 fn.bmj.comDownloaded from

amino acid concentrations is an interestingissue for further study on umbilical fluxanalysis. We are developing a system thatallows analysing amino acids with muchsmaller amounts of samples.
H Tsuchiya,1 K Matsui,2 T Muramatsu,3 T Ando,3
F Endo4
1 Department of Pediatrics, Fukuda Hospital, Kumamoto,Japan; 2 Department of Obstetrics, Fukuda Hospital,Kumamoto, Japan; 3 Institute of Life Sciences, AjinomotoCo. Inc., Kawasaki-shi, Japan; 4 Department of Pediatrics,Kumamoto University Graduate School of Medicine,Kumamoto, Japan
Correspondence to: Dr H Tsuchiya, Department ofPediatrics, Fukuda Hospital, Shin-machi 2-2-6, Kumamoto,860-0004 Japan; [email protected]
Competing interests: None.
Accepted 4 September 2008
Arch Dis Child Fetal Neonatal Ed 2009;94:F155–F156.doi:10.1136/adc.2008.147256
REFERENCES1. Noguchi Y, Zhang QW, Sugimoto T, et al. Network
analysis of plasma and tissue amino acids and thegeneration of an amino index for potential diagnosticuse. Am J Clin Nutr 2006;83:S513–19.
2. Cetin I, de Santis MS, Taricco E, et al. Maternal andfetal amino acid concentrations in normal pregnanciesand in pregnancies with gestational diabetes mellitus.Am J Obstet Gynecol 2005;192:610–17.
3. Battaglia FC, Regnault TR Placental transport andmetabolism of amino acids. Placenta 2001;22:145–61.
4. Regnault TR, Friedman JE, Wilkening RB, et al.Fetoplacental transport and utilization of amino acids inIUGR—a review. Placenta 2005;26(Suppl A):S52–62.
Comparison of peripheral andcerebral tissue oxygenation indexin neonatesNear-infrared spectroscopy (NIRS) is a non-invasive method to measure haemoglobinand tissue oxygenation continuously.Measurement of ‘‘cerebral tissue oxygena-tion index’’ (c-TOI)1 and ‘‘peripheral tissueoxygenation index’’ (p-TOI)2 is based onspatially resolved spectroscopy (SRS). SRS isrealised with one light detector havingsensors at different distances. The aim ofthe present study was to measure c-TOI andp-TOI simultaneously to compare the twovalues.
NIRS measurements were carried out in20 term and preterm infants (gestational age.29 weeks and birth weight .1200 g)within the first 8 weeks after birth. At timeof measurements the infants had to beclinically stable, without any cardiorespira-tory support. The measurements were car-ried out with the NIRO-300 (Hamamatsu,Japan). Near-infrared light was transmittedthrough the left frontoparietal side of thehead (interoptode distance of 4 cm) and theleft lateral calf (interoptode distance of3 cm). Measurements were performed dur-ing undisturbed daytime sleep after a feed.The infants were lying in a horizontalposition with the calf positioned just above
the mid-sternum. To increase the precision1
the optodes were reapplied five times. Aftereach application there was a rest period of atleast 3 min and repeated measurementslasting 20 s each were performed five times.
Heart rate and arterial oxygen saturationwere measured by pulse oximetry. Centraland peripheral temperatures and mean bloodpressure were measured before and afterNIRS measurements. Diameter of calf andsubcutaneous adipose tissue were measuredwith ultrasound. c-TOI and p-TOI weredetermined as mean values of the repeatedmeasurements in each newborn and com-pared using paired t test. Data are presentedas mean (SD).
Demographic and clinical characteristicsof the infants at time of measurements arepresented in table 1. At time of measure-ment all infants had a weight .2000 g. Ofthe 500 measurements (25 in each neonate)135 measurements were excluded because ofbody movements causing artefacts. c-TOIwas significantly higher than p-TOI (70.4%(6.7) vs 62.1% (5.7), respectively; p,0.001)(fig 1). The c-TOI/p-TOI ratio was 1.14¡
0.14.This is the first report of comparison of
simultaneously measured c-TOI and p-TOIin healthy term and preterm infants, andtherefore, the present study is the first tointroduce an index (c-TOI/p-TOI ratio).
We found that our values for c-TOI and p-TOI were similar to recent studies.1 2 Theremay be several reasons for differencesbetween c-TOI and p-TOI. Differences inthe ratio of the three vascular compartments(arterial:capillary:venous) in muscle andbrain can influence the results. Within themuscle, the estimated ratio is 10%:20%:70%,respectively.3 In the brain, the mean arter-ial:venous ratio is thought to be 16:84.4
Furthermore, cerebral autoregulation of oxy-gen delivery may also have an importantrole.
Simultaneous measurements and compar-isons of c-TOI and p-TOI might help infuture to detect early disturbances in circu-lation and oxygenation, especially in statesof shock. Further studies should address
comparison of c-TOI and p-TOI in compro-mised infants.
K Grossauer, G Pichler, G Schmolzer, H Zotter,W Mueller, B Urlesberger
Division of Neonatology, Department of Pediatrics, MedicalUniversity of Graz, Austria
Correspondence to: Dr G Pichler, Division of Neonatology,Department of Pediatrics, University of Graz,Auenbruggerplatz 30, A-8036 Graz, Austria; [email protected]
Acknowledgements: The authors would like to thankE Ziehenberger for her assistance.
Competing interests: None.
Accepted 4 September 2008
Arch Dis Child Fetal Neonatal Ed 2009;94:F156.doi:10.1136/adc.2008.146654
REFERENCES1. Sorensen LC, Greisen G. Precision of measurement of
cerebral tissue oxygenation index using near-infraredspectroscopy in preterm neonates. J Biomed Opt2006;11:054005.
2. Pichler G, Grossauer K, Klaritsch P, et al. Peripheraloxygenation in term neonates. Arch Dis Child FetalNeonatal Ed 2007;92:F51–52.
3. Boushel R, Langberg H, Olesen J, et al. Monitoringtissue oxygen availability with near infraredspectroscopy (NIRS) in health and disease.Scand J Med Sci Sports 2001;11:213–222.
4. Watzman H, Kurth C, Montenegro L, et al. Arterial andvenous contributions to near-infrared cerebral oximetry.Anesthesiology 2000;93:947–53.
CORRECTION
doi:10.1136/adc.2006.105577corr1
S H Dijkstra, A van Beek, J W Janssen, et al.High prevalence of vitamin D deficiency innewborns of high-risk mothers. This articlewas published in print in Archives of Diseasein Childhood (Arch Dis Child 2007;92:750–3)but was in fact an article for the Fetal &Neonatal edition.
Figure 1 Comparison of cerebral and periph-eral ‘‘tissue oxygenation index’’ (c-TOI and p-TOI) in 20 healthy newborn infants.
Table 1 Demographic and clinicalcharacteristics of the 20 infants at time ofmeasurement*
Neonates 20
Male to female ratio 13/7
Gestational age (weeks) 35 (3.8)
Age (days) 16 (18)
Actual weight (g) 2418 (616)
Mean arterial pressure (mm Hg) 46.1 (8.5)
Heart rate/min 133 (13)
Arterial oxygen saturation (%) 96.0 (2.5)
Haemoglobin concentration (g/l) 129 (20)
Temperature rectal (uC) 36.8 (0.5)
Temperature peripheral (uC) 34.5 (0.9)
Calf circumference (cm) 9.4 (1.1)
Thigh circumference (cm) 12.5 (1.9)
Calf diameter (cm) 3.1 (0.3)
Calf subcutaneous adipose tissue (cm) 0.3 (0.1)
*Values are mean (SD) except number of neonates and themale to female ratio.
PostScript
F156 Arch Dis Child Fetal Neonatal Ed March 2009 Vol 94 No 2
on 5 March 2009 fn.bmj.comDownloaded from

doi:10.1136/adc.2008.146654 2009;94;F156 Arch. Dis. Child. Fetal Neonatal Ed.
K Grossauer, G Pichler, G Schmölzer, H Zotter, W Mueller and B Urlesberger
oxygenation index in neonatesComparison of peripheral and cerebral tissue
http://fn.bmj.com/cgi/content/full/94/2/F156Updated information and services can be found at:
These include:
References
http://fn.bmj.com/cgi/content/full/94/2/F156#BIBL
This article cites 4 articles, 1 of which can be accessed free at:
Rapid responses http://fn.bmj.com/cgi/eletter-submit/94/2/F156
You can respond to this article at:
serviceEmail alerting
the top right corner of the article Receive free email alerts when new articles cite this article - sign up in the box at
Notes
http://journals.bmj.com/cgi/reprintformTo order reprints of this article go to:
http://journals.bmj.com/subscriptions/ go to: Archives of Disease in Childhood - Fetal and Neonatal EditionTo subscribe to
on 5 March 2009 fn.bmj.comDownloaded from

amino acid concentrations is an interestingissue for further study on umbilical fluxanalysis. We are developing a system thatallows analysing amino acids with muchsmaller amounts of samples.
H Tsuchiya,1 K Matsui,2 T Muramatsu,3 T Ando,3
F Endo4
1 Department of Pediatrics, Fukuda Hospital, Kumamoto,Japan; 2 Department of Obstetrics, Fukuda Hospital,Kumamoto, Japan; 3 Institute of Life Sciences, AjinomotoCo. Inc., Kawasaki-shi, Japan; 4 Department of Pediatrics,Kumamoto University Graduate School of Medicine,Kumamoto, Japan
Correspondence to: Dr H Tsuchiya, Department ofPediatrics, Fukuda Hospital, Shin-machi 2-2-6, Kumamoto,860-0004 Japan; [email protected]
Competing interests: None.
Accepted 4 September 2008
Arch Dis Child Fetal Neonatal Ed 2009;94:F155–F156.doi:10.1136/adc.2008.147256
REFERENCES1. Noguchi Y, Zhang QW, Sugimoto T, et al. Network
analysis of plasma and tissue amino acids and thegeneration of an amino index for potential diagnosticuse. Am J Clin Nutr 2006;83:S513–19.
2. Cetin I, de Santis MS, Taricco E, et al. Maternal andfetal amino acid concentrations in normal pregnanciesand in pregnancies with gestational diabetes mellitus.Am J Obstet Gynecol 2005;192:610–17.
3. Battaglia FC, Regnault TR Placental transport andmetabolism of amino acids. Placenta 2001;22:145–61.
4. Regnault TR, Friedman JE, Wilkening RB, et al.Fetoplacental transport and utilization of amino acids inIUGR—a review. Placenta 2005;26(Suppl A):S52–62.
Comparison of peripheral andcerebral tissue oxygenation indexin neonatesNear-infrared spectroscopy (NIRS) is a non-invasive method to measure haemoglobinand tissue oxygenation continuously.Measurement of ‘‘cerebral tissue oxygena-tion index’’ (c-TOI)1 and ‘‘peripheral tissueoxygenation index’’ (p-TOI)2 is based onspatially resolved spectroscopy (SRS). SRS isrealised with one light detector havingsensors at different distances. The aim ofthe present study was to measure c-TOI andp-TOI simultaneously to compare the twovalues.
NIRS measurements were carried out in20 term and preterm infants (gestational age.29 weeks and birth weight .1200 g)within the first 8 weeks after birth. At timeof measurements the infants had to beclinically stable, without any cardiorespira-tory support. The measurements were car-ried out with the NIRO-300 (Hamamatsu,Japan). Near-infrared light was transmittedthrough the left frontoparietal side of thehead (interoptode distance of 4 cm) and theleft lateral calf (interoptode distance of3 cm). Measurements were performed dur-ing undisturbed daytime sleep after a feed.The infants were lying in a horizontalposition with the calf positioned just above
the mid-sternum. To increase the precision1
the optodes were reapplied five times. Aftereach application there was a rest period of atleast 3 min and repeated measurementslasting 20 s each were performed five times.
Heart rate and arterial oxygen saturationwere measured by pulse oximetry. Centraland peripheral temperatures and mean bloodpressure were measured before and afterNIRS measurements. Diameter of calf andsubcutaneous adipose tissue were measuredwith ultrasound. c-TOI and p-TOI weredetermined as mean values of the repeatedmeasurements in each newborn and com-pared using paired t test. Data are presentedas mean (SD).
Demographic and clinical characteristicsof the infants at time of measurements arepresented in table 1. At time of measure-ment all infants had a weight .2000 g. Ofthe 500 measurements (25 in each neonate)135 measurements were excluded because ofbody movements causing artefacts. c-TOIwas significantly higher than p-TOI (70.4%(6.7) vs 62.1% (5.7), respectively; p,0.001)(fig 1). The c-TOI/p-TOI ratio was 1.14¡
0.14.This is the first report of comparison of
simultaneously measured c-TOI and p-TOIin healthy term and preterm infants, andtherefore, the present study is the first tointroduce an index (c-TOI/p-TOI ratio).
We found that our values for c-TOI and p-TOI were similar to recent studies.1 2 Theremay be several reasons for differencesbetween c-TOI and p-TOI. Differences inthe ratio of the three vascular compartments(arterial:capillary:venous) in muscle andbrain can influence the results. Within themuscle, the estimated ratio is 10%:20%:70%,respectively.3 In the brain, the mean arter-ial:venous ratio is thought to be 16:84.4
Furthermore, cerebral autoregulation of oxy-gen delivery may also have an importantrole.
Simultaneous measurements and compar-isons of c-TOI and p-TOI might help infuture to detect early disturbances in circu-lation and oxygenation, especially in statesof shock. Further studies should address
comparison of c-TOI and p-TOI in compro-mised infants.
K Grossauer, G Pichler, G Schmolzer, H Zotter,W Mueller, B Urlesberger
Division of Neonatology, Department of Pediatrics, MedicalUniversity of Graz, Austria
Correspondence to: Dr G Pichler, Division of Neonatology,Department of Pediatrics, University of Graz,Auenbruggerplatz 30, A-8036 Graz, Austria; [email protected]
Acknowledgements: The authors would like to thankE Ziehenberger for her assistance.
Competing interests: None.
Accepted 4 September 2008
Arch Dis Child Fetal Neonatal Ed 2009;94:F156.doi:10.1136/adc.2008.146654
REFERENCES1. Sorensen LC, Greisen G. Precision of measurement of
cerebral tissue oxygenation index using near-infraredspectroscopy in preterm neonates. J Biomed Opt2006;11:054005.
2. Pichler G, Grossauer K, Klaritsch P, et al. Peripheraloxygenation in term neonates. Arch Dis Child FetalNeonatal Ed 2007;92:F51–52.
3. Boushel R, Langberg H, Olesen J, et al. Monitoringtissue oxygen availability with near infraredspectroscopy (NIRS) in health and disease.Scand J Med Sci Sports 2001;11:213–222.
4. Watzman H, Kurth C, Montenegro L, et al. Arterial andvenous contributions to near-infrared cerebral oximetry.Anesthesiology 2000;93:947–53.
CORRECTION
doi:10.1136/adc.2006.105577corr1
S H Dijkstra, A van Beek, J W Janssen, et al.High prevalence of vitamin D deficiency innewborns of high-risk mothers. This articlewas published in print in Archives of Diseasein Childhood (Arch Dis Child 2007;92:750–3)but was in fact an article for the Fetal &Neonatal edition.
Figure 1 Comparison of cerebral and periph-eral ‘‘tissue oxygenation index’’ (c-TOI and p-TOI) in 20 healthy newborn infants.
Table 1 Demographic and clinicalcharacteristics of the 20 infants at time ofmeasurement*
Neonates 20
Male to female ratio 13/7
Gestational age (weeks) 35 (3.8)
Age (days) 16 (18)
Actual weight (g) 2418 (616)
Mean arterial pressure (mm Hg) 46.1 (8.5)
Heart rate/min 133 (13)
Arterial oxygen saturation (%) 96.0 (2.5)
Haemoglobin concentration (g/l) 129 (20)
Temperature rectal (uC) 36.8 (0.5)
Temperature peripheral (uC) 34.5 (0.9)
Calf circumference (cm) 9.4 (1.1)
Thigh circumference (cm) 12.5 (1.9)
Calf diameter (cm) 3.1 (0.3)
Calf subcutaneous adipose tissue (cm) 0.3 (0.1)
*Values are mean (SD) except number of neonates and themale to female ratio.
PostScript
F156 Arch Dis Child Fetal Neonatal Ed March 2009 Vol 94 No 2
on 5 March 2009 fn.bmj.comDownloaded from

doi:10.1136/adc.2006.105577corr1 2009;94;F156 Arch. Dis. Child. Fetal Neonatal Ed.
CORRECTION
http://fn.bmj.com/cgi/content/full/94/2/F156-aUpdated information and services can be found at:
These include:
Rapid responses http://fn.bmj.com/cgi/eletter-submit/94/2/F156-a
You can respond to this article at:
serviceEmail alerting
the top right corner of the article Receive free email alerts when new articles cite this article - sign up in the box at
Notes
http://journals.bmj.com/cgi/reprintformTo order reprints of this article go to:
http://journals.bmj.com/subscriptions/ go to: Archives of Disease in Childhood - Fetal and Neonatal EditionTo subscribe to
on 5 March 2009 fn.bmj.comDownloaded from
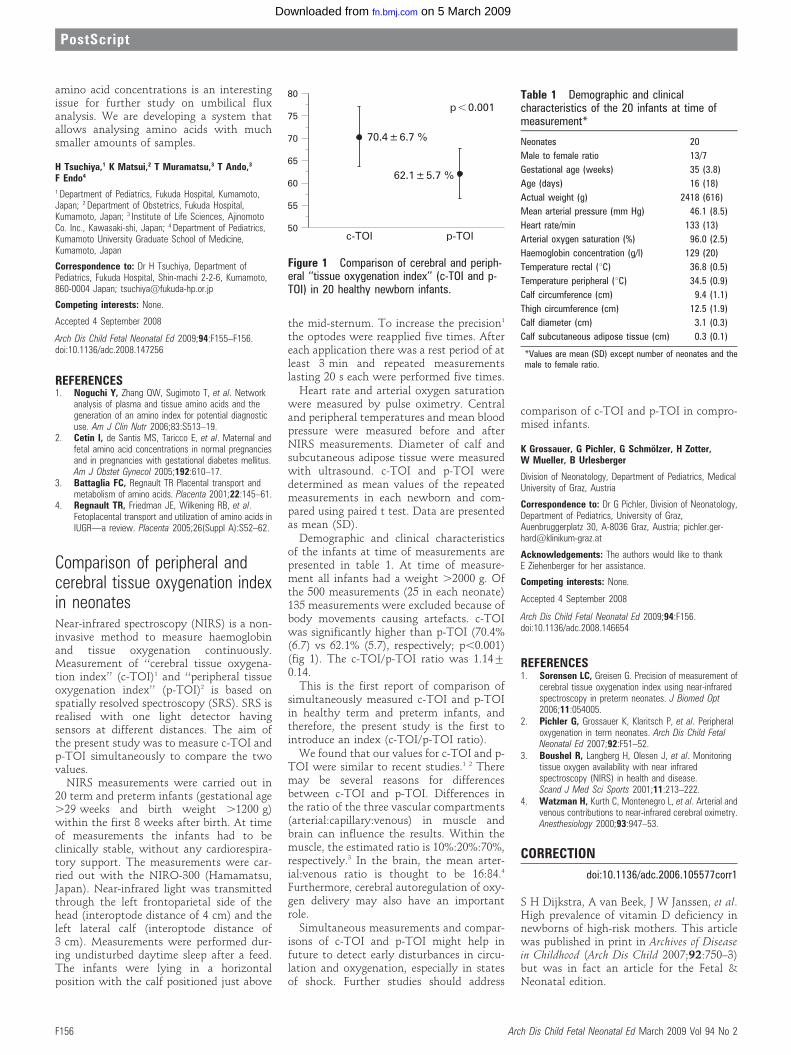
amino acid concentrations is an interestingissue for further study on umbilical fluxanalysis. We are developing a system thatallows analysing amino acids with muchsmaller amounts of samples.
H Tsuchiya,1 K Matsui,2 T Muramatsu,3 T Ando,3
F Endo4
1 Department of Pediatrics, Fukuda Hospital, Kumamoto,Japan; 2 Department of Obstetrics, Fukuda Hospital,Kumamoto, Japan; 3 Institute of Life Sciences, AjinomotoCo. Inc., Kawasaki-shi, Japan; 4 Department of Pediatrics,Kumamoto University Graduate School of Medicine,Kumamoto, Japan
Correspondence to: Dr H Tsuchiya, Department ofPediatrics, Fukuda Hospital, Shin-machi 2-2-6, Kumamoto,860-0004 Japan; [email protected]
Competing interests: None.
Accepted 4 September 2008
Arch Dis Child Fetal Neonatal Ed 2009;94:F155–F156.doi:10.1136/adc.2008.147256
REFERENCES1. Noguchi Y, Zhang QW, Sugimoto T, et al. Network
analysis of plasma and tissue amino acids and thegeneration of an amino index for potential diagnosticuse. Am J Clin Nutr 2006;83:S513–19.
2. Cetin I, de Santis MS, Taricco E, et al. Maternal andfetal amino acid concentrations in normal pregnanciesand in pregnancies with gestational diabetes mellitus.Am J Obstet Gynecol 2005;192:610–17.
3. Battaglia FC, Regnault TR Placental transport andmetabolism of amino acids. Placenta 2001;22:145–61.
4. Regnault TR, Friedman JE, Wilkening RB, et al.Fetoplacental transport and utilization of amino acids inIUGR—a review. Placenta 2005;26(Suppl A):S52–62.
Comparison of peripheral andcerebral tissue oxygenation indexin neonatesNear-infrared spectroscopy (NIRS) is a non-invasive method to measure haemoglobinand tissue oxygenation continuously.Measurement of ‘‘cerebral tissue oxygena-tion index’’ (c-TOI)1 and ‘‘peripheral tissueoxygenation index’’ (p-TOI)2 is based onspatially resolved spectroscopy (SRS). SRS isrealised with one light detector havingsensors at different distances. The aim ofthe present study was to measure c-TOI andp-TOI simultaneously to compare the twovalues.
NIRS measurements were carried out in20 term and preterm infants (gestational age.29 weeks and birth weight .1200 g)within the first 8 weeks after birth. At timeof measurements the infants had to beclinically stable, without any cardiorespira-tory support. The measurements were car-ried out with the NIRO-300 (Hamamatsu,Japan). Near-infrared light was transmittedthrough the left frontoparietal side of thehead (interoptode distance of 4 cm) and theleft lateral calf (interoptode distance of3 cm). Measurements were performed dur-ing undisturbed daytime sleep after a feed.The infants were lying in a horizontalposition with the calf positioned just above
the mid-sternum. To increase the precision1
the optodes were reapplied five times. Aftereach application there was a rest period of atleast 3 min and repeated measurementslasting 20 s each were performed five times.
Heart rate and arterial oxygen saturationwere measured by pulse oximetry. Centraland peripheral temperatures and mean bloodpressure were measured before and afterNIRS measurements. Diameter of calf andsubcutaneous adipose tissue were measuredwith ultrasound. c-TOI and p-TOI weredetermined as mean values of the repeatedmeasurements in each newborn and com-pared using paired t test. Data are presentedas mean (SD).
Demographic and clinical characteristicsof the infants at time of measurements arepresented in table 1. At time of measure-ment all infants had a weight .2000 g. Ofthe 500 measurements (25 in each neonate)135 measurements were excluded because ofbody movements causing artefacts. c-TOIwas significantly higher than p-TOI (70.4%(6.7) vs 62.1% (5.7), respectively; p,0.001)(fig 1). The c-TOI/p-TOI ratio was 1.14¡
0.14.This is the first report of comparison of
simultaneously measured c-TOI and p-TOIin healthy term and preterm infants, andtherefore, the present study is the first tointroduce an index (c-TOI/p-TOI ratio).
We found that our values for c-TOI and p-TOI were similar to recent studies.1 2 Theremay be several reasons for differencesbetween c-TOI and p-TOI. Differences inthe ratio of the three vascular compartments(arterial:capillary:venous) in muscle andbrain can influence the results. Within themuscle, the estimated ratio is 10%:20%:70%,respectively.3 In the brain, the mean arter-ial:venous ratio is thought to be 16:84.4
Furthermore, cerebral autoregulation of oxy-gen delivery may also have an importantrole.
Simultaneous measurements and compar-isons of c-TOI and p-TOI might help infuture to detect early disturbances in circu-lation and oxygenation, especially in statesof shock. Further studies should address
comparison of c-TOI and p-TOI in compro-mised infants.
K Grossauer, G Pichler, G Schmolzer, H Zotter,W Mueller, B Urlesberger
Division of Neonatology, Department of Pediatrics, MedicalUniversity of Graz, Austria
Correspondence to: Dr G Pichler, Division of Neonatology,Department of Pediatrics, University of Graz,Auenbruggerplatz 30, A-8036 Graz, Austria; [email protected]
Acknowledgements: The authors would like to thankE Ziehenberger for her assistance.
Competing interests: None.
Accepted 4 September 2008
Arch Dis Child Fetal Neonatal Ed 2009;94:F156.doi:10.1136/adc.2008.146654
REFERENCES1. Sorensen LC, Greisen G. Precision of measurement of
cerebral tissue oxygenation index using near-infraredspectroscopy in preterm neonates. J Biomed Opt2006;11:054005.
2. Pichler G, Grossauer K, Klaritsch P, et al. Peripheraloxygenation in term neonates. Arch Dis Child FetalNeonatal Ed 2007;92:F51–52.
3. Boushel R, Langberg H, Olesen J, et al. Monitoringtissue oxygen availability with near infraredspectroscopy (NIRS) in health and disease.Scand J Med Sci Sports 2001;11:213–222.
4. Watzman H, Kurth C, Montenegro L, et al. Arterial andvenous contributions to near-infrared cerebral oximetry.Anesthesiology 2000;93:947–53.
CORRECTION
doi:10.1136/adc.2006.105577corr1
S H Dijkstra, A van Beek, J W Janssen, et al.High prevalence of vitamin D deficiency innewborns of high-risk mothers. This articlewas published in print in Archives of Diseasein Childhood (Arch Dis Child 2007;92:750–3)but was in fact an article for the Fetal &Neonatal edition.
Figure 1 Comparison of cerebral and periph-eral ‘‘tissue oxygenation index’’ (c-TOI and p-TOI) in 20 healthy newborn infants.
Table 1 Demographic and clinicalcharacteristics of the 20 infants at time ofmeasurement*
Neonates 20
Male to female ratio 13/7
Gestational age (weeks) 35 (3.8)
Age (days) 16 (18)
Actual weight (g) 2418 (616)
Mean arterial pressure (mm Hg) 46.1 (8.5)
Heart rate/min 133 (13)
Arterial oxygen saturation (%) 96.0 (2.5)
Haemoglobin concentration (g/l) 129 (20)
Temperature rectal (uC) 36.8 (0.5)
Temperature peripheral (uC) 34.5 (0.9)
Calf circumference (cm) 9.4 (1.1)
Thigh circumference (cm) 12.5 (1.9)
Calf diameter (cm) 3.1 (0.3)
Calf subcutaneous adipose tissue (cm) 0.3 (0.1)
*Values are mean (SD) except number of neonates and themale to female ratio.
PostScript
F156 Arch Dis Child Fetal Neonatal Ed March 2009 Vol 94 No 2
on 5 March 2009 fn.bmj.comDownloaded from

2009;94;F79 Arch. Dis. Child. Fetal Neonatal Ed. Martin Ward Platt
Fantoms
http://fn.bmj.com/cgi/content/full/94/2/F79Updated information and services can be found at:
These include:
References
http://fn.bmj.com/cgi/content/full/94/2/F79#BIBL
This article cites 2 articles, 1 of which can be accessed free at:
Rapid responses http://fn.bmj.com/cgi/eletter-submit/94/2/F79
You can respond to this article at:
serviceEmail alerting
the top right corner of the article Receive free email alerts when new articles cite this article - sign up in the box at
Notes
http://journals.bmj.com/cgi/reprintformTo order reprints of this article go to:
http://journals.bmj.com/subscriptions/ go to: Archives of Disease in Childhood - Fetal and Neonatal EditionTo subscribe to
on 5 March 2009 fn.bmj.comDownloaded from

Fantoms
Martin Ward Platt, Deputy Editor
Safety culture and the NICUOver recent years, we have carried anumber of papers examining rates ofadverse events in babies receiving inten-sive care. These have contained salutaryreminders of the possible harms that canhappen, and their frequency, but theyhave been less helpful in terms of gen-erating and testing practical measures bywhich errors might be reduced. We wouldall sign up to the laudable aims of bettereducation, tight and simple systems, andclose monitoring of errors and learningfrom them when they occur, but eventhese do not reduce rates of error as far aswe would all wish. So it is particularlyvaluable to have the paper by Lee et albearing a very positive message by report-ing the application of structured randomsafety audits (a system widely used inindustry) to the NICU setting. In short: itdemonstrably works, and other unitsshould give serious consideration to emu-lating this system. See page F116
Feeding and NECYou might have thought that the manypublished case control studies investigat-ing risks for necrotising enterocolitiswould have said everything that there isto say on the subject. Not so. Hendersonet al, while confirming both that breastfeeding was protective and starting earlytrophic feeding was not associated withany increased risk, found that higher ratesof increase of enteral feeding (with bothshorter duration of trophic feeds andearlier attainment of full feeds), wasassociated with increased risk. The chal-lenge is now to design a simple pragmatictrial comparing two different rates ofincrease in enteral feeds, with NEC freesurvival as the endpoint. Since NEC is
uncommon the trial would need to belarge, but the question is important. Seepage F120
ECMO in the UKExtracorporeal membrane oxygenationhas now been an established mode oftherapy in the UK since the findings ofthe UK trial were published in 19961, yetlast year we carried a paper showing thatthere was still unexplained differentialreferral of babies for ECMO in the UK,begging the question as to whether allneonatologists are equally well informedabout the potential benefits of ECMOtherapy2. This month, Karimova et alreport the results of ECMO from the UKregistry for its first thirteen years, withoutcomes very similar to those achieved inreports from around the world. This isgood news, and should stimulate clin-icians who may be reluctant to considerreferral for ECMO to reconsider. See pageF129
Developmental care through alooking glass‘‘When I use a word,’’ Humpty Dumptysaid, in rather a scornful tone, ‘‘it meanswhat I choose it to mean—neither morenor less.’’ 3 So with ‘developmental care’.Maguire et al have shown that when youchoose it to mean incubator covers andnesting, there is no demonstrable bene-ficial effect on babies’ outcomes. This isinteresting as far as it goes, but we shouldbe careful. First, as the authors acknowl-edge, this does not invalidate or contradictthe studies demonstrating beneficialeffects of more integrated and extensivedevelopmental care (eg NIDCAP). Second,it does not mean that the babies did not
have a ‘better’, or more pleasant, NICUexperience—it just means that thisdimension could not be measured usingthe rather crude tools at our disposal formeasuring outcomes. The last word onthis has to go to Lewis Carroll again:‘‘Contrariwise,’’ continued Tweedledee,‘‘if it was so, it might be; and if it wereso, it would be; but as it isn’t, it ain’t.That’s logic.’’ 3 See page F92
Prone versus supineHow times have changed. The paper bySaiki et al demonstrates that the proneposition has clear benefits in terms ofrespiratory function for preterm babiesstudied at around 36 weeks postmenstrualage. Thirty years ago such data wouldhave been taken as good evidence that ex-prem babies would be ‘safer’ nursed pronethan supine, and doubtless even morewould have gone home with strictinstructions to their parents to put themdown to sleep on their tummies. Howwrong we would have been (indeed, howwrong we were). Now, in the light ofmore sophisticated knowledge, we turnthese results on their head, and concludethat relative impairment of lung functionis not the reason that ex-prem babies are athigher risk of sudden unexplained deathwhen placed prone, rather than supine,for sleep. See page F133
References1. UK Collaborative ECMO Trial Group. UK
collaborative randomised trial of neonatalextracorporeal membrane oxygenation. Lancet1996;348:75–82.
2. Tiruvoipati R, Pandya H, Manktelow B, et al.Referral pattern of neonates with severerespiratory failure for extracorporeal membraneoxygenation. Arch Dis Child Fetal Neonatal Ed2008;93:F104–F107.
3. Carroll L. Through the Looking-Glass, and What AliceFound There. London: Macmillan; 1871.
Arch Dis Child Fetal Neonatal Ed March 2009 Vol 94 No 2 F79
on 5 March 2009 fn.bmj.comDownloaded from

doi:10.1136/adc.2007.123679 1 Aug 2008;
2009;94;F80-F83; originally published onlineArch. Dis. Child. Fetal Neonatal Ed. S Gupta, S K Sinha and S M Donn
ventilation in preterm infantsventilation on tidal volume delivery and minute The effect of two levels of pressure support
http://fn.bmj.com/cgi/content/full/94/2/F80Updated information and services can be found at:
These include:
References
http://fn.bmj.com/cgi/content/full/94/2/F80#BIBL
This article cites 14 articles, 4 of which can be accessed free at:
Rapid responses http://fn.bmj.com/cgi/eletter-submit/94/2/F80
You can respond to this article at:
serviceEmail alerting
the top right corner of the article Receive free email alerts when new articles cite this article - sign up in the box at
Notes
http://journals.bmj.com/cgi/reprintformTo order reprints of this article go to:
http://journals.bmj.com/subscriptions/ go to: Archives of Disease in Childhood - Fetal and Neonatal EditionTo subscribe to
on 5 March 2009 fn.bmj.comDownloaded from

The effect of two levels of pressure supportventilation on tidal volume delivery and minuteventilation in preterm infants
S Gupta,1 S K Sinha,2 S M Donn3
1 University Hospital of NorthTees, Stockton-on-Tees, UK;2 University of Durham, TheJames Cook University Hospital,Middlesbrough, UK; 3 Division ofNeonatal-Perinatal Medicine, C.S. Mott Children’s Hospital,University of Michigan HealthSystem, Ann Arbor, Michigan,USA; [email protected]
Correspondence to:Sunil K Sinha, Professor ofPaediatrics, University ofDurham, Consultant inPaediatrics and NeonatalMedicine, The James CookUniversity Hospital,Middlesbrough, UK; [email protected]
Accepted 3 July 2008Published Online First1 August 2008
ABSTRACTObjective: To study the effect of different levels ofpressure support ventilation (PSV) on respiratory para-meters in preterm infants during the weaning phase ofmechanical ventilation.Design/methods: In this quasi-experimental crossoverstudy, a total of 19 154 breaths were analysed from 10ventilated infants of ,32 weeks’ gestation. Breath-to-breath data on minute ventilation, tidal volume, respiratoryrate, peak inspiratory pressure and mean airway pressurewere collected during three study epochs: synchronisedintermittent mandatory ventilation (SIMV) alone, SIMVwith partial PSV (PSmin), and SIMV with full PSV (PSmax).PSmin was set to provide an exhaled tidal volume (VTe)between 2.5–4 ml/kg and PSmax 5–8 ml/kg VTe.Statistical analyses were performed using analysis ofvariance (ANOVA) for repeated measures.Results: The addition of full PSV (PSmax) was associated witha significant increase in total minute ventilation as comparedwith SIMV alone (392 ml/kg/min vs 270 ml/kg/min,respectively; p,0.05). This difference in minute ventilationwas still present when PSmin was used (332 ml/kg/min ascompared with 270 ml/kg/min in SIMV; p,0.05). There wasalso a concomitant decrease in the respiratory rate with bothPSmax (59 breaths per minute) and PSmin (65 breaths perminute) compared with SIMV alone (72 breaths per min)(p,0.05).Conclusions: Pressure support ventilation increases totalminute ventilation and stabilises breathing in proportion tothe level of pressure support used. This may beadvantageous and provide a useful ventilation strategy foruse during weaning stages of mechanical ventilation inpreterm infants.
Pressure support ventilation (PSV) is a ventilatorymodality in which patients’ spontaneous breathsare supported by an inspiratory pressure ‘‘boost’’above the baseline pressure. This is designed todecrease the imposed work of breathing created bythe narrow lumen endotracheal tube and ventilatorcircuit, and to facilitate weaning. It is a form ofpatient-triggered ventilation, which can be usedeither alone in patients with reliable respiratorydrive or in conjunction with other modes ofventilation in patients who have poor or unreliablerespiratory drive. When used in conjunction withsynchronised intermittent mandatory ventilation(SIMV) either in pressure- or volume-targetedmodalities, PSV augments the tidal volume gener-ated by a patient’s own spontaneous breathing.
The three distinct characteristics of PSV are: (1)triggering; (2) pressurisation; and (3) cycling,which are accomplished using changes in airway
flow (fig 1).1 There are important differencesbetween PSV and traditional time-cycled, pres-sure-limited (TCPL) ventilation. In TCPL, circuitgas flow is fixed and the inspiratory time is set bythe clinician, whereas in PSV, inspiratory gas flowis variable and is proportional to patient demand.The inspiratory phase in PSV is flow-cycled, andinspiration ends when flow has decelerated to asmall percentage of peak. Because of the ability tocontrol inspiratory time and rate, synchronisationoccurs during both the inspiratory and expiratoryphases. Thus, patients have control of how much tobreathe (inspiratory flow and tidal volume) and forhow long to breathe (inspiratory time), thus mimick-ing physiological breathing.2
PSV has been shown to reduce the work ofbreathing and oxygen requirement in intubatedadult and paediatric patients.3 4 There is noconsensus as to what the most appropriate levelof PSV is in neonatal patients. A recent study byOsorio et al5 reported the effect of two levels ofpressure support as an adjunct to SIMV inventilated premature infants. They chose arbitrarylevels of pressure support (3 and 6 cm H2O) andweaned babies by decreasing the SIMV rate. Astidal volume delivery was not targeted in thisstudy, the interpretation about the effectiveness ofpressure support becomes difficult, especially at thelower level, which might not have been sufficient
What is already known on this topic
c Pressure support ventilation (PSV) supportsspontaneous breaths by providing pressureboost and thus should decrease the work ofbreathing.
c Patients have control on how much to breathand for how long to breathe.
c PSV has been described in adult and paediatricintensive care but the data regarding its use inthe neonatal population are limited.
What this study adds
c Pressure support ventilation increases totalminute ventilation and stabilises the breathingpattern in preterm infants.
c The increase in respiratory efficiency isproportional to the level of pressure support-provided ventilation.
Original article
F80 Arch Dis Child Fetal Neonatal Ed 2009;94:F80–F83. doi:10.1136/adc.2007.123679
on 5 March 2009 fn.bmj.comDownloaded from

to generate effective tidal volume delivery. In another publishedstudy, Migliori et al6 targeted the exhaled tidal volume (VTe)delivery only at 6 ml/kg and did not study the effect of differentlevels of PSV.
In the present study, we assessed the effects of two differentlevels of pressure support: full pressure support or partialpressure support (PSmax and PSmin, respectively) on respiratoryparameters, and compared their effectiveness in relation toSIMV during weaning from mechanical ventilation in preterminfants.
PATIENTS AND METHODSThis was a quasi-experimental study design, crossover trial,carried on the Neonatal Unit at James Cook UniversityHospital, Middlesbrough, UK. The study was part of anongoing, randomised, controlled trial, which was approved bythe Institutional Review Board, and written informed consentwas obtained from each parent prior to study entry. Babies,32 weeks’ gestation and receiving assisted ventilation forrespiratory distress syndrome (RDS) were eligible for enrolmentduring the recovery phase. To meet entry criteria, the meanairway pressure (mean Paw) had to be ,10 cm H2O, andfraction of inspired oxygen (FiO2) ,0.4. All infants receivedcaffeine citrate (20 mg/kg loading, 5 mg/kg/day maintenancedose) at entry into the study, and demonstrated reliablerespiratory drive, defined as a spontaneous respiratory rate atleast 25% higher than the ventilator rate.6 Newborns withsystemic or thoracic malformations, neuromuscular diseases, orthoracic air leaks were not eligible for inclusion.
According to a standardised unit protocol, all babies wereventilated with the AveaH ventilator (Viasys Healthcare, YorbaLinda, California, USA) using either TCPL or volume-controlled(VC) ventilation. At entry into the trial, they were on low-rateSIMV (20 breaths/min), combined with PSV. The peakinspiratory pressure for SIMV breaths was set between 12 and16 cm H2O to provide a VTe of 5–8 ml/kg.
Both the mechanical and spontaneous respiratory parameterswere displayed on the digital interface graphic monitor. TheMedical Information Bus (MIB) interface from the monitor wasused to download continuous breath-to-breath data to a securecomputer using a proprietary ‘‘GSP Interface Kit’’ and researchtool software (Viasys Healthcare, Yorba Linda, California,USA). These data were then exported to a spreadsheet
(Microsoft Excel, Microsoft Corp., Redmond, Washington) forfurther analyses.
Babies were randomly assigned to one of the three studymodes for 30-minute epochs — SIMV, SIMV with partial PSV(PSmin) or SIMV with full PSV (PSmax), and then switched toanother study mode in a random order. PSmax was targeted todeliver a VTe of 5–8 ml/kg to match the SIMV breaths, andPSmin was adjusted to deliver 2.5–4 ml/kg VTe. The mandatorymachine breaths in all three study modes were kept at 20breaths per minute. The spontaneous breaths in babies receivingSIMV alone were supported only with PEEP. When pressuresupport was added the same spontaneous breaths were eitherhalf or fully supported to become partial PSV or full PSV,respectively. This allowed us to compare the effect of differentlevels of pressure support by augmenting the spontaneousbreaths and comparing across the study groups.
Real-time breath-to-breath pulmonary mechanics data werecollected during each study epoch. This included inspired tidalvolume (VTi) and VTe, spontaneous and total minute ventila-tion (Ve), total respiratory rate (spontaneous plus mechanicalbreaths, RR), FiO2, and peak inspiratory pressure (PIP). A re-equilibration period of 15 minutes was used between theepochs. In order to avoid spill-over from the previous mode,10 minutes of artefact-free data were extracted from the latterhalf of each epoch, and subsequently integrated for analysis.The demographic data for gender, gestational age, postnatal age,and weight at birth and at study entry were recorded for eachsubject. During the recording of data, handling of babies wasnot permitted; however, FiO2 was adjusted to maintain thepulse oximeter reading in a target range of 88%–92%. The rapidshallow breathing index (RSBI) was used as a measure of theefficiency of breathing. This was calculated by taking the ratioof respiratory rate to tidal volume (RR/VTe) and expressed asbreaths/min/ml/kg and compared across the epochs. Using theRSBI, the lower the ratio, the better is the efficiency ofspontaneous breathing.
The mean value for each outcome measure was calculated oneach ventilation mode for every baby and then comparedbetween the study epochs. This was then utilised for thestatistical analyses and compared between the groups.Statistical analyses were performed using analysis of variance(ANOVA) for repeated measures and the post hoc Bonferronitest, to evaluate differences in respiratory parameters betweenthe three study groups. Outcome comparisons between the
Figure 1 Schematic diagram showingfeatures of pressure support ventilation(PSV): (1) triggering; (2) pressurisation;and (3) cycling.
Original article
Arch Dis Child Fetal Neonatal Ed 2009;94:F80–F83. doi:10.1136/adc.2007.123679 F81
on 5 March 2009 fn.bmj.comDownloaded from

groups were also carried out using the two-sided t test forparametric data and the Mann–Whitney U test for non-parametric data. All statistical analyses were performed usingSPSS Inc., version 12 for WindowsTM (Chicago, Illinois, USA).
RESULTSTen ventilated babies were enrolled in the study. Their meangestational age and birth weight were 28 weeks and 1190 g,respectively. The mean age at entry into the study was 16 days.All babies successfully completed the study and provided a totalof 19 154 breaths for analyses. There were equal numbers ofbabies receiving TCPL and VC ventilation.
The ventilator parameters were adjusted to achieve thedesired VTe and the data for partial pressure of CO2 (pCO2)were collected before and after the cross-over study period on allinfants. There were no differences in the pCO2 levels andclinical status before or after the study period. There were nomajor episodes of desaturation during the study period.
There was a significant increase in minute ventilation duringPSmin compared with SIMV alone. This was associated with aconcomitant decrease in the total respiratory rate (table 1).These differences in minute ventilation and total respiratoryrate were even more marked when full pressure support wasapplied (fig 2). There was also a statistically significantdifference in the observed parameters when PSmax wascompared with PSmin (total minute ventilation 392 ml/kg/minin PSmax vs 332 ml/kg/min in PSmin; p,0.05; and totalrespiratory rate 59 breaths per min in PSmax vs 65 breaths permin in PSmin; p,0.05). There was also a significant decrease inthe mean (SD) RSBI during PSmin (17.4 (0.31) breaths/min/ml/kg) and PSmax (10.2 (0.24) breaths/min/ml/kg) compared withSIMV alone (42.9 (1.00) breaths/min/ml/kg). Both of thesedifferences were statistically significant (p,0.05).
There was also an incremental effect on mean Paw, PIP andFiO2 according to the level of pressure support. The mean Pawincreased significantly with the addition of PSV compared withSIMV alone. The increase in mean Paw and PIP was greaterwith full PSV compared with partial PSV. The FiO2 decreased
significantly and proportionally with the addition of PSV(table 2).
DISCUSSIONPressure support ventilation is a ventilatory mode in whichspontaneous breaths are partially or fully supported by aninspiratory pressure assist above the baseline pressure. Duringweaning of mechanical ventilation, spontaneous breathingmust overcome the work imposed by the presence of a high-resistance endotracheal tube, ventilatory circuit and the disease-induced respiratory load. Pressure support can be used as anadjunct to SIMV to partially or fully unload the spontaneousbreaths.5 PSV increases the tidal volume proportionally to thechosen pressure support level, achieves synchrony during bothinspiration and expiration, and enhances the efficiency ofbreathing.7 PSV has been shown to reduce the work of breathingand oxygen requirement in intubated adult and paediatricpatients3 4 and appears to accelerate weaning from mechanicalventilation and to reduce ventilatory dependency.8 9 PSV withSIMV has been compared with SIMV alone in a randomisedcontrolled trial and was reported to have advantages ascompared with SIMV alone for weaning. This study, however,only used pressure support of 30%–50%.10 PSV has beenreported to be beneficial but there are not yet sufficient datato compare its effectiveness at different levels. This is importantto know, as PSV can be used for both full and partial supportand may offer advantages over other modalities of ventilation,especially during weaning, as it resembles physiological breaths.
In the present study, each baby served as his/her own control.The mandatory SIMV rate was kept constant at 20 breaths perminute throughout the study period to enable assessment of theeffects of two levels of pressure support, which were aimed tomaintain a desired range of VTe. This enabled us to standardisethe level of PS across the study epochs.
Data from this study suggest that the use of PSV increasestotal minute ventilation and stabilises the breathing pattern,
Figure 2 Diagram showing the effect of two different levels of pressuresupport on minute ventilation and respiratory rate. The mandatory rate isfixed across the three groups: synchronised intermittent mandatoryventilation (SIMV), SIMV with partial pressure support (PSmin) and SIMVwith full pressure support (PSmax). The effect of partial or full pressuresupport on total minute ventilation (Ve/kg) and total respiratory rate isshown. RR, respiratory rate.
Table 1 Effect of different levels of pressure support on studyparameters
Study parameterSIMV(SIMV)
SIMV + partialPSV (PSmin)
SIMV + full PSV(PSmax)
Mean (SD) exhaled tidalvolume(ml/kg)
3.9 (0.72) 5.2 (1.29)* 6.7 (0.69)*{
Mean (SD) total Ve (ml/kg/min) 270 (47) 332 (53)* 392 (63)*{Mean (SD) total RR (breaths/min)
72 (5.6) 65 (8.6)* 59 (9.8)*{
*p,0.05 (PSV vs SIMV).{p,0.05 (partial vs full PSV).Ve, minute ventilation; PSV, pressure support ventilation; RR, respiratory rate; SIMV,synchronised intermittent mandatory ventilation.
Table 2 Effect of the level of pressure support on ventilationparameters
Study parameterSIMV(SIMV)
SIMV + partialPSV (PSmin)
SIMV + full PSV(PSmax)
Mean (SD) airway pressure (cmH2O)
5.60 (0.84) 6.83 (0.89)* 7.85 (1.3)*
Mean (SD) peak inspiratorypressure (cm H2O)
14.4 (3.2) 11.3 (1.2)* 15.7 (2.1){
Mean (SD) FiO2 (%) 24.2 (2.2) 23.6 (1.5)* 21.5 (1.2)*{
*p,0.05 (PSV vs SIMV).{p,0.05 (partial vs full PSV).FiO2, fraction of inspired oxygen; PSmin, partial PSV; PSmax, full PSV; PSV, pressuresupport ventilation; SIMV, synchronised intermittent mandatory ventilation.
Original article
F82 Arch Dis Child Fetal Neonatal Ed 2009;94:F80–F83. doi:10.1136/adc.2007.123679
on 5 March 2009 fn.bmj.comDownloaded from

while enabling the baby to decrease the total respiratory rate.The significantly lower RSBI observed in this study when PSmax
was used (compared with PSmin), suggests that there is anincremental increase in respiratory efficiency by providing morepressure support, perhaps by augmenting the unloading ofrespiratory muscles. This has not been reported before innewborns but mirrors the observations made in paediatric andadult patients.11 There are limited data comparing various levelsof PSV,12–14 but these studies suggest that the addition of PSVduring weaning augments spontaneous breathing with betterthoraco-abdominal synchrony, increase in minute ventilation,and reduction in the total respiratory rate compared with SIMValone.15
Addition of PSV in the present study increased mean Paw andPIP. This has been observed before.6 While this may be a sourceof anxiety, it should be realised that PSV is flow-cycled, andinspiratory gas flow delivery is variable according to the patienteffort. This, in fact, makes PSV more physiological than themechanically delivered mandatory breaths, which are set by theoperator and are thus more prone to result in patient–ventilatorasynchrony. The effect of PSV in improving minute ventilationwith a better RSBI through reduction in the spontaneousrespiratory rate may be explained by the optimisation of tidalvolume delivery and patient–ventilator synchrony.
The decrease in FiO2 observed with the addition of PSV mayhave resulted from better alveolar recruitment. Anotherpossibility is the opportunity for the infant to sigh duringPSV through voluntary extension of the inspiratory time, whichcould also contribute to improved oxygenation. This observa-tion of a decrease in the oxygen requirement with increasingpressure support is important while weaning preterm babieswho require prolonged ventilatory support.
Because of lack of availability of continuous blood gasesmonitoring devices, we were limited in our ability to collectcontinuous data on pCO2. Nonetheless, our data suggest thatthe infants probably adjust spontaneous breathing, and thusminute ventilation, as a way to maintain normocapnia, andthat higher PSV levels provide a higher tidal volume, requiringfewer spontaneous breaths. The previous study by Osorio alsodid not show any changes in pCO2.5
In summary, the findings of this study confirm that PSVenhances the efficiency of spontaneous breathing during weaningof preterm infants from mechanical ventilation. The increase isproportional to the level of pressure support used. Based on our
findings, different levels of pressure support can be used tofacilitate a gradual shift of work of breathing from the ventilator tothe baby, and conditioning the respiratory muscles for successfulextubation. Further clinical trials are needed to fully explore thesafety and efficacy of different levels of pressure support innewborn infants requiring mechanical ventilation.
Competing interests: None.
Patient consent: Written informed consent was obtained from each parent prior to studyentry.
REFERENCES1. Sinha SK, Donn SM. Pressure support ventilation. In: Donn SM, ed. Neonatal and
pediatric pulmonary graphics: principles and clinical application. Armonk NY: FuturaPublishing Co., 1998: 301–12.
2. Sarkar S, Donn SM. In support of pressure support. Clin Perinatol 2007;34:117–28.3. El-Khatib MF, Chatburn RL, Potts DL, et al. Mechanical ventilators optimised for
paediatric use decrease work of breathing and oxygen consumption during pressuresupport ventilation. Crit Care Med 1994;22:1942–8.
4. Tokioka H, Kinjo M, Hirakawa M. The effectiveness of pressure support ventilationfor mechanical ventilatory support in children. Anaesthesiology 1993;78:880–4.
5. Osorio W, Claure N, D’Ugard C, et al. Effects of pressure support during an acutereduction of synchronized intermittent mandatory ventilation in preterm infants.J Perinatol 2005;25:412–16.
6. Migliori C, Cavazza A, Motta M, et al. Effect on respiratory function of pressuresupport ventilation versus synchronised intermittent mandatory ventilation in preterminfants. Pediatr Pulmonol 2003;35:364–7.
7. Tokioka H, Saito S, Kosaka F. Effect of pressure support ventilation on breathingpatterns and respiratory work. Intensive Care Med 1989;15:491–4.
8. Gulberg N, Winberg P, Sellden H. Pressure support ventilation increases cardiacoutput in neonates and infants. Paediatr Anaesth 1996;6:311–15.
9. Brochard L, Rauss A, Benito S, et al. Comparison of three methods of gradualwithdrawal from ventilatory support during weaning from mechanical ventilation.Am J Respir Crit Care Med 1994;150:896–903.
10. Reys ZC, Claure N, Tauscher MK, et al. Randomized controlled trial comparingsynchronised intermittent mandatory ventilation and synchronised intermittentmandatory ventilation plus pressure support in preterm infants. Pediatrics2006;118:1409–17.
11. Leung P, Jubran A, Tobin MJ. Comparison of assisted ventilator modes on triggering,patient effort and dyspnoea. Am J Respir Crit Care Med 1997;155:1940–8.
12. Olsen SL, Thibeault DW, Truog WE. Crossover trial comparing pressure support withsynchronized intermittent mandatory ventilation. J Perinatol 2002;22:461–6.
13. Nafday SM, Green RS, Lin J, et al. Is there an advantage of using pressure supportventilation with volume guarantee in the initial management of premature infants withrespiratory distress syndrome? A pilot study. J Perinatol 2005;25:193–7.
14. Abd El-Moneim ES, Fuerste HO, Krueger M, et al. Pressure support ventilationcombined with volume guarantee versus synchronized intermittent mandatoryventilation: a pilot crossover trial in premature infants in their weaning phase. PediatrCrit Care Med 2005;6:286–92.
15. Tokioka H, Nagano O, Ohta Y, et al. Pressure support ventilation augmentsspontaneous breathing with improved thoracoabdominal synchrony in neonates withcongenital heart disease. Anesth Analg 1997;85:789–93.
Original article
Arch Dis Child Fetal Neonatal Ed 2009;94:F80–F83. doi:10.1136/adc.2007.123679 F83
on 5 March 2009 fn.bmj.comDownloaded from

doi:10.1136/adc.2008.139980 13 Aug 2008;
2009;94;F84-F86; originally published onlineArch. Dis. Child. Fetal Neonatal Ed. K I Wheeler, C J Morley, C O F Kamlin and P G Davis
decrease during obstructed flowVolume-guarantee ventilation: pressure may
http://fn.bmj.com/cgi/content/full/94/2/F84Updated information and services can be found at:
These include:
References
http://fn.bmj.com/cgi/content/full/94/2/F84#BIBL
This article cites 3 articles, 1 of which can be accessed free at:
Rapid responses http://fn.bmj.com/cgi/eletter-submit/94/2/F84
You can respond to this article at:
serviceEmail alerting
the top right corner of the article Receive free email alerts when new articles cite this article - sign up in the box at
Notes
http://journals.bmj.com/cgi/reprintformTo order reprints of this article go to:
http://journals.bmj.com/subscriptions/ go to: Archives of Disease in Childhood - Fetal and Neonatal EditionTo subscribe to
on 5 March 2009 fn.bmj.comDownloaded from

Volume-guarantee ventilation: pressure maydecrease during obstructed flow
K I Wheeler, C J Morley, C O F Kamlin, P G Davis
Neonatal Services, RoyalWomen’s Hospital, Melbourne,Australia
Correspondence to:Dr K I Wheeler, NeonatalServices, Royal Women’sHospital, Locked Bag 300, CnrGrattan Street & FlemingtonRoad, Parkville, VIC 3052,Australia; [email protected]
Accepted 20 July 2008Published Online First13 August 2008
ABSTRACTBackground: Two unexpected observations were madeduring ventilation with the Drager Babylog 8000+ involume-guarantee mode: (a) during complete obstructionto gas flow down the endotracheal tube (ETT), positiveinspiratory pressure (PIP) was reduced to half waybetween the maximum inflating pressure and the positiveend expiratory pressure (PEEP) even though the setexpired tidal volume had not been achieved; (b) anexternal Drager waveform monitor may stop displayingreal-time waveforms when a tube-obstructed alarm isactivated.Objective: To investigate these phenomena using a testlung.Method: A 50 ml Drager test lung was attached to theventilation circuit of a Drager Babylog 8000+. Partialobstruction to ETT flow was induced by compressing thetubing leading to the test lung, and complete obstructionwas achieved by clamping. Recordings were made fromthe digital output of the ventilator at 125 Hz.Results: When the ETT flow was completely obstructedduring VG ventilation, a constant PIP was set midwaybetween the set maximum and PEEP. This did not happenduring partial obstruction. The external waveform monitordisplay froze when ETT flow was completely obstructed.Conclusions: During complete ETT obstruction, the PIP isset to a pressure midway between maximum PIP andPEEP even if this is less than the PIP used before theobstruction. Further research is needed to evaluatewhether this reduction in PIP is associated withprolongation of precipitating events.
An extremely-low-birthweight infant was deliv-ered prematurely at less than 26 weeks’ gestation,requiring intubation in the delivery room. Assist-control, volume-guarantee (AC/VG) ventilationwith the Drager Babylog 8000+ was started onthe neonatal intensive care unit with a targetexpired tidal volume (VTset) of 4.3 ml (4.5 ml/kg), a maximum inflating pressure limit (Pmax) of25 cm H2O and a positive end expiratory pressure(PEEP) of 5 cm H2O (fig 1). Curosurf (100 ml/kg)was rapidly administered through a closed-circuitdevice (Trach Care Multi-Access Catheter;Kimberley-Clark, Ballard Medical Products,Roswell, Georgia, USA) while AC/VG ventilationcontinued. Complete endotracheal tube (ETT)obstruction occurred immediately and lasted for45 s (fig 1, epoch B). Recorded ventilator pressureand flow waves showed that the baby received apeak inspiratory pressure (PIP) of only15 cm H2O during this time. As soon as ETTflow returned (fig 1, epoch C), the PIP increasedto Pmax over several inflations. Because of hypoxiaand because the VTset was not achieved, the
clinicians increased Pmax from 25 to 30 cm H2O(fig 1, epoch D).
VG VENTILATION: TARGETING TIDAL VOLUMEVG is a mode of volume-targeted ventilationprovided by the Drager Babylog 8000+ ventilator(Dragerwerk AG, Lubeck, Germany).1 2 A flowsensor measures inspired and expired gas flowthrough the ETT and integrates these to inspiredand expired tidal volumes (VTi and VTe). Theventilator adjusts PIP to achieve a set VTe.
3 The PIPcan vary between the set PEEP and a set maximumpressure limit (Pmax), referred to as Pinsp in theDrager manual.2 Factors that affect the VTe andtherefore the PIP include complete or partialairway occlusion, altered airway resistance,changes in lung or chest wall compliance, ETTleak, and spontaneous breathing.4 5
Before observing this phenomenon, we assumedthat in VG mode the ventilator would alwaysincrease the PIP up to Pmax if the VTe was less thanVTset. We therefore studied the response of theDrager Babylog 8000+ to episodes of partially andcompletely obstructed ETT flow using a test lung.
METHODSA 50 ml Drager test lung was attached to the wyepiece of the ventilation circuit of a Drager Babylog8000+. The settings were: AC/VG mode, back-up
What is already known on this topic
c During volume-guarantee ventilation with theDrager Babylog 8000+, peak inspiratorypressure (PIP) changes to target a set expiredtidal volume.
c When the endotracheal tube (ETT) flow ispartially obstructed during volume-guaranteeventilation, the PIP increases to the setmaximum. When the manual breath button ispushed, the maximum PIP is deliveredregardless of the ventilation mode.
What this study adds
c When the ETT flow is completely obstructedduring VG ventilation, the Drager Babylog 8000+uses a constant PIP set midway between the setmaximum and positive end expiratory pressure.This does not happen during partial obstruction.
c An external waveform monitor display mayfreeze when ETT flow is completely obstructed.
Original article
F84 Arch Dis Child Fetal Neonatal Ed 2009;94:F84–F86. doi:10.1136/adc.2008.139980
on 5 March 2009 fn.bmj.comDownloaded from

rate 50/min, PEEP 5 cm H2O, Pmax 25 cm H2O, VTset 5 ml andcircuit flow 8 litres/min. The PIP delivered was 17–18 cm H2O.Partial obstruction to ETT flow was induced by compressingthe tubing leading to the test lung. Clamping this producedcomplete obstruction.
Recordings were made from the digital output of theventilator at 125 Hz using Spectra software (Grove Medical,London, UK).
RESULTS
Partial ETT obstruction (fig 2, epoch B)When the ETT flow was partially obstructed, the VTe wasreduced. The ventilator increased the PIP to Pmax to try toachieve VTset.
Complete ETT obstruction (fig 2, epoch C)During complete ETT obstruction, flow stopped and VTe waszero. After a single cycle with no flow, the ventilator reducedthe PIP from 25 to 15 cm H2O (the midpoint of Pmax and PEEP).When ETT flow resumed (fig 2, epoch E), PIP increased stepwiseto Pmax. This reproduced our clinical observations when theETT was completely blocked after surfactant administration.When the obstruction resolved (fig 2, epoch F), the VTe
transiently exceeded the VTset and the PIP decreased until VTe
equalled VTset.
Manual breath inflations (fig 2, epoch D)The effect of manual inflations during complete obstruction toETT flow was investigated with inflations delivered at aconstant PIP at Pmax. The inflation was sustained for as longas the manual breath button was held (up to 5 s).
Ventilation without volume guaranteeWhen the VG mode is not used, the PIP is constant for eachinflation. During both partial and complete obstruction to ETTflow, inflations are delivered at the set PIP regardless of the tidalvolume delivered.
External waveform monitoringThe waveform displayed on the ventilator’s inbuilt LCD displayshows information in real-time. However, with an externalDrager waveform monitor (eg, VentView or BabyView), thereduction in PIP during complete ETT obstruction was not seenbecause this display froze during the tube-obstructed alarm. Thewaveform display recommenced when ETT flow was restored.Drager acknowledged that this previously unrecognised phe-nomenon was unintended (Dragerwerk AG Lubeck Germany,Personal Communication, 4 April 2008).
DISCUSSIONDuring partially obstructed ETT flow, the Babylog 8000+ in VGmode increased the PIP to Pmax. If VTset was not reached, theventilator activated the alarm. During complete ETT obstruc-tion, the ventilator immediately reduced the PIP to midwaybetween Pmax and PEEP, despite not having delivered VTset. Thereduction occurred after one cycle with zero ETT flow.
Drager have confirmed these observations, attached asappendix 1 (Dragerwerk, Personal Communication 26November 2007 and 28 March 2008). They informed us thatthis is designed to avoid excessive pressures after resolution ofthe tube-obstructed alarm. For example, in VG mode with aPmax of 30 cm H2O and PEEP 6 cm H2O (maximum inflatingpressure = 24 cm H2O), the ventilator will reduce the inflatingpressure to 12 cm H2O above PEEP. The PIP is limited to18 cm H2O until the tube-obstructed alarm resolves.
VG is used to automatically control PIP to target a tidalvolume. The doctors in our unit expected PIP to be increased toPmax during partial or complete ETT obstruction. We wereunaware that the Babylog ventilator reduces PIP duringcomplete ETT obstruction. We speculate that this is becauseinformation about ventilator functioning during partial andcomplete ETT obstruction is not included in the productmanual. Therefore this attenuation of PIP may not be apparentin neonatal units that use an external Drager VentView displayto show waveforms, and will be particularly marked in unitsthat set Pmax close to delivered PIP.
Figure 1 A recording from a DragerBabylog 8000+ ventilating an extremelylow birthweight infant, showinginspiratory and expiratory endotrachealflow, inflating pressures and tidal volumesaround the time of surfactantadministration. The initial ventilatorsettings were: assist-control, volume-guarantee mode, back-up rate 50/min,VTset 4.3 ml, Pmax 25 cm H2O, positiveend expiratory pressure 5 cm H2O,inflation time 0.3 s, circuit flow 8 litres/min. Four epochs are shown. (A) Set tidalvolumes generally not obtained despitepeak inspiratory pressure (PIP) havingincreased to Pmax. (B) Surfactant givenfollowed by complete endotracheal tube(ETT) obstruction. PIP decreases from 25/5 to 15/5. (C) Obstruction partiallyresolves, PIP increases back up to Pmax.Despite this, VTe remains below VTset. (D)Clinical team increases Pmax to30 cm H2O. VTe reaches VTset withvarying PIP.
Original article
Arch Dis Child Fetal Neonatal Ed 2009;94:F84–F86. doi:10.1136/adc.2008.139980 F85
on 5 March 2009 fn.bmj.comDownloaded from

We speculate that delivering an increased PIP duringobstruction may help in overcoming the resistance to flow insome situations, and, if PIP is reduced during complete ETTobstruction, the precipitating situation may take longer toresolve. Further work is needed to clarify this, includingdetermining the optimal settings for Pmax during VG ventila-tion, and minimisation of ETT obstruction events.
SUMMARYDuring complete ETT obstruction, the Drager Babylog 8000+ventilator in VG mode sets PIP to a pressure midway betweenmaximum PIP and PEEP even if this is less than the PIP usedbefore the obstruction. Manual breath inflations at Pmax aredelivered in both VG and non-VG modes. In non-VG ventila-tion, the set PIP is delivered with each inflation whether there isETT obstruction or not.
Further research is needed to evaluate whether reducing thePIP during complete ETT obstruction is associated with aprolongation of precipitating events.
Acknowledgements: We thank Research Nurse Connie Wong for her assistancewith this project.
Funding: Funded by Australian National Health and Medical Research Council ProgramGrant No 384100.
Competing interests: None.
Ethics approval: Obtained.
REFERENCES1. Grover A, Field D. Volume-targeted ventilation in the neonate: time to change? Arch
Dis Child Fetal Neonatal Ed 2008;93:F7–13.2. Dragerwerk AGLG. Babylog 8000 Plus: intensive care ventilator for neonates.
Instructions for use. Software 5.n. 2008.3. Ahluwalia JS, Morley CJ, Wahle H. Volume guarantee: new approaches in volume
controlled ventilation for neonates. Lubeck: Drager Medizintechnik GmbH.4. Jaecklin T, Morel DR, Rimensberger PC. Volume-targeted modes of modern neonatal
ventilators: how stable is the delivered tidal volume? Intensive Care Med2007;33:326–35.
5. Esquer C, Claure N, D’Ugard C, et al. Role of abdominal muscles activity on durationand severity of hypoxemia episodes in mechanically ventilated preterm infants.Neonatology 2007;92:182–6.
APPENDIX 1Communication from Drager regarding volume guarantee mode during ETTobstruction. ‘‘While working in Volume Guarantee, the Babylog needs the calculatedtidal volumes in order to be able to regulate the pressure for the next breath. As faras the Babylog detects flow going to or coming from the patient the regulator staysin action and tries to achieve the set target tidal volume. Even in case of partialobstruction the regulator will increase the PIP in order to compensate for theadditional resistance. But as soon as the ventilator cannot detect any flow going tothe patient or coming from the patient, it will alarm with a tube obstruction alarm,as in this case the ventilator seems not to be able to solve the problem and needshelp and observation by the user. If the alarm is activated the regulator goes into akind of waiting status, stopping temporarily its regulation, setting the PIP inbetween Pinsp and PEEP, providing enough pressure to detect a reopening of theobstruction and at the same time preventing too much pressure with the first breathafter reopening the obstruction. As soon as the first flow is detected again theregulator will restart its work again and provide the needed pressure after very shorttime.’’
Figure 2 Recording of study on a 50 mltest lung with complete and partiallyobstructed endotracheal tube (ETT) flow.Ventilator settings: assist-control,volume-guarantee mode, back-up rate 50/min, VTset 5 ml, Pmax 25 cm H2O, positiveend expiratory pressure 5 cm H2O,inflation time 0.3 s, circuit flow 8 litres/min. Six epochs are shown. (A) Baselineperiod with unobstructed ETT flow.Ventilator delivers a VTe equal to the setVTe using an inflating pressure of about17–18 cm H2O. (B) Partially obstructedETT flow. VTe is initially reduced. The PIPincreases over three inflations until theVTe reaches the VTset. The peakinspiratory pressure (PIP) reaches Pmax.(C) Completely obstructed ETT flow. Afterthe first inflation without flow, the PIPfalls to almost half the previous PIP, to,15 cm H2O. (D) Five manual inflationsare delivered by pushing the manualbreath button. These are delivered atPmax. After these, the ventilator returns toa PIP of 15 cm H2O. (E) Partial flowrestored. The ventilator increases the PIPfrom 15 cm H2O to Pmax as VTe is lessthan VTset. (F) Resolution: flow is nolonger obstructed. PIP decreases back to17–18 cm H2O as initial VTe exceedsVTset.
Original article
F86 Arch Dis Child Fetal Neonatal Ed 2009;94:F84–F86. doi:10.1136/adc.2008.139980
on 5 March 2009 fn.bmj.comDownloaded from

doi:10.1136/adc.2008.141341 14 Aug 2008;
2009;94;F87-F91; originally published onlineArch. Dis. Child. Fetal Neonatal Ed. P G Davis and C J Morley J A Dawson, C O F Kamlin, C Wong, A B te Pas, C P F O’Donnell, S M Donath,
gestation with air or 100% oxygenroom resuscitation of infants <30 weeks’ Oxygen saturation and heart rate during delivery
http://fn.bmj.com/cgi/content/full/94/2/F87Updated information and services can be found at:
These include:
References
http://fn.bmj.com/cgi/content/full/94/2/F87#BIBL
This article cites 34 articles, 12 of which can be accessed free at:
Rapid responses http://fn.bmj.com/cgi/eletter-submit/94/2/F87
You can respond to this article at:
serviceEmail alerting
the top right corner of the article Receive free email alerts when new articles cite this article - sign up in the box at
Notes
http://journals.bmj.com/cgi/reprintformTo order reprints of this article go to:
http://journals.bmj.com/subscriptions/ go to: Archives of Disease in Childhood - Fetal and Neonatal EditionTo subscribe to
on 5 March 2009 fn.bmj.comDownloaded from

Oxygen saturation and heart rate during deliveryroom resuscitation of infants ,30 weeks’ gestationwith air or 100% oxygen
J A Dawson,1,2 C O F Kamlin,1 C Wong,1 A B te Pas,1 C P F O’Donnell,3 S M Donath,4
P G Davis,1,2 C J Morley1,2,5
1 Neonatal Services, The RoyalWomen’s Hospital, Melbourne,Australia; 2 Department ofObstetrics and Gynaecology,University of Melbourne,Australia; 3 National MaternityHospital, Dublin, Ireland;4 Clinical Epidemiology andBiostatistics Unit, MurdochChildren’s Research Institute,Melbourne, Australia; 5 MurdochChildren’s Research Institute,Melbourne, Australia
Correspondence to:Jennifer Dawson, NeonatalServices, The Royal Women’sHospital, 20 Flemington Road,Parkville, VIC 3052, Australia;[email protected]
Accepted 27 July 2008Published Online First14 August 2008
ABSTRACTBackground: Because of concerns about harmful effectsof 100% oxygen on newborn infants, air has started to beused for resuscitation in the delivery room.Objective: To describe changes in preductal oxygensaturation (SpO2) and heart rate (HR) in the first 10 minafter birth in very preterm infants initially resuscitatedwith 100% oxygen (OX100) or air (OX21).Patients and methods: In July 2006, policy changedfrom using 100% oxygen to air. Observations of SpO2 andHR before and after the change were recorded whenevera member of the research team was available to attendthe birth.Results: There were 20 infants in the OX100 group and106 in the OX21 group. In the OX100 group, SpO2 had risento a median of 84% after 2 min and 94% by 5 min. In theOX21 group, median SpO2 was 31% at 2 min and 54% at5 min. In the OX21 group, 92% received supplementaloxygen at a median of 5 min; the SpO2 rose to a medianof 81% by 6 min. In the first 10 min after birth, 80% and55% of infants in the OX100 and OX21 groups, respectively,had an SpO2 >95%. Increases in HR over the first 10 minwere very similar in the two groups.Conclusions: Most very preterm infants receivedsupplemental oxygen if air was used for the initialresuscitation. In these infants, the use of backup 100%oxygen and titration against SpO2 resulted in a similarcourse to ‘‘normal’’ term and preterm infants. Of theinfants resuscitated with 100% oxygen, 80% had SpO2
>95% during the first 10 min. The HR changes in the twogroups were very similar.
For many years, 100% oxygen was recommendedfor delivery room (DR) resuscitation of newborninfants of all gestational ages.1 In recent years,experts have suggested that even a brief exposureto high oxygen concentrations at birth in very-low-birthweight infants is harmful.2 There is alsoaccumulating evidence of oxygen toxicity fromanimal and in vitro studies.3–5 Several studies havefound evidence of oxidative damage in infants aftershort exposure to 100% oxygen in the DR.6–9 Thisevidence has led to a change in national guidelinesfor DR resuscitation, which now advise that 21%oxygen should be considered rather than 100%oxygen during initial resuscitation of all infants.10 11
Very preterm infants appear to be at greatest riskof oxidative damage.7 9 12 Data from infants born at,30 weeks’ gestation are limited.
The protocol for resuscitation of newborn infantsat The Royal Women’s Hospital, Melbourne waschanged in line with recommendations of the
Australian Resuscitation Council.10 Before thechange, 100% oxygen was used throughout resusci-tation. After the change, air was used with 100%oxygen as a backup guided by ranges of oxygensaturations previously seen in term and preterminfants not requiring resuscitation.13 14 We aimed todescribe the changes in oxygen saturation (SpO2) andheart rate (HR) of infants ,30 weeks’ gestationresuscitated in the two eras.
PATIENTS AND METHODSIn this prospective observational study, the cohortsincluded infants ,30 weeks’ gestation, born at TheRoyal Women’s Hospital, Melbourne between 12January 2006 and 31 December 2007, when amember of the research team was available toattend the birth. This included 6 months before(OX100) and 18 months after (OX21) 17 July 2006,when the change in policy and implementation ofthe new guideline took place.
Immediately after birth, an oximetry sensor(LNOP Neo sensor; Masimo, Irvine, California,USA) was placed on the infant’s right hand andthen connected to the oximeter (Radical7 V5;Masimo), as previously described.15 SpO2, HR andsignal quality were stored by the oximeter every2 s for at least the first 10 min after birth. We used
What is already known on this topic
c Brief exposure to supplemental oxygen in thedelivery room can produce an SpO2 >95%.
c Preductal oximetry measures SpO2 and heartrate within 90 s of birth.
c Using oximetry in the delivery room, clinicianscan adjust the FiO2 to the SpO2.
What this study adds
c When very preterm infants are initiallyresuscitated with air, some will requiresupplemental oxygen.
c If very preterm infants are initially resuscitatedwith 100% oxygen, many will rapidly becomehyperoxic.
c Titrating oxygen administration may reduce thenumber of very preterm infants with SpO2
measurements >95%.
Original article
Arch Dis Child Fetal Neonatal Ed 2009;94:F87–F91. doi:10.1136/adc.2008.141341 F87
on 5 March 2009 fn.bmj.comDownloaded from

2 s averaging and maximum sensitivity. A member of theresearch team documented any interventions during resuscita-tion including adjustments made to the fractional inspiredoxygen (FiO2). In the OX100 group, the FiO2 was not able to bechanged because there was no gas blender available until infantswere moved into a transport cot for transfer to the neonatalintensive care unit. Infants in the OX21 group were managedaccording to the 2006 Royal Women’s Hospital DR protocolwith oxygen titrated according to SpO2 measurements (fig 1). Ifinfants reached an SpO2 .90%, the FiO2 was reduced in stages of,10% to target the SpO2 to 80–90%. Active, spontaneouslybreathing infants, of any gestation, were started on continuouspositive airway pressure (CPAP); infants requiring additionalsupport were intubated and ventilated. This did not change overthe time of this study. If free flow oxygen, CPAP or intermittentpositive pressure ventilation were required, this was given witha Neopuff (Fisher & Paykel, Auckland, New Zealand) T-pieceresuscitation device. In the second time period, a small numberof infants were managed using a self-inflating resuscitationdevice (Laerdal, Stavanger, Norway).
After resuscitation, data from the oximeter (HR, SpO2 andsignal quality) were downloaded to a computer using theNeO2m program16 (Dr Girvan Malcolm, Royal Prince AlfredHospital, Sydney, Australia). The data were analysed with Stata(Intercooled 10). We only analysed measurements where thesignal was considered normal, ie, no alarm messages (low IQsignal, low perfusion, sensor off, ambient light).
These observational data are presented to illustrate the effectson SpO2 and HR of resuscitation with either 100% oxygen or airwith backup 100% oxygen if the SpO2 was ,70% at 5 min. Thedata are presented as numbers and proportions (%) forcategorical variables, or means (SD) for normally distributedcontinuous variables and median (interquartile range) when the
distribution was skewed. SpO2 and HR during the first 10 minare illustrated by group using box plots showing the median,interquartile range (IQR) and range with outliers. We did notdefine primary or secondary outcomes a priori, thereforeinferential statistics have not been used to compare thesehistorical cohorts.
Figure 1 The Royal Women’s Hospitalguideline for managing administration andtitration of supplemental oxygen in thedelivery room. CPAP, continuous positiveairway pressure; FiO2, fractional inspiredoxygen; NICU, neonatal intensive careunit; SpO2, oxygen saturation.
Table 1 Characteristics of infants in the two groups
OX100
(n = 20)
OX21
(n = 105)
Gestational age (weeks)* 27 (1.6) 27 (1.6)
Birth weight (g)* 915 (300) 930 (293)
Male 13 (65) 67 (64)
Labour started 3 (15) 51 (48)
Full course of antenatalsteroids
18 (90) 87 (82)
Apgar score at 1 min{ 5 (5–7) 5 (3–7)
Apgar score at 5 min{ 8 (7–9) 8 (6–9)
Cord pH{{ 7.28 (7.25–7.34) 7.3 (7.25–7.34)
Days in oxygen{ 3.5 (2–35.5) 20 (3–44)
Days treated with CPAP{ 9 (4–42) 9 (4–34)
Days treated withventilation{
9 (3–18) 6 (3–12)
Died before discharge/transfer
3 (15) 12 (11)
Values are number (%) unless indicated otherwise.*Mean (SD).{Median (interquartile range).{pH available for eight infants in the OX100 group and 77 infants inthe OX21 group.CPAP, continuous positive airway pressure; OX100, received 100%oxygen; OX21, received 21% oxygen.
Original article
F88 Arch Dis Child Fetal Neonatal Ed 2009;94:F87–F91. doi:10.1136/adc.2008.141341
on 5 March 2009 fn.bmj.comDownloaded from

In the OX100 group, verbal consent was obtained fromparents to monitor their infants in the DR. In the later group,parental consent was not obtained to monitor infants, asapplying an oximeter sensor for monitoring in the DR was thestandard of care for management of infants at ‘‘high risk’’ forreceiving active resuscitation in our institution.
RESULTSA total of 126 infants were studied. Pulse oximeter data wereavailable for 125 infants (sensor failure in one infant in the OX21
group). All 20 infants in the OX100 group received 100% oxygenbefore 1 min of age. In the OX21 group, 97/105 (92%) weresubsequently treated with supplemental oxygen at median(IQR) of 5.05 (4–5.5) min. Eight infants (8%) in the OX21 groupdid not receive supplemental oxygen in the DR. Tables 1 and 2present the clinical characteristics and DR interventions,respectively. No infants received external cardiac massage.
Changes in oxygen saturationFigure 2 shows the changes in SpO2 values for the two groupsover the first 10 min. The median SpO2 at 1 min was 60% forthe OX100 group and 55% for the OX21 group. By 2 min, theOX100 group had a median SpO2 of 84%, which continued to risesteadily to a median of 94% at 5 min and 96% by 10 min. Forthe OX21 group, the median SpO2 fell to 31% at 2 min, then roseto a median of 54% at 5 min, followed by a sharp rise to 81% at6 min, after supplementary 100% oxygen was started, reachinga median SpO2 of 91% at 10 min. After 5 min, the median SpO2
was very similar in the two groups. In the first 10 min afterbirth, 80% and 55% of infants in the OX100 and OX21 groups,respectively, had an SpO2 >95%.
The eight infants not receiving supplemental oxygen weresimilar in gestation to infants in both the OX100 and OX21
groups, with a mean (SD) gestational age of 27.5 (1) weeks;however, they were slightly larger with a mean (SD) birthweight of 1044 (167) g. Six received CPAP and three receivedintermittent positive pressure ventilation via a face mask. Themedian SpO2 in these eight infants at 1, 2, 5 and 10 min was60%, 71%, 87% and 93%, respectively.
Changes in HRFigure 3 shows the changes in HR over the first 10 min. Themedian HR in both groups at 1 min was ,100 beats/min: 76beats/min (OX100 group) and 93 beats/min (OX21 group). Inboth groups, the median HR increased to over 100 beats/min by
2 min, over 140 beats/min by 5 min and over 150 beats/min at10 min.
DISCUSSIONPulse oximetry is increasingly used during neonatal resuscita-tion17 18 with some centres using it to target a specific SpO2
range.19 Several studies report SpO2 changes in term or near-terminfants not requiring resuscitation in the first minutes afterbirth.13 14 20–22 Recent studies used pulse oximeters with algo-rithms that deal with low perfusion and motion artefact, bothof which are common in the DR.13 14 20–22 These studies reportedan SpO2 of ,60% at 1 min, with many infants taking at least10 min to achieve >90%. Data from our very preterm infantsinitially resuscitated with air and backup 100% oxygen had asimilar course. In our very preterm infants resuscitated with100% oxygen, the SpO2 rose more quickly.
When the infants in our study were resuscitated initially withair, the SpO2 levels were at the lower end of the normal range forhealthy term infants13 and rose into the ‘‘normal’’ range whenthey were treated with supplemental oxygen at about 5 min. By6 min, their median SpO2 was 81%. By 7 min, there was littledifference in the SpO2 between the OX21 group and the OX100
group. Fewer infants in the OX21 group had an SpO2 >95% inthe first 10 min than in the OX100 group.
A systematic review found that air was more effective than100% oxygen for resuscitation of asphyxiated term infants.23
SpO2 data available for some infants in these trials24–26 show nosignificant difference in SpO2 measurements for infants rando-mised to receive air or 100% oxygen. However, few very preterminfants were enrolled in these studies.
Our hospital changed policy to starting resuscitation in air onthe basis of evidence from randomised trials comparing initialDR resuscitation with 100% oxygen or air plus 100% oxygen asneeded.8 9 26 When we developed our protocol, there were fewdata from randomised trials comparing 100% oxygen with anoxygen concentration other than 21% in preterm infants. Twostudies had randomised infants to either ,100% or .21%oxygen. Lundstrom et al27 randomised 70 infants ,33 weeks’gestation to receive air or 80% oxygen in the DR. Theyhypothesised that cerebral blood flow at 2 h of age might bereduced after a brief period of hyperoxia from 80% oxygen atbirth. They found that the cerebral blood flow was significantly(p,0.0001) higher in the group treated with air. They alsoshowed, in a subgroup of infants monitored with oximetry, thatthe mean SpO2 was significantly higher at 3, 5 and 7 min in the80% oxygen group than the air group. In the air group, 74% didnot receive supplemental oxygen. In those who received oxygen,the maximum was 50%. The reasons for the different oxygenrequirements from those in our study are that the infants in thestudy of Lundstrom et al were more mature and clinicalmethods were used rather than SpO2 to titrate oxygen in theair group. We have shown that clinicians’ ability to measurecolour28 or HR29 in the DR is weak. Harling et al30 randomised 63infants ,31 weeks’ gestation to either 50% or 100% oxygen inthe DR. They hypothesised that cytokine concentration inbronchoalveolar lavage fluid 12 h after birth would be highest ininfants treated with 100% oxygen, but found no significantdifference. In infants randomised to receive 50% oxygen, one-third had an FiO2 above 50% during resuscitation. They did notmeasure SpO2 in the DR.
One approach to selecting the FiO2 to use in the DR is to useSpO2 measurements to adjust the FiO2.31 In the neonatalintensive care unit, targeting a narrow range for SpO2 andavoiding hyperoxia is associated with reduced morbidity in
Table 2 Delivery room interventions
OX100
(n = 20)
OX21
(n = 105)
Nasopharyngeal suction 9 (45) 51 (48)
CPAP 16 (80) 72 (69)
IPPV 14 (70) 80 (76)
Endotracheal intubation 8 (40) 42 (40)
Surfactant administered 2 (10) 5 (5)
Oxygen administered 20 (100) 97 (92)
Time oxygen started (minfrom birth)*
1 (0.86–1.2) 5.05 (4–5.5)
Each infant may have received several interventions.Values are number (%) unless indicated otherwise.*Median (interquartile range).CPAP, continuous positive airway pressure; IPPV, intermittentpositive pressure ventilation.
Original article
Arch Dis Child Fetal Neonatal Ed 2009;94:F87–F91. doi:10.1136/adc.2008.141341 F89
on 5 March 2009 fn.bmj.comDownloaded from

extremely-low-birthweight infants32 33 without a detrimentaleffect on developmental outcomes.32 It seems logical that a‘‘targeted oxygen delivery approach’’34 should be applied duringresuscitation. A small observational study35 titrated FiO2 againsttargeted SpO2 in 15 infants born at 24–29 weeks. They wereinitially resuscitated with 100% oxygen and the FiO2 adjusted tomaintain the SpO2 between 80% and 92%. The FiO2 was reducedfrom 100% to ,40%.
There are now three controlled studies on very preterminfants where the FiO2 has been titrated to the SpO2 after birth.Escrig et al36 randomised 28 infants ,29 weeks’ gestation toreceive 30% or 90% oxygen. The FiO2 was adjusted to achieve anSpO2 of 85%. By 5 min, the FiO2 was just above 50%, with nosignificant difference between the groups. Wang et al34
randomised infants ,32 weeks’ gestation to start resuscitationwith 100% oxygen or air. In the 100% oxygen group, the FiO2
was weaned if the SpO2 was .95% at 5 min. In the air group,the FiO2 was increased in 25% steps if the SpO2 was ,70% at3 min or 85% at 5 min, or to 100% if the HR was ,100 beats/min for 2 min or ,60 beats/min for 30 s at any time. All infantsin the air group received oxygen from ,3 min. Infants in the100% oxygen group had significantly higher FiO2 from 1 to7 min, but from 8 to 20 min it was similar in the two groups.From 2 to 10 min, the SpO2 was higher in the group initiallyresuscitated with 100% oxygen.
In the only randomised study to mask clinicians to the SpO2,Rabi et al37 randomised 106 infants ,33 weeks’ gestation tothree groups. One received 100% oxygen throughout resuscita-tion, the second received an initial concentration of 100%,which could than be changed, and the third group started withair. In the last two groups, the FiO2 was changed by 20% every15 s until the SpO2 was between 85% and 92%. The mean timethat each group spent in the SpO2 target range was 11%, 21%and 16%, respectively (p,0.01). At the end of resuscitation, theFiO2 was similar in the two targeted groups.
The safe SpO2 range for very preterm infants duringresuscitation is undefined. We targeted an SpO2 of 80–90%.
Escrig et al36 targeted 85%, Wang et al34 targeted 80–85% at5 min and 85–90% after 7 min, and Rabi et al37 targeted an SpO2
range of 85–92%. Each group used slightly different targetscombined with different resuscitation protocols, which willhave influenced the FiO2 used.
Hyperoxia is common during resuscitation of preterminfants. Tracy et al38 showed that, of 26 ventilated preterminfants of mean gestation 28 weeks (range 23–34), 38% werehyperoxic (PaO2 .100 mm Hg) 15 min after birth. Both Wanget al34 and our own study have shown that more of the infantswho started in 100% oxygen had an SpO2 of .95% than thosewho started in air. Rabi et al37 reported that infantsresuscitated in 100% oxygen spent 49% of the time abovethe SpO2 range of 85–92%. Therefore, in very preterm infants,hyperoxia appears to be a problem after starting resuscitationwith a high FiO2 and indicates that starting with a lower FiO2
may be preferable.Our results contribute to a growing body of evidence that it is
possible to adjust the FiO2 to keep SpO2 measurements within atargeted range during resuscitation. 34 36 37 Our study shows thatmost of our very preterm infants received supplemental oxygenwhen the initial resuscitation was with air and their SpO2 was,70% at 5 min or ,90% at 10 min. However, with differentSpO2 targets, the use of supplemental oxygen would bedifferent. We have shown that, using oximetry, it is possibleto titrate the FiO2 to the SpO2, with the SpO2 rising at a similarrate to that in term infants not receiving assistance in thedelivery room.13 14 21
When the initial resuscitation of very preterm infants hasbeen started with .90% oxygen, it has generally been possibleto reduce the FiO2 in response to the SpO2 to , 50% at 5 minand 35% at 10 min. In comparison, when the initial resuscita-tion gas was air or a low FiO2, the FiO2 at 5 min was similar towhen a high FiO2 was used. Therefore it now appears that,whatever the FiO2 used to initiate resuscitation, if the SpO2 ismonitored within a few minutes an appropriate FiO2 isachieved.
Figure 2 SpO2 shown at each minute, for the first 10 min after birth,from the group receiving 100% oxygen (OX100) and the group receiving21% oxygen (OX21). The box plots show the median, interquartile range,normal range and outliers. Small circles indicate outliers.
Figure 3 The heart rate shown at each minute, for the first 10 min afterbirth, for infants from the 100% oxygen (OX100) group and the 21% oxyen(OX21) group. The box plots show the median, interquartile range, normalrange and outliers. Small circles indicate outliers.
Original article
F90 Arch Dis Child Fetal Neonatal Ed 2009;94:F87–F91. doi:10.1136/adc.2008.141341
on 5 March 2009 fn.bmj.comDownloaded from

HR is the most important indicator of an infant’s response toresuscitation.18 31 Using pulse oximetry in the DR providesclinicians with a continuous display of HR without having tointerrupt resuscitation to listen to the HR intermittently.Importantly we found that the HR increased after birth at asimilar rate in this group of very preterm infants, regardless ofwhether the infant was resuscitated with air or 100% oxygen.Our finding and those of other researchers34 36 have shown that,even with a low SpO2 during the first few minutes after birth,HR was similar to that achieved by healthy newborn terminfants not receiving assistance.13 14 21
Two important questions cannot be answered by our studybut could be addressed in future trials. Does pulse oximetry inthe DR improve outcomes for preterm infants? If pulseoximetry is effective, what is the safe SpO2 range for preterminfants in the first minutes after birth?
Acknowledgements: JAD and COFK are recipients of a RWH PostgraduateScholarship. ATP is the recipient of a Ter Meulen Fund grant for working visits, RoyalNetherlands Academy of Arts and Sciences, The Netherlands, and PGD is the recipientof a NHMRC Practitioner Fellowship. The work was supported by Australian NationalHealth and Medical Research Council Program Grant No 384100. We thank Dr GirvanMalcolm, Royal Prince Alfred Hospital, Sydney for his assistance with the NeO2Mprogram.
Competing interests: None.
Patient consent: Parental consent obtained.
REFERENCES1. O’Donnell CPF, Gibson AT, Davis PG. Pinching, electrocution, ravens’ beaks, and
positive pressure ventilation: a brief history of neonatal resuscitation. Arch Dis ChildFetal Neonatal Ed 2006;91:F369–73.
2. Saugstad OD. Optimal oxygenation at birth and in the neonatal period. Neonatology2007;91:319–22.
3. Kondo M, Itoh S, Isobe K, et al. Chemiluminescence because of the production ofreactive oxygen species in the lungs of newborn piglets during resuscitation periodsafter asphyxiation load. Pediatr Res 2000;47:524–7.
4. Kutzsche S, Ilves P, Kirkeby OJ, et al. Hydrogen peroxide production in leukocytesduring cerebral hypoxia and reoxygenation with 100% or 21% oxygen in newbornpiglets. Pediatr Res 2001;49:834–42.
5. Saugstad OD, Ramji S, Vento M. Oxygen for newborn resuscitation: how much isenough? Pediatrics 2006;118:789–92.
6. Vento M, Asensi M, Sastre J, et al. Resuscitation with room air instead of 100%oxygen prevents oxidative stress in moderately asphyxiated term neonates. Pediatrics2001;107:642–7.
7. Vento M, Asensi M, Sastre J, et al. Hyperoxemia caused by resuscitation with pureoxygen may alter intracellular redox status by increasing oxidized glutathione inasphyxiated newly born infants. Semin.Perinatol 2002;26:406–10.
8. Vento M, Asensi M, Sastre J, et al. Oxidative stress in asphyxiated term infantsresuscitated with 100% oxygen. J Pediatr 2003;142:240–6.
9. Vento M, Sastre J, Asensi MA, et al. Room-air resuscitation causes less damage toheart and kidney than 100% oxygen. Am J Respir.Crit Care Med 2005;172:1393–8.
10. Australian Resuscitation Council. Guideline 13.1 Introduction to resuscitation ofthe newborn infant. 2006. http://www.resus.org.au/ (accessed 17 Oct 2008).
11. Canadian Paediatric Society. Recommendations for specific treatmentmodifications in the Canadian context: addendum to the 2006 NRP Provider Textbook.Canadian Paediatric Society 2006. 9-9-0007. http://www.cps.ca/English/ProEdu/NRP/addendum.pdf (accessed 23 Oct 2008).
12. Saugstad OD. Oxidative stress in the newborn: a 30-year perspective. Biol Neonate2005;88:228–36.
13. Kamlin CO, O’Donnell CPF, Davis PG, et al. Oxygen saturation in healthy infantsimmediately after birth. J Pediatr 2006;148:585–9.
14. Rabi Y, Yee W, Chen SY, et al. Oxygen saturation trends immediately after birth.J Pediatr 2006;148:590–4.
15. O’Donnell CPF, Kamlin CO, Davis PG, et al. Feasibility of and delay in obtaining pulseoximetry during neonatal resuscitation. J Pediatr 2005;147:698–9.
16. Malcolm G. Neonatal oxygen saturation download and analysis - user manual. 2007.http://www.cs.nsw.gov.au/rpa/ (accessed 23 Oct 2008).
17. O’Donnell CPF, Davis PG, Morley CJ. Use of supplementary equipment forresuscitation of newborn infants at tertiary perinatal centres in Australia and NewZealand. Acta Paediatr 2005;94:1261–5.
18. Leone TA, Rich W, Finer NN. A survey of delivery room resuscitation practices in theUnited States. Pediatrics 2006;117:164–75.
19. Finer NN. Rich WD. Neonatal resuscitation: raising the bar. Curr Opin Pediatr2004;16:157–62.
20. Toth B, Becker A, Seelbach-Gobel B. Oxygen saturation in healthy newborn infantsimmediately after birth measured by pulse oximetry. Arch Gynecol Obstet2002;266:105–7.
21. Altuncu E, Ozek E, Bilgen H, et al. Percentiles of oxygen saturations in healthy termnewborns in the first minutes of life. Eur J Pediatr 2008 ;167 :687–8.
22. Mariani G, Dik PB, Ezquer A, et al. Pre-ductal and post-ductal O2 saturation inhealthy term neonates after birth. J Pediatr 2007;150:418–21.
23. Davis PG, Tan A, O’Donnell CPF, et al. Resuscitation of newborn infants with 100%oxygen or air: a systematic review and meta-analysis. Lancet 2004;364:1329–33.
24. Ramji S, Ahuja S, Thirupuram S, et al. Resuscitation of asphyxic newborn infantswith room air or 100% oxygen. Pediatr Res 1993;34:809–12.
25. Rao R,.Ramji S. Pulse oximetry in asphyxiated newborns in the delivery room. IndianPediatr 2001;38:762–6.
26. Saugstad OD, Rootwelt T, Aalen O. Resuscitation of asphyxiated newborn infantswith room air or oxygen: an international controlled trial: the Resair 2 study. Pediatrics1998;102:e1.
27. Lundstrom KE, Pryds O, Greisen G. Oxygen at birth and prolonged cerebralvasoconstriction in preterm infants. Arch Dis Child Fetal Neonatal Ed 1995;73:F81–6.
28. O’Donnell CPF, Kamlin CO, Davis PG, et al. Clinical assessment of infant colour atdelivery. Arch Dis Child Fetal Neonatal Ed 2007;92:F465–7.
29. Kamlin COF, O’Donnell CPF, Everest N, et al. Accuracy of clinical assessment ofinfant heart rate in the delivery room. Resuscitation 2006;71:319–21.
30. Harling AE, Beresford MW, Vince GS, et al. Does the use of 50% oxygen at birth inpreterm infants reduce lung injury? Arch Dis Child Fetal Neonatal Ed 2005;90:F401–5.
31. American Heart Association. 2005 American Heart Association (AHA) Guidelinesfor cardiopulmonary resuscitation (CPR) and Emergency cardiovascular care (ECC) ofpediatric and neonatal patients: neonatal resuscitation guidelines. Pediatrics2006;117:1029–38.
32. Deulofeut R, Critz A, Adams-Chapman I, et al. Avoiding hyperoxia in infants(1250 g is associated with improved short- and long-term outcomes. J Perinatol2006;26:700–5.
33. Chow LC, Wright KW, Sola A. Can changes in clinical practice decrease theincidence of severe retinopathy of prematurity in very low birth weight infants?Pediatrics 2003;111:339–45.
34. Wang CL, Anderson C, Leone TA, et al. Resuscitation of preterm neonates by usingroom air or 100% oxygen. Pediatrics 2008;121:1083–9.
35. Kopotic RJ, Lindner W. Assessing high-risk infants in the delivery room with pulseoximetry. Anesth.Analg 2002;94:S31–6.
36. Escrig R, Arruza L, Izquierdo I, et al. Achievement of targeted saturation values inextremely low gestational age neonates, resuscitated with low or high oxygenconcentrations: a prospective randomized trial. Pediatrics 2008;121:875–81.
37. Rabi Y, Nettel-Aguirre A, Singhal N. Room air versus oxygen administration duringresuscitation of preterm infants (ROAR Study). Meeting of Pediatric AcademicSocieties, Hawaii, 2008. E-PAS2008: 5127.5
38. Tracy M, Downe L, Holberton J. How safe is intermittent positive pressureventilation in preterm babies ventilated from delivery to newborn intensive care unit?Arch Dis Child Fetal Neonatal Ed 2004;89:F84–7.
Original article
Arch Dis Child Fetal Neonatal Ed 2009;94:F87–F91. doi:10.1136/adc.2008.141341 F91
on 5 March 2009 fn.bmj.comDownloaded from

doi:10.1136/adc.2008.141002 14 Aug 2008;
2009;94;F92-F97; originally published onlineArch. Dis. Child. Fetal Neonatal Ed. On behalf of the Leiden Developmental Care Project C M Maguire, F J Walther, P H T van Zwieten, S Le Cessie, J M Wit, S Veen and
infants in a randomised controlled trialincubator covers and nesting for very preterm No change in developmental outcome with
http://fn.bmj.com/cgi/content/full/94/2/F92Updated information and services can be found at:
These include:
References
http://fn.bmj.com/cgi/content/full/94/2/F92#BIBL
This article cites 20 articles, 11 of which can be accessed free at:
Rapid responses http://fn.bmj.com/cgi/eletter-submit/94/2/F92
You can respond to this article at:
serviceEmail alerting
the top right corner of the article Receive free email alerts when new articles cite this article - sign up in the box at
Notes
http://journals.bmj.com/cgi/reprintformTo order reprints of this article go to:
http://journals.bmj.com/subscriptions/ go to: Archives of Disease in Childhood - Fetal and Neonatal EditionTo subscribe to
on 5 March 2009 fn.bmj.comDownloaded from

No change in developmental outcome with incubatorcovers and nesting for very preterm infants in arandomised controlled trial
C M Maguire,1 F J Walther,1 P H T van Zwieten,2 S Le Cessie,3 J M Wit,1 S Veen,1 Onbehalf of the Leiden Developmental Care Project
1 Department of Pediatrics,Subdivision of Neonatology,Leiden University MedicalCenter, Leiden, The Netherlands;2 Department of Pediatrics,Subdivision of Neonatology,Haga Hospital, Juliana Children’sHospital, The Hague, TheNetherlands; 3 Department ofMedical Statistics, LeidenUniversity Medical Center,The Netherlands
Correspondence to:Dr S Veen, Department ofPediatrics, J-6-S, LeidenUniversity Medical Center, POBox 9600, 2300 RC Leiden,The Netherlands; [email protected]
Accepted 27 July 2008Published Online First14 August 2008
ABSTRACTObjective: To investigate in a randomised controlled trialthe effect of basic elements of developmental care(incubator covers and positioning aids) on growth andneurodevelopment in infants born at , 32 weeks.Method: Infants were randomised within 48 h of birth toa developmental care (DC) or standard care (C) group.Outcome measures at 1 and 2 years corrected age weregrowth, standardised neurological examinations, andmental (MDI) and psychomotor (PDI) development (Dutchversion of the Bayley Scales of Infant Development II).Results: 192 infants were recruited (DC = 98; C = 94).Thirteen infants (DC = 7, C = 6) were excluded becausethey were admitted for ,5 days or died within the first 5days. In total, 179 infants met the inclusion criteria. In-hospital mortality was 12/91 (13.2%) in the DC group and8/88 (9.1%) in the C group. Assessments were carriedout on 147 children (DC = 74, C = 73) at 1 year and 142children (DC = 72, C = 70) at 2 years. No significantdifference in growth, neurological outcomes or MDI wasfound. A positive trend in PDI at 1 year (p = 0.05) did notcontinue once the children reached 2 years. There was nodifference found when neurological and developmentalscores were combined.Conclusions: Basic developmental care has no positiveeffect on neurological and mental development or growthat 1 and 2 years of age in infants born at ,32 weeks. Apositive effect on psychomotor development at 1 year didnot continue at 2 years of age.Trial registration number: ISRCTN84995192.
The care and survival rate of infants born pretermhas in recent years continued to improve.1–4 Even assurvival rates are improving, the risk of develop-mental disabilities remains high and increases asthe gestational age at birth decreases.1 5–7 Since the1980s, developmental care programmes have beencreated to support infant development in theneonatal intensive care unit (NICU) while at thesame time providing the necessary medical andnursing interventions. Many are based on theNewborn Individualised Developmental Care andAssessment Program (NIDCAP), an individualapproach in which care giving is based on theinfant’s behaviour.8 9 The first studies of theeffectiveness of NIDCAP developmental careshowed promising results.10–14 Follow-up studiespublished to date up to preschool age have beenscarce, and the results are conflicting.15–17 In arecent Cochrane Review of developmental care, theneed for larger trials, more follow-up, and study of
the effects of different aspects of developmentalcare was emphasised.18
The aim of this randomised controlled trial wasto explore the effectiveness of basic developmentalcare on mental and psychomotor development,neurological outcome and growth at 1 and 2 yearscorrected age (CA) of preterm infants born at,32 weeks’ gestational age. We hypothesised that,by reducing stress and promoting physiologicalstability through the use of incubator covers andnesting, the stability provided to the infants duringtheir NICU stay would positively affect their latergrowth and development.
SUBJECTS AND METHODS
SubjectsThe study was carried out from April 2000 to June2004 at a tertiary NICU at two locations in theNetherlands: Leiden University Medical Center inLeiden and Juliana Children’s Hospital in The
What is already known on this topic
c Previous trials are based on the comprehensiveNewborn Individualised Developmental Care andAssessment Program (NIDCAP).
c Outcomes of NIDCAP trials are based on smallsample sizes, and results are conflicting.
c A Cochrane Review of developmental carestated the need for larger trials and more follow-up, and investigation of the effects of differentaspects of developmental care was emphasised.
What this study adds
c The effects of basic developmental care wereinvestigated, thus answering the need for trialsof different aspects of developmental care asstated in the Cochrane Review.
c This was a large randomised controlled trial ofbasic development care in very preterm infantswith developmental, neurological and growthoutcomes to 2 years corrected age.
c It was shown that a less intensive, cost-savingform of developmental care has an effect onpsychomotor development at 1 year of age butno significant effect on neurodevelopment ofpreterm infants at 2 years of age.
Original article
F92 Arch Dis Child Fetal Neonatal Ed 2009;94:F92–F97. doi:10.1136/adc.2008.141002
on 5 March 2009 fn.bmj.comDownloaded from

Hague. Inclusion criteria were: infants born with a gestationalage ,32 (31+6) weeks. Exclusion criteria included: infants withmajor congenital anomalies, infants needing major surgery andinfants of drug-addicted mothers. After parental informedconsent had been obtained by the resident or staff member oncall, infants were randomised within 48 h of birth to thedevelopmental care (DC) group or the control standard care (C)group using sealed envelopes made in groups of six using acomputer-generated randomisation allocation. Infants in bothgroups who were admitted for ,5 days were excluded fromfollow-up because the duration of the basic developmental careintervention was hypothesised not to be long enough to obtainan effect. A power analysis performed before the study showedthat a sample size of 140 infants was needed to show asignificant difference (p,0.05) with a power of 80%, based onthe expected difference of half a standard deviation (7.5) on thedevelopmental test scores at 1 and 2 years CA.
MethodsThe intervention included reducing light and sound through theuse of standardised incubator covers, and supporting motordevelopment and physiological stability by positioning theinfant in ways that encourage flexion and containment throughthe use of standardised nests and positioning aids. Infants in theC group received standard care, which at that time consisted ofno covers or nesting. The ethics committees of both locationsapproved the study. The short-term findings to term ageshowed no difference in number of days of respiratory support,
intensive care days, short-term growth or neuromotor develop-mental outcome.19
The children were assessed at 1 and 2 years CA by psychologyinterns supervised by a clinical psychologist, who were blindedto whether the child was in the DC or C group. All agesmentioned hereafter are corrected for prematurity. Mental andpsychomotor development was assessed using the Dutchversion of the Bayley Scales of Infant Development II (BSID-II).20 21 The mean score of the mental developmental index(MDI) and the psychomotor developmental index (PDI) is 100,with 1 SD of 15 points. An MDI or PDI > 85 (> 21 SD) isconsidered normal, an MDI or PDI between 70 and 84 (22 to21 SD) is considered mildly delayed, and index scores ( 69 (,22 SD) severely delayed. The Dutch norms, which becameavailable during our research, were used.
A standardised neurological examination at 1 year, asdescribed by Touwen,22 23 and at 2 years, as described byHempel,24 was administered by neonatologists experienced indevelopmental assessments and blinded to the group assign-ment of the child. They were classified as definitely abnormal(DA) when there was definite neurological dysfunction such ascerebral palsy, mildly abnormal (MA) in the presence of milddeviations in muscle tone regulation, reflexes, fine or grossmotor performance, or cranial nerve function, or normal (N). Toobtain a single outcome measure, neurological outcome, PDIand MDI were combined. When at least one of these threeoutcome measures was DA, children were considered to be DA,and when at least one outcome measure was MA, children wereconsidered to be MA.
Weight was measured on a paediatric digital scale, length wasmeasured from crown to heel with the child lying supine on astandard measurement board, and head circumference wasmeasured around the largest area of the head (occipital–frontalcircumference) using a non-stretch tape measure.
Statistical analysisData were analysed using SPSS V12.0 for Windows. Outcomeparameters and infant and parental characteristics werecompared with the t test, Mann–Whitney test or x2 test (fortrend) where appropriate. p,0.05 was considered significant.Linear regression was used to evaluate the influence of theduration of the intervention on 1 and 2 year outcomes bytesting if there was an interaction effect between the interven-tion duration and the treatment groups.
RESULTSIn total, 192 infants were recruited for the study; 98 in the DCgroup and 94 in the C group. Thirteen infants (DC = 7, C = 6)were excluded because they were admitted for less than 5 daysor died within the first 5 days. One of the six infants in the Cgroup was taken out of the study on day 3 at the parents’request. A total of 179 infants met the inclusion criteria: 12/91(13.2%) in the DC group and 8/88 (9.1%) in the C group diedduring hospitalisation, with the main cause of death beingcerebral or pulmonary complications. Two infants in each groupdied from necrotising enterocolitis. There was no significantdifference in the in-hospital mortality between the DC and Cgroup (p = 0.40). This left 159 infants (DC = 79, C = 80) forfollow-up. At 1 year, four infants were lost to follow-up in theDC group and seven infants in the C group because they weretransferred to hospitals out of the health region or parents didnot come back for follow-up. One infant in the DC group diedbetween term age and 1 year. Between 1 and 2 years, two
Figure 1 Infants in the developmental care study. DC, developmentalcare; C, control; CA, corrected age.
Original article
Arch Dis Child Fetal Neonatal Ed 2009;94:F92–F97. doi:10.1136/adc.2008.141002 F93
on 5 March 2009 fn.bmj.comDownloaded from

children in the DC and three children in the C group were lostto follow-up because of parents moving or not wanting tocontinue with the follow-up. The baseline data from the infantswho were lost to follow-up were comparable to those from theinfants who were assessed (data not shown). There were 147children (DC = 74/79 (93.7%), C = 73/80 (91.3%)) at 1 year and142 children (DC = 72/79 (91.1%), C = 70/80 (87.5%)) at 2 yearsseen at the follow-up clinic (fig 1). No significant differences ininfant and parental characteristics were found (tables 1 and 2).
Developmental outcomesOur primary outcome in which the power analysis wascalculated was developmental outcome at 1 and 2 years. At 1year, 145 children (DC = 73, C = 72) of the 147 children seen atfollow-up were tested with the Bayley Scales-II–NL, and at 2years of age 140 (DC = 70, C = 70) of the 142 children weretested. Three children (DC = 1, C = 2) were 13–14 months oldat the 1 year developmental follow-up, and eight children
(DC = 4, C = 4) tested were 26–27 months at 2 years, but theirindex scores were based on the norms for that age, so weincluded them in the analysis. There was no difference in themean age of all children assessed at the 1 and 2 year follow-up.
Two children had no developmental test because of illness orbecause they were uncooperative. At 1 year, the children in theDC group showed a trend of a higher PDI than those in the Cgroup (p = 0.05) but no significant difference (p = 0.56) in theirMDI. At 2 years, this difference was no longer evident, as theMDI and PDI scores were comparable (table 3).
Neurological outcomesThere were 147 (DC = 74, C = 73) children who were assessedwith a neurological examination at 1 year, and 140 (DC = 71,C = 69) children at 2 years. Two children (DC = 1, C = 1) werenot tested at 2 years because they were uncooperative. Nodifferences in neuromotor development at 1 year and 2 years ofage were found between the DC and C group (table 4).
Table 1 Medical background variables of children seen at 1 and 2 year follow-up
Birth characteristic
1 year follow-up 2 year follow-up
DC (n = 74) C (n = 73) DC (n = 72) C (n = 70)
Gestational age (weeks)* 29.5 (1.6) 29.1 (1.9) 29.5 (1.6) 29.1 (1.9)
Range 25.9–31.9 25.0–31.9 25.9–31.9 25.0–31.9
Birth weight (g)* 1248.4 (338.1) 1238.5 (337.2) 1266.3 (329.6) 1236.6 (338.5)
Range 585–2155 640–2080 585–2155 640–2080
Male gender 39/74 (52.7) 46/73 (63.0) 38/72 (52.8) 44/70 (62.9)
SGA
SGA P,10 and P>3 8/74 (10.8) 6/73 (8.2) 8/72 (11.1) 5/70 (7.1)
SGA P,3 6/74 (8.1) 4/73 (5.5) 4/72 (5.6) 4/70 (5.7)
Inborn{ 46/74 (62.2) 46/72 (63.9) 45/72 (62.5) 44/70 (62.9)
Apgar scores at 5 min n = 74 n = 72{ n = 72 n = 69{Median (range) 9.0 (2–10) 8.0 (5–10) 9.0 (2–10) 8.0 (5–10)
CRIB score* 3.2 (2.9) 3.7 (2.9) 3.0 (2.7) 3.8 (3.0)
Range 0–13 0–11 0–10 0–11
Data are number (%), unless otherwise indicated. Comparisons were performed using x2 test or t tests where appropriate.*Mean (SD).{Infants born in the participating tertiary neonatal centre.{Correct number is shown in table if there are missing values.C, control group; CRIB, clinical risk index for babies26; DC, developmental care group; SGA, small for gestational age (P,10, lessthan the 10th centile, etc).
Table 2 Parental background variables
1 year follow-up 2 year follow-up
DC C DC C
Maternal age (years) n = 74 n = 73 n = 72 n = 73
mean (SD) 31.3 (5.1) 31.4 (4.9) 32.5 (5.1) 31.4 (4.9)
Paternal age (years) n = 70 n = 69 n = 67 n = 69
mean (SD) 34.3 (5.3) 35.0 (5.7) 35.0 (5.2) 35.0 (5.7)
Mother caucasian 48/74 (64.9) 53/73 (72.6) 48/74 (64.9) 53/73 (72.6)
Father caucasian 52/74 (70.3) 56/73 (76.7) 52/74 (70.3) 56/73 (76.7)
Education level of mother*
Low 34/74 (46.0) 23/72 (32.0) 32/71 (45.1) 23/72 (32.0)
Intermediate 24/74 (32.4) 33/72 (45.8) 23/71 (32.4) 33/72 (45.8)
High 16/74 (21.6) 16/72 (22.2) 16/71 (22.5) 16/72 (22.2)
Education level of father*
Low 26/74 (35.2) 19/71 (26.8) 26/71 (36.6) 19/71 (26.8)
Intermediate 30/74 (40.5) 29/71 (40.8) 28/71 (39.4) 29/71 (40.8)
High 18/74 (24.3) 23/71 (32.4) 17/71 (23.9) 23/71 (32.4)
Data are number (%) unless otherwise indicated. Comparisons were performed using x2 test (for linear trend) or t tests whereappropriate.*Low = vocational training, intermediate = high school, high = college/university.C, control group; DC, developmental care group.
Original article
F94 Arch Dis Child Fetal Neonatal Ed 2009;94:F92–F97. doi:10.1136/adc.2008.141002
on 5 March 2009 fn.bmj.comDownloaded from

Total outcome scoreWhen we combined the developmental and neurologicaloutcome measures into one score, the percentage of childrenin the C group who were definitely delayed at both 1 and 2years was much higher than in the DC group (1 year:DC = 12.2%, C = 23.3%; 2 years: DC = 5.6%, C = 18.3%).However, the difference did not reach the level of significance(table 4).
We then carried out a linear regression analysis to see if thenumber of days on which infants received the DC interventioninfluenced the neurological outcomes at 1 and 2 years by testingif there was an interaction effect between the interventionduration and the two treatment groups. No significant effect onthe neurological outcome at 1 year (p = 0.79) or 2 years(p = 0.67) or on the combined neurological and developmentalscores at 1 year (p = 0.86) and 2 years (p = 0.60) was found.
GrowthAt 1 year, one child from the C group was not measured, and at2 years one child from the DC group and one child from the Cgroup were not measured. No significant differences in growth(weight in grams, height and head circumference in centimetres)were found between the DC and C group at 1 or 2 years. Whenwe calculated the standard deviation scores (SDS) using theDutch growth charts, we found no differences in weight andhead circumference between the groups, and the DC groupshowed a significantly (p = 0.04) better SDS for length than theC group. There were, however, more infants in the C group(11.3%) than in the DC group (4.4%) who required postnatalcorticosteroids (p = 0.08), the usual dosage being 0.20 mg/kg/day in two doses with tapering of the dosage over a period of16 days. As this may influence growth, we corrected for use ofpostnatal steroids and then found no significant difference in
Table 3 Mental and psychomotor development at 1 and 2 years corrected age
1 year 2 years
DC (n = 73) C (n = 72) p Value DC (n = 70) C (n = 70) p Value
Age at test(months)*
12.14 (0.34) 12.14 (0.40) 0.99 24.3 (0.68) 24.1 (0.47) 0.12
Range 11.2–13.2 11.4–12.1 23.2–26.4 23.5–27.4
MDI* 102.3 (15.1) 101.2 (15.7) 0.66 100.9 (14.9) 102.3 (16.2) 0.58
Range (57–138) (55–132) (55–130) (56–132)
PDI* 99.2 (17.0) 93.7 (16.1) 0.05 96.0 (14.6) 92.3 (17.0) 0.18
Range (55–135) (55–124) (55–121) (55–145)
MDI classificationscores{
>85 64 (87.7) 62 (86.1) 0.69 61 (87.1) 60 (85.7) 1.00
70–84 7 (9.6) 7 (9.7) 7 (10.0) 9 (12.9)
(69 2 (2.7) 3 (4.2) 2 (2.9) 1 (1.4)
PDI classificationscores{
>85 62 (84.9) 56 (77.8) 0.27 54 (77.1) 48 (68.6) 0.20
70–84 6 (8.2) 8 (11.1) 13 (18.6) 16 (22.9)
(69 5 (6.8) 8 (11.1) 3 (4.3) 6 (8.6)
Data are number (%) unless otherwise indicated. Comparisons were performed using the x2 test (for linear trend) or t tests whereappropriate (p,0.05 is significant).*Mean (SD).{> 85 = normal or above normal, 70–84 = mildly delayed, ( 69 = significantly delayed.C, control group; DC, developmental care group; MDI, mental developmental index; PDI, psychomotor developmental index.
Table 4 Neurological outcomes and combined score of neurological outcomes, MDI and PDI at 1 and 2years corrected age
1 year 2 years
DC C p Value DC C p Value
Neurologicaloutcome
n = 74 n = 73 n = 71 n = 69
N 56 (75.7) 52 (71.2) 0.25 50 (70.4) 46 (66.7) 0.18
MA 13 (17.5) 10 (13.7) 17 (24.0) 11 (15.9)
DA 5 (6.8) 11 (15.1) 4 (5.6) 12 (17.4)
Combinedneurological score(MDI and PDI)
n = 74 n = 73 n = 72* n = 71{
N 48 (64.8) 45 (61.6) 0.26 38 (52.8) 37 (52.1) 0.25
MA 17 (23.0) 11 (15.1) 30 (41.7) 21 (29.6)
DA 9 (12.2) 17 (23.3) 4 (5.6) 13 (18.3)
Neurological examination at 1 year was as described by Touwen22 23 and that at 2 years as described by Hempel.24 Data arenumber (%). Comparisons were performed using x2 test (for linear trend) where appropriate.*One child’s combined score was derived from the PDI and MDI.{The combined scores of two children were derived from the PDI and MDI.C, control group; DA, definitely abnormal (MDI/PDI score (69); DC, developmental care group; MDI, mental developmental index;N, normal (MDI/PDI score >85); MA, mildly abnormal (MDI/PDI score 70–84); PDI, psychomotor developmental index.
Original article
Arch Dis Child Fetal Neonatal Ed 2009;94:F92–F97. doi:10.1136/adc.2008.141002 F95
on 5 March 2009 fn.bmj.comDownloaded from

length SDS between the two groups (p = 0.10) as shown intable 5. No differences were found in the incidence ofbronchopulmonary dysplasia (oxygen dependent at .36 weeks’gestational age) or oxygen requirement at .28 days of lifebetween the two groups.19
DISCUSSIONThis randomised controlled trial showed that a less intensive,cost-saving form of developmental care had no positive effect onneurological and mental development or growth at 1 and 2 yearsin infants born at ,32 weeks. A positive effect on psychomotordevelopment at 1 year did not continue at 2 years of age.
Some differences were seen between the neuromotor anddevelopmental scores, which may be explained by the fact thatthe Touwen and Hempel techniques measure minor qualitativeneuromotor dysfunction, whereas the BSID-II PDI measuresmotor skills, identifies motor delays, and gives a quantitativescore. When we combined the scores into a single ‘‘mildlyabnormal’’ or ‘‘definitely abnormal’’ score in order to obtain aclearer picture of the outcome, the difference between thegroups remained insignificant.
We also looked at the number of days in which infants hadreceived developmental care when hospitalised to see if thatpositively influenced neurological and developmental outcomesat 1 and 2 years, but found no interaction effect. In addition,when growth SDS were corrected for postnatal steroid use, wefound no difference in growth outcomes.
To date, there has been no large randomised controlled trialexamining growth and neurodevelopmental outcome of a basicdevelopmental care programme. Therefore comparison withother studies is not possible. Most studies have examined themore intensive individualised NIDCAP developmental careprogramme and had smaller sample sizes and mixed results.15–
18 Most outcomes of developmental care studies have focused onshort-term morbidity and growth or neurodevelopment up to9–12 months,11 15 17 with one study that followed infants’development to 3 years showing no significant difference indevelopment between the two groups16 and at preschool age apossible positive effect on behaviour. However, these outcomesshould be interpreted with caution because of the small samplesize.25 No studies have been reported in the Cochrane meta-analysis examining the effect of basic developmental careprogrammes such as ours on neurodevelopment.18
We have tried with this study to answer some of thequestions posed concerning developmental care and follow-up
to 2 years of age. The infants were randomised in an appropriatemanner; however, there could be no blinding of the interven-tion, as the infants in the DC group had incubator covers andnesting. This did make it easier to ensure a strict control groupin which control infants were not provided with any nesting orincubator covers, as this was the standard method of care whenthis trial began and so was easy to maintain during the studyperiod. The percentage of infants lost to follow-up was low, theassessors were blinded to the treatment group, and neurologicaloutcomes were obtained using a standardised neurologicalexamination.
We hypothesised that, by reducing stress and promotingphysiological stability through the use of incubator covers andnesting, the stability provided to the infants during their NICUhospitalisation would positively affect their later growth anddevelopment. However, this was not the case. For futureresearch it is important to note that this commonly used formof developmental care showed no long-lasting positive effects upto 2 years of age. Perhaps a more intensive, individualiseddevelopmental care programme such, as NIDCAP, for a longerduration would show improved outcomes.
Acknowledgements: We thank Sylvia M van der Pal, PhD, Monique de Haan, MD,Monique Rijken, MD, PhD, Shirley Martens, MD, Jan Feenstra, Clinical Psychologist,Tanja Kooij, BA, Psychological Assistant, Annelijn Kruger, MSc and the psychologyinterns, Department of Pediatrics, Leiden University Medical Center, for theircontribution to this research project.
Funding: This study was funded by the ZONMW (grant 2100.0072) and the HealthCare Efficiency Research Fund LUMC.
Competing interests: None.
Ethics approval: Obtained.
Patient consent: Parental consent obtained.
REFERENCES1. Hack M, Fanaroff AA. Outcomes of children of extremely low birthweight and
gestational age in the 1990s. Semin Neonatol 2000;5:89–106.2. Stoelhorst GM, Rijken M, Martens SE, et al. Changes in neonatology: comparison of
two cohorts of very preterm infants (gestational age ,32 weeks): the Project OnPreterm and Small for Gestational Age Infants 1983 and the Leiden Follow-Up Projecton Prematurity 1996–1997. Pediatrics 2005;115:396–405.
3. Marlow N. Neurocognitive outcome after very preterm birth. Arch Dis Child FetalNeonatal Ed 2004;89:F224–8.
4. Luke B, Brown MB. The changing risk of infant mortality by gestation, plurality, andrace: 1989–1991 versus 1999–2001. Pediatrics 2006;118:2488–97.
5. Stoelhorst GM, Rijken M, Martens SE, et al. Developmental outcome at 18 and24 months of age in very preterm children: a cohort study from 1996 to 1997. EarlyHum Dev 2003;72:83–95.
Table 5 Growth outcomes at 1 and 2 years corrected age
Growth outcome
1 year 2 years
DC C p Value DC* C p Value p Value{
Weight (kg) n = 74 n = 72 n = 72 n = 69
Mean 9.31 (1.38) 9.11 (1.28) 0.37 11.9 (1.5) 11.5 (1.4) 0.10
SDS 20.72 (1.27) 20.94 (1.28) 0.31 20.69 (1.12) 21.03 (1.1) 0.08 0.18
Head circumference(cm)
n = 72* n = 71 n = 71 n = 68
Mean 46.4 (1.7) 46.2 (1.7) 0.42 48.6 (1.7) 48.2 (1.7) 0.14
SDS 20.15 (1.10) 20.38 (1.11) 0.21 20.06 (1.03) 20.41 (1.09) 0.06 0.10
Length (cm) n = 74 n = 70 n = 72 n = 69
Mean 74.7 (3.7) 74.1 (3.6) 0.36 87.3 (3.6) 86.0 (4.0) 0.06
SDS 20.54 (1.27) 20.77 (1.31) 0.29 20.36 (1.06) 20.75 (1.24) 0.04 0.10
Data are mean (SD). Comparisons were performed using t tests (p,0.05 was considered significant).*Correct number is shown in table if there are missing values.{After correction for postnatal steroid use.C, control group; DC, developmental care group; SDS, standard deviation scores.27
Original article
F96 Arch Dis Child Fetal Neonatal Ed 2009;94:F92–F97. doi:10.1136/adc.2008.141002
on 5 March 2009 fn.bmj.comDownloaded from

6. Rijken M, Stoelhorst GM, Martens SE, et al. Mortality and neurologic, mental, andpsychomotor development at 2 years in infants born less than 27 weeks’ gestation:the Leiden follow-up project on prematurity. Pediatrics 2003;112:351–8.
7. Bhutta AT, Cleves MA, Casey PH, et al. Cognitive and behavioral outcomes ofschool-aged children who were born preterm: a meta-analysis. JAMA2002;288:728–37.
8. Als H, Gibes R. Newborn Individualized Developental Care and Asessment Program(NIDCAP) training guide. Boston: Children’s Hospital, 1990.
9. Als H. A synactive model of neonatal behavioral organization: framework for theassessment of neurobehavioral development in the premature infant and for supportof infants and parents in the neonatal intensive care environment. In: Sweeney JK,ed. The high-risk neonate: developmental therapy perspectives London: Routledge,1986:3–55.
10. Als H, Lawhon G, Brown E, et al. Individualized behavioral and environmental care for thevery low birth weight preterm infant at high risk for bronchopulmonary dysplasia:neonatal intensive care unit and developmental outcome. Pediatrics 1986;78:1123–32.
11. Als H, Lawhon G, Duffy FH, et al. Individualized developmental care for the very low-birth-weight preterm infant. Medical and neurofunctional effects. JAMA1994;272:853–8.
12. Westrup B, Kleberg A, von Eichwald K, et al. A randomized, controlled trial toevaluate the effects of the newborn individualized developmental care andassessment program in a Swedish setting. Pediatrics 2000;105:66–72.
13. Buehler DM, Als H, Duffy FH, et al. Effectiveness of individualized developmentalcare for low-risk preterm infants: behavioral and electrophysiologic evidence.Pediatrics 1995;96:923–32.
14. Fleisher BE, VandenBerg K, Constantinou J, et al. Individualized developmental carefor very-low-birth-weight premature infants. Clin Pediatr (Phila) 1995;34:523–9.
15. Ariagno RL, Thoman EB, Boeddiker MA, et al. Developmental care does not altersleep and development of premature infants. Pediatrics 1997;100:E9.
16. Kleberg A, Westrup B, Stjernqvist K. Developmental outcome, child behaviour andmother–child interaction at 3 years of age following Newborn IndividualizedDevelopmental Care and Intervention Program (NIDCAP) intervention. Early Hum Dev2000;60:123–35.
17. Kleberg A, Westrup B, Stjernqvist K, et al. Indications of improved cognitivedevelopment at one year of age among infants born very prematurely who receivedcare based on the Newborn Individualized Developmental Care and AssessmentProgram (NIDCAP). Early Hum Dev 2002;68:83–91.
18. Symington A, Pinelli J. Developmental care for promoting development and preventingmorbidity in preterm infants. Cochrane Database Syst Rev 2006;CD001814.
19. Maguire CM, Veen S, Sprij AJ, et al. Effects of basic developmental care onneonatal morbidity, neuromotor development, and growth at term age of infants whowere born at ,32 weeks. Pediatrics 2008;121:e239–45.
20. Bayley N. Bayley Scales of Infant Development. 2nd edn. San Antonio: ThePsychological Corporation, Harcourt Brace & Company, 1993.
21. Meulen BF, Ruiter SAJ, Spelberg HC, et al. BSID-II-NL, deel I: praktischehandleiding, Nederlandse versie. Lisse: Swets Testpublishers, 2002.
22. Touwen BCL. Neurological development in infancy. London: Heinemann, 1976.23. Touwen BCL. Development of neurological functions in the infant period.
Eur J Morphol 1995;33:320–1.24. Hempel MS. The neurological examination technique for toddler-age. Groningen:
University of Groningen, 1993.25. Westrup B, Bohm B, Lagercrantz H, et al. Preschool outcome in children born very
prematurely and cared for according to the Newborn Individualized DevelopmentalCare and Assessment Program (NIDCAP). Acta Paediatr 2004;93:498–507.
26. The International Neonatal Network. The CRIB (clinical risk index for babies)score: a tool for assessing initial neonatal risk and comparing performance of neonatalintensive care units. Lancet 1993;342:193–8.
27. Fredriks AM, van Buuren S, Burgmeijer RJ, et al. Continuing positive secular growthchange in The Netherlands 1955–1997. Pediatr Res 2000;47:316–23.
BMJ Masterclasses
BMJ Masterclasses are educational meetings designed specifically to meet the learning needs ofdoctors. They help doctors keep up to date with the latest evidence and recent guidelines in majorclinical areas, enabling them to use the latest evidence to make better decisions. The latest evidence,recent guidelines and best practice are delivered in an interactive and informative manner by leadingexperts. The speakers are specifically chosen as highly-skilled communicators who can authoritativelyenthuse the audience and interpret the latest research and guidelines into practical tips for busydoctors. BMJ Masterclasses have proved a huge hit with clinicians, with many saying they haveinfluenced their clinical practice.
http://masterclasses.bmj.com/
Original article
Arch Dis Child Fetal Neonatal Ed 2009;94:F92–F97. doi:10.1136/adc.2008.141002 F97
on 5 March 2009 fn.bmj.comDownloaded from

doi:10.1136/adc.2007.135921 online 17 Jul 2008;
2009;94;F98-F104; originally publishedArch. Dis. Child. Fetal Neonatal Ed. P Sáenz, M Cerdá, J L Díaz, P Yi, M Gorba, N Boronat, P Barreto and M Vento
randomised trialthe neonatal intensive care unit: a prospectiveenrolled in an early discharge programme from Psychological stress of parents of preterm infants
http://fn.bmj.com/cgi/content/full/94/2/F98Updated information and services can be found at:
These include:
References
http://fn.bmj.com/cgi/content/full/94/2/F98#BIBL
This article cites 29 articles, 10 of which can be accessed free at:
Rapid responses http://fn.bmj.com/cgi/eletter-submit/94/2/F98
You can respond to this article at:
serviceEmail alerting
the top right corner of the article Receive free email alerts when new articles cite this article - sign up in the box at
Notes
http://journals.bmj.com/cgi/reprintformTo order reprints of this article go to:
http://journals.bmj.com/subscriptions/ go to: Archives of Disease in Childhood - Fetal and Neonatal EditionTo subscribe to
on 5 March 2009 fn.bmj.comDownloaded from

Psychological stress of parents of preterm infantsenrolled in an early discharge programme from theneonatal intensive care unit: a prospectiverandomised trial
P Saenz,1 M Cerda,1 J L Dıaz,2 P Yi,2 M Gorba,1 N Boronat,1 P Barreto,2 M Vento1
1 Servicio de Neonatologıa,Hospital Universitario MaternoInfantil La Fe, Valencia, Spain;2 Departamento de Psicologıa dela Personalidad, Facultad dePsicologıa, Universidad deValencia, Valencia, Spain
Correspondence to:Maximo Vento, NeonatalResearch Unit, Servicio deNeonatologıa, HospitalUniversitario Materno Infantil LaFe, Avenida de Campanar, 21:E46009 Valencia, Spain;[email protected]
Accepted 16 June 2008Published Online First17 July 2008
ABSTRACTBackground: Psychological stress of parents of preterminfants is aggravated by prolonged hospitalisation. Earlydischarge programmes (EDPs) have been implemented toalleviate this situation.Objective: To evaluate parental psychological stress inan EDP for the first 3 months after neonatal intensive careunit (NICU) discharge.Design/methods: Prospective randomised trial compar-ing parents of preterm infants assigned to EDP (n = 72) orstandard discharge programme (SDP) (standard dis-charge) (n = 68). At discharge, parents were evaluatedusing the Hospital Anxiety and Depression Scale (HAD),and the Likert Scale for well-being every 10 days for3 months. Parental narrative of Worrying and Helpingissues was assessed using a semi-structured interview.Results: Length of stay was greater in the SDP group(p,0.01). HAD showed no differences in anxiety, but SDPmothers scored higher in depression (p,0.05).Altogether, parents reported a worrisome emotionalcondition (EDP 87.2%; SDP 80%), which decreased at theend of the study (EDP 45.2%; SDP 34.5%). Their baby’sphysical well-being was the most relevant issue in thenarrative for Worrying and Helping issues at discharge(EDP 69.2%; SDP 67.5%); however, it decreased at theend of the study (EDP 22.6%; SDP 24.1%). At discharge,the paediatrician’s support was more for the SDP group.No differences on the Well-Being Scale were found, butthe EDP group always scored better.Conclusions: Vulnerability of parents enrolled in an EDPdid not increase after hospital discharge. Physical well-being of the baby was the most important issue for bothgroups. EDP parents requested less paediatric supportand scored higher in the Well-being verbatim.Trial registration number: Registered at the ClinicalTrial Government Protocol Registration System noNCT00569608.
Over the past two decades the rate of survival ofextremely premature infants has substantiallyincreased in industrialised countries.1
Socioeconomic improvement, generalised obstet-rical care, and advances in neonatal care, includingregionalisation of neonatal intensive care, havedrastically contributed to reducing neonatal mor-tality.1–4 Concomitantly, the rate of prematurityhas increased due to socio-medical factors, such aswomen working outside the home, a delay in thefirst pregnancy, a more widespread use of assistedreproductive techniques, and an increased numberof uncontrolled pregnancies, especially among the
immigrant population. However, survival of extre-mely premature infants is inevitably associatedwith prolonging hospitalisation. As a consequence,neonates are separated from their families for longperiods of time and immersed in an environmentprone to causing medical and psychosocial prob-lems.5 6 Hence, babies admitted to the neonatalintensive care unit (NICU) will commonly experi-ence difficulties in establishing an adequate bond-ing with their parents.7 Parents have to acquaintthemselves with the ‘‘technological atmosphere’’of the NICU, and adapt to the emotional andphysical separation from their child.8 9 Earlydischarge programmes (EDPs) aimed at reducinghospitalisation substantially are meant to diminishparental emotional stress,10–14 in addition to redu-cing costs.15
Parental stress associated with admission to theNICU of a preterm infant has been extensivelystudied.16 However, very little information regard-ing the psychological impact of EDP upon parentalstress is available.12 13 17 18
The primary objective of our study was todetermine the degree of psychological stress asso-ciated with EDP from the NICU as compared withthe standard discharge programme (SDP). Wehypothesised that parental stress associated with
What is already known on this topic
c Prolonged hospitalisation of premature babiescauses significant parental stress in the form ofanxiety and depression.
c In addition, preterm babies experiencedifficulties in establishing an adequate bondingwith their parents.
What this study adds
c The early discharge programme, which includedinteraction with parents and backup with theprimary care paediatrician, substantiallyshortened the length of hospitalisation and didnot increase utilisation of public healthresources.
c In addition, it improved early parental-preterminteraction, thus helping to normalise effectiveparenthood earlier.
Original article
F98 Arch Dis Child Fetal Neonatal Ed 2009;94:F98–F104. doi:10.1136/adc.2007.135921
on 5 March 2009 fn.bmj.comDownloaded from

an EDP would be significantly higher when compared with anSDP. To test our hypothesis, we performed a prospective clinicaltrial assigning parents of premature infants born in ourMaternity Unit randomly to either an EDP or an SDP, andcompared the degree of anxiety, depression, general well-being,and buffer mechanisms used as protectors to overcome stress.
MATERIAL AND METHODS
MethodsDesignThis was a prospective, randomised, clinical trial performed at atertiary level NICU (Hospital La Fe, Valencia, Spain) includingpremature infants with birth weight ,2000 g or ,36 weeks’gestation, admitted to the NICU between October 2005 andOctober 2006. The primary care paediatrician (PCP) responsiblefor the patients enrolled after discharge from the hospital agreedto participate in the study.
A flow diagram of the study is shown in fig 1. Randomisationwas performed using computer-generated random numbers.Allocation was performed by using sealed opaque envelopesopened at the time of recruitment. This was performed wheneligible infants fulfilled the inclusion criteria which were: (i)reaching a postnatal weight of >1600 g; (ii) being clinicallystable defined as having normal arterial oxygen saturation(SpO2), heart rate, blood pressure, stools and urine output in theweek previous to discharge; absence of apnoeic episodes, full
enteral feeding, no procedures or medication needing hospita-lisation; and (iii) discharge planned at approximately 2 weeks.At this stage, parents were informed about the study by thestudy coordinator and consent was requested. Twins werealways assigned to the same study group because of thecharacteristics of the intervention.
Exclusion criteria included: (i) severe congenital malforma-tions; (ii) severity of clinical condition (eg, intraventricularhaemorrhage grade III or IV, moderate or severe bronchopul-monary dysplasia according to the NIH consensus definition,19
severe congenital infection); (iii) parents diagnosed with apsychological condition; (iv) non-Spanish-speaking parents; (v)refusal to participate by the assigned PCP.
REFERENCESSDP and EDP characteristicsThe SDP at our NICU includes the following at discharge:clinical stability as defined above; weight .2000 g; correctedgestational age >36 weeks; training of parents to fulfil theirinfant’s requirements adequately.
The EDP differed at discharge in weight (1600–2000 g);corrected age ((36 weeks); requirement of a stable socialbackground assessed by a sociological score >12 (see table 1)and programmed clinical visits with the PCP.
To evaluate psychological well-being in both groups, blindedpsychologist-performed phone interviews were held every10 days for 3 months post-discharge.
Perinatal variables and clinical follow-upMajor perinatal variables were obtained from the medicalrecords. Socio-economic variables were obtained using a scoringsystem specifically designed for this study (see table 1). Clinicalvariables including weight, length, head circumference, and typeof feeding were recorded by the PCP during the follow-up visits.When two or more of the programmed visits to the PCP weremissed, the case was considered lost to follow-up andconsequently excluded from the study.
Psychological assessmentEvaluation at dischargeLevel of psychological adjustment and emotional well-being wasevaluated using the Hospital Anxiety and Depression Scale(HAD), a self-evaluating scale used as an instrument to
Figure 1 Flow diagram of the study design. *Clinical stability wasdefined as having normal SpO2, heart rate, blood pressure, stools, andurine output in the week previous to discharge. BW, birth weight; GA,gestational age; PCP, primary care paediatrician; SpO2, arterial oxygensaturation.
Table 1 Sociological scoring applied to parents of premature infantsdischarged from the neonatal intensive care unit with an early orstandard discharge programme
Parameters scored Mother Father
Age Adolescent 2 points
Personal status Single 2 points
Pregnancy Not desired 2 points
Poorly monitored 1 point
Unmonitored 4 points
Residence Frequently changing 6 points 6 points
Homeless 8 points 8 points
Level of instruction Attended school .15 y 2 points 2 points
No school attendance 4 points 4 points
Economic resources Jobless at present 4 points 4 points
Without resources at all 8 points 8 points
Addictions Tobacco .5/d 2 points 2 points
Alcohol .2 drinks/d 4 points 4 points
Other drugs 8 points 8 points
Parents whose scoring was >12 points were not randomised.
Original article
Arch Dis Child Fetal Neonatal Ed 2009;94:F98–F104. doi:10.1136/adc.2007.135921 F99
on 5 March 2009 fn.bmj.comDownloaded from

determine anxiety and depression in a hospital context.20 Itcomprises 14 items with a range from 0 to 3. Subscales ofdepression and anxiety are also valid measures of the severity ofemotional changes. Items composing the subscale of depressionare widely based on the core symptoms of the psychopathologyof depression. Items composing the subscale of anxiety arebased on clinical manifestations of situational anxiety. Eachscale has a scoring range of 0 to 21. Scores above 10 areconsidered clinically significant.
Evaluation during follow-upFollow-up was performed by a blinded psychologist using aLikert-type Well-Being Scale20 and a semi-structured interviewfocusing on Worrying and Helping issues. Phone calls weremade every 10 days (nine calls per family) for 3 months post-discharge.
A) Worrying and Helping issuesA semi-structured interview was used to assess difficulties andresources. Both aspects were evaluated using two questions: (a)what has worried or disturbed you the most in the last week?And (b) what has helped you the most or made you feel betterin the last week? For each question, parents had three options torank responses. Answers were scored according to the order ofresponse (first, second or third place).
B) Well-Being ScaleIn order to achieve a comprehensive scoring of parentalemotional well-being we made a continuous register using aLikert-type scale. The scoring range for the answers was from 0to 10 (0 was the minimum, 10 the maximum). Scoring wasperformed using the following question: taking into considera-tion what has worried and helped you in the last days, howwould you score your feeling of well-being in the last days on ascale from 0 to 10?
Statistical analysisThis study is part of a more comprehensive EDP including3 months’ follow-up post-discharge by PCP. The study size wasoriginally calculated considering approximately 25% lost tofollow-up of initially enrolled patients. The power analysisindicated that 70 preterm infants were needed in the interven-tion and control groups, respectively, to achieve a reduction of10% in the psychological variables studied with a level ofsignificance a of 0.05.
Subjects were analysed in the study group to which they wereoriginally assigned (intention-to-treat analysis) Descriptivestatistics were calculated for all the variables determining thecharacteristics of the sample. We checked for normal distribu-tion and ensured an adequate variability. In addition, univariateanalyses were performed using student’s t test for variables withnormal distribution and non-parametric tests (Mann–WhitneyU test) for variables with a non-normal distribution. An analysisof variance was performed for variables having more than twopossible values. Calculations were made using SPSS 13.0software.
RESULTSPopulationThe EDP differed at discharge in weight (1600–2000 g);corrected age ((36 weeks); requirement of a stable socialbackground assessed by a sociological score >12 (see table 1)and programmed clinical visits to the PCP.
Figure 2 depicts the number of eligible, disregarded andincluded infants who completed the study. Thus, from a total of199 eligible infants, 171 patients were randomised. However, 59were excluded, so 140 completed the study. Twenty-eightinfants were excluded because they were not randomised orincorrectly randomised. After randomisation was completed,two infants (EDP group) were lost because they weretransferred to another hospital, and 13 infants (EDP group: 8;SDP group: 5) were disregarded because their parents refused tocontinue participating in the trial. In addition, 16 infants didnot complete the follow-up and were, therefore, excluded. Fromthe 140 babies who completed the study, 72 were assigned tothe EDP group and 68 to the SDP group.
No significant differences regarding major clinical character-istics were found between neonates in the control (SDP) andexperimental group (EDP) as shown in table 2, nor in theirparents’ characteristics (table 3). However, table 2 shows therewere significant differences at discharge regarding length ofhospital stay, weight, and length and head circumference.
Parents’ vulnerability at dischargeComparison of anxiety and depression between both groups ofparents at discharge using the HAD is shown in fig 3 (A and B).No differences regarding anxiety were found between mothersand fathers in either group. No differences in depressionbetween fathers in either group were found. However, mothersin the SDP group were significantly more depressed thanmothers in the EDP group (p,0.05).
Figure 2 Flow diagram illustrating enrolment of patients in the study.EDP, early discharge programme; SDP, standard discharge programme.
Original article
F100 Arch Dis Child Fetal Neonatal Ed 2009;94:F98–F104. doi:10.1136/adc.2007.135921
on 5 March 2009 fn.bmj.comDownloaded from

Emotional well-being during follow-upFigure 4 shows the results of the Likert-type scale performedevery 10 days for 3 months post-discharge from hospital.Although there are no significant differences between parents ofthe EDP and SDP groups, the former group consistentlyobtained better scores throughout the study.
Worrying in parentsFigure 5A shows the results of the narrative of parentalworrying for premature infants throughout the 3-monthfollow-up. As depicted in fig 5A, immediately after hospitaldischarge the majority of parents expressed concern. Thus,87.2% in the EDP group and 80% in the SDP group reported aworrisome emotional condition. However, in the followingweeks, the percentage of parents expressing a perception ofbeing worried decreased significantly in both groups. Moreover,at the end of the 3-month follow-up, 45.2% of parents in theEDP group and 34.5% in the SDP group expressed theiremotional situation as worrisome. Figure 5A shows that therewere no differences between the two groups at any point duringthe study.
When answers for parental concern were specifically ana-lysed, physical well-being of their children was the most frequentresponse immediately after discharge (EDP group: 69.2%; SDPgroup: 67.5%). However, this item rendered less significant andtowards the end of the study it was substantially reduced (EDPgroup: 22.6%; SDP group: 24.1%). Another relevant worryingissue immediately after discharge was achieving coordination ofthe tasks between the couple (EDP group: 15.3%; SDP group:22.5%). However, at the end of the study only 3% of parents inboth groups expressed worry in relation to this item. This resultreflects achievement of good coordination of tasks between thecouple, which helped to cope with the new situation. Otheranswers, such as difficulties in maintaining their social life, fear ofre-hospitalisation, jealousy of other siblings, children’s character etc.,never represented a significant percentage of responses in theinterviews throughout the study and tended to disappear.
Helping issues in parentsUndoubtedly, physical well-being of their children was perceived asthe most important item, helping parents overcome thestressful situation after hospital discharge. This item scored90% in both groups, but it lost relevance during follow-up and
by the end of the study, it represented 48.4% in the EDP and60% in the SDP.
Support of the PCP was an important helping issue for 53.8% ofparents in the EDP and for 42.5% in the SDP at discharge fromthe NICU. At the end of the follow-up, 33.3% in the EDP groupand 35.5% in the SDP group still considered it a relevant helpingissue. In addition, perception of an adequate psychomotordevelopment of the baby, although not perceived as relevantimmediately post-discharge, acquired more importance duringthe follow-up, and at 3 months after discharge, 64.5% in theEDP group and 63.3% in the SDP group scored this item ashighly relevant (see fig 5B).
Other factors like coordination of tasks between the couple,leisure activities, relationship among siblings, etc, never scoredhighly enough to be considered relevant.
DISCUSSIONPsychological stress in parents of extremely premature infantsdue to prolonged hospitalisation has been studied usingdifferent perspectives.9 10 16 21 22 Separation of a newly borninfant from its mother is considered the most stressful andnegative experience for both mother and child. Moreover, thequality of mother–infant relationship during the first days oflife has been reported as one of the most relevant factors capableof exacerbating or softening the adverse impact of pretermbirth, particularly in relation to subsequent competencies anddevelopment.23 However, early discharge may be associatedwith medical risks (eg, nutrition, haematology, infections),familial psychological stress (eg, anxiety, overprotection, fear)and/or overuse of medical facilities (eg, visits to the paedia-trician, visits to emergency wards, re-hospitalisation). In orderto avoid these negative consequences, hospital discharge ofpremature infants needs to be planned in advance following adhoc established checklists and guidelines.24–26
On the other hand, although many studies have analysed themedical and economical impact of early discharge pro-grammes1 14 15 27–29 few have acknowledged the influence ofEDP on normalising preterm infants’ environment and thuscontributing to provide the social support that may effectivelybuffer family distress.12 13 17 30
We hypothesised that an EDP, which transferred responsi-bility from professional caregivers to parents when their babywas still relatively immature, could increase parental psycholo-gical distress. Thus, it would be after hospital discharge whenparental psychological vulnerability would emerge. However,
Table 2 Major characteristics of the population enrolled in the earlydischarge programme and standard discharge programme from the NICU
Standarddischarge (n = 72)
Early discharge(n = 84)
pValue
Gestational age (wks)* 32 (29–35) 33 (30–35) 0.103
Mean (SD) birth weight (g) 1603 (373.9) 1629 (319.0) 0.651
Birth weight ,1500 g (%) 39.7 27.8 0.135
Mean (SD) birth height (cm) 41.5 (3.3) 41.3 (3.3) 0.761
Mean (SD) birth headcircumference (cm)
29.1 (2.0) 29.5 (1.9) 0.315
Male (%) 58.8 51.4 0.377
Multiples (%) 36.2 37.5 0.886
Admission to the NICU (%) 45.6 38.9 0.422
Neonatal length of stay (days)* 26 (11.6–57.2) 15.5 (6.0–47.5) 0.001
Mean (SD) discharge weight (g) 2169.1 (177.3) 1872.3 (93.1) 0.001
Mean (SD) discharge height (cm) 44.4 (1.7) 43.4 (1.5) 0.001
Mean (SD) discharge headcircumference (cm)
32.0 (1.2) 31 (1.0) 0.001
*Expressed as median with 5–95% centiles in parentheses.NICU, neonatal intensive care unit.
Table 3 Parental characteristics of infants enrolled in the study
Standard discharge(n = 77)
Early discharge(n = 94) p Value
Mother’s age (years) 30.96 32.29 0.095
Firstborn child (%) 69 55.4 0.134
Monoparental family (%) 1.7 3.6 0.615
Mother smoker (%) 12.1 5.4 0.205
Father smoker (%) 24.1 19.6 0.572
Mother’s school attendance,15 years of age (%)
5.2 3.6 0.517
Father’s school attendance,15 years of age (%)
8.6 5.4 0.378
Non-desired pregnancy (%) 0 3.6 0.239
Teenage mothers (%) 1.7 0 0.509
Previous abortions (%) 32.8 23.2 0.257
No differences were found for hospital emergency readmission, although the SDPexhibited a higher incidence (SDP: 10.3% vs EDP: 4.2%; non-significant).EDP, early discharge programme; SDP, standard discharge programme.
Original article
Arch Dis Child Fetal Neonatal Ed 2009;94:F98–F104. doi:10.1136/adc.2007.135921 F101
on 5 March 2009 fn.bmj.comDownloaded from

our results show that levels of anxiety in parents of EDPs arenot significantly different from SDPs.13 In Open Neonatal Units,where parents have free access to their babies 24 h a day, andwhere training in basic skills and in fulfilment of special needsrequired by hospitalised neonates is promoted, post-dischargeadaptation should seemingly be easier.29 In our study, althoughparents in the standard discharge group were allowed to enterthe NICU freely, they tended to rely more on the caregivers,while parents in the early discharge group were more willing totake over the responsibility of parenthood. Allen et al found thatmaternal anxiety, together with an increased parental percep-tion of child vulnerability, were the most significant variablesinfluencing an infant’s subsequent competencies and develop-ment.30 However, our results show that early discharge did notincrease the level of anxiety in mothers or fathers.12 13 Thus,although early discharge was seemingly an additional stressor
for parents, we found no significant differences in the level ofanxiety with the standard discharge group, which reveals asuccessful adaptation. Hence, EDP facilitated prompter normal-isation of family life. In studies that have compared early versusstandard discharge it has been found that maternal anxiety isincreased in mothers randomised to the standard group.17 In ourstudy, we found greater depression in mothers of the SDP thanin the EDP. It is possible that having been pronounced asefficient caregivers increased self-assurance and satisfaction inmothers of the EDP group.17 This finding is relevant becauseprevious studies on very low birth weight infants have describeda significant relationship between the severity of maternaldepression and children’s mental outcome,22 and alteredmethods of family coping.31 32 Preterm-birth-derived depression
Figure 4 Likert-type scale representing well-being scores of parents ofpreterm infants randomised to the early (EDP) and standard (SDP)discharge programmes, respectively. Scoring was obtained using aweekly phone interview during a 3-month period after hospital discharge.
Figure 5 (A) Graphic representation of for verbatim (narrative) scoresexpressing worries of parents of preterm infants randomised to an earlydischarge (EDP) or a standard discharge (SDP) programme. Scoring wasperformed weekly during a 3-month period after hospital discharge. (B)Evolution of the psychomotor development expressed as helping issue toovercome worrying situations. Scoring was performed weekly during a3-month period after hospital discharge.
Figure 3 (A) Graph representing mean and standard deviation forparental anxiety at discharge from the neonatal intensive care unit(NICU) as measured by the Hospital Anxiety and Depression Scale(HAD). (B) Graph representing mean and standard deviation for parentaldepression at discharge from the NICU as measured with the HAD Scale.Values within the box-plots graph represent median and quartiles.Outliers have been included. *p,0.05 mother’s depression standardversus early discharge.
Original article
F102 Arch Dis Child Fetal Neonatal Ed 2009;94:F98–F104. doi:10.1136/adc.2007.135921
on 5 March 2009 fn.bmj.comDownloaded from

may be the result of a lack of interaction between parents andtheir baby since they are excluded from its care while in theNICU.33 Therefore, our EDP, promoting an early transfer ofresponsibility to parents, may have minimised hospitalisation-derived depression. Future studies comparing different strategiesrelated to the different roles of parents in the NICU (familycoping) will help us to identify the main factors influencing theparental adaptation process.
After hospital discharge, parents in both groups expressedtheir concern about their infant’s care. However, serial inter-views in the following weeks revealed that the percentage ofparents expressing a perception of worry decreased significantlyand no differences between the two groups were found. Takinginto consideration that babies in the early discharge group weresmaller and younger at discharge, their perception of normalfamily life was achieved at an earlier post-conceptional age.Consequently, although the Well-Being Scale showed nosignificant differences between the two groups, parents in theEDP always scored better34; this could translate to a greaterconfidence in their efficacy as caregivers. However, a possiblelimitation in the follow-up was reliance on parental perceptionof the impact of the experience instead of having used objectivetools for the evaluation of parental stress. Notwithstanding,previous studies have shown that subjective reports on well-being are a valuable tool for measuring life satisfaction.21
In our study, after hospital discharge, family life and worrieswere focused on the baby’s physical well-being in both groupsas expressed in the verbatim narrative for parental worryingissues.34 Our findings are in accordance with the EPIPAGEstudy, which aimed at assessing parents’ psychological health2 months after discharge of very preterm infants.34 Theseresearchers used a semi-structured interview to unravel rolefactors in each of the parents. They too found feelings ofanxiety and depression in mothers. However, fathers seemedmore able to cope and overcome the traumatic event ofprematurity.34 Another key helping issue that contributed toovercoming parental distress was their perception of animprovement in their babies’ neurodevelopment. Therefore,physical well-being and adequate neurodevelopment seem to bethe most important factors that contribute to overcomingparental stress after hospital discharge.
Support given by the primary care paediatrician was also arelevant helping issue. Our National Health System providesuniversal free healthcare. Therefore, all babies included in thestudy had the possibility of free access to paediatric care. Duringfollow-up, 10.3% of babies from the SDP as compared with4.2% in the EDP were readmitted to hospital as an emergency.Seemingly, the closer follow-up programme established by theprimary care paediatricians for patients in the EDP contributedto reducing the need for re-hospitalisation.
In order to reduce parental stress, a future approach shouldinclude psychological intervention. It has been shown thatmaternal emotional responses deeply influence parenting ofpremature infants.23 Early individualised family-based interven-tion during hospitalisation and after discharge has proved toreduce maternal stress and depression and increase maternalself-esteem. Moreover, such intervention has improved earlyparental-preterm interactions and reduced the length ofhospitalisation.23 30
CONCLUSIONSOur EDP significantly reduced the length of hospitalisation ofpreterm babies without increasing family stress. After discharge,the most important concern of families in both the EDP and the
SDP was the baby’s physical well-being and neurodevelopment.Therefore, early discharge did not modify parental worryingissues or requests for help. However, it helped to normaliseparenthood earlier.
Close follow-up of premature infants performed by the PCPafter an early discharge can prevent and/or detect medicalproblems early on in the babies as well as psychological stress inparents, which could interfere with effective parenting.
Acknowledgements: This research work was financed by a grant (AP015/06) fromthe Consellerıa de Sanitat & Bienestar Social (Generalitat Valenciana) to MV and PS.Thanks are extended to the participating families and primary care paediatricians. Wewould like to express our special gratitude to Professor Avroy A Fanaroff (Division ofNeonatology; Rainbow Babies & Children’s Hospital; Cleveland; USA) for reviewing andediting the manuscript.
Competing interests: None.
Ethics approval: The trial protocol was approved by both the Ethics and ResearchCommittees of our hospital.
REFERENCES1. Fanaroff AA, Stoll BJ, Wright LL, et al and NICHD Neonatal Research Network.
Trends in neonatal morbidity and mortality for very low birth weight infants.Am J Obstet Gynecol 2007;196:147e1–e8.
2. Hintz SR, Van Meurs KP, Perritt R, et al; NICHD Neonatal Research Network.Neurodevelopmental outcomes of premature infants with severe respiratory failureenrolled in a randomized controlled trial of inhaled nitric oxide. J Pediatr2007;151:16–22.
3. Broitman E, Ambalavanan N, Higgins RD, et al; National Institute of Child Health andHuman Development Neonatal Research Network. Clinical data predictneurodevelopmental outcome better than head ultrasound in extremely low birthweight infants. J Pediatr 2007;151:500–5.
4. Wilson-Costello D, Friedman H, Minich N, et al. Improved neurodevelopmentaloutcomes for extremely low birth weight infants in 2000–2002. Pediatrics2007;119:37–45.
5. Ment LR, Vohr B, Allan W, et al. Change in cognitive function over time in very lowbirth-weight infants. JAMA 2003;289:705–53.
6. Whitfield MF, Grunau RE. Teenagers born at extremely low birth weight. PaediatrChild Health 2006;11:275–7.
7. Feldman R, Eidelman AI. Maternal postpartum behaviour and the emergence ofinfant-mother and infant-father synchrony in the preterm and full-term infants: therole of neonatal vagal tone. Dev Psychobiol 2007;49:290–302.
8. Fowlie PW, Mc Haffie H. ABC of preterm birth. Supporting parents in the neonatalunit. BMJ 2004;329:1336–8.
9. Jotzo M, Poets CF. Helping parents cope with the trauma of premature birth: anevaluation of a trauma-preventive psychological intervention. Pediatrics2005;115:915–19.
10. Charpak N, Ruiz JG, Figueroa de Calume Z. What is the issue when discharging‘‘premies’’: early discharge from hospital or early integration with the family? ActaPaediatr 2001;90:1105–6.
11. Saenz P, Diaz Cordobes JL, Cerda M, et al. Psychological follow up of parents ofpreterm infants enrolled in an early discharge programme from the NICU. EPAS2007;616280.27.
12. Saenz P, Cerda M, Gorba M, et al. Psychological distress in parents of prematureinfants at discharge from the NICU. EPAS 2007;616289.26.
13. Merritt TA, Pillers D, Prows SL. Early NICU discharge of very low birth weightinfants: a critical review and analysis. Semin Neonatol 2003;8:95–115.
14. Merritt TA, Raddish M. A review of guidelines for discharge of premature infants:opportunities for improving cost effectiveness. J Perinatol 1998;18:S27–37.
15. Yee W, Ross S. Communicating with parents of high-risk infants in neonatal intensivecare. Paediatr Child Health 2006;11:291–4.
16. Ortenstrand A, Winblandh B, Nordstrom G, et al. Early discharge of preterm infantsfollowed by domiciliary nursing care parents’ anxiety assessment of infant health andbreastfeeding. Acta Paediatr 2001;90:1190–5.
17. Kaaresen PI, Ronning JA, Ulvund SE, et al. A randomized, controlled trial of theeffectiveness of an early-intervention programme in reducing parenting stress afterpreterm birth. Pediatrics 2006;118:9–19.
18. Ehrenkranz RA, Walsh MC, Vohr BR, et al for the National Institutes of Child Healthand Human Development Neonatal Research Network. Validation of the NationalInstitutes of Health Consensus Definition of Bronchopulmonary Dysplasia. Pediatrics2005;116:1353–60.
19. Zigmond AS, Snaith RP. Anxiety and depression scale. Acta Psychiatrica Scand1983;67:361–70.
20. Likert R. A technique for the measurement of attitudes. Arch Psychol1932;140:1–55.
21. Singer LT, Salvator A, Guo S, et al. Maternal psychological distress andparenting stress after the birth of a very low-birth-weight infant. JAMA1999;281:799–805.
Original article
Arch Dis Child Fetal Neonatal Ed 2009;94:F98–F104. doi:10.1136/adc.2007.135921 F103
on 5 March 2009 fn.bmj.comDownloaded from

22. Forcada-Guex M, Pierrehumbert B,Borghini A,et al. Early dyadic patterns of mother-infantinteractions and outcomes of prematurity at 18 months. Pediatrics 2006;118:e107–14.
23. Arnaud F. Discharge of very preterm infants from neonatology: check list. J GynecolObstet Biol Reprod 2004:S108–10.
24. Sauve R, Lee SK. Neonatal follow-up programmes and follow-up studies: Historicaland current perspectives. Paediatr Child Health 2006;11:267–70.
25. Executive Committee of the Connecticut Chapter of the AAP. NeonatalIntensive care Unit (NICU). Discharge Guidelines 2005.
26. Kotagal UR, Perlstein PH, Gamblian V, et al. Description and evaluation of aprogramme for the early discharge of infants from a neonatal intensive care unit.J Pediatr 1995;127:285–90.
27. Casiro OG, McKenzie Me, McFadyen L, et al. Earlier discharge with community-based intervention for low birth weight infants: a randomized trial. Pediatrics1993;92:128–34.
28. Raddish M, Merrit TA. Early discharge of premature infants. A critical analysis. ClinPerinatol 1998;25:499–520.
29. Melnyk BM, Feinstein NF, Alpert-Gillis L, et al. Reducing premature infants’ length ofstay and improving parents’ mental health outcomes with the creating opportunitiesfor parent empowerment (COPE) neonatal intensive care unit programme: arandomized, controlled trial. Pediatrics 2006;118:e1414–27.
30. Allen EC, Manuel JC, Legault C, et al. Perception of child vulnerability amongmothers of former premature infants. Pediatrics 2004;113:267–73.
31. Spear ML, Leef K, Epps S, et al. Family reactions during infants’ hospitalization in theneonatal intensive care unit. Am J Perinat 2002;19:205–13.
32. Wigert H, Johansson R, Berg M, et al. Mothers’ experiences of havingtheir newborn child in a neonatal intensive care unit. Scand J Caring Sci2006;20:35–41.
33. Vento M, Saenz P, Valle S, et al. Early discharge programme from the NICU with co-operation of the Primary Care Paediatrician. EPAS 2006;595535.204.
34. Garel M, Bahaud M, Blondel B. Consequences for the family of a very preterm birthtwo months after discharge. Results of EPIPAGE qualitative study. Arch Pediatr2004;11:1299–307.
The seasonal orchidometer
In springtime, as crocuses emerge, daffodils blossom and lambsgambol in the fields, paediatricians’ thoughts naturally turn toorchidometers. A seminal paper in 2001 elegantly demonstratedhow a Teaser sweet could be substituted for an 8 mlorchidometer bead.1 This provided grateful paediatricians witha readily available means to assess mid-puberty in adolescentboys as well as a source of sustenance at the end of a busy clinic.To the dismay of many paediatricians, by 2007 the testicularTeaser had mutated into a flat-bottomed dome that retained itsedible qualities but was quite useless as an orchidometersubstitute.2 The manufacturer was urged to reinstate Teasersto their former aesthetic and functional glory. Fortunately, asshown in the illustration, the Teaser has been refashioned intoits celebrated orchidometer shape, although somewhat dimin-ished as a 6 ml rather than 8 ml orchidometer bead, along withGalaxy, Mars and Milky Way mini eggs. Furthermore, theEastertide appearance of the Cadbury mini creme egg providesan excellent substitute for the 10 ml orchidometer bead with allthe tactile and edible qualities so well described in relation tothe Teaser. The standard Cadbury creme egg, although slightlytoo large to substitute as an orchidometer bead, is a usefulindicator of a pathologically enlarged testis. Each spring,paediatricians should grasp this seasonal opportunity of anedible orchidometer with both hands. We’ve got the balls—let’snot be afraid to use them.
C Durand, J Gibbs
Department of Paediatrics, Countess of Chester Hospital, Chester, Cheshire, UK
Correspondence to: J Gibbs, Department of Paediatrics, Countess of ChesterHospital, Liverpool Road, Chester CH2 1UL, Cheshire, UK ; [email protected]
Acknowledgements: Thanks to R Cooke for his photographic expertise and forrefraining from eating the artwork.
Competing interests: None.
Arch Dis Child Fetal Neonatal Ed 2009;94:F104. doi:10.1136/adc.2008.140921
REFERENCES1. Bhalla P, Sally, Pippa, et al. An inexpensive and edible aid for the diagnosis of puberty
in the male: multispecies evaluation of an alternative orchidometer. BMJ2001;323:1486.
2. Williams G, Dharmaraj P. Dissent of the testis. BMJ 2007;335:1287.
Figure 1 The seasonal orchidometer.
Images in neonatal medicine
Original article
F104 Arch Dis Child Fetal Neonatal Ed March 2009 Vol 94 No 2
on 5 March 2009 fn.bmj.comDownloaded from