ADB Working Paper Series on Regional Economic … crisis, growing by over 9% in both 2008 and 2009....
40
The PRC’s Free Trade Agreements with ASEAN, Japan, and the Republic of Korea: A Comparative Analysis Gemma Estrada, Donghyun Park, Innwon Park, and Soonchan Park No. 92 | January 2012 ADB Working Paper Series on Regional Economic Integration
Transcript of ADB Working Paper Series on Regional Economic … crisis, growing by over 9% in both 2008 and 2009....

The PRC’s Free Trade Agreements with ASEAN, Japan,and the Republic of Korea: A Comparative Analysis
Gemma Estrada, Donghyun Park, Innwon Park, and Soonchan ParkNo. 92 | January 2012
ADB Working Paper Series onRegional Economic Integration

Gemma Estrada+, Donghyun Park++,Innwon Park+++, and Soonchan Park++++
The PRC’s Free Trade Agreements with ASEAN, Japan,and the Republic of Korea: A Comparative Analysis
ADB Working Paper Series on Regional Economic Integration
No. 92 January 2012
+Economics Officer, Economics and Research Department, Asian Development Bank. [email protected]
++Principal Economist, Economics and Research Department, Asian Development Bank. [email protected]
+++Professor, Division of International Studies, Republic of Korea University. [email protected]
++++Associate Professor, Department of Economics and International Trade, Kongju National University. [email protected]

The ADB Working Paper Series on Regional Economic Integration focuses on topics relating to regional cooperation and integration in the areas of infrastructure and software, trade and investment, money and finance, and regional public goods. The Series is a quick-disseminating, informal publication that seeks to provide information, generate discussion, and elicit comments. Working papers published under this Series may subsequently be published elsewhere.
Disclaimer: The views expressed in this publication are those of the authors and do not necessarily reflect the views and policies of the Asian Development Bank (ADB) or its Board of Governors or the governments they represent. ADB does not guarantee the accuracy of the data included in this publication and accepts no responsibility for any consequence of their use. By making any designation of or reference to a particular territory or geographic area, or by using the term “country” in this document, ADB does not intend to make any judgments as to the legal or other status of any territory or area. Unless otherwise noted, $ refers to US dollars. © 2012 by Asian Development Bank January 2012 Publication Stock No. WPS114223

Contents Abstract v
1. Introduction 1
2. Qualitative Assessment of the PRC–ASEAN FTA and Potential FTAs with Japan and the Republic of Korea 4
2.1 Size of FTA 5
2.2 Income and Development Level 5
2.3 Geographical Proximity and Transport Infrastructure 7
2.4 Pre-FTA Trade 7
2.5 Substitutability of Products 10
2.6 Complementary Economic Structures 10
2.7 Pre-FTA Tariff Rates 12
3. Quantitative Assessment of the PRC’s FTAs with ASEAN, Japan, and the Republic of Korea 12
3.1 CGE Model and Analysis of the Impact of FTAs–A Brief Overview 13
3.2 Empirical Framework and Results 14
4. Concluding Observations 18
References 20
ADB Working Paper Series on Regional Economic Integration 22
Figures
1. Exports to the PRC as Share of Total Exports among Select East and Southeast Asian Economies, 1990–2008 1
2. Imports from the PRC as Share of Total Imports among Select East and Southeast Asian Economies, 1990–2008 2
3. The PRC's Imports from East and Southeast Asia by Commodity Classification, 1996–2008 3
4. ASEAN-6 Quarterly Export Volumes to the PRC, 2008Q1–2010Q1 3

Tables
1. Population and GDP in East and Southeast Asia 6
2. Per Capita Income in East and Southeast Asia 6
3. Geographical Proximity among Asian Economies 8
4. Intraregional Exports within ASEAN+3, 2006–2008 9
5. Intraregional Imports within ASEAN+3, 2006–2008 9
6. Intraregional Trade within ASEAN+3, 2006–2008 10
7. Substitutability of Products: Revealed Comparative Advantage (RCA), 2006–2008 Average 11
8. Complementarity Index, 2006–2008 12
9. Applied Tariff Rate—Simple Mean of All Products 13
10. Model Aggregations 15
11. Output and Welfare Effects of FTAs—CJFTA, CKFTA, ACFTA, and ASEAN+3 17

Abstract The role of the People’s Republic of China (PRC) in East Asia’s recovery from the recent global financial and economic crisis highlighted the PRC’s growing role as an engine of growth for the region. From the viewpoint of the PRC, there are many potential gains from entering into free trade agreements (FTAs) with its neighbors, who collectively form a large and fast-growing market. In this paper we qualitatively and quantitatively assess the four main permutations of the PRC’s FTAs with the region’s major economies: PRC–ASEAN, PRC–Japan, PRC–Republic of Korea, and ASEAN+3. We compare the effects of the FTAs on the PRC’s output and welfare. Our comparative analysis shows that the PRC would gain from all three bilateral FTAs, while gaining the most from a larger region-wide FTA such as ASEAN+3. Keywords: ASEAN, PRC, Japan, Republic of Korea, trade, free trade agreement, free trade area, CGE model JEL Classification: F10, F14, F15

The PRC’s Free Trade Agreements with ASEAN, Japan, and the Republic of Korea | 1
0
11
22
33
44
55
1990 1992 1994 1996 1998 2000 2002 2004 2006 2008
%
Hong Kong, China IndonesiaKorea, Rep. of MalaysiaPhilippines SingaporeTaipei,China ThailandJapan
1. Introduction The People’s Republic of China’s (PRC) rapid and sustained growth over the past 30 years is a feat unparalleled by any other major economy in recent history. Never before has such a huge country grown so fast over such a long period. With growth averaging about 10% per year the PRC’s share of world gross domestic product (GDP) rose to 14% in 2010 from only about 2% in 1980. In terms of purchasing power parity, the PRC now ranks as the world’s second largest economy after the United States (US), having moved ahead of Japan in 2010. The PRC’s significant integration into the world economy, especially the global trading system, goes a long way toward explaining its rapid growth. Its share of world exports rose from only 1% in 1980 to about 10% in 2009. In the 1980s, East and Southeast Asia, led by Japan and Hong Kong, China, absorbed the bulk of the PRC’s exports. But since the end of the 1990s major industrial economies, particularly the US and members of the European Union (EU), have become the PRC’s most important trading partners, accounting for nearly 40% of its annual exports. The rise of the PRC’s trade with major industrial economies paralleled its emergence as a center of regional production networks based on the exchange of parts, components, other intermediate products, and capital goods. The PRC assembles parts and components from East and Southeast Asia into final goods for export to the US and other industrial economies. In fact, exports to the PRC as a share of total exports rose sharply in major East and Southeast Asian economies between 1990 and 2008 (Figure 1). By the same token, the share of imports from the PRC also increased in these economies (Figure 2). Growth of the PRC’s trade with East and Southeast Asia largely reflects growth in intra-Asian production fragmentation, or vertical specialization (ADB 2009).
Figure 1: Exports to the PRC as Share of Total Exports among Select East and Southeast Asian Economies, 1990–2008
Source: Estimates based on data from CEIC Data Company Ltd. (downloaded 6 July 2009) and International Monetary Fund, Direction of Trade Statistics (May 2009).

2 | Working Paper Series on Regional Economic Integration No. 92
0
11
22
33
44
1990 1992 1994 1996 1998 2000 2002 2004 2006 2008
%
Hong Kong, China IndonesiaKorea, Rep. of MalaysiaPhilippines SingaporeTaipei,China ThailandJapan
Figure 2: Imports from the PRC as Share of Total Imports among Select East and Southeast Asian Economies, 1990–2008
Source: Staff estimates based on data from CEIC Data Company Ltd. (downloaded 6 July 2009) and International Monetary Fund, Direction of Trade Statistics (May 2009).
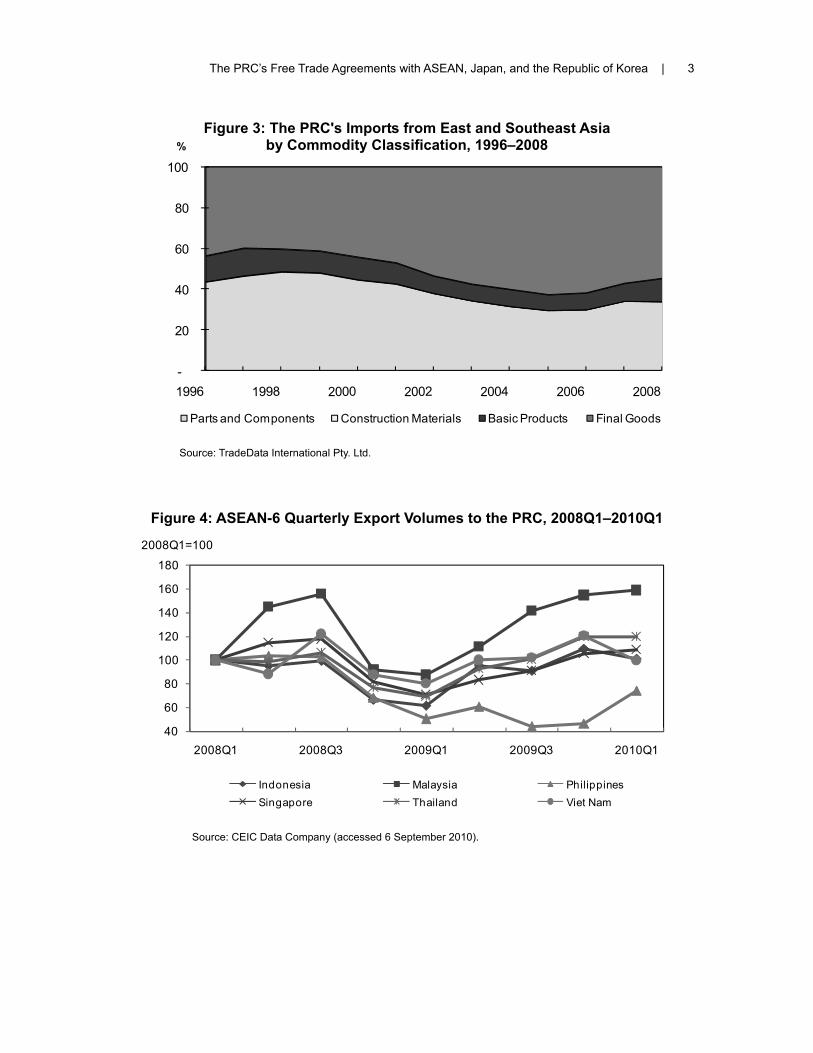
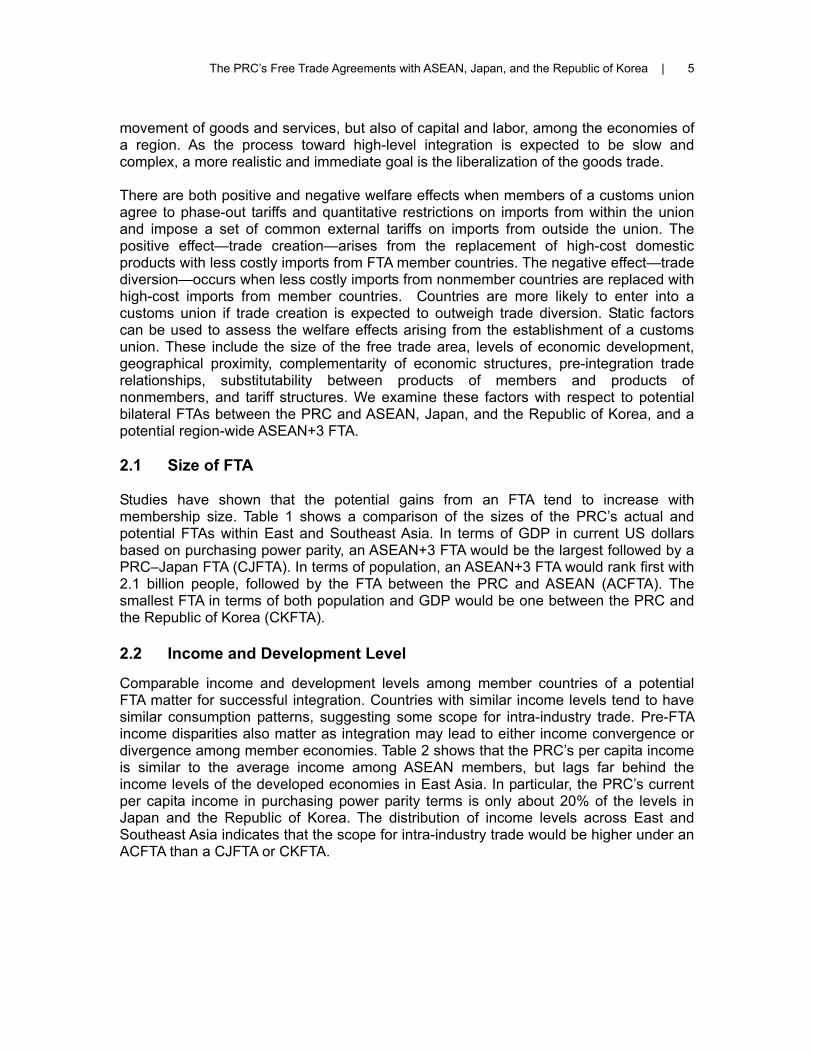
Recent evidence indicates a weakening of the PRC’s role as an assembler and a corresponding strengthening of its role as a consumer. The share of parts and components in the PRC’s total imports is much higher than in its total exports throughout 1996–2008. However, the share of parts and components in the PRC’s imports from the rest of the region has been declining, while that of final goods has been increasing (Figure 3). This suggests that direct demand for final goods may be increasingly impacting the PRC’s imports from the region. The shift from trade in parts and components toward final goods provides evidence of the PRC’s growing role as a consumer. This indirect evidence of more substantive trade between the PRC and the rest of Asia based on demand for final goods strengthens the argument for the PRC as an engine of growth. The rising influence of the PRC on growth in other economies in the region through trade can lessen the vulnerability of these economies to downturns in the US and EU. The same argument also applies to the PRC, since strengthening trade links with its neighbors can help reduce its over-dependence on exports to the US and EU. Among East Asian countries the PRC was the most resilient during the recent global financial crisis, growing by over 9% in both 2008 and 2009. There is some evidence that the PRC, through strong trade ties, helped countries in the region to recover swiftly from the global crisis. Although Asia’s exports to the PRC fell sharply during the crisis, they rebounded more strongly than exports to the US, thus helping support growth (Figure 4). The recent slowdown in advanced countries strengthens the need for regional economies to seek additional sources of growth. Given its large size, resilience during the global economic downturn, and tight trade links with other East Asian economies, the PRC is in a strong position to lead vibrant and sustainable growth in the region.
The PRC’s Free Trade Agreements with ASEAN, Japan, and the Republic of Korea | 3
-
20
40
60
80
100
%
Parts and Components Construction Materials Basic Products Final Goods
40
60
80
100
120
140
160
180
2008Q1 2008Q3 2009Q1 2009Q3 2010Q1
2008Q1=100
Indonesia Malaysia PhilippinesSingapore Thailand Viet Nam
Figure 3: The PRC's Imports from East and Southeast Asia by Commodity Classification, 1996–2008
Source: TradeData International Pty. Ltd.
Figure 4: ASEAN-6 Quarterly Export Volumes to the PRC, 2008Q1–2010Q1
Source: CEIC Data Company (accessed 6 September 2010).

4 | Working Paper Series on Regional Economic Integration No. 92
From the vantage point of the PRC, strengthening trade links with countries in East Asia is beneficial in terms of access to (i) a large, growing, and proximate market for its exports; and (ii) more diverse sources of primary inputs, raw materials, and high-tech capital goods. Collectively, East and Southeast Asia (ex-PRC) is a large, fast-growing economy with major potential. While the PRC’s phenomenal rise has garnered more attention, the PRC’s neighbors have also been growing rapidly if not as spectacularly as the PRC. (Prior to the rise of the PRC eight East and Southeast Asian economies were collectively known as the “East Asian Miracle”.) Stronger trade links may also help to facilitate the PRC’s investment in the region. Moreover, trade links with its neighbors can be viewed as an opportunity for the PRC to strengthen its economic power and influence in the region. The PRC has been active in pursuing free trade initiatives with countries in East and Southeast Asia. Recently, the ASEAN–PRC Free Trade Area (ACFTA) came into effect, establishing free trade between the PRC and the six original members of ASEAN (Brunei Darussalam, Indonesia, Malaysia, the Philippines, Singapore, and Thailand). Other ASEAN members (Cambodia, Lao People’s Democratic Republic, Myanmar, and Viet Nam) are expected to participate in ACFTA by 2015. The establishment of an FTA with ASEAN is viewed as an important step in the economic integration of the entire East Asian region. Furthermore, the PRC already has bilateral agreements with Singapore and Thailand, while negotiations for bilateral agreements with Japan and the Republic of Korea are under way. A region-wide FTA covering ASEAN, the PRC, and the two other big economies in East Asia—Japan and the Republic of Korea—has been a subject of great interest among proponents of free trade in the region. Once formed such an agreement would encompass about 2.1 billion people and account for nearly one-fourth of the world’s total output. However, establishing a region-wide FTA is seen as a long-term goal given the daunting economic and political obstacles that stand in the way. Therefore, forming bilateral FTAs is widely viewed as a realistic alternative strategy in the medium-term. The objective of this paper is to qualitatively and quantitatively assess the PRC’s FTAs and potential FTAs with ASEAN, Japan, and the Republic of Korea, as well as a possible region-wide FTA (ASEAN+3). Our qualitative analysis is based on the theory of economic integration and our quantitative analysis is based on a computable general equilibrium (CGE) model. Our analysis will focus on the relative benefits of each arrangement, especially from the point of view of the PRC. 2. Qualitative Assessment of the PRC–ASEAN FTA and
Potential FTAs with Japan and the Republic of Korea The theory of economic integration provides a basic framework for analyzing the extent to which each of the PRC’s actual and potential FTAs with ASEAN, Japan, and the Republic of Korea satisfy the theoretical criteria for successful integration. Viner (1950) is credited with providing the analytical foundation for the theory of economic integration through his pioneering work on customs unions. While there are different levels of economic integration, an advanced stage entails members agreeing not only on the free
The PRC’s Free Trade Agreements with ASEAN, Japan, and the Republic of Korea | 5
movement of goods and services, but also of capital and labor, among the economies of a region. As the process toward high-level integration is expected to be slow and complex, a more realistic and immediate goal is the liberalization of the goods trade. There are both positive and negative welfare effects when members of a customs union agree to phase-out tariffs and quantitative restrictions on imports from within the union and impose a set of common external tariffs on imports from outside the union. The positive effect—trade creation—arises from the replacement of high-cost domestic products with less costly imports from FTA member countries. The negative effect—trade diversion—occurs when less costly imports from nonmember countries are replaced with high-cost imports from member countries. Countries are more likely to enter into a customs union if trade creation is expected to outweigh trade diversion. Static factors can be used to assess the welfare effects arising from the establishment of a customs union. These include the size of the free trade area, levels of economic development, geographical proximity, complementarity of economic structures, pre-integration trade relationships, substitutability between products of members and products of nonmembers, and tariff structures. We examine these factors with respect to potential bilateral FTAs between the PRC and ASEAN, Japan, and the Republic of Korea, and a potential region-wide ASEAN+3 FTA. 2.1 Size of FTA Studies have shown that the potential gains from an FTA tend to increase with membership size. Table 1 shows a comparison of the sizes of the PRC’s actual and potential FTAs within East and Southeast Asia. In terms of GDP in current US dollars based on purchasing power parity, an ASEAN+3 FTA would be the largest followed by a PRC–Japan FTA (CJFTA). In terms of population, an ASEAN+3 FTA would rank first with 2.1 billion people, followed by the FTA between the PRC and ASEAN (ACFTA). The smallest FTA in terms of both population and GDP would be one between the PRC and the Republic of Korea (CKFTA). 2.2 Income and Development Level Comparable income and development levels among member countries of a potential FTA matter for successful integration. Countries with similar income levels tend to have similar consumption patterns, suggesting some scope for intra-industry trade. Pre-FTA income disparities also matter as integration may lead to either income convergence or divergence among member economies. Table 2 shows that the PRC’s per capita income is similar to the average income among ASEAN members, but lags far behind the income levels of the developed economies in East Asia. In particular, the PRC’s current per capita income in purchasing power parity terms is only about 20% of the levels in Japan and the Republic of Korea. The distribution of income levels across East and Southeast Asia indicates that the scope for intra-industry trade would be higher under an ACFTA than a CJFTA or CKFTA.

6 | Working Paper Series on Regional Economic Integration No. 92
Table 1: Population and GDP in East and Southeast Asia
Population
(million) GDP
(current $ billion)
GDP–PPP (current $ billion)
Brunei Darussalam 0.4 14.5 20.2 Cambodia 14.7 9.6 28.0 Indonesia 228.2 514.4 907.3 Lao PDR 6.2 5.2 13.2 Malaysia 27.0 194.9 383.7 Myanmar 49.2 — — Philippines 90.3 166.9 317.1 Singapore 4.8 181.9 238.5 Thailand 67.4 260.7 519.0
Viet Nam 86.2 90.7 240.1 ASEAN 574.5 1438.9 2667.2 PRC 1,325.6 4,326.2 7,903.2 Japan 127.7 4,909.3 4,354.6 Republic of Korea 48.6 929.1 1,358.0
PRC–Japan 1,453.3 9,250.0 12,278.0 PRC–Republic of Korea 1,374.2 5,269.8 9,281.5 PRC–ASEAN 1,900.2 5,765.1 10,570.4 ASEAN+3 2,076.5 11,603.5 16,283.0
ASEAN = Association of Southeast Asian Nations, FTA = free trade agreement, GDP = gross domestic product, Lao PDR = Lao People’s Democratic Republic, PPP = purchasing power parity, PRC = People’s Republic of China. Note: All figures are from 2008. Source: World Development Indicators Online (accessed 22 January 2010).
Table 2: Per Capita Income in East and Southeast Asia
GDP per capita (current $)
GDP per capita– PPP (current $)
Brunei Darussalam 36,634.3 50,919.1 Cambodia 651.3 1,904.6 Indonesia 2,253.6 3,974.9 Lao PDR 837.3 2,134.1 Malaysia 7,221.5 14,215.4 Myanmar — — Philippines 1,847.4 3,509.9 Singapore 37,597.3 49,283.6

The PRC’s Free Trade Agreements with ASEAN, Japan, and the Republic of Korea | 7
GDP per capita (current $)
GDP per capita– PPP (current $)
Thailand 3,868.6 7,702.6 Viet Nam 1,052.1 2,785.0 ASEAN 2,713.4 5,042.5 PRC 3,263.5 5,961.8 Japan 38,442.6 34,098.8 Republic of Korea 19,115.0 27,939.1 PRC–Japan–Republic of Korea 6,767.6 9,065.4
ASEAN = Association of Southeast Asian Nations, FTA = free trade agreement, GDP = gross domestic product, Lao PDR = Lao People’s Democratic Republic, PPP = purchasing power parity, PRC = People’s Republic of China. Notes: All figures are from 2008. The figures for PRC–Japan–Republic of Korea are weighted by population. Source: World Development Indicators Online database (accessed 22 January 2010).
2.3 Geographical Proximity and Transport Infrastructure There is a natural tendency for economies with close geographical proximity to engage in trade with one another, especially those linked by efficient transport systems. Table 3 shows that Japan and the Republic of Korea are located much closer to the PRC than to ASEAN. While this appears to give bilateral FTAs between the PRC and either Japan or the Republic of Korea a competitive edge over ACFTA, geographical barriers no longer pose as serious an impediment to trade since there are now efficient air and sea links between ASEAN, the PRC, Japan, and the Republic of Korea.
2.4 Pre-FTA Trade Pre-existing trade links among member countries of a potential FTA grouping are an important factor in forming an FTA. Countries with strong pre-FTA trade relationships are more likely to benefit from integration and are therefore more inclined to support an FTA. Table 4 shows how intraregional exports among East and Southeast Asian countries have intensified in recent years. In ASEAN+3, intraregional exports reached USD1.25 trillion in 2008, an increase of 35% from 2006 and the equivalent to 34% of total exports of all ASEAN+3 economies. ASEAN, Japan, and the Republic of Korea have become increasingly important trading partners of the PRC. Exports to ASEAN accounted for 8% of the PRC’s total exports in 2008, while the combined exports of Japan and the Republic of Korea were equivalent to 13% of the PRC’s total exports. The PRC has also become an important export market for these economies, accounting for 9% of ASEAN’s exports, 16% of Japan’s exports, and 21% of the Republic of Korea’s exports in 2008. Table 5 and Table 6 show that intraregional imports and total trade are indeed relatively high among East Asian countries. This suggests that actual and potential FTAs between the PRC and ASEAN, Japan, and the Republic of Korea either are or would be mutually beneficial for all parties involved.
Table 2: continued

8 | Working Paper Series on Regional Economic Integration No. 92
The PRC had a trade deficit with ASEAN, Japan, and the Republic of Korea in 2008. The largest deficit was with the Republic of Korea and the smallest was with ASEAN. The reluctance of Japan and the Republic of Korea to include agricultural products in their proposed bilateral FTAs with the PRC could further worsen the latter’s net trade position with these countries. Thus, in terms of the impact of net exports on GDP, ACFTA is more beneficial for the PRC than its bilateral FTAs with either Japan or the Republic of Korea. Still, trade with Japan and the Republic of Korea might be more beneficial for the PRC in terms of access to capital and technology.
Table 3: Geographical Proximity among Asian Economies (km)
PRC Japan Republic
of Korea EU-27 NAFTA
Brunei Darussalam 3,877 4,248 3,819 10,340 14,999Cambodia 3,336 4,403 3,629 9,066 14,414Indonesia 5,194 5,772 5,278 10,695 16,357Lao PDR 2,757 4,125 3,208 8,379 13,706Malaysia 4,335 5,318 4,609 9,549 15,350Philippines 2,840 2,990 2,614 9,916 13,794Singapore 4,457 5,313 4,667 9,845 15,547Thailand 3,282 4,603 3,719 8,563 14,163Viet Nam 2,321 3,670 2,744 8,346 13,367ASEAN (average) 3,600 4,494 3,810 9,411 14,633PRC 2,103 962 7,474 11,172Japan 2,103 1,153 9,096 10,928Republic of Korea 962 1,153 8,273 11,187EU-27 7,474 9,096 8,273 6,917NAFTA 11,172 10,928 11,187 6,917
ASEAN = Association of Southeast Asian Nations, EU = European Union, Lao PDR = Lao People’s Democratic Republic, NAFTA = North American Free Trade Agreement, PRC = People’s Republic of China. Note: The distance is the theoretical air distance (great circle distance) between capital cities. For the EU, the reference city is Prague, Czech Republic, which lies at the approximate geographical center of the EU. The reference city for NAFTA is Washington, DC. Source: www.timeanddate.com (accessed 22 April 2010).

The PRC’s Free Trade Agreements with ASEAN, Japan, and the Republic of Korea | 9
ASEAN = Association of Southeast Asian Nations, PRC = People’s Republic of China. Source: Authors’ calculations based on data from International Monetary Fund, Direction of Trade Statistics (January 2010).
Table 4: Intraregional Exports within ASEAN+3, 2006–2008 2006 2007 2008 2006–2008
Average
Total Exports ($ billion) PRC–Japan 184.6 211.4 241.2 212.4 PRC–Republic of Korea 114.0 138.1 165.3 139.1 ASEAN–PRC 329.4 389.9 454.1 391.2 ASEAN+3 924.3 1,066.2 1,246.5 1,079.0
Share of Total Exports (%) PRC–Japan 11.4 10.9 10.9 11.1 PRC–Republic of Korea 8.8 8.7 8.9 8.8 ASEAN–PRC 19.0 18.8 18.8 18.8 ASEAN+3 34.1 33.7 34.4 34.1
ASEAN = Association of Southeast Asian Nations, PRC = People’s Republic of China. Source: Authors’ calculations based on data from the International Monetary Fund, Direction of Trade Statistics (January 2010).
Table 5: Intraregional Imports within ASEAN+3, 2006–2008 2006 2007 2008 2006–2008
Average
Total Imports ($ billion) PRC–Japan 234.3 261.7 294.4 263.5 PRC–Republic of Korea 138.4 167.1 189.1 164.9 ASEAN–PRC 331.6 392.4 461.3 395.1 ASEAN+3 1,007.5 1,151.8 1,335.6 1,165.0
Share of Total Imports (%) PRC–Japan 17.1 16.6 15.5 16.4 PRC–Republic of Korea 12.6 12.7 12.1 12.5 ASEAN–PRC 22.7 22.8 22.2 22.6 ASEAN+3 42.9 42.7 40.8 42.1

10 | Working Paper Series on Regional Economic Integration No. 92
Table 6: Intraregional Trade within ASEAN+3, 2006–2008
2006 2007 2008 2006–2008 Average
Total Trade ($ billion) PRC–Japan 418.8 473.1 535.6 475.8 PRC–Republic of Korea 252.4 305.2 354.4 304.0 ASEAN–PRC 661.0 782.4 915.4 786.3 ASEAN+3 1,931.8 2,218.0 2,582.2 2,244.0
Share of Total Trade (%)
PRC–Japan 14.0 13.5 13.0 13.5 PRC–Republic of Korea 10.5 10.5 10.4 10.5 ASEAN–PRC 20.7 20.6 20.4 20.6 ASEAN+3 38.2 37.8 37.4 37.8
ASEAN = Association of Southeast Asian Nations, PRC = People’s Republic of China. Source: Authors’ calculations based on data from International Monetary Fund, Direction of Trade Statistics (January 2010).
2.5 Substitutability of Products A wide range of tradable goods among FTA members that can be substituted for those of nonmembers can increase the scope for trade creation. Data on revealed comparative advantage suggest that the PRC can broadly substitute products such as machinery and transport materials from the US and EU with products from Japan and the Republic of Korea (Table 7). Japan and the Republic of Korea are technologically at similar levels to the US and EU, and thus produce many similar manufactured goods. However, substitutability of products between the PRC and ASEAN tends to be limited as both export comparable goods such as electronics and textiles, and have similar key export markets. 2.6 Complementary Economic Structures It is possible for countries with competitive pre-FTA economic structures to gain from trade creation if their post-economic structures are complementary, as Meade (1995) suggested. As a result of high trade barriers, FTA members may produce similar goods prior to integration. When trade among members expands under an FTA, goods will be produced by more efficient firms and the number of similar goods produced falls. Members derive welfare gains from specialization, technological change, and economies of scale. Table 8 shows the degree to which one country’s exports are complementary with another country’s import structure. The table indicates a relatively high degree of complementarity between the PRC and ASEAN. Furthermore, the PRC’s exports and imports are more complementary with ASEAN’s export and import patterns than with other countries, including Japan and the Republic of Korea. The complementarity index

The PRC’s Free Trade Agreements with ASEAN, Japan, and the Republic of Korea | 11
between the PRC’s exports and ASEAN’s imports is about 80%, while the comparable indices of the PRC’s exports with Japan and the Republic of Korea are both about 65%. This suggests that ACFTA augurs more favorably for the PRC than a bilateral FTA with Japan or the Republic of Korea.
Table 7: Substitutability of Products: Revealed Comparative Advantage, 2006–2008 Average
Sectors ASEAN PRC Japan Republic of Korea NAFTA EU-27 ROW
1 Agriculture 0.84 0.49 0.10 0.15 1.50 1.06 1.10
2 Beverage and food Products
1.51 0.41 0.08 0.15 0.69 1.28 1.08
3 Textile and apparel
1.05 3.27 0.25 0.74 0.40 0.84 0.96
4 Chemical products
0.67 0.45 0.80 0.90 0.97 1.33 0.89
5 Metal and steel Products
0.56 1.00 0.91 1.01 0.81 1.03 1.14
6 Vehicle and other transport equipment
0.33 0.40 2.23 1.87 1.42 1.22 0.62
7 Electronic products
2.17 2.28 1.33 1.84 0.99 0.77 0.60
8 Machinery 0.49 0.65 1.65 0.73 1.09 1.22 0.83
9 Other manufacturing
1.00 0.63 0.58 0.60 0.99 0.82 1.39
ASEAN = Association of Southeast Asian Nations, EU = European Union, NAFTA = North American Free Trade Agreement, PRC = People’s Republic of China, ROW = rest of world. Note: The Revealed Comparative Advantage index is defined as the ratio of the share of a country’s total exports of a commodity in its total exports to the share of world exports of the same commodity in total world exports. Source: Author's calculations based on data from United Nations ComTrade Database (accessed 6 April 2010).

12 | Working Paper Series on Regional Economic Integration No. 92
Table 8: Complementarity Index, 2006–2008 (%)
Importing Region or Country
Exporting Region or Country ASEAN PRC Japan Republic
of Korea EU-27 NAFTA ROW
ASEAN 79.5 72.1 81.1 77.2 82.8 79.5 PRC 83.9 70.8 82.1 75.9 78.8 75.2 Japan 77.3 65.1 62.9 73.4 76.9 89.3 Rep. of Korea 75.4 66.2 65.5 74.3 80.1 87.0 EU-27 76.9 66.1 69.9 74.6 89.4 88.0 NAFTA 79.2 68.3 73.5 75.8 83.2 85.8 ROW 78.8 68.9 69.4 73.4 83.8 87.8
ASEAN = Association of Southeast Asian Nations, EU = European Union, NAFTA = North American Free Trade Agreement, PRC = People’s Republic of China, ROW = rest of world. Note: The index measures the degree to which the export pattern of one country (region) matches the import pattern of another. It is derived from the sum of the absolute value of the difference between the import shares and the export shares for each product category of two countries (regions) divided by two and multiplied by 100. Source: Authors’ calculations based on data from United Nations ComTrade Database (accessed 6 April 2010). 2.7 Pre-FTA Tariff Rates There are significant opportunities for trade creation if pre-FTA tariffs are relatively high. Net welfare impacts will be higher the more elevated the pre-FTA tariff rates among members and the lower the level and variability of tariff rates against nonmembers. Table 9 shows the applied tariff rate (simple mean of all products) for ASEAN countries, the PRC, Japan, and the Republic of Korea. The tariff rate of the PRC is higher than in Japan and most ASEAN countries, but similar to that of the Republic of Korea. Since both the PRC and the Republic of Korea maintain relatively high tariff rates, the potential for trade creation is more apparent in CKFTA than in ACFTA or CJFTA if based on tariffs alone. However, overall output and welfare gains of an FTA will depend on the combined impact of the different static factors discussed above. 3. Quantitative Assessment of the PRC’s FTAs with ASEAN,
Japan, and the Republic of Korea In this section we apply the CGE model to the various permutations of the PRC’s FTAs with ASEAN, Japan, and the Republic of Korea to estimate their quantitative effects on output and welfare. We examine static, one-time, and dynamic effects based on the impacts of FTAs through capital accumulation. Before reporting the results of our CGE analysis, we provide a brief overview of the CGE model and findings from earlier CGE studies that analyzed East Asian FTAs.

The PRC’s Free Trade Agreements with ASEAN, Japan, and the Republic of Korea | 13
Table 9: Applied Tariff Rate—Simple Mean of All Products (%)
2006 2007 2008 2006–2008 Average
Brunei Darussalam 3.1 3.1 2.7 2.9 Cambodia 0.0 12.5 12.4 8.3 Indonesia 6.0 5.9 - 5.9 Lao PDR 6.5 5.8 9.3 7.2 Malaysia 6.3 5.9 5.5 5.9 Myanmar 4.4 4.1 4.0 4.2 Philippines 5.4 5.0 5.4 5.3 Singapore 0.0 0.0 0.2 0.1 Thailand 10.8 10.3 10.6 10.6 Viet Nam 11.9 11.7 8.0 10.5 PRC 8.9 8.9 8.7 8.8 Japan 3.5 4.2 3.7 3.8 Republic of Korea 9.1 8.5 - 8.8
Lao PDR = Lao People’s Democratic Republic, PRC = People’s Republic of China. Source: World Bank, World Databank. http://databank.worldbank.org/ddp/home.do?Step=3&id=4 (accessed 26 May 2011).
3.1 CGE Model and Analysis of the Impact of FTAs–A Brief Overview A number of studies have used a CGE model and the database of the Global Trade Analysis Project (GTAP) to quantify the economic impact of FTAs. Both static and dynamic effects are considered in recent CGE studies of economic integration. The static model evaluates the one-off, more immediate impact of the removal of trade barriers. The dynamic model incorporates medium- to long-term efficiency gains from resource re-allocation and capital accumulation. Studies generally find bigger welfare gains among member countries from an FTA with a larger aggregate GDP, a feature that gives members the opportunity to exploit larger markets. Sectoral impacts are often also examined to identify groups that are likely to gain or lose from an FTA and inform policymakers. Estimates of welfare gains from trade creation as well as losses from trade diversion have varied across studies. Owing to differences in specifications and underlying assumptions, the literature on FTAs has produced varying results on the value of estimated impacts, the economies that are likely to gain or lose, and which FTAs provide the most gains to one country or region.1 There is a dearth of CGE studies that examine the impacts of bilateral and region-wide 1 Cheong (2003); Ando and Urata (2006); Ando (2009); Lee, Roland-Holst, and van der Mensbrugghe
(2004); Gilbert, Scollay, and Bora (2004); Francois and Wignaraja (2008); Lee and van der Mensbrugghe (2008); and Kawai and Wignaraja (2008).
14 | Working Paper Series on Regional Economic Integration No. 92
FTAs from the point of view of the PRC. Often the studies have assessed the bilateral FTAs of ASEAN with the PRC, Japan, and the Republic of Korea, and compared these with a potential region-wide FTA. A number of studies distinguish between the impacts on the PRC of ACFTA vs. ASEAN+3, but rarely do they show comparisons of the PRC’s bilateral FTAs with ASEAN, Japan, or the Republic of Korea. Studies that include a quantitative assessment of the income and welfare impacts on the PRC generally indicate that it stands to gain more from joining a broader FTA. This is consistent with the bulk of the literature on FTAs that finds economic size to be an important indicator of income and welfare gains. Comparing the impacts between the ASEAN–PRC FTA and an ASEAN+3 FTA, estimates by Cheong (2003), Ando and Urata (2006), and Kawai and Wignaraja (2008) show that the income gain for the PRC is about 0.4%–0.6% under the former and 1.3%–1.4% under the latter. The estimates of Lee, Roland-Holst, and van der Mensbrugghe (2004), which are based on a dynamic CGE model, also show that welfare changes for the PRC are far more favorable under an ASEAN+3 FTA than under ACFTA. Past comparisons of the PRC’s bilateral FTAs relied on the GTAP version 5 database and found that the PRC was expected to gain more in terms of output or welfare changes from a bilateral FTA with Japan rather than with ASEAN or the Republic of Korea.2 Our paper’s contribution to the literature is to highlight the potential impacts of the PRC’s FTAs with ASEAN, Japan, and the Republic of Korea. Not many studies have focused on making comparisons between the four possible arrangements of the PRC’s FTAs with its three neighboring economies, particularly by using both CGE analysis and the indicators discussed in our qualitative analysis. Using both qualitative and quantitative analysis allows us to probe deeply into the potential impacts, with our quantitative analysis complemented by our qualitative analysis. To provide some explanation of the results of our CGE analysis, such as why a particular FTA would be more favorable for the PRC, we refer back to the qualitative analysis. Indicators discussed in the previous section, such as pre-FTA trade levels and the complementarity of economic structures, enrich our understanding of the results of the CGE analysis. 3.2 Empirical Framework and Results In this section we discuss the results of our quantitative assessment based on a traditional static model, which analyzes the one-off effect of an FTA on output and welfare, and a capital accumulation CGE model, which takes into account the positive relationship between trade, investment, and growth. We incorporate dynamic effects by introducing capital accumulation in the model, a feature especially relevant for East Asian economies where high savings and investment have been key components of stellar growth. This is especially true in the case of the PRC. Baldwin (1989, 1992) suggests that higher returns to capital due to trade will induce investment and enhance the output impact of the static effects. We estimate the changes in the capital stock and output by comparing two steady states, following the approach taken by Francois, McDonald, and Nordstrom (1999). 2 Cheong (2003) and Kawasaki (2003).

The PRC’s Free Trade Agreements with ASEAN, Japan, and the Republic of Korea | 15
We implement the CGE model using social accounting data from the GTAP version 7 database, which provides global production and trade data with 2004 as the base year. Our data are aggregated into 10 sectors and 7 regions and economies (Table 10). Quantitative impacts are estimated under a scenario where both import tariffs and export taxes between members are eliminated, but tariff barriers between members and nonmembers are retained.
Table 10: Model Aggregations
Economies (number) Sectors ASEAN (9): Cambodia, Indonesia, Lao
PDR, Malaysia, Myanmar, Philippines, Singapore, Thailand, and Viet Nam
PRC Japan Republic of Korea EU (27) NAFTA (3): Canada, Mexico, and the US ROW
Agriculture, fishing, and forestry Beverage and food products Textile and apparel Chemical products Metal and steel products Vehicle and other transport equipment Electronic products Machinery Other manufactures Services
ASEAN = Association of Southeast Asian Nations, PRC = People’s Republic of China, EU = European Union, NAFTA = North American Free Trade Agreement, ROW = rest of world. Note: Brunei Darussalam is excluded because of the data problem in GTAP. Source: Authors’ compilation. Table 11 presents the output and welfare effects of implementing the CGE model for four combinations of East and Southeast Asian FTAs that include the PRC. We first highlight the results of the static model and then delve into the results of the dynamic model. Based on the results of the static CGE model, which looks at one-off effects of the FTAs, the PRC can expect higher output and welfare gains from a bilateral FTA with ASEAN than with either Japan or the Republic of Korea. Results indicate that the PRC’s welfare impacts can even be negative under CJFTA and CKFTA. When compared against an ASEAN+3 FTA, ACFTA is also expected to deliver slightly bigger output gains for the PRC, which may reflect the PRC’s negative net trade position with Japan and the Republic of Korea. Between Japan and the Republic of Korea, the PRC should favor a bilateral FTA with the latter, especially based on output impacts: the PRC gains a 0.3% increase in output under CKFTA but will realize almost no output growth under CJFTA. ASEAN, Japan, and the Republic of Korea are also expected to benefit from bilateral FTAs with the PRC, with the biggest gainer being the Republic of Korea due to the latter’s strong trade position with the PRC. Nevertheless, the economic gains to ASEAN, Japan, and the Republic of Korea are higher in an ASEAN+3 FTA than from their respective bilateral FTAs with the PRC.

16 | Working Paper Series on Regional Economic Integration No. 92
A dynamic model incorporates the impact of trade on growth through investment and thus shows higher gains compared to the static model. For example, the PRC’s output and welfare gains under ASEAN+3 are nearly 1 percentage point higher in the dynamic model than in the static model. Estimates of the PRC’s welfare and output gains in the dynamic model indicate that ASEAN is a more suitable partner than Japan or the Republic of Korea, similar to the results of the static model. Existing trade patterns between the PRC and the three economies appear to support the findings. The PRC’s net exports with ASEAN are much higher than its net exports with either Japan or the Republic of Korea, which may explain why the PRC’s output gains are higher under ACFTA. While the value of the PRC’s imports from Japan may be higher than imports from ASEAN, tariff levels in most ASEAN countries are still more elevated than in Japan. Therefore, welfare gains are more substantial under ACFTA. As discussed in Section 2, there is also deeper complementarity between the PRC and ASEAN’s exports and imports, than in the case of either Japan or the Republic of Korea. The findings of our CGE analysis are therefore somewhat similar to the results of our qualitative analysis. Among the three potential bilateral partners of the PRC, the Republic of Korea gains the most in terms of output growth and welfare changes, which is similar to the findings of the static model. The Republic of Korea’s output increases by nearly 4% under CKFTA, compared with 1.3% for ASEAN under ACFTA and about 1% for Japan under CJFTA. This can be explained by the Republic of Korea’s pre-FTA trade pattern with the PRC as well as tariff levels, which are generally higher than those of either Japan or ASEAN. When dynamic impacts are considered, ASEAN+3 delivers the biggest output and welfare gains for the PRC among the possible FTAs considered in this study. ASEAN, Japan, and the Republic of Korea would also achieve higher output and welfare gains from an ASEAN+3 FTA than from their respective bilateral FTAs with the PRC. The three would also benefit more than the PRC in terms of GDP growth under an ASEAN+3 FTA, given the huge potential for expanding exports to the PRC as well expected increased investment from the PRC. This study suggests that there are strong incentives for East Asian economies to establish FTAs that include the PRC, particularly broader or region-wide FTAs. In the same way, the PRC stands to benefit in terms of output and welfare changes from establishing bilateral FTAs with each of the three East Asian economies, especially if dynamic effects are considered. Still, the scope of the PRC’s benefits would be greater under a region-wide FTA. As there has been little progress toward a global free trade agreement under the Doha Round, a regional FTA such as ASEAN+3 could provide a faster and more viable route toward deeper integration.

The PRC’s Free Trade Agreements with ASEAN, Japan, and the Republic of Korea | 17
Table 11: Output and Welfare Effects of FTAs—CJFTA, CKFTA, ACFTA, and
ASEAN+3
Static CGE Model Capital Accumulation CGE
Model GDP
(%) Welfare
(%) Welfare
($ million) GDP (%)
Welfare (%)
Welfare ($ million)
PRC–Japan ASEAN –0.37 –0.17 –1,170 –0.50 –0.32 –2,174PRC 0.03 –0.03 –379 0.37 0.32 4,895Japan 0.98 0.16 6,408 0.97 0.24 9,711Republic of Korea
–0.16 –0.16 –936 –0.64 –0.31 –1,865
PRC–Republic of Korea ASEAN –0.23 –0.11 –735 –0.26 –0.14 –974PRC 0.32 0.00 –11 0.47 0.14 2,158Japan –0.11 –0.01 –407 –0.11 –0.02 –728Republic of Korea
2.70 0.95 5,642 3.82 2.13 12,678
ASEAN–PRC ASEAN 0.65 0.31 2,104 1.34 1.09 7,444PRC 0.57 0.13 1,942 0.90 0.46 6,981Japan –0.15 –0.03 –1,092 –0.16 –0.05 –1,807Republic of Korea
–0.29 –0.12 –688 –0.37 –0.20 –1,200
ASEAN+3 FTA ASEAN 0.15 0.44 3,010 1.83 2.36 16,179PRC 0.53 0.04 674 1.30 0.81 12,260Japan 1.51 0.25 9,850 1.54 0.40 15,844Republic of Korea
2.76 0.91 5,442 4.31 2.54 15,157
ACFTA = ASEAN–PRC Free Trade Agreement, ASEAN = Association of Southeast Asian Nations, CJFTA = PRC–Japan Free Trade Agreement, CKFTA = PRC–Republic of Korea Free Trade Agreement, CGE = computable general equilibrium, GDP = gross domestic product, PRC = People’s Republic of China. Note: % refers to percentage deviation from the baseline and millions of dollars refers to the value of deviation from the baseline. Estimated GDP and welfare effects of the FTAs on NAFTA, EU, and rest of the world are available from authors upon request. Source: Authors’ estimates.

18 | Working Paper Series on Regional Economic Integration No. 92
4. Concluding Observations The PRC’s rise as a key player in the global economy has been reinforced by the recent global financial crisis. There is some evidence that during the recent crisis, the PRC supported the growth of East Asian economies through trade, which counterbalanced feeble export demand from major industrial economies. Until now the PRC’s role in intra-Asian trade has largely been that of an assembler of parts and components from East and Southeast Asia for the production of final goods for export to the US and other industrial economies. Recent trade patterns, however, signal the PRC’s rising role as a consumer of final goods. Such a shift will be beneficial for the region as it implies that the PRC can be a source of growth for its neighbors through trade, therefore lessening their dependence on industrial markets for exports. Given its huge economic size and remarkable growth, the PRC is in a strong position to be an engine of growth for the region. From the point of view of the PRC, strengthening trade links with its East Asian neighbors through FTAs offers the opportunity to enhance its economic and political position in the region. It will strengthen the PRC’s role as a regional center of production networks by expanding access to the region’s primary inputs, raw materials, and capital goods. More generally, East Asia offers a huge market for the PRC’s exports and an equally huge source of imports. More substantive intraregional trade, based on trade in final goods along the lines of intra-EU trade, can benefit both the PRC and its neighbors by creating a large, dynamic, and self-sustaining common market. The PRC as well as ASEAN, Japan, and the Republic of Korea can leverage this common market to reduce their heavy dependence on exports to the US and EU. This would also contribute to resolving the problem of global current account imbalances. Strengthening intra-Asian trade, especially in final goods, is a win-win option for the PRC, its neighbors, and the world economy. Finally, it could also help defuse some of the geopolitical tensions that inevitably accompany the rapid rise of a huge new economic and geopolitical giant in East Asia. The objective of this paper has been to qualitatively and quantitatively examine four possible FTAs involving the PRC and ASEAN, Japan, and the Republic of Korea: ACFTA, CJFTA, CKFTA, and ASEAN+3. According to the results of our qualitative and quantitative analysis, the PRC would benefit most from an ASEAN+3 FTA, which is the largest possible FTA within East Asia. This finding is consistent with past CGE studies that have found that broader FTAs generate higher welfare and output gains for member countries. Among the three bilateral FTAs, the PRC will gain more from ACFTA than from CJFTA or CKFTA. From the results of our qualitative analysis, the PRC should prioritize ACFTA since it has income levels closer to and a trade structure more complementary with ASEAN than with either Japan or the Republic of Korea. In addition, our analysis of pre-FTA trade structures indicates that the PRC’s net trade position with ASEAN is more favorable than its position with either Japan or the Republic of Korea. Our CGE findings also show that the PRC would enjoy output and welfare gains from bilateral FTAs with ASEAN, Japan, and the Republic of Korea. However, among these three possible bilateral FTAs, an agreement with ASEAN is most beneficial for the PRC in terms of output and welfare impacts in both the static and dynamic models.

The PRC’s Free Trade Agreements with ASEAN, Japan, and the Republic of Korea | 19
As the path to a region-wide FTA such as ASEAN+3 is expected to be gradual and complex, bilateral FTAs can be a medium-term alternative trade strategy for the PRC. In the long-term, however, the PRC should pursue a region-wide FTA since the output and welfare gains from larger FTAs tend to be bigger. Ultimately, the creation of bilateral and region-wide FTAs can also help pave the way toward global trade liberalization.

20 | Working Paper Series on Regional Economic Integration No. 92
References M. Ando. 2009. Impacts of FTAs in East Asia: CGE Simulation Analysis. RIETI
Discussion Paper Series. 09-E-037. Tokyo: Research Institute of Economy, Trade and Industry.
M. Ando and S. Urata. 2006. The Impacts of East Asia FTAs: A CGE Simulation Study.
Paper presented at the JSPS (Kyoto University)-NRCT (Thammasat University) Core University Program Conference, Emerging Developments in East Asia FTA/EPAs, Doshisha University. 27–28 October.
ADB. 2009a. Asian Development Outlook 2009 Update: Broadening Openness for a
Resilient Asia. Manila. ———. 2009b. Asian Development Outlook 2009: Rebalancing Asia's Growth. Manila. R. E. Baldwin. 1989. The Growth Effects of 1992. Economic Policy. 4 (9). pp. 247–283. ———. 1992. Measurable Dynamic Gains from Trade. Journal of Political Economy. 100
(1). pp. 162–174. J. H. Francois, B. McDonald, and H. Nordstrom. 1999. Trade Liberalization and
Investment in a Multilateral Framework. In R. Baldwin and J.F. Francois, eds. Dynamic Issues in Commercial Policy Analysis. London: Centre for Economic Policy Research.
I. Cheong. 2003. Regionalism and Free Trade Agreements in Asia. Asian Economic
Papers. 2 (2). pp. 145–180. J. Francois and G. Wignaraja. 2008. Economic Implications of Asian Integration. Global
Economy Journal. 8 (3). pp. 1–46. J. Gilbert, R. Scollay, and B. Bora. 2004. New Regional Trading Developments in the
Asia-Pacific Region. In S.Yusuf, N. Altaf, and K. Nabeshima, eds. Global Change and East Asian Policy Initiatives. Washington, DC: World Bank.
M. Kawai and G. Wignaraja. 2008. EAFTA or CEPEA: Which Way Forward? ASEAN
Economic Bulletin. 25 (2). pp. 113–138. K. Kawasaki. 2003. The Impact of Free Trade Agreements in Asia. RIETI Discussion
Paper Series. 03-E-018. Tokyo: Research Institute of Economy, Trade and Industry. H. Lee, D. Roland-Holst, and D. van der Mensbrugghe. 2004. The PRC’s Emergence
and the Implications of Prospective Free Trade Agreements in East Asia. Kobe: Kobe University. Mimeo.

The PRC’s Free Trade Agreements with ASEAN, Japan, and the Republic of Korea | 21
H. Lee and D. van der Mensbrugghe. 2008. Regional Integration, Sectoral Adjustments and Natural Groupings in East Asia. International Journal of Applied Economics. 5 (2). pp. 57–79.
J. E. Meade. 1955. The Theory of Customs Union. Amsterdam: North Holland. J. Viner. 1950. The Customs Union Issue. London: Stevens.

22 | Working Paper Series on Regional Economic Integration No. 92
ADB Working Paper Series on Regional Economic Integration*
1. “The ASEAN Economic Community and the European Experience” by
Michael G. Plummer
2. “Economic Integration in East Asia: Trends, Prospects, and a Possible Roadmap” by Pradumna B. Rana
3. “Central Asia after Fifteen Years of Transition: Growth, Regional Cooperation, and Policy Choices” by Malcolm Dowling and Ganeshan Wignaraja
4. “Global Imbalances and the Asian Economies: Implications for Regional Cooperation” by Barry Eichengreen
5. “Toward Win-Win Regionalism in Asia: Issues and Challenges in Forming Efficient Trade Agreements” by Michael G. Plummer
6. “Liberalizing Cross-Border Capital Flows: How Effective Are Institutional Arrangements against Crisis in Southeast Asia” by Alfred Steinherr, Alessandro Cisotta, Erik Klär, and Kenan Šehović
7. “Managing the Noodle Bowl: The Fragility of East Asian Regionalism” by Richard E. Baldwin
8. “Measuring Regional Market Integration in Developing Asia: a Dynamic Factor Error Correction Model (DF-ECM) Approach” by Duo Qin, Marie Anne Cagas, Geoffrey Ducanes, Nedelyn Magtibay-Ramos, and Pilipinas F. Quising
9. “The Post-Crisis Sequencing of Economic Integration in Asia: Trade as a Complement to a Monetary Future” by Michael G. Plummer and Ganeshan Wignaraja
10. “Trade Intensity and Business Cycle Synchronization: The Case of East Asia” by Pradumna B. Rana
11. “Inequality and Growth Revisited” by Robert J. Barro
12. “Securitization in East Asia” by Paul Lejot, Douglas Arner, and Lotte Schou-Zibell
13. “Patterns and Determinants of Cross-border Financial Asset Holdings in East Asia” by Jong-Wha Lee
14. “Regionalism as an Engine of Multilateralism: A Case for a Single East Asian FTA” by Masahiro Kawai and Ganeshan Wignaraja

The PRC’s Free Trade Agreements with ASEAN, Japan, and the Republic of Korea | 23
15. “The Impact of Capital Inflows on Emerging East Asian Economies: Is Too Much Money Chasing Too Little Good?” by Soyoung Kim and Doo Yong Yang
16. “Emerging East Asian Banking Systems Ten Years after the 1997/98 Crisis” by Charles Adams
17. “Real and Financial Integration in East Asia” by Soyoung Kim and Jong-Wha Lee
18. “Global Financial Turmoil: Impact and Challenges for Asia’s Financial Systems” by Jong-Wha Lee and Cyn-Young Park
19. “Cambodia’s Persistent Dollarization: Causes and Policy Options” by Jayant Menon
20. “Welfare Implications of International Financial Integration” by Jong-Wha Lee and Kwanho Shin
21. “Is the ASEAN-Korea Free Trade Area (AKFTA) an Optimal Free Trade Area?” by Donghyun Park, Innwon Park, and Gemma Esther B. Estrada
22. “India’s Bond Market—Developments and Challenges Ahead” by Stephen Wells and Lotte Schou- Zibell
23. “Commodity Prices and Monetary Policy in Emerging East Asia” by Hsiao Chink Tang
24. “Does Trade Integration Contribute to Peace?” by Jong-Wha Lee and Ju Hyun Pyun
25. “Aging in Asia: Trends, Impacts, and Responses” by Jayant Menon and Anna Melendez-Nakamura
26. “Re-considering Asian Financial Regionalism in the 1990s” by Shintaro Hamanaka
27. “Managing Success in Viet Nam: Macroeconomic Consequences of Large Capital Inflows with Limited Policy Tools” by Jayant Menon
28. “The Building Block versus Stumbling Block Debate of Regionalism: From the Perspective of Service Trade Liberalization in Asia” by Shintaro Hamanaka
29. “East Asian and European Economic Integration: A Comparative Analysis” by Giovanni Capannelli and Carlo Filippini
30. “Promoting Trade and Investment in India’s Northeastern Region” by M. Govinda Rao

24 | Working Paper Series on Regional Economic Integration No. 92
31. “Emerging Asia: Decoupling or Recoupling” by Soyoung Kim, Jong-Wha Lee, and Cyn-Young Park
32. “India’s Role in South Asia Trade and Investment Integration” by Rajiv Kumar and Manjeeta Singh
33. “Developing Indicators for Regional Economic Integration and Cooperation” by Giovanni Capannelli, Jong-Wha Lee, and Peter Petri
34. “Beyond the Crisis: Financial Regulatory Reform in Emerging Asia” by Chee Sung Lee and Cyn-Young Park
35. “Regional Economic Impacts of Cross-Border Infrastructure: A General Equilibrium Application to Thailand and Lao PDR” by Peter Warr, Jayant Menon, and Arief Anshory Yusuf
36. “Exchange Rate Regimes in the Asia-Pacific Region and the Global Financial Crisis” by Warwick J. McKibbin and Waranya Pim Chanthapun
37. “Roads for Asian Integration: Measuring ADB's Contribution to the Asian Highway Network” by Srinivasa Madhur, Ganeshan Wignaraja, and Peter Darjes
38. “The Financial Crisis and Money Markets in Emerging Asia” by Robert Rigg and Lotte Schou-Zibell
39. “Complements or Substitutes? Preferential and Multilateral Trade Liberalization at the Sectoral Level” by Mitsuyo Ando, Antoni Estevadeordal, and Christian Volpe Martincus
40. “Regulatory Reforms for Improving the Business Environment in Selected Asian Economies—How Monitoring and Comparative Benchmarking can Provide Incentive for Reform” by Lotte Schou-Zibell and Srinivasa Madhur
41. “Global Production Sharing, Trade Patterns, and Determinants of Trade Flows in East Asia” by Prema-chandra Athukorala and Jayant Menon
42. “Regionalism Cycle in Asia (-Pacific): A Game Theory Approach to the Rise and Fall of Asian Regional Institutions” by Shintaro Hamanaka
43. “A Macroprudential Framework for Monitoring and Examining Financial Soundness” by Lotte Schou-Zibell, Jose Ramon Albert, and Lei Lei Song
44. “A Macroprudential Framework for the Early Detection of Banking Problems in Emerging Economies” by Claudio Loser, Miguel Kiguel, and David Mermelstein
45. “The 2008 Financial Crisis and Potential Output in Asia: Impact and Policy Implications” by Cyn-Young Park, Ruperto Majuca, and Josef Yap

The PRC’s Free Trade Agreements with ASEAN, Japan, and the Republic of Korea | 25
46. “Do Hub-and-Spoke Free Trade Agreements Increase Trade? A Panel Data Analysis” by Jung Hur, Joseph Alba, and Donghyun Park
47. “Does a Leapfrogging Growth Strategy Raise Growth Rate? Some International Evidence” by Zhi Wang, Shang-Jin Wei, and Anna Wong
48. “Crises in Asia: Recovery and Policy Responses” by Kiseok Hong and Hsiao Chink Tang
49. “A New Multi-Dimensional Framework for Analyzing Regional Integration: Regional Integration Evaluation (RIE) Methodology” by Donghyun Park and Mario Arturo Ruiz Estrada
50. “Regional Surveillance for East Asia: How Can It Be Designed to Complement Global Surveillance?” by Shinji Takagi
51. “Poverty Impacts of Government Expenditure from Natural Resource Revenues” by Peter Warr, Jayant Menon, and Arief Anshory Yusuf
52. “Methods for Ex Ante Economic Evaluation of Free Trade Agreements” by David Cheong
53. “The Role of Membership Rules in Regional Organizations” by Judith Kelley
54. “The Political Economy of Regional Cooperation in South Asia” by V.V. Desai
55. “Trade Facilitation Measures under Free Trade Agreements: Are They Discriminatory against Non-Members?” by Shintaro Hamanaka, Aiken Tafgar, and Dorothea Lazaro
56. “Production Networks and Trade Patterns in East Asia: Regionalization or Globalization?” by Prema-chandra Athukorala
57. “Global Financial Regulatory Reforms: Implications for Developing Asia” by Douglas W. Arner and Cyn-Young Park
58. “Asia’s Contribution to Global Rebalancing” by Charles Adams, Hoe Yun Jeong, and Cyn-Young Park
59. “Methods for Ex Post Economic Evaluation of Free Trade Agreements” by David Cheong
60. “Responding to the Global Financial and Economic Crisis: Meeting the Challenges in Asia” by Douglas W. Arner and Lotte Schou-Zibell
61. “Shaping New Regionalism in the Pacific Islands: Back to the Future?” by Satish Chand
62. “Organizing the Wider East Asia Region” by Christopher M. Dent
26 | Working Paper Series on Regional Economic Integration No. 92
63. “Labour and Grassroots Civic Interests In Regional Institutions” by Helen E.S. Nesadurai
64. “Institutional Design of Regional Integration: Balancing Delegation and Representation” by Simon Hix
65. “Regional Judicial Institutions and Economic Cooperation: Lessons for Asia?” by Erik Voeten
66. “The Awakening Chinese Economy: Macro and Terms of. Trade Impacts on 10 Major Asia-Pacific Countries” by Yin Hua Mai, Philip Adams, Peter Dixon, and Jayant Menon
67. “Institutional Parameters of a Region-Wide Economic Agreement in Asia: Examination of Trans-Pacific Partnership and ASEAN+α Free Trade Agreement Approaches” by Shintaro Hamanaka
68. “Evolving Asian Power Balances and Alternate Conceptions for Building Regional Institutions” by Yong Wang
69. “ASEAN Economic Integration: Features, Fulfillments, Failures, and the Future” by Hal Hill and Jayant Menon
70. “Changing Impact of Fiscal Policy on Selected ASEAN Countries” by Hsiao Chink Tang, Philip Liu, and Eddie C. Cheung
71. “The Organizational Architecture of the Asia-Pacific: Insights from the New Institutionalism” by Stephan Haggard
72. “The Impact of Monetary Policy on Financial Markets in Small Open Economies: More or Less Effective During the Global Financial Crisis?” by Steven Pennings, Arief Ramayandi, and Hsiao Chink Tang
73. “What do Asian Countries Want the Seat at the High Table for? G20 as a New Global Economic Governance Forum and the Role of Asia” by Yoon Je Cho
74. “Asia’s Strategic Participation in the Group of 20 for Global Economic Governance Reform: From the Perspective of International Trade” by Taeho Bark and Moonsung Kang
75. “ASEAN’s Free Trade Agreements with the People’s Republic of China, Japan, and the Republic of Korea: A Qualitative and Quantitative Analysis” by Gemma Estrada, Donghyun Park, Innwon Park, and Soonchan Park
76. “ASEAN-5 Macroeconomic Forecasting Using a GVAR Model” by Fei Han and Thiam Hee Ng

The PRC’s Free Trade Agreements with ASEAN, Japan, and the Republic of Korea | 27
77. “Early Warning Systems in the Republic of Korea: Experiences, Lessons, and Future Steps” by Hyungmin Jung and Hoe Yun Jeong
78. “Trade and Investment in the Greater Mekong Subregion: Remaining Challenges and the Unfinished Policy Agenda” by Jayant Menon and Anna Cassandra Melendez
79. “Financial Integration in Emerging Asia: Challenges and Prospects” by Cyn-Young Park and Jong-Wha Lee
80. “Sequencing Regionalism: Theory, European Practice, and Lessons for Asia” by Richard E. Baldwin
81. “Economic Crises and Institutions for Regional Economic Cooperation” by C. Randall Henning
82. “Asian Regional Institutions and the Possibilities for Socializing the Behavior of States” by Amitav Acharya
83. “The People’s Republic of China and India: Commercial Policies in the Giants” by Ganeshan Wignaraja
84. “What Drives Different Types of Capital Flows and Their Volatilities” by Rogelio Mercado and Cyn-Young Park
85. “Institution Building for African Regionalism” by Gilbert M. Khadiagala
86. “Impediments to Growth of the Garment and Food Industries in Cambodia: Exploring Potential Benefits of the ASEAN-PRC FTA” by Vannarith Cheang and Shintaro Hamanaka
87. “The Role of the People’s Republic of China in International Fragmentation and Production Networks: An Empirical Investigation” by Hyun-Hoon Lee, Donghyun Park, and Jing Wang
88. “Utilizing the Multiple Mirror Technique to Assess the Quality of Cambodian Trade Statistics” by Shintaro Hamanaka
89. “Is Technical Assistance under Free Trade Agreements WTO-Plus? A Review of Japan–ASEAN Economic Partnership Agreements” by Shintaro Hamanaka
90. “Is Trade in Asia Really Integrating?” by Shintaro Hamanaka
28 | Working Paper Series on Regional Economic Integration No. 92
91. “Intra-Asia Exchange Rate Volatility and Intra-Asia Trade: Evidence by Type of Goods” by Hsiao Chink Tang
*These papers can be downloaded from (ARIC) http://aric.adb.org/reipapers/ or (ADB) http:// adb.org/Economics/publications.asp?fs=fm_9:999


The PRC’s Free Trade Agreements with ASEAN, Japan, and the Republic of KoreaA Comparative Analysis
The People’s Republic of China (PRC) stands to reap sizable gains from entering into free trade agreements (FTAs) with its neighbors. The authors qualitatively and quantitatively analyze the four main permutations of the PRC’s FTAs with the region’s major economies: PRC–ASEAN, PRC–Japan, PRC–Republic of Korea, and ASEAN+3. Their comparative analysis reveals that the PRC would gain from all three bilateral FTAs, while gaining the most from a larger region-wide FTA such as ASEAN+3.
About the Asian Development Bank
ADB’s vision is an Asia and Pacific region free of poverty. Its mission is to help its developing member countries reduce poverty and improve the quality of life of their people. Despite the region’s many successes, it remains home to two-thirds of the world’s poor: 1.8 billion people who live on less than $2 a day, with 903 million struggling on less than $1.25 a day. ADB is committed to reducing poverty through inclusive economic growth, environmentally sustainable growth, and regional integration.
Based in Manila, ADB is owned by 67 members, including 48 from the region. Its main instruments for helping its developing member countries are policy dialogue, loans, equity investments, guarantees, grants, and technical assistance.
Asian Development Bank6 ADB Avenue, Mandaluyong City1550 Metro Manila, Philippineswww.adb.org/povertyPublication Stock No. WPS114223 Printed in the Philippines