Adaptive Population Enrichment for Oncology Trials with Time to Event Endpoints Cyrus Mehta, Ph.D....
24
Adaptive Population Enrichment for Oncology Trials with Time to Event Endpoints Cyrus Mehta, Ph.D. President, Cytel Inc.
-
Upload
jonah-griffith -
Category
Documents
-
view
226 -
download
0
Transcript of Adaptive Population Enrichment for Oncology Trials with Time to Event Endpoints Cyrus Mehta, Ph.D....

Adaptive Population Enrichment for Oncology Trials with Time to Event Endpoints
Cyrus Mehta, Ph.D.President, Cytel Inc.

• Statistical research with Sebastien Irle and Helmut Schäfer, Institute of Medical Biometry, University of Marburg, Germany
• Problem formulation based on collaborations with the Pfizer Inc., and M.D. Anderson Cancer Center
• Key Reference:• Irle and Schäfer. “Interim design modifications in time-
to-event studies.” JASA, 2012; 107:341-348
• We thank Pranab Ghosh for expert programming of the simulation tools
References and Acknowledgements
FDA and Industry Workshop. 9-18-201310 Sept 2013

• Motivation for enrichment trials in oncology• Adaptive enrichment design for PFS endpoints• Statistical methodology
• Conditional error function in time-to-event trials• Performing a closed test
• Simulation guided design• Future directions
Outline of Talk
FDA and Industry Workshop. 9-18-201310 Sept 2013

• Failure rate for late stage oncology trials is almost 60% (Kola and Landis, 2004)
• Two recent scientific developments can improve this track record• development of molecularly targeted agents• statistical methodology of adaptive trial design
applied to time-to-event data
• Fact: Some subgroups benefit differentially from others when treated with the targeted agent
Current State of Oncology Trials
FDA and Industry Workshop. 9-18-201310 Sept 2013

Oncology Products Approved in the US for Selected Patient Populations
Compound/Target Indication (prevalence target)Crizotinib (Xalkori®)/ ALK-rearrangement •Non-small cell lung cancer with ALK-rearrangements (5%)
Vemurafenib (Zelboraf®)/ BRAF mutation •Advanced melanoma with mutant BRAF (30-40%)
Trametinib (Mekinist™)/ MEK •Advanced melanoma with mutant BRAF (30-40%)
Trastuzumab (Herceptin®); Lapatinib (Tykerb®)/ Her2
•Her2 expressing breast cancer (25%)•Her2 expressing metastatic gastric cancer (20-30%)
Aromatase inhibitors (letrozole, exemestane) •ER(+) breast cancer (60-70%)
Rituximab (Rituxan®)/ CD20 •CD20(+) B-cell lymphomas (90%+)Cetuximab (Erbitux®); Panitumumab (Vectibix®) / EGFR
•Advanced Head/neck cancer (~100%)•EGFR(+) metastatic colorectal cancer (60-80%)•KRASWT metastatic colorectal cancer (60%)
FDA and Industry Workshop. 9-18-201310 Sept 2013
FDA and Industry Workshop. 9-18-2013
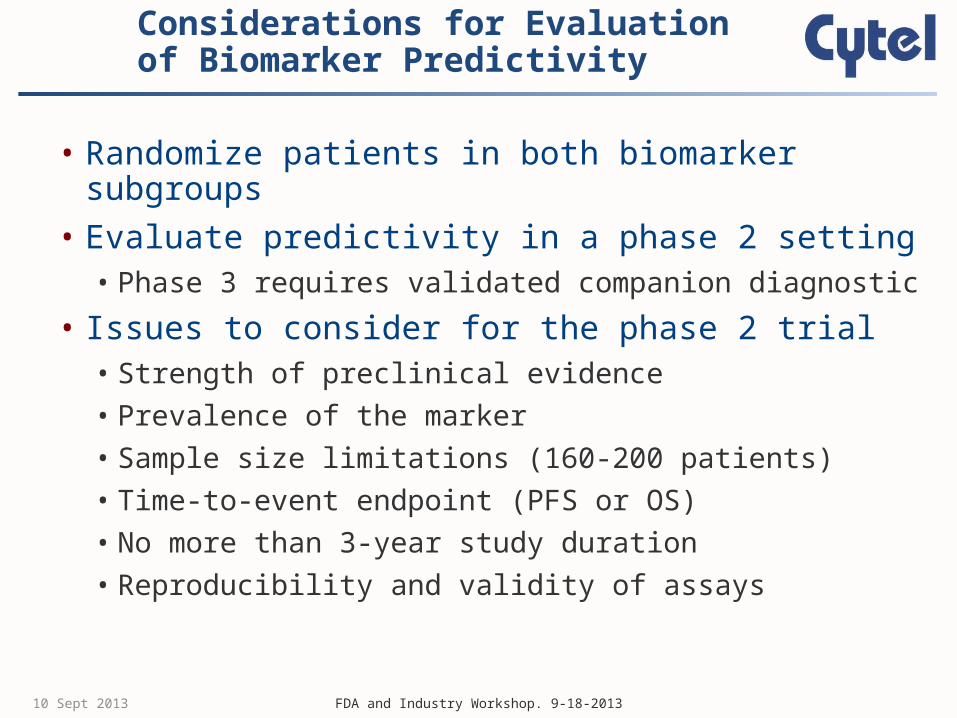
• Randomize patients in both biomarker subgroups• Evaluate predictivity in a phase 2 setting
• Phase 3 requires validated companion diagnostic
• Issues to consider for the phase 2 trial• Strength of preclinical evidence• Prevalence of the marker • Sample size limitations (160-200 patients) • Time-to-event endpoint (PFS or OS)• No more than 3-year study duration• Reproducibility and validity of assays
Considerations for Evaluation of Biomarker Predictivity
10 Sept 2013

FDA and Industry Workshop. 9-18-2013
• Two-stage design: all comers at Stage 1• Interim analysis at end of Stage 1, utilizing ALL
available information (censored and complete)• Adaptation decision implemented in Stage 2:
• Proceed with no design change (except possible SSR)• Proceed with biomarker subgroup (and possible SSR)• Terminate for futility
• Perform a closed test for the final analysis
Features of an Adaptive Enrichment Design
10 Sept 2013

• and are biomarker subgroups• n denotes sample size• d denotes events• T denotes the logrank statistic
Notation
FDA and Industry Workshop. 9-18-201310 Sept 2013

Schematic Representation of Protocol
ALL COME
RS
Subgroup
Subgroup
13
23
.5 Treatment
.5 Control
.5 Treatment
.5 Control
INTERIM
ANALYSIS
patients events
Stop for Futility
Continue withS and
Continue withS only
FINAL ANALYSIS
Perform a closed test
of S
STRATIFY
patients
FDA and Industry Workshop. 9-18-201310 Sept 2013
events
If is dropped, randomize all remaining patients to subgroup S and increase its events S
0d
0n
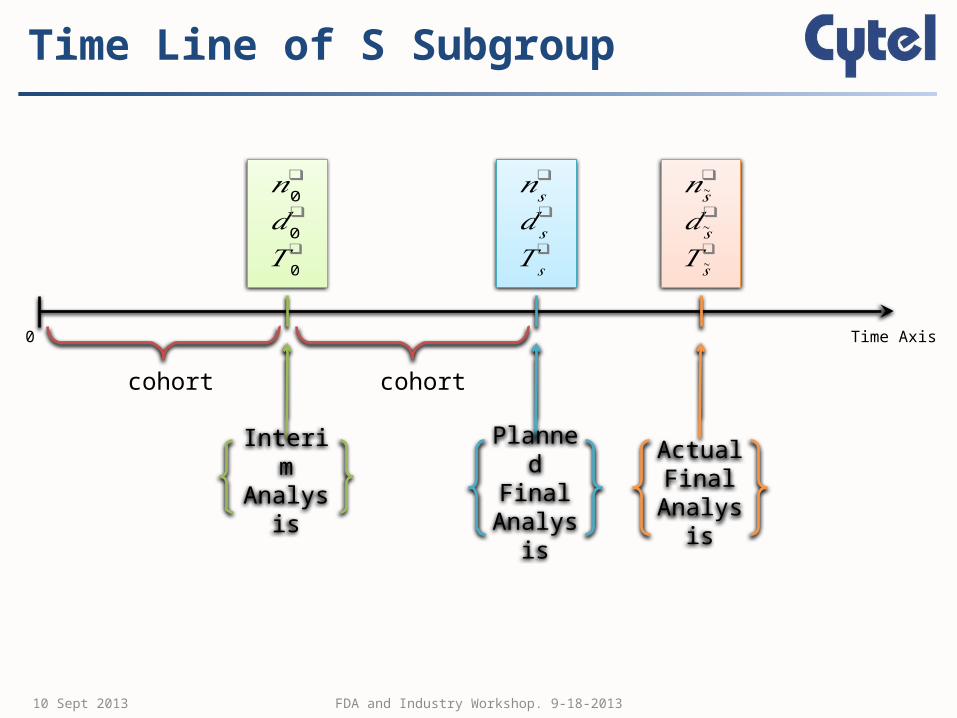
Time Line of S Subgroup
𝑛0❑
𝑑0❑
𝑇 0❑
InterimAnalysis
cohort
𝑛𝑠❑
𝑑𝑠❑
𝑇 𝑠❑
PlannedFinal
Analysis
cohort
𝑛~𝑠❑
𝑑~𝑠❑
𝑇 ~𝑠❑
ActualFinal
Analysis
Time Axis0
FDA and Industry Workshop. 9-18-201310 Sept 2013

Time Line of Subgroup
𝑛0❑
𝑑0❑
𝑇 0❑
InterimAnalysis
cohort
𝑛𝑠❑
𝑑𝑠❑
𝑇 𝑠❑
PlannedFinal
Analysis
Time Axis0
cohort
Drop the Subgroup if it has low conditional power
𝑺
FDA and Industry Workshop. 9-18-201310 Sept 2013

Hypothesis Testing at Final Analysis(a) If you do not drop at interim
1.96
2.24
R: rejection region for theIntersection hypothesis
2.24 T s
T s
Rejection region for the elementary hypothesis
For closed testing both and must be rejected
FDA and Industry Workshop. 9-18-201310 Sept 2013

Hypothesis Testing at Final Analysis(b) If you do drop at interim
~𝑐 T s
Rejection region for the elementary hypothesis
Reject if
FDA and Industry Workshop. 9-18-201310 Sept 2013

Preserving Type-1 Error: CER Method 1( Mullër and Schafër, 2001)
𝑛0❑
𝑑0❑
𝑇 0❑
InterimAnalysis
cohort
𝑛𝑠❑
𝑑𝑠❑
𝑇 𝑠❑
PlannedFinal
Analysis
cohort
𝑛~𝑠❑
𝑑~𝑠❑
𝑇 ~𝑠❑
ActualFinal
Analysis
Time Axis0
FDA and Industry Workshop. 9-18-201310 Sept 2013

• Decision to drop must only utilize the interim data from the patients for whom the event has occurred (Brannath et. al.,2009)
• Cannot utilize extra information in the censored observations such as tumor response
• This limitation is specific to survival dataReferences: Bauer and Posch (2004, Stat. in Med); Jenkins et. al. (2010, Pharmaceut. Statist.)
Comments on CER Method 1
FDA and Industry Workshop. 9-18-201310 Sept 2013

Preserving Type-1 Error: Method 2 (Irle, Schafër,Mehta, 2012, methodology)
𝑛0❑
𝑑0❑
𝑇 0❑
InterimAnalysis
cohort
𝑛𝑠❑
𝑑𝑠❑
𝑇 𝑠❑
PlannedFinal
Analysis
cohort
𝑛~𝑠❑
𝑑~𝑠❑
𝑇 ~𝑠❑
ActualFinal
Analysis
Time Axis0
𝑇 ′ 0❑ ~
𝑇 ′ 0𝑇 0❑𝑇 0❑
FDA and Industry Workshop. 9-18-201310 Sept 2013

• Conditions on future value of logrank statistic rather than value obtained at interim.
• Permits examination of all the interim data, not just the uncensored observations
• In particular, can combine short and long term data for interim decision making
• Related work of Jenkins, Stone, Jennison (2011): • Error control based on combination functions• Closed test of and ) not and )
Ref: Irle and Schäfer. “Interim design modifications in time-to-event studies.” JASA, 2012; 107:341-348
Comments on CER Method 2
FDA and Industry Workshop. 9-18-201310 Sept 2013

• Phase 2 trial of metastatic non-small cell lung cancer• Sample size limit of N = 160 patients with 80 for each
subgroup• Primary endpoint is progression free survival (PFS)• Median PFS for control arm is 5 months• Prior evidence that subgroup S (EGFR mutation) is
predictive of PFS:• HR(S) = 0.5, 06 is plausible• HR() < 0.7 is unlikely
The setting for a simulation guided design
10 Sept 2013 FDA and Industry Workshop. 9-18-2013

• Based on conditional power (CP)• Drop if CP() < A and CP(S) > B• Desirable properties of a good decision rule:
• If HR(S) is small and HR() is large, decision rule should reject and accept
• If HR(S) and HR() are both small, decision rule should reject and reject
• Phase 2 results should guide Phase 3 design
Decision Rule for Dropping at Interim
FDA and Industry Workshop. 9-18-201310 Sept 2013

Decision rules for initiating a Phase 3 trial based on the results of the Phase 2 adaptive enrichment trial
Use Phase 2 Simulations to Guide Phase 3 Go/No-Go/Enrich Decisions
FDA and Industry Workshop. 9-18-2013
Phase 2 Outcome: Decision Rule for Phase 3
Win on S; Lose on Initiate Phase 3 in S only
Win on S; Win on Initiate Phase 3 in S and
Lose on S; Win on No Go/investigate
Lose on S; Lose on No Go
10 Sept 2013

Drop if CP() < 0.5 and CP(S) > 0
10 Sept 2013 FDA and Industry Workshop. 9-18-2013
Assume HR(S) = 0.5

Drop if CP() < 0.5 and CP(S) > 0.5
10 Sept 2013 FDA and Industry Workshop. 9-18-2013
Assume HR(S) = 0.5

Never Drop (apply closed test only)
10 Sept 2013 FDA and Industry Workshop. 9-18-2013
Assume HR(S) = 0.5

• Phase 2 trial produces go/no-go/enrich Phase 3 decision• Simulate Phase 2 trial under scenarios where biomarker
is predicitve and where it is prognostic• Use simulation results to caliberate the performance of
the go/no-go/enrich decision rules• Improve the criteria for dropping or for futility
termination at interim analysis:• Utilize the information in the censored observations• Use Bayesian model incorporating tumor response and PFS
for sharper criteria
• Consider modeling both Phase 2 and Phase 3
Concluding Remarks and Future Work
FDA and Industry Workshop. 9-18-201310 Sept 2013