Adaptive landing gear: Optimum control strategy and potential...
21
Shock and Vibration 16 (2009) 175–194 175 DOI 10.3233/SAV-2009-0460 IOS Press Adaptive landing gear: Optimum control strategy and potential for improvement Grzegorz Mikulowski and Lukasz Jankowski ∗ Smart-Tech Centre, Institute of Fundamental Technological Research, Swietokrzyska 21, 00-049 Warszawa, Poland Received 17 July 2007 Revised 7 March 2008 Abstract. An adaptive landing gear is a landing gear (LG) capable of active adaptation to particular landing conditions by means of controlled hydraulic force. The objective of the adaptive control is to mitigate the peak force transferred to the aircraft structure during touch-down, and thus to limit the structural fatigue factor. This paper investigates the ultimate limits for improvement due to various strategies of active control. Five strategies are proposed and investigated numerically using a validated model of a real, passive landing gear as a reference. Potential for improvement is estimated statistically in terms of the mean and median (significant) peak strut forces as well as in terms of the extended safe sinking velocity range. Three control strategies are verified experimentally using a laboratory test stand. Keywords: Adaptive landing gear, adaptive impact absorption, shock absorber, load mitigation 1. Introduction A typical, most often occurring landing scenario of an aircraft involves a relatively low sinking velocity of approx. 0.5 m/s. However, the maximum design velocity, as specified by the regulations, is usually much higher (seven to ten knots [1]) and consequently landing gears (LGs) should be designed to dissipate optimally both low-energy and high-energy landings. This is virtually impossible for a standard passive LG and thus it is optimized for the most dangerous, highest-energy landing scenario only. Therefore, in a typical landing the standard LG operates unoptimized, although well below the maximum design peak force, which nevertheless results in unnecessary high fatigue of the involved structures and shortening of their service life. The structural fatigue factor could be greatly reduced [2], if a LG was capable of adaptation to each particular landing scenario [3]. It would be then possible to optimally reduce the peak strut force in the typical low-energy landing scenarios, but also preserve the capability to dissipate rare, high-energy impacts. Such adaptive landing gear (ALG) was the goal of the project ADLAND (Adaptive Landing Gears for Improved Impact Absorption [4]), funded within the EU 6th Framework Programme. Intensive development of landing gears started in the United States in 1950s when oleo-pneumatic design became popular and widely employed. These shock absorbers were composed of a gas spring and two hydraulic chambers separated by an orifice, which provided the resistant reaction of the hydraulic fluid. This type of shock absorber was reported to have the highest efficiency in relation to the weight [5]; however, its properties were not tunable to the wide demands of the touchdown operation. The strut reacting forces are awaited to vary in particular phases of the landing loading. Additionally, the same landing gear must also perform satisfactorily during taxi operations. Hydraulic orifices of constant geometries result in constant quadratic relation of the reaction to the velocity of the piston. It was soon determined to be beneficial to allow the hydraulic reaction to be adjustable during the operation of the strut. The first innovation to the oleo-pneumatic shock absorbers was the metering pin, which modulated ∗ Corresponding author. Tel.: +48 22 8261281 ext. 241; Fax: +48 22 8287476; E-mail: [email protected]. ISSN 1070-9622/09/$17.00 2009 – IOS Press and the authors. All rights reserved
Transcript of Adaptive landing gear: Optimum control strategy and potential...

Shock and Vibration 16 (2009) 175–194 175DOI 10.3233/SAV-2009-0460IOS Press
Adaptive landing gear: Optimum controlstrategy and potential for improvement
Grzegorz Mikułowski and Łukasz Jankowski∗Smart-Tech Centre, Institute of Fundamental Technological Research, Swietokrzyska 21, 00-049 Warszawa, Poland
Received 17 July 2007
Revised 7 March 2008
Abstract. An adaptive landing gear is a landing gear (LG) capable of active adaptation to particular landing conditions by meansof controlled hydraulic force. The objective of the adaptive control is to mitigate the peak force transferred to the aircraft structureduring touch-down, and thus to limit the structural fatigue factor. This paper investigates the ultimate limits for improvementdue to various strategies of active control. Five strategies are proposed and investigated numerically using a validated model ofa real, passive landing gear as a reference. Potential for improvement is estimated statistically in terms of the mean and median(significant) peak strut forces as well as in terms of the extended safe sinking velocity range. Three control strategies are verifiedexperimentally using a laboratory test stand.
Keywords: Adaptive landing gear, adaptive impact absorption, shock absorber, load mitigation
1. Introduction
A typical, most often occurring landing scenario of an aircraft involves a relatively low sinking velocity of approx.0.5 m/s. However, the maximum design velocity, as specified by the regulations, is usually much higher (sevento ten knots [1]) and consequently landing gears (LGs) should be designed to dissipate optimally both low-energyand high-energy landings. This is virtually impossible for a standard passive LG and thus it is optimized for themost dangerous, highest-energy landing scenario only. Therefore, in a typical landing the standard LG operatesunoptimized, although well below the maximum design peak force, which nevertheless results in unnecessary highfatigue of the involved structures and shortening of their service life. The structural fatigue factor could be greatlyreduced [2], if a LG was capable of adaptation to each particular landing scenario [3]. It would be then possible tooptimally reduce the peak strut force in the typical low-energy landing scenarios, but also preserve the capabilityto dissipate rare, high-energy impacts. Such adaptive landing gear (ALG) was the goal of the project ADLAND(Adaptive Landing Gears for Improved Impact Absorption [4]), funded within the EU 6th Framework Programme.
Intensive development of landing gears started in the United States in 1950s when oleo-pneumatic design becamepopular and widely employed. These shock absorbers were composed of a gas spring and two hydraulic chambersseparated by an orifice, which provided the resistant reaction of the hydraulic fluid. This type of shock absorberwas reported to have the highest efficiency in relation to the weight [5]; however, its properties were not tunable tothe wide demands of the touchdown operation. The strut reacting forces are awaited to vary in particular phasesof the landing loading. Additionally, the same landing gear must also perform satisfactorily during taxi operations.Hydraulic orifices of constant geometries result in constant quadratic relation of the reaction to the velocity of thepiston. It was soon determined to be beneficial to allow the hydraulic reaction to be adjustable during the operationof the strut. The first innovation to the oleo-pneumatic shock absorbers was the metering pin, which modulated
∗Corresponding author. Tel.: +48 22 8261281 ext. 241; Fax: +48 22 8287476; E-mail: [email protected].
ISSN 1070-9622/09/$17.00 2009 – IOS Press and the authors. All rights reserved
176 G. Mikułowski and Ł. Jankowski / Adaptive landing gear: Optimum control strategy and potential for improvement
the cross-section of the orifice in dependence on the position of the piston [5]. Extensive research on the behaviorof oleo-pneumatic landing gears was conducted in 1950s by NACA researchers with the objective of developinganalytical modeling methods and appropriate design tools. The studies were usually conducted numerically withlaboratory validation [6,7]. In parallel, the landing gears were investigated experimentally in flight tests [8]. One ofthe first methods to calculate the proper profile of the metering pin was proposed in [9].
Development of supersonic airplanes in 1960s introduced a new class of problems. The ground-induced dynamicand vibration problems were magnified because of increased structural flexibility of the slender bodies, thin-wingdesigns and higher takeoff and landing speeds. During investigations of particular designs, extremely high vibrationlevels of fuselages during takeoffs were reported [10]. The objectives of researches on landing gears were extendedto include the effective mitigation of ground-induced vibrations. From the beginning of 1970s, an active landinggear began to be considered to be a possible solution to the vibration problems [11].
An active landing gear was defined as a shock strut with actively controlled damping force. The control amountedto increasing or decreasing the internal hydraulic pressure by means of an external reservoir of compressed medium.Initially, the researches were focused on recognition of the character of the phenomenon, analytical modelling andassessing the feasibility [2,12]. The first results were promising but technological problems were reported sincethe estimated flow rates of the hydraulic fluid were predicted to be as high as 1000 liters per minute [12]. Atthe beginning of 1980s the concept matured to a prototype system designed in accordance with all aeronauticalregulations [13,14], which was tested in impact and roll-out operations [15,16]. The tests showed that the device iseffective in reducing the dynamics effects but also a significant bending of the landing gear during the spin-up phaseof the touchdown was reported. In 1990s active landing gears were adapted for employment in military aircrafts asreported in [17–19]. Actively controlled landing gears were analyzed for military aviation also in Europe [20].
These widely studied active solutions have two important disadvantages. They are characterized by high energyconsumption due to the necessity of delivering high pressures. Moreover, a fail-safe active LG is hard to realize,since characteristics of the strut air spring depends on the instantaneous amount of the oil inside the strut and, inthe case of a failure, the resulting passive landing gear may be not tuned for the actual impact landing scenario. In1990s, a new less invasive solution became to be discussed [21,22]: application of an adaptive, semi-active approachto landing gears. The hydraulic force was assumed to be controlled directly by alterations of characteristics of themain orifice of the strut. The significant advantages of the new concept are lower energy consumption (no externalcompressed reservoirs, no need to add hydraulic energy to the system) and better fail-safe properties. The researcheswere focused on optimum control development and analysis of possible actuation systems [21,23,24]. After the year2000, reports on experimental tests of non-flying models of adaptive landing gears become available [25,26]. Thereported solutions were based on quick electric servovalves controlling the flow of the hydraulic fluid between thechambers.
Other technical solutions were proposed within the ADLAND project [4], which pursued an adaptive LG im-plemented using smart technologies: piezo-driven valves and magnetorheological (MR) fluids. Both approachesrequire a dedicated active LG head only and preserve the time-tested general design of landing gears. Piezoelectricmaterials are characterized by a very low power consumption, high actuation accuracy and short response time;these advantages make them perfectly suitable for a piezo-valve system for controlling the flow of hydraulic fluidin a LG. Low power consumption, mechanical reliability and simplicity of the design were important advantagesof the other solution, which was based on MR fluids: an MR-based LG head is free of complicated mechanicalsystems and quickly moving parts, as the damping effect can be controlled directly by the magnetic flux density. Inboth cases, power-failure fail-safe characteristics can be easily designed by including a proper passive position ofthe piezo-valve or a system of magnets for the proper passive intensity of the magnetic field. The project ended in2006 with flight test of the developed adaptive LG. Part of the design problems were presented in [27–29].
In the first stages of the ADLAND project a systematic comparison and evaluation of different control strategieswas necessary, since available researches focused on a single chosen control scheme only and assumed full knowledgeabout the landing conditions[2,23,25,26]. This paper reports on the corresponding systematic investigation of theperformance and the ultimate limits for improvement of a standard LG due to five basic strategies of adaptive control,ranging from passive to active, with and without the full information about the landing mass. As a reference,a standard oleopneumatic one-stage cantilever-type [5,30,31] passive nose LG of an I-23 light aircraft [32] is used,with no structural modifications assumed besides the possibility of an instantaneous active control. Comparison of
G. Mikułowski and Ł. Jankowski / Adaptive landing gear: Optimum control strategy and potential for improvement 177
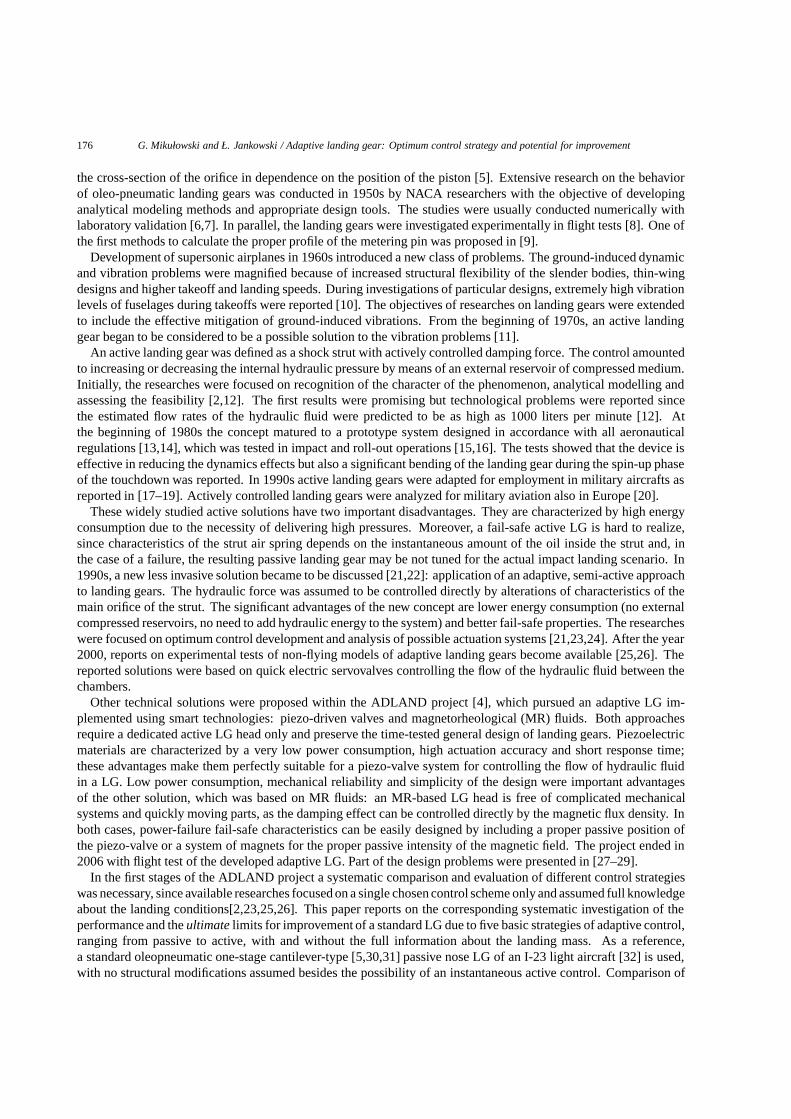
Fig. 1. Free-body diagram of landing gear (aircraft, strut and wheel).
numerical simulations with drop-tests of the reference LG confirms the accuracy of the model used for simulations.Moreover, three of the five investigated strategies are verified experimentally on a laboratory-scale drop testing stand;details of the effective real-time feedback control used in the active control schemes are reported in [27].
Optimum adaptation requires pre-touchdown recognition, at least partial, of the imminent landing scenario (mass,velocity, etc.) to trigger the adaptation in advance. This has been studied and proven feasible in [33,34]. Innumerical computations, the hydraulic force is assumed here to be controlled directly by the main orifice area, whichin practical implementations for ADLAND project was related to driving voltage (piezo-valve solution) or current(magnetorheological head), the latter is demonstrated also in the experimental section of the paper.
The following Section 2 states the numerical model used and validates it against measurement data. The controlstrategies used to minimize the peak strut force are discussed in Section 3. The potential for improvement is estimatedand compared in Section 4, while Section 5 reports on the laboratory testing stand and the experimental verification.
2. Numerical model
For the purposes of this analysis, the (A)LG is represented by a 2 DOF system, shown schematically in Fig. 1,and modeled by the following set of equations (a modified version of the equations derived by Milwitzky and Cookin [6]):
m1z1 = m1g − FS − mgL,
m2z2 = m2g + FS − FG,
z1(0) = z2(0) = 0, (1)
z1(0) = z2(0) = v0,
where m, m1 and m2 are respectively total, upper (aircraft) and lower (wheel) masses (m = m 1 + m2, m2 =8.71 kg); z1 and z2 denote their vertical displacements from initial contact; L denotes the lift factor (L = 0.667 [1]);FG is the vertical force acting on tire at the ground; FS is the total axial strut force, and v0 denotes the initial landingsinking velocity.
178 G. Mikułowski and Ł. Jankowski / Adaptive landing gear: Optimum control strategy and potential for improvement
0
5
10
15
20
25
0 10 20 30 40 50 60 70 80 90
tire
forc
e F G
[kN
]
tire deflection z2 [mm]
measuredfitted
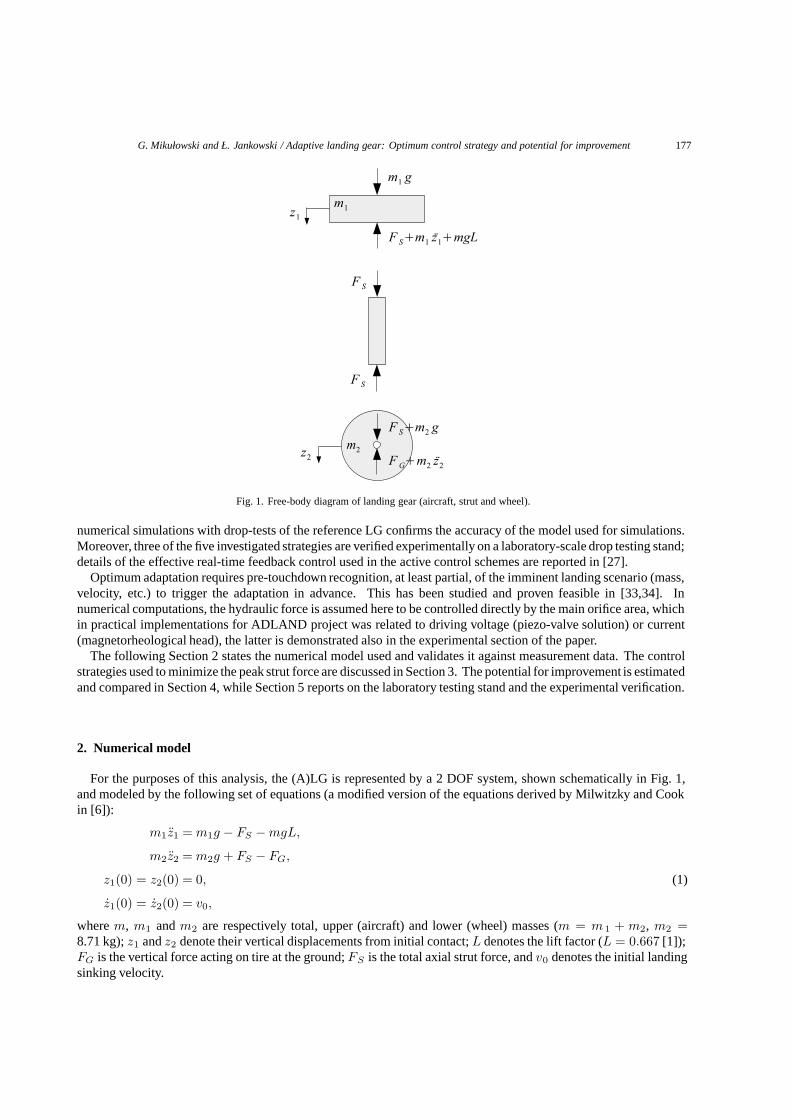
Fig. 2. Measured and fitted tire force – deflection characteristics (I-23 nose LG).
The mass m and the sinking velocity v0 are limited [32] by
288 kg = mmin � m � mmax = 422 kg,(2)
0 m/s = v0(max) � v0 � v0(max) = 2.93 m/s.
For the assumed detailed statistics of the landing mass m and the sinking velocity v 0, see Section 4.2. The mass mis the reduced mass (mass per landing gear) and is less than the total landing mass of the aircraft. The upper boundof 422 kg corresponds to the maximum I-23 design landing mass of 1117 kg and the lower bound of 288 kg waschosen to be proportional to the mass of an empty aircraft with a pilot [32].
The dynamic tire force – deflection characteristics of the I-23 nose LG, denoted in Eq. (1) by F G, has been obtainedby fitting experimental data measured in three dynamic tests (see Fig. 2). The least squares fit is a fourth-orderpolynomial:
FG(z2) ≈ (7.3 104 + 5.4 106z2 − 8.6 107z22 + 6.4 108z3
2)max(z2, 0),
where the last multiplier denotes symbolically that FG vanishes when the tire hovers above the ground.The total axial strut force FS is modeled as a sum of four forces:
FS = Fa + Fh + Ff + Fd, (3)
which are respectively strut pneumatic, hydraulic and friction forces, denoted by F a, Fh and Ff , and the delimitingforce Fd, which prevents excessive strut elongation. Notice that introduction of the actually occurring delimitingforce Fd greatly simplifies modeling of the landing process, as compared to the approach of Milwitzky and Cook [6],since the LG can be uniformly modeled as a 2 DOF system throughout the whole landing, including its initial stageand – if necessary – rebounds. The total strut force and the component forces depend directly on the strut axialstroke s,
s = z1 − z2.
The pneumatic force Fa in Eq. (3) is modeled in accordance with the polytropic law for compression of gases,
Fa(s) = p0Aa
(V0
V0 − sAa
)n
, (4)
while the hydraulic force Fh is modeled in the standard way [6] as
Fh(s) = sign(s)12
ρA3h
C2dA2
o
s2. (5)
The friction occurring in the strut is assumed to be dry friction only [6] and is modeled by
G. Mikułowski and Ł. Jankowski / Adaptive landing gear: Optimum control strategy and potential for improvement 179
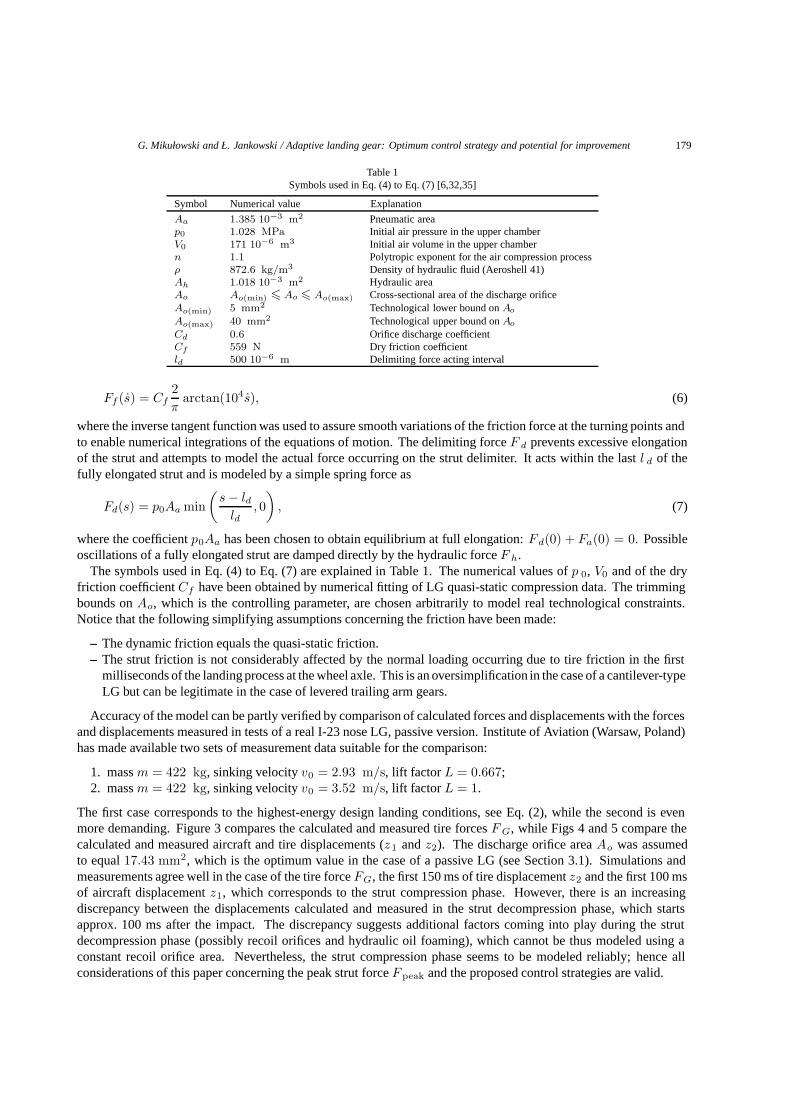
Table 1Symbols used in Eq. (4) to Eq. (7) [6,32,35]
Symbol Numerical value Explanation
Aa 1.385 10−3 m2 Pneumatic areap0 1.028 MPa Initial air pressure in the upper chamberV0 171 10−6 m3 Initial air volume in the upper chambern 1.1 Polytropic exponent for the air compression processρ 872.6 kg/m3 Density of hydraulic fluid (Aeroshell 41)Ah 1.018 10−3 m2 Hydraulic areaAo Ao(min) � Ao � Ao(max) Cross-sectional area of the discharge orificeAo(min) 5 mm2 Technological lower bound on Ao
Ao(max) 40 mm2 Technological upper bound on Ao
Cd 0.6 Orifice discharge coefficientCf 559 N Dry friction coefficientld 500 10−6 m Delimiting force acting interval
Ff (s) = Cf2π
arctan(104s), (6)
where the inverse tangent function was used to assure smooth variations of the friction force at the turning points andto enable numerical integrations of the equations of motion. The delimiting force F d prevents excessive elongationof the strut and attempts to model the actual force occurring on the strut delimiter. It acts within the last l d of thefully elongated strut and is modeled by a simple spring force as
Fd(s) = p0Aa min(
s − ldld
, 0)
, (7)
where the coefficient p0Aa has been chosen to obtain equilibrium at full elongation: Fd(0) + Fa(0) = 0. Possibleoscillations of a fully elongated strut are damped directly by the hydraulic force F h.
The symbols used in Eq. (4) to Eq. (7) are explained in Table 1. The numerical values of p 0, V0 and of the dryfriction coefficient Cf have been obtained by numerical fitting of LG quasi-static compression data. The trimmingbounds on Ao, which is the controlling parameter, are chosen arbitrarily to model real technological constraints.Notice that the following simplifying assumptions concerning the friction have been made:
– The dynamic friction equals the quasi-static friction.– The strut friction is not considerably affected by the normal loading occurring due to tire friction in the first
milliseconds of the landing process at the wheel axle. This is an oversimplification in the case of a cantilever-typeLG but can be legitimate in the case of levered trailing arm gears.
Accuracy of the model can be partly verified by comparison of calculated forces and displacements with the forcesand displacements measured in tests of a real I-23 nose LG, passive version. Institute of Aviation (Warsaw, Poland)has made available two sets of measurement data suitable for the comparison:
1. mass m = 422 kg, sinking velocity v0 = 2.93 m/s, lift factor L = 0.667;2. mass m = 422 kg, sinking velocity v0 = 3.52 m/s, lift factor L = 1.
The first case corresponds to the highest-energy design landing conditions, see Eq. (2), while the second is evenmore demanding. Figure 3 compares the calculated and measured tire forces F G, while Figs 4 and 5 compare thecalculated and measured aircraft and tire displacements (z1 and z2). The discharge orifice area Ao was assumedto equal 17.43 mm2, which is the optimum value in the case of a passive LG (see Section 3.1). Simulations andmeasurements agree well in the case of the tire force FG, the first 150 ms of tire displacement z2 and the first 100 msof aircraft displacement z1, which corresponds to the strut compression phase. However, there is an increasingdiscrepancy between the displacements calculated and measured in the strut decompression phase, which startsapprox. 100 ms after the impact. The discrepancy suggests additional factors coming into play during the strutdecompression phase (possibly recoil orifices and hydraulic oil foaming), which cannot be thus modeled using aconstant recoil orifice area. Nevertheless, the strut compression phase seems to be modeled reliably; hence allconsiderations of this paper concerning the peak strut force F peak and the proposed control strategies are valid.

180 G. Mikułowski and Ł. Jankowski / Adaptive landing gear: Optimum control strategy and potential for improvement
0
5
10
15
20
25
0 50 100 150 200
tire
forc
e F G
[kN
]
time [ms]
measured case 1computed case 1measured case 2computed case 2
Fig. 3. Measured and computed tire force FG, passive LG: test case 1 (m = 422 kg, v0 = 2. 93 m /s, L = 0. 667); test case 2 (m = 422 kg,v0 = 3.52 m/s, L = 1).
-20
0
20
40
60
80
100
120
140
160
180
200
0 50 100 150 200
disp
lace
men
ts z
1 and
z2 [
mm
]
time [ms]
measured z1computed z1measured z2computed z2
Fig. 4. Measured and computed displacements of aircraft z1 and tire z2, passive LG, test case 1 (m = 422 kg, v0 = 2.93 m/s, L = 0.667).
3. Control strategies
It is assumed that the landing scenario is fully defined by two basic parameters: (1) total landing mass per strutm, (2) initial strut sinking velocity v0. Their ranges are given in Eq. (2), their distributions in Section 4.2. Thecommon objective of all the investigated control strategies is to minimize the peak strut force F peak occurring duringthe landing. The evolution of the total strut force FS is fully determined by the control parameter, which is area A o
of the discharge orifice. Essentially, there are three control strategies possible:
– Passive LG (PLG), i.e. no control. the orifice area Ao is constant and cannot be adjusted to particular landingconditions. Nevertheless, its pre-set constant value is optimized to mitigate the peak strut force occurring at thehighest-energy landing conditions (maximum design landing mass and sinking velocity).
– Semi-active LG (SLG). The orifice area Ao is optimally set directly before each landing, based on the actualsinking velocity v0 and/or mass m, which have to be measured or known in advance. A o remains constantduring the landing process, which makes the strategy relatively easy to implement, since no quick closed controlloops are necessary.

G. Mikułowski and Ł. Jankowski / Adaptive landing gear: Optimum control strategy and potential for improvement 181
-50
0
50
100
150
200
0 50 100 150 200
disp
lace
men
ts z
1 and
z2 [
mm
]
time [ms]
measured z1computed z1measured z2computed z2
Fig. 5. Measured and computed displacements of aircraft z1 and tire z2, passive LG, test case 2 (m = 422 kg, v0 = 3. 52 m /s, L = 1).
– Active LG (ALG). The orifice area Ao changes continuously during the landing process, according to a strategydefined by the actual values of the initial sinking velocity v0 and/or mass m, which have to be measured orknown in advance. This strategy potentially yields the highest improvement, but requires quick closed controlloops and accurate real-time measurement data, which may result in instabilities.
The strategies apply to the strut compression phase only. During the decompression phase, recoil orifices takeeffect instead of the main discharge orifice, the numerical model has thus to be modified and the optimization goalredefined. However, as the (to-be-minimized) peak strut force F peak occurs within the strut compression phase,modeling of the decompression phase is outside the scope of this paper.
To apply the active or the semi-active control strategy, as defined above, the actual landing scenario has to be atleast partially known in advance. In real conditions, the sinking velocity v 0 can be relatively easy measured justbefore the touchdown by a dedicated sensor (e.g. ultrasonic, one per LG). However, it may not be possible to knowthe exact actual value of the total landing mass per strut m. Therefore, to asses the importance of the knowledge ofthe mass, altogether five cases have been considered:
1. Passive LG (PLG);2. Semi-active LG (SLG): both v0 and m are known before landing;3. Velocity-driven semi-active LG (VD-SLG): only v0 is known before landing;4. Active LG (ALG): both v0 and m are known before landing;5. Velocity-driven active LG (VD-ALG): only v0 is known before landing.
To investigate and assess the strategies, the equations of motion Eq. (1) had to be solved numerically, which wasdone with explicit methods and the time step 5 µs or 50 µs (active strategies). The peak strut forces computed at5 µs and 50 µs differed by approx. 0.1%–0.2%, which is acceptable to compare the strategies reliably.
3.1. Passive LG
The pre-set constant discharge orifice area APLGo has to be chosen to minimize the peak force occurring
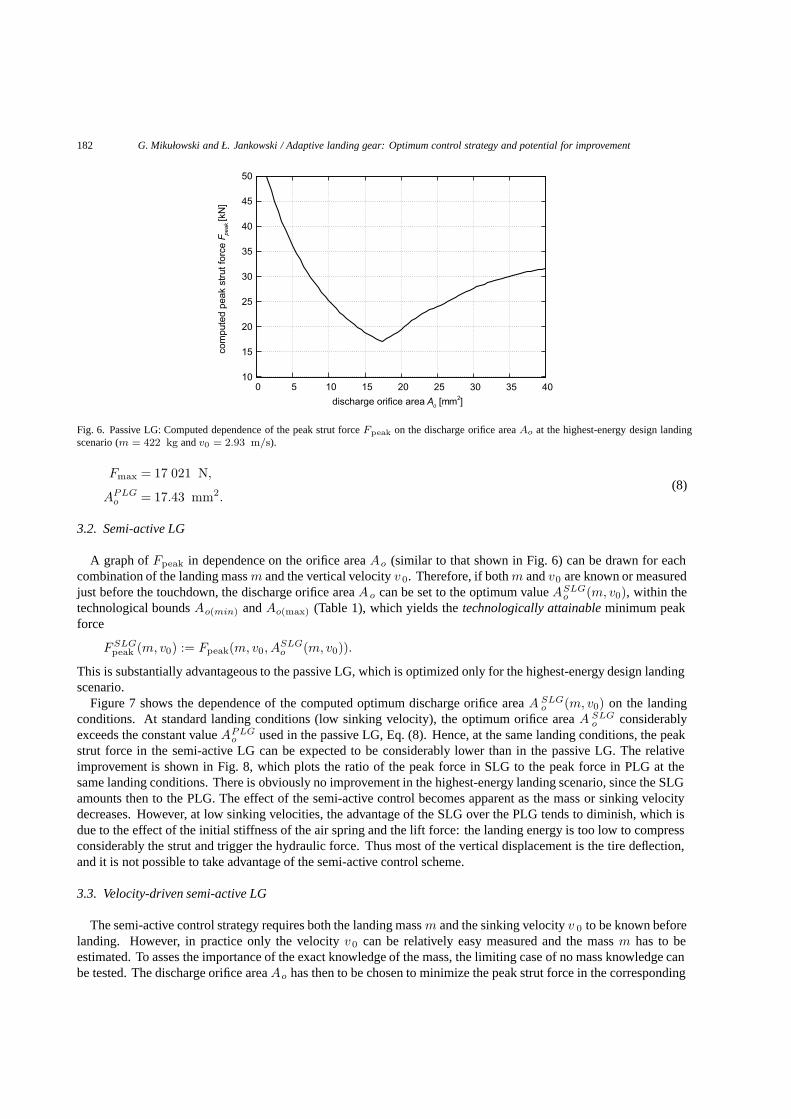
during the highest-energy design landing scenario. Figure 6 shows the dependence of the peak strut forceFPLG
peak (mmax, v0(max), Ao) on the discharge orifice area Ao. The left slope corresponds to the decreasing peak of thehydraulic force, while the right slope corresponds to the increasing peak of the pneumatic force. The minimum valueof 17 021 N has been found at APLG
o = 17.43 mm2, where both peaks are equal. The corresponding computedtire peak force equals 17 374 N, which is relatively very close to the measured value of 17 400 N (see Fig. 3).Thus, the maximum design strut force was assumed to be Fmax = 17 021 N. The optimum discharge orifice areafor a passive LG is APLG
o = 17.43 mm2.
182 G. Mikułowski and Ł. Jankowski / Adaptive landing gear: Optimum control strategy and potential for improvement
10
15
20
25
30
35
40
45
50
0 5 10 15 20 25 30 35 40
com
pute
d pe
ak s
trut
forc
e F pe
ak [k
N]
discharge orifice area Ao [mm2]
Fig. 6. Passive LG: Computed dependence of the peak strut force Fpeak on the discharge orifice area Ao at the highest-energy design landingscenario (m = 422 kg and v0 = 2. 93 m /s).
Fmax = 17 021 N,(8)
APLGo = 17.43 mm2.
3.2. Semi-active LG
A graph of Fpeak in dependence on the orifice area Ao (similar to that shown in Fig. 6) can be drawn for eachcombination of the landing mass m and the vertical velocity v 0. Therefore, if both m and v0 are known or measuredjust before the touchdown, the discharge orifice area Ao can be set to the optimum value ASLG
o (m, v0), within thetechnological bounds Ao(min) and Ao(max) (Table 1), which yields the technologically attainable minimum peakforce
FSLGpeak (m, v0) := Fpeak(m, v0, A
SLGo (m, v0)).
This is substantially advantageous to the passive LG, which is optimized only for the highest-energy design landingscenario.
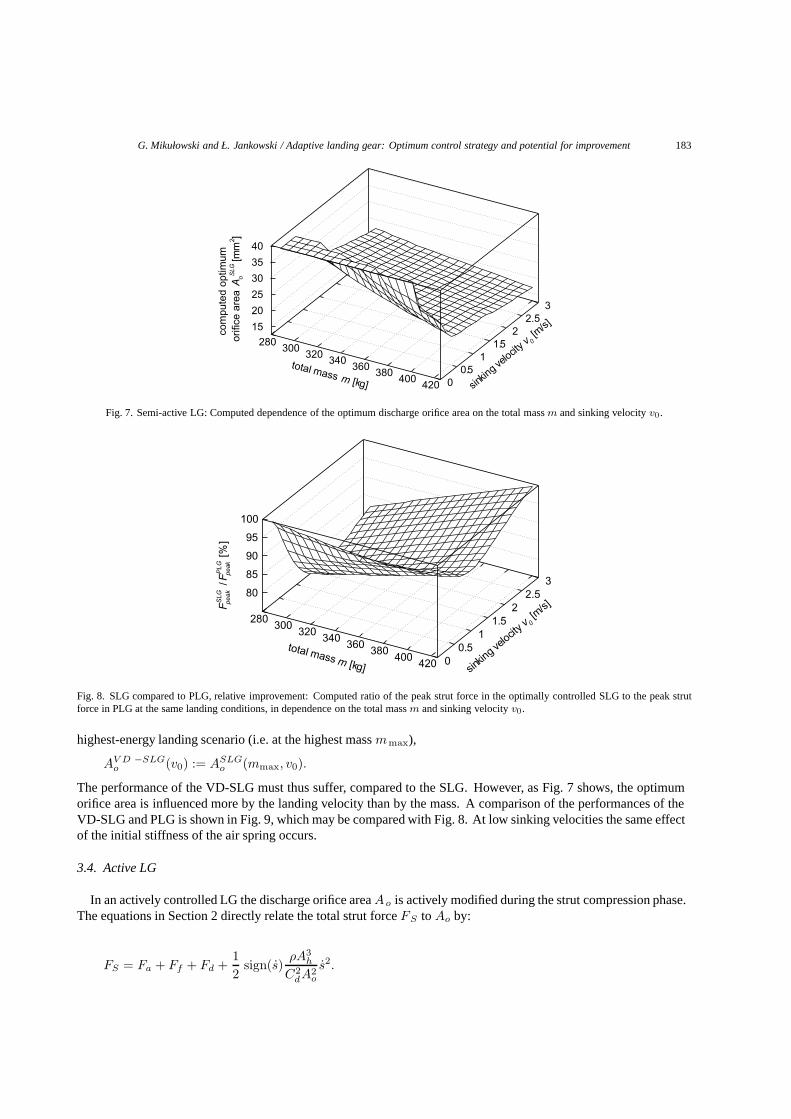
Figure 7 shows the dependence of the computed optimum discharge orifice area A SLGo (m, v0) on the landing
conditions. At standard landing conditions (low sinking velocity), the optimum orifice area A SLGo considerably
exceeds the constant value APLGo used in the passive LG, Eq. (8). Hence, at the same landing conditions, the peak
strut force in the semi-active LG can be expected to be considerably lower than in the passive LG. The relativeimprovement is shown in Fig. 8, which plots the ratio of the peak force in SLG to the peak force in PLG at thesame landing conditions. There is obviously no improvement in the highest-energy landing scenario, since the SLGamounts then to the PLG. The effect of the semi-active control becomes apparent as the mass or sinking velocitydecreases. However, at low sinking velocities, the advantage of the SLG over the PLG tends to diminish, which isdue to the effect of the initial stiffness of the air spring and the lift force: the landing energy is too low to compressconsiderably the strut and trigger the hydraulic force. Thus most of the vertical displacement is the tire deflection,and it is not possible to take advantage of the semi-active control scheme.
3.3. Velocity-driven semi-active LG
The semi-active control strategy requires both the landing mass m and the sinking velocity v 0 to be known beforelanding. However, in practice only the velocity v0 can be relatively easy measured and the mass m has to beestimated. To asses the importance of the exact knowledge of the mass, the limiting case of no mass knowledge canbe tested. The discharge orifice area Ao has then to be chosen to minimize the peak strut force in the corresponding
G. Mikułowski and Ł. Jankowski / Adaptive landing gear: Optimum control strategy and potential for improvement 183
total mass m [kg] sinkin
g velocit
y v 0 [m
/s]com
pute
d op
timum
orifi
ce a
rea
AoS
LG [m
m2 ]
280 300
320 340
360 380
400 420 0
0.5 1
1.5 2
2.5 3
15
20
25
30
35
40
Fig. 7. Semi-active LG: Computed dependence of the optimum discharge orifice area on the total mass m and sinking velocity v0.
total mass m [kg] sinkin
g velocit
y v 0 [m
/s]FS
LGpe
ak /
Fpe
akP
LG [
%]
280 300
320 340 360 380
400 420 0
0.5 1
1.5 2
2.5 3
80
85
90
95
100
Fig. 8. SLG compared to PLG, relative improvement: Computed ratio of the peak strut force in the optimally controlled SLG to the peak strutforce in PLG at the same landing conditions, in dependence on the total mass m and sinking velocity v0.
highest-energy landing scenario (i.e. at the highest mass mmax),
AV D −SLGo (v0) := ASLG
o (mmax, v0).
The performance of the VD-SLG must thus suffer, compared to the SLG. However, as Fig. 7 shows, the optimumorifice area is influenced more by the landing velocity than by the mass. A comparison of the performances of theVD-SLG and PLG is shown in Fig. 9, which may be compared with Fig. 8. At low sinking velocities the same effectof the initial stiffness of the air spring occurs.
3.4. Active LG
In an actively controlled LG the discharge orifice area Ao is actively modified during the strut compression phase.The equations in Section 2 directly relate the total strut force FS to Ao by:
FS = Fa + Ff + Fd +12
sign(s)ρA3
h
C2dA2
o
s2.

184 G. Mikułowski and Ł. Jankowski / Adaptive landing gear: Optimum control strategy and potential for improvement
total mass m [kg] sinkin
g velocit
y v 0 [m
/s]FV
D-S
LGpe
ak
/ Fpe
akP
LG [
%]
280 300
320 340 360 380
400 420 0
0.5 1
1.5 2
2.5 3
80
85
90
95
100
Fig. 9. VD-SLG compared to PLG, relative improvement: Computed ratio of the peak strut forces in the optimally controlled VD-SLG and PLGat the same landing conditions, in dependence on the total mass m and sinking velocity v0.
Hence, if instantaneous control is assumed, an obvious method to keep the total strut force F S at a desired limitvalue Flimit is to actively set Ao during the compression phase according to
A2o =
{A2
o(max) if Flimit � Fa + Ff + Fd
max(A2
o(min), min(A2
o(max),ρ2
A3h
C2d
s2 sign(s)Flimit−Fa−Ff−Fd
))otherwise,
(9)
where the first value serves the instantaneous minimization of FS in case it inevitably exceeds Flimit. According toEq. (9), at the very beginning of the strut motion, when the total strut force F S is still low, the discharge orifice areaAo is set to Ao(min) and stay so until FS attains Flimit. Thereafter Ao is actively controlled within the given limitsuntil the decompression phase begins. Therefore, the active approach of Eq. (9) requires optimization of the peakforce with respect to only one parameter F limit, which has to be performed for each landing conditions defined bym and v0.
However, Eq. (9) is only an approximation to the optimum active control. A finer control strategy applied at thebeginning of the compression phase, before attaining F limit, could further increase the efficiency of the strut andreduce the peak force. To come closer to the optimum strategy, the strut can be softened at the beginning of theimpact by setting the initial discharge orifice area to a given value Ao(ini). The active control of Eq. (9) begins firstwhen the force limit Flimit has been attained. In a real LG it will also reduce the initial tire – runway friction, allowfor a gradual wheel spin-up and reduce the spring-back effects. This resulted in optimization with respect to twoparameters: (1) initial area of the discharge orifice Ao(ini); (2) desired strut force limit Flimit, which triggers andcontrols the phase of active control according to Eq. (9).
Figure 10 shows the relative improvement in comparison to the PLG. The advantage of the ALG over SLG (Fig. 8)at standard landing conditions (low sinking speed) amounts to not more than 3% and is rather insignificant. However,at the highest-energy landing conditions it attains the maximum of approx. 9%, which is significantly better than thesemi-active strategy.
3.5. Velocity-driven active LG
Similarly to VD-SLG, a VD-ALG can be considered to study the limiting case of the practical scenarios when themass m is not known before the landing and should be thus assumed to be the maximum m max:
AV D −ALGo(ini) (v0) := AALG
o(ini)(mmax, v0),
FV D −ALGlimit (v0) := FALG
limit (mmax, v0).

G. Mikułowski and Ł. Jankowski / Adaptive landing gear: Optimum control strategy and potential for improvement 185
total mass m [kg] sinkin
g velocit
y v 0 [m
/s]FA
LGpe
ak /
Fpe
akP
LG [
%]
280 300
320 340 360 380
400 420 0
0.5 1
1.5 2
2.5 3
80
85
90
95
100
Fig. 10. ALG compared to PLG, relative improvement: Computed ratio of the peak strut forces in the optimally controlled ALG and PLG at thesame landing conditions, in dependence on the total mass m and sinking velocity v0.
total mass m [kg] sinkin
g velocit
y v 0 [m
/s]FV
D-A
LGpe
ak
/ Fpe
akP
LG [
%]
280 300
320 340 360 380
400 420 0
0.5 1
1.5 2
2.5 3
80
85
90
95
100
Fig. 11. VD-ALG compared to PLG, relative change: Computed ratio of the peak strut forces in the optimally controlled VD-ALG and PLG atthe same landing conditions, in dependence on the total mass m and sinking velocity v0; the contour line marks the 100% level.
Figure 11 compares the performances of the VD-ALG and PLG. At low landing mass the peak force can be evenhigher than in the standard PLG, which renders the pure VD-ALG strategy useless.
3.6. Example simulations
All sample simulations presented in this section are based on the landing conditions m = 350 kg and v 0 =1.5 m/s, which are taken as examples and lie approximately in the middle of the design range (see Eq. (2)).
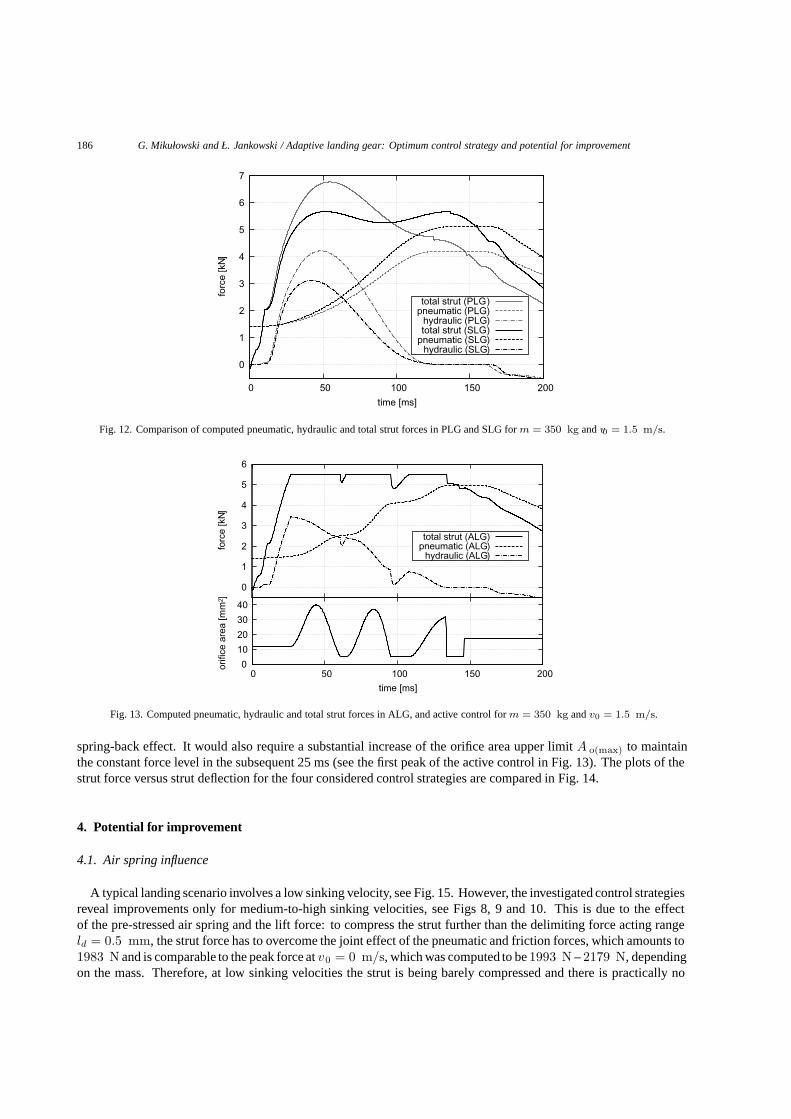
Figure 12 compares the computed strut forces in the PLG and SLG during the first 200 ms of the landing process.Figure 13 shows the forces in the ALG along with the details of the applied active control. Two small temporarydecreases of the total strut force at approx. 60 ms and 100 ms are results of attaining the lower limit A o(min) imposedon the orifice area (see the bottom plot of the active control). Notice how the pneumatic and hydraulic force peaks,which are unequal in the PLG, are made equal in the SLG and additionally leveled in the ALG. Further reductionof the peak strut force is possible only by increasing the force growth rate in the first 25 ms by decreasing theinitial orifice area Ao(ini). However, in a real LG this would considerably increase the tire – runway friction and the
186 G. Mikułowski and Ł. Jankowski / Adaptive landing gear: Optimum control strategy and potential for improvement
0
1
2
3
4
5
6
7
0 50 100 150 200
forc
e [k
N]
time [ms]
total strut (PLG)pneumatic (PLG)
hydraulic (PLG)total strut (SLG)
pneumatic (SLG)hydraulic (SLG)
Fig. 12. Comparison of computed pneumatic, hydraulic and total strut forces in PLG and SLG for m = 350 kg and v0 = 1.5 m/s.
0
10
20
30
40
0 50 100 150 200
orifi
ce a
rea
[mm
2 ]
time [ms]
0
1
2
3
4
5
6
forc
e [k
N]
total strut (ALG)pneumatic (ALG)
hydraulic (ALG)
Fig. 13. Computed pneumatic, hydraulic and total strut forces in ALG, and active control for m = 350 kg and v0 = 1. 5 m/s.
spring-back effect. It would also require a substantial increase of the orifice area upper limit A o(max) to maintainthe constant force level in the subsequent 25 ms (see the first peak of the active control in Fig. 13). The plots of thestrut force versus strut deflection for the four considered control strategies are compared in Fig. 14.
4. Potential for improvement
4.1. Air spring influence
A typical landing scenario involves a low sinking velocity, see Fig. 15. However, the investigated control strategiesreveal improvements only for medium-to-high sinking velocities, see Figs 8, 9 and 10. This is due to the effectof the pre-stressed air spring and the lift force: to compress the strut further than the delimiting force acting rangeld = 0.5 mm, the strut force has to overcome the joint effect of the pneumatic and friction forces, which amounts to1983 N and is comparable to the peak force at v0 = 0 m/s, which was computed to be 1993 N – 2179 N, dependingon the mass. Therefore, at low sinking velocities the strut is being barely compressed and there is practically no

G. Mikułowski and Ł. Jankowski / Adaptive landing gear: Optimum control strategy and potential for improvement 187
Table 2Assumed cumulative occurrences of sinking velocities per 1000 landings
Sinking Cumulative Sinking Cumulativevelocity v0 [m/s] occurrences velocity v0 [m/s] occurrences
0.00 1000.0 1.54 63.00.15 994.6 1.70 33.80.31 925.6 1.85 17.70.46 811.3 2.00 9.70.62 669.6 2.16 4.70.77 518.8 2.31 2.50.93 380.2 2.47 1.61.08 260.3 2.62 1.01.23 172.9 2.78 0.61.39 108.4 2.93 0.3
PLGVD-SLG
SLGALG 0
1
2
3
4
5
6
7
0 10 20 30 40 50 60 70 80 90
forc
e [k
N]
strut deflection [mm]
Fig. 14. Strut force versus deflection in PLG, VD-SLG, SLG and ALG for m = 350 kg and v0 = 1. 5 m/s.
hydraulic force to be controlled. As a result no strategy based on hydraulic force control can yield improvementat low sinking velocities. This is, however, not necessary, since the static runway loading is considerably higherthan the landing peak force at low sinking velocities. This is due to the lift factor L = 0.667, which occurs inEq. (1) and disappears in static or taxiing conditions. Therefore, the (semi)-active control strategies can in fact beconsidered necessary only in the cases when the peak force in the PLG is significant, i.e. exceeds the static loading,FPLG
peak (m, v0) > mg. This occurs at higher sinking velocities only; the limiting velocity ranges from 0.54 m/s to0.85 m/s, depending on the landing mass m.
4.2. Mean and median peak strut force
Figures 8 to 11 compare the performance of the discussed LG types for each design landing condition separately.An overall comparison is possible by statistical means if the probability distributions of landing conditions aredefined. The initial sinking velocity v0 and the total mass m are assumed to be independent. To ease the statisticalcomputations, their ranges Eq. (2) have been discretized into 20 equally spaced values. The distribution of thelanding mass has been assumed to be uniform in the whole range of 288 kg–422 kg. The assumed discretizeddistribution of the initial sinking velocity v0 is listed in Table 2 (cumulative occurrences) and illustrated in Fig. 15(occurrences).
Table 3 compares the performances of the four LG types in terms of the expected and median peak strut forces.Two cases have been considered, unconditional and conditional:
1. All landing conditions have been taken into accounts, unconditional E [F peak] and median [Fpeak] have beencomputed for the four control strategies considered.

188 G. Mikułowski and Ł. Jankowski / Adaptive landing gear: Optimum control strategy and potential for improvement
Table 3Performance of four LG control strategies, a statistical comparison.Case 1: Unconditional values (all landing scenarios); Case 2: Con-ditional values (landings with the PLG peak strut force exceeding thestatic load
Peak strut force Relative improvementLG type Expected Median Expected Median
value [kN] value [kN] value [%] value [%]
Case 1: Unconditional (all landing scenarios)PLG 3.890 3.527 — —VD-SLG 3.618 3.284 7.0 6.9SLG 3.386 2.992 12.9 15.2ALG 3.331 2.959 14.4 16.1
Case 2: Conditional (FPLGpeak > mg)
PLG 4.962 4.613 – –VD-SLG 4.565 4.232 8.0 8.3SLG 4.202 3.878 15.3 15.9ALG 4.106 3.790 17.2 17.8
0
20
40
60
80
100
120
140
160
0 0.5 1 1.5 2 2.5 3
occu
renc
es p
er 1
000
land
ings
sinking velocity v0 [m/s]
Fig. 15. Assumed occurrences of sinking velocities per 1000 landings.
2. Only landings with the PLG peak strut force exceeding the static load have been taken into account. Thiscase reports on the statistical reduction of significant peaks and leads to conditional probability distributions,expected values and medians
E[Fpeak | FPLG
peak > mg], median
[Fpeak | FPLG
peak > mg].
4.3. Safe sinking velocity range
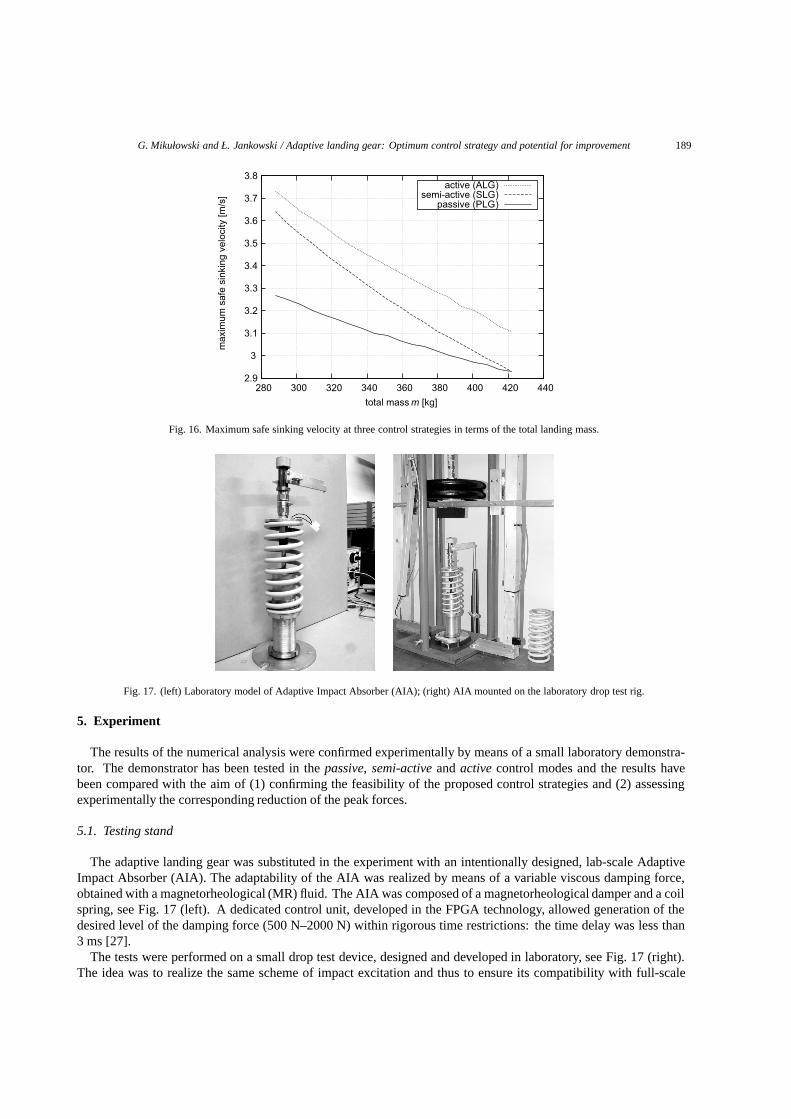
The described control strategies decrease the peak strut force, hence allow the sinking velocity range to be extendedeven beyond v0(max) = 2.93 m/s without exceeding the peak strut force limit Fmax. Figure 16 compares, in termsof the landing mass m at three control strategies (PLG, SLG, ALG), the maximum safe sinking velocities v, whichare defined by an implicit relation Fpeak(v, m) = Fmax. The velocity-driven semi-active strategy (VD-SLG) hasbeen skipped, since it assumes no information about the landing mass m and is hence bound by v 0(max) = 2.93 m/s,which occurs at mmax.
G. Mikułowski and Ł. Jankowski / Adaptive landing gear: Optimum control strategy and potential for improvement 189
2.9
3
3.1
3.2
3.3
3.4
3.5
3.6
3.7
3.8
280 300 320 340 360 380 400 420 440
max
imum
saf
e si
nkin
g ve
loci
ty [m
/s]
total mass m [kg]
passive (PLG)semi-active (SLG)
active (ALG)
Fig. 16. Maximum safe sinking velocity at three control strategies in terms of the total landing mass.
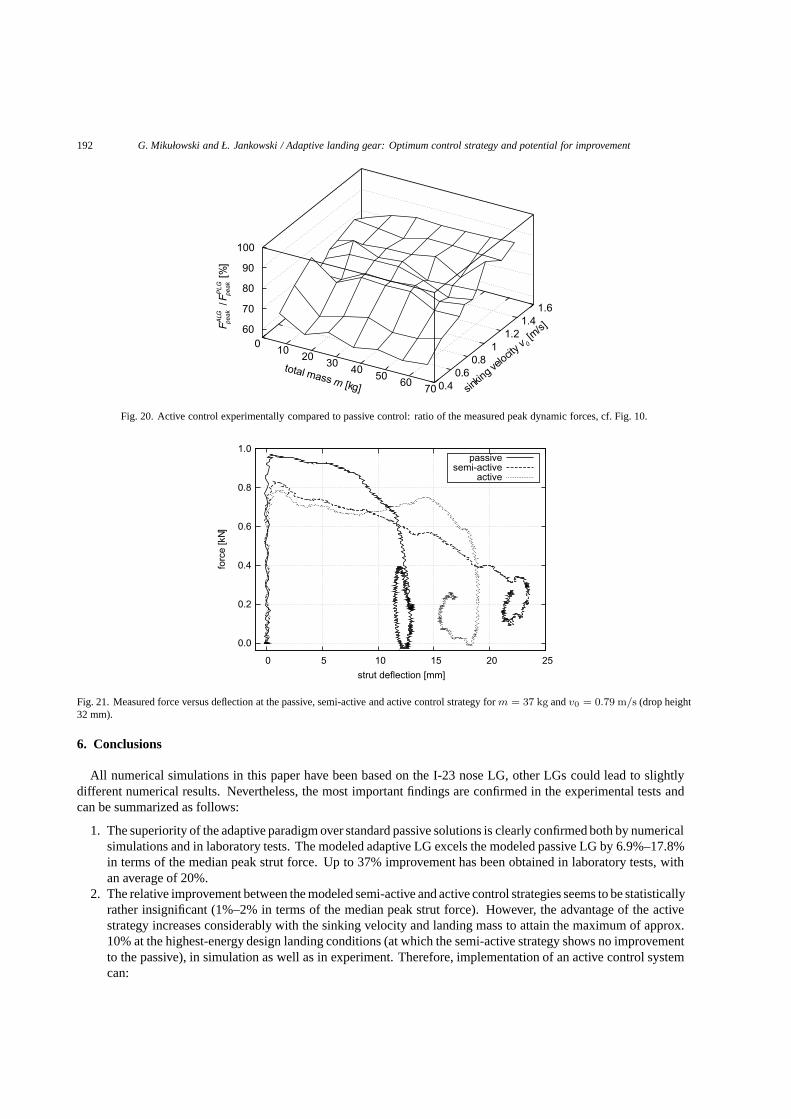
Fig. 17. (left) Laboratory model of Adaptive Impact Absorber (AIA); (right) AIA mounted on the laboratory drop test rig.
5. Experiment
The results of the numerical analysis were confirmed experimentally by means of a small laboratory demonstra-tor. The demonstrator has been tested in the passive, semi-active and active control modes and the results havebeen compared with the aim of (1) confirming the feasibility of the proposed control strategies and (2) assessingexperimentally the corresponding reduction of the peak forces.
5.1. Testing stand
The adaptive landing gear was substituted in the experiment with an intentionally designed, lab-scale AdaptiveImpact Absorber (AIA). The adaptability of the AIA was realized by means of a variable viscous damping force,obtained with a magnetorheological (MR) fluid. The AIA was composed of a magnetorheological damper and a coilspring, see Fig. 17 (left). A dedicated control unit, developed in the FPGA technology, allowed generation of thedesired level of the damping force (500 N–2000 N) within rigorous time restrictions: the time delay was less than3 ms [27].
The tests were performed on a small drop test device, designed and developed in laboratory, see Fig. 17 (right).The idea was to realize the same scheme of impact excitation and thus to ensure its compatibility with full-scale

190 G. Mikułowski and Ł. Jankowski / Adaptive landing gear: Optimum control strategy and potential for improvement
Table 4Kinetic energies used in tests
Kinetic Sinking velocity [m/s]energy [J] 1.46 1.30 1.10 1.00 0.95 0.85 0.79 0.58 0.40
67 71.41 56.62 40.54 33.50 30.23 24.20 20.91 11.27 5.3657 60.75 48.17 34.49 28.50 25.72 20.59 17.79 9.59 4.56
Mass 47 50.09 39.72 28.44 23.50 21.21 16.98 14.67 7.91 3.76[kg] 37 39.43 31.27 22.39 18.50 16.70 13.37 11.55 6.22 2.96
27 28.78 22.82 16.34 13.50 12.18 9.75 8.43 4.54 2.1617 18.12 14.37 10.29 8.50 7.67 6.14 5.30 2.86 1.367 7.46 5.92 4.24 3.50 3.16 2.53 2.18 1.18 0.56
Fig. 18. Comparison of schemes of testing stands: (Left) lab-scale; (right) full-scale.
testing stands dedicated to testing of landing gears. Full-scale testing stands fix the landing gears under a drop mass,which simulates a respective part of the weight of an aircraft. The test procedures include free falling drops fromvarious heights to simulate different sinking velocities. In order to make the laboratory landing conditions moreclose to reality, struts are usually tested with variable circumferential speed of the wheel and, in the case of mainlanding gears, with various attitude angles (up to 15 degrees). Moreover, full-scale testing stands are equipped witha simulator of the lift force, which is able to generate the wing lift contribution to the landing process. For thepurpose of the small, lab-scale experiment, the testing procedure was simplified in the following points:
1. The tests were conducted only in the vertical position of the adaptive impact absorber;2. The tire of the landing gear was substituted by a bumper made of solid rubber;3. The absorbing element was not mounted to the free falling mass but fixed in the vertical position on the
foundation plate;4. The lift force was not simulated.
Due to the simplifications, the friction forces generated on the sliding surfaces of the damper were much lowercompared to real-world landing gear. The rubber element had relatively stiffer characteristic in comparison to thecharacteristic of a pneumatic tire. Neglecting of the lift force had an influence on the inertial balance of the system.However, from the mechanical point of view, both systems are analogous (Fig. 18) and the time limitations for thecontrol and actuation systems are the same.
The test program consisted of 567 drop tests. The procedure included drop tests in 63 cases of impact energy(0.6 J–70 J), which are listed in Table 4. In each case, the drops were conducted for three tested modes of operationand repeated three times to guarantee the proper repeatability.
5.2. Control strategies
To test the passive control strategy, the AIA was assumed to behave as a conventional, passive landing gear,and optimized to operate properly under the maximum considered impact energy. A constant level of the control

G. Mikułowski and Ł. Jankowski / Adaptive landing gear: Optimum control strategy and potential for improvement 191
total mass m [kg] sinkin
g velocit
y v 0 [m
/s]FS
LGpe
ak /
Fpe
akP
LG [
%]
0 10
20 30
40 50
60 70 0.4
0.6 0.8
1 1.2
1.4 1.6
60
70
80
90
100
Fig. 19. Semi-active control experimentally compared to passive control: ratio of the measured peak dynamic forces, cf. Fig. 8.
signal was determined, which allowed the peak dynamic force to be minimized without reaching the full pistonstroke. Further on, the tests were conducted for the full range of the impact energies with the determined level of thedamping characteristics. The peak dynamic force was measured and stored to serve as a reference for assessment ofthe effectiveness of the proposed adaptive control strategies.
In the semi-active mode, the constant damping control signal was adjusted separately in each particular case ofthe impact, in dependence on its kinetic energy. The semi-activity of the system was thus defined as using an openloop control only. The control procedure consisted of: (1) determination of the sinking velocity and the mass ofthe falling object and (2) generation of the corresponding optimum level of the control signal and the adaptationof the system. Figure 19 depicts the relative value of the measured peak dynamic force at the semi-active strategyin comparison to the peak force at the passive strategy and the same impact energy. The results are similar to thenumerical results depicted in Fig. 8, the difference is due to the lift force present in the numerical computations andneglected in the experiment, which effectively decreases the weight of the drop mass but does not affect its inertialbehavior (mass). The improvement is most significant at small impact velocities. An overall peak force reduction isapprox. 20%.
The active control strategy was realized in a closed loop control with the vertical acceleration of the structureas the feedback signal [27,36]. The control sequence consisted of: (1) recognition of the energy of the impact;(2) initial adaptation of the system; (3) execution of the feedback control strategy. The recognition of the impactenergy was realized within 2 ms before the impact moment. To measure the sinking velocity a photo sensor wasused, while the drop mass was assumed to be known. The objective of the closed loop control strategy was to adhereto a predefined value of the deceleration of the structure, which was determined in accordance to the recognizedimpact energy. Figure 20 depicts the relative value of the measured peak dynamic force in comparison to the peakforce at the passive strategy and the same impact energy. The approximate gain with respect to the semi-activestrategy (Fig. 19) is on the level of 5%. The relative improvement increases with the impact energy, which is similarto the numerical results, see Fig. 10.
5.3. Example measurements
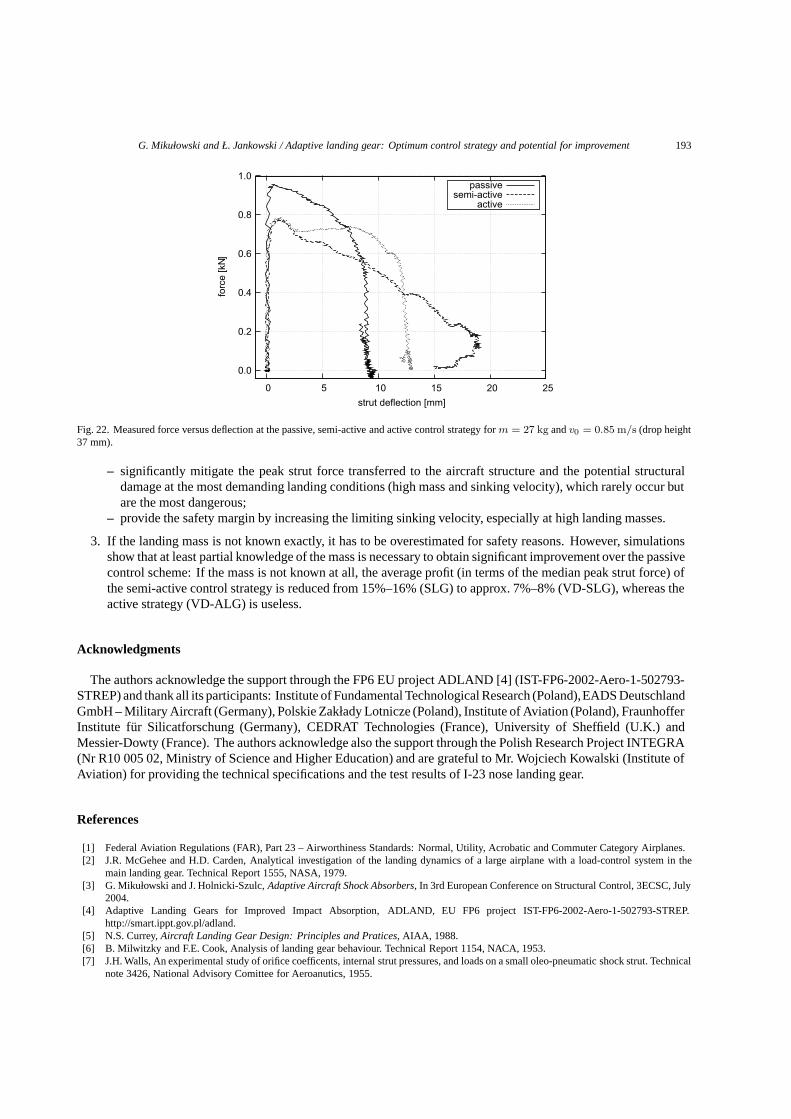
Figures 21 and 22 compare the plots of measured force FS versus strut deflection s, which clearly illustratethe effects of the tested control strategies. The advantage of the semi-active and active modes over the passive isclear in both cases: the peak dynamic force has been considerably reduced. The advantage of the active strategyover the semi-active is much less pronounced. However, the active strategy, besides decreasing the peak dynamicforce, which was the objective here, also significantly decreased the maximum piston strokes needed to complete thedissipation process. With the active strategy the energy is thus dissipated on a shorter distance. The displacementsof the pistons were reduced by 15% on average, which significantly enlarges the energy dissipation potential of theAIA.
192 G. Mikułowski and Ł. Jankowski / Adaptive landing gear: Optimum control strategy and potential for improvement
total mass m [kg] sinkin
g velocit
y v 0 [m
/s]FA
LGpe
ak /
Fpe
akP
LG [
%]
0 10
20 30
40 50
60 70 0.4
0.6 0.8
1 1.2
1.4 1.6
60
70
80
90
100
Fig. 20. Active control experimentally compared to passive control: ratio of the measured peak dynamic forces, cf. Fig. 10.
passivesemi-active
active
0.0
0.2
0.4
0.6
0.8
1.0
0 5 10 15 20 25
forc
e [k
N]
strut deflection [mm]
Fig. 21. Measured force versus deflection at the passive, semi-active and active control strategy for m = 37 kg and v0 = 0. 79 m /s (drop height32 mm).
6. Conclusions
All numerical simulations in this paper have been based on the I-23 nose LG, other LGs could lead to slightlydifferent numerical results. Nevertheless, the most important findings are confirmed in the experimental tests andcan be summarized as follows:
1. The superiority of the adaptive paradigm over standard passive solutions is clearly confirmed both by numericalsimulations and in laboratory tests. The modeled adaptive LG excels the modeled passive LG by 6.9%–17.8%in terms of the median peak strut force. Up to 37% improvement has been obtained in laboratory tests, withan average of 20%.
2. The relative improvement between the modeled semi-active and active control strategies seems to be statisticallyrather insignificant (1%–2% in terms of the median peak strut force). However, the advantage of the activestrategy increases considerably with the sinking velocity and landing mass to attain the maximum of approx.10% at the highest-energy design landing conditions (at which the semi-active strategy shows no improvementto the passive), in simulation as well as in experiment. Therefore, implementation of an active control systemcan:
G. Mikułowski and Ł. Jankowski / Adaptive landing gear: Optimum control strategy and potential for improvement 193
passivesemi-active
active
0.0
0.2
0.4
0.6
0.8
1.0
0 5 10 15 20 25
forc
e [k
N]
strut deflection [mm]
Fig. 22. Measured force versus deflection at the passive, semi-active and active control strategy for m = 27 kg and v0 = 0. 85 m /s (drop height37 mm).
– significantly mitigate the peak strut force transferred to the aircraft structure and the potential structuraldamage at the most demanding landing conditions (high mass and sinking velocity), which rarely occur butare the most dangerous;
– provide the safety margin by increasing the limiting sinking velocity, especially at high landing masses.
3. If the landing mass is not known exactly, it has to be overestimated for safety reasons. However, simulationsshow that at least partial knowledge of the mass is necessary to obtain significant improvement over the passivecontrol scheme: If the mass is not known at all, the average profit (in terms of the median peak strut force) ofthe semi-active control strategy is reduced from 15%–16% (SLG) to approx. 7%–8% (VD-SLG), whereas theactive strategy (VD-ALG) is useless.
Acknowledgments
The authors acknowledge the support through the FP6 EU project ADLAND [4] (IST-FP6-2002-Aero-1-502793-STREP) and thank all its participants: Institute of Fundamental Technological Research (Poland),EADS DeutschlandGmbH – Military Aircraft (Germany), Polskie Zakłady Lotnicze (Poland), Institute of Aviation (Poland), FraunhofferInstitute fur Silicatforschung (Germany), CEDRAT Technologies (France), University of Sheffield (U.K.) andMessier-Dowty (France). The authors acknowledge also the support through the Polish Research Project INTEGRA(Nr R10 005 02, Ministry of Science and Higher Education) and are grateful to Mr. Wojciech Kowalski (Institute ofAviation) for providing the technical specifications and the test results of I-23 nose landing gear.
References
[1] Federal Aviation Regulations (FAR), Part 23 – Airworthiness Standards: Normal, Utility, Acrobatic and Commuter Category Airplanes.[2] J.R. McGehee and H.D. Carden, Analytical investigation of the landing dynamics of a large airplane with a load-control system in the
main landing gear. Technical Report 1555, NASA, 1979.[3] G. Mikułowski and J. Holnicki-Szulc, Adaptive Aircraft Shock Absorbers, In 3rd European Conference on Structural Control, 3ECSC, July
2004.[4] Adaptive Landing Gears for Improved Impact Absorption, ADLAND, EU FP6 project IST-FP6-2002-Aero-1-502793-STREP.
http://smart.ippt.gov.pl/adland.[5] N.S. Currey, Aircraft Landing Gear Design: Principles and Pratices, AIAA, 1988.[6] B. Milwitzky and F.E. Cook, Analysis of landing gear behaviour. Technical Report 1154, NACA, 1953.[7] J.H. Walls, An experimental study of orifice coefficents, internal strut pressures, and loads on a small oleo-pneumatic shock strut. Technical
note 3426, National Advisory Comittee for Aeroanutics, 1955.

194 G. Mikułowski and Ł. Jankowski / Adaptive landing gear: Optimum control strategy and potential for improvement
[8] A.W. Hall, R.H. Sawyer and J.M. McKay, Study of groud-reaction forces measured during landing impacts of a large airplane. Technicalnote 4247, National Advisory Committee for Aeronautics, May 1958.
[9] W. Flugge, Landing-gear impact Technical note 2743, National Advisory Committee for Aeronautics, October 1952.[10] J.E. Wignot, P.C. Durup and M.A. Gamon, Design Formulation and Analysis of an Active Landing Gear, AFFDL-TR-71-80 Vol. I, U.S.
Air Force, 1971.[11] E.K. Bender, E.F. Berkman and M. Bieber, A Feasibility Study of Active Landing Gear, AFFDL-TR-70-126, U.S. Air Force, 1971.[12] J.R. McGehee and H.D. Carden, A mathematical model of an active control landing gear for load control during impact and roll-out.
Technical Note NASA TN D-8080, NASA Langley Research Center, February 1976.[13] I. Ross, Flightworthy active control landing gear system for a supersonic aircraft. Technical report, Hydraulic Research Textron, 1980.[14] I. Ross and R. Edson, An electronic control for an electrohydraulic active control landing gear for the F-4 aircraft. Technical report,
Hydraulic Research Textron, Inc, 1982.[15] J.R. McGehee and R.C. Dreher, Experimental Investigation of Active Loads Control for Aircraft Landing Gear, NASA Technical Paper
2042, Langley Research Centre, 1982.[16] J.R. McGehee and D.L. Morris, Active Control Landing Gear for Ground Load Alleviation, In AGARD Conf. Proc. 384, FMP Symposium,
1984. Toronto.[17] W.E. Howell, J.R. McGehee, R.H. Daaugherty and W.A. Vogler, F-106b airplane active control landing gear drop test performance. NASA
Technical Memorandum 102741, Langley Research Centre, November 1990.[18] L.G. Horta, R.H. Daugherty and V.J. Martinson, Modeling and validation of a Navy A6-Intruder actively controlled landing gear system.
Technical Report TP-1999-209124, NASA, 1999.[19] L.G. Horta, R.H. Daugherty and V.J. Martinson, Actively controlled landing gear for aircraft vibration reduction. Tecnical Paper NASA-
99-ceas-lgh, NASA, 1999.[20] R. Freymann, Actively damped landing gear system. In AGARD CP-484 Ref. 20, Proc. of the 71st Meeting of the AGARD Structures and
Materials Panel, October 1990.[21] Z. Lou, R.D. Ervin, C.B. Winkler and F.E. Filisko, An Electrorheologically Controlled Semi-Active Landing Gear, SAE paper 931403,
Langley Research Centre, January 1993.[22] H. Wentscher, W. Kortum and W.R. Kruger, Fuselage Vibration Control using Semi-Active Front Gear, In Proceedings of the 81st meeting
of the AGARD SMP Panel on "The design, Qualification and Maintenance of Vibration-Free Landing Gears", 1995.[23] X. Wang and U. Carl, Fuzzy Control of Aircraft Semi-Active Landing Gear System, In Proc. of the 37th AIAA Aerospace Sciences Meeting
and Exhibit, January 1999.[24] W. Kruger, Integrated Design Process for the Development of Semi-Active Landing Gears for Transport Aircraft, PhD thesis, University
of Stuttgart, December 2000.[25] G.L. Ghiringhelli, Testing of semiactive landing gear control for a general aviation aircraft, AIAA Journal of Aircraft 37(4) (2000), 606–616.[26] G.L. Ghiringhelli and S. Gualdi, Evaluation of a landing gear semi-active control system for complete aircraft landing, Aerotecnica Missili
e Spazio 83 (January 2004), 21–31.[27] G. Mikułowski and J. Holnicki-Szulc, Adaptive landing gear concept – feedback control validation, Smart Materials and Structures 16(6)
(2007), 2146–2158.[28] D.C. Batterbee, N.D. Sims, R. Staway and Z. Wołejsza, Magnetorheological landing gear: 1. a design methodology, Smart Materials and
Structures 16 (2007), 2429–2440.[29] D.C. Batterbee, N.D. Sims, R. Staway and M. Rennison, Magnetorheological landing gear: 2. validation using experimental data, Smart
Materials and Structures 16 (2007), 2441–2452.[30] D.P. Raymer, Aircraft Design: A Conceptual Approach, AIAA education series, 1989.[31] S.T. Chai and W.H. Mason. Landing gear integration in aircraft conceptual design. Technical Report MAD 96-09-01, MAD Center, 1996.[32] I-23 technical specification. Institute of Aviation, Warsaw, Poland.[33] K. Sekuła and J. Holnicki-Szulc, On-line impact load identification. submitted to International Journal of Impact Engineering, 2008.[34] J. Holnicki-Szulc, G. Mikułowski, J. Motylewski, P. Pawłowski and Z. Wołejsza, Adaptive system for energy dissipation in landing gears (in
Polish: Adaptacyjny system dyssypacji energii w podwoziu lotniczym). XXXIV Polish Symposium on Machine Diagnostics, WegierskaGorka, March 2007.
[35] D. Batterbee, N.D. Sims and R. Stanway, ADLAND report: Annex USFD-1(a): Oleopneumatic shock absorber modelling and initial MRdevice sizing. Technical report, University of Sheffield, 2004.
[36] G. Mikułowski and J. Holnicki-Szulc, Fast controller and control algorithms for MR based adaptive impact absorbers – force based control,Machine Dynamics Problems 30(2) (2006), 113–122.

International Journal of
AerospaceEngineeringHindawi Publishing Corporationhttp://www.hindawi.com Volume 2010
RoboticsJournal of
Hindawi Publishing Corporationhttp://www.hindawi.com Volume 2014
Hindawi Publishing Corporationhttp://www.hindawi.com Volume 2014
Active and Passive Electronic Components
Control Scienceand Engineering
Journal of
Hindawi Publishing Corporationhttp://www.hindawi.com Volume 2014
International Journal of
RotatingMachinery
Hindawi Publishing Corporationhttp://www.hindawi.com Volume 2014
Hindawi Publishing Corporation http://www.hindawi.com
Journal ofEngineeringVolume 2014
Submit your manuscripts athttp://www.hindawi.com
VLSI Design
Hindawi Publishing Corporationhttp://www.hindawi.com Volume 2014
Hindawi Publishing Corporationhttp://www.hindawi.com Volume 2014
Shock and Vibration
Hindawi Publishing Corporationhttp://www.hindawi.com Volume 2014
Civil EngineeringAdvances in
Acoustics and VibrationAdvances in
Hindawi Publishing Corporationhttp://www.hindawi.com Volume 2014
Hindawi Publishing Corporationhttp://www.hindawi.com Volume 2014
Electrical and Computer Engineering
Journal of
Advances inOptoElectronics
Hindawi Publishing Corporation http://www.hindawi.com
Volume 2014
The Scientific World JournalHindawi Publishing Corporation http://www.hindawi.com Volume 2014
SensorsJournal of
Hindawi Publishing Corporationhttp://www.hindawi.com Volume 2014
Modelling & Simulation in EngineeringHindawi Publishing Corporation http://www.hindawi.com Volume 2014
Hindawi Publishing Corporationhttp://www.hindawi.com Volume 2014
Chemical EngineeringInternational Journal of Antennas and
Propagation
International Journal of
Hindawi Publishing Corporationhttp://www.hindawi.com Volume 2014
Hindawi Publishing Corporationhttp://www.hindawi.com Volume 2014
Navigation and Observation
International Journal of
Hindawi Publishing Corporationhttp://www.hindawi.com Volume 2014
DistributedSensor Networks
International Journal of