Adaptive Designs in Clinical Development - …files.massbio.org/file/BSDMCT-11092016.pdf ·...
93
Adaptive Designs in Clinical Development: An introduction to methods and utility Wednesday November 9, 2016
Transcript of Adaptive Designs in Clinical Development - …files.massbio.org/file/BSDMCT-11092016.pdf ·...
Adaptive Designs in Clinical Development: An introduction to methods and utility
Wednesday November 9, 2016
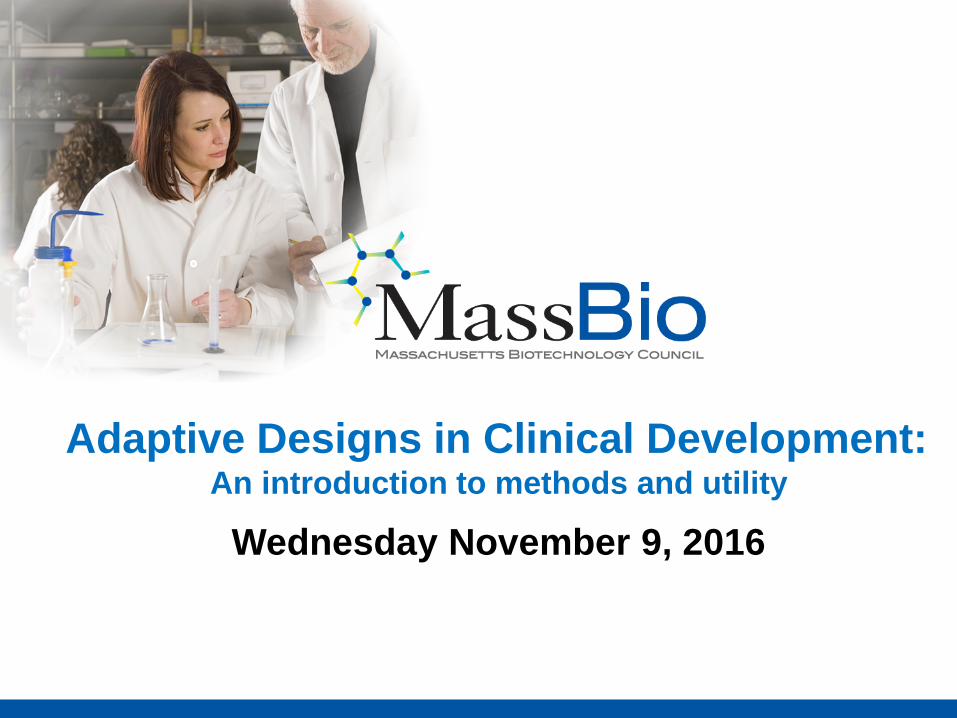
Adaptive Designs in Clinical Development: An introduction to methods and utility
Speakers: • Stella Sergiopolous, MS, MPH, Research Fellow, Tufts
Center for the Study of Drug Development • Mark Chang, PhD, Senior Vice President, Veristat LLC • Cyrus Mehta, PhD, President, Cytel • Deepak L. Bhatt, MD, MPH, Executive Director of
Interventional Cardiovascular Programs, Brigham & Women’s Hospital; Professor, Harvard Medical School
• Yi Liu, PhD, Senior Manager, Takeda Pharmaceuticals International Co.
Moderator: • John Balser, PhD, Co-founder and President, Veristat LLC
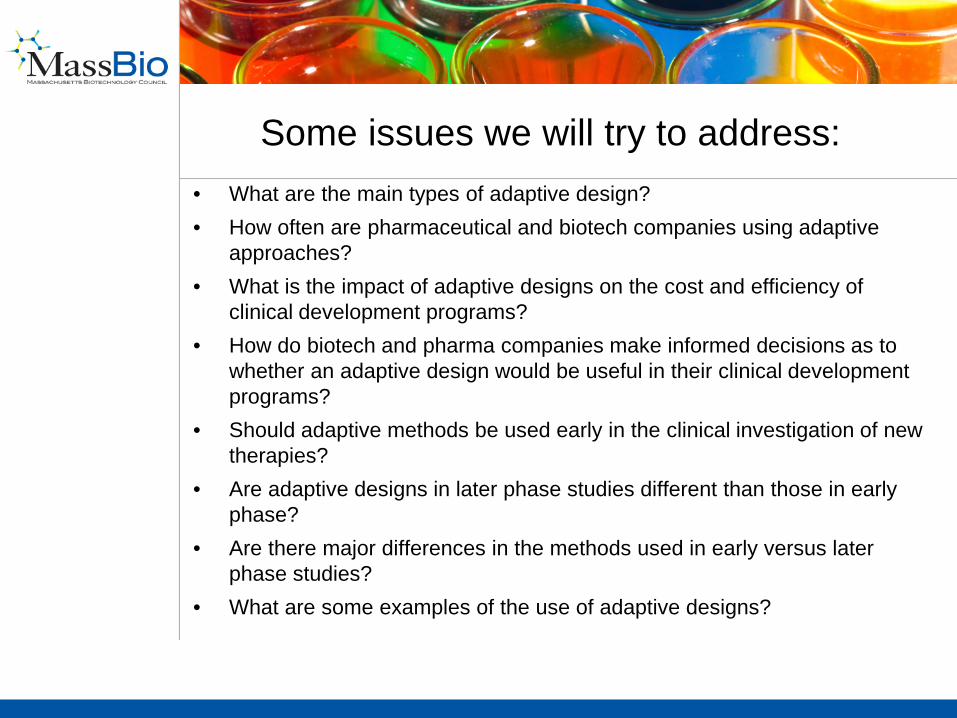
Some issues we will try to address:
• What are the main types of adaptive design? • How often are pharmaceutical and biotech companies using adaptive
approaches? • What is the impact of adaptive designs on the cost and efficiency of
clinical development programs? • How do biotech and pharma companies make informed decisions as to
whether an adaptive design would be useful in their clinical development programs?
• Should adaptive methods be used early in the clinical investigation of new therapies?
• Are adaptive designs in later phase studies different than those in early phase?
• Are there major differences in the methods used in early versus later phase studies?
• What are some examples of the use of adaptive designs?
A Landscape Analysis of Adaptive Trial Design
Stella Stergiopoulos Research Fellow
Tufts Center for the Study of Drug Development (Tufts CSDD)
Mass Bio Talk; November 9, 2016
Agenda • About Tufts CSDD
• Defining Adaptive Trial Design (ATD)
• Regulatory Environment
• Estimated Prevalence
• Value Proposition
5
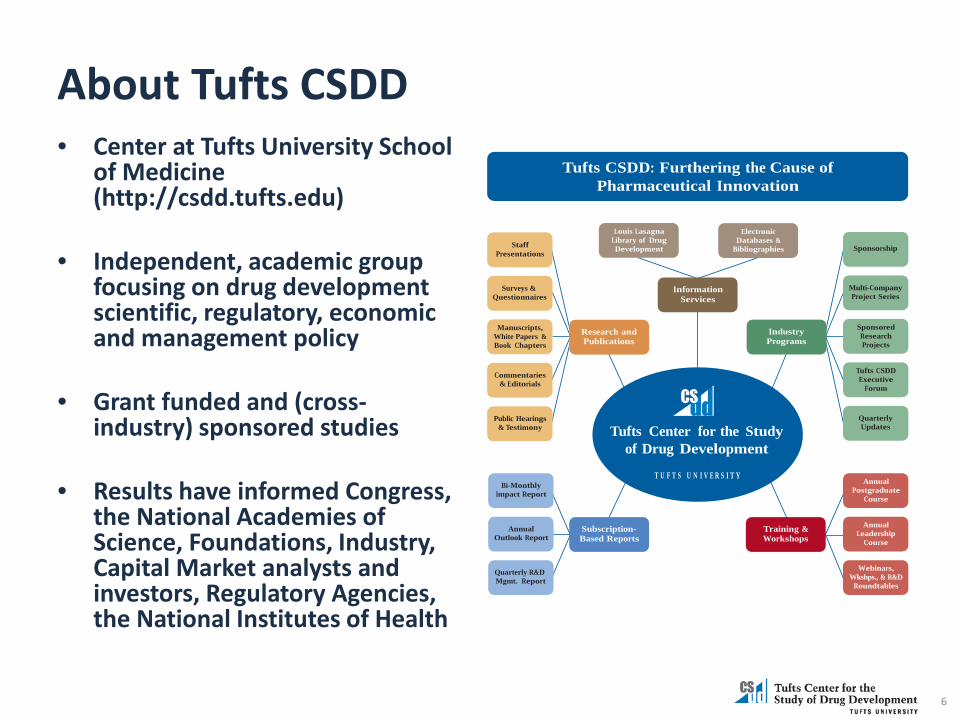
About Tufts CSDD • Center at Tufts University School
of Medicine (http://csdd.tufts.edu)
• Independent, academic group focusing on drug development scientific, regulatory, economic and management policy
• Grant funded and (cross-industry) sponsored studies
• Results have informed Congress, the National Academies of Science, Foundations, Industry, Capital Market analysts and investors, Regulatory Agencies, the National Institutes of Health
6
Tufts CSDD: Furthering the Cause of Pharmaceutical Innovation
Staff Presentations
Louis Lasagna Library of Drug Development
Electronic Databases &
Bibliographies
Sponsorship
Surveys & Questionnaires
Information Services
Multi-Company Project Series
Manuscripts, White Papers & Book Chapters
Research and Publications
Industry Programs
Sponsored Research Projects
Commentaries & Editorials
Tufts CSDD Executive
Forum
Public Hearings & Testimony
Tufts Center for the Study of Drug Development
Quarterly Updates
Bi-Monthly Impact Report
T U F T S U N I V E R S I T Y Annual
Postgraduate Course
Annual Outlook Report
Subscription- Based Reports
Training & Workshops
Annual Leadership
Course
Quarterly R&D Mgmt. Report
Webinars, Wkshps., & R&D
Roundtables
TCSDD Select Publications on Protocol Design • Lamberti M, Zuckerman R, Howe D, Shapiro L, Getz K. Factors influencing investigative site
willingness and ability to participate in clinical trials. Drug Information Journal. 2011;45(3):377-390. • Lamberti MJ, Mathias A, Myles J, Howe D, and Getz K. Evaluating the Impact of Patient Recruitment
and Retention Practices. Drug Information Journal. 2012; 46(5), 573-580. • Getz KA, Kim J, Stergiopoulos S, Kaitin KI. New governance mechanisms to optimize protocol design.
TIRS. 2013;47(6):651-655. • Lamberti MJ, Stergiopoulos S, Naik P, Getz KA. White paper: Industry Usage of Social and Digital
Media Communities in Clinical Research. Boston: Tufts Center for the Study of Drug Development. June 2014. http://csdd.tufts.edu/files/uploads/TCSDD_Social_Media_Final.pdf
• Getz KA, Kim J, Stergiopoulos S, Birch P. Flexible, global, more adaptive: clinical trials 2.0. Scrip100: 2014. 2013:38-39.
• Stergiopoulos S, Getz KA. Social listening to enhance clinical research. Global Forum. 2014;6(5):17-20.
• Getz K, Birch P, Stergiopoulos S. Adaptive trial design: prepping for adoption. Pharmaceutical Executive. 2014;34(6):48.
• Stergiopoulos S, Eustace C, Stem K, Getz K. Mobile nurse services in clinical trials: usage and industry perceptions Therapeutic Innovation & Regulatory Science; Published online before print January 27, 2016. 2016.
• Harker M, Dimasi J, Getz K, CTTI Patient Groups and Clinical Trials: Building the Value Model. DIA 2015 presentation.
• Lincoln E, Lamberti MJ, Measuring Return on Engagement: An Interim Report on the DIA-Tufts CSDD Metrics Study. DIA 2016 presentation.
7
The Decade of Optimized Protocol Design: 2011 - 2020 • Current R&D paradigm and global market conditions demand
transformative solutions
• Deep pocket, solely science-driven R&D no longer an option
• Must overcome fear of changing legacy processes
• Alignment with regulatory agency interest in supporting achievement of better quality and efficiency
• Primary optimization opportunities include: – Traditional protocol design optimization (out of scope today) – Adaptive trial design
8
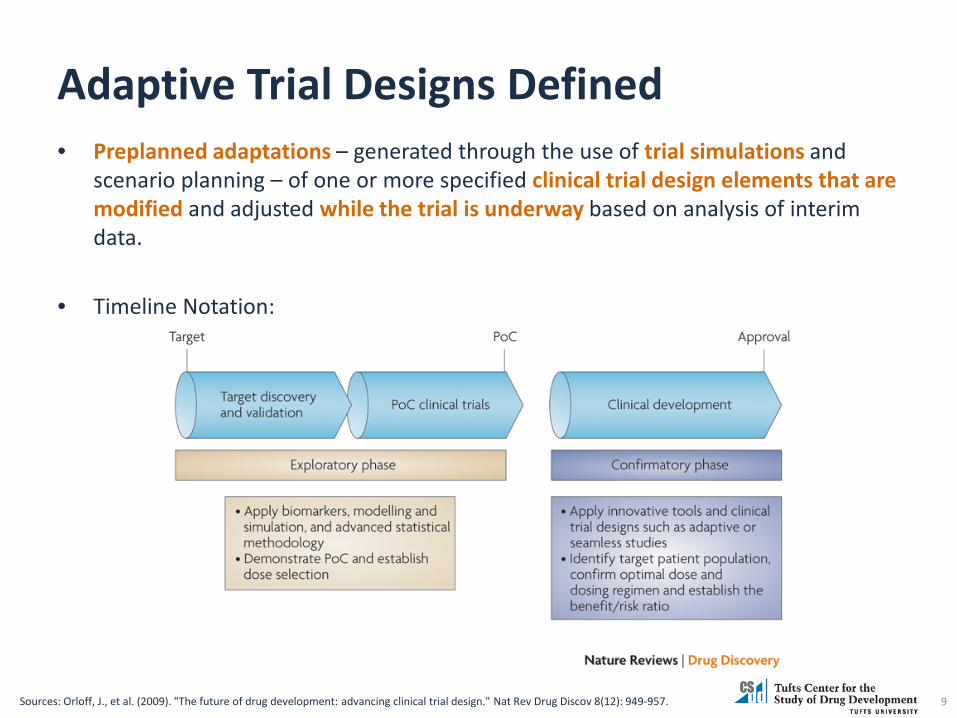
Adaptive Trial Designs Defined • Preplanned adaptations – generated through the use of trial simulations and
scenario planning – of one or more specified clinical trial design elements that are modified and adjusted while the trial is underway based on analysis of interim data.
• Timeline Notation:
9 Sources: Orloff, J., et al. (2009). "The future of drug development: advancing clinical trial design." Nat Rev Drug Discov 8(12): 949-957.

Main Types of Adaptive Trial Designs
10
Design Definition
Stopping Trial Early Stopping clinical trial early on boundary crossing: Superiority, Futility, and/or Harm
Sample Size Re-Estimation
Increasing or decreasing the sample size at an interim point in the trial. Used when unclear on between-subject variance (blinded data or unblinded) a clinically meaningful effect size at which to power the trial (unblinded data).
Seamless Trials
Combining in one trial objectives that are typically in separate trials; i.e., learn (dose selection) and confirm (efficacy). Can either use data from final stage (operationally seamless) or combine from both phases for final analysis (inferentially seamless)
Dose-Ranging
Allowing for dynamic allocation of patients and possibly variable number of dose levels based on accumulating information
Sources: (1) Orloff, J., et al. (2009). "The future of drug development: advancing clinical trial design." Nat Rev Drug Discov 8(12): 949-957. (2) Krams, M. L. et al (2006). “Adaptive Clinical Trials” PhRMA Adaptive Design Working Group. FDA/Industry Workshop. ww2.amstat.org/meetings/fdaworkshop/.../phrma_adapt_fda_sept27_09122006.ppt (3) Bhatt, D. L. and C. Mehta (2016). "Adaptive Designs for Clinical Trials." New England Journal of Medicine 375(1): 65-74. (4) Bretz F. (2007). “Adaptive Dose Ranging Studies”. ROeS. http://citeseerx.ist.psu.edu/viewdoc/download?doi=10.1.1.184.9513&rep=rep1&type=pdf
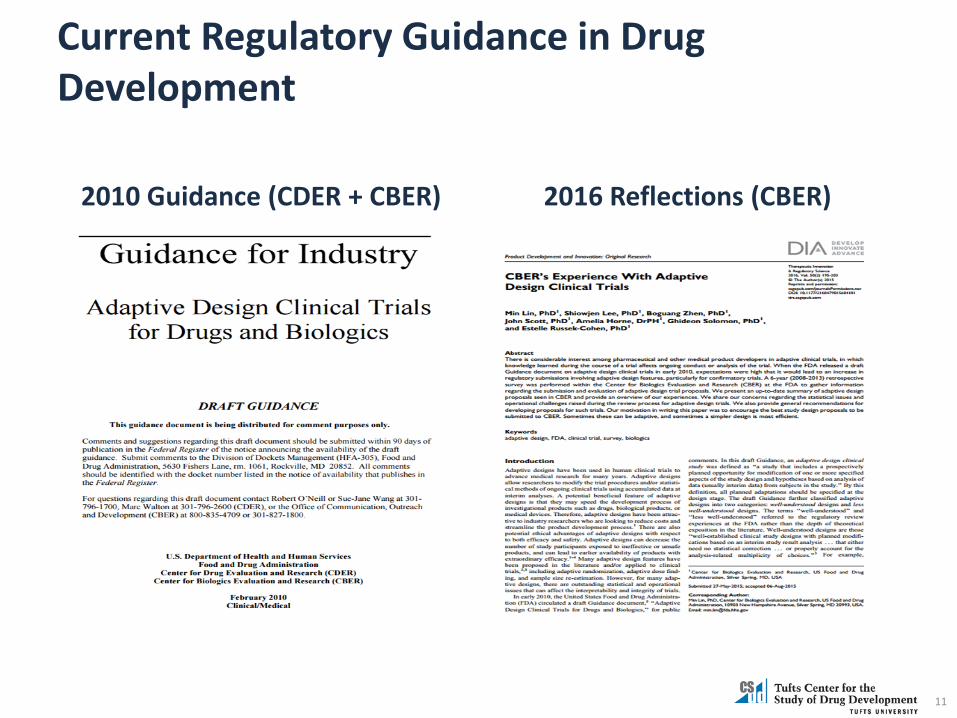
Current Regulatory Guidance in Drug Development
2010 Guidance (CDER + CBER) 2016 Reflections (CBER)
11
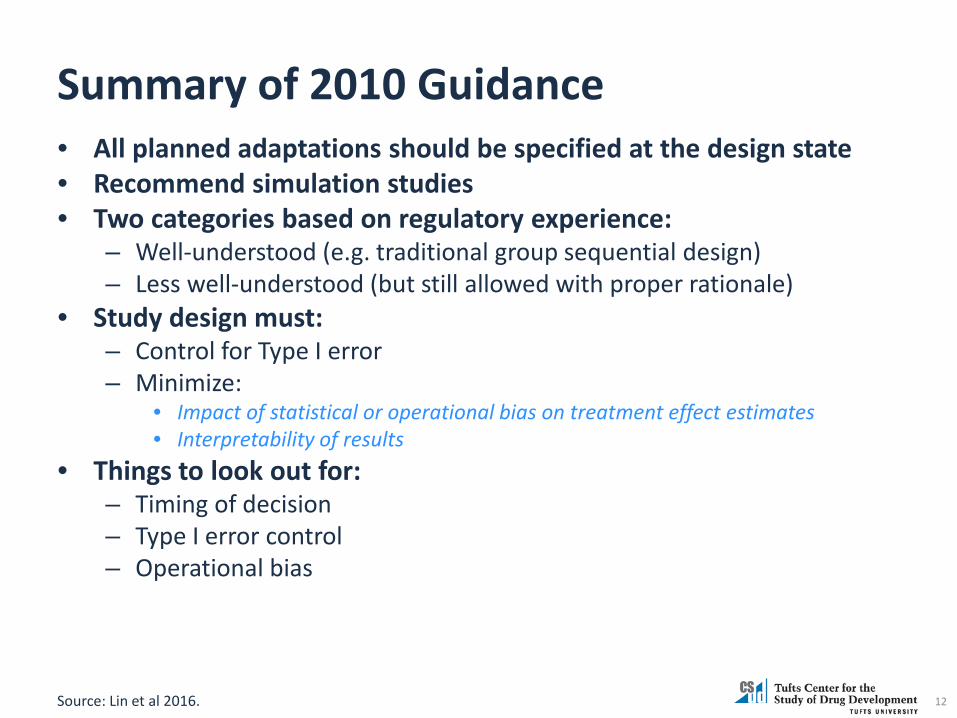
Summary of 2010 Guidance • All planned adaptations should be specified at the design state • Recommend simulation studies • Two categories based on regulatory experience:
– Well-understood (e.g. traditional group sequential design) – Less well-understood (but still allowed with proper rationale)
• Study design must: – Control for Type I error – Minimize:
• Impact of statistical or operational bias on treatment effect estimates • Interpretability of results
• Things to look out for: – Timing of decision – Type I error control – Operational bias
12 Source: Lin et al 2016.
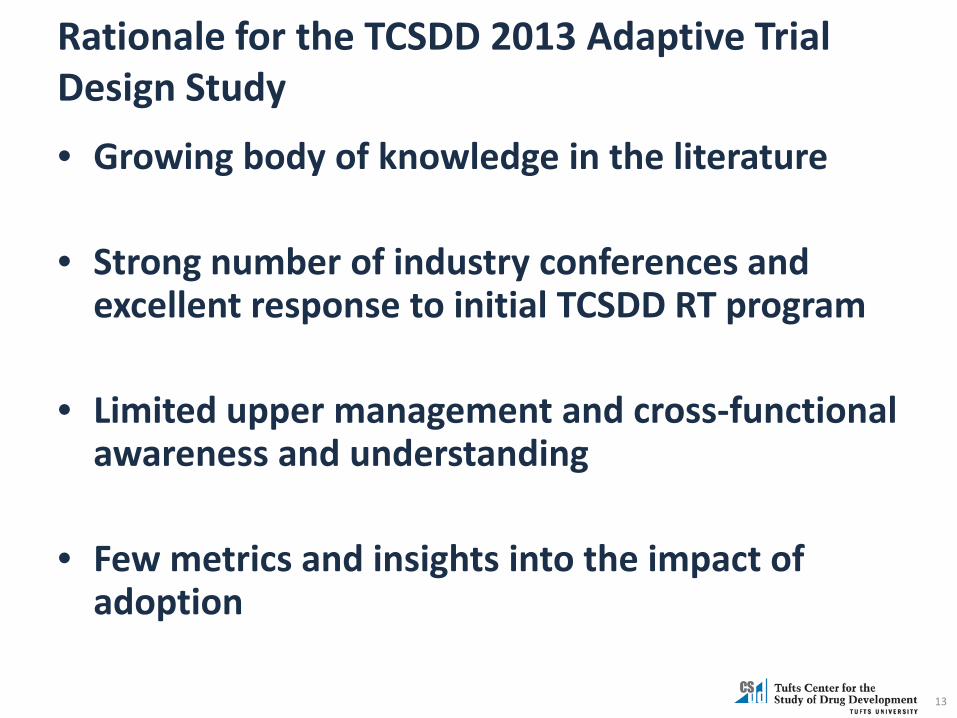
Rationale for the TCSDD 2013 Adaptive Trial Design Study
• Growing body of knowledge in the literature
• Strong number of industry conferences and excellent response to initial TCSDD RT program
• Limited upper management and cross-functional awareness and understanding
• Few metrics and insights into the impact of adoption
13
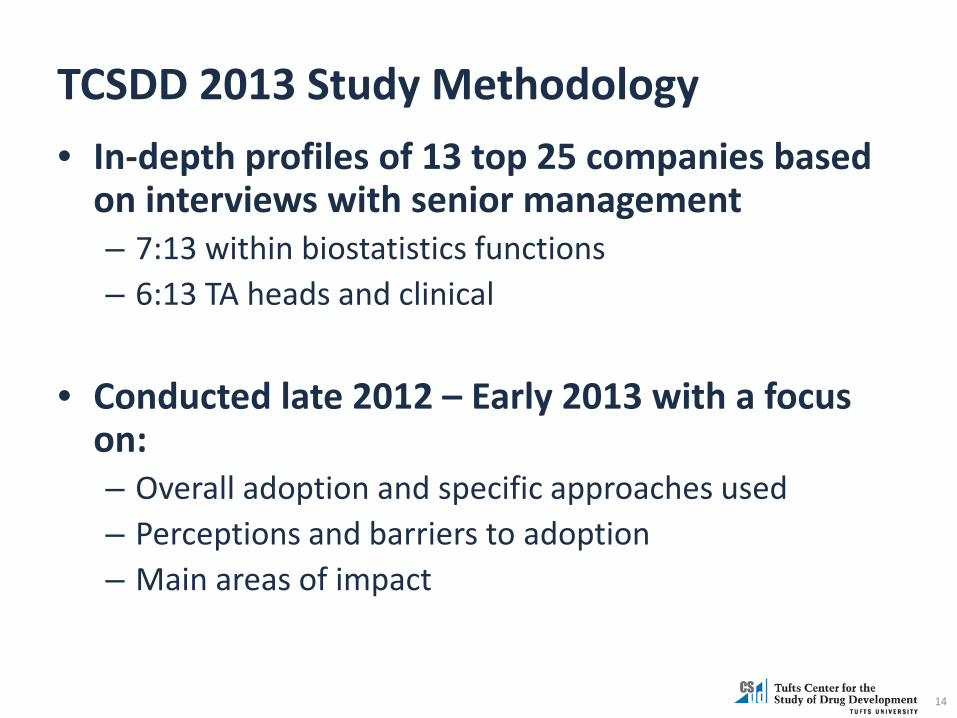
TCSDD 2013 Study Methodology • In-depth profiles of 13 top 25 companies based
on interviews with senior management – 7:13 within biostatistics functions – 6:13 TA heads and clinical
• Conducted late 2012 – Early 2013 with a focus
on: – Overall adoption and specific approaches used – Perceptions and barriers to adoption – Main areas of impact
14
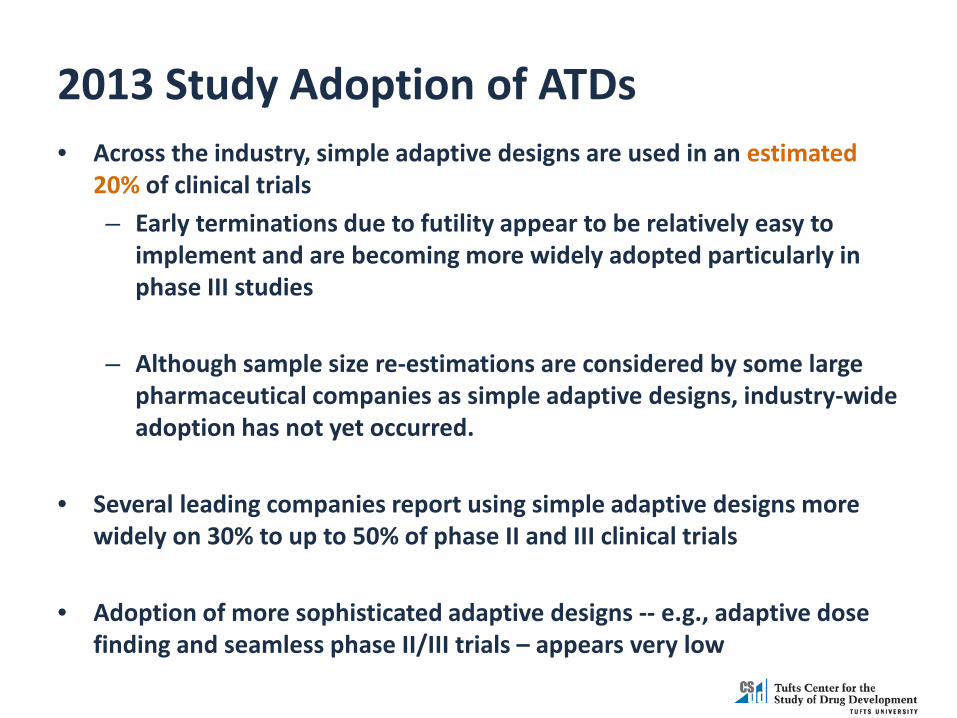
2013 Study Adoption of ATDs • Across the industry, simple adaptive designs are used in an estimated
20% of clinical trials – Early terminations due to futility appear to be relatively easy to
implement and are becoming more widely adopted particularly in phase III studies
– Although sample size re-estimations are considered by some large
pharmaceutical companies as simple adaptive designs, industry-wide adoption has not yet occurred.
• Several leading companies report using simple adaptive designs more widely on 30% to up to 50% of phase II and III clinical trials
• Adoption of more sophisticated adaptive designs -- e.g., adaptive dose finding and seamless phase II/III trials – appears very low
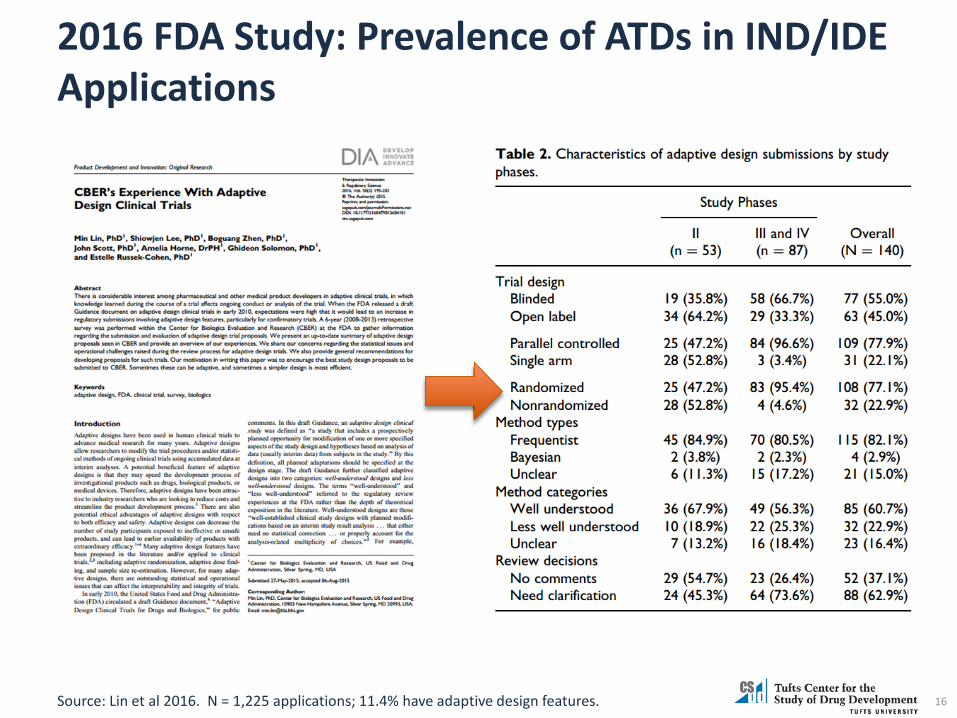
2016 FDA Study: Prevalence of ATDs in IND/IDE Applications
16 Source: Lin et al 2016. N = 1,225 applications; 11.4% have adaptive design features.
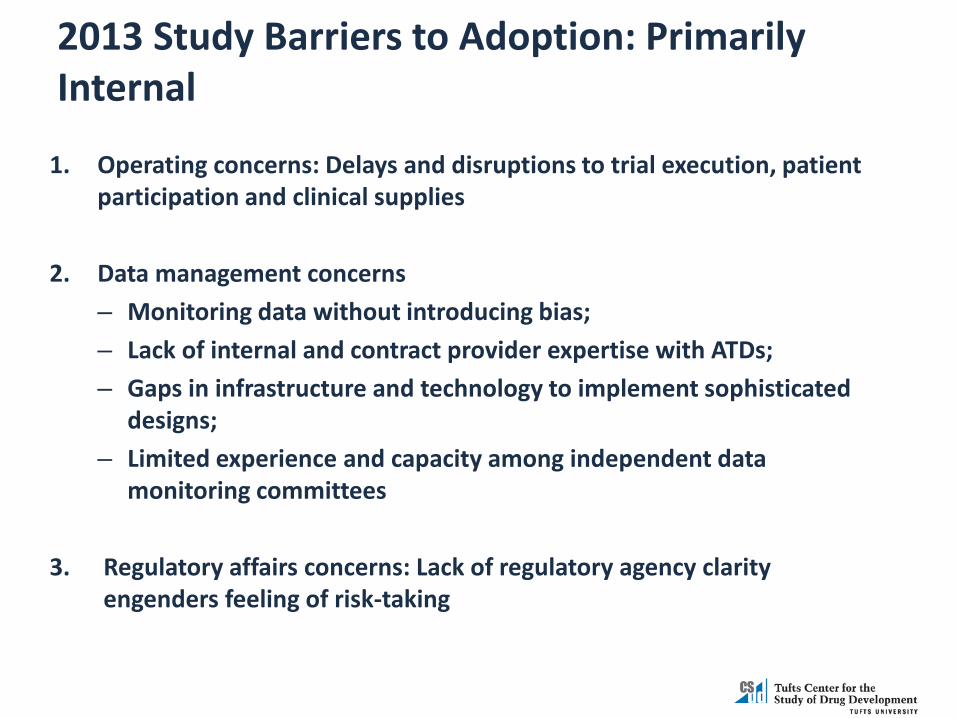
2013 Study Barriers to Adoption: Primarily Internal
1. Operating concerns: Delays and disruptions to trial execution, patient participation and clinical supplies
2. Data management concerns – Monitoring data without introducing bias; – Lack of internal and contract provider expertise with ATDs; – Gaps in infrastructure and technology to implement sophisticated
designs; – Limited experience and capacity among independent data
monitoring committees
3. Regulatory affairs concerns: Lack of regulatory agency clarity engenders feeling of risk-taking
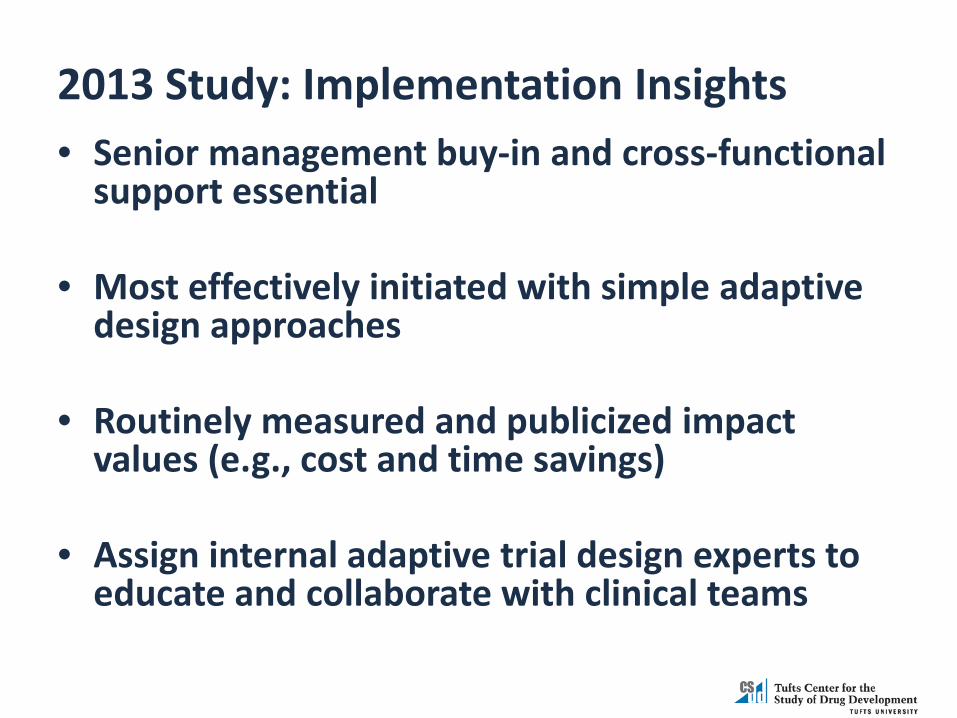
2013 Study: Implementation Insights • Senior management buy-in and cross-functional
support essential
• Most effectively initiated with simple adaptive design approaches
• Routinely measured and publicized impact values (e.g., cost and time savings)
• Assign internal adaptive trial design experts to educate and collaborate with clinical teams
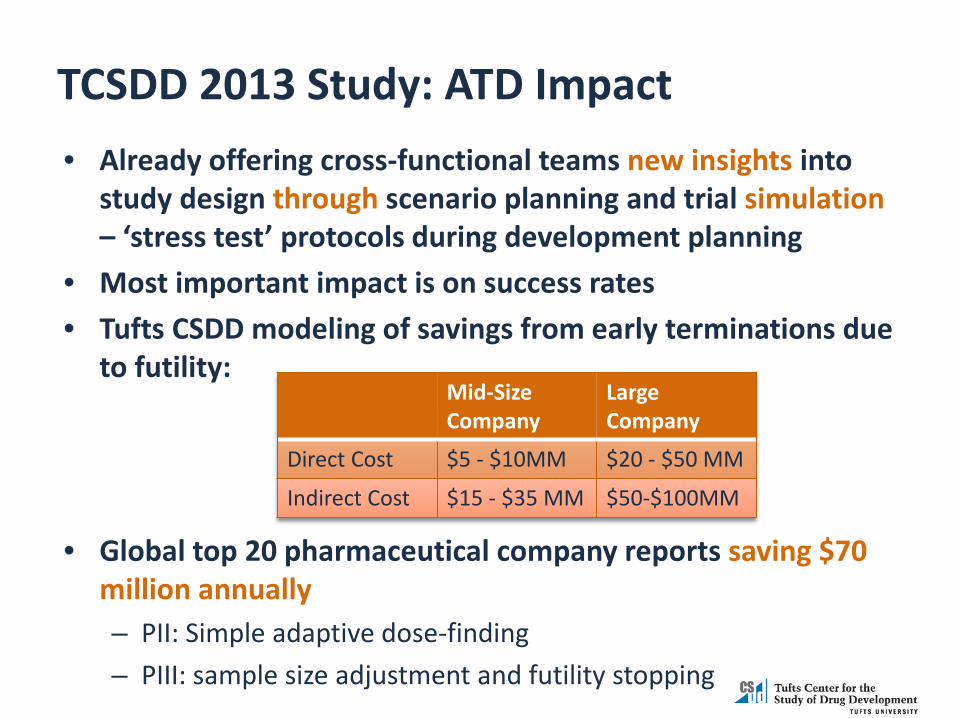
TCSDD 2013 Study: ATD Impact • Already offering cross-functional teams new insights into
study design through scenario planning and trial simulation – ‘stress test’ protocols during development planning
• Most important impact is on success rates • Tufts CSDD modeling of savings from early terminations due
to futility:
• Global top 20 pharmaceutical company reports saving $70 million annually – PII: Simple adaptive dose-finding – PIII: sample size adjustment and futility stopping
Mid-Size Company
Large Company
Direct Cost $5 - $10MM $20 - $50 MM
Indirect Cost $15 - $35 MM $50-$100MM

Summary of 2013 Study Findings
Save development timeline
Saving costs by stopping early /
assessing sample size
“Every year, we add up how much money we saved, and it’s always in the tens of millions across the entire portfolio” --- Large Pharmaceutical Company
Thank you! Stella Stergiopoulos
Research Fellow Tufts Center for the Study of Drug Development (Tufts CSDD)
21

Early Phase Adaptive Trial Designs: Avoid Strategic Mistakes and Increase overall Probability of Success
VERISTAT
Mark Chang, Ph.D. Sr. Vice-President Strategic Statistical Consulting

Coverage Integrated sequential decision process in drug
development Importance of right strategies in designing
early phase trials How to design early phase trial when facing
multiple challenges: - Limited information, heterogeneity of patient
population, high-cost and financial constraints, timing, competing landscape.
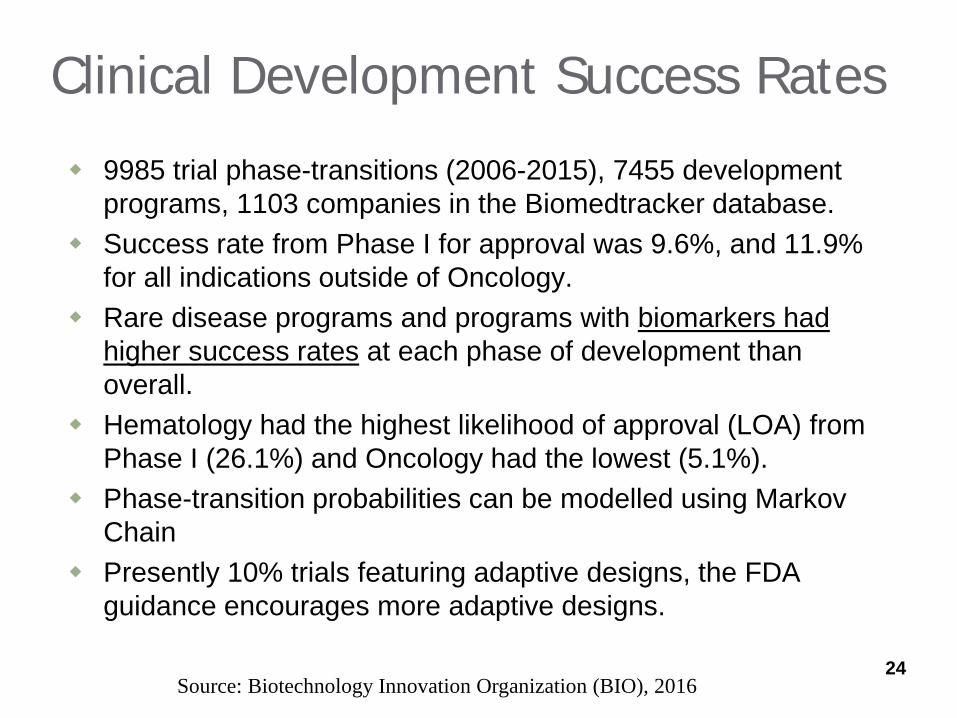
Clinical Development Success Rates
9985 trial phase-transitions (2006-2015), 7455 development programs, 1103 companies in the Biomedtracker database.
Success rate from Phase I for approval was 9.6%, and 11.9% for all indications outside of Oncology.
Rare disease programs and programs with biomarkers had higher success rates at each phase of development than overall.
Hematology had the highest likelihood of approval (LOA) from Phase I (26.1%) and Oncology had the lowest (5.1%).
Phase-transition probabilities can be modelled using Markov Chain
Presently 10% trials featuring adaptive designs, the FDA guidance encourages more adaptive designs.
24 Source: Biotechnology Innovation Organization (BIO), 2016
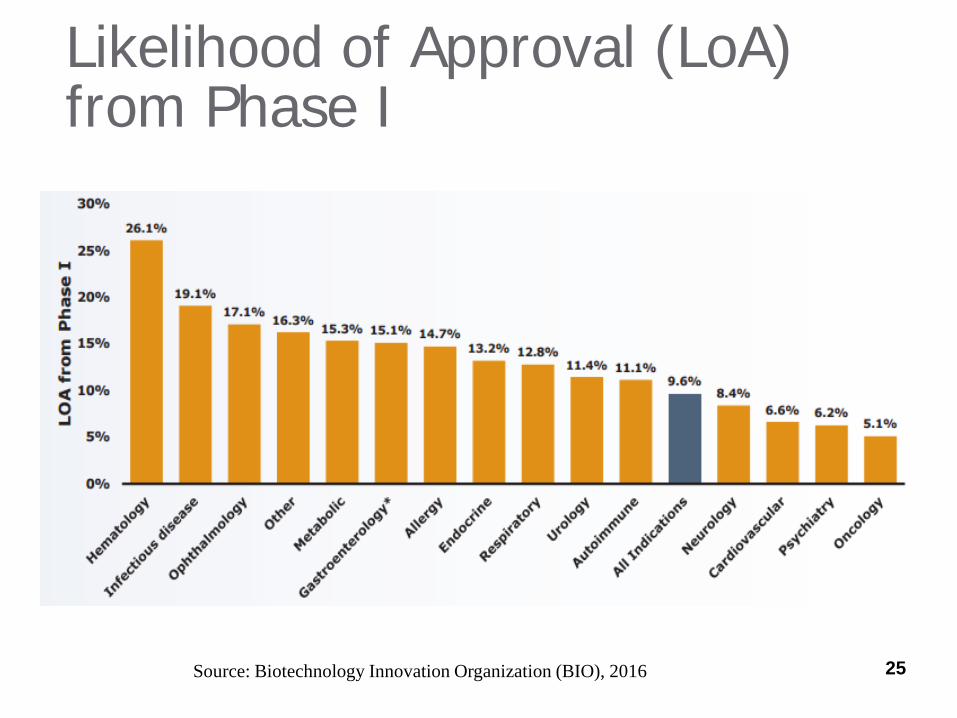
Likelihood of Approval (LoA) from Phase I
25 Source: Biotechnology Innovation Organization (BIO), 2016
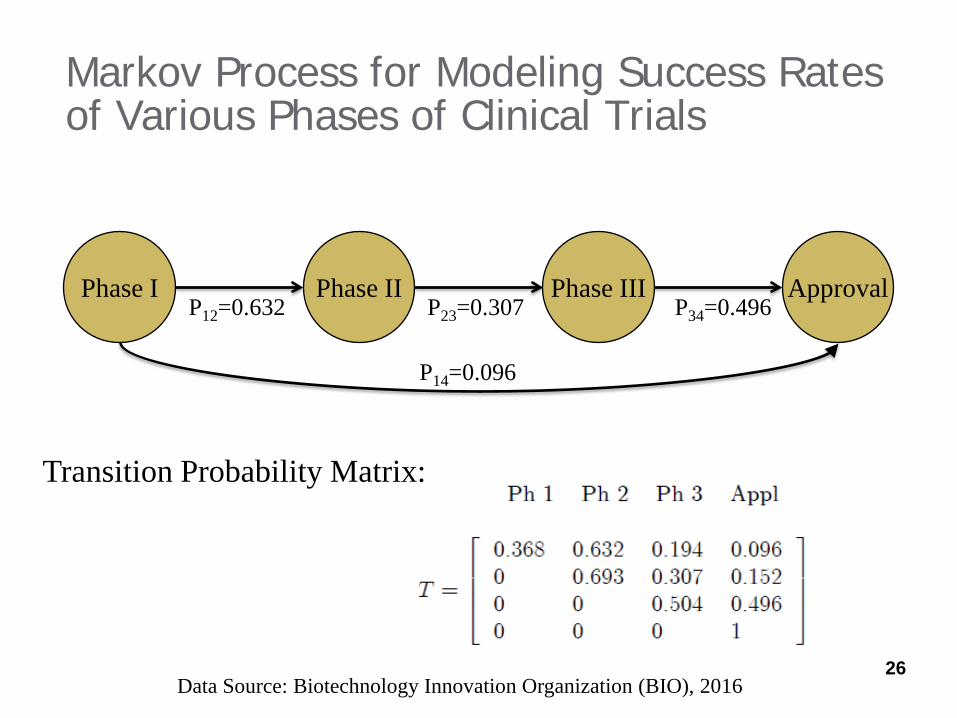
Markov Process for Modeling Success Rates of Various Phases of Clinical Trials
Phase I Phase II Phase III Approval P12=0.632 P23=0.307 P34=0.496
P14=0.096
Transition Probability Matrix:
26 Data Source: Biotechnology Innovation Organization (BIO), 2016
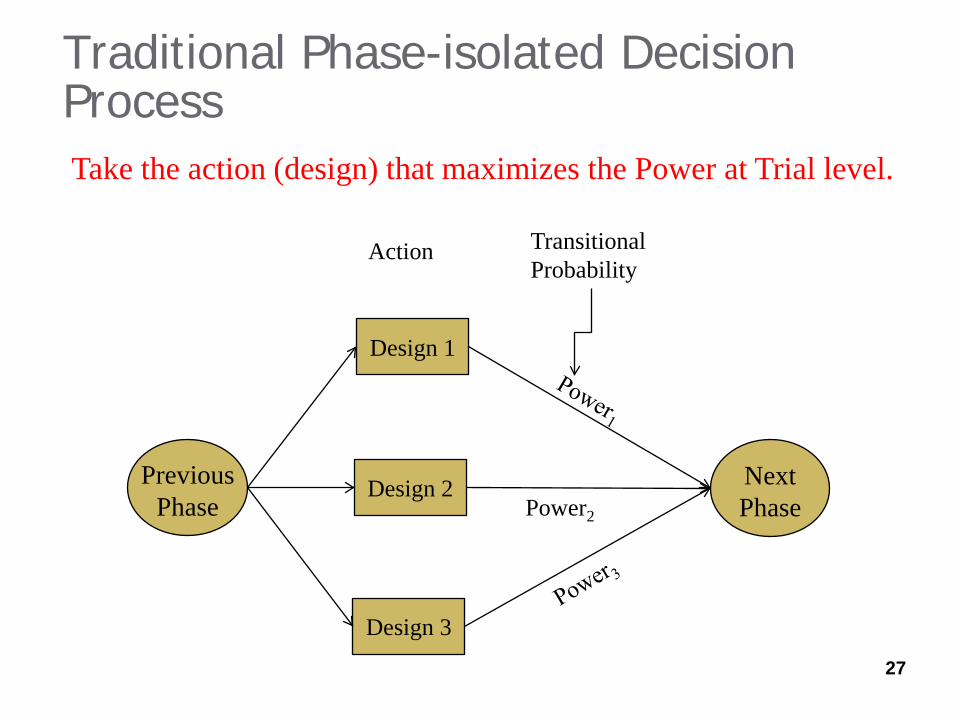
Traditional Phase-isolated Decision Process
Design 1
Design 2
Design 3
Action
Power2
27
Take the action (design) that maximizes the Power at Trial level.
Transitional Probability
Previous Phase
Next Phase
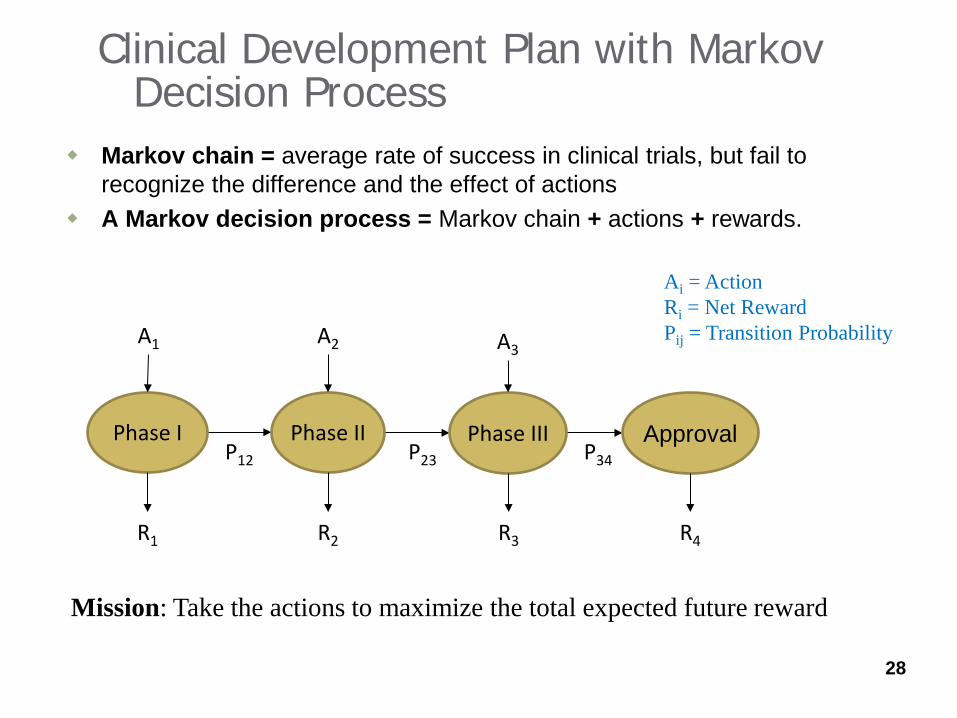
Clinical Development Plan with Markov Decision Process
Markov chain = average rate of success in clinical trials, but fail to recognize the difference and the effect of actions
A Markov decision process = Markov chain + actions + rewards.
28
P12 P23 P34 Phase I Phase II Phase III Approval
R1
A1 A2
R2 R4 R3
A3
Ai = Action Ri = Net Reward Pij = Transition Probability
Mission: Take the actions to maximize the total expected future reward
Success Dependent on Multifactors - Solutions
1. Unknown treatment effect – Bayesian prior distribution of parameter
2. Decisions – Adaptive trial designs 3. Probabilistic outcomes – Simulations 4. Interrelationship among different phases –
Markov Chain Decision Process with adaptive design to maximize the forward rewards at anytime point.
29
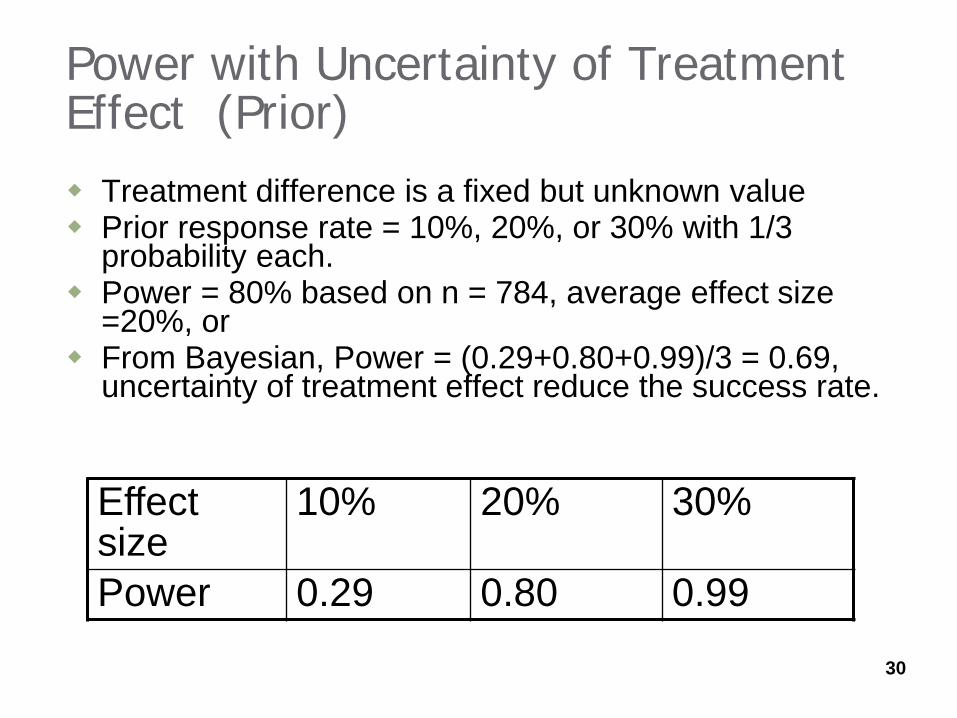
Power with Uncertainty of Treatment Effect (Prior) Treatment difference is a fixed but unknown value Prior response rate = 10%, 20%, or 30% with 1/3
probability each. Power = 80% based on n = 784, average effect size
=20%, or From Bayesian, Power = (0.29+0.80+0.99)/3 = 0.69,
uncertainty of treatment effect reduce the success rate.
Effect size
10% 20% 30%
Power 0.29 0.80 0.99
30
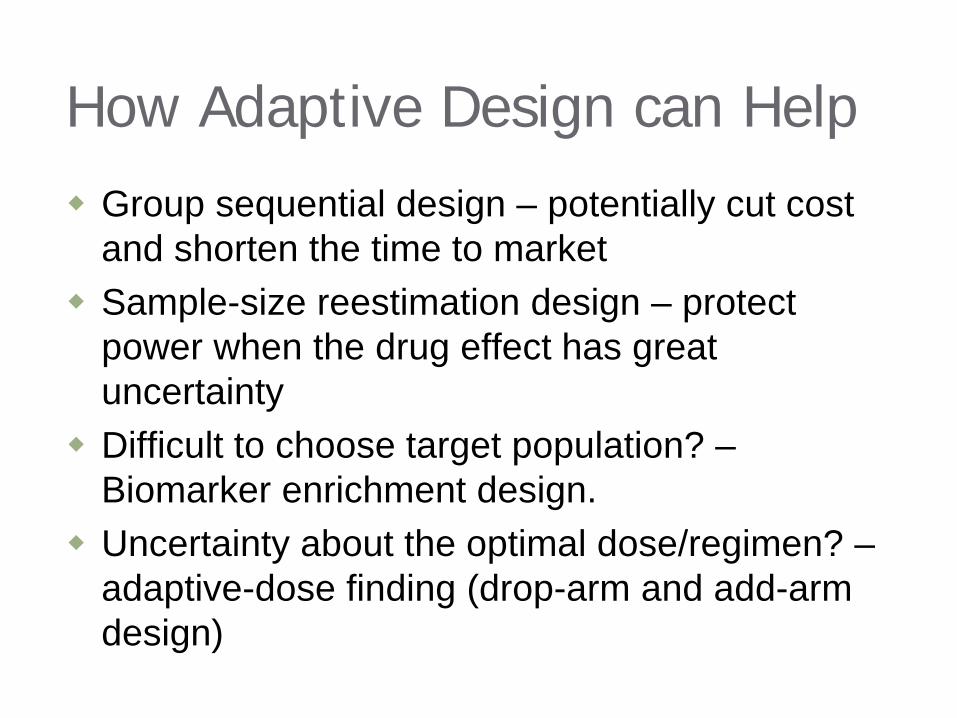
How Adaptive Design can Help Group sequential design – potentially cut cost
and shorten the time to market Sample-size reestimation design – protect
power when the drug effect has great uncertainty
Difficult to choose target population? – Biomarker enrichment design.
Uncertainty about the optimal dose/regimen? – adaptive-dose finding (drop-arm and add-arm design)

Monte Carlo or Clinical Trial Simulation
Clinical trial simulation (CTS) is a process that mimics clinical trials using computer programs.
CTS is particularly important in adaptive designs for several reasons: - Intuitive approach with minimal cost, easy to implement,
can be do in a short time - Easy to mimic complex situations - Provide comprehensive outputs, operating characteristics - Can be used to monitor trials, predict outcomes, anticipate
problems, and suggest early remedies before it is too late Reference: Chang, M. (2010). Monte Carlo Simulations for Pharmaceutical Industry. CRC 32
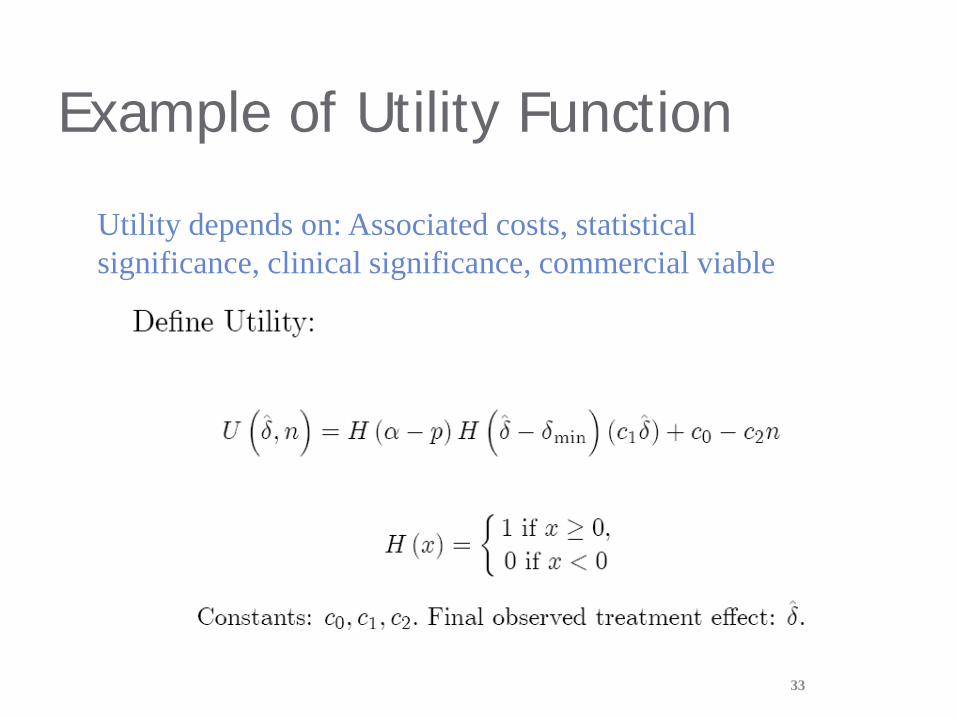
Example of Utility Function
33
Utility depends on: Associated costs, statistical significance, clinical significance, commercial viable
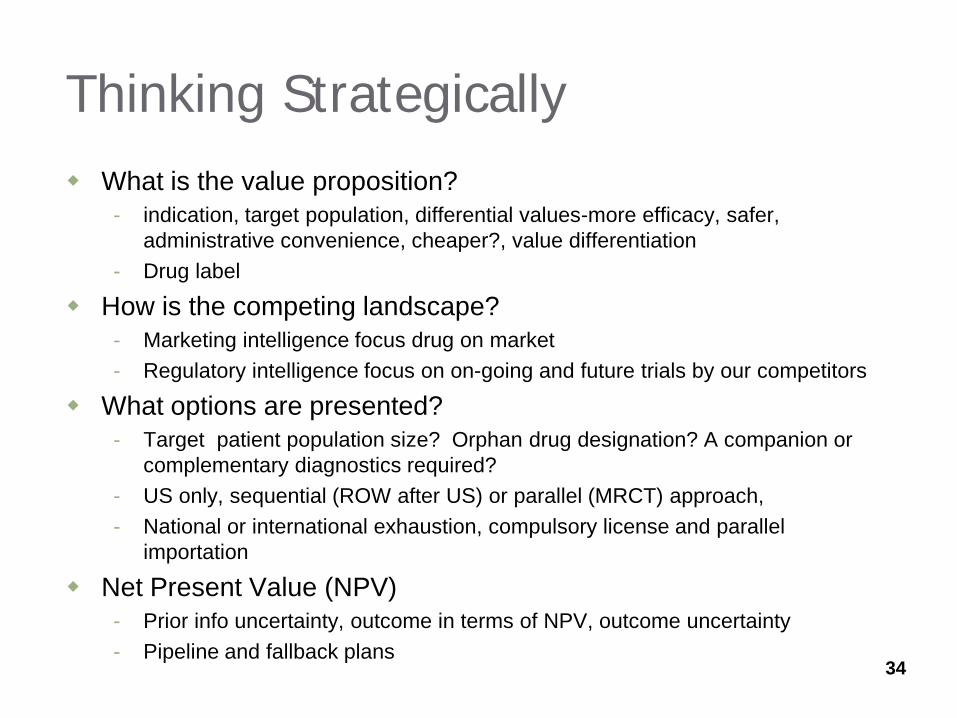
Thinking Strategically What is the value proposition?
- indication, target population, differential values-more efficacy, safer, administrative convenience, cheaper?, value differentiation
- Drug label
How is the competing landscape? - Marketing intelligence focus drug on market - Regulatory intelligence focus on on-going and future trials by our competitors
What options are presented? - Target patient population size? Orphan drug designation? A companion or
complementary diagnostics required? - US only, sequential (ROW after US) or parallel (MRCT) approach, - National or international exhaustion, compulsory license and parallel
importation
Net Present Value (NPV) - Prior info uncertainty, outcome in terms of NPV, outcome uncertainty - Pipeline and fallback plans
34
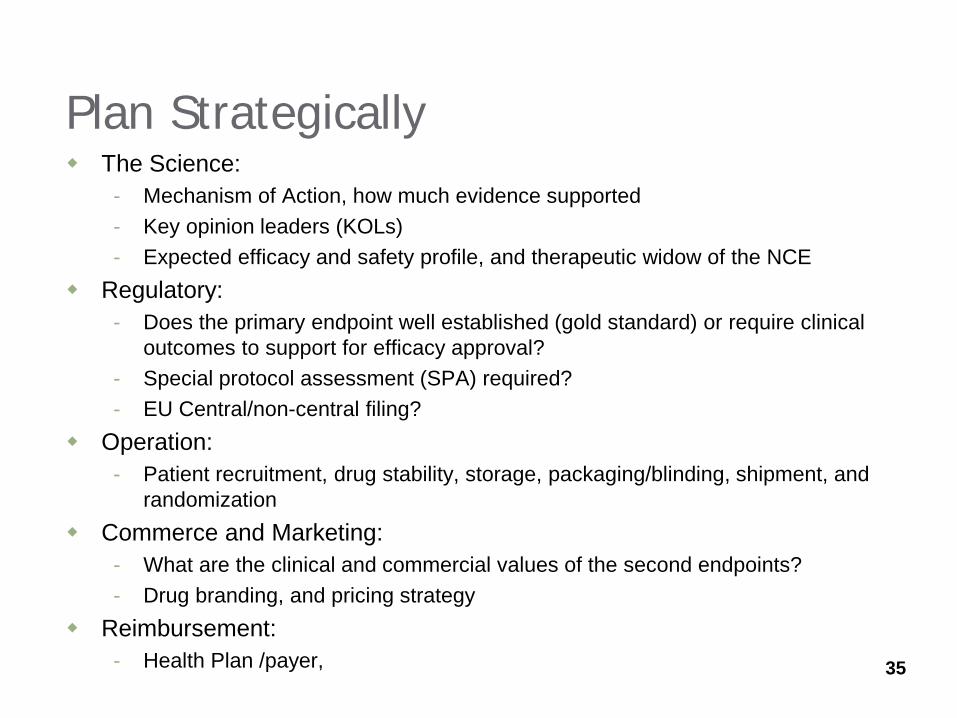
Plan Strategically The Science:
- Mechanism of Action, how much evidence supported - Key opinion leaders (KOLs) - Expected efficacy and safety profile, and therapeutic widow of the NCE
Regulatory: - Does the primary endpoint well established (gold standard) or require clinical
outcomes to support for efficacy approval? - Special protocol assessment (SPA) required? - EU Central/non-central filing?
Operation: - Patient recruitment, drug stability, storage, packaging/blinding, shipment, and
randomization Commerce and Marketing:
- What are the clinical and commercial values of the second endpoints? - Drug branding, and pricing strategy
Reimbursement: - Health Plan /payer, 35
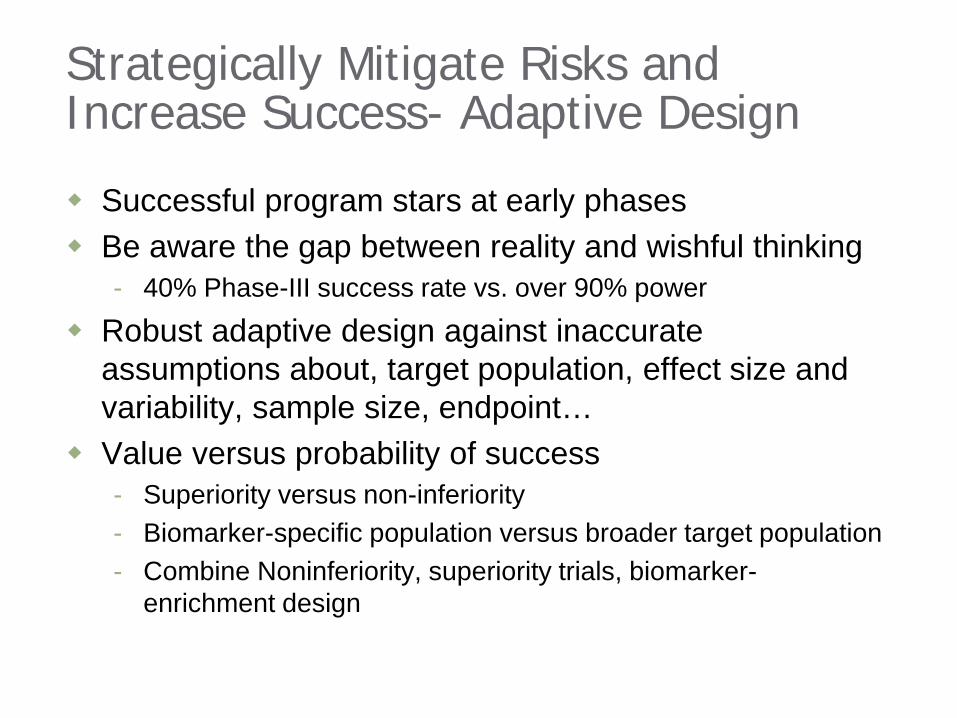
Strategically Mitigate Risks and Increase Success- Adaptive Design
Successful program stars at early phases Be aware the gap between reality and wishful thinking
- 40% Phase-III success rate vs. over 90% power
Robust adaptive design against inaccurate assumptions about, target population, effect size and variability, sample size, endpoint…
Value versus probability of success - Superiority versus non-inferiority - Biomarker-specific population versus broader target population - Combine Noninferiority, superiority trials, biomarker-
enrichment design
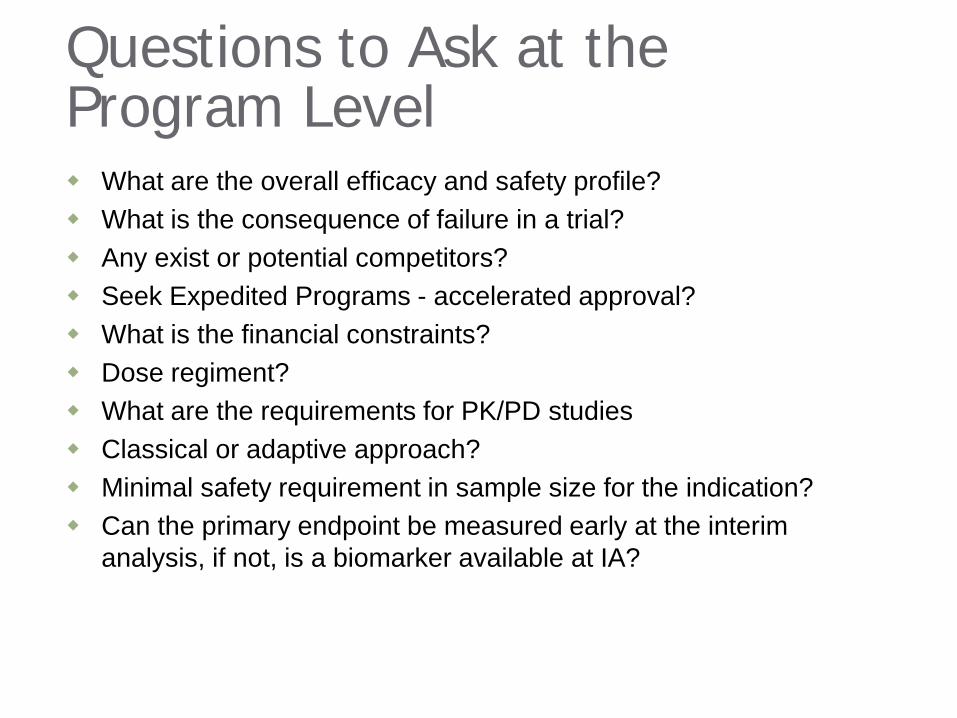
Questions to Ask at the Program Level What are the overall efficacy and safety profile? What is the consequence of failure in a trial? Any exist or potential competitors? Seek Expedited Programs - accelerated approval? What is the financial constraints? Dose regiment? What are the requirements for PK/PD studies Classical or adaptive approach? Minimal safety requirement in sample size for the indication? Can the primary endpoint be measured early at the interim
analysis, if not, is a biomarker available at IA?
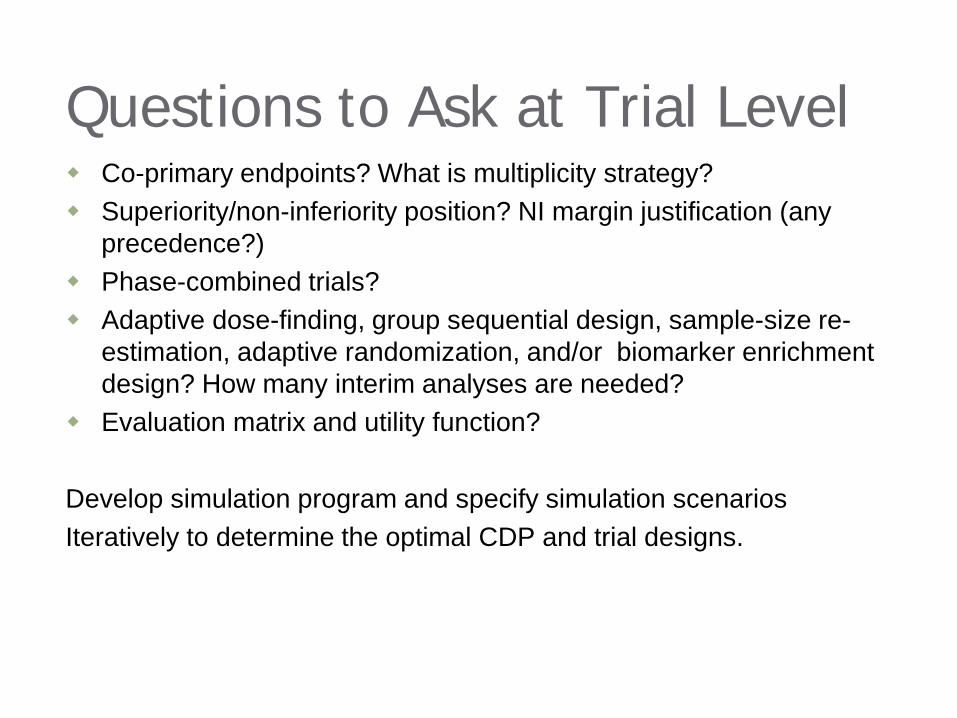
Questions to Ask at Trial Level Co-primary endpoints? What is multiplicity strategy? Superiority/non-inferiority position? NI margin justification (any
precedence?) Phase-combined trials? Adaptive dose-finding, group sequential design, sample-size re-
estimation, adaptive randomization, and/or biomarker enrichment design? How many interim analyses are needed?
Evaluation matrix and utility function? Develop simulation program and specify simulation scenarios Iteratively to determine the optimal CDP and trial designs.

Summary and Discussion Trial Phase-transition probabilities inform the average
success rate for different indications The success of clinical development for an individual
NME depends on the decisions made in the process Early phase trials using adaptive design play a critical
role in the success of the entire clinical development program
Design early phase to achieve the global development optimal.
39

References 1. Chang, M. (2010). Monte Carlo Simulations for Pharmaceutical Industry. CRC 2. Chang M. (2014). Adaptive design theory and implementation using SAS and R.
CRC 3. FDA (2016). Adaptive Designs for Medical Device Clinical Studies. 4. Clinical Development Success Rates 2006-2015.
https://www.bio.org/sites/default/files/Clinical%20Development%20Success%20Rates%202006-2015%20-%20BIO,%20Biomedtracker,%20Amplion%202016.pdf
40
Adaptive Designs for Confirmatory Trials Two Case Studies
MassBio Adaptive Design Forum
9 November 2016
Cyrus Mehta, Ph.D., Cytel Inc and Harvard T.H.Chan and
Deepak L. Bhatt, M.D., M.P.H., BWH and Harvard Medical School

Two case studies featuring adaptive confirmatory trials 1. The VALOR trial of acute myeloid leukemia
• motivation • promising zone design • operating characteristics • strategic impact
2. Enrichment design for a targeted therapy • motivation • the MAMS approach • power comparison: MAMS vs conventional design
Outline
MassBio Adaotive Design Forum 42
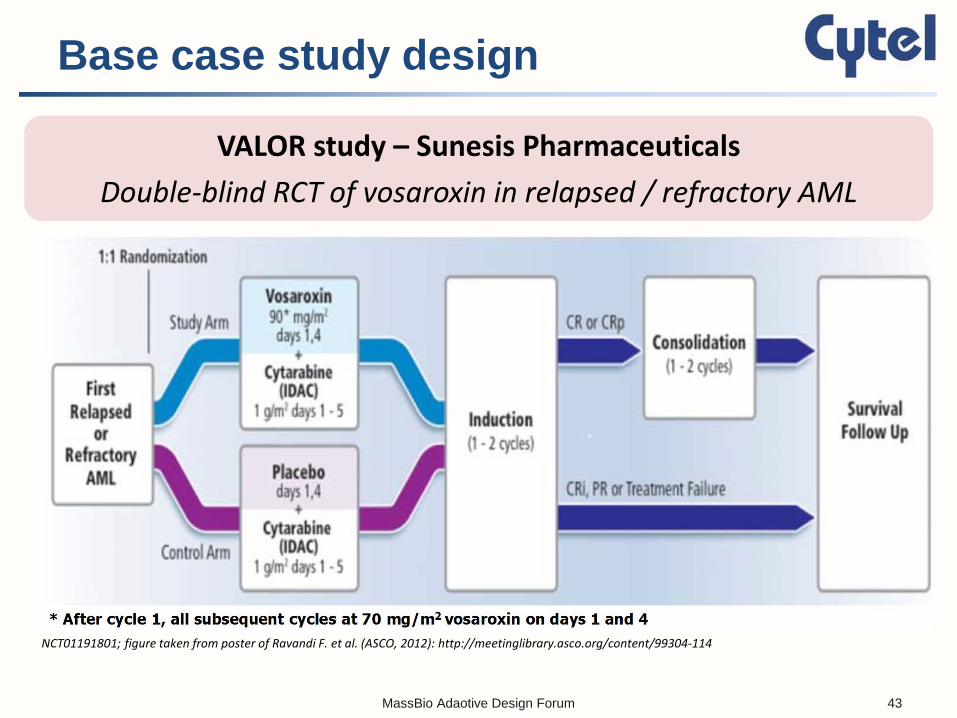
Base case study design
VALOR study – Sunesis Pharmaceuticals Double-blind RCT of vosaroxin in relapsed / refractory AML
NCT01191801; figure taken from poster of Ravandi F. et al. (ASCO, 2012): http://meetinglibrary.asco.org/content/99304-114
MassBio Adaotive Design Forum 43
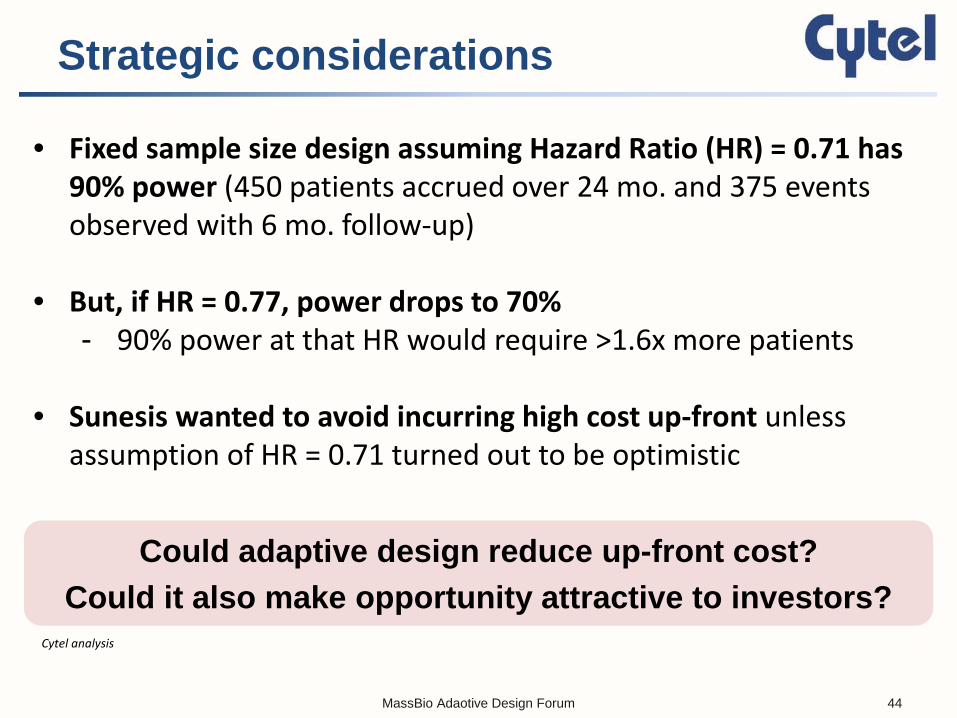
Strategic considerations
Cytel analysis
• Fixed sample size design assuming Hazard Ratio (HR) = 0.71 has 90% power (450 patients accrued over 24 mo. and 375 events observed with 6 mo. follow-up)
• But, if HR = 0.77, power drops to 70% - 90% power at that HR would require >1.6x more patients
• Sunesis wanted to avoid incurring high cost up-front unless
assumption of HR = 0.71 turned out to be optimistic
Could adaptive design reduce up-front cost? Could it also make opportunity attractive to investors?
MassBio Adaotive Design Forum 44
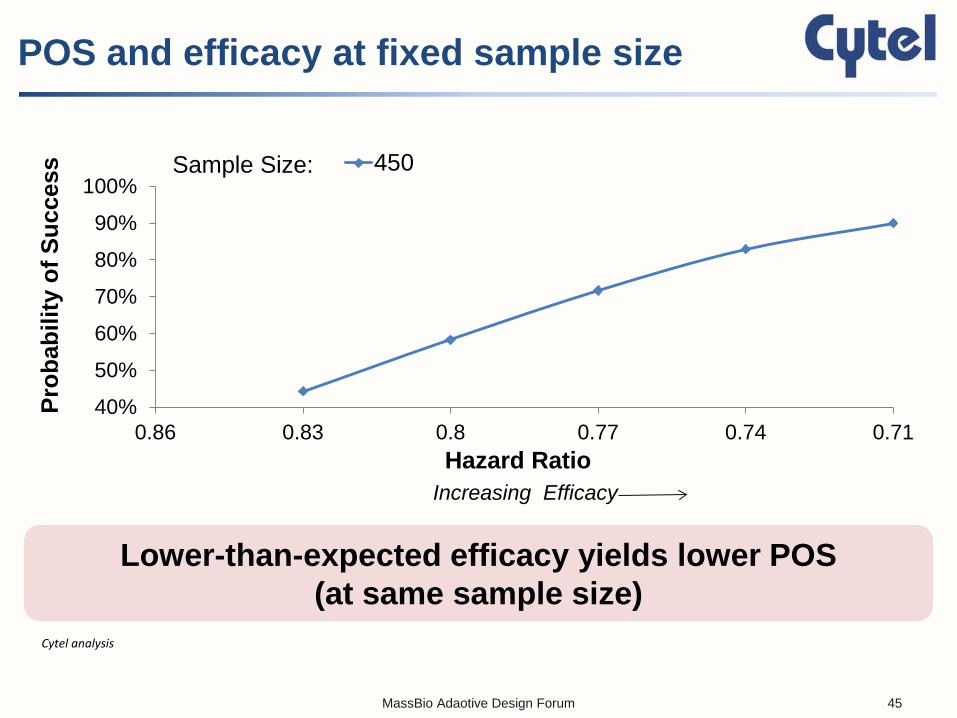
POS and efficacy at fixed sample size
Cytel analysis
Lower-than-expected efficacy yields lower POS (at same sample size)
40%
50%
60%
70%
80%
90%
100%
0.710.740.770.80.830.86
Prob
abili
ty o
f Suc
cess
Hazard Ratio
450Sample Size:
Increasing Efficacy
MassBio Adaotive Design Forum 45
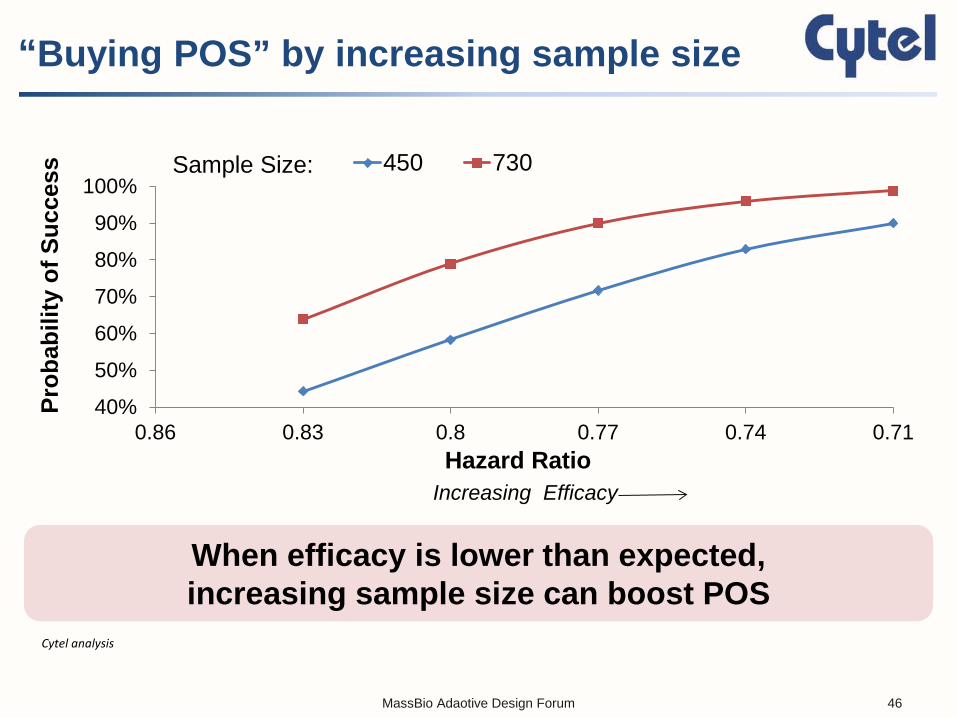
“Buying POS” by increasing sample size
Cytel analysis
When efficacy is lower than expected, increasing sample size can boost POS
40%
50%
60%
70%
80%
90%
100%
0.710.740.770.80.830.86
Prob
abili
ty o
f Suc
cess
Hazard Ratio
450 730Sample Size:
Increasing Efficacy
MassBio Adaotive Design Forum 46

Adaptive design: Interim sample size re-assessment
Transparent, pre-specified plan to increase sample size only if interim analysis was in “promising zone”
NCT01191801; figure taken from poster of Ravandi F. et al. (ASCO, 2012): http://meetinglibrary.asco.org/content/99304-114
MassBio Adaotive Design Forum 47
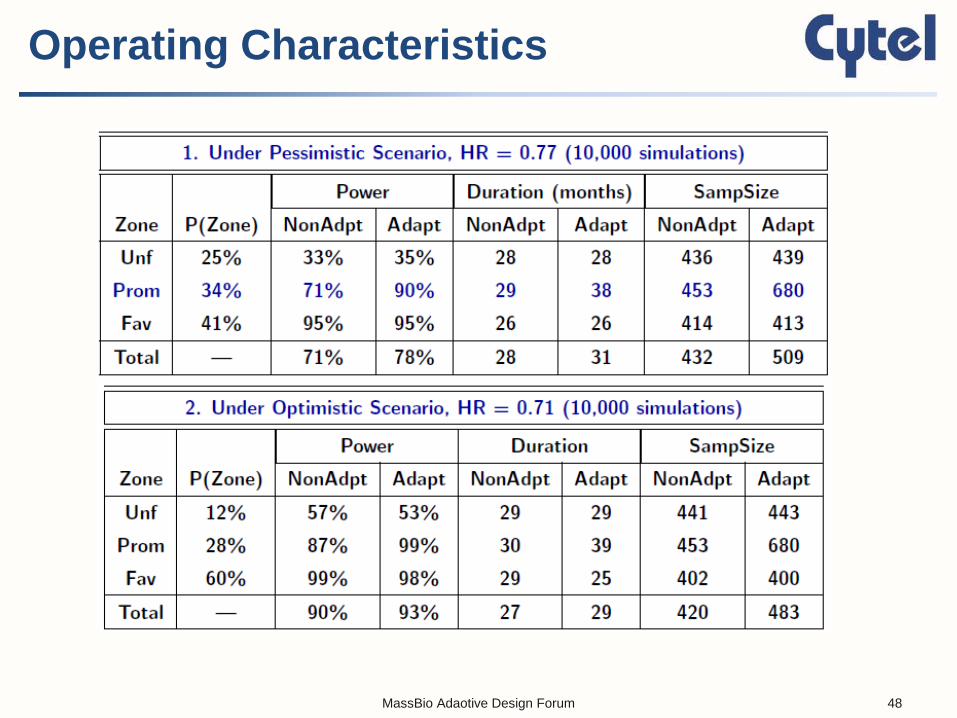
Operating Characteristics
MassBio Adaotive Design Forum 48

Comments from partners
“Sunesis’ use of an adaptive trial design offers us an opportunity to invest in this promising biopharmaceutical product candidate on terms that are a
win-win for both Sunesis and Royalty Pharma: Sunesis gains access to a flexible, novel financing structure and we are
able to invest in vosaroxin at a time when we believe its likelihood of commercial success will be high.”
– Pablo Legorreta, CEO, Royalty Pharma1
“The innovative yet practical design provided multiple favorable scenarios that allowed us to proceed with our pivotal Valor study …
It is difficult to imagine going forward with traditional methods alone.” – Steven Ketchum, Sr. VP R&D, Sunesis Pharmaceuticals2
1 Sunesis press release, March 29, 2012 (http://ir.sunesis.com/phoenix.zhtml?c=194116&p=irol-newsArticle&ID=1678333) 2 S. Ketchum, personal communication
MassBio Adaotive Design Forum 49
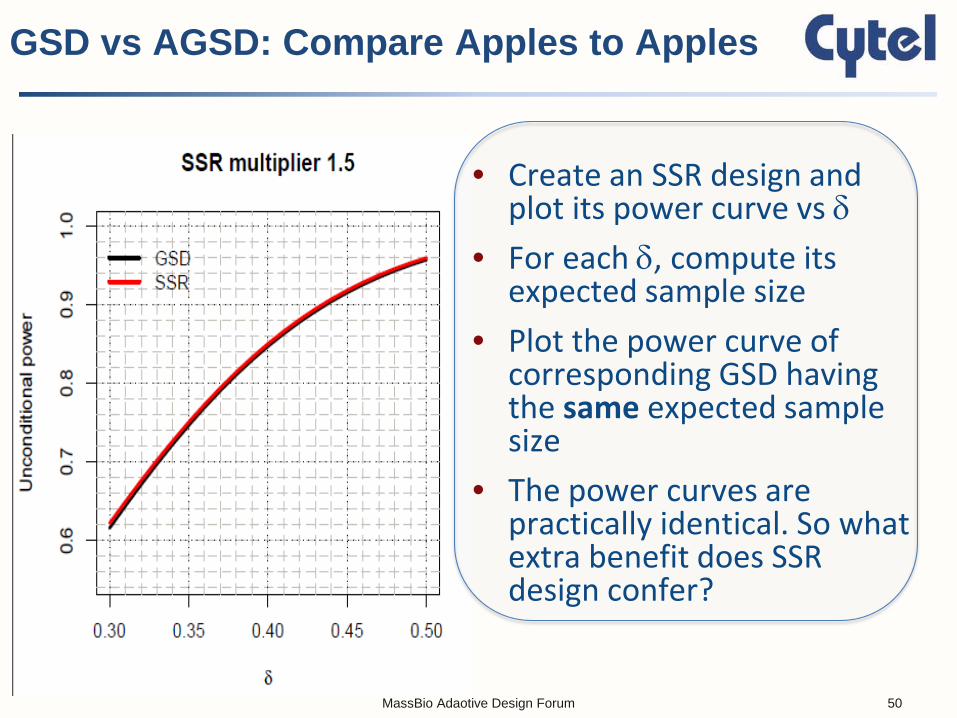
• Create an SSR design and plot its power curve vs δ
• For each δ, compute its expected sample size
• Plot the power curve of corresponding GSD having the same expected sample size
• The power curves are practically identical. So what extra benefit does SSR design confer?
GSD vs AGSD: Compare Apples to Apples
MassBio Adaotive Design Forum 50
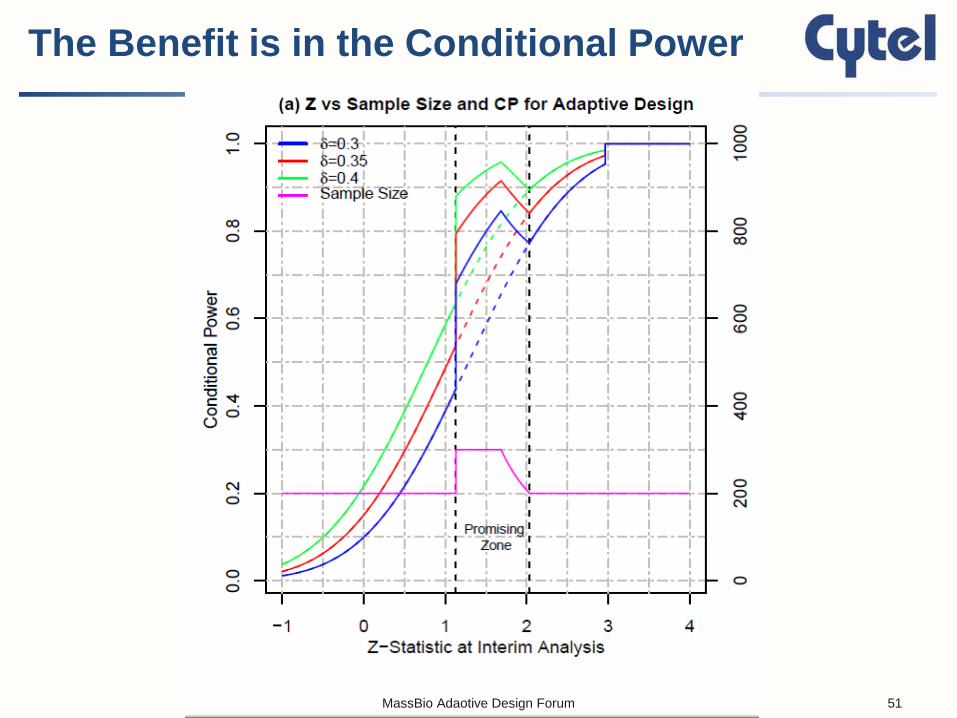
The Benefit is in the Conditional Power
MassBio Adaotive Design Forum 51
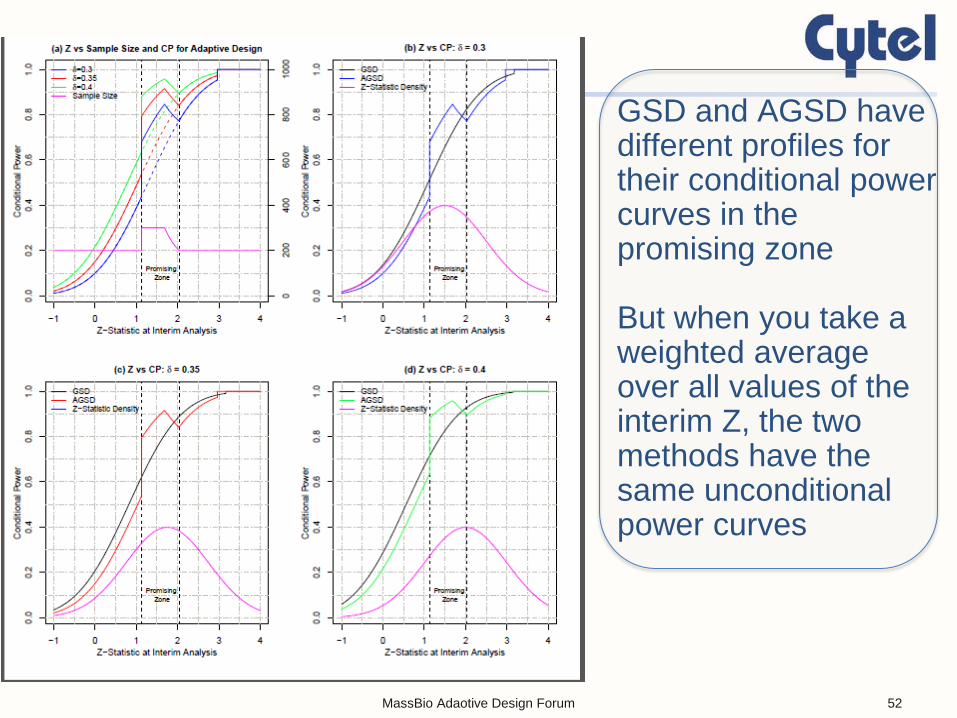
GSD and AGSD have different profiles for their conditional power curves in the promising zone But when you take a weighted average over all values of the interim Z, the two methods have the same unconditional power curves
MassBio Adaotive Design Forum 52
Can We Do Randomized Clinical Trials Better?
Deepak L. Bhatt, MD, MPH
Executive Director of Interventional Cardiovascular Programs, BWH Heart and Vascular Center Professor of Medicine, Harvard Medical School
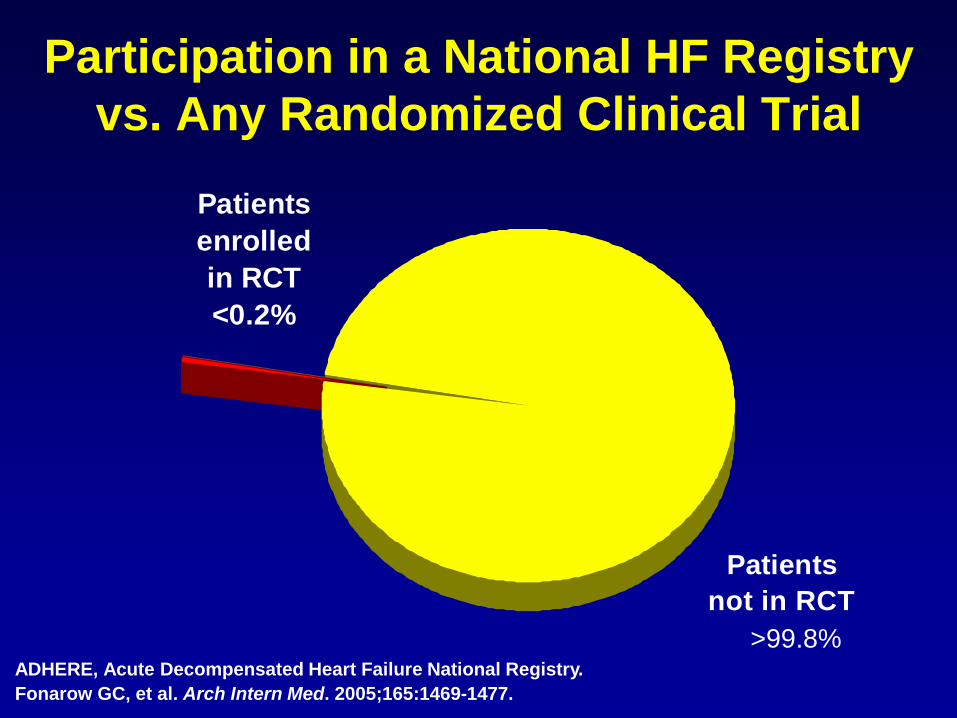
Patients not in RCT
Patients enrolled in RCT<0.2%
Participation in a National HF Registry vs. Any Randomized Clinical Trial
ADHERE, Acute Decompensated Heart Failure National Registry. Fonarow GC, et al. Arch Intern Med. 2005;165:1469-1477.
>99.8%
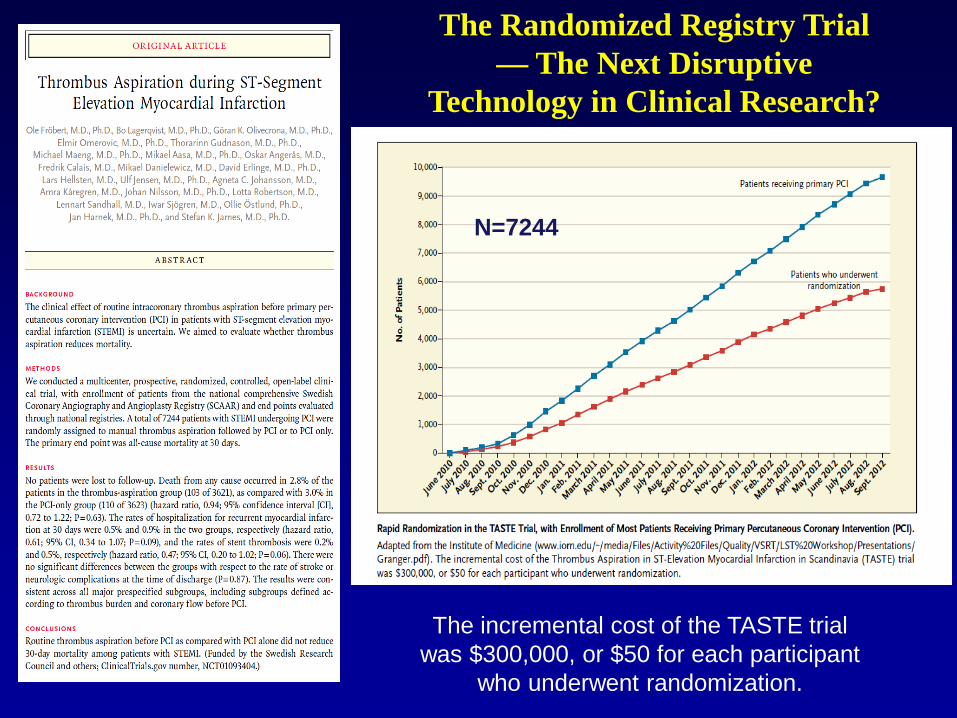
The incremental cost of the TASTE trial was $300,000, or $50 for each participant
who underwent randomization.
The Randomized Registry Trial — The Next Disruptive
Technology in Clinical Research?
N=7244
Bhatt DL, Mehta C. N Engl J Med 2016;375:65-74

Adaptive Features of a Trial That Uses Sample-Size Reestimation
Bhatt DL, Mehta C. N Engl J Med 2016;375:65-74
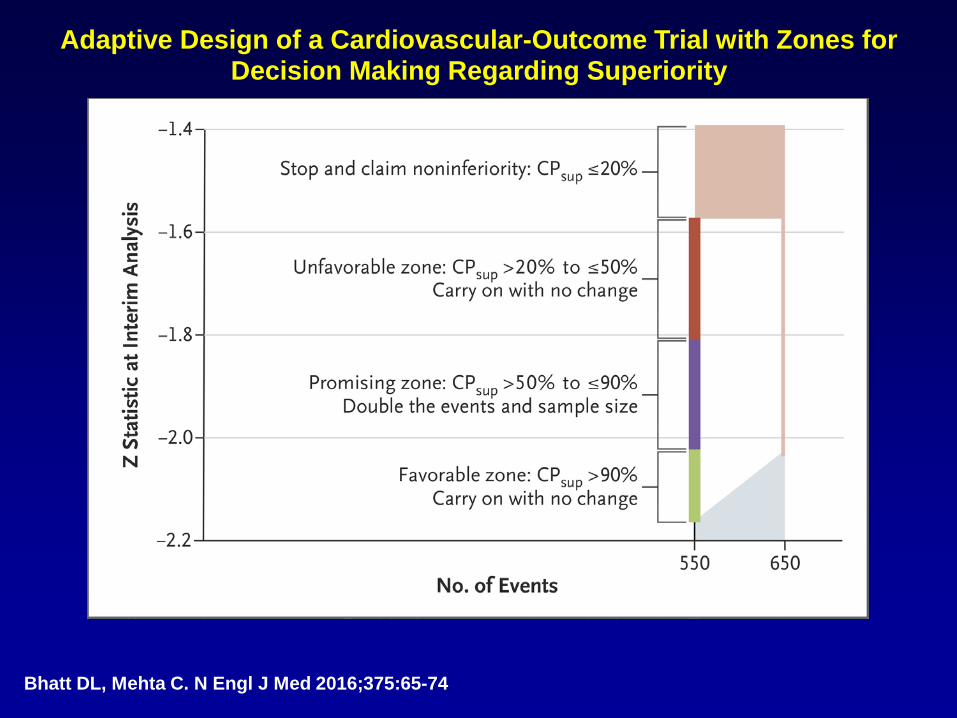
Adaptive Design of a Cardiovascular-Outcome Trial with Zones for Decision Making Regarding Superiority
Bhatt DL, Mehta C. N Engl J Med 2016;375:65-74
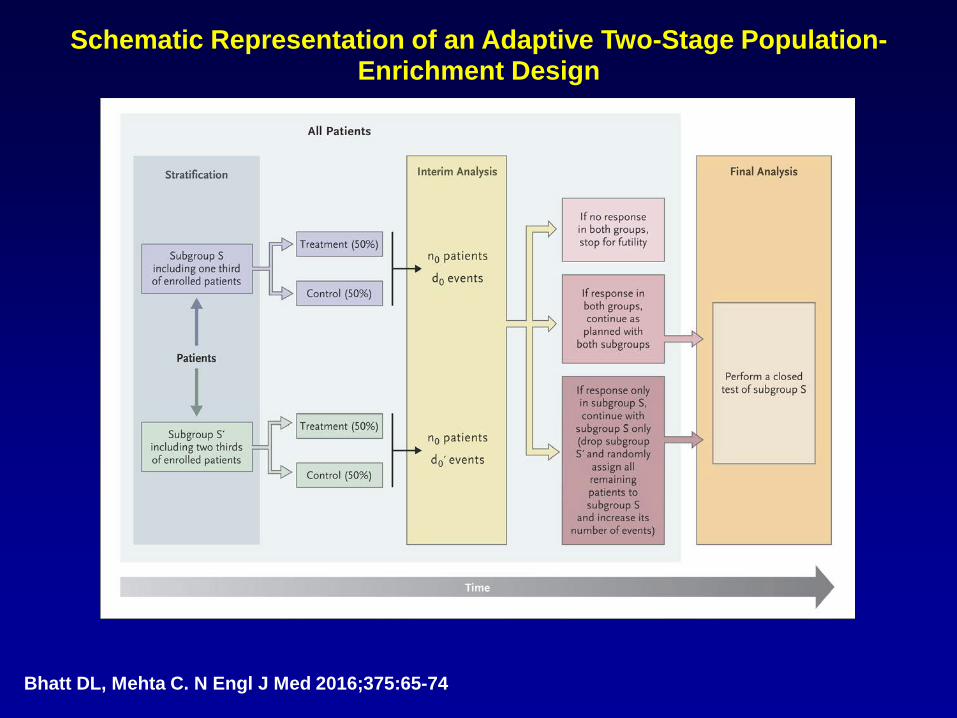
Schematic Representation of an Adaptive Two-Stage Population-Enrichment Design
Bhatt DL, Mehta C. N Engl J Med 2016;375:65-74
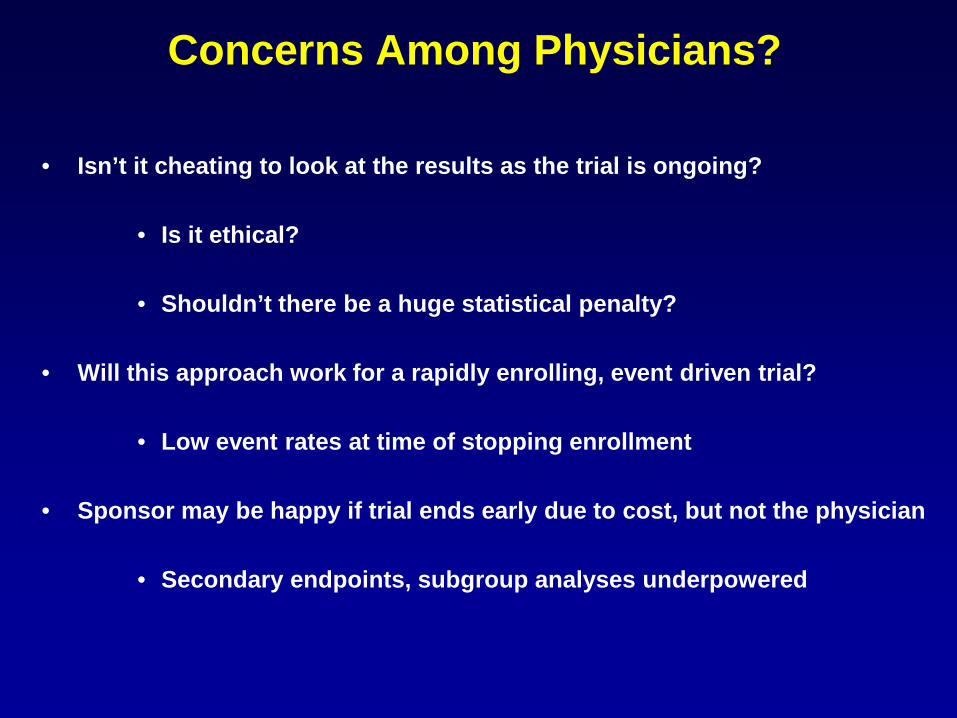
Concerns Among Physicians?
• Isn’t it cheating to look at the results as the trial is ongoing?
• Is it ethical?
• Shouldn’t there be a huge statistical penalty?
• Will this approach work for a rapidly enrolling, event driven trial?
• Low event rates at time of stopping enrollment
• Sponsor may be happy if trial ends early due to cost, but not the physician
• Secondary endpoints, subgroup analyses underpowered

www.brighamandwomens.org/heart
Deepak L. Bhatt, MD, MPH Executive Director of Interventional Cardiovascular Programs, BWH Heart & Vascular Center Professor of Medicine, Harvard Medical School 1 (857) 307-1992 [email protected]
Thank You!

• Population enrichment design in oncology
Back-up Slides - Appendix
MassBio Adaotive Design Forum 62
• PD-1 is a protein and cell-surface receptor that down-regulates the immune system
• A new class of drugs (pembrolizumab and nivolumab) block PD-1 and activate the immune system
• Many tumors (eg NSCLC) express PD-L1, an immunosuppressive ligand that might enhance the mechanism of action of the pembrolizumab and nivolumab
Population Enrichment Design a Targeted Therapy
MassBio Adaotive Design Forum 63

CheckMate 57: OS by Biomarker Status
MassBio Adaotive Design Forum 64
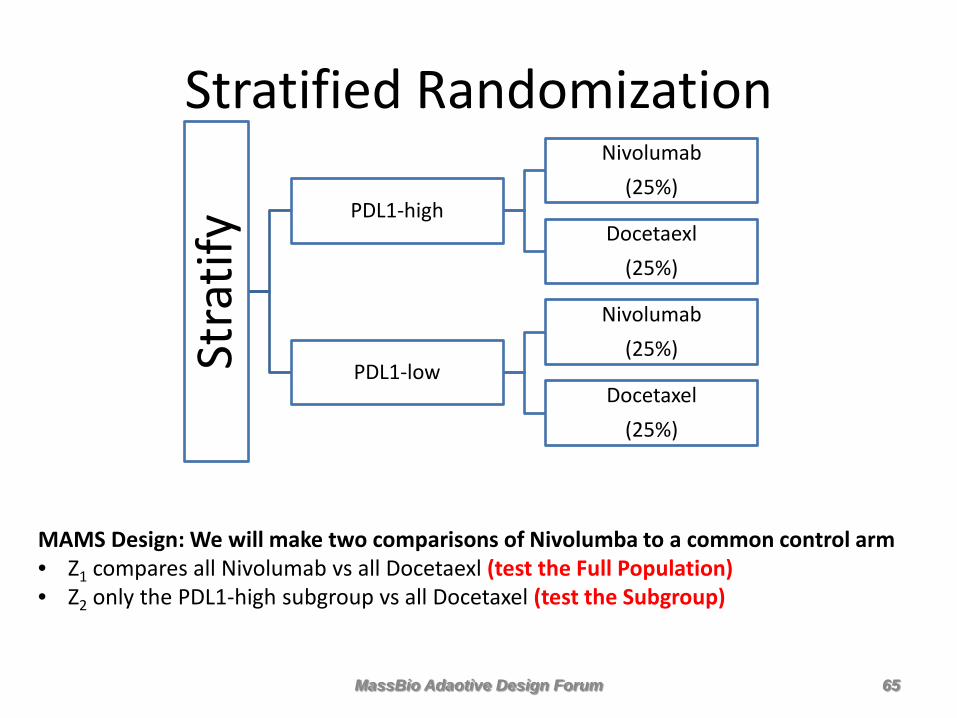
Stratified Randomization
Stra
tify PDL1-high
Nivolumab (25%)
Docetaexl (25%)
PDL1-low
Nivolumab (25%)
Docetaxel (25%)
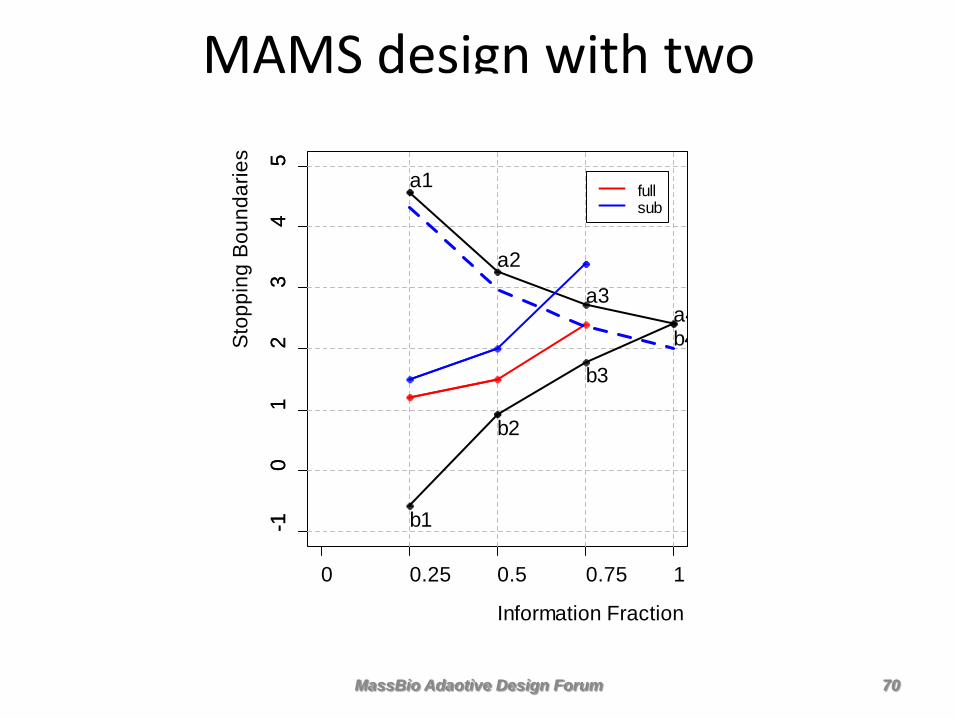
MAMS Design: We will make two comparisons of Nivolumba to a common control arm • Z1 compares all Nivolumab vs all Docetaexl (test the Full Population) • Z2 only the PDL1-high subgroup vs all Docetaxel (test the Subgroup)
MassBio Adaotive Design Forum 65
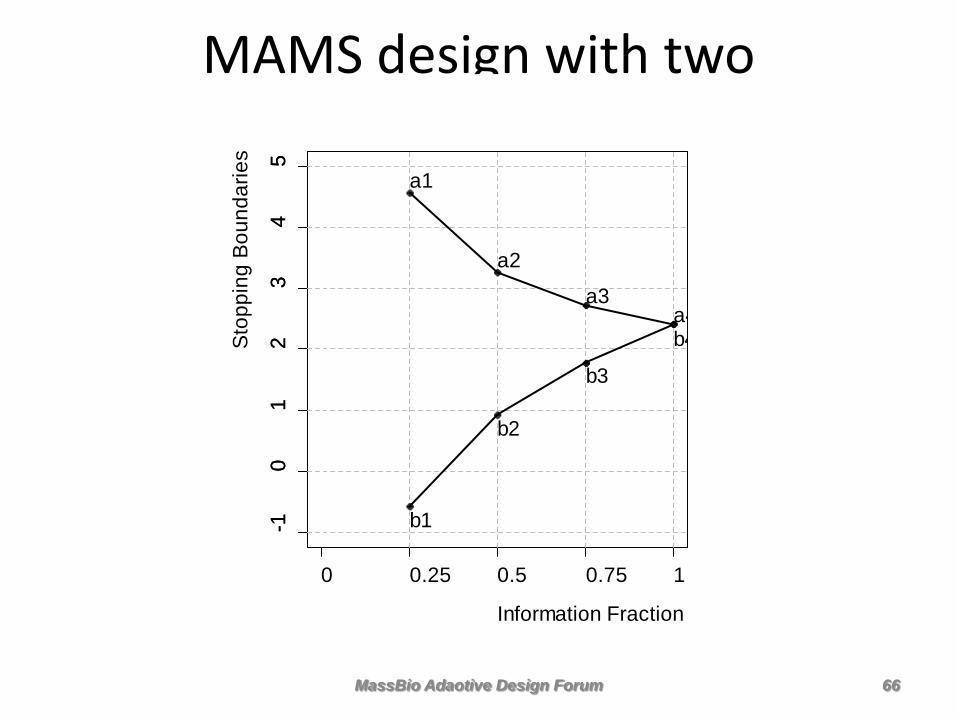
MAMS design with two comparisons
-10
12
34
5
Information Fraction
Sto
ppin
g B
ound
arie
s
0 0.25 0.5 0.75 1
-10
12
34
5
a1
a2
a3a4
b1
b2
b3
b4
MassBio Adaotive Design Forum 66
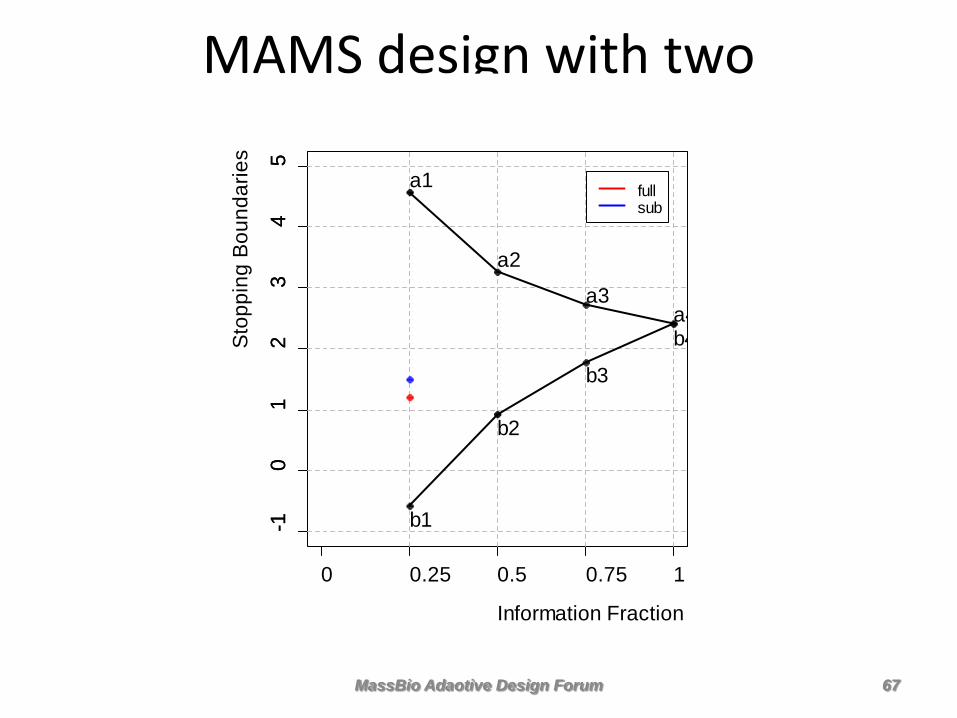
MAMS design with two comparisons
-10
12
34
5
Information Fraction
Sto
ppin
g B
ound
arie
s
0 0.25 0.5 0.75 1
-10
12
34
5
a1
a2
a3a4
b1
b2
b3
b4
fullsub
MassBio Adaotive Design Forum 67
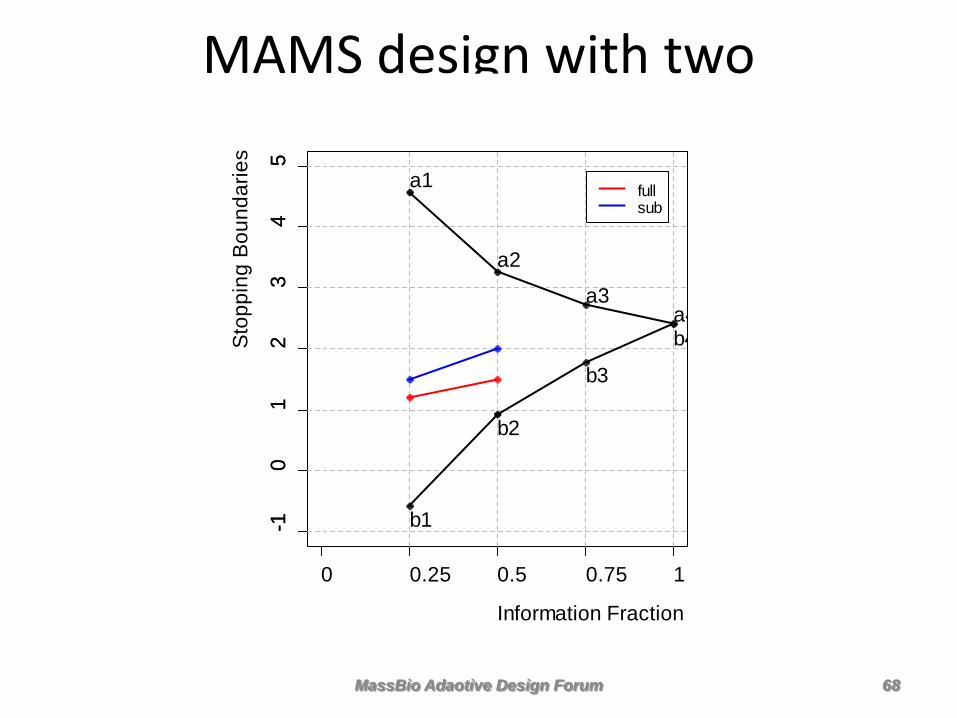
MAMS design with two comparisons
-10
12
34
5
Information Fraction
Sto
ppin
g B
ound
arie
s
0 0.25 0.5 0.75 1
-10
12
34
5
a1
a2
a3a4
b1
b2
b3
b4
fullsub
MassBio Adaotive Design Forum 68

MAMS design with two comparisons
-10
12
34
5
Information Fraction
Sto
ppin
g B
ound
arie
s
0 0.25 0.5 0.75 1
-10
12
34
5
a1
a2
a3a4
b1
b2
b3
b4
fullsub
MassBio Adaotive Design Forum 69
MAMS design with two comparisons
-10
12
34
5
Information Fraction
Sto
ppin
g B
ound
arie
s
0 0.25 0.5 0.75 1
-10
12
34
5
a1
a2
a3a4
b1
b2
b3
b4
fullsub
MassBio Adaotive Design Forum 70
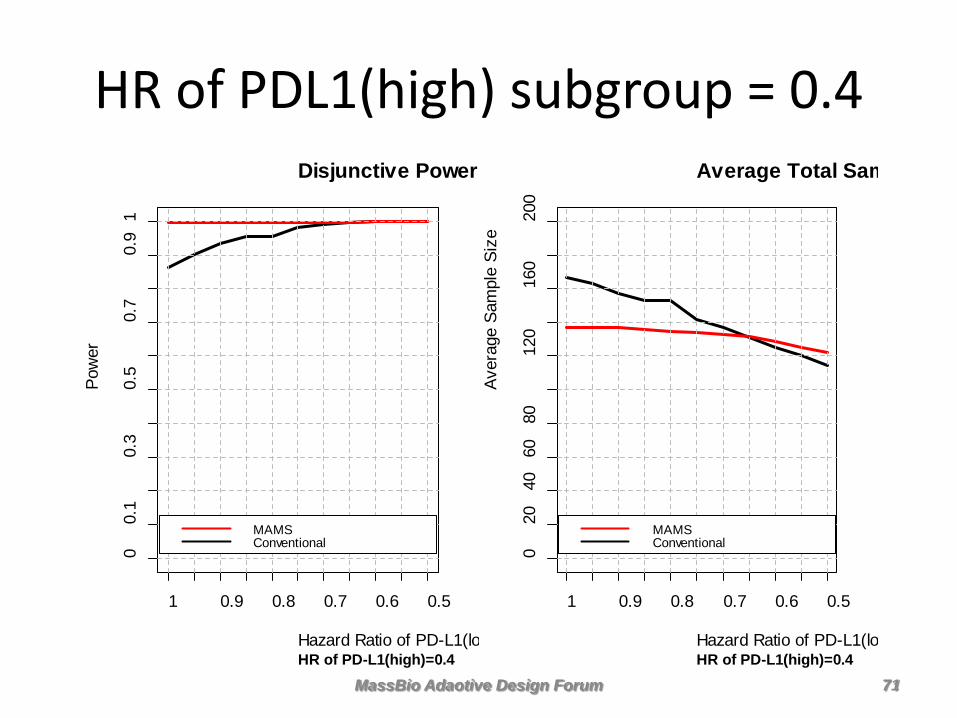
HR of PDL1(high) subgroup = 0.4 Disjunctive Power
HR of PD-L1(high)=0.4Hazard Ratio of PD-L1(lo
Pow
er
1 0.9 0.8 0.7 0.6 0.5
00.
10.
30.
50.
70.
91
MAMSConventional
Average Total Sam
HR of PD-L1(high)=0.4Hazard Ratio of PD-L1(lo
Aver
age
Sam
ple
Size
1 0.9 0.8 0.7 0.6 0.5
020
4060
8012
016
020
0MAMSConventional
MassBio Adaotive Design Forum 71
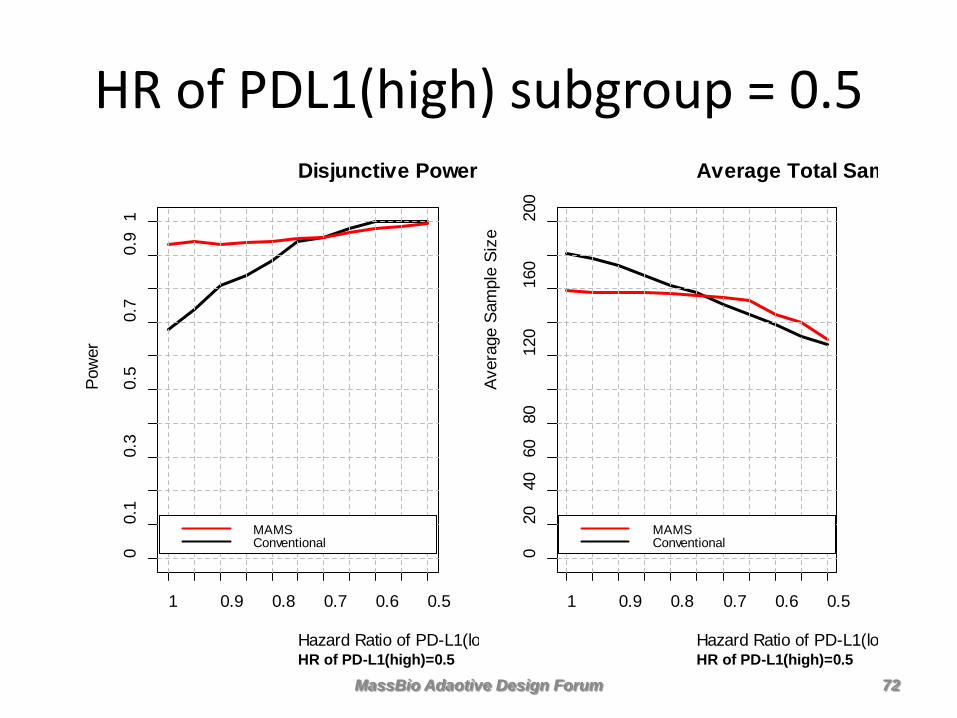
HR of PDL1(high) subgroup = 0.5 Disjunctive Power
HR of PD-L1(high)=0.5Hazard Ratio of PD-L1(lo
Pow
er
1 0.9 0.8 0.7 0.6 0.5
00.
10.
30.
50.
70.
91
MAMSConventional
Average Total Sam
HR of PD-L1(high)=0.5Hazard Ratio of PD-L1(lo
Aver
age
Sam
ple
Size
1 0.9 0.8 0.7 0.6 0.5
020
4060
8012
016
020
0MAMSConventional
MassBio Adaotive Design Forum 72
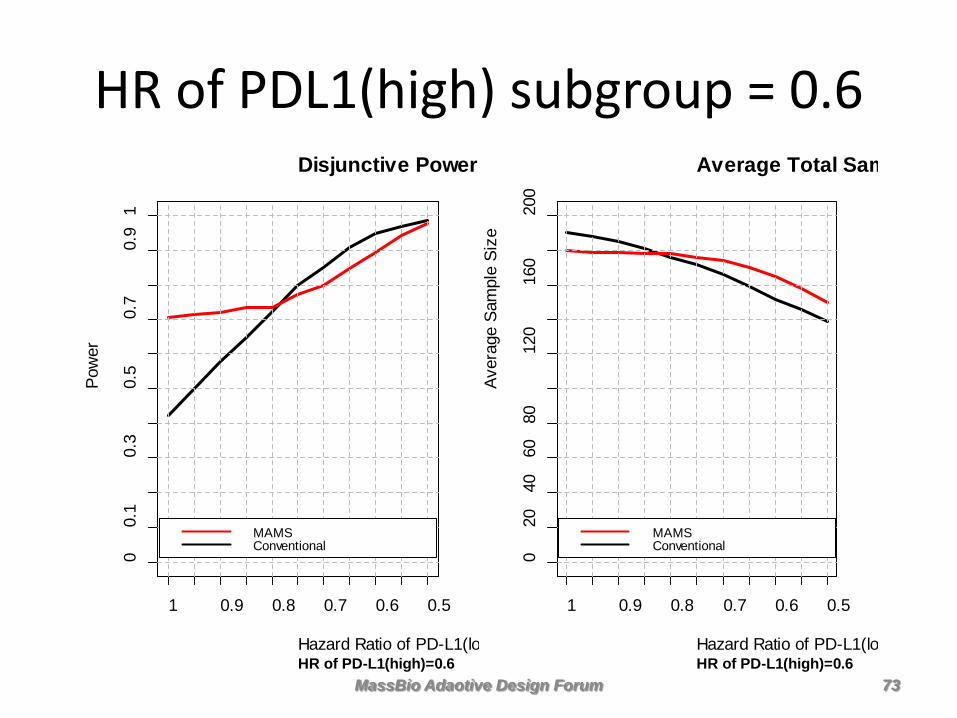
HR of PDL1(high) subgroup = 0.6 Disjunctive Power
HR of PD-L1(high)=0.6Hazard Ratio of PD-L1(lo
Pow
er
1 0.9 0.8 0.7 0.6 0.5
00.
10.
30.
50.
70.
91
MAMSConventional
Average Total Sam
HR of PD-L1(high)=0.6Hazard Ratio of PD-L1(lo
Aver
age
Sam
ple
Size
1 0.9 0.8 0.7 0.6 0.5
020
4060
8012
016
020
0MAMSConventional
MassBio Adaotive Design Forum 73
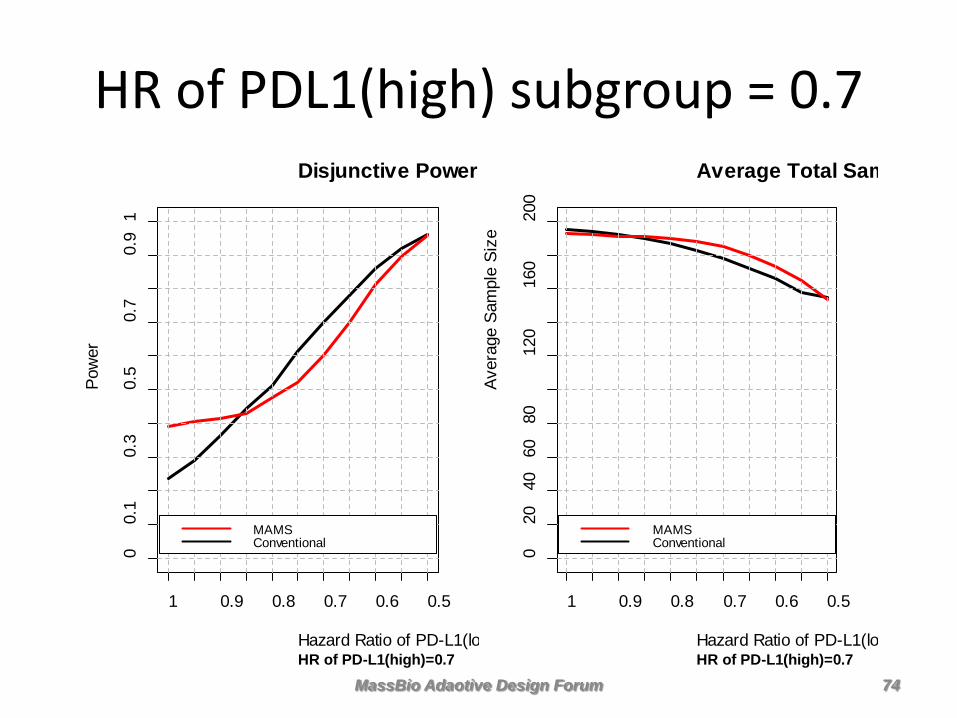
HR of PDL1(high) subgroup = 0.7 Disjunctive Power
HR of PD-L1(high)=0.7Hazard Ratio of PD-L1(lo
Pow
er
1 0.9 0.8 0.7 0.6 0.5
00.
10.
30.
50.
70.
91
MAMSConventional
Average Total Sam
HR of PD-L1(high)=0.7Hazard Ratio of PD-L1(lo
Aver
age
Sam
ple
Size
1 0.9 0.8 0.7 0.6 0.5
020
4060
8012
016
020
0MAMSConventional
MassBio Adaotive Design Forum 74
• MAMS has greater power and smaller expected sample size compared to conventional if PDL1 biomarker is predictive
• The greater the differential benefit from PDL1(high) in patients treated with Nivolumab, the more MAMS dominates
• But PDL1(high) and PDL1(low) patients benefit more or less equally on Nivolumab therapy, then the conventional design is better
• Choice of MAMS or conventional depends on prior belief that the novel therapy benefits on subgroup more than the other
Summary of Results
MassBio Adaotive Design Forum 75
Confidential and Proprietary Business Information. For Internal Use Only.
Implementing Adaptive Designs at Takeda
Nov 9, 2016 MassBio Adaptive Design Forum
Yi Liu PhD, Sr Manager Global Statistics Takeda Pharmaceuticals Inc Co. Mingxiu Hu, Zhaoyang Teng, Ken Nip, Hui-min Lin
Confidential and Proprietary Business Information. For Internal Use Only.
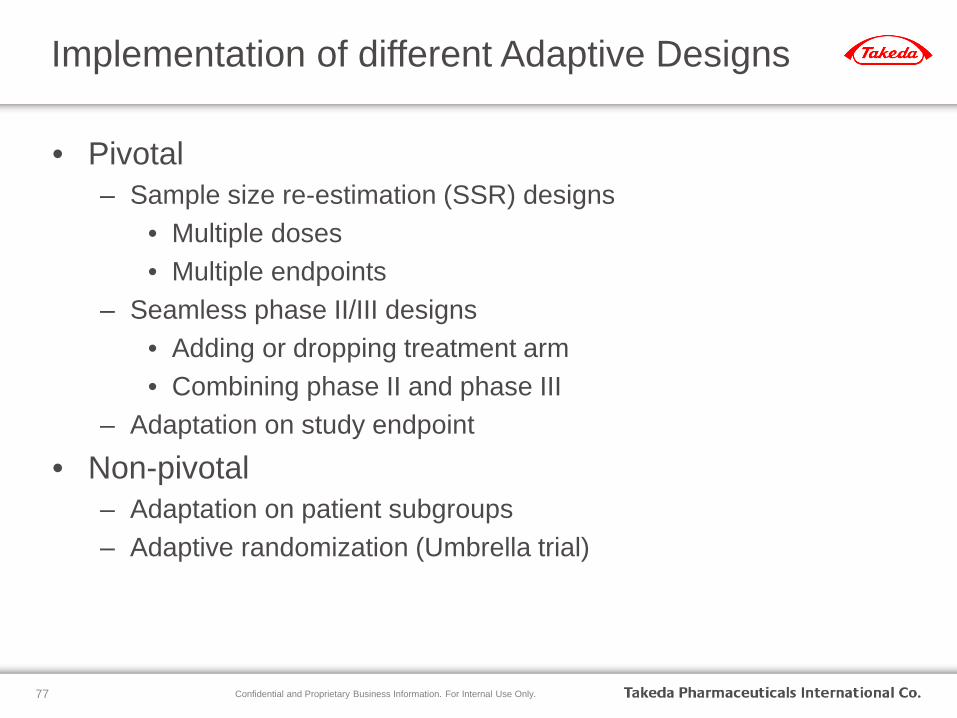
Implementation of different Adaptive Designs
• Pivotal – Sample size re-estimation (SSR) designs
• Multiple doses • Multiple endpoints
– Seamless phase II/III designs • Adding or dropping treatment arm • Combining phase II and phase III
– Adaptation on study endpoint
• Non-pivotal – Adaptation on patient subgroups – Adaptive randomization (Umbrella trial)
77
Confidential and Proprietary Business Information. For Internal Use Only.
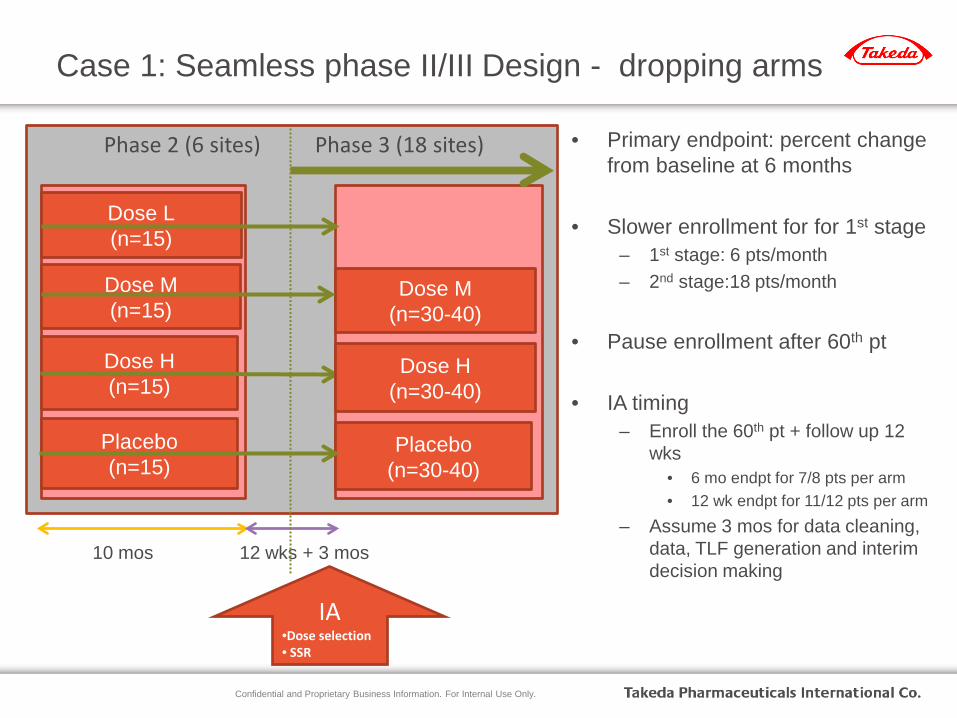
Case 1: Seamless phase II/III Design - dropping arms
IA •Dose selection • SSR
Phase 2 (6 sites) Phase 3 (18 sites)
Dose L (n=15)
Dose M (n=15)
Dose H (n=15)
Placebo (n=15)
Dose M (n=30-40)
Placebo (n=30-40)
10 mos 12 wks + 3 mos
Dose H (n=30-40)
• Primary endpoint: percent change from baseline at 6 months
• Slower enrollment for for 1st stage – 1st stage: 6 pts/month – 2nd stage:18 pts/month
• Pause enrollment after 60th pt
• IA timing
– Enroll the 60th pt + follow up 12 wks
• 6 mo endpt for 7/8 pts per arm • 12 wk endpt for 11/12 pts per arm
– Assume 3 mos for data cleaning, data, TLF generation and interim decision making
Confidential and Proprietary Business Information. For Internal Use Only.
IA Decision Rule
• One option is to calculate conditional power (CP) separately for each arm comparing to the placebo – If all CPL, CPM, CPH < 30%, stop for futility
– If top one CP is 30% higher than top two CP, then pick only the top one
dose, and do sample size recalculation
– Otherwise, select doses with top 2 CPs
• sample size recalculation based on CP for the selected doses and use the
smaller sample size among them.
• Alternative approaches:
– Dose response modeling including MCP-Mod
Confidential and Proprietary Business Information. For Internal Use Only.
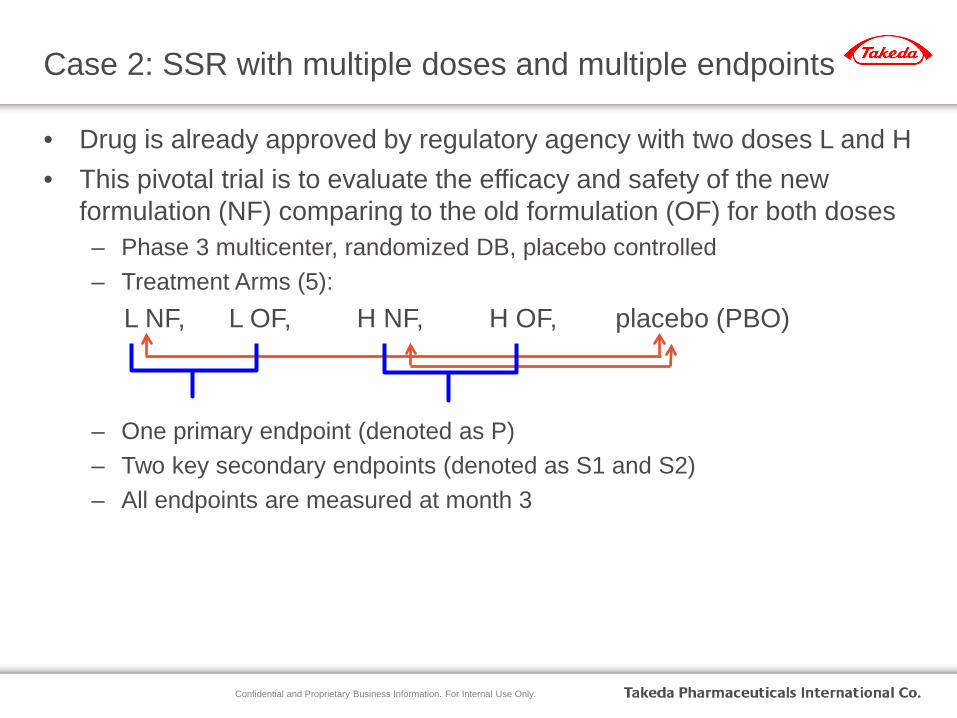
Case 2: SSR with multiple doses and multiple endpoints
• Drug is already approved by regulatory agency with two doses L and H • This pivotal trial is to evaluate the efficacy and safety of the new
formulation (NF) comparing to the old formulation (OF) for both doses – Phase 3 multicenter, randomized DB, placebo controlled – Treatment Arms (5):
L NF, L OF, H NF, H OF, placebo (PBO)
– One primary endpoint (denoted as P) – Two key secondary endpoints (denoted as S1 and S2) – All endpoints are measured at month 3
Confidential and Proprietary Business Information. For Internal Use Only.
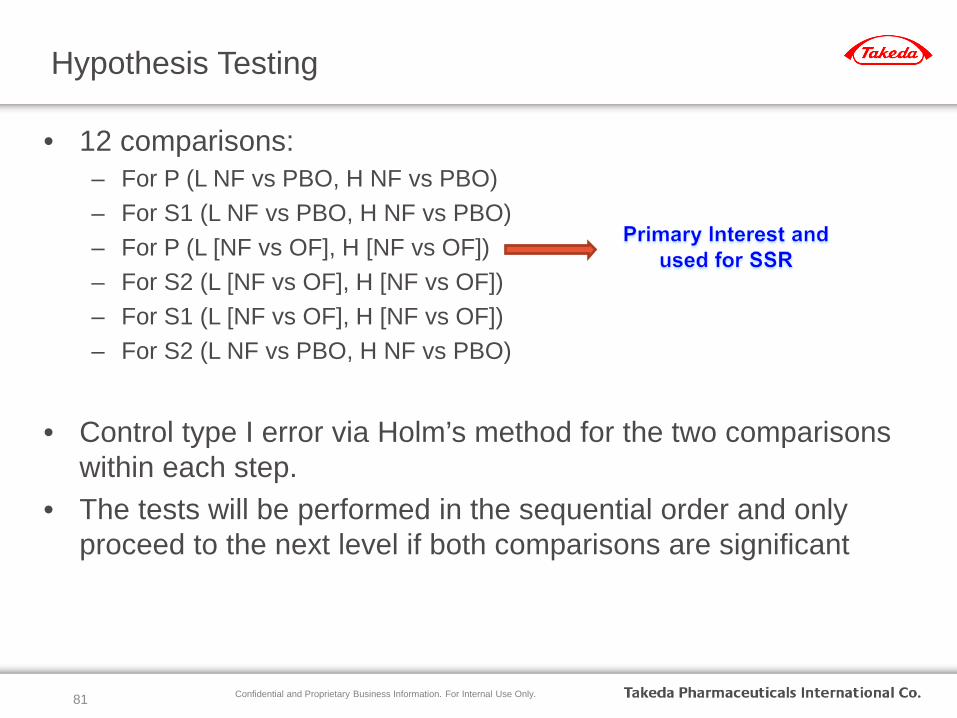
• 12 comparisons: – For P (L NF vs PBO, H NF vs PBO) – For S1 (L NF vs PBO, H NF vs PBO) – For P (L [NF vs OF], H [NF vs OF]) – For S2 (L [NF vs OF], H [NF vs OF]) – For S1 (L [NF vs OF], H [NF vs OF]) – For S2 (L NF vs PBO, H NF vs PBO)
• Control type I error via Holm’s method for the two comparisons
within each step. • The tests will be performed in the sequential order and only
proceed to the next level if both comparisons are significant
Hypothesis Testing
81
Confidential and Proprietary Business Information. For Internal Use Only.
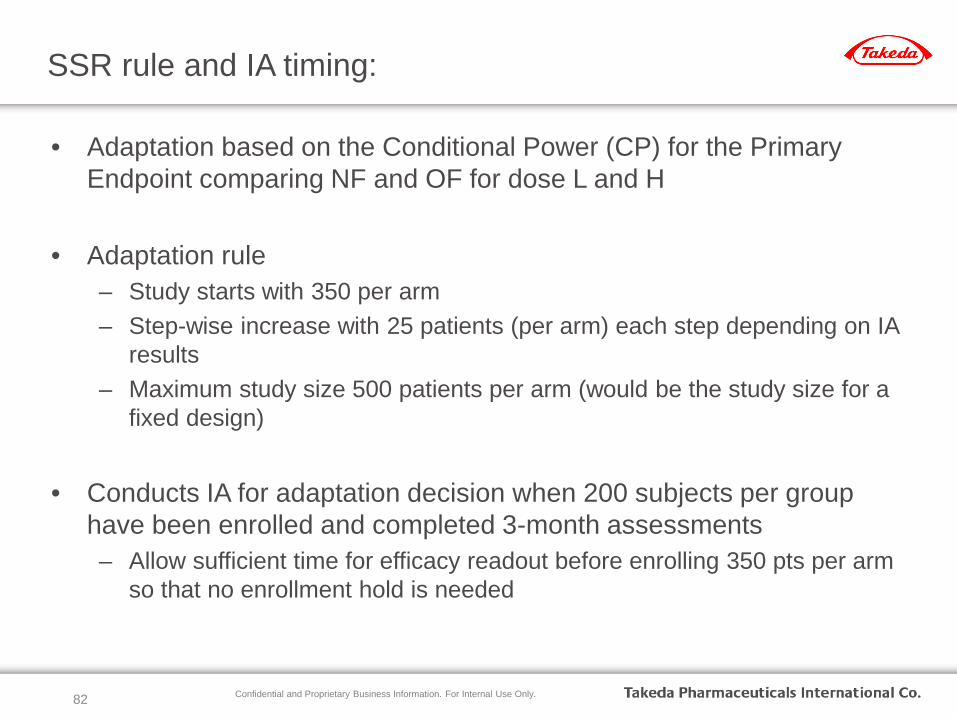
• Adaptation based on the Conditional Power (CP) for the Primary Endpoint comparing NF and OF for dose L and H
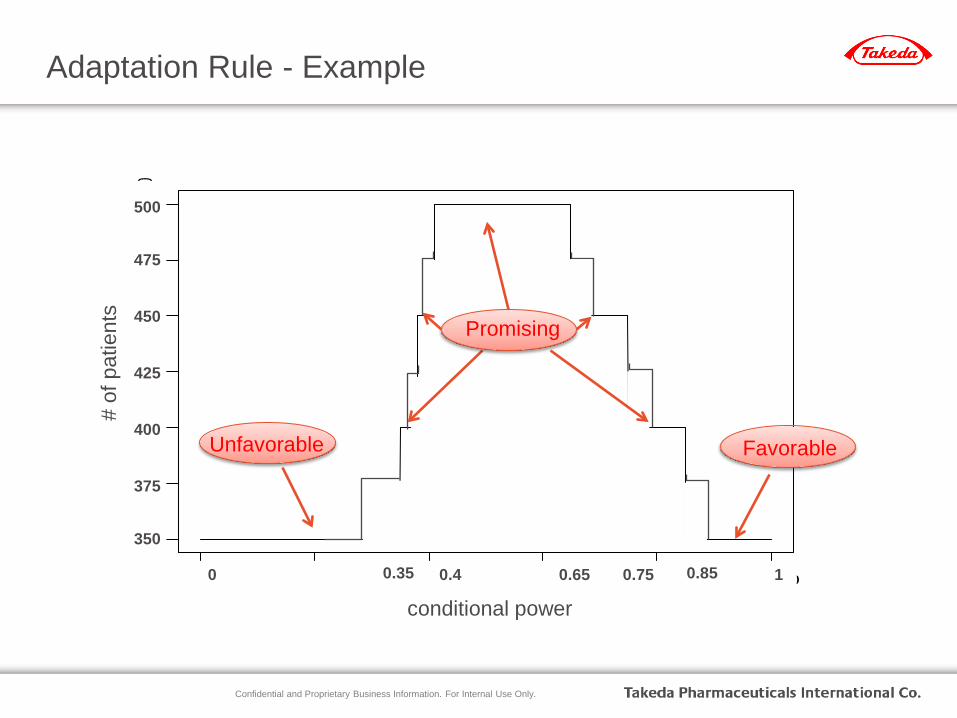
• Adaptation rule – Study starts with 350 per arm – Step-wise increase with 25 patients (per arm) each step depending on IA
results – Maximum study size 500 patients per arm (would be the study size for a
fixed design)
• Conducts IA for adaptation decision when 200 subjects per group have been enrolled and completed 3-month assessments – Allow sufficient time for efficacy readout before enrolling 350 pts per arm
so that no enrollment hold is needed
SSR rule and IA timing:
82
Confidential and Proprietary Business Information. For Internal Use Only.
0.0 0.2 0.4 0.6 0.8 1.0
0.00
0.05
0.10
0.15
0.20
0.25
0.30
conditional power
samp
le siz
e inc
remen
tAdaptation Rule - Example
conditional power
# of
pat
ient
s
0.35 0.85
350
500
0.4 0.75 0.65 1 0
Unfavorable Favorable
375
400
425
450
475
Promising
Confidential and Proprietary Business Information. For Internal Use Only.
Outcome: • Interim analysis was conducted in 2015 • Results indicated that only 350 patients (minimum
sample size) per arm are needed • Saved 750 patients in total and $15 million in cost
assuming $20,000 per patient • Shortened development time • FA was conducted in 2016 and met statistical significance
of the primary comparison of interest
Study Outcome
84
Confidential and Proprietary Business Information. For Internal Use Only.
Case 3: SSR to shorten development timeline
• Study setting – Two primary endpoints
• Response Rate/PFS – Accelerated approval – “surrogate” endpoint
• PFS/OS – Full/regular approval – longer time to mature
– Two analysis time points • ORR test first at IA • PFS test at FA with the possibility of early stopping at IA for
overwhelming efficacy
Confidential and Proprietary Business Information. For Internal Use Only.
Why adaptive
• Rare disease and slow enrollment – Difficult to run a randomized trial with time-to-event
endpoint, unless use very aggressive assumption on effect size
• Limited knowledge on effect size – Need an IA to re-estimate the sample size more accurately
Confidential and Proprietary Business Information. For Internal Use Only.
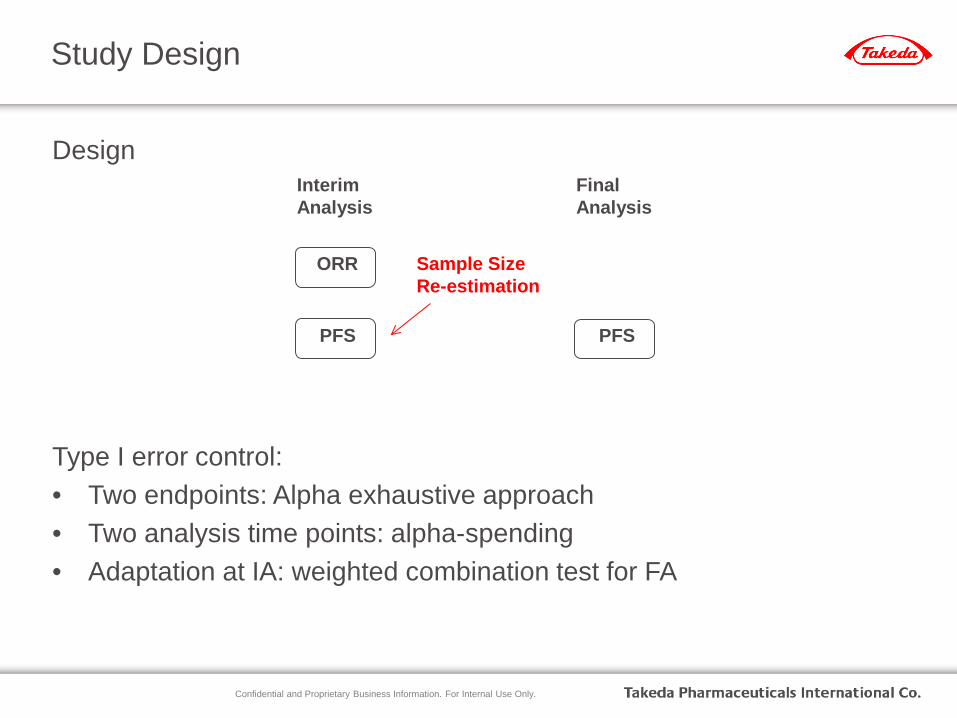
Design Type I error control: • Two endpoints: Alpha exhaustive approach • Two analysis time points: alpha-spending • Adaptation at IA: weighted combination test for FA
Study Design
Interim Analysis
Final Analysis
ORR
PFS PFS
Sample Size Re-estimation

Confidential and Proprietary Business Information. For Internal Use Only.
Alpha Exhaustive Design
ORR not significant
PFS significant
Interim Analysis
Final Analysis
ORR
α=0.0125 PFS α=0.0245
PFS α=0.0124
ORR α=0.0125
ORR significant PFS
α=0.0015
PFS α=0.0004
PFS not significant
PFS not significant
Sample Size Re-estimation
ORR PFS
α=0.0125
α=0.0125
significant
significant
α=0.0125+0.0125=0.025
Not significant α=0.0125+0.125=0.025
Between Two Primary Endpoints
Confidential and Proprietary Business Information. For Internal Use Only.
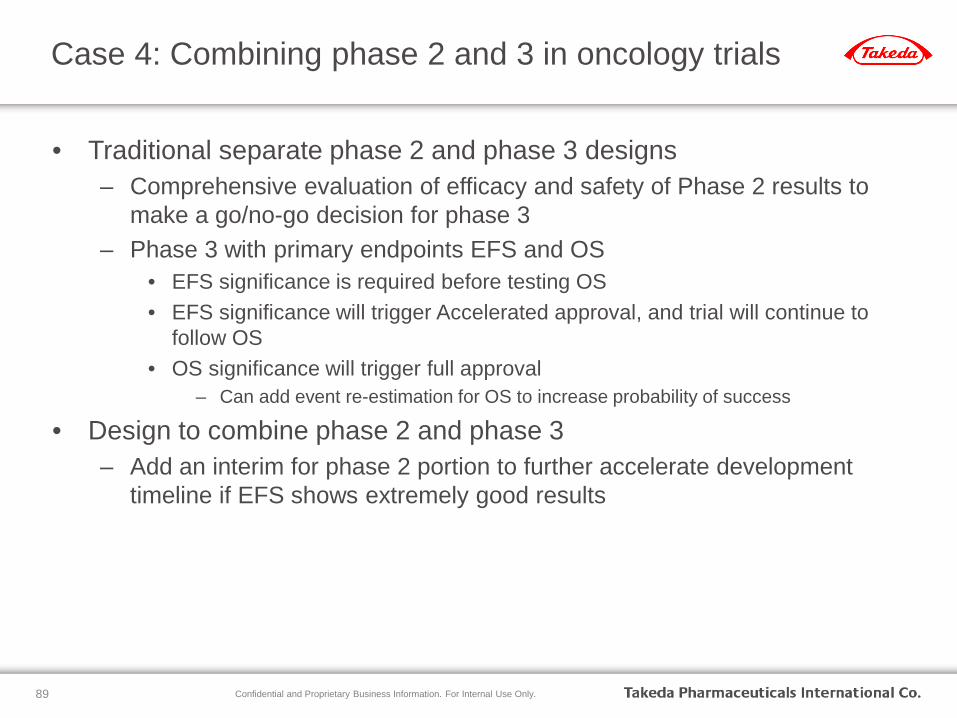
Case 4: Combining phase 2 and 3 in oncology trials
• Traditional separate phase 2 and phase 3 designs – Comprehensive evaluation of efficacy and safety of Phase 2 results to
make a go/no-go decision for phase 3 – Phase 3 with primary endpoints EFS and OS
• EFS significance is required before testing OS • EFS significance will trigger Accelerated approval, and trial will continue to
follow OS • OS significance will trigger full approval
– Can add event re-estimation for OS to increase probability of success
• Design to combine phase 2 and phase 3 – Add an interim for phase 2 portion to further accelerate development
timeline if EFS shows extremely good results
89
Confidential and Proprietary Business Information. For Internal Use Only.
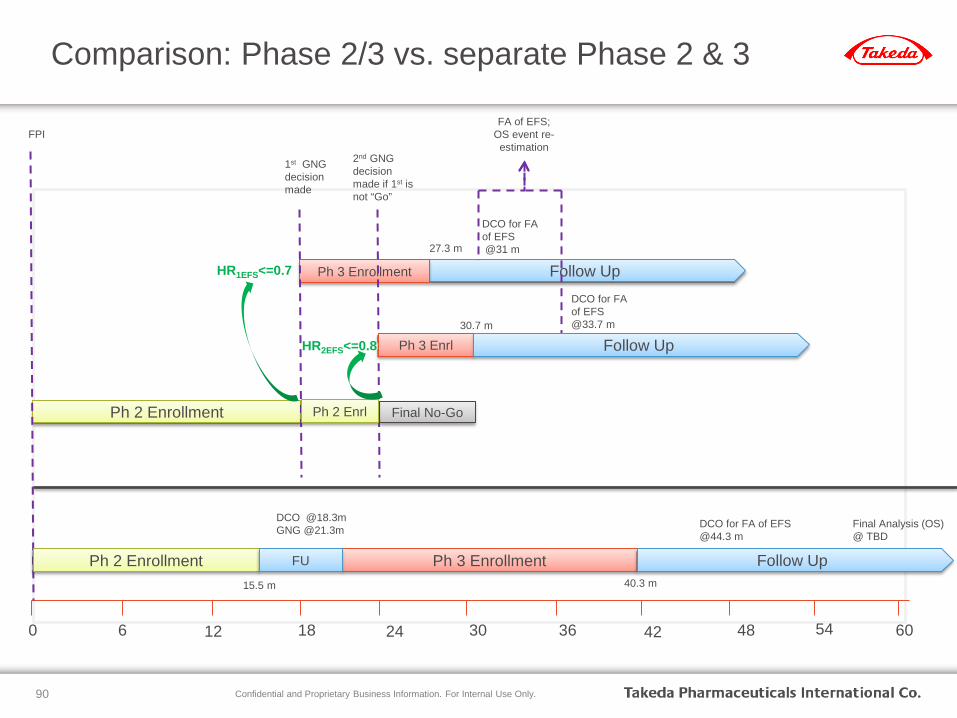
Comparison: Phase 2/3 vs. separate Phase 2 & 3
90
Ph 2 Enrollment
Follow Up 27.3 m
DCO for FA of EFS @31 m
Ph 3 Enrollment HR1EFS<=0.7
Final No-Go
0 30 24 18 6 12 48 36 42 54 60
FPI
1st GNG decision made
2nd GNG decision made if 1st is not “Go”
FA of EFS; OS event re-estimation
Ph 2 Enrl
Ph 3 Enrl HR2EFS<=0.8 Follow Up
DCO for FA of EFS @33.7 m 30.7 m
Ph 3 Enrollment Follow Up
DCO for FA of EFS @44.3 m
Final Analysis (OS) @ TBD
40.3 m
Ph 2 Enrollment FU
DCO @18.3m GNG @21.3m
15.5 m
Confidential and Proprietary Business Information. For Internal Use Only.
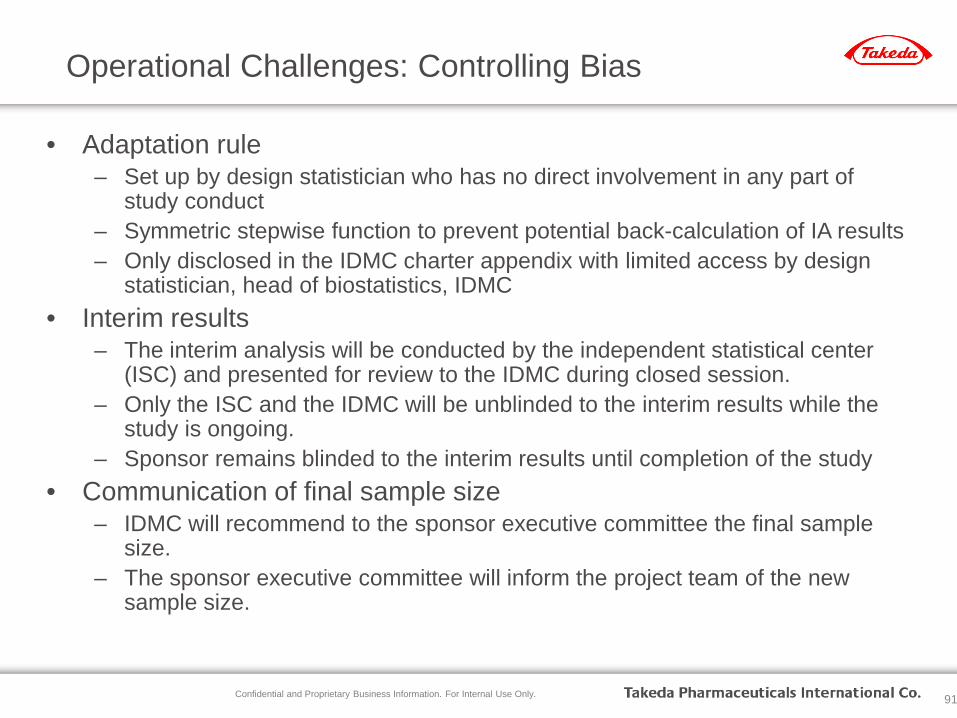
Operational Challenges: Controlling Bias
• Adaptation rule – Set up by design statistician who has no direct involvement in any part of
study conduct – Symmetric stepwise function to prevent potential back-calculation of IA results – Only disclosed in the IDMC charter appendix with limited access by design
statistician, head of biostatistics, IDMC • Interim results
– The interim analysis will be conducted by the independent statistical center (ISC) and presented for review to the IDMC during closed session.
– Only the ISC and the IDMC will be unblinded to the interim results while the study is ongoing.
– Sponsor remains blinded to the interim results until completion of the study • Communication of final sample size
– IDMC will recommend to the sponsor executive committee the final sample size.
– The sponsor executive committee will inform the project team of the new sample size.
91
Confidential and Proprietary Business Information. For Internal Use Only.
Thank You!
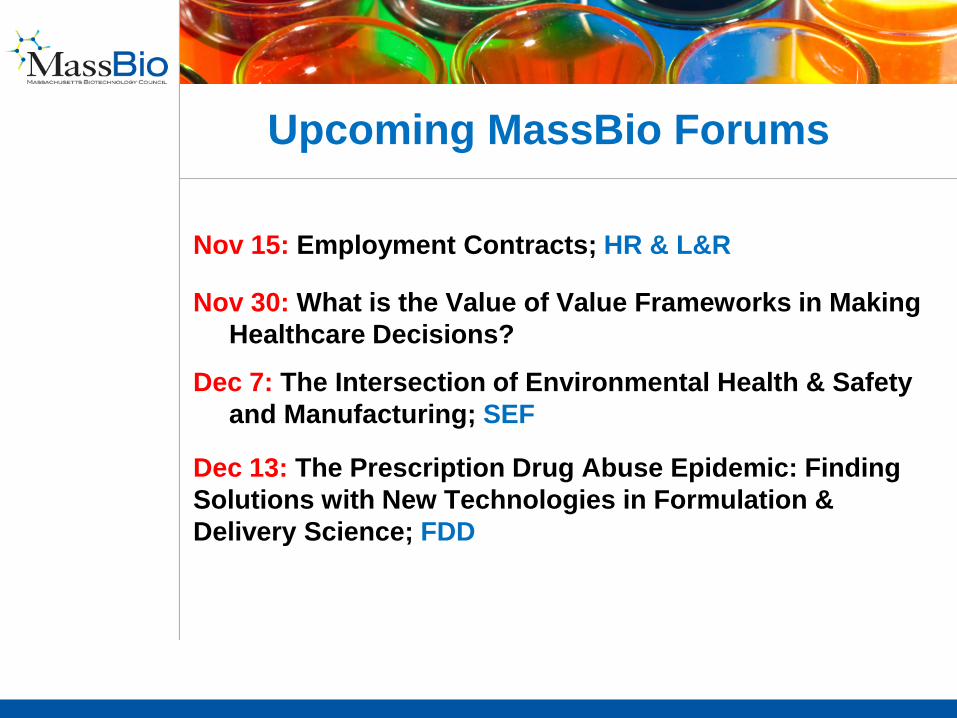
Upcoming MassBio Forums
Nov 15: Employment Contracts; HR & L&R
Nov 30: What is the Value of Value Frameworks in Making Healthcare Decisions?
Dec 7: The Intersection of Environmental Health & Safety and Manufacturing; SEF
Dec 13: The Prescription Drug Abuse Epidemic: Finding Solutions with New Technologies in Formulation & Delivery Science; FDD