
Study: Cross-Platform Video Ad Effectiveness by Nielsen & AdColony

21/03/2012
1
A d M ti d lA d M ti d lAndrew MartindaleAndrew Martindale
Effectiveness of Transverse Road Markings on reducing vehicle speedsvehicle speeds
Effectiveness of Transverse Road Markings on Reducing Vehicle Speeds
Andrew Martindale - Transport Engineer
Cherie Mason – Senior Road Safety Engineer
NZTA research report 423

21/03/2012
2
Overview
• BACKGROUND• WHY ARE WE DOING THISWHY ARE WE DOING THIS
• NZ’S SPEED PROBLEM AND HAZARDS
• DEFINITIONS
• NZ & INTERNATIONAL APPLICATIONS
• FIELD TRIAL • LOCATION
• MARKING ARRANGEMENT• MARKING ARRANGEMENT
• TRIAL RESULTS
• CONCLUSIONS
• POST TRIAL
NZ’s Speed Problem
• Driving over the speed limit or too fast for the conditions is a major cause of safety problems on NZ rural roads.
45Percentage of Contributing Factors in Fatal crashes 2006 2010 New Zealand
39
34
24
28
1513
3431
37
23
1215
20
25
30
35
40
Percentage of Contributing Factors in Fatal crashes 2006-2010 – New Zealand
Source: Crash Analysis System – Fatal crashes 2006-2010
8
0
5
10
Alcohol Too Fast Poor Handling Poor Obsveration Failed to Give Way/Stop
Road Factors
Fatal Only Urban Fatal Only Rural

21/03/2012
3
Hazards
High Speed approaches to :
Curves Intersections
Bridges Motorway slip roadsBridges Motorway slip roads
Changes in environment ie rural to urban
Hazards Treatment
• Traditional speed mitigation measures for approaches to hazards:
• road signs & markings are the most widelyroad signs & markings are the most widely used & cost effective ways to influence driver behaviour.
Source: nzta.govt.nz

21/03/2012
4
Hazard Treatment
• Sign Clutter• Drivers can be confronted with too many signs, limiting their effectivenessDrivers can be confronted with too many signs, limiting their effectiveness
on hazard approaches.
Source: (Left) http://www.dailymail.co.uk/news/article-513953 (Right) PIN/ www.funonthenet.in
Alternative Devices
• Alternative devices (such as perceptual countermeasures) p p )or measures that can inform a driver sub-consciously to modify their behaviour of the upcoming road environment, are now being considered i.e.
transverse road markings.
Source: (Top) “Speed change management for New Zealand roads” (Charlton S and P Bass, 2006) (Bottom) Opus Road Safety PIN

21/03/2012
5
Definitions: Transverse Road Markings
• Transverse road markings are a speed mitigation device. They can be generally defined as:
“A series of marked (either flat or raised) transverse bars placedA series of marked (either flat or raised) transverse bars placed across the road in the direction of traffic flow”
• It is thought that transverse markings either:
1. Give a driver the sense of acceleration through an optical illusion in the driver’s visual field
2. Act as large warning device, which is difficult for a driver to ignore.
Source: “Speed Reduction Mechanisms of Transverse Lines” (Godley et al, 2000)
Scope of Research
• to report on the effectiveness and application of previous transverse road marking trials both nationally and internationallyinternationally
• to develop an appropriate layout and methodology for field testing in a New Zealand environment
• to conduct field trials at two locations on New Zealand roads
• to provide evidenced-based material that could aid the development of best practice guidelines and recommendations for the industry.y

21/03/2012
6
NZ and International Literature
• Review of standards and guidelines and current practice in:Review of standards and guidelines and current practice in:
• NZ
• International
• UK
• Australia
USA• USA
NZ: Simulator trials
• NZ research using driving simulators for a number of trials of transverse road markings/perceptual countermeasures
• The trials showed speed reductions and/or h i l itichanges in lane position
for transverse markings in high speed rural environments.
Source: “Development of a Road Safety Engineering Modelling Tool”, 2003, Charlton, S.G

21/03/2012
7
NZ: Transverse Markings
• In NZ no official field trials involving speed assessment had been documented prior to this NZTA project.p p j
• Not mentioned in current NZ legislation, guidelines or design standards.
Source: Google Pro Licence
International: Transverse Road Markings
• Research into understanding their effects and properties completed in Australia, UK & USA. p ,
• Used extensively at motorway off-ramps and roundabouts in the UK.
Source: (left) Helliar-Symons et al, 1981 (right) high-speed curve layout in Milwaukee (Gates et al 2007)

21/03/2012
8
International: Transverse Road Markings
Pacific Highway in New South Wales, Australia (photo courtesy of Google Earth Pro License)
Key Points from Research
• Various layouts (evenly spaced, logarithmically decreasing lines, colour of lines, length and width of lines, distance between the end of the treatment and the hazard etc) have been used and )there have been contradictory findings.
• Regardless of the marking layout & site application, reductions in mean & 85th percentile speeds were typically found on hazard approaches if installed.
• In NZ, it provides an opportunity to
reduce fatal and serious injury crashes
caused by speeding on high speed rural
hazard approaches.
Source: http://www.nzpaimages.co.nz/previews//200911/73018_4
21/03/2012
9
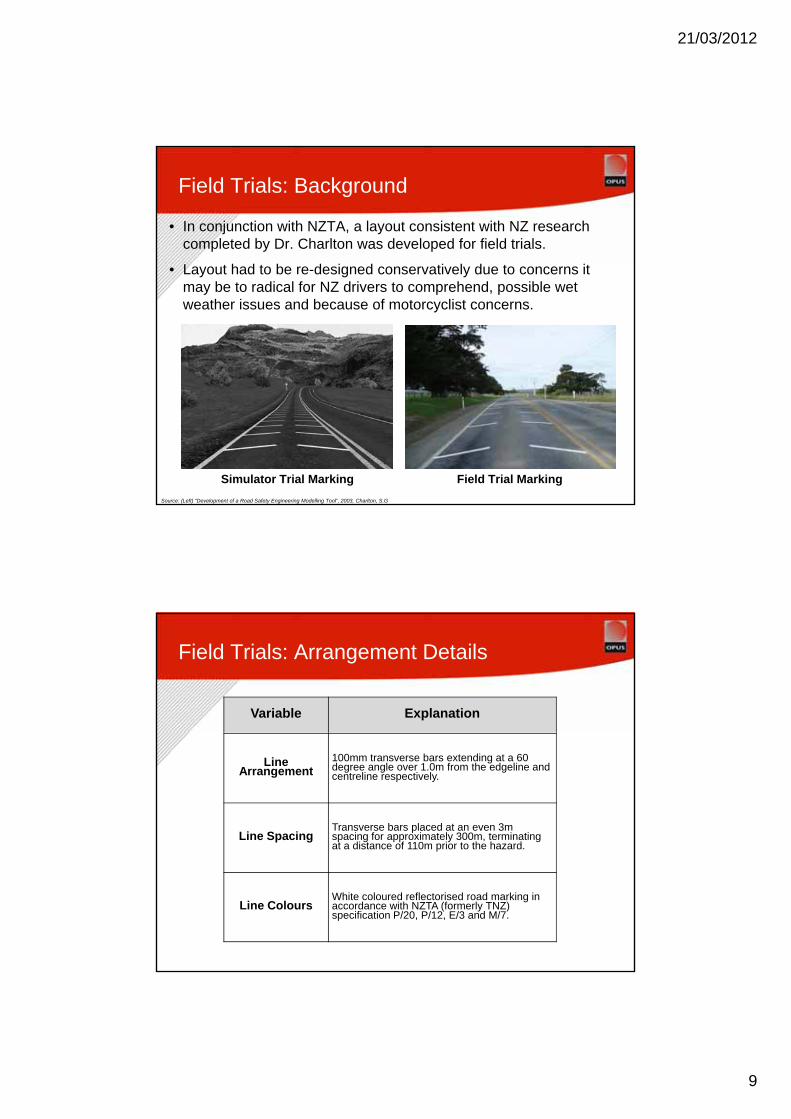
Field Trials: Background
• In conjunction with NZTA, a layout consistent with NZ research completed by Dr. Charlton was developed for field trials.
L t h d t b d i d ti l d t it• Layout had to be re-designed conservatively due to concerns it may be to radical for NZ drivers to comprehend, possible wet weather issues and because of motorcyclist concerns.
Simulator Trial Marking Field Trial Marking
Source: (Left) “Development of a Road Safety Engineering Modelling Tool”, 2003, Charlton, S.G
Field Trials: Arrangement Details
Variable Explanation
Line Arrangement
100mm transverse bars extending at a 60 degree angle over 1.0m from the edgeline and centreline respectively.
Line SpacingTransverse bars placed at an even 3m spacing for approximately 300m, terminating at a distance of 110m prior to the hazard.
Line ColoursWhite coloured reflectorised road marking in accordance with NZTA (formerly TNZ) specification P/20, P/12, E/3 and M/7.
21/03/2012
10
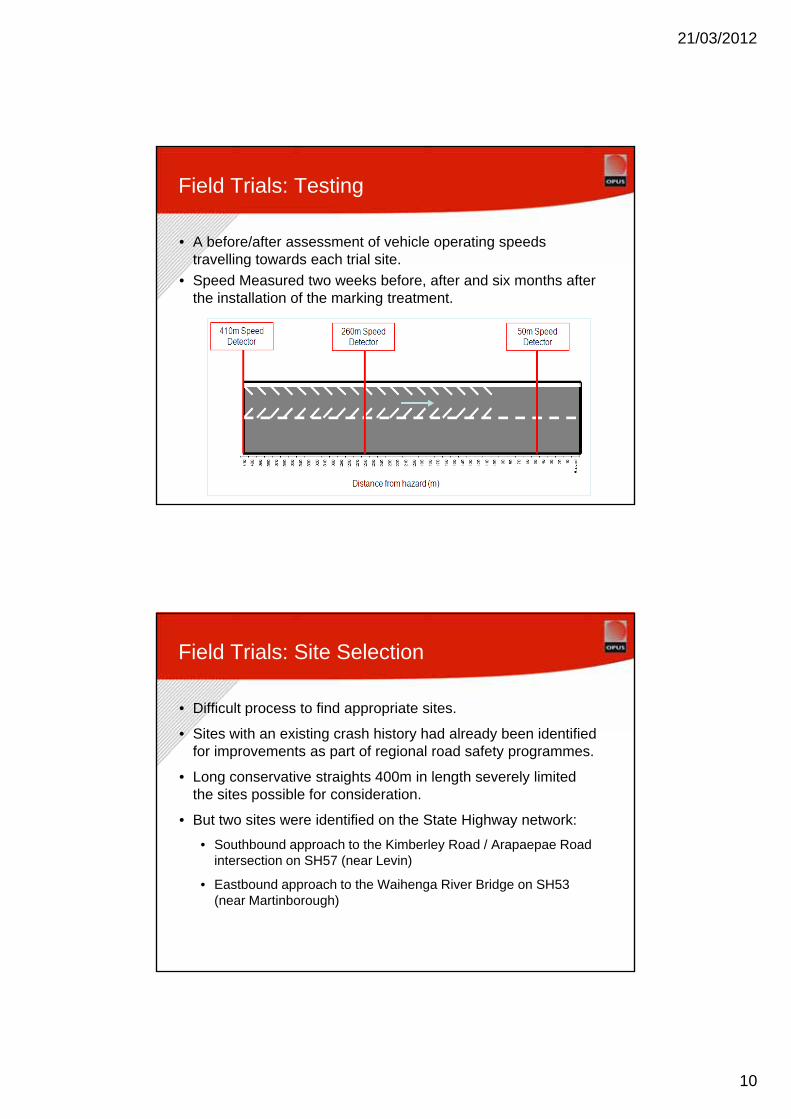
Field Trials: Testing
• A before/after assessment of vehicle operating speeds travelling towards each trial site.g
• Speed Measured two weeks before, after and six months after the installation of the marking treatment.
Field Trials: Site Selection
• Difficult process to find appropriate sites.
• Sites with an existing crash history had already been identified• Sites with an existing crash history had already been identified for improvements as part of regional road safety programmes.
• Long conservative straights 400m in length severely limited the sites possible for consideration.
• But two sites were identified on the State Highway network:
• Southbound approach to the Kimberley Road / Arapaepae Road intersection on SH57 (near Levin)
• Eastbound approach to the Waihenga River Bridge on SH53 (near Martinborough)
21/03/2012
11
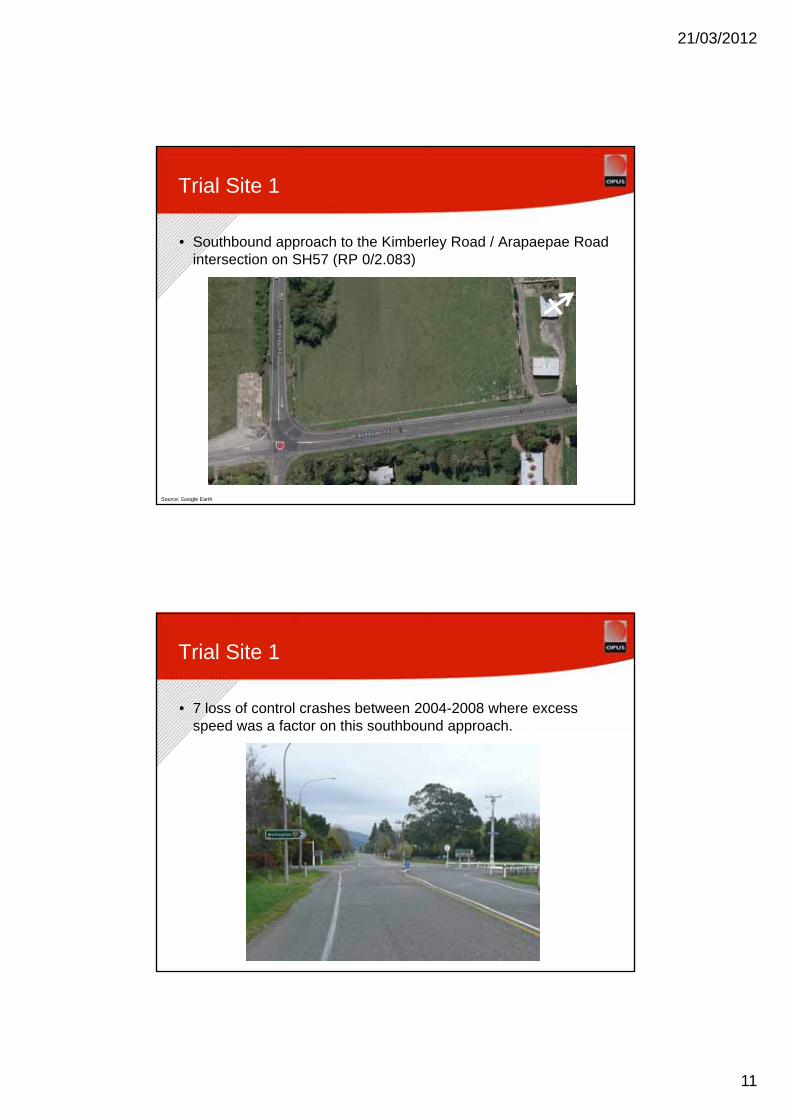
Trial Site 1
• Southbound approach to the Kimberley Road / Arapaepae Road intersection on SH57 (RP 0/2.083)( )
Source: Google Earth
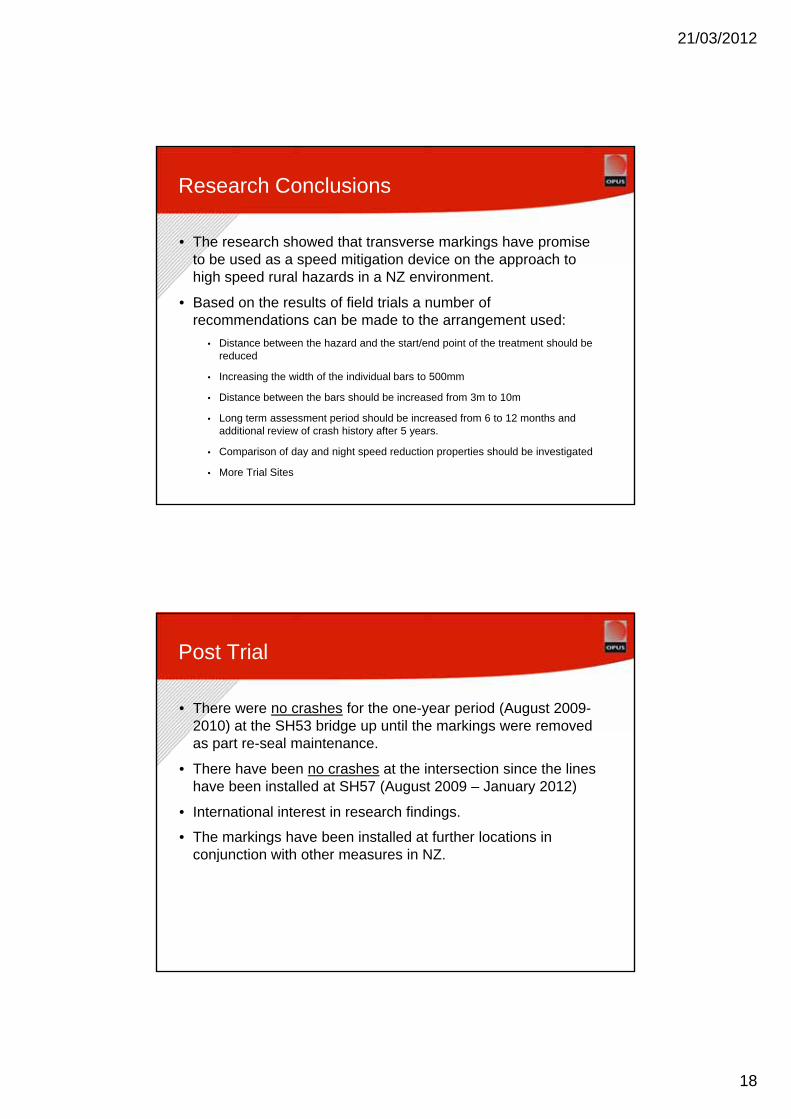
Trial Site 1
• 7 loss of control crashes between 2004-2008 where excess speed was a factor on this southbound approach.p pp

21/03/2012
12
Trial Site 2
• Eastbound approach to the Waihenga River Bridge on SH53 (RP 0/14.755)( )
Source: Google Earth
Trial Site 2
• Safety issues with the bridge not very wide. Drivers approaching it too fast without seeing farm traffic using the pp g g gbridge

21/03/2012
13
Installation
• Integrated Traffic Solutions installed the markings for us at both trial sites. Took about 3 hours per site to install.p
• $2,500 per site, but more than half of cost due to TM.
Before & After Photos
• Site 1 – 410m out from hazard

21/03/2012
14
Before & After Photos
• Site 1 – 260m out from hazard
Before & After Photos
• Site 2 – 410m out from hazard

21/03/2012
15
Before & After Photos
• Site 2 – 260m out from hazard
Results – Overall Speed Change
• At Trial Site 1 vehicle speeds reduced at all measurement locations in the long term (statistically)g ( y)

21/03/2012
16
Results – Overall Speed Change
• At Trial Site 2 vehicle speeds dropped at both the start & end of the treatment length (statistically) g ( y)
Results – Other Statistics
• The transverse lines affected daily commuter and weekend traffic equally.q y
Source: httpwww.motorhomehire.co.nzimages4berth_deluxe_sm.jpg

21/03/2012
17
Results – Other Statistics
• The transverse line marking arrangement had the same effect on drivers of different vehicle classes.
Source: httpwww.roadtransport.comblogsbig-lorry-blogTRUCK%20PHOTOS%20NZ%20SEPT%2008%20013%20(2).jpg
Results - Summary
• Largest speed reduction effects were clearly at the start of the marking treatment.g
• Drivers have appeared to slow down out of precaution due to the alerting properties of the lines.
• Because of the length of the marking treatment, drivers had enough time to return to their pre installation speed at the treatment mid-point.
B t d i lik l t b f th i l f• But, drivers are likely to be more aware of the visual cues of the intersection/bridge which is why they arrived at a reduced speed 50m from the hazard.
21/03/2012
18
Research Conclusions
• The research showed that transverse markings have promise to be used as a speed mitigation device on the approach to p g pphigh speed rural hazards in a NZ environment.
• Based on the results of field trials a number of recommendations can be made to the arrangement used:
• Distance between the hazard and the start/end point of the treatment should be reduced
• Increasing the width of the individual bars to 500mm
• Distance between the bars should be increased from 3m to 10m
• Long term assessment period should be increased from 6 to 12 months and additional review of crash history after 5 years.
• Comparison of day and night speed reduction properties should be investigated
• More Trial Sites
Post Trial
• There were no crashes for the one-year period (August 2009-2010) at the SH53 bridge up until the markings were removed ) g p gas part re-seal maintenance.
• There have been no crashes at the intersection since the lines have been installed at SH57 (August 2009 – January 2012)
• International interest in research findings.
• The markings have been installed at further locations in conjunction with other measures in NZconjunction with other measures in NZ.

21/03/2012
19
Post Trial
Questions?

21/03/2012
20
Session G:Session G: Safety