AD-AOG9 672 NAVAL RESEARCH LAB WASHINGTON … filead-aog9 672 naval research lab washington dc f/6...
55
AD-AOG9 672 NAVAL RESEARCH LAB WASHINGTON DC F/6 20/9 BEAM GENERATED VORTICITY AND CONVECTIVE CHANNEL MIXING. (U) SEP B0 .J P BORIS, .J M PICONE UNLASSIFIED NRL-RR-43277 NL
Transcript of AD-AOG9 672 NAVAL RESEARCH LAB WASHINGTON … filead-aog9 672 naval research lab washington dc f/6...
AD-AOG9 672 NAVAL RESEARCH LAB WASHINGTON DC F/6 20/9BEAM GENERATED VORTICITY AND CONVECTIVE CHANNEL MIXING. (U)SEP B0 .J P BORIS, .J M PICONE
UNLASSIFIED NRL-RR-43277 NL
11111 I . 12 .0BB-
11111r --1111.25 14 1.6
MICROCOPY RI 1tJIloN l HART

W-i
SECURITY CLASSIFICAIOON OF TNIS PAGE (hton fle Enarcedm)
______________________________________READ INSTRUCTIONSt ~~~RER:LRT D UEN TION PAGE RA mulmRE T BEN T PEFORE COMPLETING FORM
N R. M e 4 1 1 M -JZ. G VT ACCESSION NO L E:T AT L G N M E
TITLE (and Sublitle) s. TYPE of REPORT a PERIOD COVERED
S"EAM ENERATEDy2RTICITY AND CONVECTIVE Interim report on a continuingCHANNEL MIXING * , NRL problem
6 .. PERFORMING ORG. REPORT NUMBER
7. AUTHOR(s) I. CONTRACT OR GRANT NUMSER(a)
/ . . P. oris , . M. one
. PERFORMING ORGANIZATION NAME AND ADDRESS ,0. PROGRAM ELEMENT. PROJECT. TASK
Laboratory for Computational PhysicsNaval Research Laboratory.- 62-0580-0-0Washington, DC 20375
I,. CONTROLLING OFFICE NAME AND ADDRESS 12. REPORT DATENaval Surface Weapons Center, White Oak Sepawd I, W80" .Silver Spring, M aryland 20910 . '° - : - -- - -
5214. MONITORING AGENCY NAME A ADORESS(i differenl from Conllfeilg Office) IS. SECURITY CLASS. (of thl topo)
Unclassified
ISO. OECLASSIFICATION/DOWNGRADINGSCHEDULE
I1. DISTRIBUTION STATEMENT (of l4 Report)
Approved for public release; distribution unlimited.
I?. DISTRIBUTION STATEMENT (of Ihe eblracI entMd In Slock 20, It dlfferent fom Report)
IS. SUPPLEMENTARY NOTES
This research was sponsored by the Naval Surface Weapons Center under subtask -80-WRWO190
19. K(EY WORDS (Contilnue on rere olde If nftce.e'y o ideify lby bloct number)
Charged particle beamHydrodynamicsGas channel formationHole boring
2- 1, uRACT (Continue m revere old* It neceseiy and Id ietify by block number)
1 Asymmetries in density and pressure gradients exist when a beam deposits energy off center ina hot gaseous channel formed by a previous beam or discharge. These asymmetries, coupled with thenatural dynamics of the expanding compound channel, cause vortex filaments to be generated whichpropagate unabated long after motion would have ceased in a symmetric flow. This concentratedvorticity is a source of convective (turbulent) cooling of the hot channels. In this paper we presenta theory for the amount of vorticity generated as a function of asymmetry and system parameters
(Continued)
DO I ,,j 1473 EDITION of, I Nov es IS ooLETS/4 0102-014-56601 SECURITY C;.ASSIFICATION OF THIS PAGE (ftem DOr Enter,)
lowi
II +. + ... (

1 \ Z--6, Jql TY CLA5SIFICATION Of1 THIS PAGatflia4 DaEt e Ei..oo
2O... STRAC " (Continued)d cilibrate this theory using detailed numerical simulations. An estimate of the convective
mixing time for such composite channels is constructed using the strength of the asymmetry-generated vortex filaments as a source term.\
SICURII? CLASSIFICAION OF THIS PAGSf'WUn Date Botewoii
* I
CONTENTS
I. INTRODUCTION .................................................. I
11. MIXING-TIME E STM TI MA.................................E........ 4
III. AN APPROXIMATE VORTICITY INTEGRAL ...................................... 6
IV. DETAILED NUMERICAL SIMULATIONS .......................................... 15
V. SUMMARY AND CONCLUSIONS.................................................... 20
ACKNOWLEDGMENT........................................................................ 26
REFERENCES................................................................................. 26
Aoosligcai onT
Dist. special

BEAM GENERATED VORTICITY AND CONVECTIVE CHANNEL MIXING
I. INTRODUCTION
Recent theory and numerical computation at NRL have resulted in a theoretical formalism for
estimating persistent flows which mix cold ambient air into a beam-heated channel. In this paper we
also give a quantitative calibration of that formalism using detailed two-dimensional simulations. The
importance of determining the mechanisms and scaling laws governing the dynamics of a gaseous chan-
nel heated by a sequence of pulses is clear. One important application is the fixation of atmospheric
nitrogen by lightning.
The probable existence of such a cooling mechanism is well documented in NRL laser and
discharge data showing heated channels breaking up in a number of circumstances.' Data also exists on
"turbulent" cooling of multipulse channels from Astron2 (Fig. I). The "classical theory" curve in that
figure shows that the thermal conduction cooling rate is significantly slower than observed in
experiments-pointing to a convective "turbulent" mechanism. Any reasonable estimate of background
gas velocities falls orders of magnitude short of explaining the cooling rate, so a mechanism is needed
to convert curl-free fluid expansion which cannot mix into persistent vonicity which can.
The symmetric expansion of a cylindrical beam-heated channel causes no convective mixing per
se. but asymmetries, appearing either in the beam deposition or as density variations in the background
gas, permit the generation of vortex filaments. The sheared flow attending the motion and interaction
of these filaments mixes cold background gas into the heated channel at a rate which depends on the
strength of the induced voricity and thus ultimately on the fluid-dynamic asymmetries. Three types of
asymmetries can be identified:
Manuscript submitted July It. 1980.

BORIS AND PICONE
1. 2D distortions of the channel from a circular cross section,
2. 2D asymmetries from pulse displacement off the channel axis, and
3. 3D distortions such as characterize a lightning or spark channel.
In this paper we analyze the convective flow and calculate the related mixing rate for the second
possibility, a lateral displacement of the second and subsequent pulses from the center of the hot chan-
nel created by the first pulse. We then simulate the process numerically to calibrate our analytic results.
Figure 2 provides a schematic diagram of the situation which we are considering. A hot circular chan-
nel of characteristic radius So and depth PJOo is assumed to have reached a hydrostatic equilibrium by
the time a second pulse comes along displaced to the left by a distance X0. The initial characteristic
radius of the second pulse channel is R0 and it expands to RI, eventually coming to rest there as a
weak acoustic signal continues to propagate off to infinity. This simple 2D situation, shown in cross
section in Fig. 2, arises when the second pulse is being driven or is drifting out of the preformed hot,
low density channel. Perfectly passive effects such as transverse flows also can cause this displacement.
The radial expansion of the second pulse channel generates vorticity according to the two-
dimensional vorticity equation,
since the pressure gradient is not aligned with the density gradients present after the first pulse. As
depicted in Fig. 3, the resulting velocity distribution will be approximately the same as that of an
extended vortex filament pair located at (7, :t Y) and having respective strengths :t V, where
=" fO -dyf dx :(x,y. ). (2)
The bar over capital, V, has units of cm 2/sec and is an area integrated vorticity, to be distinguished
from lower case v and v, which are velocities and have units of cm/sec. Because of the two-
dimensional Cartesian geometry, only the z component of vorticity, , need be considered.
2
.....
NR. MEMORANDUM REPORT 4327
The vortex pair shown in Fig. 3 propagates horizontally at a speed which is roughly 1/4 that of the
fluid jetting along the x axis between the two oppositely rotating filaments. The time it takes a fluid
element at one side of the original channel (say x - SO) to reach the other side (x - -SO) will be used
as a measure of the mixing time T'ix- The resulting mixing time formula coupled with our analytic
approximation for the strength of the vortex filaments formed, gives a simple yet quite accurate expres-
sion for scaling laws and quantitative estimates.
In the next section the mixing time formula will be derived by analyzing the system shown in Fig.
3. This formula is then coupled with a dimensional-analysis approximation of the expansion-induced
vorticity to show that mixing of cool background gas with the heated channel interior due to this vorti-
city occurs on short timescales, relative to the cooling from molecular thermal conduction. The third
section analyzes the configuration of Fig. 2 and arrives at a useful analytic expression for the induced
vorticity to replace the less accurate dimensional analysis for V(,r) used to obtain the preliminary esti-
mates in Section ii. This analysis gives variations of integrated vorticity V with the non-dimensional
parameters characterizing the pulse strength, the lateral pulse displacement, the relative channel sizes,
and the original heated channel depth, all of which cannot be deduced from dimensional considerations
alone.
Section IV presents the results of detailed two-dimensional simulations of the problem depicted
schematically in Fig. 2. These computations not only validate the qualitative features predicted by the
analytic model, but they also allow us to calibrate the total vorticity integral quantitatively for strong
pulses. This allows us to define a meaningful channel expansion velocity needed for the theory. Appli-
cations of these calibrated formulae to NRL and LLL data in Section V indicate as good agreement
between predicted mixing times and observed mixing times (typically within a factor of two) as can.ea-
sonably be expected.
IJ

BORIS AND PICONE
11. MIXING-TIME ESTIMATE
We assume that the asymmetry induced flow field may be represented approximately as two com-
pact vortex filaments of strength * P at :1yj The azimuthal velocity induced by each of these decays as
/r away from the vortex center. The velocity of the fluid along the symmetry plane is the sum of
flows induced by each vortex separately. Figure 3 is a schematic of the situation with a sketch of the
variation of the fluid flow velocity along the x-axis shown. This velocity is given by
v(xO) - 2v# cost- P cose V . (3)xa+
where cos9 -4 _+72. The filaments are migrating in the same direction at a slower velocity,
v, (O,7) - -- (4)4w37
which we will ignore in the following integral estimates. This overall migration velocity will become
important when a series of pulses is being considered. In that case a quasi-steady state developes in
which the systematic migration of the integrated vorticity entrains cold fluid stochastically at the edges
of the hot turbulent channel.
To estimate the mixing time, we use Eq. (3) to calculate the time it takes a fluid element starting
at x - -So to reach x - So. The equation of motion for this element is
-vX(x,0) - 1 P) (5)dt W +
which can be integrated to give
dr r - f dC(x2 + (6)fo dt=-T.- y f.so
The quadrature can be performed and gives the following mixing time estimate:
- ir 3 + . (7)
where the vortex strength P is given by Eq. (2) and the "average" displacement of this vorticity above
the y - 0 plane is given formally by
I -I
_______ ___fy___ I
NRL MEMORANDUM REPORT 4327
To complete this estimate we need expressions for V and . generated by the off-center expansion
of the second pulse channel. The remainder of this paper is concerned with calculating analytically and
calibrating numerically an expression for V. A simple dimensional analysis allows us to make at least
crude estimates rather directly. From Eq. (1) it would appear that a number of size scales enter the
problem: So, the radius of the channel created by the first pulse; the characteristic scale lengths for the
pressure and density gradients- and the initial and final radii R0 and R I of the second, displaced channel
being formed. Fortunately most of these scales are either unimportant or expressible in terms of So. If
the first and second pulse deposit a like amount of energy, R 1 and So will be roughly equal and R 0 will
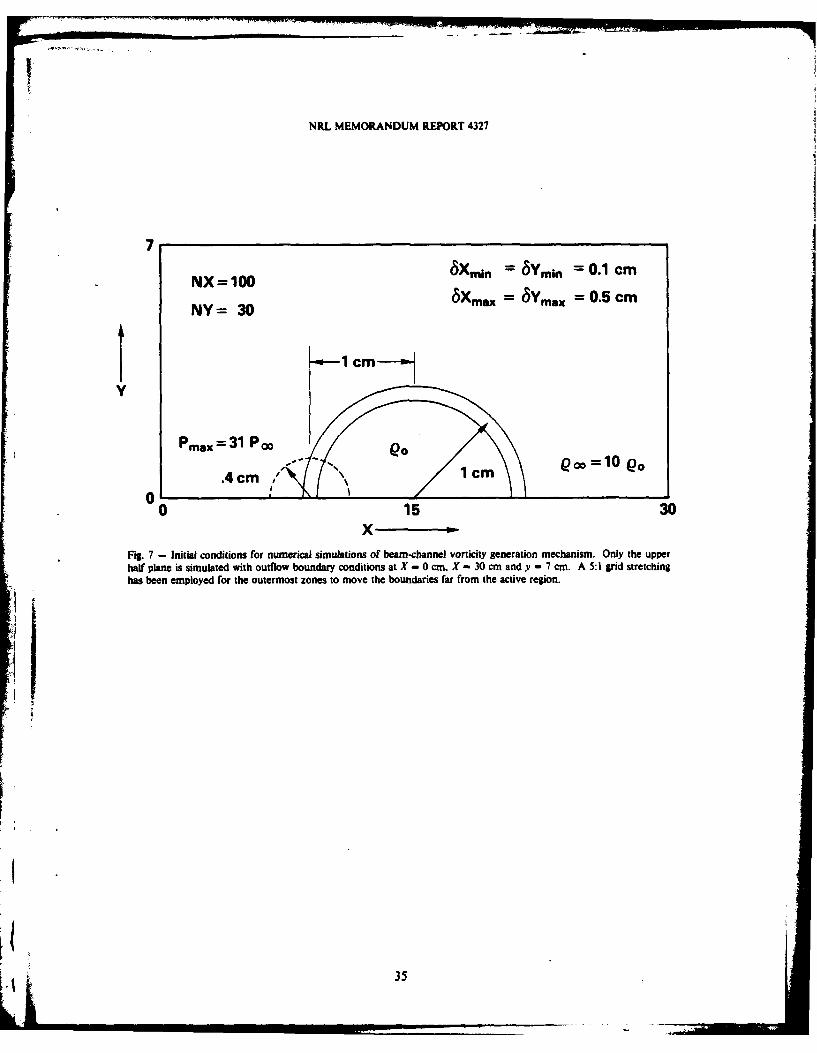
be a modest fraction of R 1. In the numerical simulations (Fig. 7), the second pulse initial radius
Ro - 0.4 cm, So - 1.0 cm, and the overpressure factor for the first pulse was 30. In this situation pres-
sure balance is achieved (adiabatically) when the density drops by a factor of 11.6 and the radius Ro
increases to RI - 1.4 cm - So.
Other simplifications are expected. Whether a shock expansion or an adiabatic expansion is being
driven by the energy deposition, the larger the pressure gradient the smaller the time over which it acts.
Thus the integrated vorticity is relatively insensitive to the shock thickness. Similarly, the density gra-
dient is integrated over space so the inner and outer densities enter, P0 and p., but the scale length of
S.the transition region (shown in Fig. 6 as a band centered at S - SO) can be neglected. It is reasonable
to expect and will in fact be shown that the maximum vorticity generation occurs when X0 - So. Thus
there are no small parameters arising as ratios of characteristic lengths unless we consider exceptionally
tightly focussed pulses in which case Ro << R, - So or only slight departures from the symmetric
superposition of the pulses in which case X0 << So.
The integrated vorticity V has units of cm 2/sec, a length times a velocity or a characteristic time
multiplied by a velocity squared. The characteristic velocity will be the expansion velocity. When the
energy deposition is fast, as in the problem of interest here, this velocity is a characteristic sound speed
c,. The characteristic time is the expansion duration (if the energy deposition is slow) or the sonic "
transit time Se/c,. Thus we expect
*11 ___
BORIS AND PICONE
V - c3SoF (9)
where F is a dimensionless form factor containing geometric effects, detailed hydrodynamics interac-
tions, and information about the channel and beam profiles. Cancellation effects leaving I V v as the
dominant contribution to the vorticity source term generally reduce F somewhat below unity. This will
be demonstrated below.
If we assume that ; F So, Eq. (7) for the mixing time becomes
1
For a strong pulse which heats the gas appreciably on passage, we shall assume F - -. Taking
5 x 10" cm/sec as a generic value for c, and choosing S0 - 1 cm gives
7.7x 1TIM~ 7.7 - 300,usec.
Sx~ 2
This 300 lssec "mixing time" from the dimensional analysis estimate of Eq. (10) is the time for cold
material from one side of a hot channel to cross the channel and reach the other side. True mixing of
hot and cold fluid will probably take somewhat longer because one or two rotations of the vortices will
be required to entrain and smear in an appreciable amount of the colder fluid. This "mixing" time,
however it is best defined, is clearly important when comparable to only a few pulse separation times.
In the next section an integration of the vorticity source term in Eq. (1) is performed to improve
on Eqs. (9) and (10), our dimensional analysis estimates. Using a few reasonable assumptions, a qua-
drature for integrated vorticity V is obtained which will display the various non-dimensional depen-
dences of the form/fudge factor Fin Eqs. (9) and (10).
III. AN APPROXIMATE VORTICITY INTEGRAL
Equation (2) defines the integrated vortex strength at any instant in time and will be used in con-
junction with Eq. (1) to develop an approximate analytic expression to replace Eq. (9) in the mixing
6

NRL MEMORANDUM REPORT 4327
time estimate Eq. (7). For our purposes we only need V(r), where r is a time sufficiently long that
expansion and vorticity generation is complete. Using the geometry of Fig. 1.
V(r) - fo'd fo'd f(, rdr 2 _1)
where the spatial integral is performed over the fluid outside the expanding cylinder R0 < R () 4 R1 .
We assume that this outside region (r > R ()) behaves incompressibly and the inside, beam-
heated region expands uniformly. Thus
vvt-uO)rv, (r) - for r 4 R (t) and (12)
v,(r,t) - U(t)R(t) for r > R(t)r
specifies the flow everywhere as a function of the heated region radius R () and velocity U(t) A (t).
This flow has a uniform but time-varying divergence inside the heated region and zero divergence out-
side. In fact, the fluid inside the just-heated channel will give up energy to the cold surrounding fluid
via shocks and a fraction of the pulse-deposited energy will even escape to -e as an acoustic wave. The
smooth shape of the expanded channels observed from ID hole-boring calculations3 and the computa-
jtional fact that most of the deposited energy stays close to the original pulse deposition lends hope for
the approximations implied by using the flow field (12).
As will soon be shown somewhat more explicitly, the important feature of vorticity generation is
how far radially each fluid element moves. Pressure gradients arising from accelerations of a fluid ele-
ment do not really contribute to vorticity in the present context. Because the fluid elements begin and
end their expansion-induced displacement at rest, the average acceleration is zero. The v V v vorticity
source term has the same sign throughout the expansion and consequently contributes more strongly to
the integrated vorticity.
7

BORIS AND PICONE
The velocity field (12) can be substituted into the fluid momentum equation for the outside
region and yields
dv, -v, + 8Vv, 1 (UR) U2 R 2 (13)
4: at 8r r at r 3
-- mp.
P
Since we are going to assume the motion behaves incompressibly in the outer region r > R (t), the
second term on the right hand side of Eq. (11) vanishes simplifying the integral considerably. The
acceleration is being taken in the radial direction with values strictly appropriate only when feedback of
the asymmetric density gradients on the driving expansion flow are small.
The theoretical model appears to work quite well for large density variations as well, a result that
is understandable in hindsight. The maximum vortex-induced flow speed which resides in the system is
much smaller than the maximum expansion speed. The vorticity is generated essentially instantane-
ously relative to the mixing timescale 'r. Thus the generation term can be calculated assuming that
the initial asymmetric density gradients do not change the expansion-driven pressure gradients and that
the vorticity which develops does not affect the density gradients during the relatively brief expansion.
Under these assumptions only the density gradient in the 0 direction need be crossed with the
radial pressure gradients. Using Eq. (13) and
S(14)
in Eq. (11) we obtain
P) fo dt f(, f 1. l d L I I(UR)2 I 1 (UR)1 115O dfJO ( p,)r1 pr 80 r r 8a (
We now change to the Lagrangian variables (ro, 00) where
r - r(t) - 1rj + R 2 (t) - R& and (16)
8
0--00.

NRL MEMORANDUM REPORT 4327
Then
r dr - ro dro (17)
and r () is the instantaneous radial position of a fluid element initially at r (0) - r0. Because the flow
described by Eq. (12) is incompressible, the continuity equation becomes
-- p V " V -0, (18)
and therefore
p(r(t), 9) - p(ro, 0). (19)
Thus Eq. (15) becomes
f)dtfod frd~ro ro -.L. B-(ro,0 r(U (20)
Note that the 0 gradient of p decreases as the expansion proceeds because the fluid elements are mov-
ing to larger radius while retaining the same 0 variation.
At this point we assume a general form for the density profile p (s) in the original low density
channel.
p (S) - p. e•ILP- (21)
where
s - Xf + r4 - 2Xoro cosO, (22)
g(0) - 1 and g(-) 0.Then
- P- -kIn 1P (s) (23)p rp o Po r 89
and the 0 integral in Eq. (15) can be performed without approximation.
This gives us
0,f d@ ' g s(s (ro, V)) - g (s(ro 0))f de g(ro+Xo)-g ro) ro>Xo
9

BORIS AND PICONE
and Eq. (20) becomes
1Pm)Ej r dt f droro I (UR)2 8(UR)
P~~v) -o ln--j~t 0 r2()[ r2(t) at ~o 0
~X drr IwR)z a 8(UR) I-gmdroro (UR)2 ~&URLgiX) -n ff ro) - g ro-)0)
JR0 r2(t) r2(g) It - --J r2(t) r2(t) at I
Still working on this rather general form of the equation, approximations must be made to get a
useable analytic result because Eq. (25) is a hairy 2D quadrature even assuming that the appropriate
R (t) for our particular case is known. The approximation most useful is to evaluate the integrand at
one time. If we assume U(r) - U(O) - 0 so that the initial and final states of the expansion are at
rest, the term (UR) integrates to zero. To approximate V(r), let us evaluate r(t) in the integrand
at the time t, when the expansion flux R, U, =-- R(,) U(t,) is maximum. Then the 1 (UR) term
vanishes and r (t) is still a function of r0, the initial fluid element radius, but not a function of t.
,- ,/ R + R, - Rj. (26)
The desired integral becomes
tfro roV(r)- lnjr-I fodt U2(t)R2(:) f 4 g(r+X0)
f o droro " dro ro (-p'g(X- o)- gr - o) . (27)
In Eq. (27) the time integral can be simply approximated as U.2R.2 r/2 where r -2(R - R0 )/U.
Thus
fvi) -In I I o ro ,+ R0 2- R2 )2 (28)
P~~r)r 2 In P0 0 -f ro ro )~fRi0 d Rg(Xo - ro) -ro g(ro - Xo)
10
NRL MEMORANDUM REPORT 4327
Now the integral is written in terms of three non-dimensional parameters
a RoWR < 1,
b R./So < 1, and (29)
c Xo/ So- I.
where So is a characteristic scale length for variation of g(s/So) and hence of the original channel den-
sity profile, Eq. (21). Letting the integration variable be q- riR. yields
If d'n. g(SO[71b + ci)V(r) - U 2
1 a dq (1 + 7 -a2 )2
fd 77 g (Soic -7b)- g (So[7 b - c])(I + 712 - a2)2 f,, - -n(I+ - a2) 2 (30)
If the remaining composite integral is identified as a three parameter form factor f 2(ab,c) with
values of order unity and if U - cs, an assignment which will be justified empirically by detailed
numerical simulation in the next section for strong pulses, the very useful improvement on the dimen-
sional approximation Eq. (9) is obtained:
V()=c RI- Ro)lnII f 2(a,b,c). (31)
Here the form factor f2, defined as
-2a de g(S 0[71b + c) ri-lb d71 g(SOc - 71b])f 2(a,b,c) =J d1' 1 I 2 )2 J da2) (I+ 72 -a 2)2
J1 dQ g(Sofb- (32)+--12 -a2) 2 ,(2
is generally less than 1/2. The sign of f2 indicates the direction of flow in the xy-plane-
counterclockwise or clockwise.
The general integral form factor, Eq. (32), can be integrated numerically for any reasonable
profile g (s/So). Figure 4 shows plots of f2 versus c, the measure of channel separation for several
values of a at b- 0.7 and for several values of b at a - 0.6, values closely approximating the actual
initial conditions for the detailed calculation of the next section. In this figure the super Gaussian
profile was used,

BORIS AND MCONE
gsr(S/so) - e- S2/ sJ (33)
and the integrations performed using a numerical quadrature algorithm. Calculations have also been
carried out using a Bennett profile,
-In[L-- P 1-0.1 + S21Sm)2]
g8 (s/ SO) - (34)
and are plotted in Figure S. In the degenerate case of a square well density discontinuity at s - So,
0 if s ;o SO (5,sw(s/So) I if S < so,
the integral can be performed analytically to give
- [a~c b2 b)2 (36)
fsw(ab,) 1 + C)2 + b(l - a2) - (1 - c)2 + bl(l - a2)
for ab < c - 1. This is the case when the second pulse is wholly outside the channel formed by the
first pulse. As c approaches cc fD decreases as -Ic 3 so pulse channels separated by more than 3 radii
interact only weakly.
When the channels are closer, ab > c - 1 and the channels overlap somewhat initially. When
-ab < c - 1 there is still part of the second channel of initial radius Ro outside the cylinder s - So so
1s1~bc b2 -1(37)fswa~bc)- ( + C)2 + b2(j - a2) '
Equation (37) agrees with (36) at the interfacial separation c - I + ab.
There is a third region when the initial radius of the second channel lies wholly within the first,
i.e., So > X0 + R0 or I > c + ab. Then fsw (a,b,c) satisfies Eq. (36) aglain. The cross over point at c
+ ab - I again has the two expressions equal. In the intermediate region (1 - ab < c 4 1 + ab),
fsw takes on its peak (negative) value at the exterior touching point c - I + ab. For larger values of
the magnitude Ifswl decreases and for smaller values Ifswi decreases monotonically to zero at c - 0.
This peak negative value is
12
I...Il... .. ... ,............ . .. . . ... ,,_ .. .

NRL MEMORANDUM REPORT 4327
- -2(1 + ab) (38)0SWa" (4 + 4ab + b2)"
When ab - b2 1/2, Ifswin, -6/13 which is close to the values in Fig. 4 and 5 forfso and fa
respectively.
Also of interest is the slope 1 at c - 0 where the pulses are concentric and no vorticity genera-ec
tion is expected:
o" - -b (39)
ac 1 + b2(1-a 2 )12
which is non-zero and large. Thus even modest non-concentricity leads to appreciable vorticity and
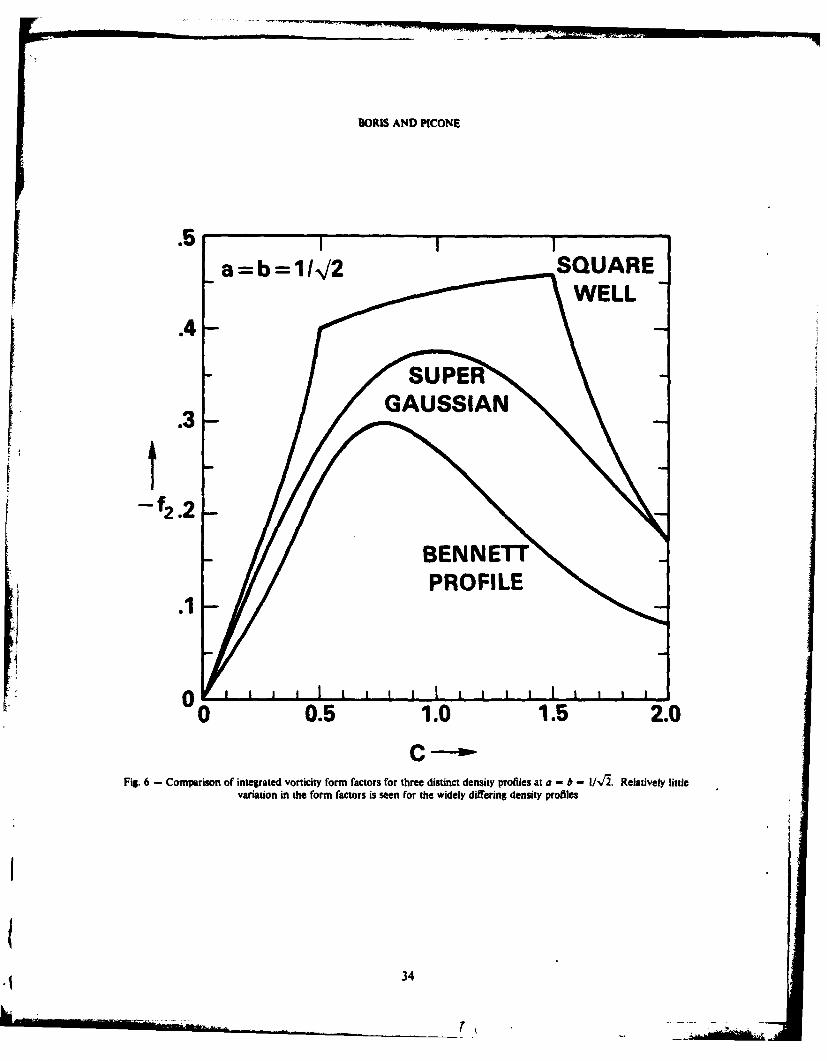
mixing. Similar behavior is observed in the two smooth profiles considered as well. Figure 6 compares
f ., c], fsI , ',-, and fsw II, c, to demonstrate the similarity among the
vorticity generation form factors regardless of the profile. This relative profile insensitivity arises
because V is an integral quantity, the total upper half plane circulation.
Returning to our integrated vorticity estimate of Eq. (31) with a maximum form factor of 6/13,
IP, c, (R I- R0) In -0"(40)13 P0Using viet as the maximum on axis velocity and assuming = R I - R0 gives
Ivxlma I c,. (41)
Under optimum conditions the velocity between the vortex filaments approaches a quarter of the sound
speed in the surrounding fluid. When the expansion is subsonic throughout (where this analysis ought
to be most accurate), c, in Eq. (41) should be replaced by the appropriately averaged expansion velocity
Using Eq. (7) for the mixing time with o RS0 I - R0 and IVIw from Eq. (40)
above gives
*1 i 13
BORIS AND PICONE
~131rSoI~ir~o(42)
~2c 3 In
With c, 5 x 104 cm/sec, In (p-/po) = 2.5, and So- I cm, the fastest mixing time is seen to be
about 160 ltsec. This estimated fastest mixing time is within a factor of two of the dimensional esti-
mate. In any particular system the integral of Eq. (32) can be performed numerically and the resulting
form facor substituted into Eq. (25) for the integrated vorticity.
The sign of P(T) is negative for the configuration of Fig. 2 where the second pulse is centered to
the left of the original channel. This means that the jet of colder wall gas across the original channel
starts on the side opposite to the displaced second pulse and rushes toward the newly heated region.
On average the old channel moves toward the new channel. This average motion does not imply mix-
ing but the spatial behavior of the flow from the vortex filament pair, as will be seen in the simulations
of Section IV, effectively bisects the composite hot channel with a cold jet. The result is two smaller
channels above and below the original symmetry plane in which the vortex filaments are now centered.
A third pulse located at y - 0 between the two modified channels will cause each of these smaller chan-
nels to bifurcate again with fluid jets from the top of the upper channel and the bottom of the lower
channel impinging on the third expanding channel from above and below.
In the next section the problem of Fig. 7 is solved numerically with p-/po- 10, Ro- 0.4 cm,
R- 1.4 cm, So- 1.0 cm, and X 0 - 1.0 cm. If we assume R,,, - 1.0 cm. a - 0.4, b - 1.0, c - 1.0,
then f2(.4, 1.0,1.0) - -1/5 from Fig. 16. Substituting these numbe" into Eq. (31) with c, taken as
5 x 104 cm/sec gives P(Nr) = -2.3 x 104 cm 2/sec. This number is within 10% of the measured value -
2.1 x 104 cm 2/sec (Section IV). The value of c, used should be evaluated in the original channel den-
sity and temperature profiles at the location of the center of the second pulse, i.e., x - - X0 - -I cm
for the example here. The characteristic time r must be equal to (RI - Ro)/(c,/2) -25 jAsec to justify
using c, as the effective maximum expansion velocity of the heated cylinder. This value is also within
10% of the observed value of r < 30 ;sec.
14

NRL MEMORANDUM REPORT 4327
Using Eq. (3) with x - 0 gives the maximum flow velocity expected in the symmetry plane,
o f -90 m/sec, (43)
when .Y - cm. This value is in good agreement with the measured jet velocity of -85 m/sec
seen in the detailed simulations. The mixing time calculated from Eq. (7) for those parameters is about
330 gsec.
IV. DETAILED NUMERICAL SIMULATIONS
Preliminary detailed numerical simulations of this problem have been performed using the
FAST2D 4 .6 computer code to validate and calibrate the approximate analytic model developed above.
In addition to accounting for shocks properly, which the theoretical model does not do, the simulations
are capable of describing the late-time motions and profiles as modified by the induced vorticity. Thus
the various elements of the mixing-time approximations, and their significance, can be evaluated using
detailed calculations of representative problems. In this paper we restrict ourselves to a few calculations
related to the specific configuration of Fig. 7 to calibrate and validate the most questionable assump-
tions leading to Eq. (28). Questions of channel cooling and complex multipulse flows are left for future
studies.
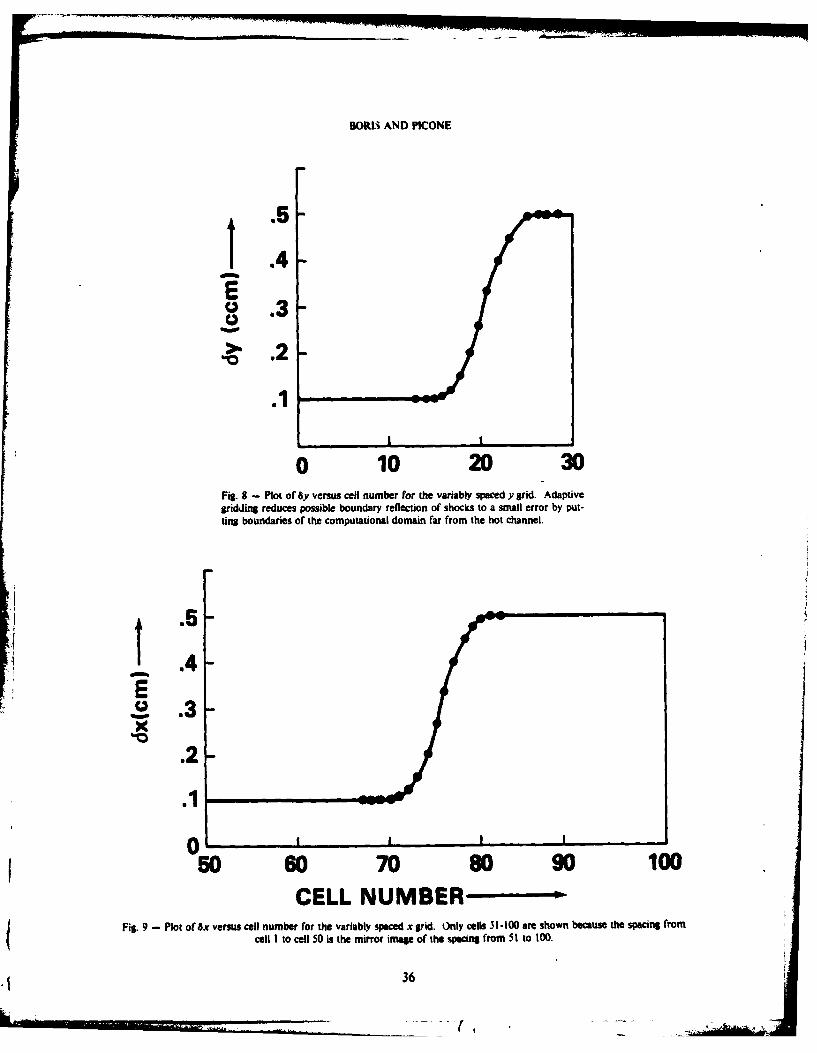
The calculations based on fig. 7 used Cartesian coordinates on a stationary rectangular grid con-
sisting of 100 by 30 cells of dimensions 8x and 8y, each varying from 1 mm to 5 mm. As shown in
Figs. 8 and 9, an embedded, finely zoned region of 50 x 20 cells 1 mm on a side was centered on the
initial 1.0 cm radius hot channel. With increasing distance from the center of the channel, the values
of 8x and 8y transitioned smoothly from 1 mm to 5 mm. Near the sides and top of the grid, 8x and 8y
were both 5 mm.
Figure 10 shows a plot of p (x, 0,0) and P (x, 0,0) along the y - 0 plane at the time the second
pulse is deposited. Bennett profiles 1/[I + s 2/S 12 for the density and pressure deviation from ambient
15
BORIS AND PICONE
were used in these calculations. The dots (0) on the two curves show the location and spacing (1 mm)
of the finite difference grid points in the vicinity of the channel centers.
To compute the vorticity approximately we used the relation
f -v. . v(x, 0,t) d (44)
where x, and xu are the respective limits of the coordinates on our grid. To derive Eq. (44) we
have assumed that v,, vy - 0 as x,y -oo.
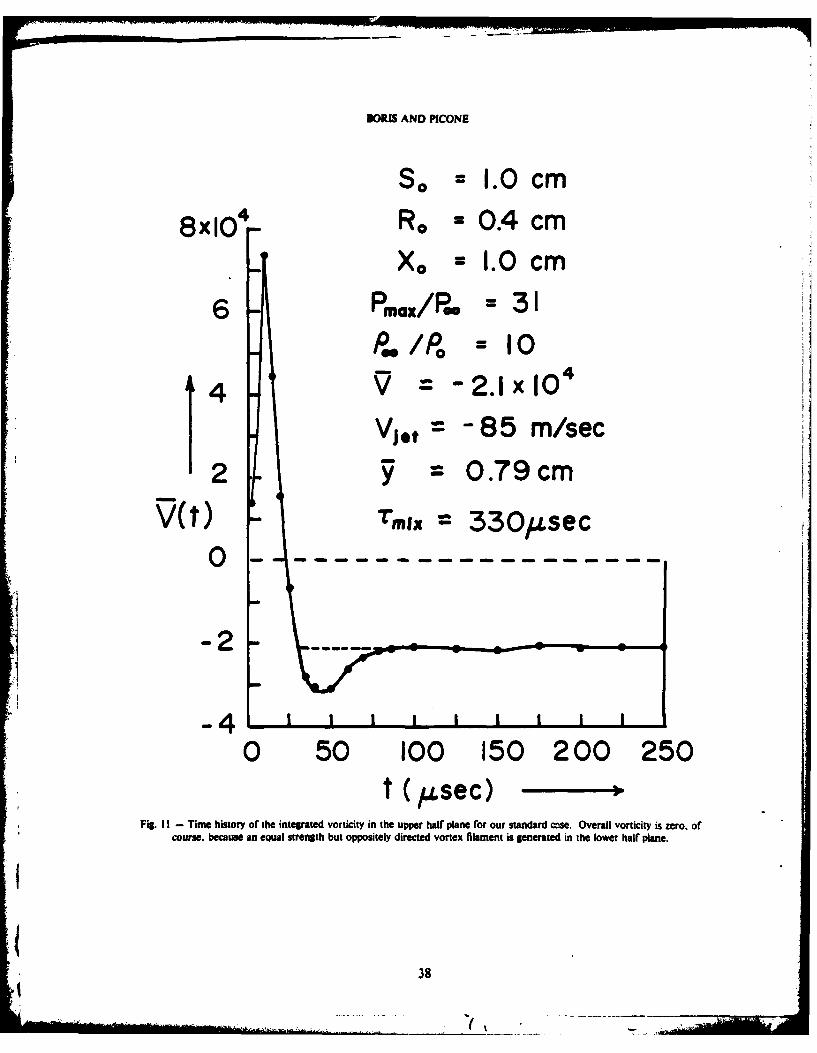
Figure 11 shows the results of our calculations of V(t) for Ro - 0.4, So - 1.0, and Xo - 1.0 cm
using the density profile of the channel formed by the first pulse and the pressure profile of the second
pulse as shown in Fig. 10. After an initial positive transient, the integrated vorticity settles down to a
steady state negative value after a weak relaxation oscillation.
In deriving Eq. (27) from Eq. (25) the time derivative term L, which must integrate to zero8v
during the expansion, is neglected in favor of the v L term which is always of the same sign and
hence contributes most to the integral. A posteriori justification for this approximation is obtained
from Fig. I I which shows the general cancellation of a big transient component in V(t), as assumed in
Section [II, and good quantitative agreement with the residual secular term. This means that the
amount of vorticity generated depends strongly on the eventual radial displacement of each fluid ele-
ment but not on the detailed expansion history. The scale of vorticity is set by an average expansion
velocity only.
Figure 12 shows a schematic diagram to explain physically how the initial positive vorticity spike
of Fig. I I occurs. The expanding shock, shown at four different times as a dashed line, travels faster
and drives the post shock flow faster in the low density material. The density gradient is shown here
localized between the two solid semi-circles in an annulus centered at So. The shear resulting from the
differential acceleration of the inner and the outer fluid corresponds to vorticity of positive sign which
16
L "r ...
NRL MEMORANDUM REPORT 4327
vanishes, as assumed, when differential velocity ceases. The angle between Vp and VP (assumed nor-
mal to the dashed line shock fronts) is shown at three locations along the original channel periphery.
The residual vorticity, which corresponds to that appearing in Eqs. (27) and (30), in effect measures
the net outward expansion of the new channel.
Figures 13 and 14 show the vorticity strength V() as a function of X0 with the other remaining
variables in our standard case held constant. When the axis of the second pulse fell within So of the
center of the channel (Fig. 13), the transient term appeared to oscillate more rapidly than the cases for Iwhich the axis of the second pulse fell "outside" the original channel (Fig. 14). The residual values
P) to which the integrated vorticities in Fig. 13 related were also more nearly equal than in Fig. 14.
The general trend of V( - -c) in the five cases of Figs. 13 and 14 follows qualitatively the shape of
f 2(a,b,c) plotted for various cases in Figs. 4, 5, and 6. The uncancelled vorticity, which we called V(r)
in Section III, decreases from a maximum around Xo - So both as Xo - 0 and as Xo gets large com-
pared to So. The ratio of V(r) at Xo - 0.2 cm to V(&-) at X0 - 0.1 cm is probably not as small as
expected from the curves of f2 in Fig. 5 because the sound speed is higher when the second pulse is
near the center of the first channel. This increasing sound speed partially counterbalances the tendency
of f 2 to fall off as X0 approaches zero.
The major issue in interpreting these calculations using the formulae of Section III revolves
around the choice of -i- for Eq. (30). For Eq. (31) and later estimates we have assumed U is the
sound speed of the fluid at the second pulse center before the second pulse is laid down. We have also
assumed that the average expansion velocity is U./2.
Figure 15 compares the effects of initial pulse size on the second pulse with the same values of
the channel parameters and the overpressure and displacement X0 of the second pulse. We notice that
the transient term appears to scale in magnitude as Ro while the value of the "residuar vorticity appears
to scale as RJ. We may explain the scaling of the residual vorticity in terms of our analytic "late time"
treatment. Instead of using the estimate
17

BORIS AND PICONE
U,.- c,, (45)
as in Eq. (31), we may calculate U,, from the equation
2(RI-R0) (46)
where i* is the time of expansion from R0 to R 1. In Fig. 15, we see that the extrema in Vfor the cases
Ro - 0.2 cm and 0.4 cm occur at almost the same values of t and that the relaxation to the final value
of V occurs at the same rate for the two cases. Thus we have (for any consistent definition of 7) the
relation
7-, U -. (47)
However we expect that
RIA L +Ra (48)
since
ROA 2R0. (49)
Thus Eq. (46) yields
U ,. --A U ,,,e (5 0 )
Estimates of the form factor indicate that
f2A f25. (51)
Using Eqs. (31) and (46)-(01), we find that
VA (7) (R 1A - RoA) 2 1--%-- 8) 4 - (52)Vo(7) (R1t - R0B)2 (
for the case shown in Fig. 15.
This analysis indicates that Eq. (45) provides only a crude estimate of U. as the energy deposited
becomes small. Clearly the relaxation time of the transients depends as much on the already existing
density gradients as it does on the new channel expansion laid down. The ambient sound speed at
X0 - 1.0 cm is about 4 x 104 cm/sec for the standard case and the reduced energy case of Fig. 15. The
final relaxation to the long-time value V() begins at about 40 jsec for both cases, about the time it
18

NRL MEMORANDUM REPORT 4327
takes a sound wave to reach the far side of the original hot channel from the edge of the second pulse
(a distance of 1.8 cm and 1.6 cm for cases A and B respectively).
Clearly additional work is required to refine the approximation of Eq. (31), to improve the rather
cavalier way in which U, has been determined. We expect to carry this study forward in a future
report using cases for analysis and simulation which are of prime experimental interest.
In Table I and Fig. 16, we present estimates of the form factor f2 for the case So - 1.0 cm,
Ro- 0.4 cm, RI - 1.4 cm, Pn/Po - 10 (channel formed by first pulse) and P.JPo z 31 (second
pulse), as shown in Figs. 7 and 10. These values correspond to a m 0.4 and b - 1.0. We vary c from
0.2 to 2.0. To estimate the value of Urn, we used Eqs. (45) and (46). For Eq. (46), we define r to be
the time elapsed between the deposition of the second pulse (t - 0 in Figs. 13 and 14) and the last
extremum in V() before the monotonic relaxation to the residual value. The solid curve is the esti-
mate from Eq. (32).
For both methods of estimating U, the values of f 2 appear to be somewhat low near c - 1.0, as
we see from comparison of the simulation data points with the analytic calculations also shown in Fig.
16 for the Bennett profile, which was used in our simulations. Here Eq. (45) appears to provide a
better estimate of U,, than does Eq. (46), at least when Ro - 1.0 cm. Better agreement is expected
when the energy deposition is slow and the adiabatic expansion treatment is a better approximation.
Finally, returning to Fig. 1, assume U n 2.0 x I0 cm/sec, R, - Ro = 15% of 4 mm - 0.06
cm, In (p0 /po) - 0.33, and choose f, - -1/20 for a smaller relative displacement than shown in Fig.
3. The expansion velocity is smaller here because the pulse is weak. The predicted value of V(,r) is 20
cm 2/sec. The corresponding mixing time is about 60 msec for two pulses and perhaps a half or a third
of that time if the vonicity from the subsequent third and fourth pulses add roughly linearly. More
accurate estimates for these data, kindly provided by the authors,2 must await specific detailed calcula-.. !
tions in a future publication.
19

BORIS AND PICONE
V. SUMMARY AND CONCLUSIONS
Formulae have been developed and calibrated for calculating the integrated vorticity and subse-
quent convective mixing time resulting after a second circular heating pulse is injected parallel to the
axis but off center in a hot channel created by an earlier pulse. The vorticity arises because the density
gradient asymmetries interact with pressure gradients attendant on the second heating pulse. Two
oppositely rotating vortex filaments give rise to a shearing, mixing flow field which tends to convect the
original channel toward the center of the second pulse.
The following formulae summarize the results of this paper. Assume a hot channel exists with a
central density P0 lower than ambient density p.. and with a characteristic radius So for the density vari-
ation. In the simulations performed for this paper a Bennett profile was used:
P(p.- - Po)
p(s) - p.. -R + (s/So) 2]2
both for the original channel and for the subsequent energy depositions. A second pulse is deposited a
distance X0 off center in the heated channel with an overpressure 8P., at the center and a characteris-
tic radius Ro.
P(r) - P. + 8I (54)[I + (,r/0)2]2
for the simulations reported here. The extra energy deposited per unit length by this second pulse is
w1fR2 8P", (55)
(v-I) (5
which may also be used to calculate 8P,, from AE. For the calculations reported here 8Po,, - 30 and
R0 - 0.4 cm (generally).
If adiabatic expansion of the second pulse channel to ambient pressure is an adequate approxima-
tion as suggested by Lampe, 7 the final characteristic radius of the expanded pulse channel will be
(approximately)
20

NRL MEMORANDUM REPORT 4327
1 8P + (56)
Giving RI - Ro for use in Eq. (31). The integrated vorticity in each of the two filaments, :t V(), is
given adequately by the formula
P(7) == c,(Xo)(RI - Ro) InI-I 2 Rfz R_ 0 (P0) R.m S S
where the sound speed c,(Xo) is evaluated in the original channel at the location where the second
pulse will be centered. The radius Rm lies between R0 and RI and we have taken it to be 1.0 cm when
Ro - 0.4 cm and 8Pn. - 30. If the original channel overpressure is 8P:., P-!Po is given by an
expression analogous to Eq. (56)
(p./po)- Vp*. + 1 (58)
The geometric form factor f2 (a,b,c) is given by the simple quadrature
7bf d-n [g(So[71 b + c) - g(S[, b-cJ) (59)
f'2(a, b,c) - f. [I +,2 - a212
where the original channel density satisfies
-In (P" g(s/S0op(s)-p. e 0 . (60)
Equation (59) for the form factor is a permissible simplification when g(s/So) is expressible in even
powers of s. Plots of this form factor for a number of cases are presented in Figs. 4, 5, 6 and 16. It
typically takes on negative values with an extremum of f2 - in the vicinity of Xo - So (c - 1) and3
approaches zero for both large and small values of X0 .
Using Eq. (57) for the generated vorticity, a mixing time estimate can be derived as in Section II,
%6 7r SJ7 IMX (I (61)
21

BORIS AND PICONE
This is the time it takes cold fluid from one side of the original channel to cross the hot region and
reach the other side-thus effectively bisecting the hot channel with cool fluid. The negative sign on f2
means physically that the vortex-induced cold jet moves toward and into the second pulse channel
rather than away from it.
As an example of the use of these formulae, consider the case of 4E ergs/cm being deposited by
each pulse in a cylinder of initial radius Ro. The overpressure factor is
r 8P=.. (y- I)E (62)
and the mixing time estimate of Eq. (61) can then be written
Ro (1+ r) ) 63T mix " UT (63)
[(1 + r)2 _ lln(I + r)
The typical turbulence velocity UT is given by the expression
U-<f2>C(X0) 103 cm/sec (64)Ur - . y
where the value of 103 cm/sec assumes <f2> c, - 10' cm/sec. Since c, - 5 x 104 cm/sec and
if2I - " in the range 0.5 So 4 Xo 4 1.5 So, this is a good approximation.
A single curve, as seen from Eq. (63), serves to characterize the non-dimensional vorticity mixing
time in terms of the instantaneous pulse overpressure. However, since 8Pm,IP . also depends on R0 ,
curves of ',,,x for several values of Ro are plotted in Fig. 17. For tightly focused beams (Ro small and
f large) the mixing times are very fast so convective/turbulent cooling is bound to play a significant
role in multipulse propagation. Overpressures significantly less than unity must be used with pulses
separated by 107 3 sec or more when the beam radius is 1 mm. In fact mixing will significantly alter
channel dynamics with a deposition radius of I mm and overpressure of 10 unless the pulse separation
in time is reduced well below 100 ,usec.
22
*Jr
NRL MEMORANDUM REPORT 4327
There is much still to be learned about this vorticity generation mechanism which may have a tel-
ling role in determining overall channel coding characteristics. In closing this paper it is appropriate to
identify several of these issues which appear to play a major role and which have been dealt with only
approximately above. Where possible the likely effect is described and discussed.
In our theoretical model for the integrated vorticity, a great simplification was achieved by
evaluating the integrand at a point in time when the maximum expansion velocity was attained and
then replacing U.2 j- with c1(Ri - R 0). For moderate strength shocks this should work reasonably
well. Ignoring for now the question of what is the *correct* average to take, it should be clear that the
formula is probably wrong for both very strong energy deposition and for relatively weak energy deposi-
tions. Strong shocks leave large yet subsonic velocities in their wakes. In terms of the ambient sound
speed (at the pulse location), this velocity of expansion may be quite supersonic making our approxi-
mation actually underestimate the vorticity generated. On the other hand, for weaker energy deposi-
tions the shock speed is still slightly larger than c, but the flow speed, and hence the expansion rate,
can be much smaller.
These weaker cases may well be treated as dynamic adiabatic expansions where RiiR - I is
small but detailed numerical simulations will be needed to calibrate the improved theoretical model. It
U.may well be that the effective expansion timer and hence the effective expansion velocity -2= should
involve the maximum of the shock transit time from R, to R 0 and the rarefaction wave transit time to
the axis from R 0. The effect of reducing the vorticity generation rate at low deposition power means
that there will probably be a shift of the least mixed channel to larger size since not only Rt - R 0 but
also the effective expansion velocity -= = decrease when the overpressurerismal
In reality the energy deposition will probably depend on the existing channel profiles. Lower den-
sit, often means reducea energy deposition although perhaps equal or near equal local heating may
result. Furthermore. circular energy deposition will no longer apply. While it may not yet be possible
23

BORIS AND PICONE
to evaluate the channel effect on subsequent pulse propagation, the effect on the channel of an energy
deposition with given cross section should be easier to determine. It will be particularly important to
characterize these phenomena quantitatively because a reduction in the beam-generated turbulence is
likely. This is turn reduces the turbulence level and hence convective channel cooling. For near term
experiments these refinements and the corresponding reduced cooling for low intensity beams will
probably help raise the average channel temperature. For more intense beams, the turbulence problem
may well be worse than we predict here because L may be larger than cs.
Distortion of either a two-dimensional or a three-dimensional variety will also contribute to the
vorticity and hence turbulence generation. These additional asymmetries must also be analyzed
theoretically. Even in the initially 2D cases three-dimensional effects are likely to appear and reach full
amplitude by the time an averaged description of the "turbulent" channel cooling will become useful.
This is not likely to occur before a few pulses at least so the use of detailed (and probably expensive)
calculations is necessary to bridge the gap between a single pulse interacting with a previously bored
smooth channel and a roughly circular turbulent cylinder being driven by a repetitively pulsed energy
source near its axis.
Questions about the vorticity generation in highly distorted geometries must be resolved. As the
symmetry plane jet developes in the simplest case, the hot, double channel becomes bisected into two
channels with embedded vorticity. A third pulse might be expected to bisect these two channels-if the
location and timing of the pulse were correct. It is clear that the timing is important because the vorti-
city should add essentially linearly when the pulses are separated by a time appreciably shorter than the
mixing time estimated above. By separating the pulses sufficiently in time, on the other hand, interest-
ing nonlinear effects will result. Proper phasing and location of the pulses can certainly cancel existing
vorticity in some regions and enhance it in others.
As the number of pulses increases so also will the geometric complexity of the resulting compo-
(site channel. A turbulent situation is expected to result in which the migrating, interacting vortex
24
k,' I
S(~ -,,,-
NRL MEMORANDUM REPORT 4327
filaments shear and stir the hot expansion channels. This mixing brings cold entrained air into proxim-
ity with the hot channel air on spatial scales short compared to an expanded channel radius and thus
molecular thermal conduction cooling is expected to be enhanced. Questions in the turbulence regimes
occur at a number of points. Where the beam-generated vorticity goes and how it evolves are clearly
controlling issues. The same reduction of scales by the expansion induced jets which tends to favor
enhanced molecular thermal conduction will also favor enchanced viscous dissipation of the driving
vortices themselves. Since the decay of vorticity reduces the convective cooling rate, a balance will be
obtained eventually where the production of vorticity is equal to the dissipation rate.
In standard turbulence phenomenologies there is no good way for dealing with transient,
multispace-scale phenomena so a model for these effects will have to be developed which also allows
the complex channel to be cooler, on average, at the edges than in the center. The importance of tem-
perature fluctuations also cannot be overemphasized. Knowing the average channel temperature is not
sufficient if one very hot region takes on unusual importance. Thus a transient turbulence model will
also have to be constructed which allows molecular cooling so the temperature fluctuations about the
mean can be analyzed.
Work is currently underway to extend this analysis to the other types of asymmetry and to per-
form detailed simulations of the late time channel cooling to calibrate the mixing time formula as well
as the vorticity generation formula. Three-dimensional simulations of the early time and the develop-
ment of a spectral dynamics turbulence phenomenology for the late time will be necessary before a
truly interactive multipulse scenario can be simulated where the beam deposition-vorticity generation-
channel distortion feedback loop is incorporated. A framework for the turbulence analysis has been
developed, and will serve as the basis for our improved analysis of these issues in future research.
25
BORIS AND PICONE
ACKNOWLEDGMENT
The authors would like to acknowledge helpful conversations with M. Lampe, D. Book, T.
Fessendon. and S. Yu. This work was supported by DARPA under program clement NSWC6I lOIE.
The FAST2D) comnputer code used to perform these calculations was developed under support from
ONR and DNA.
REFERENCES
1. J-R. Greig, R.E. Pechacek, R.F. Fernsler, I.M. Vitkovitsky, A.W. DeSilva. and D.W. Koopman,
"A Preliminary Study of Aerosol Initiated CO2 Laser Produced Air Sparks and Their Ability to
Guide Electrical Discharges", NRL Memorandum Report 3647.
J.R. Greig, D.W. Koopman, R.F. Fernsler, R.E. Pechacek. l.M. Vitkovitsky, and A.W. Ali,
*Electrical Discharges Guided by Pulsed C0 2-Laser Radiation", Physical Review letters, 41, 174-
176 (1978).
D. Koopman. J. Greig, R. Pechacek. A. Ali, I. Vitkovitsky, and R. Fernsler," C0 2-Laser Produced
Channels for Guiding Long Sparks in Air", Journal De Physique, Colloque C7, Supplement au n*7,
Tome 40, Juillet 1979, C7-419.
M. Raleigh, J.D. Sethian, L. Allen, i.R. Greig, R.B. Fiorito, and R.F. Fernsler," Experiments on
the Injection of Relativistic Electron Beams into Preformed Channels in the Atmosphere, NRL
* Memorandum Report 4220.
2. T.J. Fessendon. R.J. Briggs, R.E. Hester, E.J. Lauer, and R.L. Spoerlein, *ASTRON High Pres-
sure Channel Experiments", report nearing completion.
3. M. Lampe, H.H. Szu, and S. Kainer. *Hydrodynamics of Gas Channel Formation," NRL Memo.
Report 4073.
26

NRL MEMORANDUM REPORT 4327
4. J.P. Boris, "Flux-Corrected Transport Modules for Solving Generalized Continuity Equations,"
NRL Memorandum Report 3237 March 1976.
5. J.P. Boris, "Dynamic Stabilization of the Imploding Shell Rayleigh-Taylor Instability," Comments
on Plasma Physics and Controlled Fusion (3) No. 1, pp 1-13, 1977.
6. D.L. Book, J.P. Boris, A.L. Kuhl. E.S. Oran, J.M. Picone. and S.T. Zalesak," Simulation of (4om-
plex Shock Reflections from Wedges in Inert and Reactive Gaseous Mixtures," proceedings of
Seventh International Conference on Numerical Methods in Fluid Dynamics, June 23-27, 1980,
Standford Univ-NASA Ames, U.S.A.
7. M. Lampe, private communications.
27
JI
27i

BORIS AND PICONE
Table I. Values off2 from numerical simulations. The displacement of thesecond pulse from the channel center is varied (c a xo/so) and two differentestimates of U,. are compared. The sound speed in the original channel at thesecond pulse center is indicated.
c Um = Cs(Xo -f 2 Cs) Urn (e.46) -f2 (*q.46) -V()
0.2 8.2 x 104cm 0.10 8.0 x l0 4cm 0.10 1.9 x 104cm 2
sec sSc sac
0.5 5.2 x 10⁴ 0.18 6.3 x 10⁴ 0.14 2.1 x 10⁴
1.0 3.9 x 10⁴ 0.23 5.9 x 10⁴ 0.15 2.1 x 10⁴
1.5 3.6 x 10⁴ 0.19 4.2 x 10⁴ 0.17 1.6 x 10⁴
2.0 3.5 x 10⁴ 0.15 3.2 x 10⁴ 0.16 1.2 x 10⁴
28
*1 (4
NRL MEMORANDUM REPORT 4327
2.51
~2.0
E ----- Classical theory
1.54puss&dansi
2 pulses & diagnostic
0 20 40 60 80 100
Time after first pulse (msec)Fig. I - Measure of temperature rise versus time for multipulse channel formtion using Astron (by permis-sion of the authors). The *classical theory" curve indicates that cooling occurs faster than can be accountedfor by thermal conduction alone.
29
BORIS AND PICONE
original low densityexpanding - region
pn ngregion,,,
0rI t
So\
Fig. 2 - Schematic of the initial conditions in which a second beam pulse of radius R0 propagates parallel to thehot channel of characteristic radius S0 formed by a previous beam pulse. The second pulse, offset from the firstpulse by Xo, expends to radius R0.
I
30
X2pulse.b........pa.ds.to radius=

NRL MEMORANDUM REPORT 4327
ydo,- -
le'.
N\NI '.4)---
-s s
I-
o S/~x 2 7r /2
F i.-Symtiditiuinoloaie otctaperastoetne votxflmnsrsprtdba itac y.Fo eoiyidcdb hs otcsi hw aogtexai afa ewe h iaet.Temxnimri eie eea h iei ae li lmn t-ot ec oadhneefcieybsc h oc anl
a3
-t s

BORIS AND PICONE
a=0.
.3
1.0
f.2 0.7
.1 0.4
0.1
0510 1.5 2.0C---
.4
.3.
,.2.1 gSa s=fhS)
0
C --
Fig. 4 - Integrated vorticity form factors assuming a "super-Gaussian" density profile. Largervariation with b is observed in the upper figure than with a in the lower figure. Peak vorticitygeneration always seems to occur in the vicinity of X0 -So and -f 2 ranges from 0. 1 to 0.4 inmaximum value with 0.3 being a good working value.
.32

NRL MEMORANDUM REPORT 4327
a =0.6
.3b1.
.0.
0 -0 .
f2 --
.1 - 0.
LCr -- -
.4
00 0. 1.0.
C-0.-
P . - 0nertdvriiyfr atr asmn ent est rfl. Lre aito
wihbi- gifbsre hnwt a=.0t htapeibefr fcosa ' 2S a2eotie he ssal
- Q~s)= 33[1+ 21
BORIS AND PICONE
.4-
-f2 .2
00 0.5 1.0 1.5 2.0
CFig. 6 - Comparison of integrated vorticity form factors for three distinct density profiles at a - /VI. Relatively little
variation in the form factors is seen for the widely differing density profiles
*1 34
MO
NRL MEMORANDUM REPORT 4327
7
NX=10 bXmin b ymin = 0.1 CmNY = 10 bXmax = yna = 0.5 cmn
Pnax =31 P o QQ00 =l0 Qo
00 15 30
xFig. 7 - Inicial conditions for numerical simulations of beam-channel vorticity generation mechanism. Only the upperhalf plane is simulated with outflow boundary conditions at X - 0 cm, X - 30 cm and y - 7 cm. A 5:1 grid stretchinghas been employed for the outermost zones to move the boundaries far from the active region.
35
BOKI AND PICONE
.4 -
.3
.2
0 10 20 30Fig. 8 - Plot of 8y versus cell number for the variably spaced y grid. Adaptivegridding reduces possible boundary reflection of shocks to a small error by put-ting boundaries of the computational domain far from the hot channel.
S .5-
.4-
O .3x
.2-
.1
0150 60 70 80 90 100
CELL NUMBERFig. 9 - Plot of Sx versus cell number for the variably spaced x rid. Only cells 31-100 are shown because the spacing from
cell I to cell 50 is the mirror image of the spacing from 51 to 100. I
36

NRL MEMORANDUM REPORT 4327
Pmax = I P
-secondpulse
"~ ~ ~~ ~~ Pxoopxoo first pulse "
I I
13 14 15 16 17x(cm)
Fig. 1O - Symmetry plane pressure and density profiles for the case where the second pulse and first pulse chan-nel centers are separated by 1.0 cm. The first pulse characteristic channel radius is So - 1.0 cm and the secondpulse characteristic channel radius is 0.4 cm (see Figs. 2 and 7). Data points are shown near the channel centers to
vi indicate good resolution used in the fine zone region.
37
BORIS AND PICONE
So = 1.0 cm
8x10 4 Ro = 0.4 cmXo = 1.0 cm
6 PmaX/Pe = 31P./PO =10
4 = -2.1 x 10⁴
Viet = 85 msec2 = 0.79cm
V(t) Tmix 330zsec0
- - -4--- -a- -A-2I
0 50 100 150 200 250t (pMsec)
Fig. I I - Time history of the integrated vorticty in the upper half plane for our standard case. Overall vorticity is zero, ofcourse, becamuse an equal strength but oppositely directed vortex filament is generated in the lower hal plane.
38
NIL MEMORANDUM RUMOT 4327
%I
4.O
Fig. 12 - Schematic diagram showing how initial vorticity transient arises physically. When the outwardly expandingfluid eventually decelerates to rest, most of the transient vorticity cancels because the acceleration pressure gradientmust change sign to stop the expansion.
39

BORIS AND PICONE
8
6 CURVE X0
IA 0.2cm
C 1.0cm
-2
II
40

NRL MEMORANDUM REPORT 4327
8 A
51t
6 BCURVE X
UA 1.0cm4' B 1.5cm
CC
-2-
A
0 21 50 X5 100 125 150 1751 200
Fsu. 14 - lassatd vorticity V(t) for three cases with x 0 ); so.
41 T
BORIS AND PICONE
6I' CUV 0.2cm 1.0cm
1 > 0 A
-2 --
0 25 so 75 100 125 ISO 175 20
t 466c) --Fit. is - integrated vorticity P(: for two case differing only in second pulse radius. Curve B is the standardcase and Curve A has one fourth the energy per unit length deposited in one fourth the area so the peak overpres-sures are equal. The transients differ by a factor of two but the residual integrated vorticity differs by a factor or 4.
42
NIL MEMORANDUM REPORT 4327
.4a = 0.4b =1.0
-f2 .2 -
A Um - 2(Rl-R 0 )/T
0 1 1 10 0.5 1.0 1.5 2.0
CFig. 16 - Comparison or numerically determined form factors (* and A) with the theoretical calculation using the vorticity
generation formulation and setting a -0.4, b - 1.0. Agreement is good in both magnitude and sign.
1 43
BORIS AND PICONE
10-2
1Cm
10-4 ++
UT 96
J- M1P 42.
F.1Mxn iestaesaafuconopusoereurraninil beam raiu 0 0~-
F im . s e c i ng u y c h a e isti ca t o f a ir a t S .o T h e f o u l e e p ssu m a riz e d in ie ti o n Ve a w ere d u s w i T 1 03
and C, 5 x 104 cm/sec. mrzdi eto eeue ihI2
44

DISTRIBUTION LIST
1. CommanderNaval Sea Systems CommandDepartment of the NavyWashington, D.C. 20363
Attn: NAVSEA 03H (Dr. C. F. Sham)
2. Central Intelligence AgencyP. 0. Box 1925Washington, D.C. 20013
Attn: Dr. C. Miller/OSI
3. Air Force Weapons LaboratoryKirtland Air Force BaseAlbuquerque, New Mexico 87117
Attn: Lt. Col. J. H. Havey
4. U. S. Army Ballistics Research LaboratoryAberdeen Proving Ground, Maryland 21005
Attn: Dr. D. Eccleshall (DRXBR-BM)
5. Ballistic Missile Defense Advanced Technology CenterP. 0. Box 1500Huntsville, Alabama 35807
Attn: Dr. L. Havard (BMDSATC-1)
6. B-K Dynamics, Inc.15825 Shady Grove RoadRockville, Maryland 20850
Attn: Mr. I. Kuhn
7. Intelcom Rad TechP. 0. Box 81087San Diego, California 92138
Attn: Mr. W. Selph
8. Lawrence Livermore LaboratoryUniversity of CaliforniaLivermore, California 94550
Attn: Dr. R. J. BriggsDr. T. FessendenDr. E. P. Lee
9. Mission Research Corporation735 State StreetSanta Barbara, California 93102
Attn: Dr. C. LongmireIt Dr. N. Carron
45

10. National Bureau of StandardsGaithersburg, Maryland 20760
Attn: Dr. Mark Wilson
11. Science Applications, Inc.1200 Prospect StreetLa Jolla, California 92037
Attn: Dr. M. P. FrickeDr. W. A. Woolson
12. Science Applications, Inc.Security Office5 Palo Alto Square, Suite 200Palo Alto, California 94304
Attn: Dr. R. R. JohnstonDr. Leon Feinstein
13. Science Applications, Inc.1651 Old Meadow RoadMcLean, Virginia 22101
Attn: Mr. W. Chadsey
14. Science Applications, Inc.8201 Capwell DriveOakland, California 94621
Attn: Dr. J. E. Reaugh
15. Naval Surface Weapons CenterWhite Oak LaboratorySilver Spring, Maryland 20910
Attn: Mr. R. J. BiegalskiDr. R. CawleyDr. J. W. ForbesDr. D. L. Love
Dr. C. M. HuddlestonDr. G. E. Hudson
Mr. W. M. HinckleyMr. G. J. PetersMr. N. E. ScofieldDr. E. C. WhitmanDr. M. H. ChaDr. H. S. UhmDr. R. Fiorito
16. C. S. Draper LaboratoriesCambridge, Massachusetts 02139
Attn: Dr. E. OlssonDr. L. Matson
17. M.I.T. Lincoln LaboratoriesP. 0. Box 73Lexington, Massachusetts 02173
Attn: Dr. J. Salah46m m

18. Physical Dynamics, Inc.P. 0. Box 1883La Jolla, California 92038
Attn: Dr. K. Brueckner
19. Office of Naval ResearchDepartment of the NavyArlington, Virginia 22217
Attn: Dr. W. J. Condell (Code 421)
20. Avco Everett Research Laboratory2385 Revere Beach Pkwy.Everett, Massachusetts 02149
Attn: Dr. R. PatrickDr. Dennis Reilly
21. Defense Technical Information CenterCameron Station5010 Duke StreetAlexandria, VA 22314 (12 copies)
22. Naval Research LaboratoryWashington, D.C. 20375
M. Lampe - Code 4792 (50 copies)M. Friedman - Code 4700.1J. R. Greig - Code 4763I. M. Vitkovitsky - Code 4770J. B. Aviles - Code 4665M. Haftel - Code 4665T. Coffey - Code 4000Superintendent, Plasma Physics Div. - Code 4700 (25 copies)Branch Head, Plasma Theory Branch - Code 4790Library - Code 2628A. Ali - Code 4700.1D. Book - Code 4040
J. Boris - Code 4040I. Haber - Code 4790S. Kainer - Code 4790A. Robson - Code 4760P. Sprangle - Code 4790D. Colombant - Code 4790M. Picone - Code 4040D. Spicer - Code 4169M. Raleigh - Code 4760R. Pechacek - Code 4763
47_ _ _ _

23. Defense Advanced Research Projects Agency1400 Wilson Blvd.Arlington, VA 22209
Attn: Dr. J. ManganoDr. J. Bayless
24. JAYCOR205 S. Whiting St.Alexandria, VA 22304
Attn: Drs. D. TidmanR. HubbardJ. Guillory
25. JAYCORNaval Research LaboratoryWashington, D.C. 20375
Attn: Dr. R. Fernslert- Code 4770Dr. G. Joyce - Code 4790Dr. S. Goldstein - 4770
26. SAiNaval Research LaboratoryWashington, D.C. 20375
Attn: A. Drobot - Code 4790W. Sharp - Code 479Q
27. Physics International, Inc.2700 Merced StreetSan Leandro, CA.
Attn: Drs. S. PutnamE. Goldman
28. Mission Research Corp.1400 San Mateo, S.E.Albuquerque, NM 87108
Attn: Dr. Brendan Godfrey
29. Princeton UniversityPlasma Physics LaboratoryPrinceton, NJ 08540
Attn: Dr. Francis Perkins, Jr.
30. McDonnell Douglas Research LaboratoriesDept. 223, Bldg. 33, Level 45Box 516St. Louis, MO 63166
Attn: Dr. Michael Greenspan
48
~ Um ~ (|
31. Cornell UniversityIthaca, NY 14853
Attn: Prof. David Hamner
32. Sandia Laboratories-Albuquerquo, WM 87185
Attnt Dr. Bruce MillerDr, Barbara Epstein
33. University of CaliforniaPhysics DepartmentIrvine, CA 92717
Attn: Dr. Gregory Benford
34. Defense Technical Information CenterCameron Station5010 Duke StreetAlexandria, VA 22314 0.2 copiewl
35, Beers Associates Inc.Attn: Drt Douglas StricklandP. 0, Box 2549Reston, Va, "22090
49
I.!