Actual Case Study - YDATUM Page Case Study Our overall objective was to improve the business...
17
Actual Case Study This example is based on an actual project. A T M I provides products and services for semiconductor device manufacture, including thin film material and delivery systems, environmental equipment, thin film deposition services, and sub- atmospheric gas delivery systems. This case study takes place in the Vector line located in Napa, California. Napa Facility, Napa, CA, Center for Manufacturing Excellence One Page Case Study Our overall objective was to improve the business condition. That is, to improve quality and reduce lead-time and cost at the same time. It's easy to reduce labor when increasing inventory or vice versa. A true kaizen reduces labor, inventory, and increases quality. In addition, nobody was laid-off as direct result of our TPS effort. Our approach to implementing the Toyota system, or lean, included: Analysis to find the biggest problem, develop a target condition supported by a strategy and specific milestones; Increasing stability through problem solving; Continuous flow through connecting processes (assembly line) and eliminating changeover (outsourcing in this case); Meaningful work to people (Jidoka); Standardized work and workplace organization; Heijunka, or level production; Demand pull manufacturing (SEQUENTIAL pull system) Material and Information Flow of Initial Condition (Current Value Stream Mapping)
Transcript of Actual Case Study - YDATUM Page Case Study Our overall objective was to improve the business...

Actual Case Study
This example is based on an actual project. A T M I provides products and services for semiconductor device manufacture, including thin film material and delivery systems, environmental equipment, thin film deposition services, and sub-atmospheric gas delivery systems. This case study takes place in the Vector line located in Napa, California.
Napa Facility, Napa, CA, Center for Manufacturing Excellence
One Page Case Study
Our overall objective was to improve the business condition. That is, to improve quality and reduce lead-time and cost at the same time. It's easy to reduce labor when increasing inventory or vice versa. A true kaizen reduces labor, inventory, and increases quality. In addition, nobody was laid-off as direct result of our TPS effort. Our approach to implementing the Toyota system, or lean, included:
Analysis to find the biggest problem, develop a target condition supported by a strategy and specific milestones;
Increasing stability through problem solving;
Continuous flow through connecting processes (assembly line) and eliminating changeover (outsourcing in this case);
Meaningful work to people (Jidoka);
Standardized work and workplace organization;
Heijunka, or level production;
Demand pull manufacturing (SEQUENTIAL pull system)
Material and Information Flow of Initial Condition (Current Value Stream Mapping)

Purpose of Material & Information Flow of Initial Condition To visually capture the current condition of the shop floor to gain consensus on the biggest problem. It is the equivalent of standardized work of initial condition for management.
Biggest Problem ATMI's manufacturing lead-time, from receiving the order to shipping the order, is greater than the customer lead-time. As a result, production must be based on a forecast, while actual customer order fluctuation is directly passed on to the shop floor, forcing the need to carry resources to cover for peak demand. Excess resources hide problems, further necessitating resources (time, labor, inventory and capital) to cover for lack of operational availability.
On the initial condition you can see that our processes were all disconnected. Each process was producing in a batch and sending the sub-assembly to the warehouse where it would wait until an order would come through. This situation created a long lead-time, forcing us to work on a forecast. Since the customer was only giving us 2 or 3 weeks to ship and it was taking 8 to 9 weeks to build, we had to start all the subassembly based on a forecast. Making to forecast is not accurate and results in excess inventory of some parts and a shortage of others.

As a result, final configuration had to start earlier. To summarize, all problems were pushed to final configuration where we would scramble at the last minute to make the order. In TPS, we do not pass defects on to the following process and that is hard to do.
Material & Information Flow of Target Condition (Future Value Stream Mapping)
Purpose of Material & Information Flow of Target Condition A tool for management to reach agreement on steps, methods and resources required to attack and fix those problems.
Shared Vision of the Future ATMI's manufacturing lead-time, from receiving the order to shipping the order, is below customer lead time. Production can be scheduled based on actual customer demand. Excess ATMI lead time can be used to level the order fluctuation, thus eliminating the need for carrying resources to cover for peak demand. The Napa facility becomes a center for operational excellence, where resources (sales, engineering, planning, and manufacturing) are set against actual customer demand (rate of operation equals demand, operational availability is 100%). Supply chain is established internally and externally to ATMI. We achieve highest quality, lowest lead time and lowest cost.
Continuous Flow
In reducing the lead-time our strategy was to connect processes in a continuous flow and eliminate changeover. In creating a continuous flow we determined takt time and, against the work content, the size of the part and the number of people who could work simultaneously, we established pitches

The rule is that the following pitch pulls from the preceding pitch at the actual pace of the customer demand, or Takt Time. Before, we used to push the work until it would stop at the bottleneck station.

Detailed Design of the Assembly Line

Assembly
This line is designed to accommodate flexible manpower work. We can, without increasing the cost, vary production from 5 units to 1. For instance, in final assembly we can, with 4 operators, produce 4 units a day at 110 minutes takt time plus 1 extra unit during 110 minutes available over-time. However, if demand drops, with one operator we can produce 1 unit per day across all final assembly pitches. For that we had to make sure that all our operators were cross-trained. Each subassembly works on the same principle: just-in-time against the pull of the final line.

Each pitch is 110 minutes over 110 inches. In other words, 1 minute is equal to 1-inch worth of work. The work is distributed equally in each of the pitches, so everyone works at the same pace producing 1x1 on demand and in sequence.
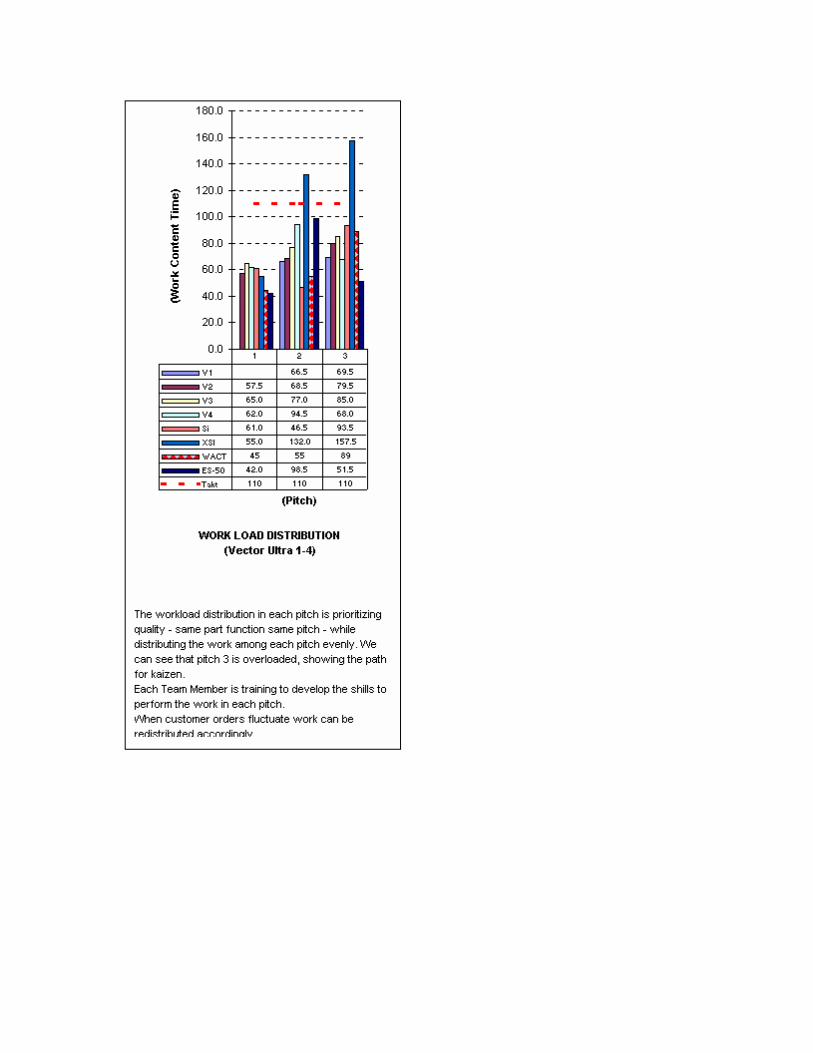
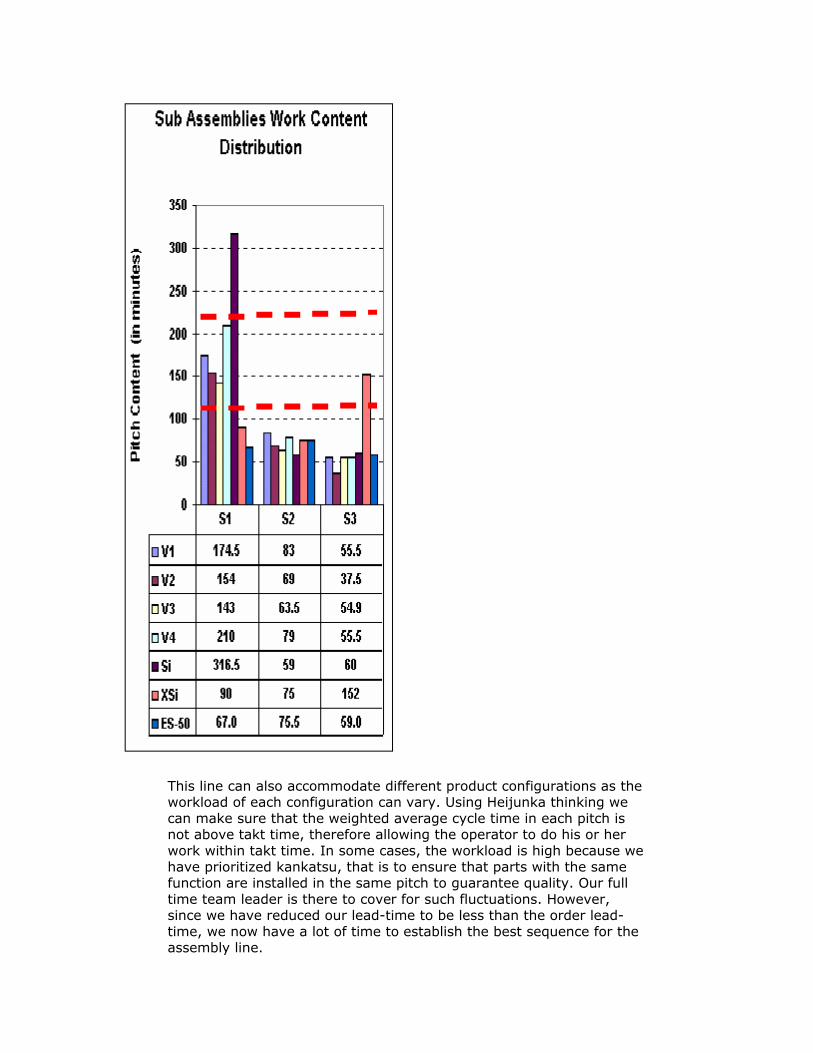
This line can also accommodate different product configurations as the workload of each configuration can vary. Using Heijunka thinking we can make sure that the weighted average cycle time in each pitch is not above takt time, therefore allowing the operator to do his or her work within takt time. In some cases, the workload is high because we have prioritized kankatsu, that is to ensure that parts with the same function are installed in the same pitch to guarantee quality. Our full time team leader is there to cover for such fluctuations. However, since we have reduced our lead-time to be less than the order lead-time, we now have a lot of time to establish the best sequence for the assembly line.

Establish Standardized Work in Final and SubassemblyLines
The role of the team leader, however, extends beyond just helping in the line. He or she is responsible for standardized work. Standardized work is our tool for kaizen. Without it we cannot know what the problems are and we cannot make improvements. Standardized Work is frequently misunderstood and disregarded as a useful tool. Yet, it is an essential component of an Olympic Class process. It is THE tool to measure efficiency and set a base for continuous improvement. It is the responsibility of the supervisor and management to ensure that the Standardized Worksheet be completed, posted and used. Any variance between the Standardized Worksheet and the actual work done highlights a kaizen point. It will be especially important to thoroughly deploy Standardized Work in our process because of its long takt time, ranging from 110 to 220 minutes. Along with the Standardized Worksheet we implemented Standard Quality Sheets against field or next process failure.
Actual Standardized Worksheet currently implemented:
Standardized Worksheet

Standard Quality Sheet
We designed our standardized work to make it work with the pitch layout (1 minute = 1 inch). For now we only have 1 sheet per pitch, our target, however, is to have 10 standardized works per pitch, or 1 for 10 minutes of work, or 11 inches. This will allow the operator to know quickly if his or her work is ahead or behind production. It is also a good baseline for ergonomics and workability.
Steps of implementation:
• First Wave: o One Standardized Worksheet per pitch (Assembly and
subassembly) o One Standard Quality Sheet per pitch highlighting the
most critical work element. • Second Wave:
o One Standardized Work Sheet per 1/10th of a pitch (1 inch or 11 minutes) worth of work.
o One Standard Quality Sheet per 1/10 of a pitch (if needed)
Workability is our main focus today.
If we can make the work simple, quality, workplace organization, kaizen and morale will follow in a very natural way. Without good workability, the pull system would end up forcing work on people and that would be the worst thing we could do. Our people are very important. Without their know-how I could not build anything and I would miss shipment.

Each unit is kitted and sequenced according to the customer order. Our kits are sequentially brought, as opposed to replenished, to the line at specific addresses. One of the elements of Standardized Work is standard-in-process-stock. At ATMI, standard-in-process-stock takes the form of part components and tooling. Against the location of the part and the tool we can establish smooth work in the station (even if it means that tools must be duplicated). The operator can keep the best sequence of operation while quickly knowing if he’s ahead or behind. At this stage ATMI has learned so much that they can do many things by themselves. They are now working on the ABC line.
Work is Pulled by the Customer: No Over-production, No Push.
ATMI is also working back in the warehouse and production control. The objective is to connect the entire value stream in one single continuous flow where the work is pulled by the customer. However, we do not go right into kanban. Unless the floor is stable, kanban (Just-in-time) cannot work. At ATMI we are implementing a sequential production system. It is best for ATMI, due to part cost and quality control over outsourced components. Later, when ATMI's shop floor has connected all processes in a continuous flow, eliminated changeover, and achieved close to 100% operational availability it will

then be time to implement a simple and autonomous pull system. For the time being, however, let's look at how we are connecting our different functions in the organization.
Basic Schematic:
The lead-time diagram provides detailed understanding of how quickly we can respond to a customer order.

Results: Excerpt from the project summary to the Executive Officers of ATMI.

“ Although we have only addressed a small portion of what TPS can offer at this time, I wanted to summarize for you the results achieved in approximately 6.5 months, from 11/20/00 to 5/11/01, specifically in the areas of cost, lead-time and quality. These results are relevant to the XXX product line only, where the pilot implementation team focused its attention.
Cost:
Labor - 66% improvement
� The Vector product line in the Napa facility is now capable of producing the same number of units with approximately one third of the initial labor required (from over 18 people down to 6).
Inventory reduction (work-in-process) - 84% improvement
� We are now building each unit subassembly in a lot size of one, just in time against the actual pull of the final configuration line. Each final configuration is built just in time, on demand, and in sequence.
Capital requirements reduction (real estate) - 41% improvement
� By connecting processes in a one-piece continuous flow, space utilization requirements were reduced by over 41%. This space is now open to accommodate new product lines.
Lead-time:
Manufacturing lead-time - 80% improvement
� From subassembly to finished goods, the initial lead-time was X. A vector can now be sub assembled and assembled in 20% of the initial time. However, as shop floor stability improves, the layout is designed to support a lead-time of 10% of the initial lead-time.
Quality:
Defects per tool due to operation standard – 3% improvement � In TPS quality is built into the process, and defects are not allowed to be
passed onto the following process. Thus, the meaning of establishing a new shift schedule design to bring together standardized work and fixed position stops in the workstation. The next step would have been to implement Andon and Poka yoke.
Quality due to actual workmanship in the line improved while:
� The workforce was reduced by 2/3 which results in knowledge and skill loss
� Introducing a learning curve due to changes in manufacturing methods

� Cross training all operators
� Changing the sequence of operations
� Reducing safety inventory line side
� Non-standard units increased over 12 fold
� Introducing a deep cultural change by eliminating over-production.
It is not possible to know how many operator-related workmanship defects would have been recorded due to the dramatic rise in non-standard build without the benefits of TPS. I am confident that focused attention has been given to not pass bad quality to the following process as it is an essential point of TPS.
The results achieved so far (not including the learning from key individuals that will be applied to the other lines) represent an annualized savings of about $1.6 million (not including the 3% quality improvement).
BEFORE TPS IMPLEMENTATION AFTER PARTIAL TPS IMPLEMENTATION
TOTAL ANNUALIZED PROCESS COST $2,821,788.00 CURRENT TOTAL ANNUALIZED PROCESS COST$1,197,540
TARGET TOTAL ANNUALIZED PROCESS COST $992,260.00 INVESTMENT XXX
COST REDUCTION OPPORTUNITY $1,829,528.00 COST REDUCTION REALIZED 1,474,248
PERCENT IMPROVEMENT OPPORTUNITY 184.38% PERCENT IMPROVEMENT 123.11%
Certainly, the process savings and lead-time reduction are notable at this time. In the final analysis what counts, however, is not the amount of improvement but rather if ATMI is now improving faster than its competitors. Quite possibly what will ultimately distinguish ATMI from its competitors could come down to rather subtle issues of dollars and minutes as the product becomes more of a commodity. The question is, how good should ATMI be? Making ATMI better than its competitors will be more difficult to achieve from this point forward. Several advanced TPS tools and techniques necessary to achieve that level of operational excellence must still be implemented. >>
For more information about this project you can call:
Dave Steffen Plan manager, ATMI, 707-257-1960


![Gcmmf Case Tps[1]](https://static.fdocuments.in/doc/165x107/54500d8eaf7959ff088b4954/gcmmf-case-tps1.jpg)

