ACROSS EUROPEAN NUTS-2 REGIONS · join the club convergence in population ageing across european...
33
Join the club CONVERGENCE IN POPULATION AGEING ACROSS EUROPEAN NUTS-2 REGIONS ILYA KASHNITSKY * , JOOP DE BEER , LEO VAN WISSEN, NICOLE VAN DER GAAG RSA Annual Conference 2016-04-05 * Corresponding author: [email protected]
Transcript of ACROSS EUROPEAN NUTS-2 REGIONS · join the club convergence in population ageing across european...

Join the club CONVERGENCE IN POPULATION AGEING ACROSS EUROPEAN NUTS-2 REGIONS
ILYA KASHNITSKY *, JOOP DE BEER , LEO VAN WISSEN,
NICOLE VAN DER GAAG
RSA Annual Conference 2016-04-05
* Corresponding author: [email protected]

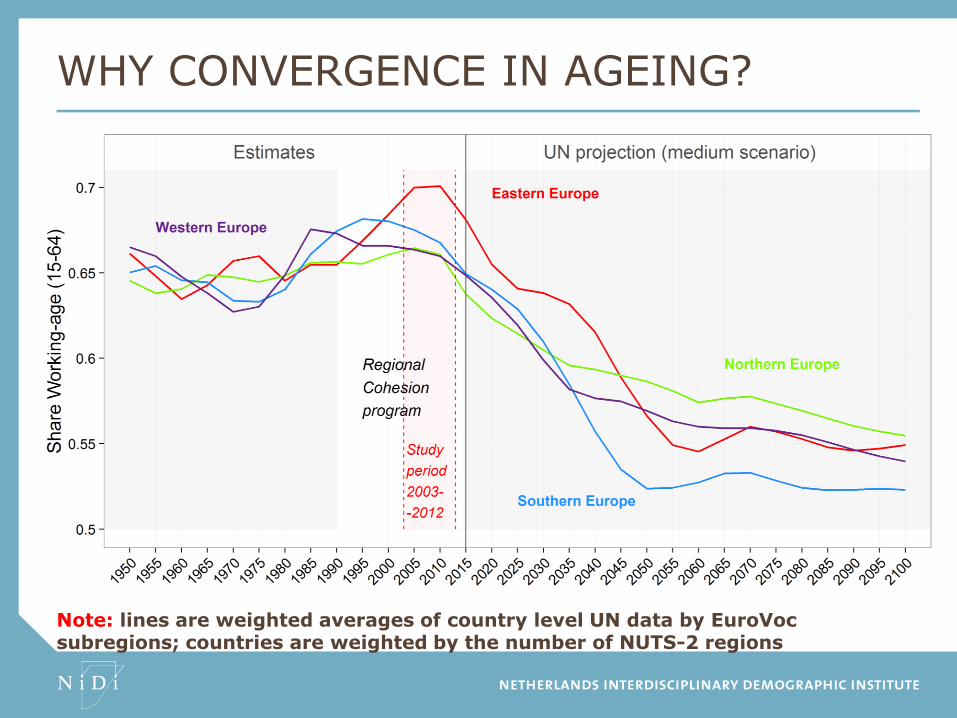
WHY CONVERGENCE IN AGEING?

WHY CONVERGENCE IN AGEING?
Cohesion Policy (success story ?)

WHY CONVERGENCE IN AGEING?
Cohesion Policy (success story ?)
Population ageing, a big challenge
WHY CONVERGENCE IN AGEING?
Note: lines are weighted averages of country level UN data by EuroVoc subregions; countries are weighted by the number of NUTS-2 regions
WHY CONVERGENCE IN AGEING?
Cohesion Policy (success story ?)
Population ageing, a big challenge
Ageing has a downwards effect on economic
output

WHY CONVERGENCE IN AGEING?
Cohesion Policy (success story ?)
Population ageing, a big challenge
Ageing has a downwards effect on economic
output
To what extent convergence in income can be
explained with convergence in ageing?

DATA & METHODS
European Union 27, 261 NUTS-2 regions
Population data: Eurostat, self harmonized
Economic data (GDP): Cambridge Regional
Database

DATA & METHODS
European Union 27, 261 NUTS-2 regions
Population data: Eurostat, self harmonized
Economic data (GDP): Cambridge Regional
Database
Measure variable for ageing:
share of working-age population (15-64/total)

DATA & METHODS
European Union 27, 261 NUTS-2 regions
Population data: Eurostat, self harmonized
Economic data (GDP): Cambridge Regional
Database
Measure variable for ageing:
share of working-age population (15-64/total)
Sigma-convergence VS beta-convergence

SIGMA-CONVERGENCE VS BETA-CONVERGENCE

SIGMA DIVERGENCE
2003 2013
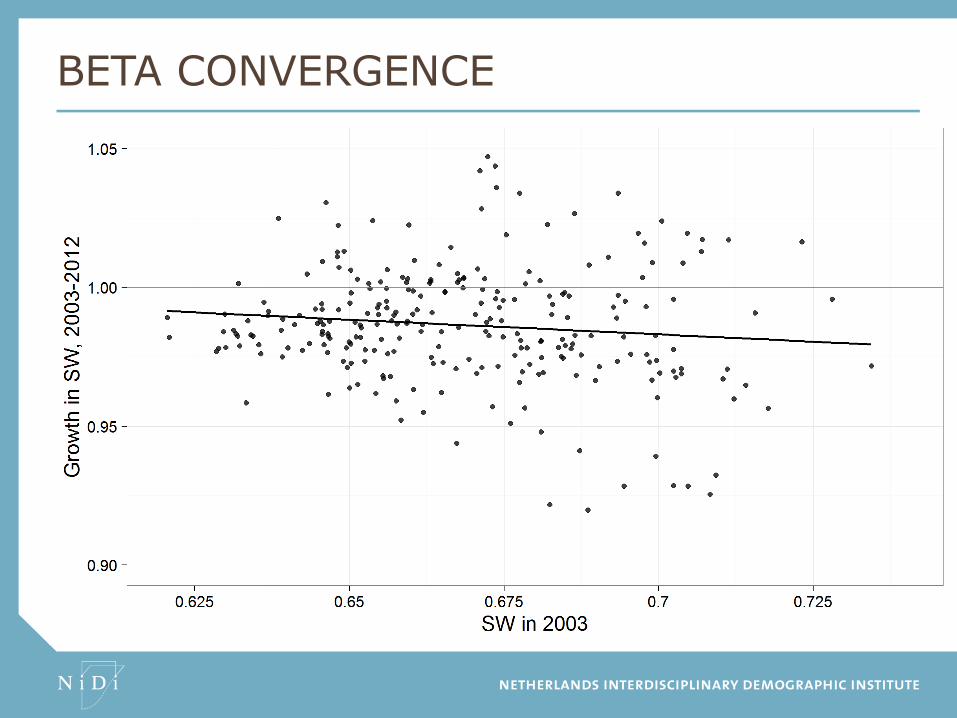
BETA CONVERGENCE

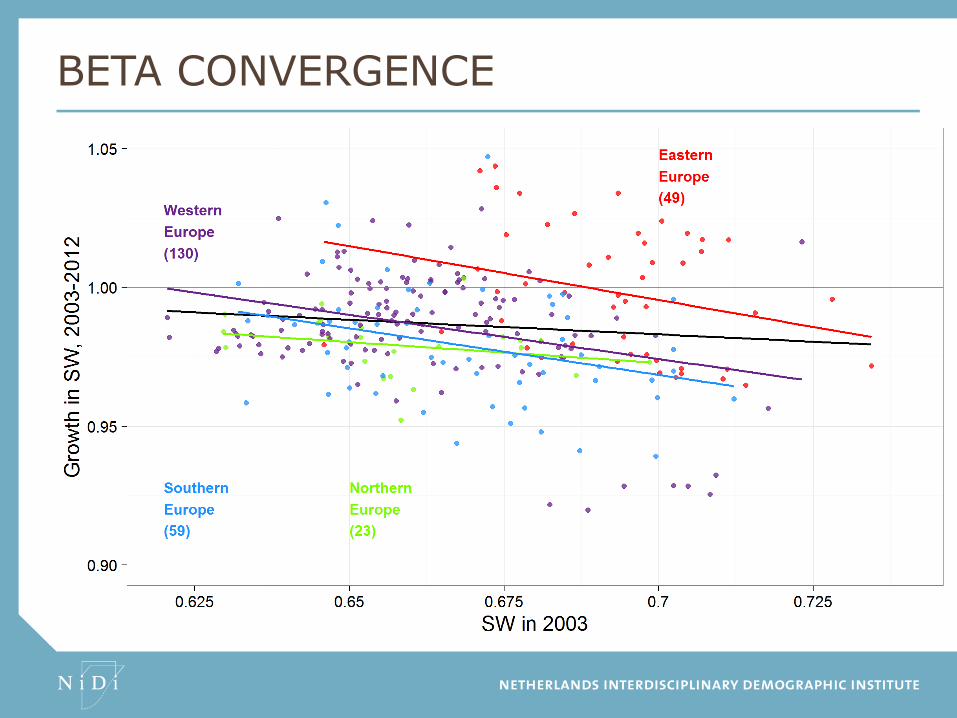
BETA CONVERGENCE
BETA CONVERGENCE

CONVERGENCE IN AGEING
beta sigma
CV of the share of working-age population increased from 3.38% to 3.79%, an increase of 12.2%
Europe,
global
Europe,
conditional
(Intercept) 1.06 (0.04)*** 1.20 (0.04)***
Initial WR -0.11 (0.06) -0.32 (0.06)***
Western (ref) NA
Eastern 0.02 (0.00)***
Northern -0.01 (0.00)
Southern -0.01 (0.00)
R2 0.01 0.18
Adj. R2 0.01 0.17
Num. obs. 261 261
RMSE 0.02 0.02
***p < 0.001, **p < 0.01, *p < 0.05;
standard errors in parenthesis
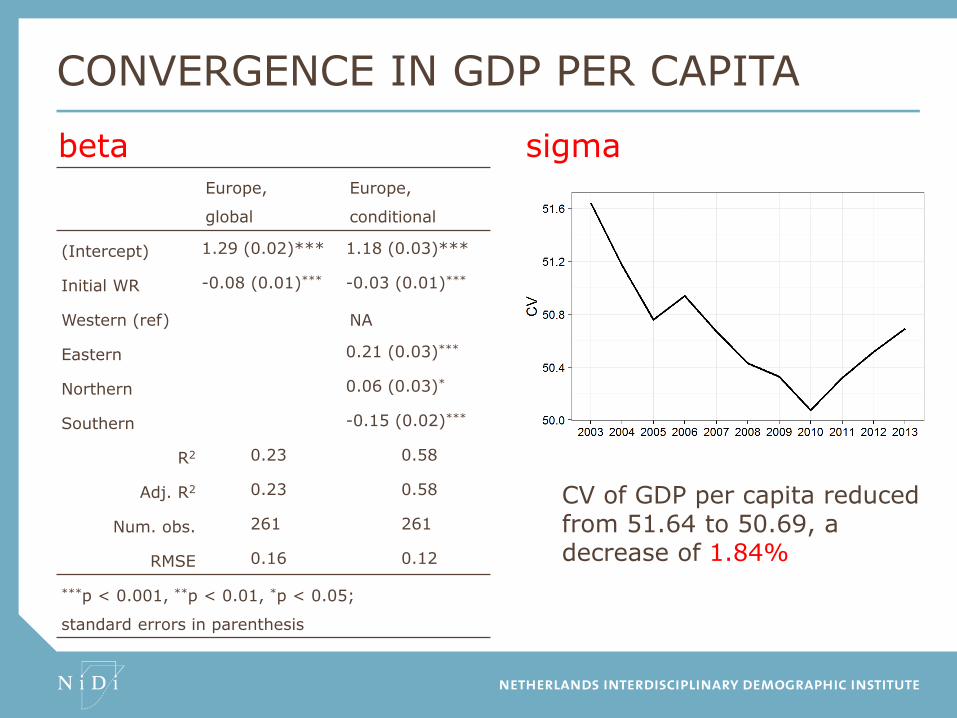
CONVERGENCE IN GDP PER CAPITA
Europe,
global
Europe,
conditional
(Intercept) 1.29 (0.02)*** 1.18 (0.03)***
Initial WR -0.08 (0.01)*** -0.03 (0.01)***
Western (ref) NA
Eastern 0.21 (0.03)***
Northern 0.06 (0.03)*
Southern -0.15 (0.02)***
R2 0.23 0.58
Adj. R2 0.23 0.58
Num. obs. 261 261
RMSE 0.16 0.12
***p < 0.001, **p < 0.01, *p < 0.05;
standard errors in parenthesis
beta sigma
CV of GDP per capita reduced from 51.64 to 50.69, a decrease of 1.84%

CORRELATION: INCOME AND AGEING
Europe,
global
Europe,
conditional
(Intercept) -1.34 (0.50)** 0.34 (0.36)
Initial WR 2.49 (0.51)*** 0.76 (0.37)*
Western (ref) NA
Eastern 0.28 (0.02)***
Northern 0.06 (0.03)*
Southern -0.12 (0.02)***
R2 0.09 0.57
Adj. R2 0.08 0.56
Num. obs. 261 261
RMSE 0.17 0.12
***p < 0.001, **p < 0.01, *p < 0.05;
standard errors in parenthesis

CORRELATION: INCOME AND AGEING
There is a positive
correlation between
growth in GDP per capita
and growth the share of
working-age population
Europe,
global
Europe,
conditional
(Intercept) -1.34 (0.50)** 0.34 (0.36)
Initial WR 2.49 (0.51)*** 0.76 (0.37)*
Western (ref) NA
Eastern 0.28 (0.02)***
Northern 0.06 (0.03)*
Southern -0.12 (0.02)***
R2 0.09 0.57
Adj. R2 0.08 0.56
Num. obs. 261 261
RMSE 0.17 0.12
***p < 0.001, **p < 0.01, *p < 0.05;
standard errors in parenthesis

CORRELATION: INCOME AND AGEING
There is a positive
correlation between
growth in GDP per capita
and growth the share of
working-age population
There are big differences
between subregions: the
dummies explain half of
the variance in GDP per
capita growth
Europe,
global
Europe,
conditional
(Intercept) -1.34 (0.50)** 0.34 (0.36)
Initial WR 2.49 (0.51)*** 0.76 (0.37)*
Western (ref) NA
Eastern 0.28 (0.02)***
Northern 0.06 (0.03)*
Southern -0.12 (0.02)***
R2 0.09 0.57
Adj. R2 0.08 0.56
Num. obs. 261 261
RMSE 0.17 0.12
***p < 0.001, **p < 0.01, *p < 0.05;
standard errors in parenthesis

EFFECT OF AGEING ON INCOME CONVERGENCE
𝐺𝐷𝑃2 𝑃2
𝐺𝐷𝑃1 𝑃1 =
𝐺𝐷𝑃2 𝑊2
𝐺𝐷𝑃1 𝑊1 x
𝑊2 𝑃2
𝑊1 𝑃1
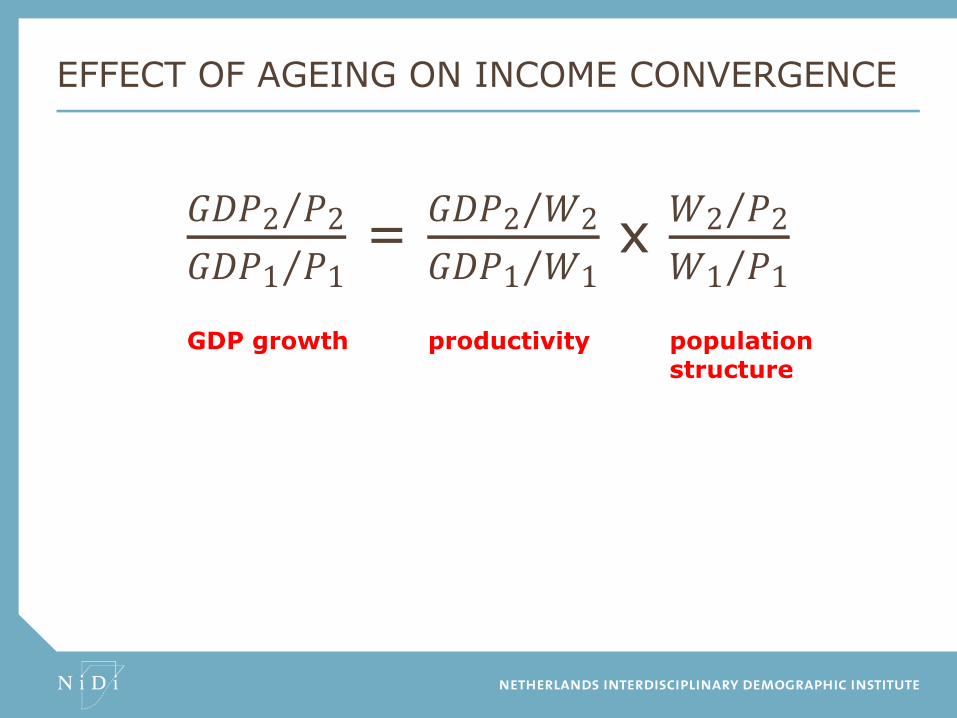
EFFECT OF AGEING ON INCOME CONVERGENCE
𝐺𝐷𝑃2 𝑃2
𝐺𝐷𝑃1 𝑃1 =
𝐺𝐷𝑃2 𝑊2
𝐺𝐷𝑃1 𝑊1 x
𝑊2 𝑃2
𝑊1 𝑃1
GDP growth productivity population structure

EFFECT OF AGEING ON INCOME CONVERGENCE
𝐺𝐷𝑃2 𝑃2
𝐺𝐷𝑃1 𝑃1 =
𝐺𝐷𝑃2 𝑊2
𝐺𝐷𝑃1 𝑊1 x
𝑊2 𝑃2
𝑊1 𝑃1
GDP growth productivity population structure
𝐺𝐷𝑃1 𝑃1 x 𝐺𝐷𝑃2 𝑊2
𝐺𝐷𝑃1 𝑊1 x
𝑊2 𝑃2
𝑊1 𝑃1 = 𝐺𝐷𝑃2 𝑃2

EFFECT OF AGEING ON INCOME CONVERGENCE
51.64 (1)
𝐺𝐷𝑃1 𝑃1 x 𝐺𝐷𝑃2 𝑊2
𝐺𝐷𝑃1 𝑊1 x
𝑊2 𝑃2
𝑊1 𝑃1 = 𝐺𝐷𝑃2 𝑃2
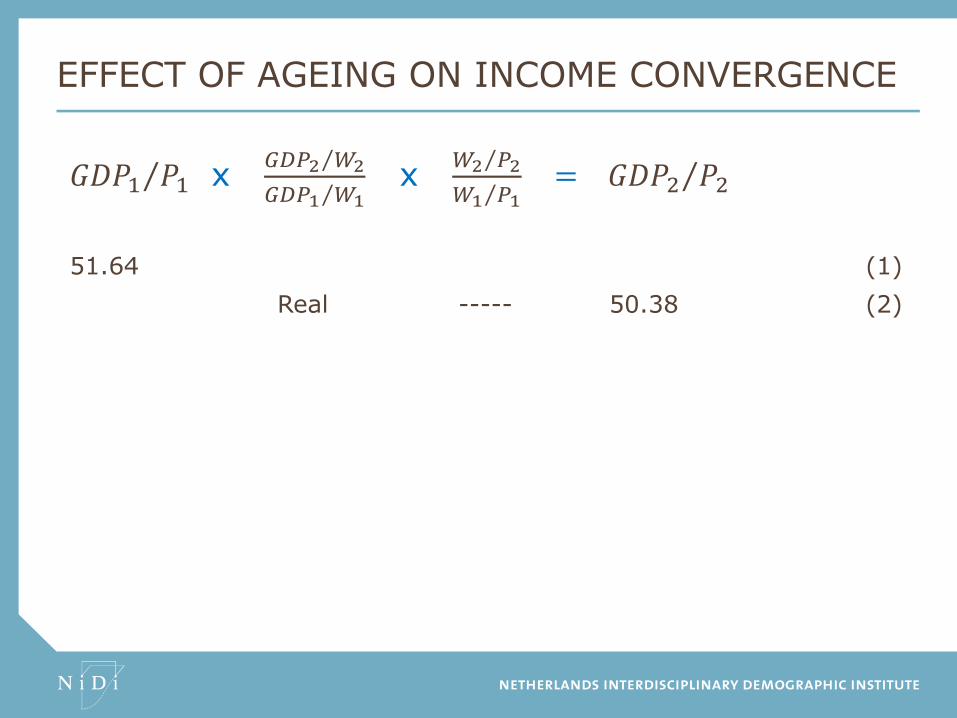
EFFECT OF AGEING ON INCOME CONVERGENCE
51.64 (1)
Real ----- 50.38 (2)
𝐺𝐷𝑃1 𝑃1 x 𝐺𝐷𝑃2 𝑊2
𝐺𝐷𝑃1 𝑊1 x
𝑊2 𝑃2
𝑊1 𝑃1 = 𝐺𝐷𝑃2 𝑃2

EFFECT OF AGEING ON INCOME CONVERGENCE
51.64 (1)
Real ----- 50.38 (2)
Real Real 50.69 (3)
𝐺𝐷𝑃1 𝑃1 x 𝐺𝐷𝑃2 𝑊2
𝐺𝐷𝑃1 𝑊1 x
𝑊2 𝑃2
𝑊1 𝑃1 = 𝐺𝐷𝑃2 𝑃2
Divergence in ageing (real) reduces income convergence by 24.4%

EFFECT OF AGEING ON INCOME CONVERGENCE
51.64 (1)
Real ----- 50.38 (2)
Real Real 50.69 (3)
Real Fit 50.03 (4)
𝐺𝐷𝑃1 𝑃1 x 𝐺𝐷𝑃2 𝑊2
𝐺𝐷𝑃1 𝑊1 x
𝑊2 𝑃2
𝑊1 𝑃1 = 𝐺𝐷𝑃2 𝑃2
Divergence in ageing (real) reduces income convergence by 24.4% Convergence in ageing (beta-convergence model fit) increases income convergence by 28.4%
CONCLUSIONS
Convergence in ageing: sigma divergence; weak beta
convergence; club convergence

CONCLUSIONS
Convergence in ageing: sigma divergence; weak beta
convergence; club convergence
Convergence in income: sigma convergence; moderate beta
convergence; club convergence

CONCLUSIONS
Convergence in ageing: sigma divergence; weak beta
convergence; club convergence
Convergence in income: sigma convergence; moderate beta
convergence; club convergence
Convergence in ageing is positively related with convergence in
income
CONCLUSIONS
Convergence in ageing: sigma divergence; weak beta
convergence; club convergence
Convergence in income: sigma convergence; moderate beta
convergence; club convergence
Convergence in ageing is positively related with convergence in
income
Changes in the share of working-age population account for
8.5% of regional income growth
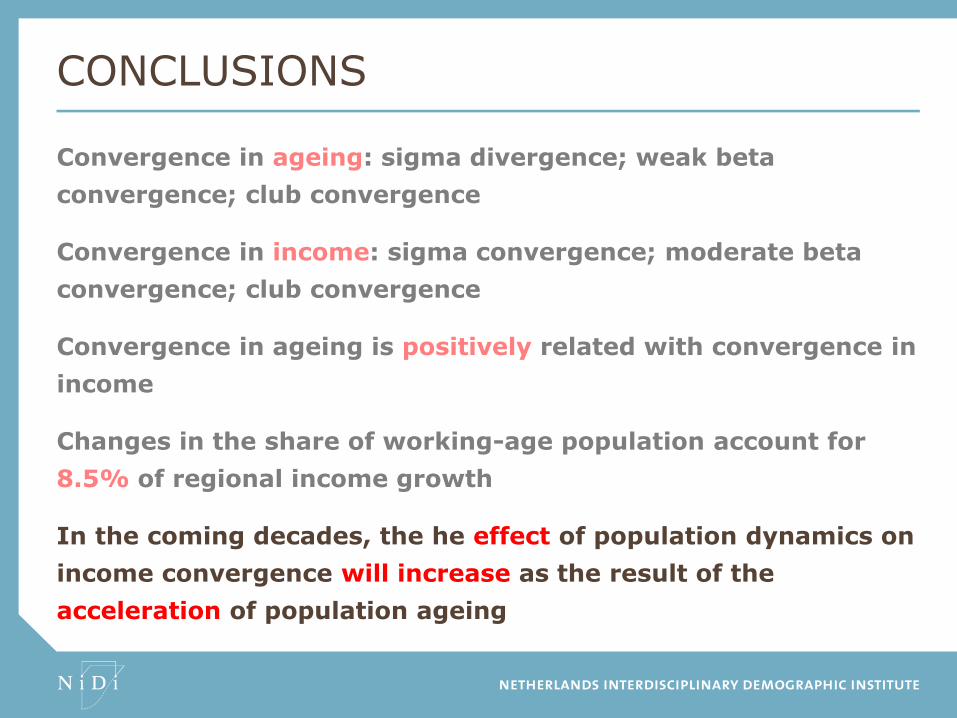
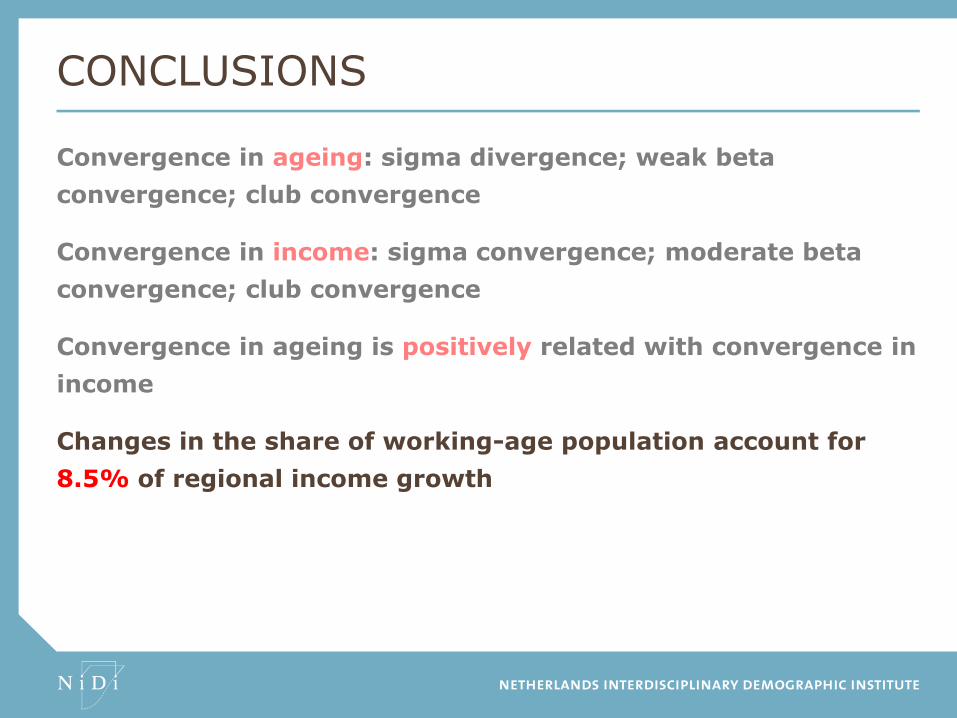
In the coming decades, the he effect of population dynamics on
income convergence will increase as the result of the
acceleration of population ageing

NIDI is an institute of the Royal Netherlands Academy of Arts and Sciences KNAW and is affliated to the University of Groningen www.nidi.nl
thank you
ILYA KASHNITSKY ([email protected])
JOOP DE BEER
LEO VAN WISSEN
NICOLE VAN DER GAAG