Acquiring Customers via Word-of-Mouth Referrals: A ...
40
“Acquiring Customers via Word-of-Mouth Referrals: A Virtuous Strategy?” © 2015 Constant Pieters and Aurélie Lemmens; Report Summary © 2015 Marketing Science Institute MSI working papers are distributed for the benefit of MSI corporate and academic members and the general public. Reports are not to be reproduced or published in any form or by any means, electronic or mechanical, without written permission. Marketing Science Institute Working Paper Series 2015 Report No. 15-123 Acquiring Customers via Word-of-Mouth Referrals: A Virtuous Strategy? Constant Pieters and Aurélie Lemmens
Transcript of Acquiring Customers via Word-of-Mouth Referrals: A ...

“Acquiring Customers via Word-of-Mouth Referrals: A Virtuous Strategy?” © 2015 Constant Pieters and Aurélie Lemmens; Report Summary © 2015 Marketing Science Institute
MSI working papers are distributed for the benefit of MSI corporate and academic members
and the general public. Reports are not to be reproduced or published in any form or by any means, electronic or mechanical, without written permission.
Marketing Science Institute Working Paper Series 2015
Report No. 15-123
Acquiring Customers via Word-of-Mouth Referrals: A Virtuous Strategy?
Constant Pieters and Aurélie Lemmens
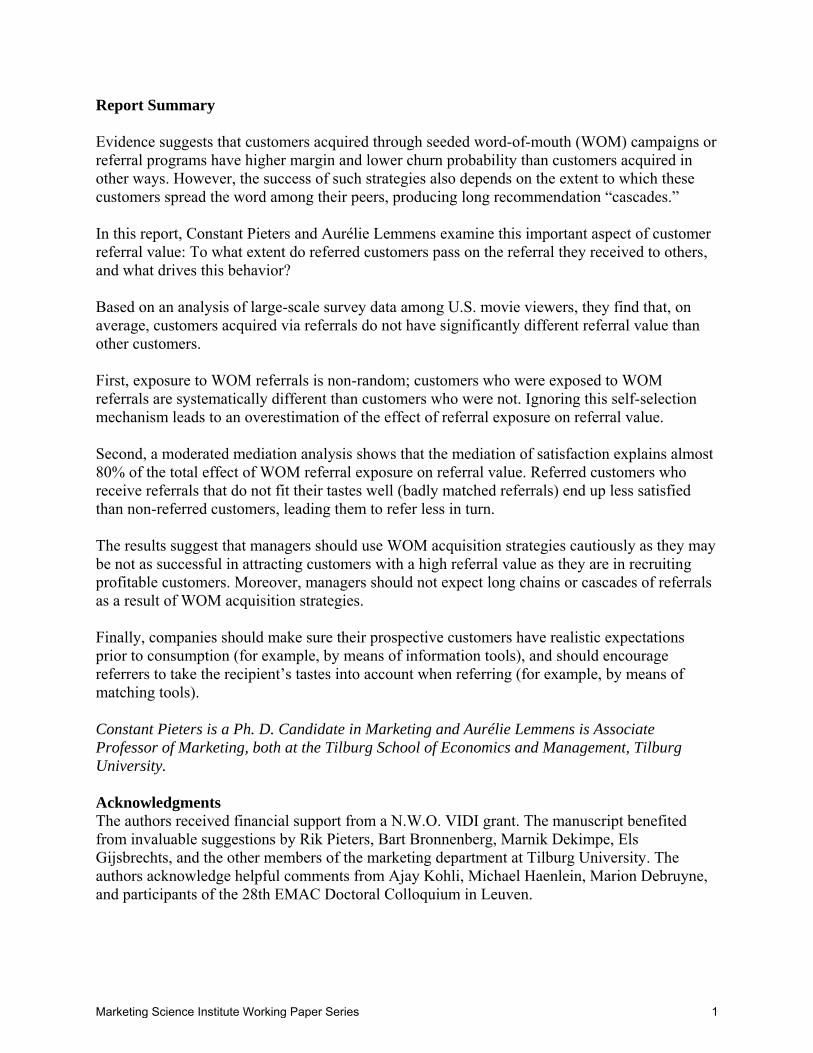
Report Summary
Evidence suggests that customers acquired through seeded word-of-mouth (WOM) campaigns or referral programs have higher margin and lower churn probability than customers acquired in other ways. However, the success of such strategies also depends on the extent to which these customers spread the word among their peers, producing long recommendation “cascades.” In this report, Constant Pieters and Aurélie Lemmens examine this important aspect of customer referral value: To what extent do referred customers pass on the referral they received to others, and what drives this behavior? Based on an analysis of large-scale survey data among U.S. movie viewers, they find that, on average, customers acquired via referrals do not have significantly different referral value than other customers. First, exposure to WOM referrals is non-random; customers who were exposed to WOM referrals are systematically different than customers who were not. Ignoring this self-selection mechanism leads to an overestimation of the effect of referral exposure on referral value. Second, a moderated mediation analysis shows that the mediation of satisfaction explains almost 80% of the total effect of WOM referral exposure on referral value. Referred customers who receive referrals that do not fit their tastes well (badly matched referrals) end up less satisfied than non-referred customers, leading them to refer less in turn. The results suggest that managers should use WOM acquisition strategies cautiously as they may be not as successful in attracting customers with a high referral value as they are in recruiting profitable customers. Moreover, managers should not expect long chains or cascades of referrals as a result of WOM acquisition strategies. Finally, companies should make sure their prospective customers have realistic expectations prior to consumption (for example, by means of information tools), and should encourage referrers to take the recipient’s tastes into account when referring (for example, by means of matching tools). Constant Pieters is a Ph. D. Candidate in Marketing and Aurélie Lemmens is Associate
Professor of Marketing, both at the Tilburg School of Economics and Management, Tilburg
University.
Acknowledgments
The authors received financial support from a N.W.O. VIDI grant. The manuscript benefited from invaluable suggestions by Rik Pieters, Bart Bronnenberg, Marnik Dekimpe, Els Gijsbrechts, and the other members of the marketing department at Tilburg University. The authors acknowledge helpful comments from Ajay Kohli, Michael Haenlein, Marion Debruyne, and participants of the 28th EMAC Doctoral Colloquium in Leuven.
Marketing Science Institute Working Paper Series 1
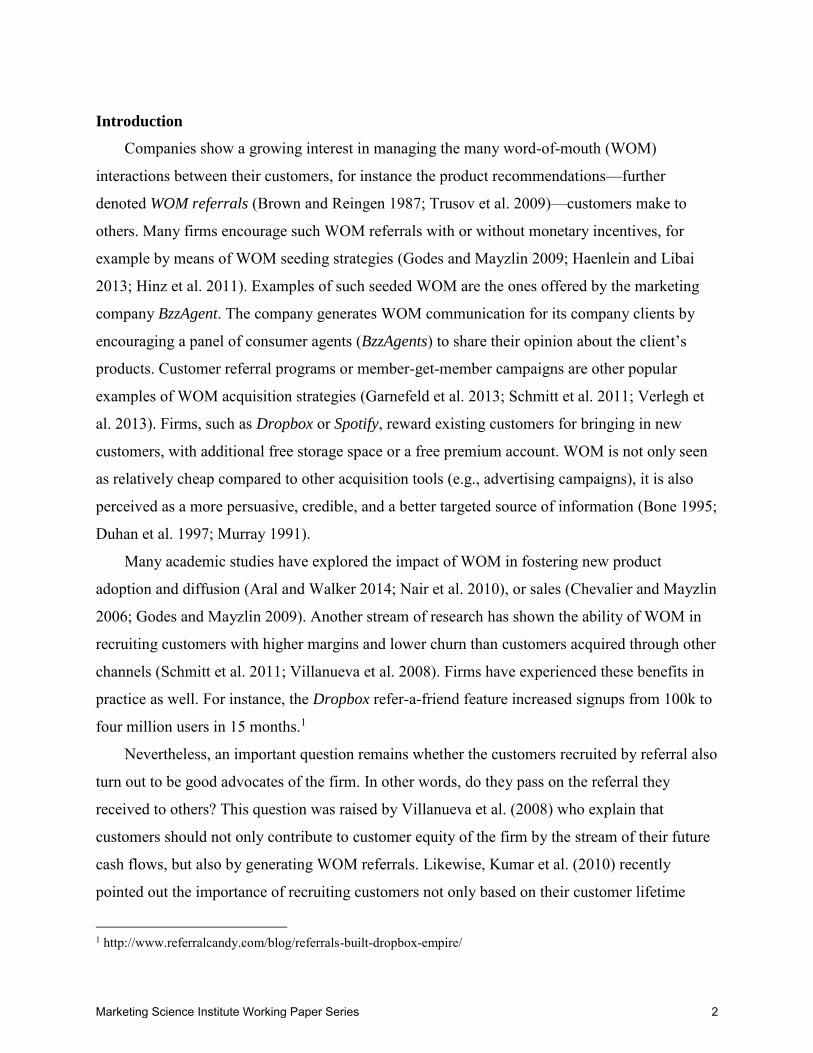
Introduction
Companies show a growing interest in managing the many word-of-mouth (WOM)
interactions between their customers, for instance the product recommendations—further
denoted WOM referrals (Brown and Reingen 1987; Trusov et al. 2009)—customers make to
others. Many firms encourage such WOM referrals with or without monetary incentives, for
example by means of WOM seeding strategies (Godes and Mayzlin 2009; Haenlein and Libai
2013; Hinz et al. 2011). Examples of such seeded WOM are the ones offered by the marketing
company BzzAgent. The company generates WOM communication for its company clients by
encouraging a panel of consumer agents (BzzAgents) to share their opinion about the client’s
products. Customer referral programs or member-get-member campaigns are other popular
examples of WOM acquisition strategies (Garnefeld et al. 2013; Schmitt et al. 2011; Verlegh et
al. 2013). Firms, such as Dropbox or Spotify, reward existing customers for bringing in new
customers, with additional free storage space or a free premium account. WOM is not only seen
as relatively cheap compared to other acquisition tools (e.g., advertising campaigns), it is also
perceived as a more persuasive, credible, and a better targeted source of information (Bone 1995;
Duhan et al. 1997; Murray 1991).
Many academic studies have explored the impact of WOM in fostering new product
adoption and diffusion (Aral and Walker 2014; Nair et al. 2010), or sales (Chevalier and Mayzlin
2006; Godes and Mayzlin 2009). Another stream of research has shown the ability of WOM in
recruiting customers with higher margins and lower churn than customers acquired through other
channels (Schmitt et al. 2011; Villanueva et al. 2008). Firms have experienced these benefits in
practice as well. For instance, the Dropbox refer-a-friend feature increased signups from 100k to
four million users in 15 months.1
Nevertheless, an important question remains whether the customers recruited by referral also
turn out to be good advocates of the firm. In other words, do they pass on the referral they
received to others? This question was raised by Villanueva et al. (2008) who explain that
customers should not only contribute to customer equity of the firm by the stream of their future
cash flows, but also by generating WOM referrals. Likewise, Kumar et al. (2010) recently
pointed out the importance of recruiting customers not only based on their customer lifetime
1 http://www.referralcandy.com/blog/referrals-built-dropbox-empire/
Marketing Science Institute Working Paper Series 2
value (CLV), but also taking into account their customer referral value (CRV), that characterizes
the number of WOM referrals a customer makes. They find that the customers with the highest
CRV are typically not the ones with the highest CLV. The success of WOM referral strategies
does not only depend on the CLV of the acquired customers to the firm but also on the extent to
which referred customers continue spreading the good word among their peers (Haenlein and
Libai 2013), which would allow the production of long recommendation cascades or referral
chains (Goel et al. 2012; Leskovec et al. 2007).
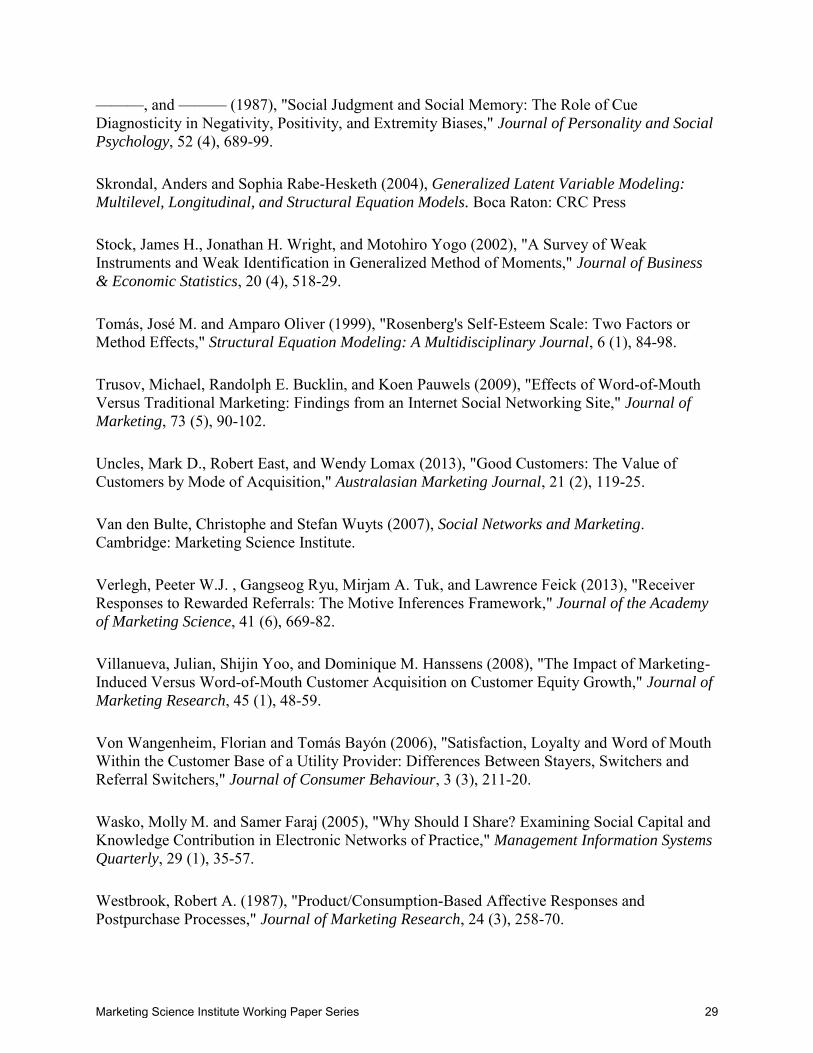
Several studies have recently investigated the effect of WOM referral exposure on WOM
referral giving. These are summarized in Table 1 (Tables follow References throughout).2 One
stream of research has found, using individual-level survey data, a positive correlation between
receiving and giving referrals (File et al. 1994; Sheth 1971; Uncles et al. 2013; Von
Wangenheim and Bayón 2006). Recently, Yang et al. (2012) also found a synergy effect between
receiving and giving referrals in that customers get utility from engaging in both actions. These
results have been corroborated by a second stream of studies that has analyzed aggregate time-
series of customer acquisition via referrals (Trusov et al. 2009; Villanueva et al. 2008). They
concluded that customers exposed to WOM referrals contribute to higher referral acquisition
rates in future time periods, compared to customers acquired through traditional marketing
channels. A third stream of work has collected individual-level real-life referral network data
(Goel et al. 2012; Leskovec et al. 2007). In contrast to what other studies would have predicted,
they find that cascades of referrals are rare in practice, suggesting that the effect of referrals on
subsequent referral value might actually be more limited than previously assumed.
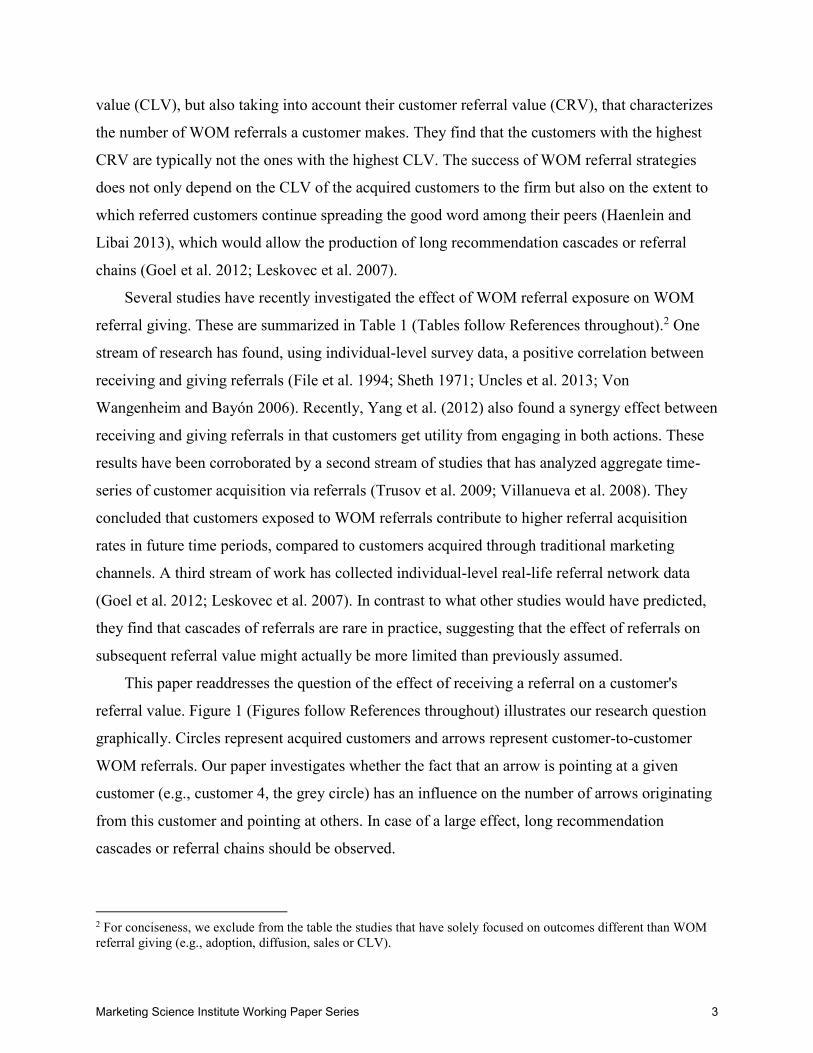
This paper readdresses the question of the effect of receiving a referral on a customer's
referral value. Figure 1 (Figures follow References throughout) illustrates our research question
graphically. Circles represent acquired customers and arrows represent customer-to-customer
WOM referrals. Our paper investigates whether the fact that an arrow is pointing at a given
customer (e.g., customer 4, the grey circle) has an influence on the number of arrows originating
from this customer and pointing at others. In case of a large effect, long recommendation
cascades or referral chains should be observed.
2 For conciseness, we exclude from the table the studies that have solely focused on outcomes different than WOM referral giving (e.g., adoption, diffusion, sales or CLV).
Marketing Science Institute Working Paper Series 3
In contrast to previous work, this study takes into account the potential self-selection
mechanism by which receiving a product recommendation is a non-random process. Previous
work points out to the possibility that the customers exposed to referrals are intrinsically
different from the customers non-exposed to referrals. For instance, Uncles et al. (2013) note that
customers with a wide circle of friends and a greater interest in products naturally receive and
make more referrals than others. We expect two sources of endogenous selection. First, some
customers may be more likely to activate others to discuss their consumption experiences, while
simultaneously being more inclined to seek social contacts. Similarly, some products are simply
more likely to be talked about (Berger and Schwartz 2011), leading to a potentially spurious
correlation between receiving and giving referrals. From a managerial viewpoint, it is important
to correct for endogeneity because one could erroneously attribute the differences in referral
value to the exposure to referrals, and thus overestimate the effectiveness of WOM acquisition
strategies. To solve this problem, we use an instrumental variable approach in which we specify
a selection equation and allow the error terms of the various equations to be correlated (Skrondal
and Rabe-Hesketh 2004).
In addition to measuring the effect of referral exposure to a customer’s subsequent referral
value, the paper also contributes to the literature by shedding light on the mechanisms driving
this effect. Understanding the underlying mechanisms provides guidelines on how to improve
WOM strategies. To do so, we perform a moderated mediation analysis. First, the model tests the
moderating role of referral match, the extent to which referrals are well-matched to the
recipient’s preferences. Second, we investigate the mediating role of customer satisfaction.
We collect individual referral data via a large-scale survey among a sample of 851
customers in the motion-picture industry. The experiential and intangible nature of movie
consumption makes WOM referral information important in this industry (Murray 1991;
Neelamegham and Jain 1999). Our data indicate the presence of a strong endogenous selection
mechanism through which the customers who received a movie recommendation turn out to be
intrinsically different from the customers who did not. After controlling for endogeneity, we find
that, on average, exposure to WOM referrals has no effect on a customer's referral value.
Interestingly, the results—when ignoring endogeneity—erroneously point to a positive relation
between receiving and giving referrals. The moderated mediation analysis shows that, when
referrals are ill-matched with the recipient’s preferences, the referred customers end up less
Marketing Science Institute Working Paper Series 4
satisfied with the referred movie than non-referred customers, leading to a lower referral value.
We find that this mechanism accounts for the majority (almost 80%) of the total effect. We
conclude the paper by providing a number of suggestions for firms to improve the satisfaction of
referred customers and, by this, the success of their WOM referral programs.
The remainder of this paper is structured as follows. In the next section, we provide a
theoretical background to shed light on the relationship between receiving and giving WOM
referrals. We then present the data, the methodology and the empirical application. This paper
closes with a discussion of managerial implications and directions for future research.
Theoretical Framework and Hypotheses
An overview of our theoretical framework is given in Figure 2. We suggest that exposure to
WOM referrals can influence the referral value of customers through the mediating effect of
satisfaction. The positive effect of satisfaction on WOM referral intention and behavior is
relatively well-established (Anderson 1998; De Matos and Rossi 2008). Hence, we verify this
relationship in our empirical analysis. However, a prerequisite for establishing the mediating role
of satisfaction is to show that WOM referral exposure affects satisfaction. The effects of WOM
exposure on satisfaction are less known. Below, we provide a theoretical background to these
effects.
Impact of WOM referral exposure on satisfaction
We define satisfaction as the pleasurable fulfillment of service (Shankar et al. 2003), and use
the expectancy disconfirmation model to develop our arguments (Oliver 1980). The expectancy
disconfirmation model is a comparative model of customer satisfaction that predicts satisfaction
to be the difference between expectations and perceived performance. A customer is predicted to
be satisfied if perceived performance exceeds her expectations, whereas a customer is
dissatisfied when perceived performance falls short of expectations (Oliver 1980). A referral a
customer receives acts as information prior to purchase upon which the customer can base her
expectations regarding performance quality (Anderson and Salisbury 2003; Murray 1991;
Zeithaml et al. 1993). In the motion-picture industry, the role of WOM in forming such
expectations is known to be particularly important because of the experiential and intangible
nature of movie consumption (Murray 1991; Neelamegham and Jain 1999), which makes it hard
for customers to form expectations by other means. Below, we provide several arguments for a
Marketing Science Institute Working Paper Series 5

positive effect of WOM referral exposure on expectations, and thus indirectly a negative effect
on satisfaction, consistent with the expectancy disconfirmation framework (Oliver, 1980;
Westbrook, 1987; Zeithaml et al., 1993).
First, the product or service referrals received by customers are positive in nature and made
by customers who positively evaluated the product or service. The more someone enjoyed a
movie, the higher his likelihood to share his positive experience and refer it to friends (Anderson
1998). Through this mechanism, referred customers are likely to receive above-than-average
positive information about a movie, compared to non-referred customers, and so to form high
expectations about the referred movie.
Second, referrals are known to be a particularly valuable source of information for
customers. According to the accessibility/diagnosticity theory (Feldman and Lynch 1988),
information in memory is likely to influence the consumer when it is accessible and diagnostic
(Bone 1995; Feldman and Lynch 1988; Herr et al. 1991). Referrals are accessible in that they are
easy to retrieve, mostly because of their vividness (Herr et al. 1991). Referrals also have a high
diagnostic value because, unlike advertising, they are transmitted by a non-commercial source,
and therefore are generally seen as credible and trustworthy (Bone 1995).
Third, research on consumer herd behavior and informational cascades suggests that
customers exposed to WOM referrals tend to disregard their own information and follow the
choices made by others (Bikhchandani et al. 1998). This behavior leads to suboptimal outcomes
(Banerjee, 1992). Customers believe that other customers have informational advantages about
the product (Huang and Chen 2006), and may even use simple heuristics to drive their decision
such as “if everyone tells me to watch this movie, I should go see it, because it should be a great
movie.” Therefore, customers infer product quality prior to purchase, and hence form
expectations, from others’ choices and evaluations.
As argued above, we expect that through these mechanisms, referred customers are more
likely to have higher expectations, end up being disappointed, and are less satisfied with their
movie experience than non-referred customers. Formally, we predict:
H1: Customers exposed to WOM referrals are, on average, less satisfied with their product
or service consumption experience than customers not exposed to WOM referrals.
Marketing Science Institute Working Paper Series 6

Moderating role of the match of the referrals with the recipient’s preferences
While we expect a negative main effect of WOM referrals on satisfaction, it is possible that
some of the customers who are exposed to WOM referrals turn out to be more satisfied with their
product choice than others. One important factor that can moderate the relationship between the
exposure to WOM referrals and satisfaction is the degree to which a referral’s recipient receives
referrals that are well-matched to his or her preferences.
In contrast to companies and other untargeted sources of information, the referring customer
tends to have a good knowledge about the referred customer’s tastes, making his or her referrals
well-matched with the recipient’s preferences (Dichter 1966). As Duhan et al. (1997) argue,
influential recommendations require knowledge of both the product and the person receiving the
recommendation, especially for products with affective evaluative cues (subjective criteria such
as taste), such as movies. Strong ties, for example close friends, are likely to be knowledgeable
of each other’s tastes and the relevance of their information (Brown and Reingen 1987; Duhan et
al. 1997). Moreover, homophily, the tendency for people to interact with people like them,
suggests that customers are likely to share their experience with people that are similar to
themselves (Brown and Reingen 1987; McPherson et al. 2001; Schmitt et al. 2011; Van den
Bulte and Wuyts 2007). The homophily in taste between these customers is likely to increase the
odds of satisfaction on the recipient side.
We expect that the extent to which customers receive well-matched referrals will moderate
the negative effect of exposure to WOM referrals on satisfaction. In particular, referred
customers who typically receive well-matched referrals are expected to show a higher level of
satisfaction than customers who typically receive ill-matched referrals. Formally:
H2: The degree to which a referral’s recipient receives well-matched referrals moderates
the relationship between the exposure to WOM referrals and satisfaction, in that customers who
are exposed to referrals and receive well-matched referrals are more satisfied with the product
or service consumption experience than customers who receive ill-matched referrals.
Impact of satisfaction on WOM referral value
A second condition for satisfaction to be mediating the effect of WOM referral exposure and
the referral match moderator on WOM referral value is that there also exists an effect of
satisfaction on WOM referral value. Customer satisfaction with a consumption experience is
Marketing Science Institute Working Paper Series 7
regarded as a key antecedent of product- or service-related WOM (Anderson 1998; De Matos
and Rossi 2008; Westbrook 1987). The higher the satisfaction of an individual with a
consumption experience, the greater the amount of recommendations she is likely to make.
Several reasons for this effect are captured in the utility-based model proposed by Anderson
(1998), who asserts that a customer’s utility of referring a product of service increases as the
satisfaction with product experience increases.
First, extreme information is more accessible than moderate information (Anderson 1998).
A very satisfying product experience is more memorable and thus more likely to be talked about
than a less satisfying product experience. Moreover, extreme information has been found to be
more diagnostic: an extreme cue provides more utility in discriminating between alternative
categories than a less extreme cue (Anderson 1998; Skowronski and Carlston 1989; Skowronski
and Carlston 1987). As such, higher satisfaction has a strong impact on WOM behavior as it
allows customers to easily categorize the product in the “talk about” compared to “not talk
about” category while moderate satisfaction makes categorization ambiguous.
Second, customers often engage in WOM referrals to bring back positive feelings to relive
the pleasurable product experience and elicit positive feelings (Berger 2014). Dichter (1966)
refers to WOM referrals as having the function of “verbal consumption.” A more satisfying
consumption experience is therefore more likely to be talked about for these purposes as it is
surrounded by more positive feelings that can be retrieved.
Third, a common motive for customers to engage in WOM referrals is self-enhancement
(Berger 2014; De Angelis et al. 2012), where customers talk about favorable and interesting
things to look good in front of their peers and create good impressions. Customers can get
positive recognition from others by linking these favorable impressions with themselves by
talking about them. For this purpose, the more positive a consumption experience is perceived by
the customer, the more it makes the customer look interesting in front of their peers, making it
more suitable to talk about for self-enhancement purposes.
All in all, these motives suggest that the more satisfied a customer is, the more likely she
will share her experience with others. A recent meta-analysis by De Matos and Rossi (2008)
gives strong empirical support for this positive relationship. While we do not formally
hypothesize the relationship between satisfaction and referral value, we aim to empirically verify
the findings above with a moderated mediation analysis.
Marketing Science Institute Working Paper Series 8
Data and Variables
In order to test our hypotheses, we ran a large-scale survey in August 2014 among movie
viewers in the United States. The survey investigated the WOM referral behavior of the
respondents and contained a number of psychometric scales necessary to test our hypotheses. In
order to control for inherent differences that exist between the movies watched by the
respondents, we combined the survey with data on movie characteristics that we extract from the
Internet Movie Database (IMDb; www.IMDb.com).
Our choice to use a survey is consistent with current practice in the WOM literature
(Anderson 1998; File et al. 1994; Neelamegham and Jain 1999; Uncles et al. 2013; Von
Wangenheim and Bayón 2006; Westbrook 1987; Yang et al. 2012). In light of our research
objectives, our survey items have multiple benefits over other data types such as social network
data (Goel et al. 2012; Leskovec et al. 2007), or aggregate time-series (Trusov et al. 2009;
Villanueva et al. 2008). First, they allow us to measure individual psychometric constructs (e.g.,
satisfaction with a consumption experience) that are latent and difficult to measure with
secondary data. Second, they provide us the instruments we need to handle the issue of
endogenous selection. As the selection mechanism operates on the individual level—customers
who are exposed to WOM referrals are systematically different from those who were not—it is
challenging for aggregate time-series data to capture individual-level selection effects. Large-
scale social network data, albeit on the individual level, suffers from similar concerns as finding
instrumental variables is extremely challenging, although (costly) field experiments or (difficult
to find) natural experiments may be employed (Aral and Walker 2014). As survey data is prone
to measurement error and recollection bias, which may limit the generalizability of the study, we
use a structural equation model with a measurement component in order to account for
measurement error (Bagozzi and Yi 2012; Kline 2011). We also check that our results do not
suffer from a potential recollection bias in the “Robustness Checks” section.
Marketing Science Institute Working Paper Series 9
Measures and variable operationalization
Participants were recruited using the Amazon Mechanical Turk (MTurk) service.3 Workers
were allowed to participate if they had seen a movie in a movie theater in the past 12 months.4 In
order to receive $.5 payment after completing the survey, respondents received a randomized
code to enter in the MTurk environment. The survey consisted of two parts. First, participants
were asked to recall their last movie visit (for a recent paper using a similar survey see Yang et
al. 2012). In this part of the survey, participants reported the title of the last movie they saw at a
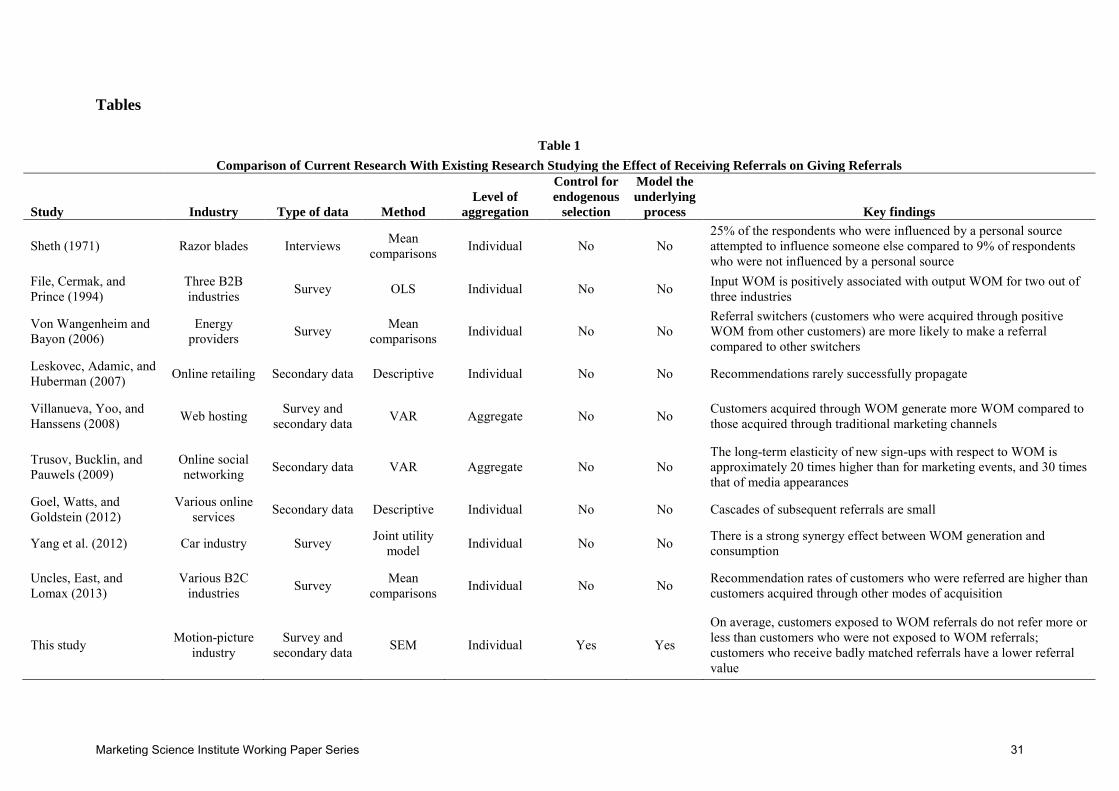
movie theater, and were asked to answer a set of questions with this movie in mind (see Table 2
for an overview of the items and scales):
- WOM referral exposure. Respondents answered for the movie they indicated as the last
movie they had seen, whether they were exposed to WOM referrals prior to seeing the
movie. This binary variable takes value one for respondents who reported being exposed to
WOM referrals and zero for those who were not.
- Satisfaction. The degree of satisfaction of the respondent with his/her movie of choice was
measured with three items (one reversed) and seven-point Likert scales, adopted from
Maxham III and Netemeyer (2002).
- WOM referral value. We capture WOM referral value by measuring the total number of
referrals a customer has made and plans to make in the future. To account for the long-tailed
distribution, we take the natural logarithm of the total of number of prospective customers a
consumer referred to and intends to refer in the future, plus one to account for zero values.
In the second part of the survey, participants were asked to complete items that were not specific
to the movie in question:
- Referral match. We measure the degree to which a customer receives referrals that are well-
matched to his or her preferences using three items and seven-point scales. Participants were
asked how they would qualify the movie recommendations they receive in general, how
satisfied they are with the movie recommendations they receive in general, and how well the
individuals who generally recommend them movies know the participant’s movie tastes.
3 For a recent empirical application of MTurk in marketing see for example Lamberton and Rose (2012). For discussions on the MTurk platform and expected reliability of the data see Buhrmester et al. (2011) and Peer et al. (2014). 4 Following recommendations by Peer et al. (2014), U.S. workers with at least a 95% acceptance rate and at least 500 accepted tasks were sampled. Moreover, we applied the procedure outlined by Peer et al. (2012) to prevent sampling multiple responses per worker ID.
Marketing Science Institute Working Paper Series 10

These items capture the extent to which, in general, the referrals a participant receives
match her preferences. Because we consider this construct as a moderator, rather than a
mediator, we measure referral matching using a construct not specific to the focal movie
consumption episode, but as an individual-level trait that is determined independently of the
current consumption episode.
We also collected additional individual-level variables that serve as control variables and
instrumental variables in the model (see “The Model” section for how all variables enter the
model):
- Opinion seeking. The scale was adopted from Flynn et al. (1996) and captures the extent to
which a customer looks for opinions from others before choosing movies with six seven-
point Likert items (three reversed).
- Opinion leadership. The scale was adopted from Flynn et al. (1996) and captures the extent
to which the customer exerts influence on the movie choices of others with six seven-point
Likert items (three reversed).
- Gender and age. Participants were also asked about their gender (male coded as 1, female as
0) and age (continuous scale).
Finally, we also collected movie-level data on the movies from IMDb:
- Movie rating. We control for quality differences between movies using the movie ratings
provided by IMDb users.
- Opening weekend box-office revenues. This variable measures the movie revenues up to the
opening weekend and hence captures the popularity of the movie early in its lifecycle. We
use the natural logarithm of this variable to account for its long-tailed distribution.
Sample and descriptive statistics
We collected data from 900 respondents. We excluded respondents who claimed to have
seen the movie before the release date shown on IMDb and respondents who reported a movie
which actual release date, according to IMDb, was before 2012 (because of the short lifecycle of
movies, it is unlikely that these customers saw the movie in the theater). We also removed
duplicate IP addresses, respondents for which we could not match the self-reported movie title
with the IMDb repository, as well as movies for which there was missing data.
Marketing Science Institute Working Paper Series 11
Our final sample consists of 851 respondents. Among the respondents, 320 (about 38%)
mentioned having been exposed to WOM referrals prior to seeing the movie, the remaining 531
(about 62%) were not exposed to WOM referrals. Table 3 shows descriptive statistics. In line
with previous research, customers who indicated to be exposed to WOM referrals seem to make
more referrals, compared to customers who were not exposed to WOM referrals (T(849) = -6.824,
p < .001) when we do not control for any other variables. Moreover, when we do not control for
endogeneity, customers who were exposed to WOM referrals seem to show a higher satisfaction
and referral value than those who were not exposed to WOM referrals (e.g., satisfaction 1: T(849)
= -5.062, p < .001). Another interesting difference is that customers who were exposed to WOM
referrals have a higher tendency to be opinion seekers (e.g., opinion seeking 1: T(849) = -6.905, p
< .001). Customers exposed to WOM are also slightly younger (T(849) = 2.680, p = .008), but both
groups do not differ in the proportion of men/women (T(849) = -.057, p = .954). In terms of their
movie choice, customers exposed to WOM tend to choose better rated movies (T(849) = -9.414, p
< .001) and movies with higher opening weekend box-office revenues (T(849) = -4.127, p < .001).
Measurement properties
We first performed a confirmatory factor analysis measurement model to validate and purify
the multi-item scales (Anderson and Gerbing 1988). The items of the latent constructs
satisfaction, referral match, opinion seeking and leadership scales load on separate factors with
free covariances between factors. No cross-loadings were allowed. For each latent variable, we
specify for respondent i, and indicator j:
yij = νj + λjηi + εij, (1)
where ηi is the latent variable, yij is the observed indicator, νj is an intercept, λj is a loading, and
error term εij ~ N(0, σεij). We fixed one loading of each factor to one for identification purposes,
and allow for within-factor covariances between errors of negatively (reversed) scaled items to
parsimoniously control for response styles of negatively worded items (DiStefano and Motl
2006; Marsh 1996; Tomás and Oliver 1999). After dropping the first opinion leadership item
with a poor standardized loading (.41; see Table 2), the measurement model showed adequate fit
(χ2 = 406.671; Comparative Fit Index (CFI) = .962; Tucker-Lewis Index (TLI) = .953; Root
Mean Squared Error of Approximation (RMSEA) = .057; Standardized Root Mean Square
Residual (SRMR) = .045).
Marketing Science Institute Working Paper Series 12
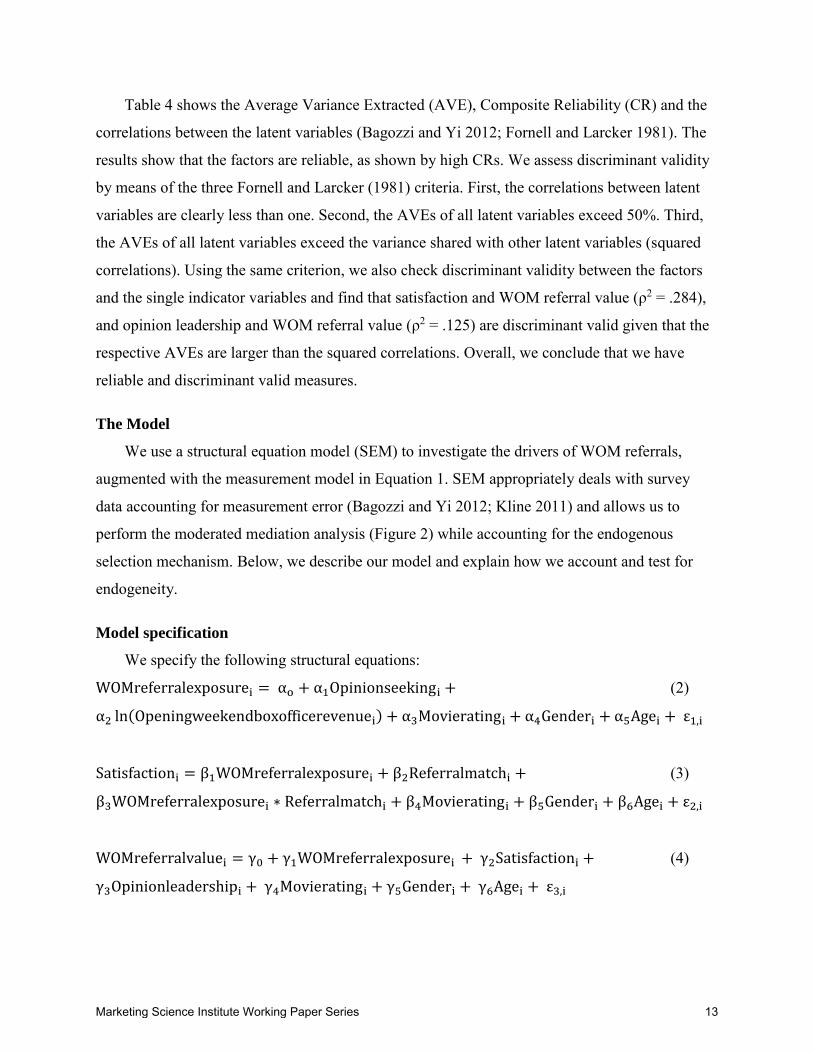
Table 4 shows the Average Variance Extracted (AVE), Composite Reliability (CR) and the
correlations between the latent variables (Bagozzi and Yi 2012; Fornell and Larcker 1981). The
results show that the factors are reliable, as shown by high CRs. We assess discriminant validity
by means of the three Fornell and Larcker (1981) criteria. First, the correlations between latent
variables are clearly less than one. Second, the AVEs of all latent variables exceed 50%. Third,
the AVEs of all latent variables exceed the variance shared with other latent variables (squared
correlations). Using the same criterion, we also check discriminant validity between the factors
and the single indicator variables and find that satisfaction and WOM referral value (ρ2 = .284),
and opinion leadership and WOM referral value (ρ2 = .125) are discriminant valid given that the
respective AVEs are larger than the squared correlations. Overall, we conclude that we have
reliable and discriminant valid measures.
The Model
We use a structural equation model (SEM) to investigate the drivers of WOM referrals,
augmented with the measurement model in Equation 1. SEM appropriately deals with survey
data accounting for measurement error (Bagozzi and Yi 2012; Kline 2011) and allows us to
perform the moderated mediation analysis (Figure 2) while accounting for the endogenous
selection mechanism. Below, we describe our model and explain how we account and test for
endogeneity.
Model specification
We specify the following structural equations:
WOMreferralexposurei = αo + α1Opinionseekingi + (2)
α2 ln(Openingweekendboxofficerevenuei) + α3Movieratingi + α4Genderi + α5Agei + ε1,i
Satisfactioni = β1WOMreferralexposurei + β2Referralmatchi + (3)
β3WOMreferralexposurei ∗ Referralmatchi + β4Movieratingi + β5Genderi + β6Agei + ε2,i
WOMreferralvaluei = γ0 + γ1WOMreferralexposurei + γ2Satisfactioni + (4)
γ3Opinionleadershipi + γ4Movieratingi + γ5Genderi + γ6Agei + ε3,i
Marketing Science Institute Working Paper Series 13

with the errors ε1,i, ε2,i, ε3,i ~ N(0, 0, 0; Σ). The specification of the error covariance matrix is
defined in the next subsection. Consistent with the mediation literature, we specify a direct effect
of WOM referral exposure on WOM referral value (Preacher et al. 2007; Zhao et al. 2010).
Equation 2 is specified as a linear probability model (Olsen 1982). The intercept in the
satisfaction equation is suppressed for identification purposes. We estimate the measurement
model and structural model simultaneously in Mplus (Muthén and Muthén 1998-2012) using
full-information robust (to deviations from normality) maximum likelihood.5 We follow the
procedure by Klein and Moosbrugger (2000) to estimate the latent interaction effect in Equation
3.
Accounting for endogenous selection
A key feature of our approach is that we consider the endogenous process by which
customers select themselves into being exposed to WOM referrals. Specifically, we argue that
the effects of WOM referral exposure are likely to be driven by endogenous selection on
unobservables. Two types of endogeneity are likely to occur.
First, some customers may be more likely to activate others to discuss their consumption
experiences, while simultaneously being more inclined to seek social contacts. For example,
some customers may simply be more social in that they often talk with other customers about
their favorable movie experiences, but are also exposed to movie-related conversations from
their peers. Moreover, some customers may simply be more involved with the product category.
They like to talk about movies with others and do not hesitate to ask for interpersonal advice
when they need information about a movie. Second, some products are simply more likely to be
talked about (Berger and Schwartz 2011) leading to a potentially spurious correlation between
WOM input and output. For example, some movies are more provocative than others, such that
they generate a lot of chatter.
To correct for endogeneity, we use an instrumental variable procedure and specify a WOM
referral exposure equation (Equation 2) as a function of a number of instruments, and free off-
diagonal elements of the Σ covariance matrix of the structural error terms (Skrondal and Rabe-
Hesketh 2004). We use two instruments, opinion seeking to account for the potential selection at
5 Given that we use robust maximum likelihood to estimate the model, we rescale the test statistic using the scaling correction factor described by Satorra (2000) when performing nested model (likelihood ratio) comparison tests.
Marketing Science Institute Working Paper Series 14

the customer level, and opening weekend box-office revenue (in natural logarithm) to account
for the potential selection at the movie level. We demonstrate the statistical properties of these
instruments in the next section. Our choice for these instruments is justified by the fact that we
expect opinion seekers to show a high tendency to seek information from their peers when
buying a new product or service, and hence to be exposed to WOM referrals (Flynn et al. 1996).
Moreover, we expect that the better a movie performs during the first weekend, the more buzz it
will generate and the larger the base of adopters who will recommend the movie to others after
the first weekend.
Testing the instruments
We use a three-pronged approach to empirically test for the strength and validity of our
instruments. For the strength, Stock et al. (2002) provide a rule of thumb in that the F-statistic on
the excluded instruments in the first stage should be greater than ten. A joint test of the R2
increase (from .099 to .143) of the excluded instruments yields F(2, 845) = 21.69, while both
instruments significantly explain WOM referral exposure (p = .043 and p = .001), indicating that
the instruments are empirically strong.
For the validity, we test for overidentifying restrictions (Kenny and Milan 2012). For each
equation, we sequentially free paths from one of the instruments to the dependent variables
(satisfaction and WOM referral value) in the model. The additional paths were not significant
(highest Z = -.696, p = .487), and adding them did not significantly increase model fit (highest χ2
= .473, p = .492), indicating that the instruments are empirically valid.
Finally, we also tested for endogeneity using the Durbin-Wu-Hausman (DWH) test. We find
that the residual is significant in the satisfaction equation (Z = 8.671, p = .003) whereas it is not
significant in the WOM referral value equation (Z = 1.408, p = .235). We conclude that the
instruments are strong and valid and that WOM referral exposure is endogenous in the
satisfaction equation (see Dinner et al. 2014, for a similar procedure).
Moderated mediation analysis
As shown in Figure 2, the expected impact of WOM referral exposure on referral value is
not only mediated by satisfaction, but its effect on the satisfaction mediator is also expected to be
moderated by referral match. As such, we expect a moderated mediation (Preacher et al. 2007).
Consistent with the mediation literature and our model, we decompose the total effect of
Marketing Science Institute Working Paper Series 15
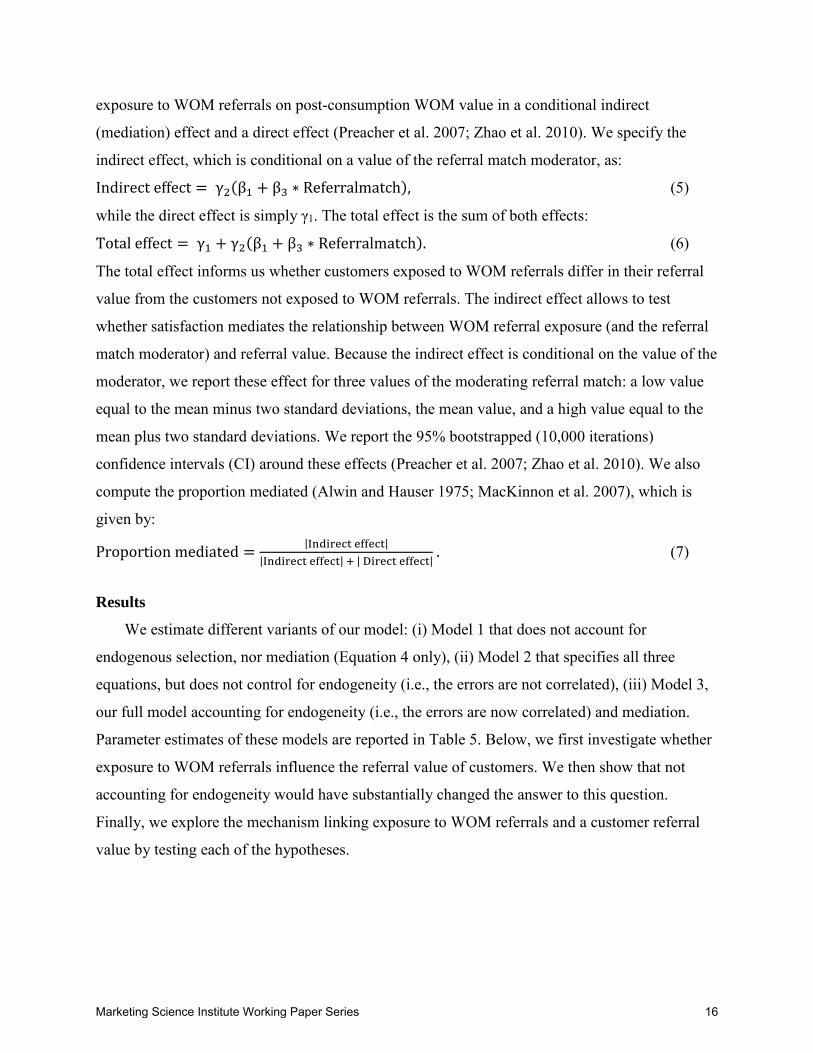
exposure to WOM referrals on post-consumption WOM value in a conditional indirect
(mediation) effect and a direct effect (Preacher et al. 2007; Zhao et al. 2010). We specify the
indirect effect, which is conditional on a value of the referral match moderator, as:
Indirect effect = γ2(β1 + β3 ∗ Referralmatch), (5)
while the direct effect is simply γ1. The total effect is the sum of both effects:
Total effect = γ1 + γ2(β1 + β3 ∗ Referralmatch). (6)
The total effect informs us whether customers exposed to WOM referrals differ in their referral
value from the customers not exposed to WOM referrals. The indirect effect allows to test
whether satisfaction mediates the relationship between WOM referral exposure (and the referral
match moderator) and referral value. Because the indirect effect is conditional on the value of the
moderator, we report these effect for three values of the moderating referral match: a low value
equal to the mean minus two standard deviations, the mean value, and a high value equal to the
mean plus two standard deviations. We report the 95% bootstrapped (10,000 iterations)
confidence intervals (CI) around these effects (Preacher et al. 2007; Zhao et al. 2010). We also
compute the proportion mediated (Alwin and Hauser 1975; MacKinnon et al. 2007), which is
given by:
Proportion mediated =|Indirect effect|
|Indirect effect| + | Direct effect| . (7)
Results
We estimate different variants of our model: (i) Model 1 that does not account for
endogenous selection, nor mediation (Equation 4 only), (ii) Model 2 that specifies all three
equations, but does not control for endogeneity (i.e., the errors are not correlated), (iii) Model 3,
our full model accounting for endogeneity (i.e., the errors are now correlated) and mediation.
Parameter estimates of these models are reported in Table 5. Below, we first investigate whether
exposure to WOM referrals influence the referral value of customers. We then show that not
accounting for endogeneity would have substantially changed the answer to this question.
Finally, we explore the mechanism linking exposure to WOM referrals and a customer referral
value by testing each of the hypotheses.
Marketing Science Institute Working Paper Series 16
Does exposure to WOM referrals influence customers’ referral value?
Table 6 depicts the estimated total effect of WOM referral exposure on a customer referral
value according to Model 3 and decomposes it into a direct and an indirect effect. A graphical
representation of this total effect decomposition is provided in Figure 3. The total effects (darkest
bars) show that customers who received a movie referral do not have a higher probability to refer
the movie to others than customers who did not receive a referral. In fact, for mean and high
values of the referral match moderator, the total effect of WOM referrals on WOM referral
value, taking into account all paths, is negative yet indistinguishable from zero (95% bootstrap
CI (-.701; .073) for mean referral match and (-.586; .263) for high referral match both contain
zero). However, for a low value of the moderating variable referral match, the total effect
becomes significantly negative (95% bootstrap CI (-.877; -.051) does not contain zero). These
results provide us a first important managerial insight: customers exposed to WOM referrals do
not have a higher referral value than the customers not exposed to WOM. At best, they refer the
movie they have seen to as many other customers as the customers not exposed to WOM
referrals. In some cases, they tend to refer it to less people than the customers who were not
exposed to WOM referrals.
This total effect can be decomposed into a direct effect (mid-grey bars) and an indirect
(mediating) effect via satisfaction (light grey bars). As shown in Figure 3, the effects are of
opposite signs, what Zhao et al. (2010) name “competitive mediation”, and also referred to as
“inconsistent mediation” (MacKinnon et al. 2007). We find a negative indirect effect of WOM
referral exposure on WOM referral value, mediated by satisfaction. The indirect effect is
significant for low and mean values of referral match (95% bootstrap CIs resp. (-1.013; -.224)
and (-.850; -.105) do not contain zero). For high values of referral match, we find an indirect
effect indistinguishable from zero (95% bootstrap CI (-.727; .093) contains zero). Contrasting
with this negative indirect effect, we find a significant direct effect (95% bootstrap CI (.022;
.294) does not contain zero) of WOM referral exposure on WOM referral value. While
satisfaction partially mediates the relationship between WOM referral exposure and a customer
referral value, the proportion mediated for low, mean, and high values of referral match is
respectively .789, .736, and .648, suggesting that a majority of the total effect of WOM referral
exposure on WOM referral value comes from the indirect effect. Following Kenny (2014), this is
close to a full mediation as the share approaches 80%. These results provide us a second
Marketing Science Institute Working Paper Series 17
important managerial insight: satisfaction plays a major role in the extent to which customers
who receive a movie referral would pass it on to others and therefore be of high referral value.
Finally, Figure 3 offers an interesting contrast between customers who typically receives ill-
matched referrals (left panel of Figure 3, “low referral match”), and customers who usually
receives well-matched referrals (right panel of Figure 3, “high referral match”). The indirect
effect of exposure to WOM referrals via satisfaction is less pronounced for the second segment
of customers compared to the first segment of customers. In particular, the first segment ends up
recommending the movie less to others when they go for a movie they have been recommended
to than when the movie was not recommended to them. For the second segment, there is no
difference in the number of referrals they make whether the movie has been referred to them or
not. The results provide us a third important managerial insight: the satisfaction of referred
customers who receive well-matched movie referrals is not sufficiently high to make their
referral values higher than the referral value of customers who do not receive any referral.
How do the results change when not accounting for endogeneity?
To highlight the role of endogeneity, we contrast these results with the results from Model 1,
which does not control for it. In Table 5, we find a positive and significant effect of WOM
referral exposure on WOM referral value (γ1 = .256, p = .001, 95% bootstrap CI (.109; .404)
does not contain zero). This result is consistent with previous research and indicates that the
apparent positive correlation between receiving and giving WOM referrals is due to endogenous
self-selection rather than the exposure to WOM itself.6
What explains the effect of exposure to WOM referrals on customers’ referral value?
Our model also provides insights into the mechanisms that relate exposure to WOM referrals
and WOM referral value, which allow us to test the hypotheses (see Table 5, Model 3). Based on
the moderated mediation analyses we find, consistent with H1 and H2, that the effect of WOM
referral exposure on referral value is moderated by the referral match and mediated by
satisfaction. We find a negative and significant main effect of WOM referral exposure on
satisfaction (β1 = -.957, p = .013). We explain this negative effect by the fact that customers who
6 Note that the change in the size of the standard errors (efficiency loss) between Model 1 and Model 3 (approximately a factor two) is in line with previous research (Kornish and Ulrich 2014; Zhang et al. 2009), which we consider reasonable.
Marketing Science Institute Working Paper Series 18
received a movie referral tend to form higher expectations about the movie they are about to see,
increasing the odds that they will end up disappointed and hence less satisfied compared to
customers who did not received a referral. This effect is positively moderated by the referral
match (β3 = .233, p = .057), consistent with H2. Customers who tend to receive referrals that fit
their preferences end up more satisfied with the movie than those who receive ill-matched
referrals. When the referring customer has a good knowledge about the movie preferences of the
referred customer, for example in case of strong ties, we find that the negative effect of receiving
a referral becomes smaller in intensity. As shown in Figure 3, the indirect effect becomes
insignificant for high values of referral match.
To complete the mediating effect of satisfaction, the results also show a positive and
significant effect of satisfaction on WOM referral value (γ2 = .455, p < .001). Customers who are
more satisfied get more utility from engaging in WOM referrals themselves and spread the word
to a larger audience (Anderson 1998; De Matos and Rossi 2008). Finally, we find a small but
significant positive direct effect of WOM referral exposure on customer referral value (γ1 = .156,
p = .024) as we described in the prior subsection. Although the direct effect accounts for a small
share of the total effect, it may capture several interesting mechanisms, which we do not identify
in our study. For example, the theory of emotional contagion shows that emotions can flow from
one person to another (Hennig-Thurau et al. 2006). Arousal that drives customers to engage in
product-related conversations (Berger 2011) can be transferred to the referral recipient, leading
her to refer in turn. Alternatively, customers may engage in indirect reciprocity after receiving a
favorable referral in that they reciprocate the act of receiving a successful referral by referring to
others in their network (Wasko and Faraj 2005). Future research could shed more light on the
nature of this small but significant positive effect by introducing additional mediators or
moderators (Zhao et al. 2010).
Robustness checks
We check the robustness of these results to various scenarios. First, to investigate potential
recollection bias, we restrict the sample to customers who saw the movie less than three months
ago, resulting in a sample size of 660 customers (77.6% of the full sample). We find the
coefficients of interest and the substantive conclusions to be identical.
Marketing Science Institute Working Paper Series 19
Second, the literature suggests that early adopters might differ from late adopters (Rogers
1983), and such differences can have an effect of their referral value. We control for the timing
of adoption (viewing) of the movie and include a variable that captures how many months after
the movie release a respondent saw the movie to all three equations. We find that the additional
parameters are insignificant in all equations (all p > .344), that the coefficients of interest remain
substantively identical, and that the Bayesian Information Criterion (BIC) becomes larger (BIC =
45,785 with adoption timing compared to 45,766 without adoption timing).
Third, we checked the robustness of our results when allowing for a non-zero error
covariance between Equations 2 and 4, in addition to the error covariance between Equations 2
and 3. We find that the quantities of interest are substantively identical and that the additional
error covariance is virtually zero (σ1,3 = -.008, p = .906), and that the BIC becomes larger (BIC =
45,773).
Fourth, we account for the possibility that the direct effect of WOM referral exposure on
WOM referral value may also be moderated by referral match. We add a main effect of referral
match and its interaction with WOM referral exposure to Equation 4 and find that both paths are
insignificant (resp. p = .319, p = .202), and that the model fit does not improve (BIC = 45,774).
Discussion
Our paper reveals a number of interesting findings about the relationship between receiving
and giving WOM referrals. First, our results highlight the consequences of ignoring the
endogenous selection process by which customers are exposed to WOM referrals. In contrast to
previous research (Sheth 1971; Trusov et al. 2009; Uncles et al. 2013; Villanueva et al. 2008;
Von Wangenheim and Bayón 2006), the results show that, on average, being exposed to WOM
referrals does not affect the number of referrals a customer will make in turn.
Second, we get insights in the mechanisms that lead to these effects. The moderated
mediation analysis reveals that referred customers who receive referrals that are poorly matched
turn out to be less satisfied than non-referred customers, leading them to refer less in turn. This
result supports the idea that not all referrals are equally useful. Effective recommendations
should take the recipient into account and require knowledge of both the product and the person
receiving the recommendation (Duhan et al. 1997). Consistent with a disconfirmation of
expectations account (Oliver 1980), WOM referrals create unrealistic expectations about the
Marketing Science Institute Working Paper Series 20

movie a customer is about to view which are disconfirmed when seeing the movie, leading to
lower satisfaction. The mediation of satisfaction accounts for the majority (for average
customers: 73.6%) of the total effect of WOM referral exposure (moderated by referral match)
on WOM referral value. These results contrast with previous research suggesting that customers
acquired through WOM might be satisfied customers (Bolton et al. 2004; Uncles et al. 2013;
Von Wangenheim and Bayón 2006).
Managerial implications
Our results offer a number of important managerial implications for firms interested in
WOM acquisition strategies. First, while WOM acquisition strategies have certainly shown their
potential in attracting higher CLV customers compared to other acquisition strategies (Schmitt et
al. 2011; Villanueva et al. 2008), they are less likely to recruit customers with a higher referral
value (Kumar et al. 2010). On average, we find that customers acquired via referrals do not have
significantly different referral value than other customers. From a managerial viewpoint, it
implies that firms can count on high revenues from customers recruited via referrals but should
expect more limited cascades of referrals (i.e., the number of customers recruited) than what
prior work has suggested (e.g., Trusov et al. 2009; Villanueva et al. 2008)
Second, our moderated mediation analysis pinpoints that companies should act with care
when implementing WOM acquisition campaigns. It is critical not to encourage referrals
between customers who know little about each other’s preferences. Incentivizing customers to
increase the number of referrals they make, for example by offering them a monetary reward
(Verlegh et al. 2013), might have a detrimental effect on the outcome as it might push customers
to pay less attention to who they share their recommendation with. A solution can be to give
customers incentives to share that are conditional on the adoption of the receiver and/or her
future referral value (Garnefeld et al. 2013; Schmitt et al. 2011).
Third, the results suggest directions for firms on how to boost the length of referral cascades.
One can be to offer technology and software solutions to their current customers that help them
improving the satisfaction of the referred customers, and consequently their referral value.
Different types of helping tools can be made available to them. For instance, information tools
that provide a sensible description of the product and ensure realistic expectations about the
referred products can be made available on a (online) customer platform. For physical products,
Marketing Science Institute Working Paper Series 21
free samples can be offered to share, while for services, informational videos can be provided to
referring customers to show to their friends. In addition, firms could also offer matching tools
that help the referring customers to better identify which of their friends would be potentially
most satisfied with the referred product or service. For example, movie enthusiast websites (like
IMDb), but also social networks such as Facebook, often allow users to specify their favorite
movies or show the most recent ratings and reviews for each user when accessing their profile,
effectively showing the movies they have seen and their ratings. Companies may even aid
recommenders by using and analyzing historical data on customer preferences combined with
demographic information, and come up with a list of friends that might also like the movie they
have seen. In view of the increasing amount of data (sources) becoming available, matching tools
undoubtedly have the potential to help customers to better target their recommendations.
Limitations and directions for future research
Our study suffers from several limitations that offer opportunities for future research. First,
our study contributes to a growing stream of research that investigates the consequences of
WOM referrals on future referrals (see Table 1). Similar to these papers, we focus on the
consequences of positive WOM referrals. Studying the consequences of negative WOM was
beyond the scope of the present research but can certainly reveal interesting new insights.
Second, we investigate the effect of WOM referrals on a customer referral value in general.
It would be interesting to study the extent to which the content of these referrals also plays a role.
Future research could distinguish between, for example very enthusiastic vs. mild endorsements,
solicited referrals vs. unsolicited referrals (Fitzsimons and Lehmann 2004), or rewarded vs. not-
rewarded referrals (Verlegh et al. 2013).
Third, like many studies on WOM referrals, we use self-reported data. A key reason for us
to use survey data is that it allows us to study the process: the moderating and mediating
mechanisms that jointly link receiving and giving referrals. While we control for potential
measurement issues with a measurement model, the retrospective nature of the survey might
limit the generalizability of our findings. Future research may augment similar survey data with
secondary data on actual referral activity to further alleviate the potential recollection bias
concerns and enhance the generalizability of the study.
Marketing Science Institute Working Paper Series 22
Fourth, we reveal satisfaction to be a key factor in the process that leads to an effect of
WOM referral exposure on WOM referral value. However, we do not capture complete evidence
for the theoretical mechanisms we propose, which are based on expectations. Although the
relationship between expectations and satisfaction is well-established (Oliver, 1980; Westbrook,
1987; Zeithaml et al., 1993), future research may be able to dig even further in the process,
especially by showing an effect of WOM referral exposure on expectations, for example by
means of lab experiments or multiple measures over time.
To conclude, we believe, in view of previous work and the current research, that WOM
acquisition strategies can be potentially successful strategies for firms to consider but should be
implemented with care if they want to benefit from long cascades of referrals.
Marketing Science Institute Working Paper Series 23
References
Alwin, Duane F. and Robert M. Hauser (1975), "The Decomposition of Effects in Path Analysis," American Sociological Review, 40 (1), 37-47.
Anderson, Eugene W. (1998), "Customer Satisfaction and Word of Mouth," Journal of Service
Research, 1 (1), 5-17.
——— and Linda C. Salisbury (2003), "The Formation of Market‐Level Expectations and Its Covariates," Journal of Consumer Research, 30 (1), 115-24.
Anderson, James C. and David W. Gerbing (1988), "Structural Equation Modeling in Practice: A Review and Recommended Two-Step Approach," Psychological Bulletin, 103 (3), 411-23.
Aral, Sinan and Dylan Walker (2014), "Tie Strength, Embeddedness, and Social Influence: A Large-Scale Networked Experiment," Management Science, 60 (6), 1352-70.
Bagozzi, Richard P. and Youjae Yi (2012), "Specification, Evaluation, and Interpretation of Structural Equation Models," Journal of the Academy of Marketing Science, 40 (1), 8-34.
Banerjee, Abhijit V. (1992), "A Simple Model of Herd Behavior," The Quarterly Journal of
Economics, 107 (3), 797-817.
Berger, Jonah (2011), "Arousal Increases Social Transmission of Information," Psychological
Science, 22 (7), 891-93.
——— (2014), "Word of Mouth and Interpersonal Communication: A Review and Directions for Future Research," Journal of Consumer Psychology, 24 (4), 586-607.
——— and Eric M. Schwartz (2011), "What Drives Immediate and Ongoing Word of Mouth?," Journal of Marketing Research, 48 (5), 869-80.
Bikhchandani, Sushil, David Hirshleifer, and Ivo Welch (1998), "Learning From the Behavior of Others: Conformity, Fads, and Informational Cascades," Journal of Economic Perspectives, 12 (3), 151-70.
Bolton, Ruth N., Katherine N. Lemon, and Peter C. Verhoef (2004), "The Theoretical Underpinnings of Customer Asset Management: A Framework and Propositions for Future Research," Journal of the Academy of Marketing Science, 32 (3), 271-92.
Bone, Paula F. (1995), "Word-of-Mouth Effects on Short-term and Long-term Product Judgments," Journal of Business Research, 32 (3), 213-23.
Marketing Science Institute Working Paper Series 24
Brown, Jacqueline J. and Peter H. Reingen (1987), "Social Ties and Word-of-Mouth Referral Behavior," Journal of Consumer Research, 14 (3), 350-62.
Buhrmester, Michael, Tracy Kwang, and Samuel D. Gosling (2011), "Amazon's Mechanical Turk: A New Source of Inexpensive, Yet High-Quality, Data?," Perspectives on Psychological
Science, 6 (1), 3-5.
Chevalier, Judith A. and Dina Mayzlin (2006), "The Effect of Word of Mouth on Sales: Online Book Reviews," Journal of Marketing Research, 43 (3), 345-54.
De Angelis, Matteo, Andrea Bonezzi, Alessandro M. Peluso, Derek D. Rucker, and Michele Costabile (2012), "On Braggarts and Gossips: A Self-Enhancement Account of Word-of-Mouth Generation and Transmission," Journal of Marketing Research, 49 (4), 551-63.
De Matos, Celso A. and Carlos A.V. Rossi (2008), "Word-of-Mouth Communications in Marketing: A Meta-Analytic Review of the Antecedents and Moderators," Journal of the
Academy of Marketing Science, 36 (4), 578-96.
Dichter, Ernest (1966), "How Word-of-Mouth Advertising Works," Harvard Business Review, 44 (6), 147-60.
Dinner, Isaac M., Harald J. Van Heerde, and Scott A. Neslin (2014), "Driving Online and Offline Sales: The Cross-Channel Effects of Traditional, Online Display, and Paid Search Advertising," Journal of Marketing Research, 51 (5), 527-45.
DiStefano, Christine and Robert W. Motl (2006), "Further Investigating Method Effects Associated With Negatively Worded Items on Self-Report Surveys," Structural Equation
Modeling: A Multidisciplinary Journal, 13 (3), 440-64.
Duhan, Dale F., Scott D. Johnson, James B. Wilcox, and Gilbert D. Harrell (1997), "Influences on Consumer Use of Word-of-Mouth Recommendation Sources," Journal of the Academy of
Marketing Science, 25 (5), 283-95.
Feldman, Jack M. and John G. Lynch (1988), "Self-Generated Validity and Other Effects of Measurement on Belief, Attitude, Intention, and Behavior," Journal of Applied Psychology, 73 (3), 421-35.
File, Karen M., Dianne S.P. Cermak, and Russ A. Prince (1994), "Word-of-Mouth Effects in Professional Services Buyer Behaviour," Service Industries Journal, 14 (3), 301-14.
Fitzsimons, Gavan J. and Donald R. Lehmann (2004), "Reactance to Recommendations: When Unsolicited Advice Yields Contrary Responses," Marketing Science, 23 (1), 82-94.
Marketing Science Institute Working Paper Series 25
Flynn, Leisa R., Ronald E. Goldsmith, and Jacqueline K. Eastman (1996), "Opinion Leaders and Opinion Seekers: Two New Measurement Scales," Journal of the Academy of Marketing
Science, 24 (2), 137-47.
Fornell, Claes and David F. Larcker (1981), "Evaluating Structural Equation Models with Unobservable Variables and Measurement Error," Journal of Marketing Research, 18 (1), 39-50.
Garnefeld, Ina, Andreas Eggert, Sabrina V. Helm, and Stephen S. Tax (2013), "Growing Existing Customers' Revenue Streams Through Customer Referral Programs," Journal of
Marketing, 77 (4), 17-32.
Godes, David and Dina Mayzlin (2009), "Firm-Created Word-of-Mouth Communication: Evidence from a Field Test," Marketing Science, 28 (4), 721-39.
Goel, Sharad, Duncan J. Watts, and Daniel G. Goldstein (2012), "The Structure of Online Diffusion Networks," Proceedings of the 13th ACM Conference on Electronic Commerce, 623-38.
Haenlein, Michael and Barak Libai (2013), "Targeting Revenue Leaders for a New Product," Journal of Marketing, 77 (3), 65-80.
Hennig-Thurau, Thorsten, Markus Groth, Michael Paul, and Dwayne D. Gremler (2006), "Are All Smiles Created Equal? How Emotional Contagion and Emotional Labor Affect Service Relationships," Journal of Marketing, 70 (3), 58-73.
Herr, Paul M., Frank R. Kardes, and John Kim (1991), "Effects of Word-of-Mouth and Product-Attribute Information on Persuasion: An Accessibility-Diagnosticity Perspective," Journal of
Consumer Research, 17 (4), 454-62.
Hinz, Oliver, Bernd Skiera, Christian Barrot, and Jan U. Becker (2011), "Seeding Strategies for Viral Marketing: An Empirical Comparison," Journal of Marketing, 75 (6), 55-71.
Huang, Jen‐Hung and Yi‐Fen Chen (2006), "Herding in Online Product Choice," Psychology &
Marketing, 23 (5), 413-28.
Kenny, David A. (2014), "Mediation," (accessed July 15, 2015), [available at http://davidakenny.net/cm/mediate.htm].
——— and Stephanie Milan (2012), "Identification: A Nontechnical Discussion of a Technical Issue," in Handbook of Structural Equation Modeling, Rick H. Hoyle, ed. New York: Guilford Press.
Marketing Science Institute Working Paper Series 26
Klein, Andreas and Helfried Moosbrugger (2000), "Maximum Likelihood Estimation of Latent Interaction Effects with the LMS Method," Psychometrika, 65 (4), 457-74.
Kline, Rex B. (2011), Principles and Practice of Structural Equation Modeling. New York: Guilford Press.
Kornish, Laura J. and Karl T. Ulrich (2014), "The Importance of the Raw Idea in Innovation: Testing the Sow's Ear Hypothesis," Journal of Marketing Research, 51 (1), 14-26.
Kumar, V., J.A. Petersen, and Robert P. Leone (2010), "Driving Profitability by Encouraging Customer Referrals: Who, When, and How," Journal of Marketing, 74 (5), 1-17.
Lamberton, Cait P. and Randall L. Rose (2012), "When is ours better than mine? A framework for understanding and altering participation in commercial sharing systems," Journal of
Marketing, 76 (4), 109-25.
Leskovec, Jure, Lada A. Adamic, and Bernado A. Huberman (2007), "The Dynamics of Viral Marketing," ACM Transactions on the Web, 1 (1), 1-39.
MacKinnon, D.P., A.J. Fairchild, and M.S. Fritz (2007), "Mediation Analysis," Annual Review of
Psychology, 58 (1), 593-614.
Marsh, Herbert W. (1996), "Positive and Negative Global Self-Esteem: A Substantively Meaningful Distinction or Artifactors?," Journal of Personality and Social Psychology, 70 (4), 810.
Maxham III, James G. and Richard G. Netemeyer (2002), "A Longitudional Study of Complaining Customers' Evaluations of Multiple Service Failures and Recovery Efforts," Journal of Marketing, 66 (4), 57-71.
McPherson, Miller, Lynn Smith-Lovin, and James M. Cook (2001), "Birds of a Feather: Homophily in Social Networks," Annual Review of Sociology, 27 (1), 415-44.
Murray, Keith B. (1991), "A Test of Services Marketing Theory: Consumer Information Acquisition Activities," Journal of Marketing, 55 (1), 10-25.
Muthén, L.K. and B.O. Muthén (1998-2012), Mplus User's Guide. Los Angeles: Muthén & Muthén.
Nair, Harikesh S., Puneet Manchanda, and Tulikaa Bhatia (2010), "Asymmetric Social Interactions in Physician Prescription Behavior: The Role of Opinion Leaders," Journal of
Marketing Research, 47 (5), 883-95.
Marketing Science Institute Working Paper Series 27
Neelamegham, Ramya and Dipak Jain (1999), "Consumer Choice Process for Experience Goods: An Econometric Model and Analysis," Journal of Marketing Research, 36 (3), 373-86.
Oliver, Richard L. (1980), "A Cognitive Model of the Antecedents and Consequences of Satisfaction Decisions," Journal of Marketing Research, 17 (4), 460-69.
Olsen, Randall J. (1982), "Distributional Tests for Selectivity Bias and a More Robust Likelihood Estimator," International Economic Review, 23 (1), 223-40.
Peer, Eyal, Gabriele Paolacci, Jesse Chandler, and Pam Mueller (2012), "Selectively Recruiting Participants from Amazon Mechanical Turk Using Qualtrics," working paper (accessed August 15, 2014), [available at http://ssrn.com/abstract=2100631].
———, Joachim Vosgerau, and Alessandro Acquisti (2014), "Reputation as a Sufficient Condition for Data Quality on Amazon Mechanical Turk," Behavior Research Methods, 46 (4), 1023-31.
Preacher, Kristopher J., Derek D. Rucker, and Andrew F. Hayes (2007), "Addressing Moderated Mediation Hypotheses: Theory, Methods, and Prescriptions," Multivariate Behavioral Research, 42 (1), 185-227.
Rogers, Everett M. (1983), Diffusion of Innovations. New York: Free Press.
Satorra, Albert (2000), "Scaled and Adjusted Restricted Tests in Multi-Sample Analysis of Moment Structures," in Innovations in Multivariate Statistical Analysis, Vol. 36, Risto D.H. Heijmans, D.S.G. Pollock and Albert Satorra, eds. Dordrecht, The Netherlands: Springer.
Schmitt, Philipp, Bernd Skiera, and Christophe Van den Bulte (2011), "Referral Programs and Customer Value," Journal of Marketing, 75 (1), 46-59.
Shankar, Venkatesh, Amy K. Smith, and Arvind Rangaswamy (2003), "Customer Satisfaction and Loyalty in Online and Offline Environments," International Journal of Research in
Marketing, 20 (2), 153-75.
Sheth, Jagdish N. (1971), "Word-of-Mouth in Low-Risk Innovations," Journal of Advertising
Research, 11 (3), 15-18.
Skowronski, John J. and Donal E. Carlston (1989), "Negativity and Extremity Biases in Impression Formation: A Review of Explanations," Psychological Bulletin, 105 (1), 131-42.
Marketing Science Institute Working Paper Series 28
———, and ——— (1987), "Social Judgment and Social Memory: The Role of Cue Diagnosticity in Negativity, Positivity, and Extremity Biases," Journal of Personality and Social
Psychology, 52 (4), 689-99.
Skrondal, Anders and Sophia Rabe-Hesketh (2004), Generalized Latent Variable Modeling:
Multilevel, Longitudinal, and Structural Equation Models. Boca Raton: CRC Press
Stock, James H., Jonathan H. Wright, and Motohiro Yogo (2002), "A Survey of Weak Instruments and Weak Identification in Generalized Method of Moments," Journal of Business
& Economic Statistics, 20 (4), 518-29.
Tomás, José M. and Amparo Oliver (1999), "Rosenberg's Self‐Esteem Scale: Two Factors or Method Effects," Structural Equation Modeling: A Multidisciplinary Journal, 6 (1), 84-98.
Trusov, Michael, Randolph E. Bucklin, and Koen Pauwels (2009), "Effects of Word-of-Mouth Versus Traditional Marketing: Findings from an Internet Social Networking Site," Journal of
Marketing, 73 (5), 90-102.
Uncles, Mark D., Robert East, and Wendy Lomax (2013), "Good Customers: The Value of Customers by Mode of Acquisition," Australasian Marketing Journal, 21 (2), 119-25.
Van den Bulte, Christophe and Stefan Wuyts (2007), Social Networks and Marketing. Cambridge: Marketing Science Institute.
Verlegh, Peeter W.J. , Gangseog Ryu, Mirjam A. Tuk, and Lawrence Feick (2013), "Receiver Responses to Rewarded Referrals: The Motive Inferences Framework," Journal of the Academy
of Marketing Science, 41 (6), 669-82.
Villanueva, Julian, Shijin Yoo, and Dominique M. Hanssens (2008), "The Impact of Marketing-Induced Versus Word-of-Mouth Customer Acquisition on Customer Equity Growth," Journal of
Marketing Research, 45 (1), 48-59.
Von Wangenheim, Florian and Tomás Bayón (2006), "Satisfaction, Loyalty and Word of Mouth Within the Customer Base of a Utility Provider: Differences Between Stayers, Switchers and Referral Switchers," Journal of Consumer Behaviour, 3 (3), 211-20.
Wasko, Molly M. and Samer Faraj (2005), "Why Should I Share? Examining Social Capital and Knowledge Contribution in Electronic Networks of Practice," Management Information Systems
Quarterly, 29 (1), 35-57.
Westbrook, Robert A. (1987), "Product/Consumption-Based Affective Responses and Postpurchase Processes," Journal of Marketing Research, 24 (3), 258-70.
Marketing Science Institute Working Paper Series 29

Yang, Sha, Mantian Hu, Russell S. Winer, Henry Assael, and Xiaohong Chen (2012), "An Empirical Study of Word-of-Mouth Generation and Consumption," Marketing Science, 31 (6), 952-63.
Zeithaml, Valarie A., Leonard L. Berry, and A. Parasuraman (1993), "The Nature and Determinants of Customer Expectations of Service," Journal of the Academy of Marketing
Science, 21 (1), 1-12.
Zhang, Jie, Michel Wedel, and Rik Pieters (2009), "Sales Effects of Attention to Feature Advertisements: A Bayesian Mediation Analysis," Journal of Marketing Research, 46 (5), 669-81.
Zhao, Xinshu, John G. Lynch Jr., and Qimei Chen (2010), "Reconsidering Baron and Kenny: Myths and Truths About Mediation Analysis," Journal of Consumer Research, 37 (2), 197-206.
Marketing Science Institute Working Paper Series 30
Tables
Table 1
Comparison of Current Research With Existing Research Studying the Effect of Receiving Referrals on Giving Referrals
Study Industry Type of data Method
Level of
aggregation
Control for
endogenous
selection
Model the
underlying
process Key findings
Sheth (1971) Razor blades Interviews Mean comparisons Individual No No
25% of the respondents who were influenced by a personal source attempted to influence someone else compared to 9% of respondents who were not influenced by a personal source
File, Cermak, and Prince (1994)
Three B2B industries Survey OLS Individual No No Input WOM is positively associated with output WOM for two out of
three industries
Von Wangenheim and Bayon (2006)
Energy providers Survey Mean
comparisons Individual No No Referral switchers (customers who were acquired through positive WOM from other customers) are more likely to make a referral compared to other switchers
Leskovec, Adamic, and Huberman (2007) Online retailing Secondary data Descriptive Individual No No Recommendations rarely successfully propagate
Villanueva, Yoo, and Hanssens (2008) Web hosting Survey and
secondary data VAR Aggregate No No Customers acquired through WOM generate more WOM compared to those acquired through traditional marketing channels
Trusov, Bucklin, and Pauwels (2009)
Online social networking Secondary data VAR Aggregate No No
The long-term elasticity of new sign-ups with respect to WOM is approximately 20 times higher than for marketing events, and 30 times that of media appearances
Goel, Watts, and Goldstein (2012)
Various online services Secondary data Descriptive Individual No No Cascades of subsequent referrals are small
Yang et al. (2012) Car industry Survey Joint utility model Individual No No There is a strong synergy effect between WOM generation and
consumption
Uncles, East, and Lomax (2013)
Various B2C industries Survey Mean
comparisons Individual No No Recommendation rates of customers who were referred are higher than customers acquired through other modes of acquisition
This study Motion-picture industry
Survey and secondary data SEM Individual Yes Yes
On average, customers exposed to WOM referrals do not refer more or less than customers who were not exposed to WOM referrals; customers who receive badly matched referrals have a lower referral value
Marketing Science Institute Working Paper Series 31
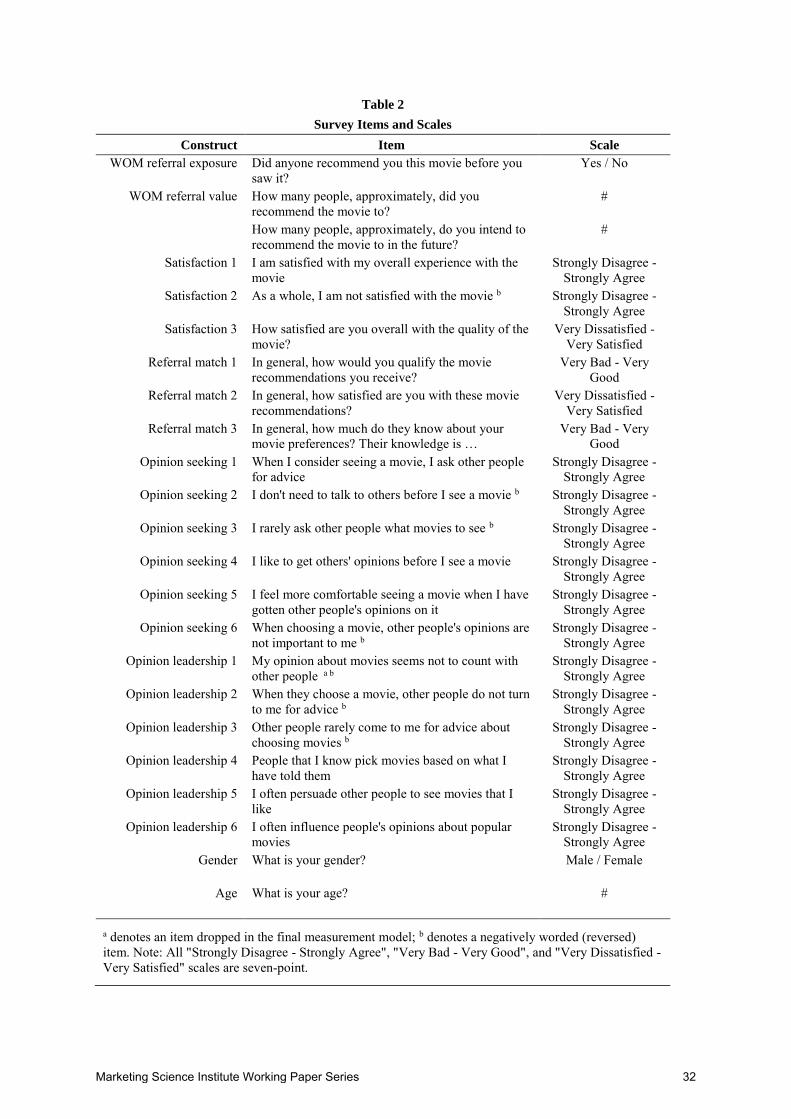
Table 2
Survey Items and Scales
Construct Item Scale
WOM referral exposure Did anyone recommend you this movie before you saw it?
Yes / No
WOM referral value How many people, approximately, did you recommend the movie to?
#
How many people, approximately, do you intend to recommend the movie to in the future?
#
Satisfaction 1 I am satisfied with my overall experience with the movie
Strongly Disagree - Strongly Agree
Satisfaction 2 As a whole, I am not satisfied with the movie b Strongly Disagree - Strongly Agree
Satisfaction 3 How satisfied are you overall with the quality of the movie?
Very Dissatisfied - Very Satisfied
Referral match 1 In general, how would you qualify the movie recommendations you receive?
Very Bad - Very Good
Referral match 2 In general, how satisfied are you with these movie recommendations?
Very Dissatisfied - Very Satisfied
Referral match 3 In general, how much do they know about your movie preferences? Their knowledge is …
Very Bad - Very Good
Opinion seeking 1 When I consider seeing a movie, I ask other people for advice
Strongly Disagree - Strongly Agree
Opinion seeking 2 I don't need to talk to others before I see a movie b Strongly Disagree - Strongly Agree
Opinion seeking 3 I rarely ask other people what movies to see b Strongly Disagree - Strongly Agree
Opinion seeking 4 I like to get others' opinions before I see a movie Strongly Disagree - Strongly Agree
Opinion seeking 5 I feel more comfortable seeing a movie when I have gotten other people's opinions on it
Strongly Disagree - Strongly Agree
Opinion seeking 6 When choosing a movie, other people's opinions are not important to me b
Strongly Disagree - Strongly Agree
Opinion leadership 1 My opinion about movies seems not to count with other people a b
Strongly Disagree - Strongly Agree
Opinion leadership 2 When they choose a movie, other people do not turn to me for advice b
Strongly Disagree - Strongly Agree
Opinion leadership 3 Other people rarely come to me for advice about choosing movies b
Strongly Disagree - Strongly Agree
Opinion leadership 4 People that I know pick movies based on what I have told them
Strongly Disagree - Strongly Agree
Opinion leadership 5 I often persuade other people to see movies that I like
Strongly Disagree - Strongly Agree
Opinion leadership 6 I often influence people's opinions about popular movies
Strongly Disagree - Strongly Agree
Gender What is your gender? Male / Female
Age What is your age? #
a denotes an item dropped in the final measurement model; b denotes a negatively worded (reversed) item. Note: All "Strongly Disagree - Strongly Agree", "Very Bad - Very Good", and "Very Dissatisfied - Very Satisfied" scales are seven-point.
Marketing Science Institute Working Paper Series 32
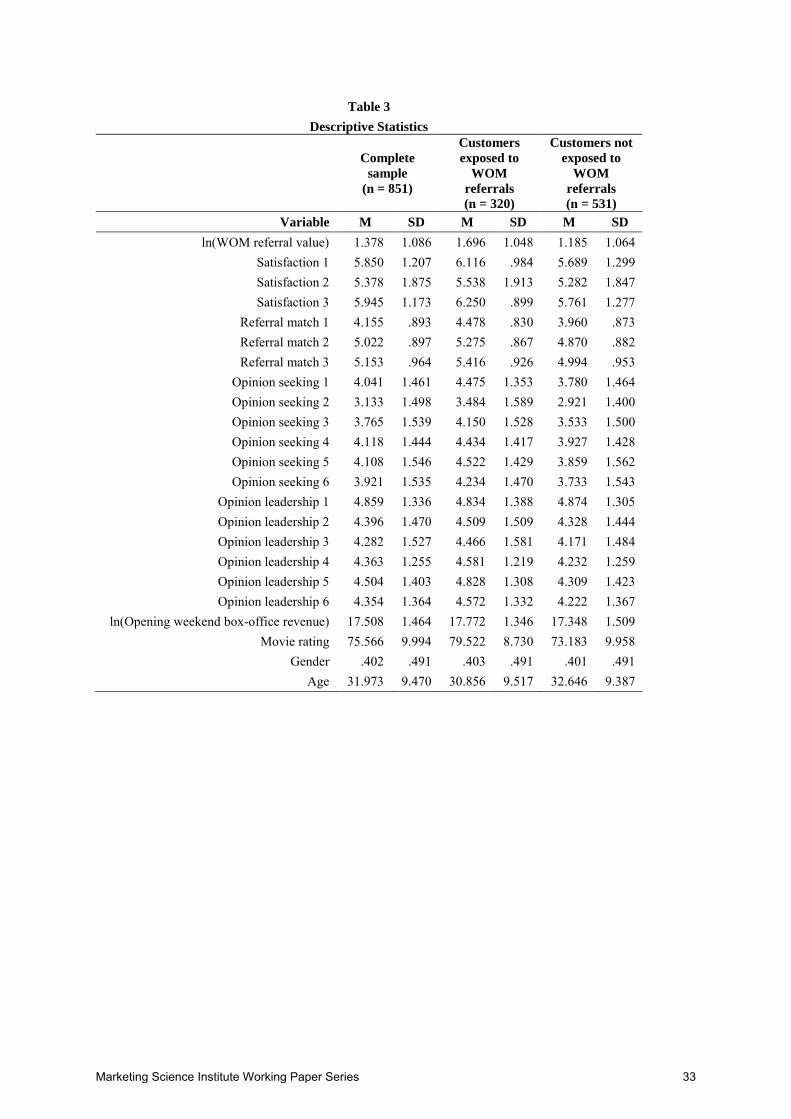
Table 3
Descriptive Statistics
Complete
sample
(n = 851)
Customers
exposed to
WOM
referrals
(n = 320)
Customers not
exposed to
WOM
referrals
(n = 531)
Variable M SD M SD M SD
ln(WOM referral value) 1.378 1.086 1.696 1.048 1.185 1.064 Satisfaction 1 5.850 1.207 6.116 .984 5.689 1.299 Satisfaction 2 5.378 1.875 5.538 1.913 5.282 1.847 Satisfaction 3 5.945 1.173 6.250 .899 5.761 1.277
Referral match 1 4.155 .893 4.478 .830 3.960 .873 Referral match 2 5.022 .897 5.275 .867 4.870 .882 Referral match 3 5.153 .964 5.416 .926 4.994 .953
Opinion seeking 1 4.041 1.461 4.475 1.353 3.780 1.464 Opinion seeking 2 3.133 1.498 3.484 1.589 2.921 1.400 Opinion seeking 3 3.765 1.539 4.150 1.528 3.533 1.500 Opinion seeking 4 4.118 1.444 4.434 1.417 3.927 1.428 Opinion seeking 5 4.108 1.546 4.522 1.429 3.859 1.562 Opinion seeking 6 3.921 1.535 4.234 1.470 3.733 1.543
Opinion leadership 1 4.859 1.336 4.834 1.388 4.874 1.305 Opinion leadership 2 4.396 1.470 4.509 1.509 4.328 1.444 Opinion leadership 3 4.282 1.527 4.466 1.581 4.171 1.484 Opinion leadership 4 4.363 1.255 4.581 1.219 4.232 1.259 Opinion leadership 5 4.504 1.403 4.828 1.308 4.309 1.423 Opinion leadership 6 4.354 1.364 4.572 1.332 4.222 1.367
ln(Opening weekend box-office revenue) 17.508 1.464 17.772 1.346 17.348 1.509 Movie rating 75.566 9.994 79.522 8.730 73.183 9.958
Gender .402 .491 .403 .491 .401 .491 Age 31.973 9.470 30.856 9.517 32.646 9.387
Marketing Science Institute Working Paper Series 33
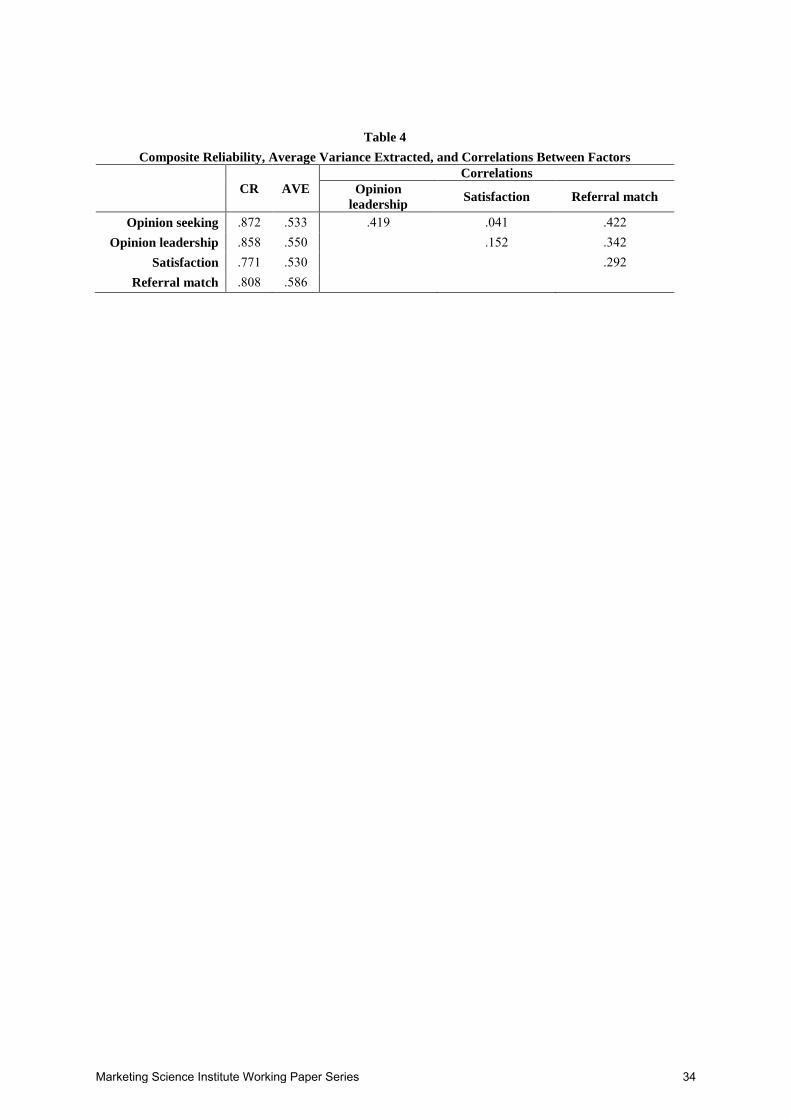
Table 4
Composite Reliability, Average Variance Extracted, and Correlations Between Factors
CR AVE
Correlations
Opinion
leadership Satisfaction Referral match
Opinion seeking .872 .533 .419 .041 .422 Opinion leadership .858 .550 .152 .342
Satisfaction .771 .530 .292 Referral match .808 .586
Marketing Science Institute Working Paper Series 34

Table 5
Parameter Estimates
Model 1 Model 2 Model 3
No endogeneity
correction, no
mediation
No endogeneity
correction, with
mediation
With endogeneity
correction and
mediation
Parameter
estimate SE
Parameter
estimate SE
Parameter
estimate SE
Equation 2: WOM referral exposure Opinion seeking .096*** .014 .095*** .014
ln(Opening weekend box-office revenue) .021** .011 .023** .010 Movie rating .013*** .002 .013*** .002
Gender .038 .032 .038 .032 Age -.002 .002 -.002 .002
Intercept -.957*** .209 -.989*** .197 Equation 3: Satisfaction
WOM referral exposure .112 .076 -.957** .385 Referral match .238*** .086 .315*** .093
WOM referral exposure * Referral match .231* .122 .233* .122 Movie rating .034** .004 .049*** .007
Gender .176** .073 .211*** .081 Age .011*** .004 .007* .004
Equation 4: ln(WOM referral value) Satisfaction .455*** .030 .455*** .030
WOM referral exposure .256*** .075 .157** .069 .156** .069 Opinion leadership .442*** .044 .364*** .038 .365*** .038
Movie rating .025*** .004 .009*** .003 .009*** .003 Gender -.044 .066 -.140** .061 -.140** .061
Age .014*** .003 .008** .003 .008** .003 Intercept -1.071*** .299 -.953*** .302 -1.240*** .323
Error covariance between Equations 2 and 3 .220*** .078 n 851 851 851
Log likelihood -7,420.53 -22,618.19 -22,613.46 Scaling correction factor 1.498 1.363 1.358
Akaike Information Criterion (AIC) 14,887.07 45,394.37 45,386.92 Bayesian Information Criterion (BIC) 14,996.24 45,769.34 45,766.64
# of free parameters 23 79 80 * p < .1; ** p < .05; *** p < .01
Marketing Science Institute Working Paper Series 35
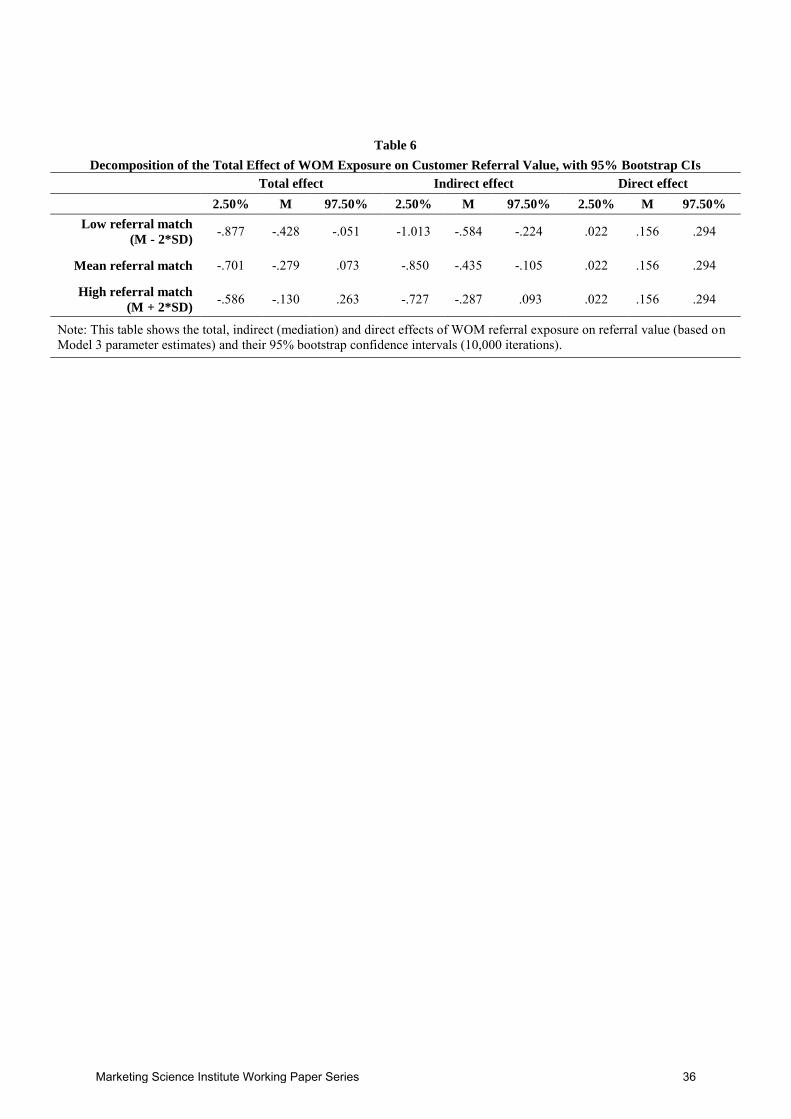
Table 6
Decomposition of the Total Effect of WOM Exposure on Customer Referral Value, with 95% Bootstrap CIs
Total effect Indirect effect Direct effect
2.50% M 97.50% 2.50% M 97.50% 2.50% M 97.50%
Low referral match
(M - 2*SD) -.877 -.428 -.051 -1.013 -.584 -.224 .022 .156 .294
Mean referral match -.701 -.279 .073 -.850 -.435 -.105 .022 .156 .294
High referral match
(M + 2*SD) -.586 -.130 .263 -.727 -.287 .093 .022 .156 .294
Note: This table shows the total, indirect (mediation) and direct effects of WOM referral exposure on referral value (based on Model 3 parameter estimates) and their 95% bootstrap confidence intervals (10,000 iterations).
Marketing Science Institute Working Paper Series 36
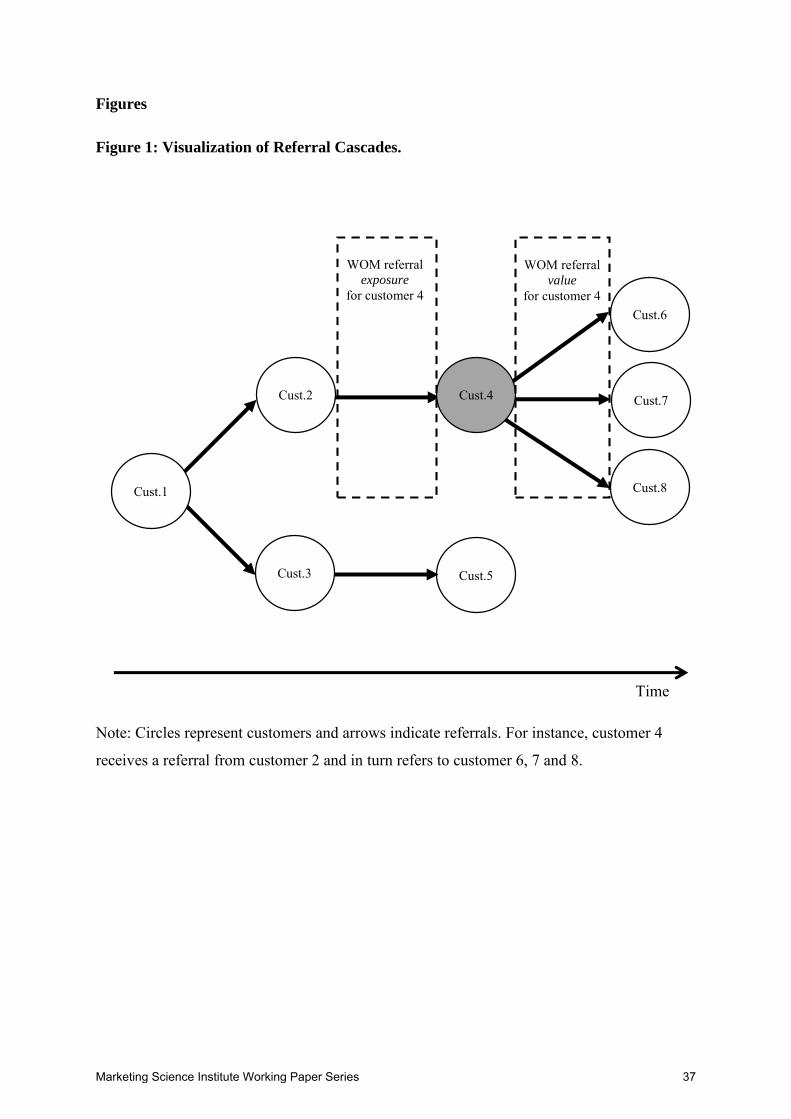
Figures
Figure 1: Visualization of Referral Cascades.
Note: Circles represent customers and arrows indicate referrals. For instance, customer 4
receives a referral from customer 2 and in turn refers to customer 6, 7 and 8.
Time
WOM referral value
for customer 4
WOM referral exposure
for customer 4
Cust.1
Cust.3 Cust.5
Cust.6
Cust.7
Cust.8
Cust.2 Cust.4
Marketing Science Institute Working Paper Series 37
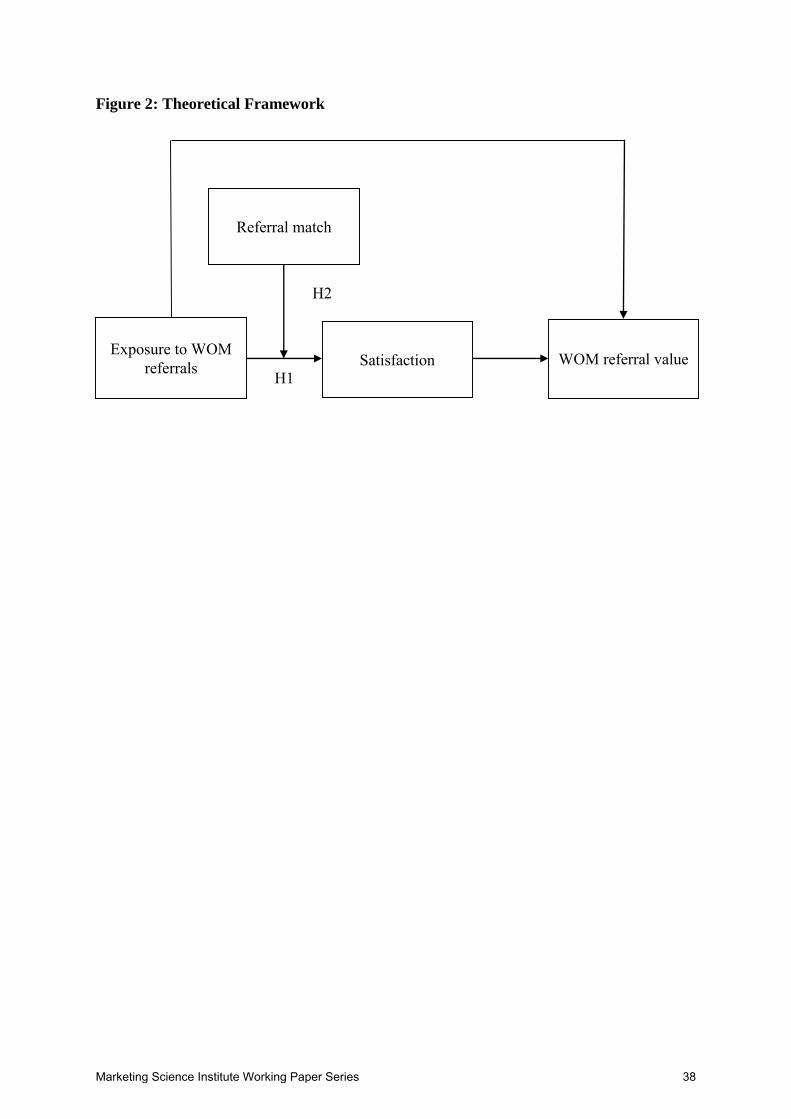
Figure 2: Theoretical Framework
H1
H2
Exposure to WOM referrals Satisfaction WOM referral value
Referral match
Marketing Science Institute Working Paper Series 38
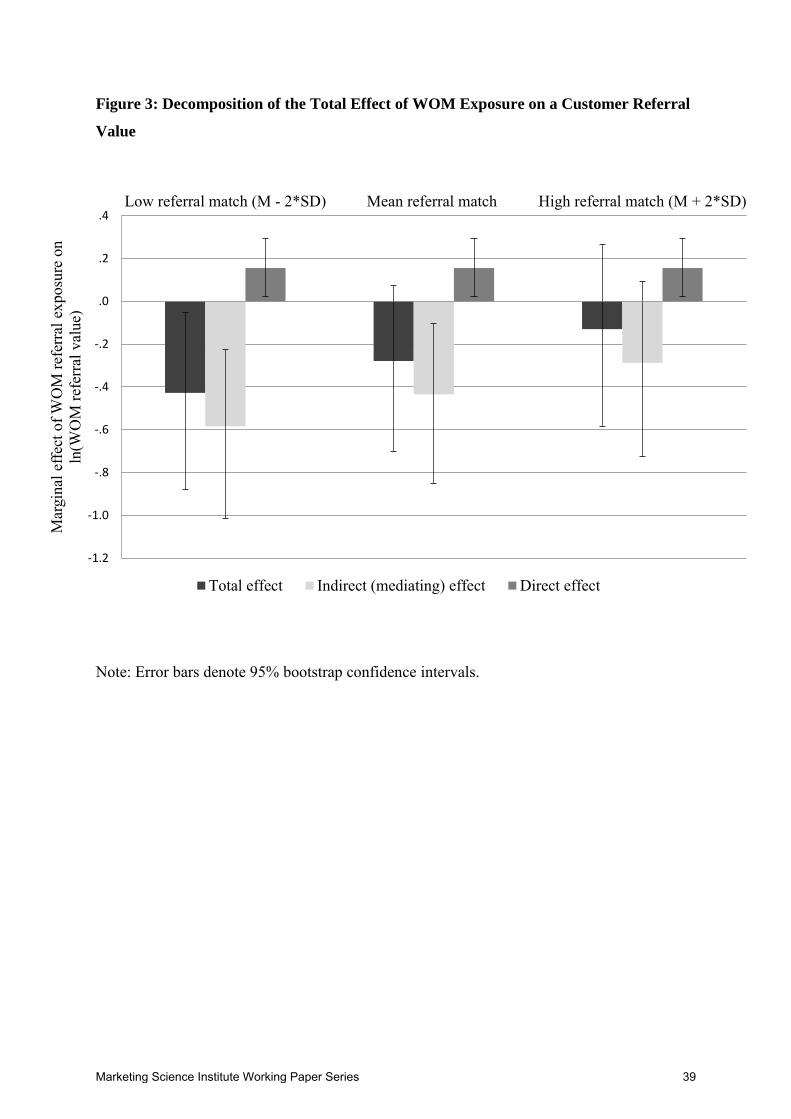
Figure 3: Decomposition of the Total Effect of WOM Exposure on a Customer Referral
Value
Note: Error bars denote 95% bootstrap confidence intervals.
-1.2
-1.0
-.8
-.6
-.4
-.2
.0
.2
.4Low referral match (M - 2*SD) Mean referral match High referral match (M + 2*SD)
Mar
gina
l effe
ct o
f WO
M re
ferr
al e
xpos
ure
on
ln(W
OM
refe
rral
val
ue)
Total effect Indirect (mediating) effect Direct effect
Marketing Science Institute Working Paper Series 39