![Quantitative Acoustic Emission Monitoring of Fatigue ...ASTM E647 [24], which gives the standard Mode 1 fatigue loading protocols. Figure 1 shows a conceptual illustration of the approach.](https://static.fdocuments.in/doc/165x107/5e7c549f20dd9b11ce17b189/quantitative-acoustic-emission-monitoring-of-fatigue-astm-e647-24-which-gives.jpg)
Acoustic Fatigue Design Data · Acoustic Fatigue Design Data Part I by ... and the amplitudes of...
58
ILI UM D AGARD- raph No. 162 Acoustic Fatigue Design Data Part I by A.G.R.Thomson DISTRIBUTION AND AVAILABILITY ON BACK COVER ~ A-- NATI ONAI IL-CHN!CAL- Q,, I!CC ) Nl ý(r SF RVIC F
Transcript of Acoustic Fatigue Design Data · Acoustic Fatigue Design Data Part I by ... and the amplitudes of...

ILI
UM D
AGARD- raph No. 162
Acoustic Fatigue Design DataPart I
by
A.G.R.Thomson
DISTRIBUTION AND AVAILABILITYON BACK COVER ~ A--
NATI ONAI IL-CHN!CAL-Q,, I!CC ) Nl ý(r SF RVIC F

AGARD-AG- 162
NORTH ATLANTIC TREATY ORGANIZATION
ADVISORY GROUP FOR AEROSPACE RESEARCH AND DEVELOPMENT
(ORGANISATION DU TKAITE DE L'ATLANTIQUE NORD)
AGARDograph 162
ACOUSTIC FATIGUE DESIGN DATA
Part I
by
"A.G.R.Thomson
Engineering Sciences Data Unit LtdLondon, UK
ThinAGARO -AGARD.

THE MI3SION OF AGARD
The mission of AGARD is to bring together the leading personalities of the NATO nations in the fields of
science and technology relating to aerospace for the following purposes:
- Exchar.ging of scientific and technical information;
- Continuously stimulating advances in the aerospace sciences relevant to strengtbeiing the common defenceposture;
- Improving the co-operation among member nations in aerospace research and development,
- Providing scientific and technical advice and assistance to the North Atlantic Military Comm:ttee in thefield of Perospace research and development;
-. Rendering scientific and tecanical assistance, as requested, to other NATO bodies and to m-mber nptionsin connect;on with research bnd development problems in the aerospace field.
- Providing assistance to member nations for the purpose of increasing their scientific and technical potential,
- Recommending effective ways for the member nations to use their research and development capabilitiesfor the common benefit of the NATO community.
The highest authority within AGARD is the National Delegates Board consisting of officially appointed seniorrepresentatives from each Member Nation. The mission of AGARD is carried out through the Panels which arecomposed for experts appointed by the National Delegates, tlh.e Consultant and Exchange Program and the AerospaceApplications Studies Program. The results of AGARD work ate reported to the Member Nations and the NATOAuthorities through the AGARD series of publications of which this is one.
I artic~pation in AGARD activities is by invitation only and is normally limited to citizens of the NATO nations.
The material in this publication has been reproducedK directly from copy supplied by AGARD or the author.
Published May 1972
620 178 3
P art d bt l((hrtal f atring aund R(,prodwu (i L idtiurford tlouu% 7 V ('harloitt St I ond,, WI/' IIID
PREFACE
Thk&-volume, the first part of a series giving data for design against acousticfatigue, has been prepared in order to draw together the results of research inacoustic fatigue and to present them in a form directly useable in aerospace design.Future work in this series viii deal with endurance of aluminium alloy and titaniumalloy structures under simulated acoustic loading, stress response of flat or curvedhoneycomb panels, near field compressor noise estimation, stress response of box andcontrol surface structures and structural damping. .
The AGARD Structures and Materials Panel has for many years been active inencouraging and coordinating the work that has been necessary to make this collectionof design data possible and after agreeing on procedures for the acquisition, analysisand interpretation of the requisite data, work on this series of design data sheetswas initiated in 1970.
The overall management of the project has been conducted by the Working Group .nAcoustic Fatigue of the AGARD Structures and Materials Panel, and the projoct has beenfinanced through a collective fund established by the Nations collaborating in theproject, namely Canada, France, Germany, Italy, U.K. and U.S. National Coordinatorsappointed by each country havy provided the basic data, liaised with the sources ofthe date, and provided constructive comment on droft data sheets. These Coordinatorsare Dr G.M. Lindberg (Canada), Mr R. Loubet (France), Mr G. Bayerdorfer (Germany),Gen. A. Griselli (Italy), Mr N.A. Townsend (U.K.), Mr A.W. Kolb (U.S.) andMr F.F. Rudder (U.S.). Staff of the Engineering Sciences Data Unit Ltd, London, haveanalysed the basic data and prepared and edited the resultant data sheets with Invalu-able guidance and advice from the National Coordinators and from the Acoustic FatiguePanel of the Royal Aeronautical Society which has the following constitutiongProfessor B.L. Clarkson (Chairman)p Mr D.C.G. Eaton, Mr J.A. Hay, Mr W.T. Kirkby,Mr M.J.T. Smith and Mr NA. Townsend. The members of Staff of the EngineeringSciences Data Unit concerned with the preparation of the data sheets in this volumeares Mr A.G.R. Thomson (Executive, Environmental Projects), Dr G. Son Gupta andMr R.F. Lambert (Environmental Projects Group).
Data sheets based on this AoARDograph will subsequently be issued in the FatigueSeries of Engineering Sciences Data issued by ESDU Ltd, where additions and amendmentsviii be made to maintain their current applicability.
A.H. HallChairman,Working Group on Acoustic FatigueStructures and Materials Panel
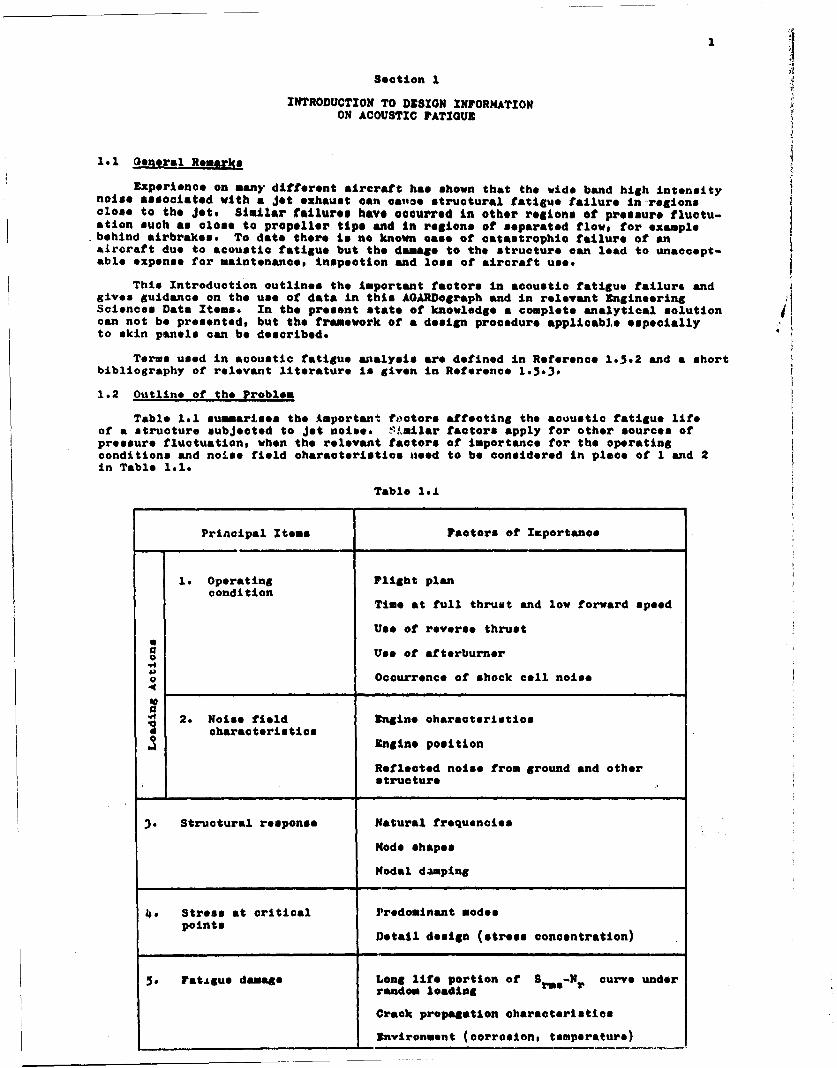
CONTEW__S
PMs No.
SECTION 1. INTRODUCTION TO DESIGN INFORMATION ON ACOUSTICFATIGUE 1
1.1 General Remarks 11.2 Outline of the Problem 1S1.3 Design Procedure 21.4 Analysis 21.5 References 3
SECTION 2. IfE ESTIMATION OF NEAR FIELD SOUND PRESSURE LEVELSDUE TO JET NOISE 5
2.1 Notation 52.2 Introduction 52.3 Calculation Procedure 62.4 Use of Calculated Sound Pressure Levels 62.5 Derivation and Reference 7K2.6 Example 7Figures 971
SECTION 3. NATURAL FREQUENCIES OF BUILT-UP, FLAT, PERIODICSKIN-STRINGER STRUCTURES(Part 1: Stringers rigid in bending) 13
3.1 Notation 133.2 Introduction .43.3 Calculation Procedure 143-4 Notes 153.5 Derivation 153.6 Example 15Figures 17
SECTION 4. NATURAL FREQUENCIES OF RECTANGULAn SINGLY-CURVEEPLATES 25
4.1 Notation 2,4.2 4otes 24.3 Applicatioa to Aircraft Structural Panels 264.4 Derivation 274.5 ExampleFigures 29
SECTION 5 THE ESTIMATION OF R.N.S. STRESS IV STIFFENED SKINPANELS SUBJECTED TO RANDOM ACOUSTIC LOADING 44
5,1 Notation k45.2 General Not.e 445.3 Notes on the Figures 455.4 Calculation Procedure 455.5 Comparison with keasurod Data 465.6 Derivation and Rwference 1465.7 Exanples 47Vieu• ~49
Section I
INTRODUCTION TO DESIGN INFORMATIONON ACOUSTIC FATIOUE
1.1 General Remarks
Experience on many different aircraft has shown that the wide band high intensitynoise associated with a jet exhaust can ca•oe structural fatigue failure in regionsclose to the jets Similar failures have occurred in other regions of pressure fluctu-ation such as close to propeller tips and in regions of separated flow, for example
.behind airbrakes. To date there is no known case of catastrophic failure of anaircraft due to acoustic fatigue but the damage to the structure can lead to unaccept-able expense for maintenance, inspection and loss of aircraft uses
This Introduction outlines the important factors in acoustic fatigue failure andgives guidance on the use of data in this AGARDograph and in relevant EngineeringSciences Data Items. In the present state of knowledge a complete analytical solution Acan not be presented, but the framework of a design procedure applicable especiallyto skin panels can be described.
Teros used in acoustic fatigue analysis are defined in Reference 1.5.2 and a shortbibliography of relevant literature is given in Reference 1.5.-3
1.2 Outline of the Problem
Table 1.1 summarises the important foctors affecting the acoustic fatigue lifeof a structure subjected to jet noise. '.milar factors apply for other sources ofpressure fluctuation, when the relevant factors of importance for the operatingconditions and noise field characteristics need to be considered in place of I and 2in Table 1.1.
Table 1.l
Principal Items Factors of IZportance
1. Operating Flight plancondition
Time at full thrust and low forward speed
Use of reverse thruste
0 Use of afterburner
o Occurrence of shock cell noise
V 2. Noise field Engine characteristicscharacteristics
Engine position
Reflected noise from ground and otherstructure
3. Structural response Natural frequencies
Node shapes
Nodal d~uaping
4. Stress at critical Predominant modespoints Detail design (stress concentration)
5. FatAguo damage Long life portion of S -N curve under
random loading e r
Crack propagation characteristics
Environment (corrosion, temperature)

1. Design Procedure
1.3.1 Skin panel.
The basic type of skin design for a component subject to acoustic fatigueloading is chosen with regard to the overall noise level which may be estimated asoutlined in Section 1.4.2 or from previous experience. Guidance on the choice of skindesign and on good design practice is given in Reference 1.5.4. The effect of variationsin panel geometry may be investigated by means of the analysis outlined in Sections1.4-.1 to 1.4.4. Use of early design charts such as those of Reference 1.5.1 has boonfound to lead to excessively heavy designs in many cases, but the later Referencesare more realistic.
Teats of critical sections of structure in a simulated jet noiae environment mayhe necessary after preliminary design, and after redesign a proof test may be requiredbefore finalisation.
1.4 Analysis
The analytical estimation of the life of a part subject to acoustic fatiguerequires informction in three main areas:
(a) the loading action, is.e the noise field chas. -ceristics and durationsunder critical operating conditions,
(b) the structural response, i.e. the natural frequencies of the structureand the amplitudes of the induced stressesp 4
(c) the fatigue life of the type of structure made from the particularmaterial when subjected to the resultant random loading.
The fnllowing notes amplify those information requirements.
1.4.1 Operating condittons
The starting point for an analysis is the estimation of the pressure fluctuationsand their durations throughout the flight plan or mission profile, and the estimatednumber of flights during service life. For example important elements may be thetotal time during whioh the engine is at full thrust and the forward speed is low,the possible ocnurrence of shock cell noise in cruise, and the use of reverse thrustin landing. In addition consideration should be given to pressure fluctuations suchas those generated by jet exhaust impingement and boundary layer turbulence.Consideration of such elements leads to an estimate of the acoustic fatigue loadspectrum.
Reference 1.5.11 contains a suggested procedure for dealing with cases where morethan one operating condition is a significant source of acoustic fatigue damage.
Reference 1.5.6 deals with the combination of sound levels from two or more sources
acting simultaneously*
1.4.2 Noise-field characteristics
The loading action on the structure is computed from a knowledge of the enginenoise characteristics and the vehicle configuration. The most important factors arethe location of the engines relative to the structure and the proximity of soundreflecting surfaces such as wing, fuselage, tail section or runway. The characteristicsrequired to define the loading action completely are
(a) the pressure spectra and spatial distribution over the structural
surface,
1(b) the correlation of the pressures over the structural surface.
A method of estimating the first, in relation to jet noise, is given in Section 2and further methods are listed in Reference 103*0o Although estimates by the method ofSection 2 have compared well with measurements on several different full-scale andmodel aircraft, it usually remaina necessary in the design development stage tosupplement them by measurements of noise levels on prototype aircraft.
The spatial correlation of the pressures is not usually required in initialdesign because of the simplifying assumptions which must be made.
.4-.) Structural response And stress at critical points
The cermplete expression for the response of a structure to acoustic excitationruquires n, knowledge of all the modes of vibration of the structure, their naturalfrequencies and damping, in addition to the noise field characteristics. In practice,the responfo of the structure can be estimated only from simplified representations ofthe structure and of the pressure field.

3
The following table shows sources of data on natural frequencies or various types,of structure in their lower modes.
Type of Structure Edge Conditions Data Source
ý bAll edges fixed
Ref. 1.5.8All edges simply-supported
Flat plate
Ref 1 5.9K All edges sim'ply -suppori ed
(to be revised in 1972)
Flat honey•ounb panel
Tor;kinol rest-aint at inflexible strnngors,
long edge of skin simply-supported, Section 3.
short edge restrained in rotationStringer- stif fenete panel
a All edges fixedAll edges simply-supported Section 4
<b (a > b)Curved plate
All edges fixed
All edges simply -supported To be issued in Port 2, 1972
Curved honeycomb panel
In calculating natural frequencies and stress responfle, experience suggesta thatindividual plate widths should be taken as the distance between adjacent skin-stiffenerrivet lines. For bonded structures, the distance between contrelines of adjacentbonded flanges is genbrally taken.
I Knowing the natural frequencies, the sound pressure levels and the pressurespectra, and making assumptions on panel damping, Section 5 gives an approximatemethod of e3timating the stress response, in terms of r.m.s. stress, of skin-stringerpanels having stiffeners of relatively high flexural stiffness; Reference 1.12outlines tte simplified theory used and shows a comparison with experimental results.In using this method it is requibed to know the spectrum level of acoustiu pressure ata natural Trequency of the panel. If band levels only are known, they may be convertedto spectrum level using Reference 1.5.-5 The effect on the stresses of reinforcement byincreased thickness along the plate edges is considerea in Reference 1.5.13.
414-4 Fatigue strength and endurance
The estimated r.m.s. stress in the panel Is compared with appropriate fatiguestrength data in order to estimate the life of the panel. In making this comparisonit is important to ensure thut the fatigue strength data used correspond to theappropriate conditions because the highest stresses usually occur in tee region ofstiffener or frame rivet lines where effects of stress concentration and fretting areimportant. Reference 1.10 gives data on the endurance of var.our types of joint inaluminium alloys subjected to simulated acoustic loading.
Where a panel is subjected to acoustic loadings of different intensities atdifferent timus it is su~gested tentatively +hat the effects should be combined byapplying the simple cumulative damage hypothesis using S rms-Nr data. This approach
is discussed in Reference 1.5.11.
1.5 References
S1.5.1 Structural design for acoustic fatigue.WADC ASD-TDR-63.820, 1963.
1.5o2 Definitions of terms for acoustic fatigue analysis.Engineering Sciences Data Item No. 66013, 1966.
4
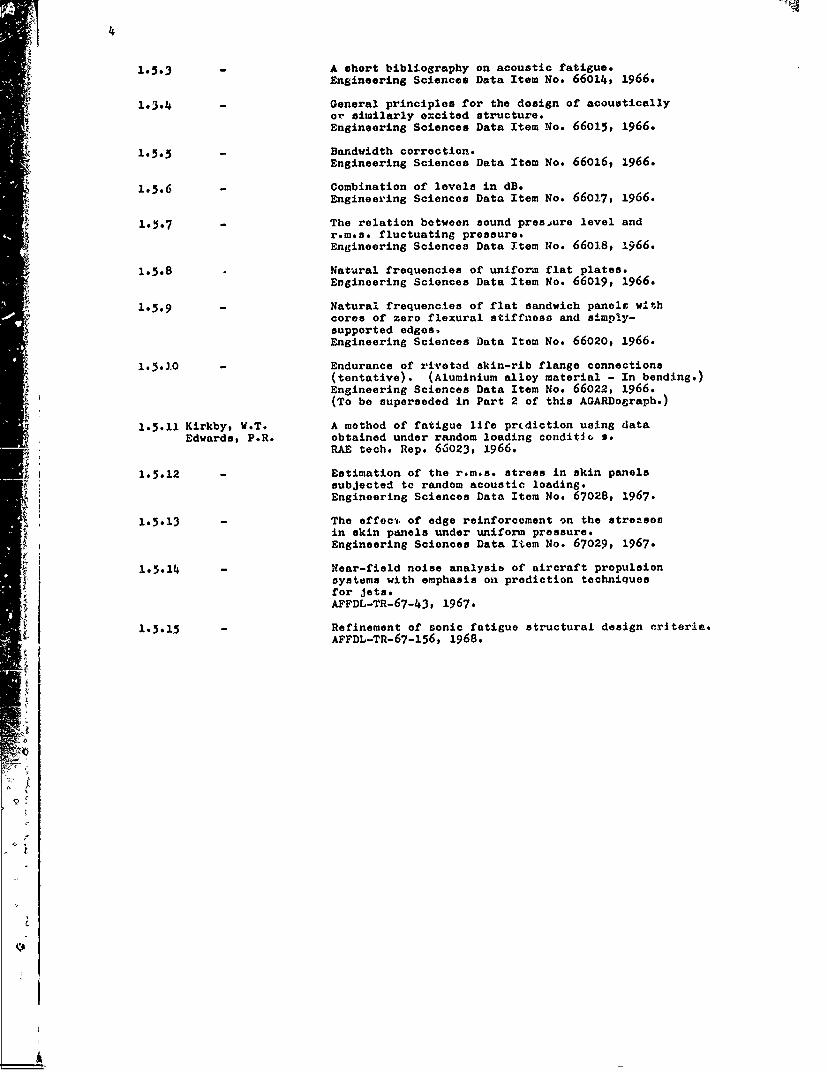
1.5.3 A short bibliography on acoustic fatigue.Engineering Sciences Data Item No. 66014, 1966.
1.3.4 - General principles for the design of acousticallyor similarly excited structure.Engineering Sciences Data Item No. 66015, 1966.
1.5.5 - Bandwidth correction.Engineering Sciences Data Item No. 66016, 1966.
1.5.6 - Combination of levels in dB.Engineering Sciences Data Item No. 66017, 1966.
1o5o7 - The relation between sound preejure level andr.m.s. fluctuating pressure.Engineering Sciences Data Item No. 66018, 1-966.
1°5.8 Natural frequencies of uniform flat plates."Engineering Sciences Data Item No. 66019, 1966.
1.5.9 - Natural frequencies of flat sandwich panelt withcores of zero flexural stiffness and simply-supported edges.Engineering Sciences Data Item No. 66020, 1966.
1.5.10 - Endurance of riveted skin-rib flange connections(tentative). (Aluminium alloy material - In bending.)Engineering Sciences Data Item No. 66022, 1966.(To be superseded in Part 2 of this AGARDograph.)
1.5.11 Kirkby, W.T. A method of fatigue life pr(diction using dataEdwards, P.R. obtained under random loading conditiG s.
RAE tech. Rep. 66023, 1966.
1.5.12 - Estimation of the r.m.s. stress in skin panelssubjected to random acoustic loading.Engineering Sciences Data Item No. 67028, 1967.
1.5.13 - The effoc%, of edge reinforcement on the streseesin skin panels under uniform pressure.Engineering Sciences Data Item No. 67029, 1967.
1.5.14 Near-field noise analysis of aircraft propulsionsystems with emphasis on prediction techniquesfor jets.AFFDL-TR-67-43, 1967.
1.5.15 - Refinement of sonic fatigue structural design criteria.AFFDL-TR-67-156, 1968.
V
Section 2
THE ESTIMATION OF NEAR FIELD SOUND PRESSURELEVELS DUE TO JET NOISE
2.1 Notation
c specific heat at constant pressure ofP fully expanded jet gases J/hg K ft lbf/slug K
D jet nozzle diameter m ft
f frequency Hz c/s
L overall sound pressure level dB
L datum overall sound pressure lovel dB dB0
Lv correction to L due to change in jetvelocity dB dB
L correction to L due to change in jetP density dB dB
n velocity index
p ambient pressure N/m2 lbf/ft 2
R gas constant(287 J/kg K) (3090 ft lbf/slug K) J/kg K ft lbf/slug K
Tj jet pipe static temperature K K
THJ jet pipe total temperature K K
V mean fully expanded jet velocity M/8 ftie
Vo datum fully expanded jet velocity(610 m/e) (2000 ft/s) M/8 ft/sx axial distance from jet pipe nozzle
plane, measured in jet direction m ft
y radial distance from jet axis m ft
Pj density of jet gases kg/n3 slug/ft 3
Po doatum density0 dau9 kgOs/) (o.oo0 00 slug/ft') kg/m3 1Lug/ft3
4 Both S1 and British units are quoted but any coherent system of urits may be used.
2.2 Introd%ction
This Section gives a method of estimating the near field sound pressure levelsr • due to high elte.ity jet noise from a single stationary conical nozzle.
Detailtid uoise data from the engine manufacturer should be used for preferencebut, when tiA is not possible, a number of methods of estimation is available. Thesemethods g*vw" widely differing results and after comparing them the following methodW• has been found to give the closest agreement with exparimental results. This methodis intended to give a value of the o'orall sound pressure level that is somewhere nearth%. mean. Tht accuracy 3t tne estimat%0 tNvele is expected to be within ±5 dB, J..between ep;ronimately 6C per "=n. and 17 per cent of the actual r.m.s, pressure.Under reab;t .ondi.,exv'4 or at J-, t.eloc~*- well above the datum velocity, howev.tr,the discrepancy cru'a he .i4r
V, Tho noise level: prodic-.d by the method described here ar free field valud butdo not apply to the field within a conical ourface emanating fr, the jet nozzle yari-moter and expand~n7 at a somi-anglz of approximately l1 degrees lative to the jotaxis, since vhir region contains the turbulent mixi.,g region of tue jet.
'This Seuticn is also inapplicable to the case of "shock cel) noso's,phenomenon uhtch can occur when a jet nozzle ia oerating in an over-choked conditW.on.A relatively discrete note is then produced, giving in a narrow band an intensit/ utuctgreater than that of the busic Jet noiso.

6
2.3 Calculation Procedure
The following information is required aui a basis for the computation of the soundpressuve level at some point in the fields
Jet nozzle diameter Dco-ordinates of the point (x,y)mean fully expanded jet velocity Vjet pl.po total temperature THJ.
(i) Evaluate x/D and y/D •
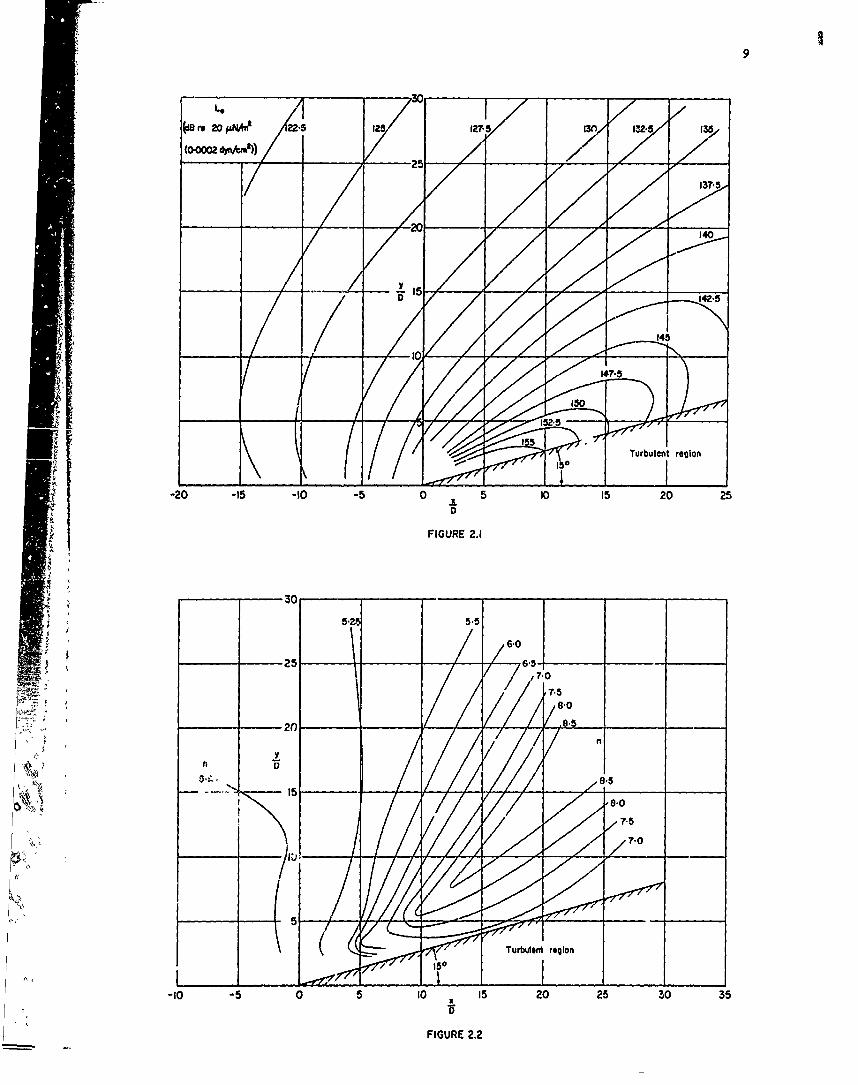
(ii) From Figure I, which shows the free field datum noise level contours,read off the datum overall sound pressure level Lo at the position(x/D, y/D).
(iii) From Figure 2, which shows velocity index contours, read off the velocityindex n at the position (x/D, y/D).
(iv) Calculate the first part of the velocity correction term ALvl , from(VO)•Lvl I~nl~vl
(v) Obtain the seconid part of the volocity correction term Lv 2 fromFigure 3, which shows ALv 2 plotted against loglO(V/Vo) for differentvalueo of n .
(vi) Calculate the total jet velocity correction Lv from
Lv u ALvl + ALv2 •
(vii) Calculate the density of the jet gases pj
where Pi a -RT i
V2
and T a THJ - 2c for all jet veloctties.
tp
(viii) Calculate denaitf correction LP
where Lp - 20 logl0(• .c
(ix) Evaluate the overa& sound pressure level (SPL) at *,t required point(x,y) as
L L° + L0 v + L •
This level can be converted to a pressure loading by the use of therelation
r.m.s* fluctuating preAsure in N/m2 I0 (0.05L°4.699)
or using Reference 2.5.1.
(x) For a given frequency the spectrum level in decibels relative to anarbitrary overall SPL may be read from Figure 4, after evaluating fD/Vand x/D . Alternatively, if the spectrum level is required in terms ofpressure loading, this may be found using Figure 3. Taking values of
fD/V and x/D the spectrum level in (N/m2)/Hz relative to I N/m2
"overall SPL is read from the ordinate of Figure 5 and is then multipliedby the value of L obtained as a preeaure loading in (ix). This gives
the pressure spectrum level for a specified frequency in (N/m 2 )/Hz.
2.4 Use of Ctlculated-Sound Pressure Levels
After the free field sound pressure levels have been 'etimated, corrections mustbe made for local effects, for example reflection. When teo wavo fionts of this Poisefield strike a structure they are partially reflected, and the reflection processlocally increases the pressure loading on the surface.
When the wave front strikes the surface at right angles (normal incidenve) ý.hepressure loading is doubled (a 6 dB increase on the c"..ulated values). If the wavefront moves parallel to the surface (grazing incidence) there is no increase in loading.

To allow for this reflection proceoc, it is fairly gineral engineering practiceto add a mean correction of 3 dB to the calculated free air levels.
The effects of different nozzle arrangements, aircraft configurations, etc.,should be taken into consideration.
Further corrections must be made for the case of an aircraft in motion to allow* for tho effects of the aircraft velocity and ambient speed of sound.
An alternative computer-based method that plots overall sound pressure levels ?orvarious engine operating conditions can be seen in Derivation 2.5.3,
2.5 Derivation and Reference
Derivation
2.5.1 Fzanken, P.A. Methods of flight vehicle noise prediction.et al. WADC TR 58-343, 1958.
2.5.2 Unpublished work by Rolls-Royce Ltd and Bristol SiddeloyEngines Ltd.
2.5.3 Plumblee, H.E. Near field noise analyses of aircraft propulsion systemset al. with emphasis on prediction techniques for jots.
AFFDL-TR-67-43, 1967.
2.5.4 Riley, H.P. Near field jet noise prediction techniques.British Aircraft Corporation Ltd, Acoustics LaboratoryReport A.R.324, 1971.
Roference
2.5.5 The relation between sound pressure level and r.m.o.fluctuating pressure.Engineering Sciences Data Item No. 66018, 1966.
2.6 Example
It is required to estimate the r.m.s. sound pressure level and the pressurespectrum level at 300 Hz at a specific point given the following conditions:
D = 0.61 m, x = 5.5 m, y a 6.7 m,
V = 670 m/a, THj = 900 K,
Vo Z 61o m/s, Po U 0.49 kg/m3',
R a 287 J/kg K, c = 1160 J/kg K,P a 101 x 10 3 N/m2. P
Firstly 0xD 1 9,02 ,
and 2D 11.0•
Hence, froti Figure 1DL 140 dB
and, from Figure 2, by intorpol&tion
n = 6.2.
4Now A v 10 x 6.2 loglo( ) a 2.5 dBi
and, from Figure 3, for logl 0 (V/Vu) - 0.0407 and interpolating for n - 6.2
AL •"v2 0.9 dB
so that Lv • 2.5 - 0.9 a 1.6 dB •
As T 670 9 - 2x 6 707 Kj C' 16
the- Pj 101 x 103 I 0.498 kg/rn287 x 707
Now L 20 logliaO49 30*14 dB
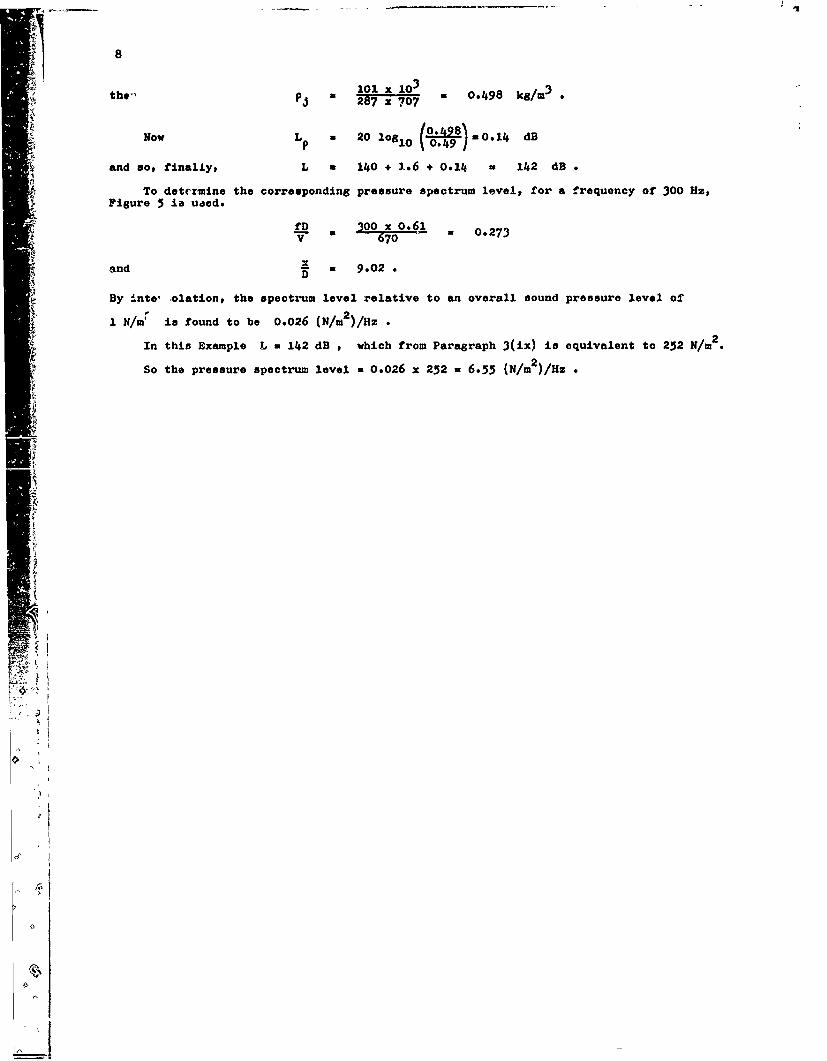
and sop finally, L a 140 + 1.6 + 0.14 u 142 dB
To deternine the corresponding pressure spectrum level, for a frequency of 300 Hz,Figure 5 ia uaed.
fD 300 x 0.61 0273V 670
and a 9.02.
By .nte, olation, the spectrum level relative to an overall sound pressure level of
1 N/mr' is found to be 0.026 (N/m 2 )/Hz f
In this Example L a 142 dB , which from Paragraph 3(ix) in equivalent to 252 NIM2,
So the pressure spectrum level = 0.026 x 252 u 6.55 (N/m 2)/Hz
I
j
V 6"0
C'
20~ 2OMAi 22-5 125 127.5 130 Il2.5 135
(00020twm iL,-2-- _ _
.37.
IIS
Tubie rgo
-20 -15 -10 -5 0 5 10 15 20 25D
FIGURE 2.1
- 30-___-__ ___
6.0
15*880
70
i5
-10 -5 0 5 0 15 20 25 30 35
FIGURE 2.2

10
*c
o9 E

11
__________ _________ 2
a1.
a
a
a
'4
aa1.
V
a
*N
0
.4
1*2
*
a
-0 a
a
a
______ ______ N
4 _______ _______ _______ -
a�bJO
C, C'4 '4
20 0 0 0I I I I
(( 1 uqu4 �ooGo) 1W/N O� SJ SP)�49 310J6A00 P!)01J ISM� WIU�O*d9
K I

A12A
IdS HIOMO ,3;/5qI I in; IwAO wfjlJadS
a~ $1 0 0so0
CON
___ 4)
- - - -
0 c
r 1.-
Vk 01N ___IA j/ I4 nW
13
Section 3
7 •NATURAL FREQUENCIES OF BUILT-UP, FLAT,PERIODIC SKIN STRINGER STRUCTURES
(Part I: Stringers rigid in bending)
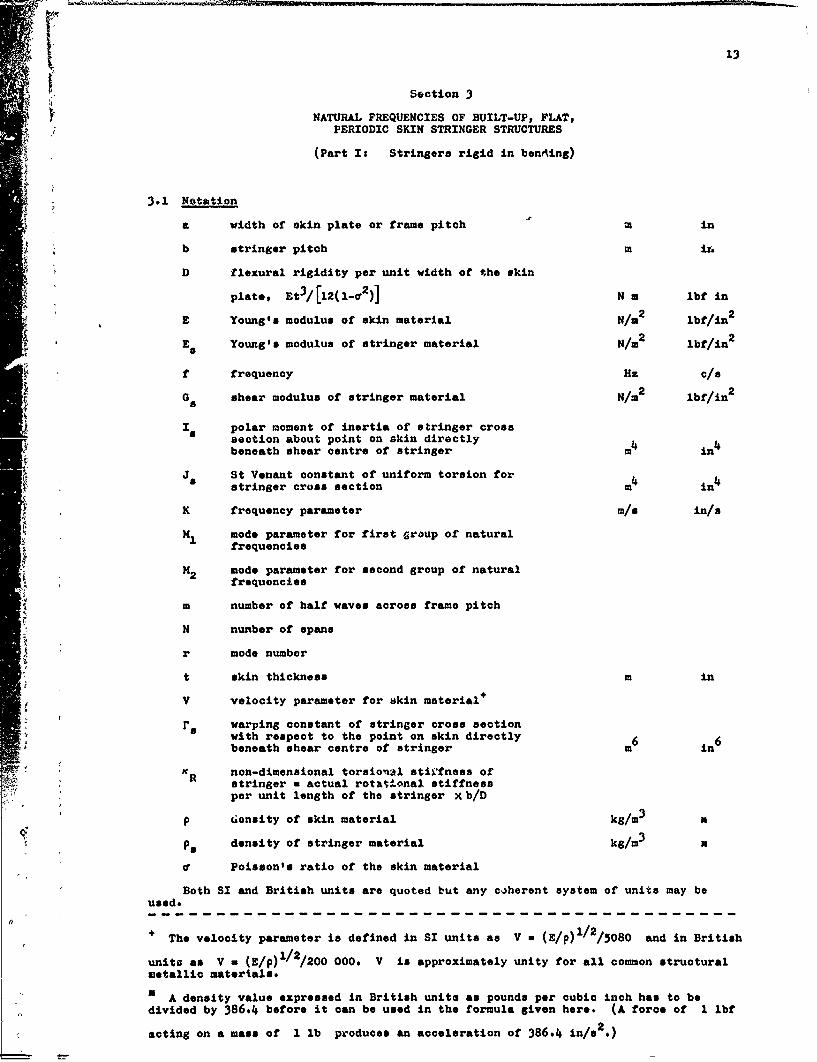
3.1 Notation
& width of akin plate or frame pitch M in
b stringer pitoh m in
D flexural rigidity per unit width of the akin
plate, Et3/[l2(1la2)] N m lbf in
E Young's modulus of akin material N/rn2 lbf/in 2
-E Young's modulus of stringer material N/M2 lbf/in2
i'. f frequency Hz c/o
G shear modulus of stringer material N/, 2 lbf/in 2
1 s polar moment of inertia of stringer crosssection about point on skin directlybeneath shear centre of stringer m4 in 4
Sa St Venant constant of uniform torsion for m4 4
stringer cross section in
K frequency parameter m/s in/a
H1 mode parameter for first group of naturalfrequencies
H 2 mode parameter for second group of natural"•frequencies
m number of half waves across frame pitch
N number of spans
r mode number
t skin thickness m in
V velocity parameter for akin material÷
re warping constant of stringer cross sectionwith respect to the point on skin directly 6beneath shear centre of stringer Min6
SR non-dimensional torsional sti'fness ofstringer u actual rotattonal stiffnessper unit length of the stringer x b/D
p ionsity of skin material kg/m3 M
Sp density of stringer material kg/m3 a
Poisson's ratio of the skin material
Both SI and British units are quoted but any coherent system of units may beused.
SThe velocity parameter is defined in SI units as V u (E/p)l/2/5080 and in British
unitg as V a (E/p)l/2/200 000. V is approximately unity for all common structuralmetallic materials.
a A density value expressed in British units as pounds per cubic inch has to bedivided by 386-4 before it can be used in the formula given here. (A force of I lbf
acting on a mass of 1 lb produces an acceleration of 386-4 in/s 2.)

114
3.2 Introduction
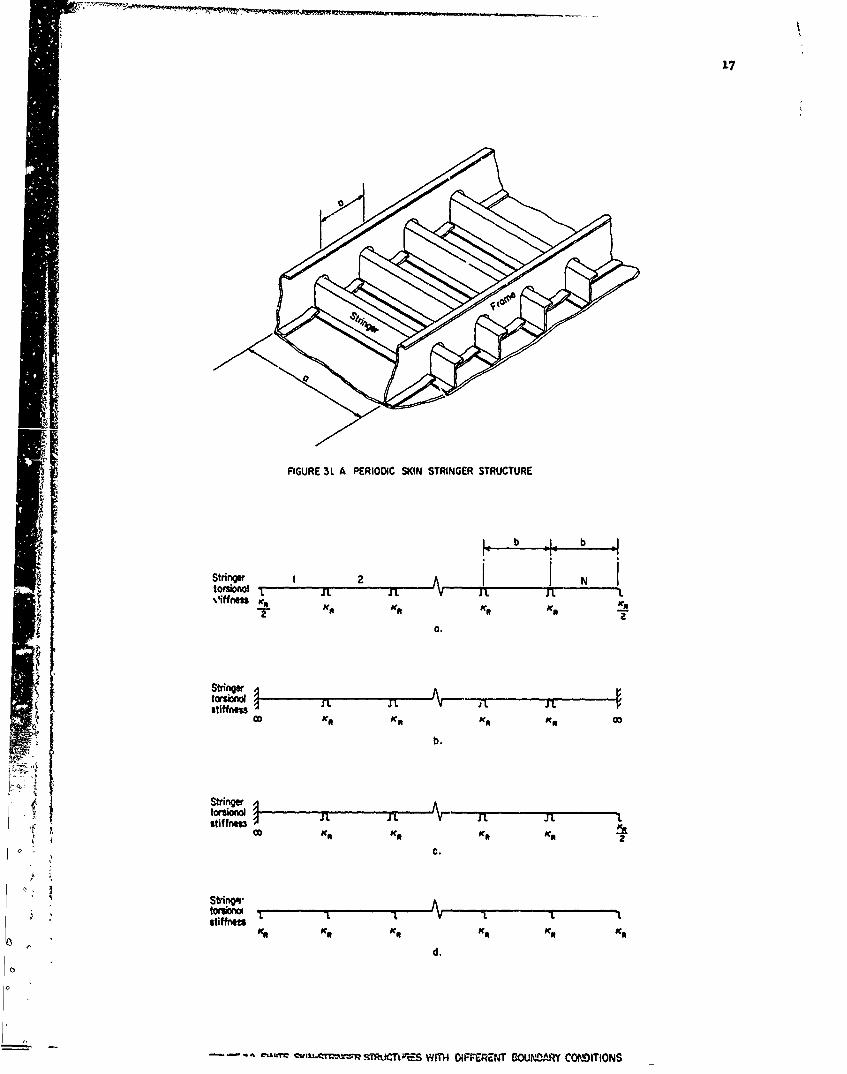
This Section gives the natural frequencies of vibration of built-up, flat skin-stringer structures with equispaced and identical stringers as shown in Figures 3.1and 3.2. The natural frequencies of such multi-span structures occur in groups, thenumber of frcquoncies in each group being equal to the number of spans. For a panelhaving a large number of spans the lowest natural frequency in any group is generallyassociated with a mode in which the stringers twist and the highest nttural frequencyin that group is associated with a mode in which the stringers tend to bend withouttwitting. For a panel having a small number of spans, typical mode shapes, as shownin Figure 3.3, are affected by the edge conditions. The mode shapes alternate betweensymmetric and anti-symmetric as frequency increases.
In the Derivation the frame torsional stiffness has been neglected and the framebending stiffness has been assumed to be infinite. The skin edges at the frames arethus assumed to be simply-supported. The natural frequencies are only slightlyinfluenced by the stringer bending stiffness and therefore this stiffness has beenassumed to be infinity.
This Section cLn be used to predict the first two groups of natural frequenciesof skin-stringer structures with four different end conditions. The results have beenpresented for varying degrees of stringer torsional stiffness, for three differentaspect ratios (a/b) and for two different values of m # the number of half-wavesacross the frame pitch.
3.3 Calculation Procedure
Calculate f from
f a VK t
To determine K
(i) Calculate KR from thn equation
K Ra E~. T) Gs(T) - p0Is(2x} X "iSince f is unknown its value has to be estimated lIitially. Values of f a 100 Hzfor the first group of frequencies and f a 200 Hz for the second group should giveresults of sufficient accuracy for commonly used skin-stringer structures. Alternatively,for the first group of natural frequencies, f may be taken as the fundamentalnatural frequency of any individual panel with fully-fixed edges. For the secondgroup, f may be taken as the natural frequency of the same panel with fully-fixededges in its second mode (i.e. with approximately two half waves along the length b).Both these frequencies can be calculated using Reference 3.5.3.
(ii) Calculate H3 or H2 from the following tablet
End Conditions M1 H2as in (lr,(N) (N+ler 2N)
Figure 2a r N r I
Nr
Figure 2b r 2
Figure 2c 2r2- 1 2 l2r2- I2N 2N
seee2d Note in Step (iii)
Figure below
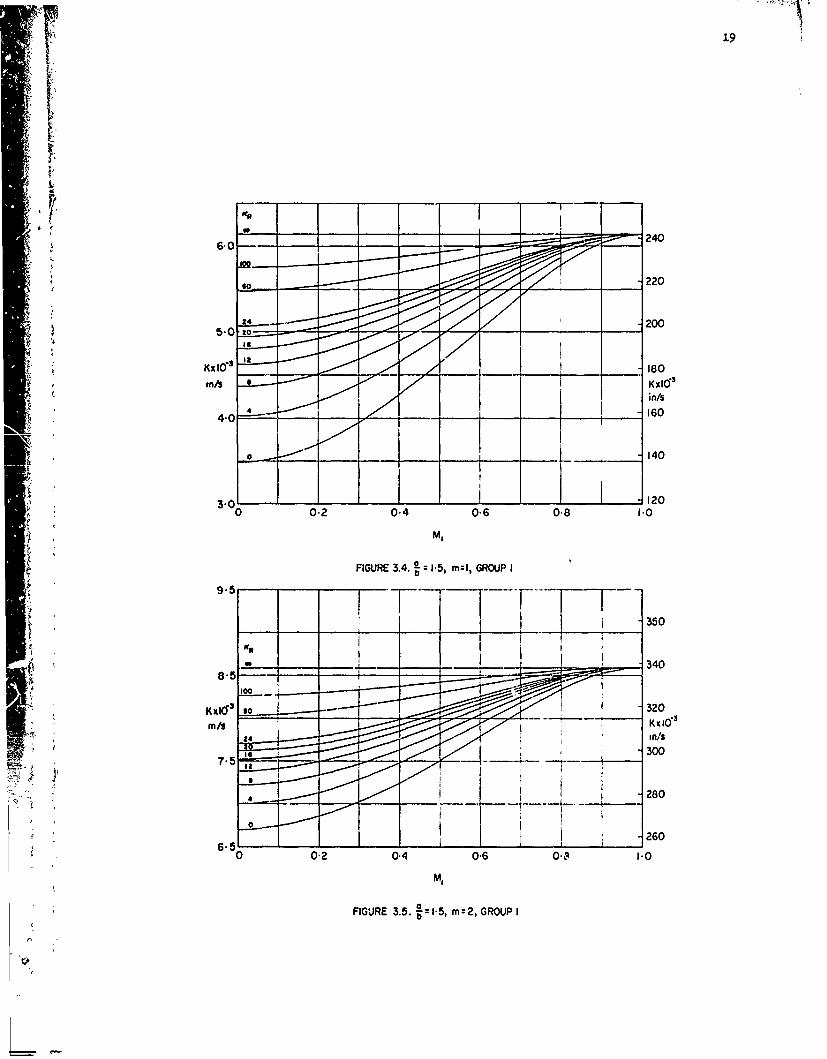
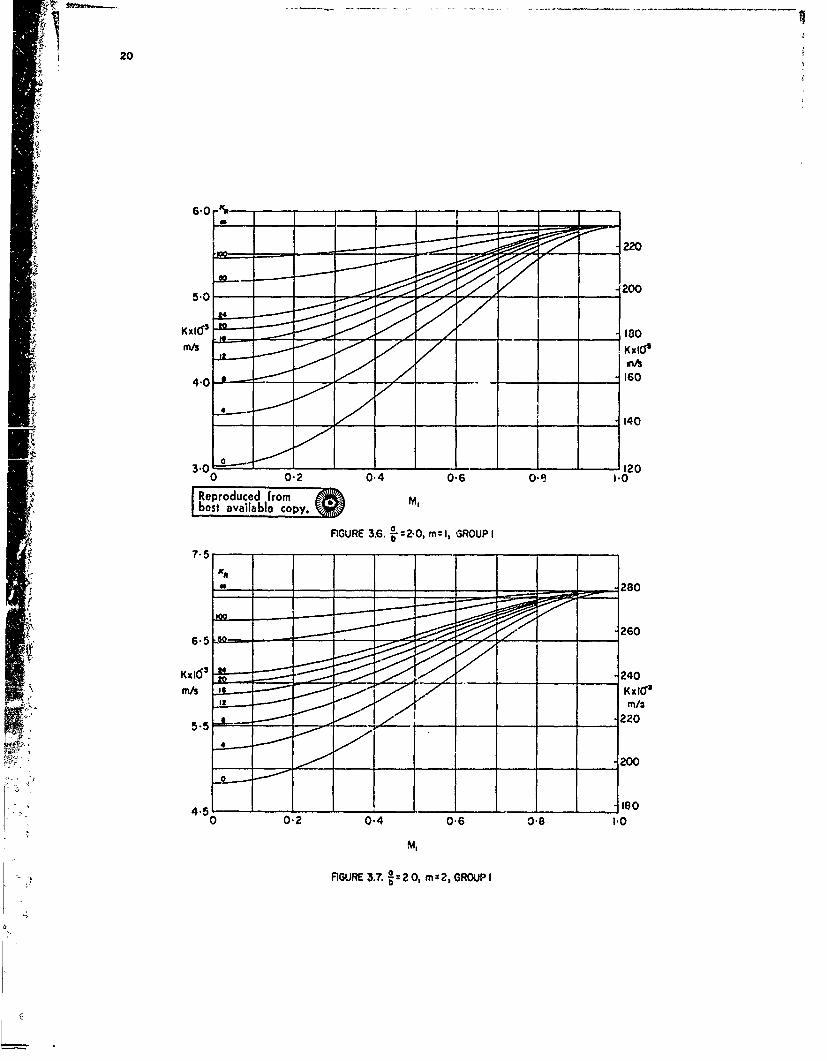
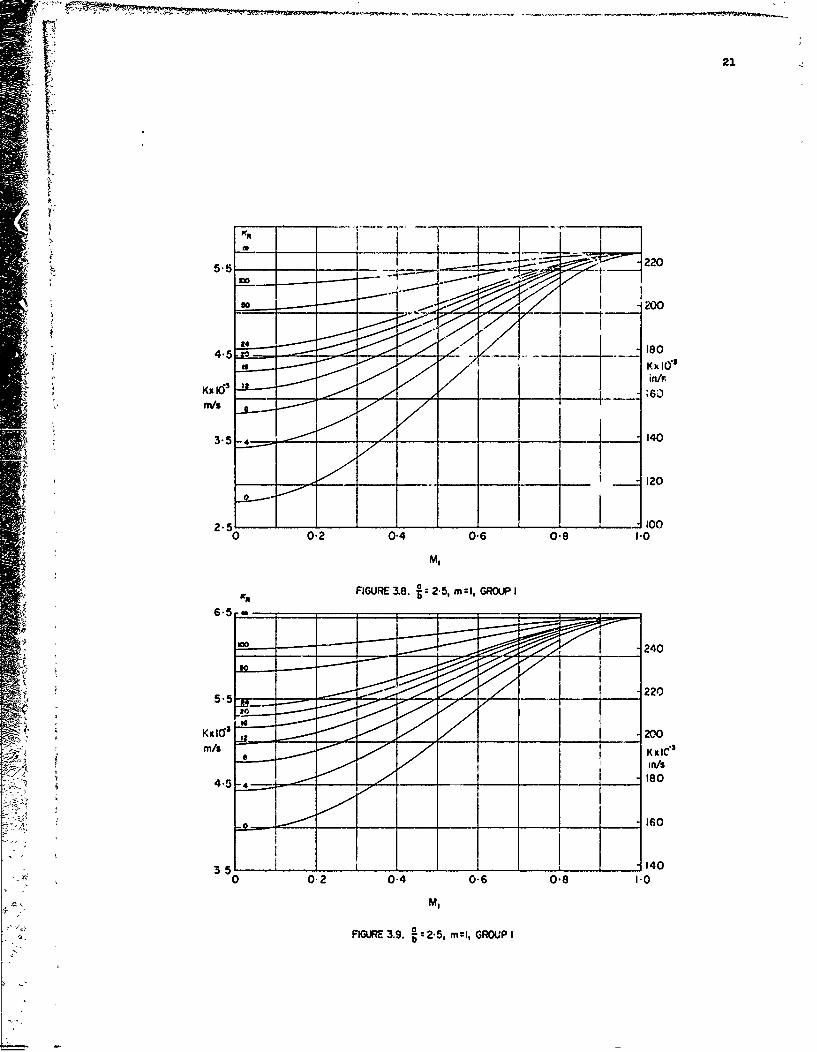
(iii) Read K from Figures 4-9 for appropriate values of m , aspict ratio(a/b), KR and H1 or M2
Notei For str•ctures with end conditions as in Figure 2d, K is approximatelyequal to the arithm~ttic average of the values of K obtained from ths first two rowsin the above table.

15
3.4 Notsm
The effect of including the frame torsional stiffness would be to increase thenatural frequencies slightly and this would be more pronounced for structuren with"smaller aspect ratios. The effect of including the frAmea bending stiffness would beto decrease the natural frequencies slightly.
For structures with a low stringer torsional stiffness, the bounding frequencierof the first group (with m a 1 or 2) can also be found from Data Item No. 66019.
Derivations 3.5.2, 3.5.4 an4 3.5.5 give the transfer-matrix method of analysis ofskin-stringer structures which could be used to calculate the natural frequencies ofnon-periodic structures, i.e. structures with non-uniform skin/stringer characteristics.
3.5 Derivation
3.5.1 Lin, Y.K. Free vibration of a finite row of continuous skin-stringerBrown, I.D. panels. J. Sound and Vibration, Vol.1, No.l, January 1964.Deutschle, P.C.
3.5.2 Lin, Y.K. Free vibration of continuous skin-stringer panels withet al. non-uniform stringer spacing and panel thickness.
AFML-TR-64-347,. February 1965.
3.5.3- Natural frequencies of uniform flat plates.Engineering Sciences Datn, Item No. 66019, 1966.
3.5-4 Hercer# C.A. Prediction of natural frequencies and normal modes ofSeavey, C. skin-stringer panel rows.
J. Sound and Vibration, Vol.6, No.1, January 1967.
3.5.5 Mercer, C.A. Program for the calculation of natural frequencies andSeavey, C. normal modes of skin-stringer panel arrays.
Institute of Sound and Vibration Research Tech. ReportNo.6, July 1968.
3.5.6 Sen Gupta, 0. Natural flexural waves and the normal modes ofperiodically supported beams and plates.J. Sound and Vibration, Vol.13, No.1, September 1970.
3.5.7 Sen Gupta. 0. Natural frequencies of periodic skin stringer structuresus.-ne a wave approach.J. Sound and Vibration, Vol.16, No-4, June 1971.
3.6 Extinpla
It is required to determine the first group of natural frequencies of a six-spanskin-stringer structure having the following dimensions ,tc. with end conditions asin figure 2d and with a single half wave across the skin widtn.
-12 6
ba u254 mm I al0.5 x108 M4
t a I1mm Eu~.20 Nr 2S•E - Es IS 72 300 HN/m2
auO- .3
94.4 x 0" 1 2 m4 P Pa W 2800 kg/m 3
Go I27 800 wN/m 2 .
K -* From this D - 12(1-02) " 6.62 N m, V - 0 1.00
12(1--2)5080
and for the first group of natural frequencies with a single half wave across the skin
width (m a I and assuming f a 100 Hz),
PC -- p. (3) + J- Paloo)2 b
a (328 + 100 - l16) x 0.0384
S•0 12,0v
For this group of frequencies, with m a 1, a/b a 2.0, K R a 12.0 and using
•_ Figure 3a, the results can be calculated and presented in the form of the following

16
gode End conditions End conditions End conditions f VKtnumber as in Figure 2a as in Pigure 2b as in Figure 2d b'
1 )1 K (Average of the (using K from(from Figure 3a) (from Figure 3a) results in column VI)
(m/e) (m/M) columns III and V) (Hz)(m/e) (z( I( (IV) (M( VI ) (VII)
1 0 4270 1/6 4360 4315 66.9
2 1/6 4360 1/3 4610 4485 69.5
3 1/3 ý6io 1/2 4970 4790 74.2
4 1/2 4970 2/3 5370 5170 80.1
5 2/3 5370 5/6 5690 5530 85.7
6 5/6 5690 1 5S30 5760 89.3
Sirmilar calculations can be done for a structure with end conditions as inFidure 2c. It may be noted that the frequencies obtained in column VII are less than100 Hs and therefore the value of K R has been slightly under-estimated. This means
the actual frequencies are slightly higher in this particular problem. Furthercalculations show that the calculated frequencies are within about 3.5 per cent of thefrequencies obtrined by taking a further iteration.
17
FIGURE 31. A PERIODIC SKIN STRINGER STRUCTURE
Stringer L 1 1 2 I Nto~rsimnl JL AL ,L •
0.
r. JKo J1.
00 K1 KR K" Ka 3 0
b.
I ~ ~~~~~~~~Stringer _______________________torindlna••... 1
K" KR KR K 3
0 C.
¶ ~String",A* ~torsni"
stiffnetKm Ka KM KA KR Km
S.... "•'• -•'UM••crt-S WITH DIFFERENT COU.,ARY COkýOITIONS

ModelI
Stringer torsion mode
Mode 2
An intermediate mode
Mode 4
_-•' .___••Mode 5
" Mode 6
Stringer bending mode
FIGURE 3a3 TYPICAL MODE SHAPES OF A SIX-SPAN SKIN-STRINGER PANEL
(ONLY THE FIRST GROUP IS SHOWN)
19
_____ _____ _____240
220
-&1--___ -200
________ 180
~ r/S Kin/s-- -1600__ ____ 140
0.4 0 120A 0,. . . . .
FIGURE 3.4:. 9 -5, mz1,GROUP I
I9.
I1350a 340
~I /
280
0 . 0.4 0.6 o0q 1-0
FIGURE 3.5. 1-I.5, m 2, GROUP I
20
-200
KxIcl3 180
4__0 160
14
3.0 - .- 1200 0- 0-40-6 .9 10
Reproduced from M
FIGURE 3.6. * 2. 0, m: 1, CROUP 1
Kx163 .240
-___220
__ 200
ISO4.5 - - - - - - - - - - - - -
002040.6 0.8 1-0
FIGURE 3.7. :2 0, m 2, GROUP I
~1 21
~1~* - ~ 220
4.5 -vaý180
Kxd'?
Kxw 6
_ _ _ _ _ _ 140
120
leftFIGURE 318. :2-5, m 1, GROUP I
_____240
___220
KxlxI0
____ ____ ____ ____ ____ 160
0 0.2 0-4 0-6 0.810
FIGURE 3.9. g 2.5, m:I, GROUP I

22
I1
60NQIý
IS
rn/sin/
4350
002040.6 0.8 110
FIGURE 3.10. 2=1-5, rnz, GROUP 2
1 23
IC~f
144
45
i0 0-2 0-4 0-6 0.81.
M,
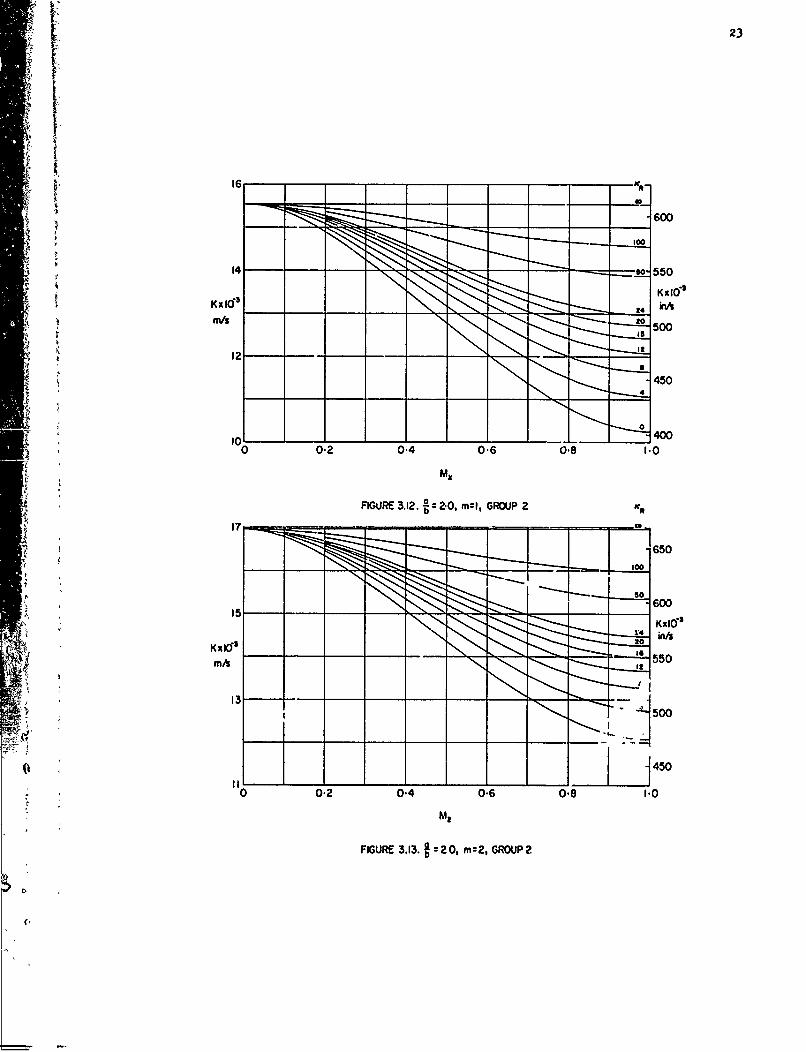
FIGURE 3.12. -0, mCI, GROUP 2Ko
15 KX16'
13 J0
00-2 0-406 0.8 1.045
FIGURE 3.13. 2 :0, m 2, GROUP?.
24
K _X __ in/s
42
-45
I,,
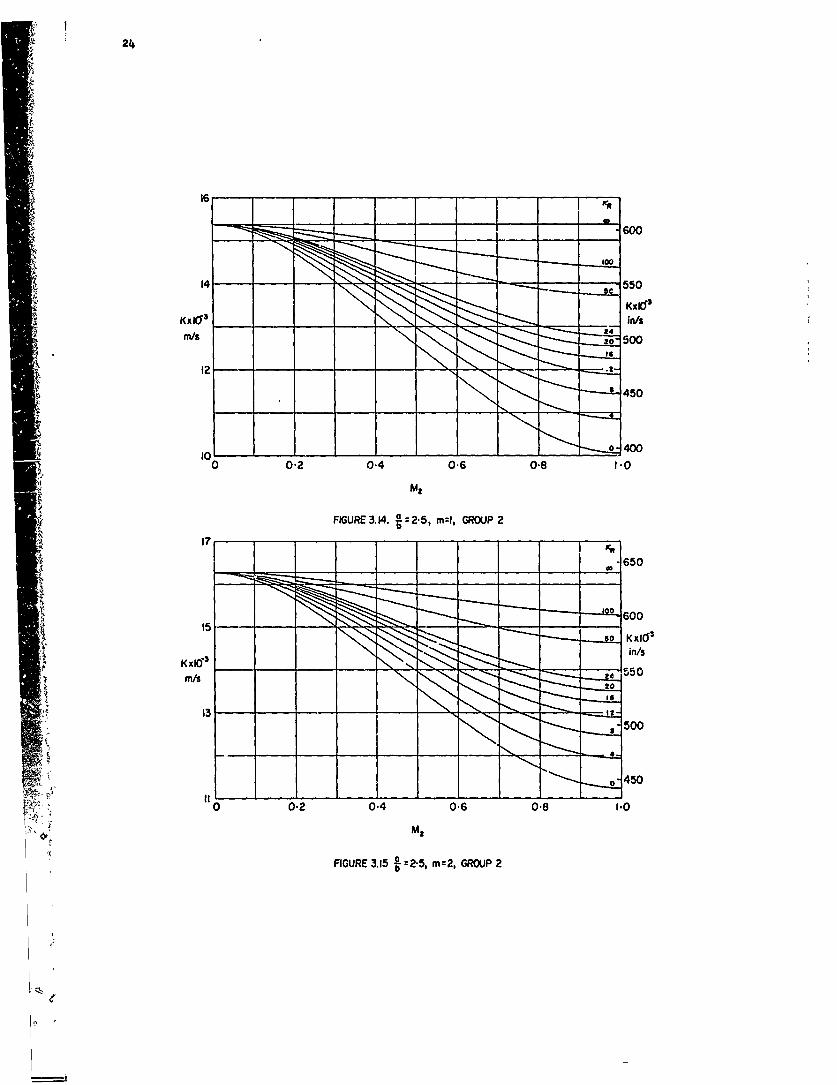
FIGURE 3.14 . :2.5, mz2, GROUP 2
'65
25
Section 4
NATURAL FREQUENCIES OF RECTANGULARSINGLY-CURVED PLATES
4.1 Notation
a length of longer plate side in
b arc length of shorter plato side M in
E Young's modulus of plate material N/.a2 lbf/in 2
f natural frequency of vibration of plate HZ c/s
K natural frequency parameter for fixed edge plates M/a in/s
K natural frequency parameter of simply-supported"K' plate in (m,n)th mode m/s in/$
m number of half waves in plate parallel to longerside
n number of half waves in plate parallel toshorter (curved) side
R radius of curvature of plate m in
t thickness of plate m in
V velocity parameter for plate material÷
or Poisson's ratio of plate material
p density of plate muterial kg/m3 a
Both SI and British units are quoted but any coherent system of units may beused.
4.2 Notes
4.2.1 Plates with simply-supported adges
The natural frequency iL given by
T VKX nmn b 2
In Figure 4.1 v.lues of Kmn are plotted against an/mb for a range of values
of b2 /n 2Rt for initially unstressed, cylindrically curved, rectangular plates ofuniform thickness having all edges simply supported. For plates having all edgessimply supported the modes are exactly defined by the number of half waves acrossth, length and breadth of the panel. These natural frequencies can be presented onone figure since the condition at a nodal line is the same as that at the boundariesparallel to the nodal line.
4.2.2 Plates with fixed edges
The natural frequency is given by
f u VYK b
+ The velocity parameter is defined in SI units by V a (E/p)1/5080 or in British
units by V u (E/p)1/200 000. V is approximately unity for all common structuralmetallic materials.
A density value expressed in British units as pounds per cubic inch has to be
divided by 386.4 before it can be used in the formula for V given here. (A force
of 1 lbf acting on a mass of I lb produces an acceleration of 386.4 in/s 2 .)
-
26
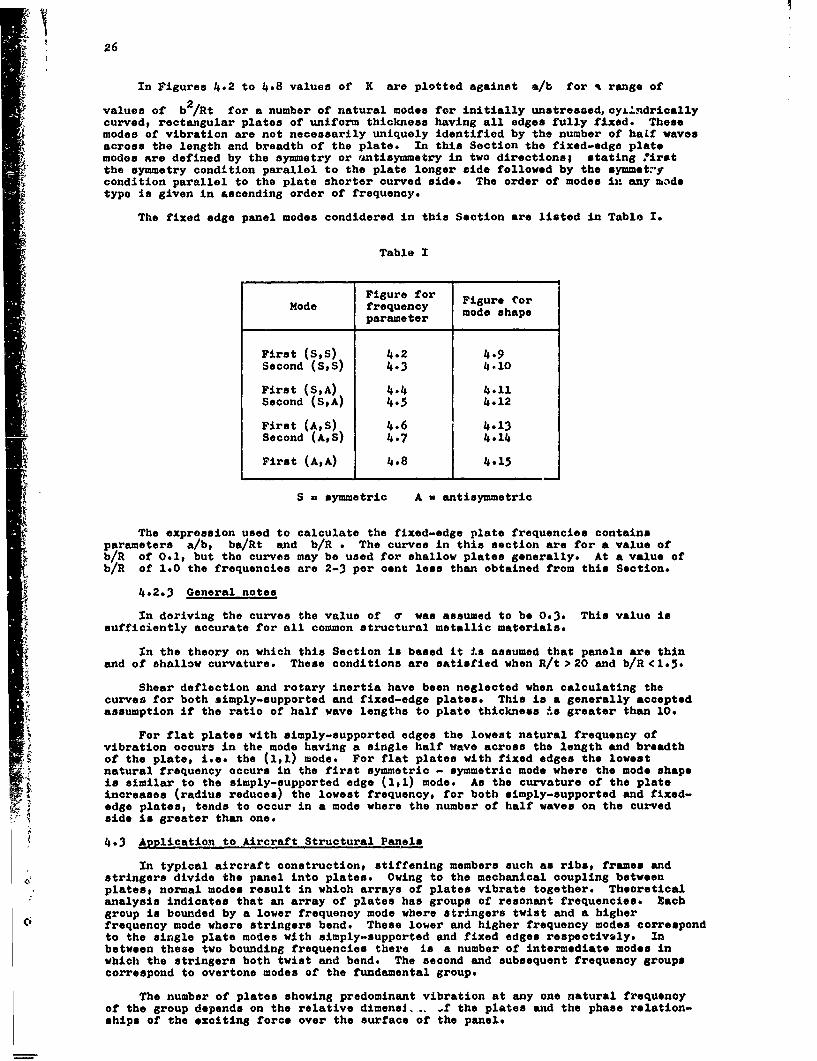
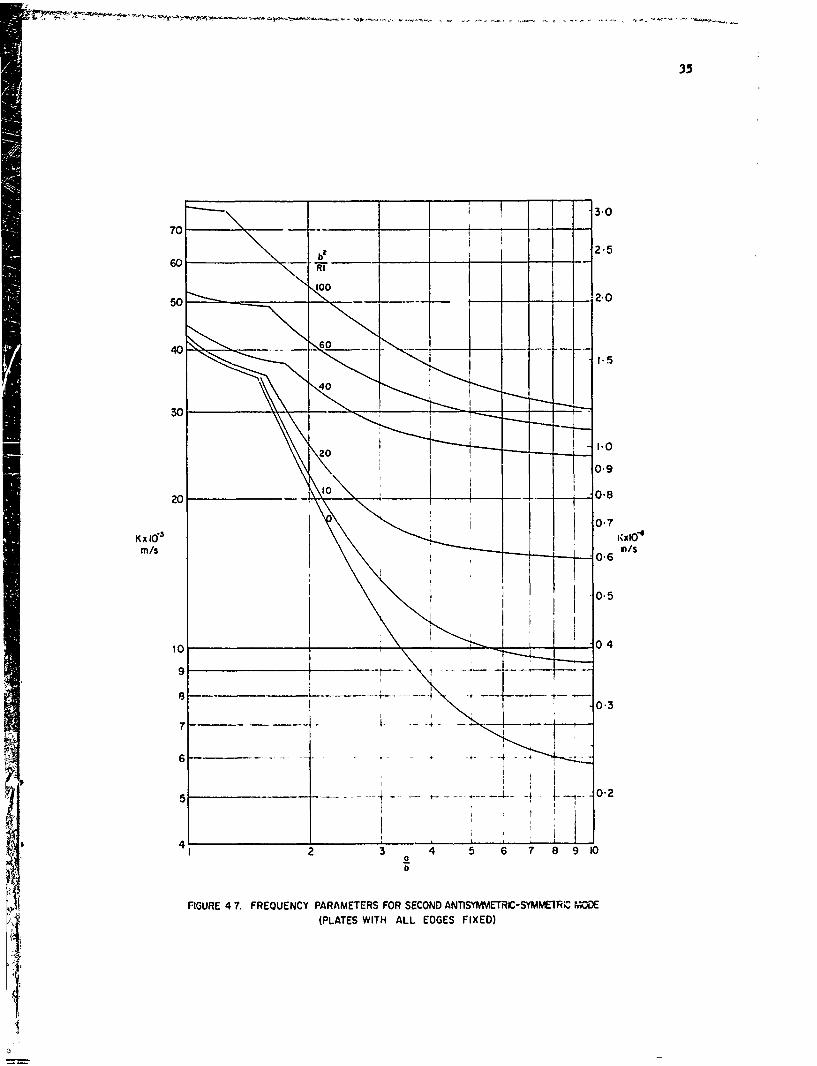
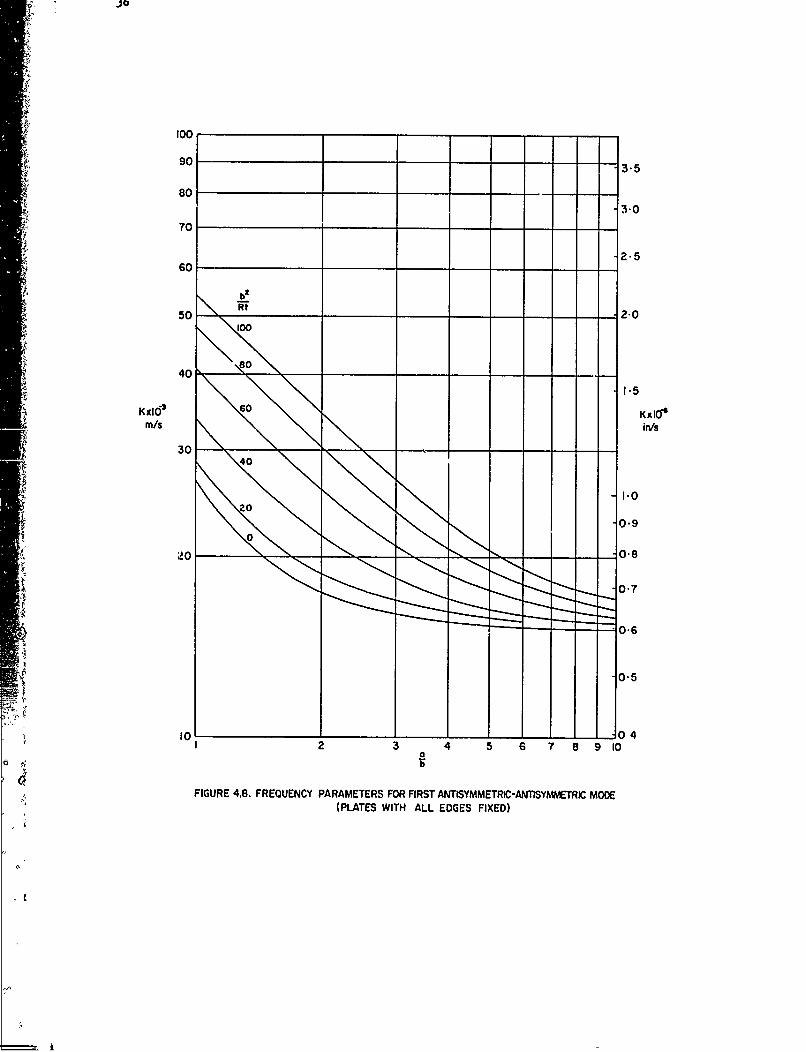
In Figures 4.2 to 4.8 values of K are plotted against a/b for % range of
values of b 2/Rt for a number of natural modes for initially unstressed, cyilndricallycurved, rectangular plates of uniform thickness having all edges fully fixed. Thesemodes of vibration are not necessarily uniquely identified by the number of haLf wavesacross the length and breadth of the plate. In this Section the fixed-edge platemodes are defined by the symmetry or rAntisymmetry in two directions; stating :irstthe symmetry condition parallel to the plate longer aide followed by the symmetrcondition parallel to the plate shorter curved side. The order of modes in any madetype is given in &scending order of frequency.
The fixed edge panel modes condidered in this Section are listed in Table I.
Table I
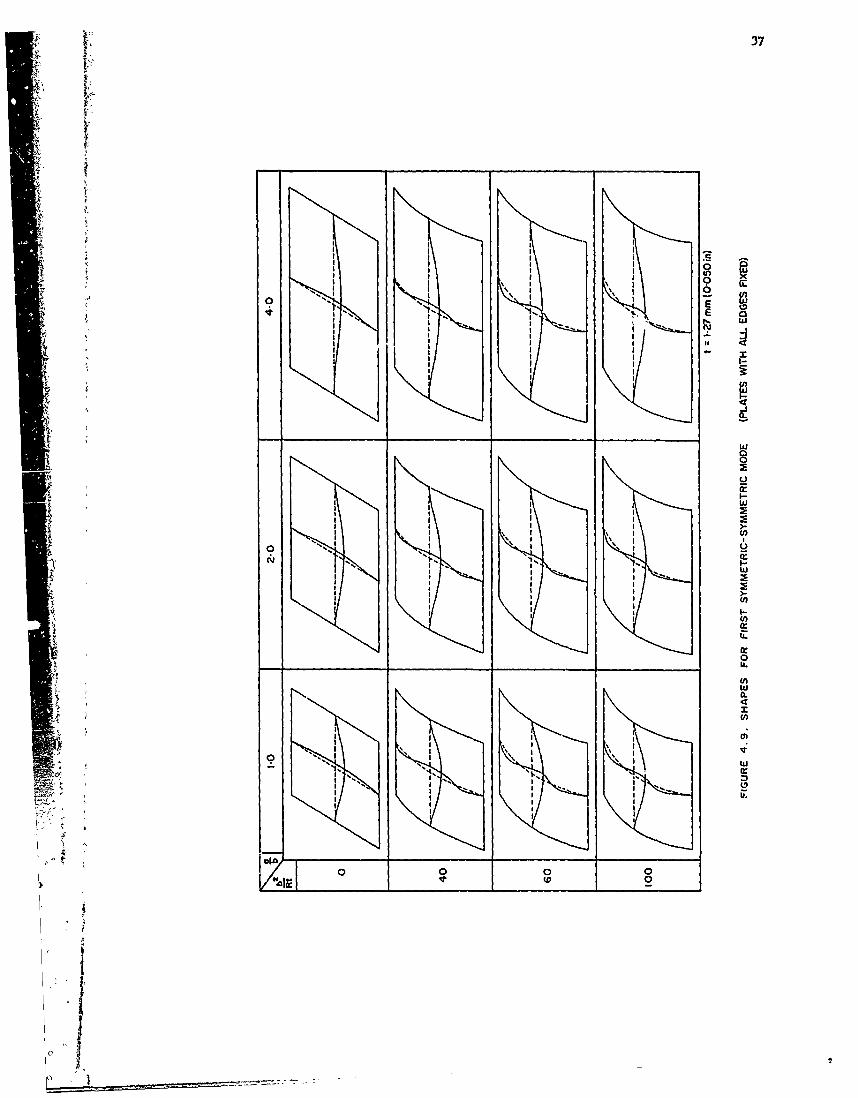
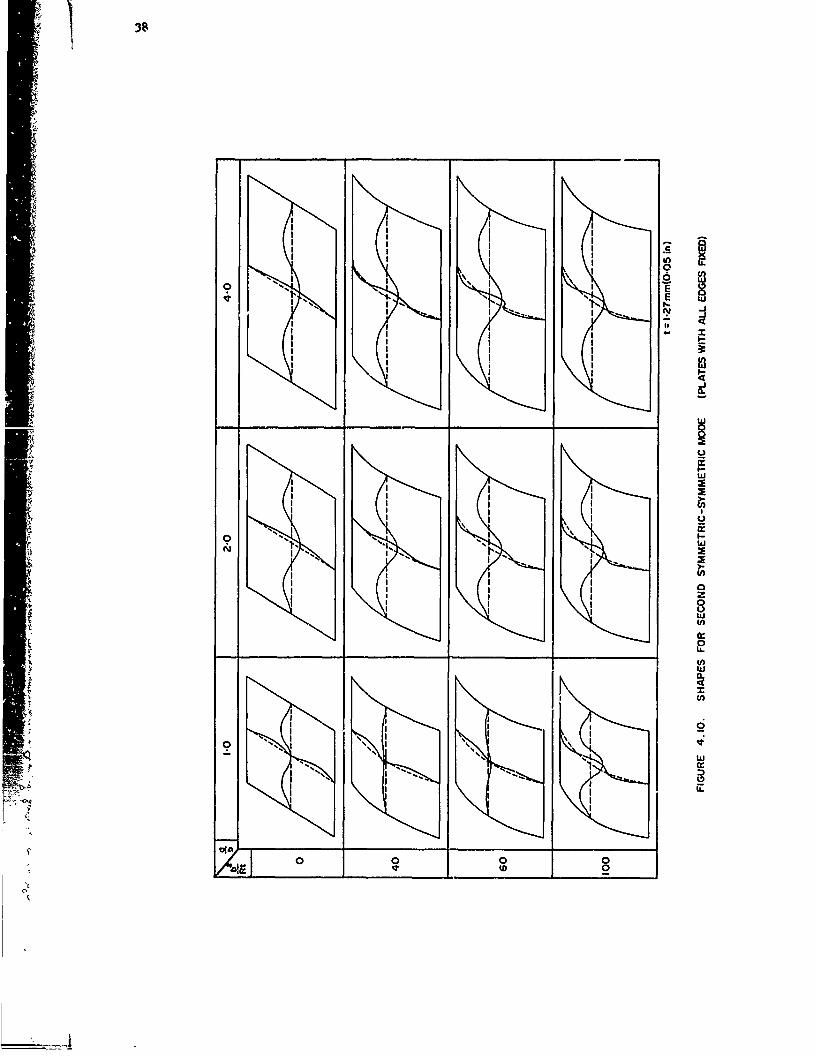
Figure for Figure forMode frequency mode shape
parameter
First (SS) 4.2 4.9Second (SS) 4.3 4.10
First (SA) 4.4 4.11Second (SA) 4.5 4.12
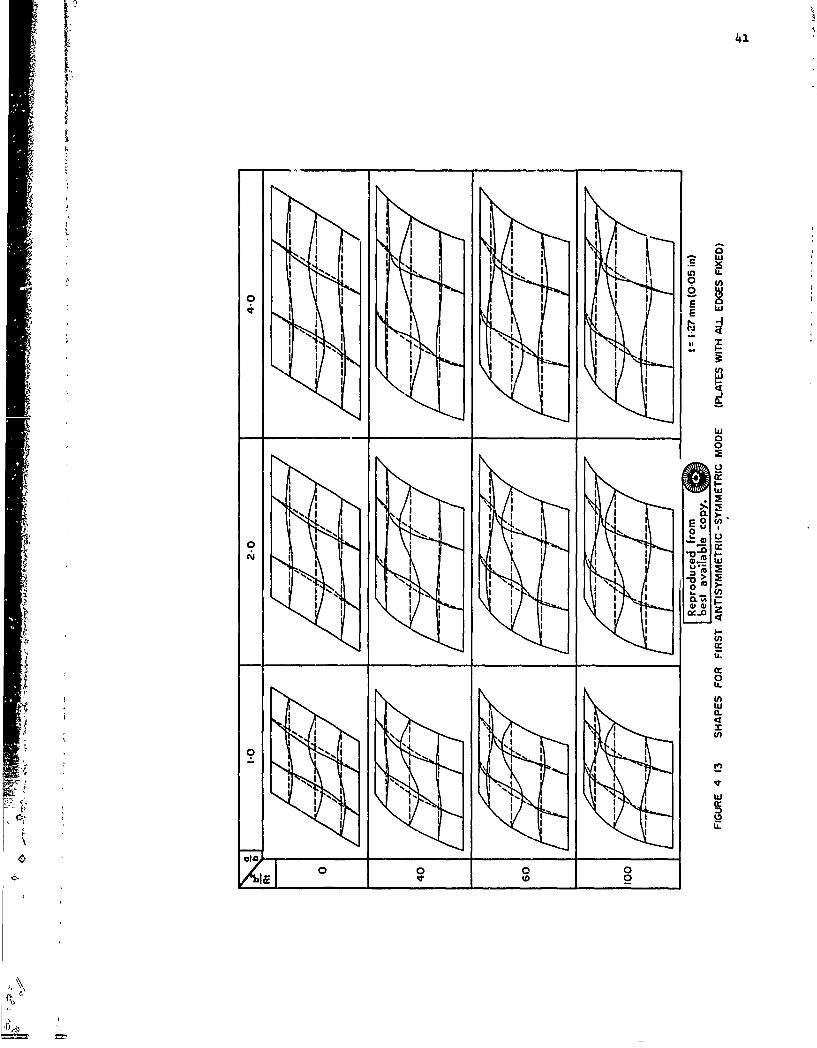
First (A,S) 4.6 4.13- Second (A,S) 4.7 4.14
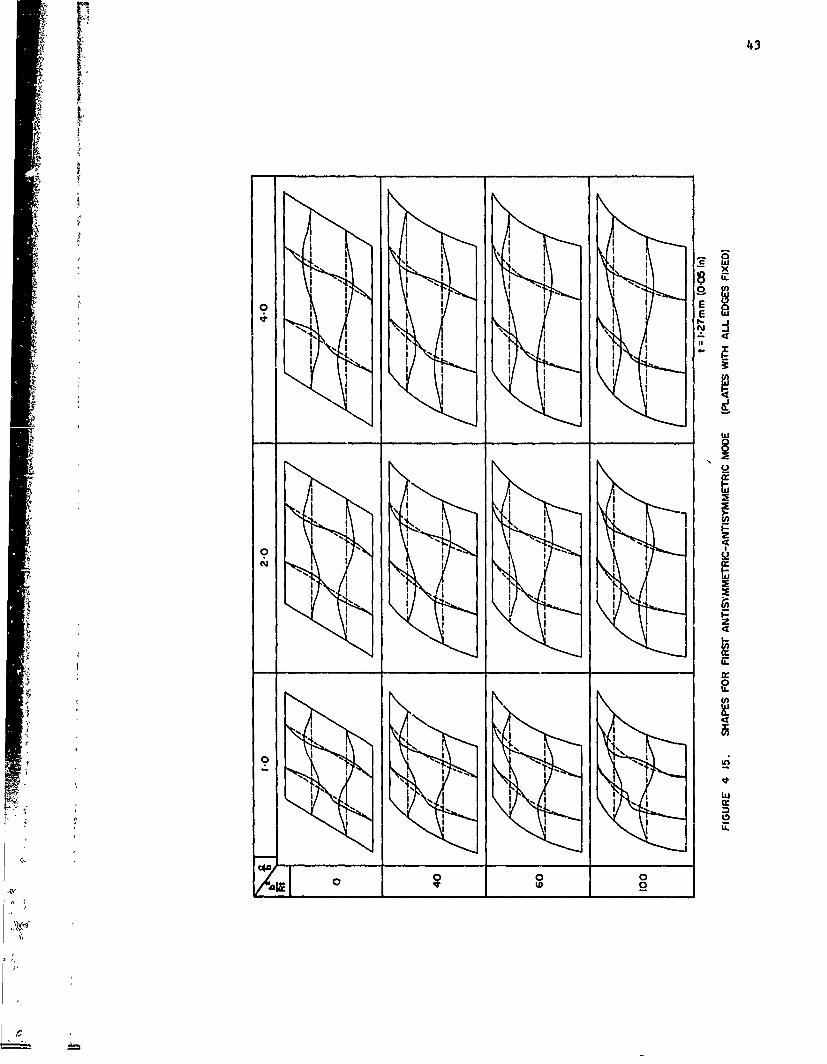
First (A,A) 4.8 4.15
S = symmetric A u antisymmetric
The expression used to calculate the fixed-edge plate frequencies containsparameters a/b, ba/Rt and b/R . The curves in this section are for a value ofb/R of 0.1, but the curves may be used for shallow plates generally. At a value ofb/R of 1.0 the frequencies are 2-3 per cent less than obtained from this Section.
4.2.-3 General notes
In deriving the curves the value of 0 was assumed to be 0.3. This value issufficiently accurate for all common structural metallic materials.
In the theory on which this Section is based it is assumed that panels are thinand of shallow curvature. These conditions are satisfied when R/t >20 and b/R <1.5.
Shear deflection and rotary inertia have been neglected when calculating thecurves for both simply-supported and fixed-edge plates. This is a generally acceptedassumption if the ratio of half wave lengths to plate thickness is greater than 10.
For flat plates with simply-supported edges the lowest natural frequency ofvibration occurs in the mode having a single half wave across the length and breadthof the plate, i.e. the (1,1) mode. For flat plates with fixed edges the lowestnatural frequency occurs in the first symmetric - symmetric mode where the mode shapeis similar to the simply-supported edge (1,1) mode. As the curvature of the plateincreases (radius reduces) the lowest frequency, for both simply-supported and fixed-edge plates, tends to occur in a mode where the number of half waves on the curvedside is greater than one.
4.3 Application to Aircraft Structural Panels
In typical aircraft construction, stiffening members such as ribs, frames and"stringers divide the panel into plates. Owing to the mechanical coupling betweenplates, normal modes result in which arrays of plates vibrate together. Theoreticalanalysis indicates that an array of plates has groups of resonant frequencies. Eachgroup is bounded by a lower frequency mode where stringers twist and a higher
i frequency mode where stringers bend. These lower and higher frequency modes correspondto the single plate modes with simply-supported and fixed edges respectivr~lys Inbetween these two bounding frequencies there is a number of intermediate modes inwhich the stringers both twist and bend. The second and subsequent frequency groupscorrespond to overtone modes of the fundamental group.
The number of plates showing predominant vibration at any one natural frequencyof the group depends on the relative dimens.. f the plates and the phase relation-ships of the exciting force over the surface of the panel.

27
The lowest natural frequency is generally associaited with a mode of vibrationin which the response of plates is such that half waves on the two sides of a stringerare out of phase. If the stringers are of low torsional stiffnesse the frequency forthe panel will be close to the valuo indicated by this Section for a single plate withsimply-supported edges. With increasing torsional stiffness the lowest resonantfrequency cf the group rises to approach the value indicated by this Section for asingle plate with fixed edges.
The highest natural frequency of a panel in a f'roquency group is associated witha mode of vibration in which the half waves in the plates on the two sides of astringer are in phase. This behaviour corresponds to fixed-edge conditions.
4.4 Derivation
4•4.1 Timoshenko, S. Vibration problems in tingineoring. Second edition.Von Nostrand, New York, 1937.
4.4.2 Warburton, G.B. The vibration of rectangular plates.Proc. I.Mech.E., Vol.168, No.12, pp.371-384, 1954.
4.4.3 Clarkson, B.L. The design of structures to resist jot noise fatigue.J. R. aeronaut. Soc., Vol.66, No.622, pp.603-616,October 1962.
44..4 Sewall, J.L. Vibration analysis of cylindrically curved panelswith simply supported or clamped edges and comparisonwith some experiments.NASA tech. Note D-3791, January 1967.
4.4.5 Webster•. J.J. Free vibrations of rectangular curved panels.-nt. J. Mech. Sci., Vol.lO, No.7, pp.571-582, July 1968.
4.4.6 Petytt Ho Vibration of curved plates.J. Sound Vib., Vol.15, No.3, pp.381-395, April 1971.
4.4.7 Webstor, J.J. Discussion of "Approximate methods for the determinationWarburton, G.B. of the natural frbquencies of stiffened and curved
plates".J. Sound Vib., Vol.18, No.1, pp.139-141, September 1971.
4.5 Example
It is required to estimate the lowest natural frequency of an aluminium alloyplate in both the simply-supported and fixed-edge conditions. The plate has thefollowing dimensions and physical properties:
a a 300 mm, b = 200 mm, R = 1000 mm,
0.8 mm, E - 70 000 p = 2770 kg/m3.MHN/in, pu27
Firstly = 0 = 1.52,
b 2 200Sb 2 2002
Rt 1oo x 0.8 50
1
and V • 500 Q99.
4.5.1 All edges simply-supported
Obtain the natural, frequency parameters from Figure 4.1.
2 2 2Mode an b 10 3K n t fu VK n t
mb n2Rt m,n - m,n
(m,n) e(m/) (m-1) (Hz)
1,1 1.5 50 12.9 0.02 255
1,2 3.0 12.5 2.87 0.08 227
2,1 0.75 50 26.7 0.02 529
1,3 4-.5 5.556 2.54 o.18 453
3,1 0.5 50 34.5 0.02 683
28
Hence the lowest natural frequency with all edges simply supported occurs in the (1,2)mode and Is 227 Hz.
4..2 All edaesi fixod
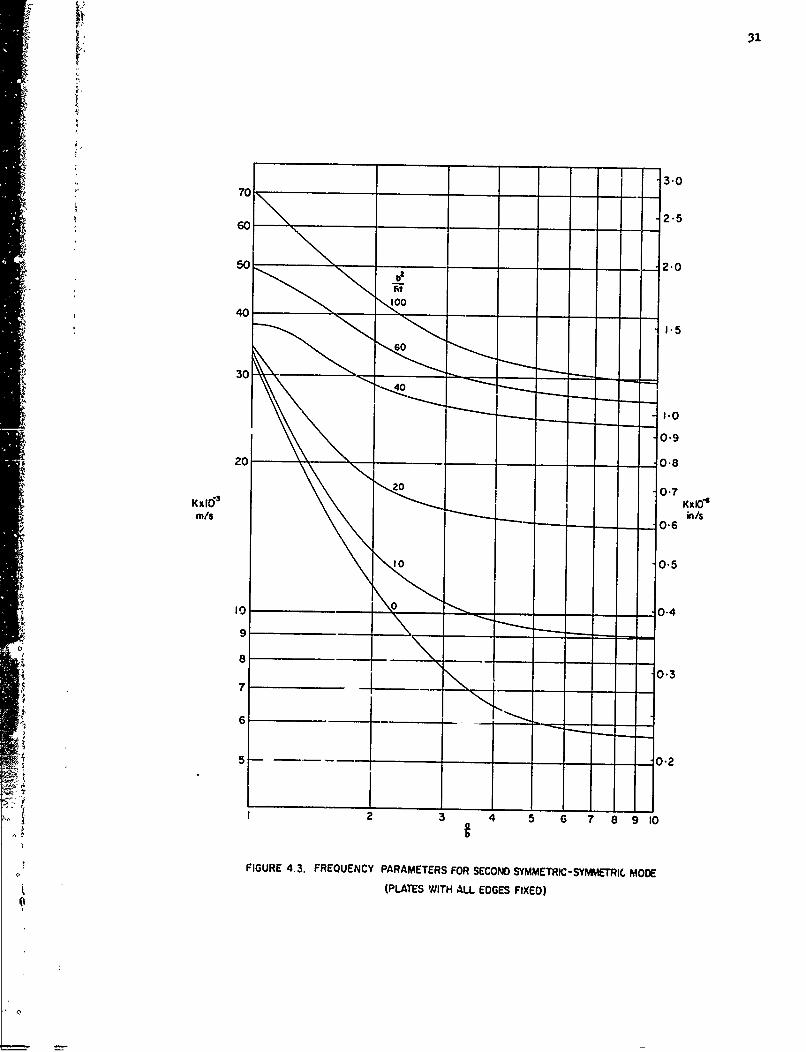
For lowest symmetric-symmetric mode from Figure 4.2
10-3 K a 27.3 m/s •
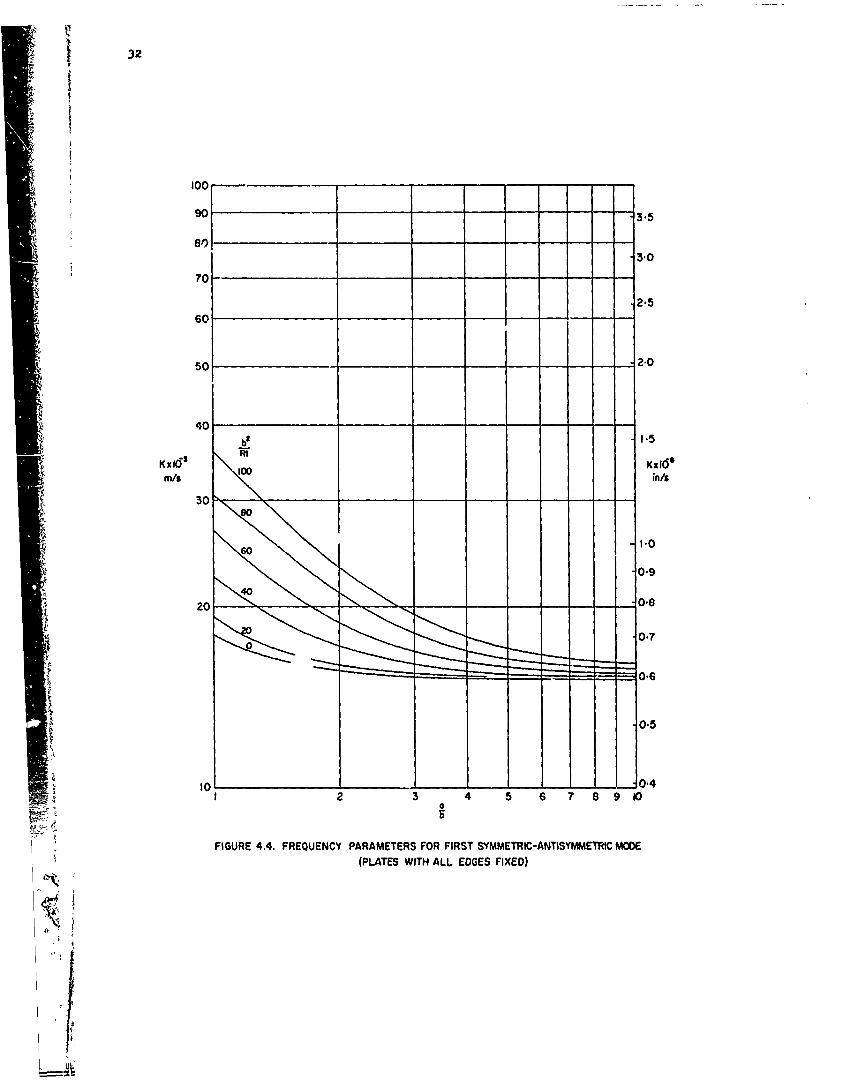
For lowest symmetric-antisymmetric mode from Figure 4.4
10-3 X 20.0 m/s .
For lowest antisymmetric-symmetric mode from Figure 4.6
10-3 K a 31.2 m/s .
For lowest antisymmetric-antisymmetric mode from Figure 4.8
10-3 K 28.0 m/s .
Hence the lowest natural frequency with all edges fixed occurs in the firstsymmetric-antisymmetric mode
and is 0,99 x 20.0 x 103 x 0.8 x 1000 396 Hz.2002
A-
_!
°'

29
i
60 -50 • ' =2
30-#I
20 -0-- - - 0 -8
Kmn x I0"6 3 4
-0-Io \ \ \0.5
0.3 040-5O06 08 1 2 3 4 56 78910
9tnb
FIGURE 4.1. FREQUENCY PARAMETERS FOR PLATES WITH ALL EDGES SIMPLY -SUPPORTED

30
50 - 2.5
5020
401.5
30L _
1.0
0.920 030
0-7K xlOM KxIO/
in/s
0-5
___ _ 0 .0.4
00.3
5 -o 0"2
2 3 4 5 6 7 8 9 10b
FIGURE 4.2. FREQUENCY PARAMETER FOR FIRST SYMMETRIC-SYMMETRIC MODE
(PLATES WITH ALL EDGES FIXED)
" t- 6 70 3 .-
6, 0 -- - -25
.2-5
-=.•50 O2.8
�' IKx0O"
rnsin/s04
"'-.0.97xV .0- 0.3
MI "0- -n
<" FIGURE 4,3. FREQUENCY PARAMETERS FOR SECONO SYMMETRIC-SYMM~ETRIC MODE
S~(PLATES WITH ALL EDGES FIXED)
0-)7
32
100
3.0~~70-..
S~2'5
602
50 - -2.0
401.5
Kxd' R, Kxil'mr/s in/s
30,
2 0 1 ,0,so,
0'5
1I 3 4 5 6 7 891
0
FIGURE 4.4. FREQUENCY PARAMETERS FOR FIRST SYMMETRIC-ANTISYMMETRIC MODE(PLATES WITH ALL EDGES FIXED)
33
100
90 35.
3807C
2.560
50 - -- - 2-0
1.5
Kx 6o' s Kxlom/s in/s
3C
S1.0
0.9
20
I0~~ ~ -7 , .
I 2 3 4 5 6 7 8 9 10b
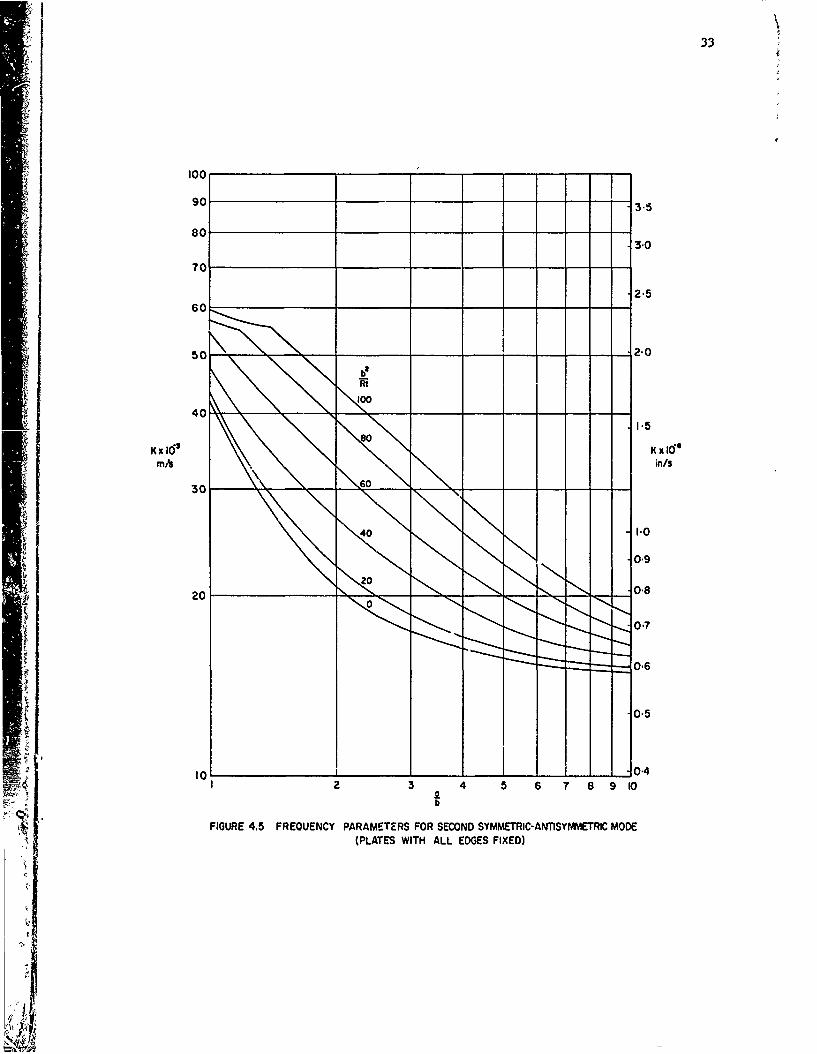
FIGURE 4.5 FREOUENCY PARAMETERS FOR SECOND SYMMETRIC-ANTISYMMETRIC MODE(PLATES WITH ALL EDGES FIXED)

34
7011
600
>0-5
30*
0.9
rn/s i/
00
.03
b
FIGURE 4.6. FREQUENCY PARAMETERS FOR FIRST ANTISYMMETRIC-SYMMETRIC MODE(PLATES WITH ALL EDGES FIXED)
35
TO-
6O \ Rt
50 60• "z~
00
60
1000
-0.9
10 400.8
K x I0"r-• I0
m/s i6/s
0.5
10405 0 "3
aI
FIGURE 4 7. FREQUENCY PARAMETERS FOR SECOND ANTIYMMETRIC-SYMMElR;C 6-OOE4 (PLATES WITH ALL EDGES FIXED)
II
100
90, 3.5
80
70
60 2-5
S50 - 1 1 .12.0
100
1-5
SK XO" KxlO-5rn/s \\in/s
S30
1*09•
1.07
10 - 0 40 2 3 4 5 6 7 8 9 10
FIGURE 4.8. FREQUENCY PARAMETERS FOR FIRST ANTISYMMETRIC-AUTISYMMETRIC MOOE(PLATES WITH ALL EDGES FIXED)
.' C ,
~37
N Ir
S. I w
I Ir
P Inw(L.
Vw
.4' o
AU
(0:
I I
I I
I II-
I I •I
I i I,, •
o• o I
S

39
Ii w0 x
.1 6 u.
I I E
I I~ I Ch
I - _
4 Ir
CL
(r
atelz-

40
"I 'I I
*I--
o I 2 L
I I II S at
I '~I ~ SI I
41* �, E
I I II I II I I 0
I I I I 1 Ii�I I a -� LU
I 4 I i�I I I I ii II-'4 I I I �k.
I I I U)
I i I I w0 I i -�
I I I ELUI I I 2
IN Ii IiiI I
'kI I I�' I I - I.-
I I i - 4.I I I I I
I I I 1 g
4 I I I
4 LU
1' 00
0I-2
I I I i I IiiI II I I
NiI I I CU)'
NI '�* I I
0 "�I I" I� I
I I
I'.i II" II II I I z
U)
________________ _________________ _________________ U.
4 4 0ILU)
LU0.
A I I
' I I I U)
o %I I I* I-. g'�.I - S I
- I I'I
I �I p.5 I
S IX LU
� '1' -� F- 1 '�I I I I
U-
aI�0 0 0�iJIII___ii. w 0
4 I

42N
I I
I I I I Sw
S
I I I- II I I I -�g �N5 I I I i
Is
I I 4
I - -I-. I -I
S
-.5
(1).5
I.5
*1.Is
S I I
I I I
-- I I -
I 0.-J
't� I-w(ft
S. .'15.
5..
I-s. S I
Is'S N
I"�
'4.N
- \ S I ISt
� "
'
NS S
N I S
1'
'5 5 'S"I '�
5. I"N
Is I
421:10
U)C.)
q
IjJ0IL.
w
(ftI I a.SI I I
U)z4
- I
Its 1,*I I
I I I.5- I -.ii
I I II
I
I
I -�Ih o 0CO
ci� I
I i,\ ,Ia
a0~
I I
al a I
I a2 .N -
'I o i
, o
2 I 44
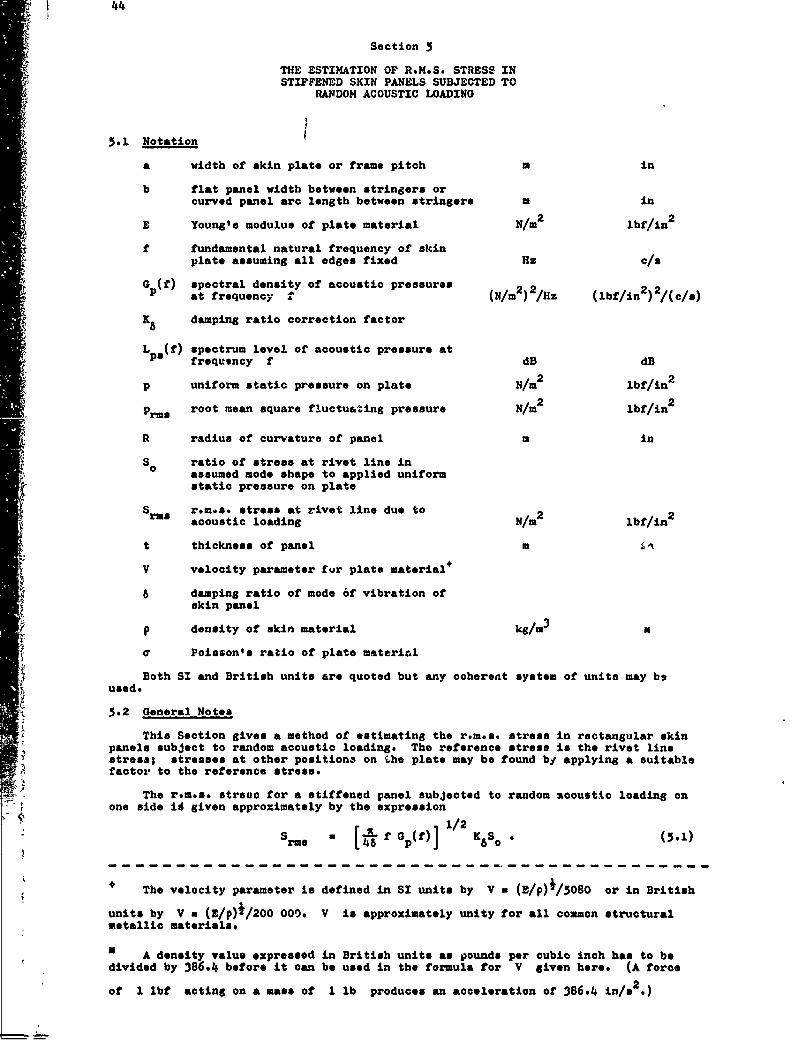
Section 5
THE ESTIMATION OF RoMeS. STRESS INSTIFFENED SKIN PANELS SUBJECTED TO
RANDOM ACOUSTIC LOADING
5.1 Notation
a width of skin plate or frame pitch m in
Sb flat panel width between stringers or* curved panel arc length between stringers m in
E Young's modulus of plate material N/M 2 lbf/in 2
f fundamental natural frequency of skinplate assuming all edges fixed Hz c/s
G ( spectral density of acoustic pressures 2 2 2 2at frequency f (N/r2)2/Hz (lbf/in ) /(c/s)
K damping ratio correction factor
SL (t) spectrum level of acoustic pressure atfrequency f dB dB
p uniform static pressure on plate N/m 2 lbf/in 2
p rms root mean square fluctuating pressure N/mr2 lbf/in 2
R radius of curvature of panel m in
-- 0S ratio of stress at rivet line inassumed mode shape to applied uniformstatic pressure on plate
S rum.s, stress at rivet line due to 2acoustic loading N/mr lbf/in 2
St thickness of panel m i
V velocity parameter for plate material+
S6 damping ratio of mode of vibration ofskin panel
p density of skin material kg/=' a
or Poisson's ratio of plate materinl
Both SI and British units are quoted but any coherent system of units may bsused.
5.2 General Notes
This Section gives a method of estimating the r.m.s. stress in rectangular skinpanels subject to random acoustic loading. The reference stress is the rivet linestress; stresses at other position3 on .he plate may be found by applying a suitablefactor to the reference stress.
The r.m.s. streas for a stiffened panel subjected to random acoustic loading onone side id given approximately by the expression
S W 1/25rs •~ ~~ ) K6 so • (5.1)
The velocity parameter is defined in SI units by V a (3/p)*/5080 or in British
units by V u (3/p)1/200 00'. V is approximately unity for all common structuralmetallic materials.
IN A density value expressed in British units as pounds per cubic inch has to be
divided by 386.-4 before it can be used in the formula for V given here. (A force
2of I lbf acting on a mass of 1 lb produces an acceleration of 386.4 in/s .

45
In the case of a control surface or similar structure where two skins are
coupled by ribs and both vibrate in reaponse to a loadirnC largely on one side, thestress level is about 1/3 of the value given by Equation (5.1). However, where theacoustic loading is of similar intensity on both sides of a box structure the stresslevel is about 1/2 of the value given by Equation (5.1).
In deriving Equation (5.1) it has been assumed that the predominant form of akinvibration is one in which individual plates within the stiffened panel vibrateindependently in the assumed mode which, for this calculation, has been taken to bethe fundamental fixed-edge mode. Thio restricts the use of this Section to skin-stringer panels where the bending stiffness of the stringers is sufficiently high toapproximate to a fixed-edge condition for individual plates. It is not applicable tostiffened panels where individual plates are much stiffer and th* supporting stiffenersrelatively more flexible than for conventional skin-stringer panels.
The pressure is assumed to be uniform and in phase over the whole of eachindividual plate and the spectrum level of the acoustic pressure is taken to beconstant over the range of frequencies close to the fundamental natural frequency ofthe panel.
The r.m.s. stresses given are the nominal unfactored rivet line values and inusing these stresses to calculate a fatigue life care must be taken to ensure dueaccount is taken of any geometric stress concentrations in the region of the rivetline.
This Section may be used for etched skins, or s!'.ns with bonded reinforcing, byfirst obtaining the nominal rivet line rom.s. stress for the panel, assuming it to beof uniform thickness, and then applying a correction with the aid of Reference 5.6fl4o
For conventional structures without special damping treatment, f may be takenas the undamped natural frequency.
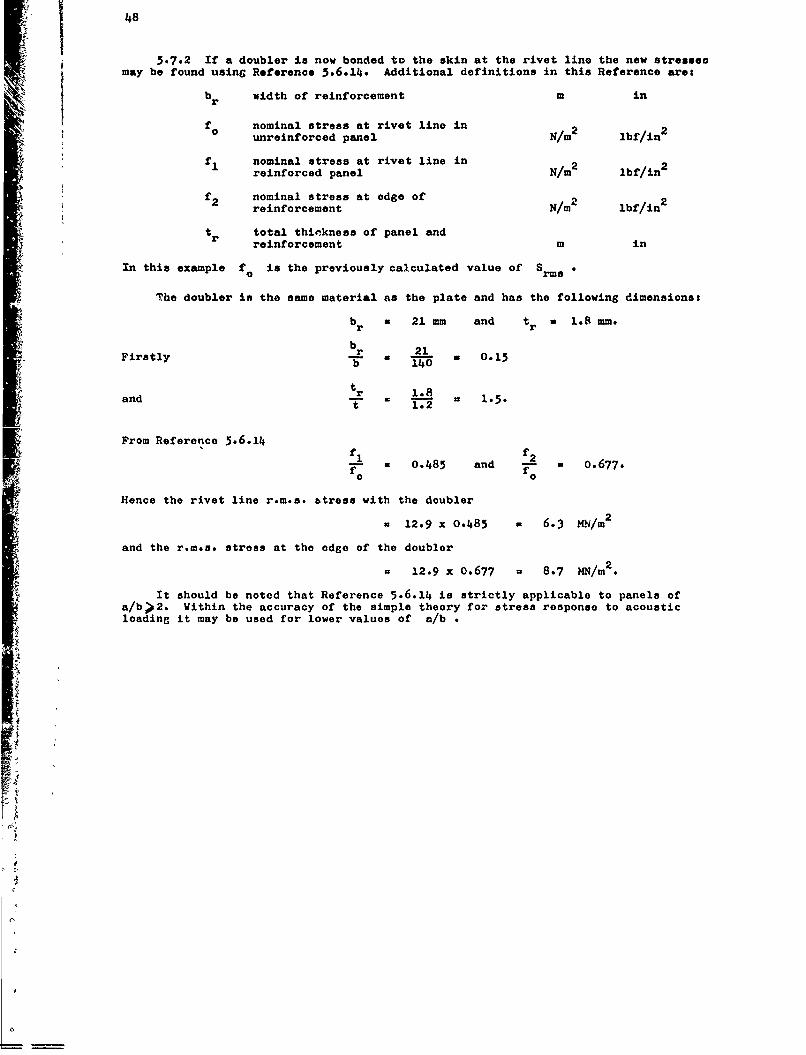
5.3 Notes on the Figure-
Figures 5.1 and 5.2 give nomographs for Srmo * The nomograph are entered at a
value of Lpa(f), each quadrant being used in turn in the direction indicated through
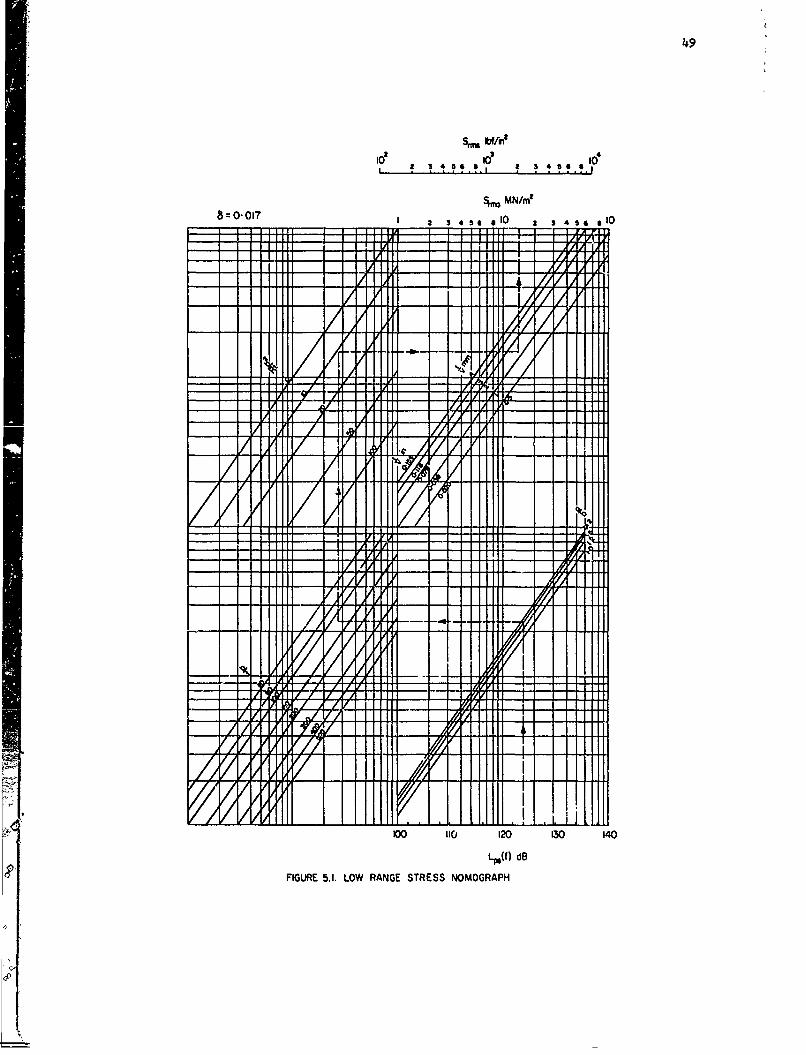
ranges of a/b, b/t, b 2/Rt and t/V. Figure 5.2 is aa extension of the stressrange of Figure 5.1. Figures 5.1 and 5.2 are drawn for a value of 6 - 0.017 ; Srms
for other values of 6 is calculated using correction factor K6 which is plotted
against 8 in Figure 5.3
The r.m.a. stress given is the skin surface stress across the rivet line at themid position of the longer side of the pla.e. This is the position of highestnominal stress when the plates vibrate in their fundamental fixed-edge mode. Noallowance is made for stress concentration factor due to rivet holes etc.; his isexpected to be negligible at distances greater than 2.5 times the rivet di'.eter fromthe centre line of the rivet along the rivet line.
In the derivation of the nomographe it is assumed that the plate bending stress
is within the linear region whore it is directly proportional to the normal pressure,
that is p/E less than about 20(t/b) 4 .
The higher range of Figure 5.2 is for use in estimating stresses in titanium andhigh strength steel panels. However, high values of stresses obtained from thisFigure should be treated with caution as no extensive measured data are at presentavailable to check the validity of the simple response theory over the higher stressrange.
45. Calculation Procedure
5.4.1 The procedure for estimzting Srms in a general case is as follows.
(i) Estimate the fundamental natural frequency of the panel. For flat platesuse Reference 5.6.13 or Section 4 of this AGARDograph, or evaluate thehighest frequency of the first group of natural frequencies usingSection 3 of this AGARDograph. For curved plates calculate the naturalfrequency using Section 4 of this AGARDograph.
(ii) Obtain the value of spectrum level of acoustic pressure L (f) at thePs
calculated frequency. If only the band pressure level is known, it isfirst corrected to pressure spectrum level (unit bandwidth) usingReference 5.6.11. The reference pressure for sound pressure level is
220pzN/m
46
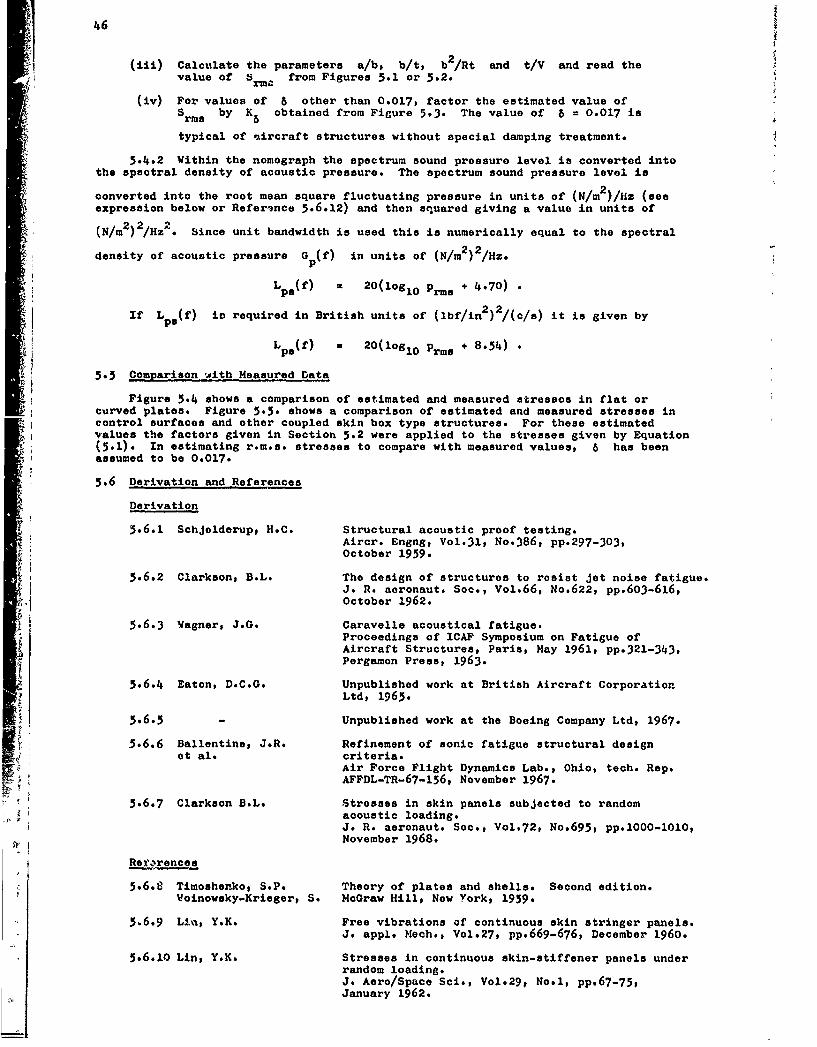
2(iii) Calculate the parameters a/b, b/t, b /Rt and t/V and read thevalue of Srm from Figures 5.1 or 5.2.
(iv) For values of 6 other than 0.017, factor the estimated value ofS by K obtained from Figure 5.3. The value of 6 = 0.017 is
typical of %ircraft structures without special damping treatment.
5.4.2 Within the nomograph the spectrum sound pressure level is converted intothe spectral density of acoustic pressure. The spectrum sound pressure level is
converted into the root mean square fluctuating pressure in units of (N/mr2)/Hz (see* expression below or Referince 5.6.12) and then squared giving a value in units of
(NI/) /Hz2. Since unit bandwidth is used this is numerically equal to the spectral
density of acoustic pressure G (f) in units of (N/m 2 ) 2 /Hz.
"* I If Lps(f) iv required in British units of (lbf/in2 )2 /(c/s) it is given by
L(f) L 20(10810 Prms + 8.54)
5.5 Comparison with Measured Data
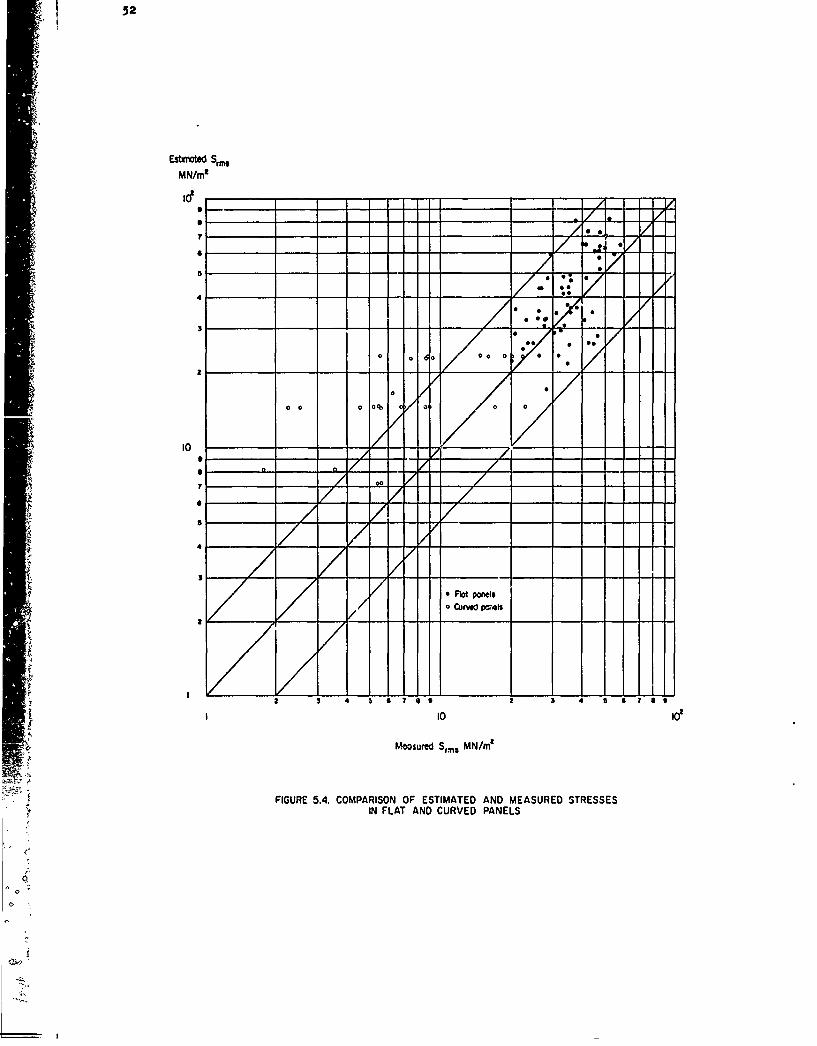
Figure 5.4 shows a comparison of estimated and measured stresses in flat orcurved plates. Figure 5.5. shows a comparison of estimated and measured stresses incontrol surfaces and other coupled skin box type structures. For these estimatedvalues the factors given in Section 5.2 were applied to the stresses given by Equation(5.1). In estimating r.m.s. stresses to compare with measured values, 6 has beenassumed to be 0.017.
5.6 Derivation and References
Derivation
3.6.1 Schjelderup, H.C. Structural acoustic proof testing.Aircr. Engng, Vol.31, No.386, pp.297-303,October 1959.
5.6.2 Clarkson, B.L. The design of structures to rosist jet noise fatigue.J. R. aeronaut. Soc., Vol.66, No.622, pp. 6 03- 6 16,October 1962.
5.6.3 Vagner, J.G. Caravelle acoustical fatigue.Proceedings of ICA" Symposium on Fatigue ofAircraft Structures, Paris, May 1961, pp.321-343,Pergamon Press, 1963.
5.6.-4 Eaton, D.C.G. Unpublished work at British Aircraft CorporationLtd, 1965.
5.6.5 - Unpublished work at the Boeing Company Ltd, 1967.
5.6.6 Ballentine, J.R. Refinement of sonic fatigue structural designet al. criteria.
Air Force Flight Dynamics Lab., Ohio, tech. Rep.AFFDL-TR-67-156, November 1967.
5.6.7 Clarkson B.L. Stresses in skin panels subjected to randomacoustic loading.J. R. aeronaut. Soc., Vol.72, No.695, pp.lO00-1010,November 1968.
Refrences
5.6.8 Timoshenko, S.P. Theory of plates and shells. Second edition.Woinowsky-Krieger, S. McGraw Hill, New York, 1959.
5.6.9 Lin, Y.K. Free vibrations of continuous skin stringer panels.J. appl. Mech., Vol.27, pp. 6 69- 6 76 , December 1960.
5.6.10 Lin, Y.K. Stresses in continuous skin-stiffener panels underrandom loading.J. Aero/Space Sci., Vol.29, No.1, pp. 6 7-75,January 1962.
47
5.6.11 Bandwidth correction.Engineering Sciences Data Item No. 66016,February 1966.
5.6.12 The relation between sound pressure leveland r.m.s. fluctuating pressure.Engineering Sciences Data Item No. 66018,February 1966.
5.6.13 Natural frequencies of uniform flat plates.Engineering Sciences Data Item No. 66019,February 1966.
5.6.14 The effect of edgo reinforcement on the stressesin skin panels undoir uniform pressure.Engineering Sciences Data Item 11o. 67029,May 1967.
5.7 Exanles
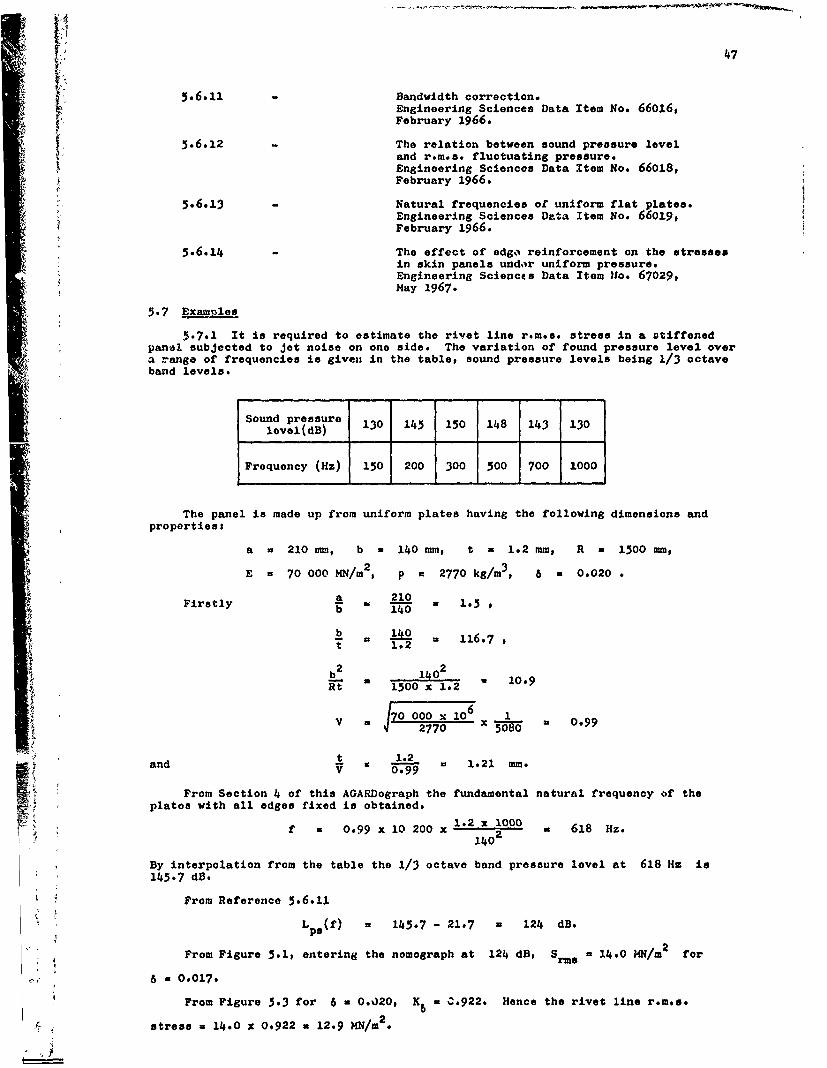
5.7.1 It is required to estimate the rivet line r.m.s. stress in a otiffenedpanel subjected to jet noise on one side. The variation of found pressure level overa range of frequencies is given in the table, sound pressure levels being 1/3 octaveband levels.
Sound pressurelovel(dB) 130 145 150 148 143 130
Frequency (Hz) 150 200 300 500 700 1000
pThe panel is made up from uniform plates having the following dimensions andpropertiest
a - 210 mm, b 140 mm, t a 1.2 mm, R n 1500 mm,
E - 70 000 MN/m 2 , p 2770 kg/mr, 8 = 0.020
Firstly a 210 1-5b • *-- 1.
b 140 = 116.7= 1.2
b 2 1402 .Rt 1500 x 1.2 U 10.9
• 0 000 106 1V 2770 5 080 0.99
andt 1.2 1.21 mm.
From Section 4 of this AGARDograph the fundamental natural frequency of theplates with all edges fixed is obtained.
1.2 x 1000f x 0.99 x 10 200 x 2 618 Hz.
By interpolation from the table the 1/3 octave band pressure level at 618 Hz is145.7 dB.
From Reference 5.6.11
Lps(f) = 145.7 - 21.7 - 124 dB.
2From Figure 5.1, entering the nomograph at 124 dB, S -a 14.0 MN/Mr for6 * 0.017.
From Figure 5.3 for 6 = 0.020, K6 u C.922. Hence the rivet line r.m.s.
S* stress = 14-0 x 0.922 = 12.9 MN/m.
j 48
5.7.2 If a doubler is now bonded to the skin at the rivet line the now stressesmay be found usinG Reference 5.6.14. Additional definitions in this Reference are:
br width of reinforcement m in
f nominal stress at rivet line in0 unreinforced panel N/rm2 lbf/in 2
f nominal stress at rivet line in1 reinforced panel N/M2 lbf/in2
f2 nominal stress at edge ofreinforcement N/rm2 lbf/in 2
tr total thiekness of panel andr reinforcement m in
In this example fa is the previously calculated value of Srms
The doubler in the same material as the plate and has the following dimensions:
b u 21 mm and t r 1.8 mm.
bb 21Firstly r - 21 0.15b W
tr 1.8and t 1.25
From Reference 5.6.14f 1 0.485 and L2 0.677.
0 0
Hence the rivet line r.m.s. &tress with the doubler
U 12.9 x 0.485 - 6.3 MN/mr2
and the r.m.s. stress at the edge of the doubler
- 12.9 x 0.677 8.7 MN/m2
-E It should be noted that Reference 5.6.14 is strictly applicable to panels ofa/b>2. Within the accuracy of the simple theory for stress response to acousticloadinB it may be used for lower values of n/b
C,
49
Sm. bAfin*
S. MN/rn'8=0-017 1 2 3 .&010 2 3 4854 810
I I 00 II 110 12 13 10I I( LAI
FIGURE 5.3. LOW ANG SI ES IOOR
(X1

50
SM 1/mz
8=0.17 1 2 4 5 lie 2 3 4 56 81
A
A~~ If01
120 13 1401 // 0 P6
II JA, ) 1 1d1 1
FIIR 5.2 HIG RAG SRSSN 1O
F.Y
51
3"0
25
1.0
05-
o"
00.01 0.02 0.03 0.04 0.05
FIGURE 5.3 DAMPING RATIO CORRECTION FACTOR
r;'•5.3
52
Estmoated Sl,=MN/mn
Mw'"
/I77 1.
100
4 ~5 -
1 e0 M*oo SS * Se
0 0 0DIN o L, AND CRE -
V /
S -/ /
4 - -/ // --- --
2t 3 4 3 6 76 2 i 3 4 5 67 T S
•£• Meosured Srm, MN/rnz
FIUE54 OPRSNO SIAE N ESRDSRSE
INFATAD-UVE ANL

53
Erfimalted SmMN/rn'
30'
2 I
7e f
ST
4 - --
3 - --
3 -- - - -
2 -- 0
2 9 a 3 4 6476 o10Io
Mwue , Nm
FIUE55SOPRSNO SIAE N ESRDSRSE
I IfIN AILPANE 4NDCONROISURACE