ACN 008 778 925 ANNUAL REPORT 2020 - CTI Logistics
63
CTI Logistics Limited ACN 008 778 925 ANNUAL REPORT 2020
Transcript of ACN 008 778 925 ANNUAL REPORT 2020 - CTI Logistics
CTI Logistics Limited ACN 008 778 925
ANNUAL REPORT 2020

Contents
1 Directory
2 Chairman’s Statement
3-8 Directors’ Report
9 Lead Auditor’s Independence Declaration
10
Consolidated Statement of Profit or Loss and other
Comprehensive Income
11 Consolidated Statement of Financial Position
12 Consolidated Statement of Changes in Equity
13 Consolidated Statement of Cash Flows
14-50 Notes to the Financial Statements
51 Directors’ Declaration
52-56 Independent Auditor’s Report
57-60 Corporate Governance Statement
61 Shareholder Information

Page 1
Directory DIRECTORS
David Robert Watson
(Executive Chairman)
David Anderson Mellor
(Executive)
Bruce Edmond Saxild
(Executive)
Peter James Leonhardt
(Non-Executive)
SECRETARY
Owen Roy Venter
AUDITORS
KPMG
235 St. Georges Terrace
Perth WA 6000
Telephone (08) 9263 7171
SHARE REGISTRY
Computershare Investor Services Pty Ltd
Level 11, 172 St. Georges Terrace
Perth WA 6000
Telephone (08) 9323 2000
REGISTERED OFFICE AND PRINCIPAL PLACE OF BUSINESS
1 Drummond Place
West Perth WA 6005
Telephone (08) 9422 1100
Facsimile (08) 9227 8000
E-mail [email protected]
Web www.ctilogistics.com
The financial report covers the Group consisting of CTI Logistics Limited and its subsidiaries.
The financial report is presented in Australian dollars.
The financial report was authorised for issue by the directors on 31 August 2020.
CTI Logistics Limited is a company limited by shares, incorporated and domiciled in Australia.
Page 2
Chairman’s Statement
In a year impacted by the effects of floods, bushfires and the COVID 19 pandemic, revenue from operations to 30 June 2020 was up 1.5% to $215.2m. EBITDA for
the year was down 7.9% to $14.0m and cashflow remained strong. However the Company declared an after tax loss of $4.3m after taking into account the $0.6m
impact of the new AASB 16 Leases and a non-cash impairment of $5.8m on the value of our undeveloped land at our Hazelmere site.
Going forward, we face the unknowns of the ongoing pandemic, and the effects of government responses over time. However we’re all in this together and success
will in part be determined by how well we at CTI manage our way through the challenges as they arise. The expansion of our group in recent years has resulted in
six well-defined complementary businesses, each of which can stand alone and react to the current challenges in a way that is most appropriate to the individual
circumstances of each business.
• Our Perth metropolitan transport business comprises couriers, parcel B2B and B2C deliveries, and taxi trucks. These businesses had been in some decline following the end of the mining boom, but the pandemic-driven increase in e-commerce has presented growth opportunities.
• Regional Freight is now the consolidated aggregation of several acquisitions, and covers the whole of regional Western Austra lia with regular scheduled services throughout the entire state.
• Interstate Freight now offers a road and rail network between mainland capitals, with local pick-up and delivery fleets in all cities and on-forwarding capabilities.
• GMK Logistics offers national storage and distribution of carpet and other flooring products, including cutting and preparation for individual jobs throughout all states.
• National 3PL Warehousing is offered in Brisbane, Sydney, Melbourne, Adelaide and Perth. In Perth we own the warehouse at our partially developed Hazelmere site, and lease properties at Bibra Lake, Spearwood, and Bassendean. We are assessing the expansion of the warehousing and transport footprint at Hazelmere, on land already owned, to reduce our leased footprint as the leases expire. In Perth we also operate a records management and recycling destruction business.
• Security and its related services are not logistics-related, but have been within the group for many years. Located in Perth but with national affiliations, the business operates an A1 graded monitored alarm control room and has recently developed lone worker protection devices, with obvious applications within the transport industry.
As directors we can see profitable growth and opportunity in all of the above, and will be working hard to realise that growth, aided by the CTI team, including
management, staff and sub-contractors, whose enthusiasm and commitment is acknowledged and appreciated.
David Watson
EXECUTIVE CHAIRMAN

Directors’ Report
Page 3
YOUR DIRECTORS PRESENT THEIR REPORT ON THE GROUP CONSISTING OF CTI LOGISTICS LIMITED AND THE ENTITIES IT CONTROLLED AT THE END
OF, OR DURING, THE YEAR ENDED 30 JUNE 2020.
Directors
Directors of the Company who were in office during the financial year and up to the date of this report are:
David Robert Watson (Executive Chairman)
Mr Watson is the founder, executive chairman and chief executive officer of the Group. Mr Watson is a member of the remuneration committee. Mr Watson
has not held any other directorships in listed companies over the past 4 years.
David Anderson Mellor (Executive Director)
Mr Mellor is a Chartered Accountant who has been with the Group since 1978. He is responsible for the Group’s finances and accounts. Mr Mellor has not held
any other directorships in listed companies over the past 4 years.
Bruce Edmond Saxild (Executive Director)
Mr Saxild has been with the Group since 1977. He is responsible for the Group’s logistics and transport operations. He is a member of the audit and risk
committee. Mr Saxild has not held any other directorships in listed companies over the past 4 years.
Peter James Leonhardt (Non-Executive Director)
Mr Leonhardt is a non-executive director of CTI Logistics Limited and has been with the Group since 1999. During the past 4 years Mr Leonhardt has served as
Chairman of Carnarvon Petroleum Limited. Mr Leonhardt is a former managing partner of Coopers & Lybrand (now PricewaterhouseCoopers). Mr Leonhardt is the
chairman of the audit and risk committee and the remuneration committee.
Principal activities of the Group
The principal activities of the Group during the year were the provision of logistics and transport services, rental of property, specialised flooring logistics and
provision of security services.
Dividends
Dividends paid or declared by the Company to members since the end of the previous financial year were:
Declared and
paid during the
year
Final 2019 Ordinary
Cents per
share
nil
Total amount Franked
nil
Date of payment
n/a
Interim 2020 Ordinary
nil
nil
n/a
No final dividend has been declared after balance sheet date.
Review of operations and results
The Group is a Western Australian based transport and logistics provider. Transport operations cover couriers and taxi trucks , B2B and B2C parcel distribution,
container handling, fleet management, WA regional road freight and interstate freight. Logistics includes 3PL, 4PL, supply chain and DC warehousing, E-commerce
fulfilment, temperature-controlled warehousing, minerals and energy supply base services, quarantine and preservation wrapping and fumigation, document storage,
media destruction and recycling. The Group also has a security business providing installation, maintenance and monitoring of alarms, CCTV visual verification and
lone worker protection.
During the year the Company has invested in growing our national freight operations in Melbourne, Sydney and Brisbane, including the relocation of two transport
depots in Perth and Melbourne, as well as continued investment in information technology at GMK (specialised flooring logistics) and warehousing divisions to
enhance our operating systems and performance as well as a cyber security investment in ongoing managed services to protect our IT systems network.
For the year ended 30 June 2020 revenue from operations was up 1.5% to $215,209,363.
The 30 June 2020 loss for the year and balance sheet is not directly comparable to the prior year as a result of the Group implementing the requirements of
AASB 16 Leases at 1 July 2019, as well as a non-cash impairment on the vacant land at Hazelmere. A valuation of the three vacant blocks of land at Hazelmere
was performed at 30 June 2020 and an impairment of $5,771,500 has been recognised to write these blocks down to their fair value less the cost to dispose.

Directors’ Report
Page 4
The Group’s long-term intentions in relation to the development of these blocks has remained unchanged, however their carrying value could not be supported
in the current economic climate.
The following key financial data is provided to show comparability to the prior period excluding the impacts of the above.
30 June 2020 30 June 2019 Movement
Statement of profit or loss and
other comprehensive income
Excluding AASB
16 and
Impairment
$000
Impact of
AASB 16
$000
Impairment
charges
$000
As reported
$000
Excluding
contingent
consideration
$000
Excluding
adjustments
Revenue from operations 215,209 - - 215,209 212,031
Other income 892 636 - 1,528 946
Impairment - - (5,772) (5,772) -
Motor vehicle and transport costs
(27,682)
918
-
(26,764)
(27,193)
Property costs (16,109) 13,245 - (2,864) (17,189)
Other costs** (158,303) - - (158,303) (153,384)*
Results from operating activities
excluding interest, depreciation
and amortisation (“EBITDA”)
14,007
14,799
(5,772)
23,034
15,211*
(7.9%)
Depreciation and amortisation
(9,831)
(11,986)
-
(21,818)
(9,033)
Net finance costs (1,704) (3,393) - (5,097) (2,044)
Profit (loss) before tax 2,472 (580) (5,772) (3,881) 4,134* (40.2%)
Income tax expense (642) 174 - (468) (1,006)
Profit (loss) for the year 1,830 (406) (5,772) (4,349) 3,128*
*excluding contingent consideration relating to the Jayde Transport acquisition of $2,340,000 **represents all other expenses in the consolidated statement of profit or loss which have not been impacted by the adjustments noted above.
30 June 2020 30 June 2019 Movement
Statement of financial position Excluding AASB
16
$000
Impact of AASB 16
$000
As reported
$000
As reported
$000
Excluding
adjustments
Current assets 37,713 - 37,713 33,619
Non-current assets 125,947 46,341 172,288 134,926
Total assets 163,660 46,341 210,001 168,545 (2.9%)
Current liabilities (29,442) (9,857) (39,299) (29,905)
Non-current liabilities (47,831) (41,257) (89,088) (48,342)
Total liabilities (77,273) (51,114) (128,387) (78,247) (1.2%)
Net assets 86,387 (4,773) 81,614 90,298 (4.3%)
After adding back the contingent consideration in the previous year and excluding the impact of AASB 16 and an impairment charge in the current year, the
profit before tax and EBITDA were down 40.2% and 7.9% respectively on the previous year. The results for the year continue to be impacted by the state of
the economy, particularly as a result of COVID 19 for the second half of the year with a contraction of the national economy resulting in reductions in activity
and margin pressure across a wide range of customers. Interstate freight was further impacted by natural disasters on the Eas t coast, including lower volumes
and higher associated costs to maintain service levels, as well as the relocation of two transport depots in Perth and Melbourne. GMK was impacted by the
implementation of a new transport management system, and this has resulted in increased costs during the year, with future years expected to see the benefit
of improved systems and performance.
The COVID 19 pandemic has seen various impacts within the Group. Freight businesses within the Group, including regional and interstate, have generally
maintained revenue, albeit with increased pressure on margin. The Group’s warehouses, couriers and security businesses have seen reductions in revenues as a
result of the pandemic. These reductions in revenue have qualified certain businesses within the Group for the JobKeeper program and an amount of $561,000
is included within “other income”.
The Company continues to focus on cost reduction and productivity initiatives to improve margins

Directors’ Report
Page 5
Despite the challenging market conditions, operating cash flow has remained strong at $11,683,086 for the year (excluding the impact of AASB 16 which improved
cash flows from operations by $11,649,063 and reduced cash flows from financing activities by an equal amount), representing an improvement of 18.9% on the
previous year. The Group’s receivables and cash flow management remained well controlled with debtors’ days outstanding in line with the prior year. With a
diverse and large customer base, the strength of the Group’s focus on receivables management is reflected in the value of receivables written off during the year
representing only 0.02% of revenue.
The Company decreased interest bearing debt marginally by $148,122 and has further reduced the gearing ratio of the Group from 60% to 58% (after adjusting
for the impacts of AASB 16) by significantly improving the available cash balance by $5,424,723 to $7,611,064 at 30 June 2020.
Although current market conditions have been challenging, the Company continues to generate strong cash flow and is poised to take advantage of and benefit
from any upturn in the economy.
Changes in the state of affairs
No other significant changes in the state of affairs of the Group have occurred other than those matters referred to elsewhere in this report.
Events subsequent to balance date
The directors are not aware of any other matters or circumstances that have significantly or may significantly affect the operations of the Group, the results of
those operations, or the affairs of the Group in subsequent financial years.
Likely developments
The major objectives encompassed in the Business Plan of the Group are:
(i) expansion of existing operations by aggressive marketing and by acquisition;
(ii) establishment or acquisition of businesses in fields related to or compatible with the Group’s existing core operations; and
(iii) to maximise the profits and returns to shareholders by constant review of existing operations.
Company secretary
The company secretary is Mr O Venter. He was appointed to the position on 26 August 2016.
Directors’ meetings
The number of directors’ meetings held in the period each director held office during the financial year and the number of meetings attended by each director
were:
Board of Directors
Number Held Number Attended
P J Leonhardt 11 11
D A Mellor 11 11
B E Saxild 11 11
D R Watson 11 11
Audit and Risk Committee
Number Held Number Attended
P J Leonhardt 3 3
B E Saxild 3 3
Remuneration Committee
Number Held Number Attended
P J Leonhardt 2 2
D R Watson 2 2
Particulars of directors’ interests in shares of CTI Logistics Limited at the date of this report
The relevant interest of each director in the shares issued by the Company as notified by the directors to the ASX in accordance with S205G(1) of the Corporations
Act 2001, at the date of this report is as follows:
Directors’ Report
Page 6
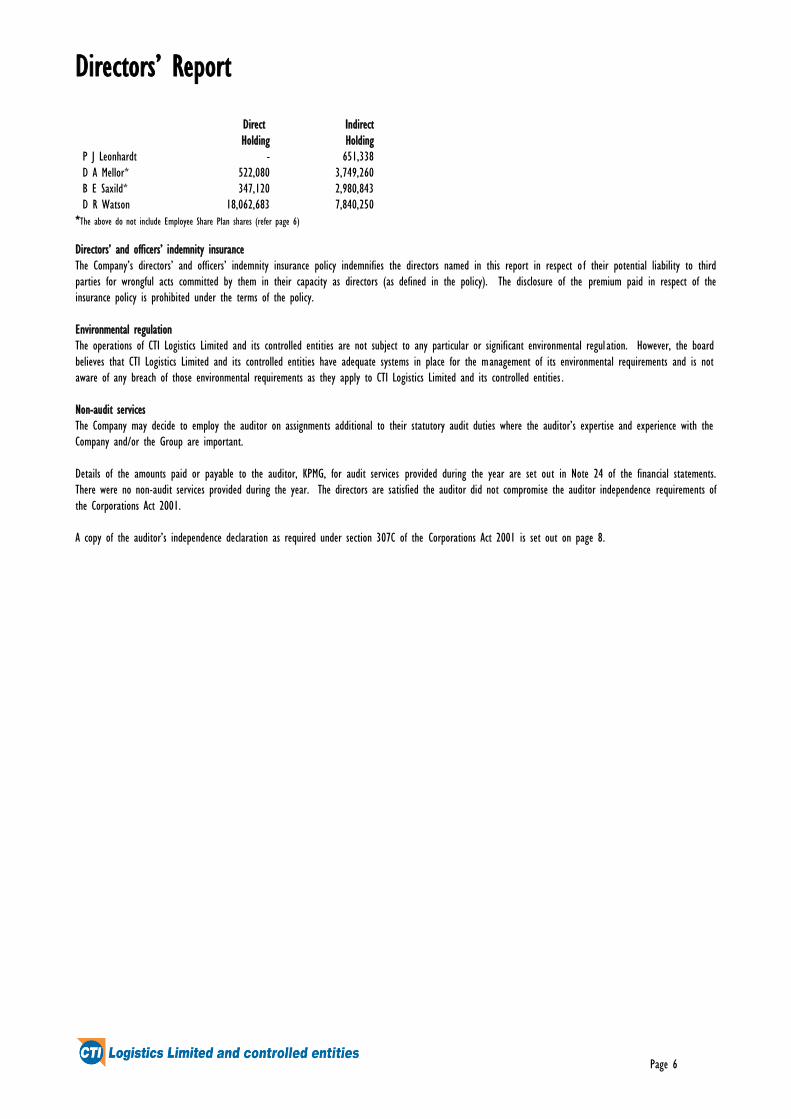
Direct
Holding
Indirect
Holding
P J Leonhardt - 651,338
D A Mellor* 522,080 3,749,260
B E Saxild* 347,120 2,980,843
D R Watson 18,062,683 7,840,250
*The above do not include Employee Share Plan shares (refer page 6)
Directors’ and officers’ indemnity insurance
The Company’s directors’ and officers’ indemnity insurance policy indemnifies the directors named in this report in respect o f their potential liability to third
parties for wrongful acts committed by them in their capacity as directors (as defined in the policy). The disclosure of the premium paid in respect of the
insurance policy is prohibited under the terms of the policy.
Environmental regulation
The operations of CTI Logistics Limited and its controlled entities are not subject to any particular or significant environmental regul ation. However, the board
believes that CTI Logistics Limited and its controlled entities have adequate systems in place for the management of its environmental requirements and is not
aware of any breach of those environmental requirements as they apply to CTI Logistics Limited and its controlled entities .
Non-audit services
The Company may decide to employ the auditor on assignments additional to their statutory audit duties where the auditor’s expertise and experience with the
Company and/or the Group are important.
Details of the amounts paid or payable to the auditor, KPMG, for audit services provided during the year are set out in Note 24 of the financial statements.
There were no non-audit services provided during the year. The directors are satisfied the auditor did not compromise the auditor independence requirements of
the Corporations Act 2001.
A copy of the auditor’s independence declaration as required under section 307C of the Corporations Act 2001 is set out on page 8.

Directors’ Report
Page 7
Remuneration report - audited
The remuneration report is set out under the following main headings:
A. Principles used to determine the nature and amount of remuneration B. Details of remuneration C. Service agreements D. Key management personnel transactions E. Additional information
The information provided in this remuneration report has been audited as required by section 308(3C) of the Corporations Act 2001.
A. Principles used to determine the nature and amount of remuneration Executive directors The remuneration committee makes specific recommendations on remuneration packages and other terms of employment for executive directors. Remuneration is
set to competitively reflect market conditions for comparable roles. There are no guaranteed base pay increases each year, no element of the remuneration is
based upon the Company’s performance and no bonus schemes operated during the financial year.
Non-executive directors Remuneration of non-executive directors is determined by the board within the maximum amount of $300,000, approved by shareholders at the annual general
meeting on 26 November 2009.
B. Details of remuneration Details of the nature and amount of each element of the emoluments of each director of the Company and the Group is set out in the following table.
Short-term Post-employment
Cash salary and fees
$
Non-monetary
benefits
$
Superannuation
$
Total
$
2020
P J Leonhardt 70,000 - - 70,000
*D A Mellor 469,864 11,831 24,960 506,655
*B E Saxild 540,019 14,599 24,960 579,578
*D R Watson 500,640 17,862 24,960 543,462
Total 1,580,523 44,292 74,880 1,699,695
2019
P J Leonhardt 57,500 - - 57,500
*D A Mellor 456,942 16,966 24,960 498,868
*B E Saxild 512,326 14,772 24,960 552,058
*D R Watson 500,640 16,242 24,960 541,842
Total 1,527,408 47,980 74,880 1,650,268
*The cash salary and fees of the Executive Directors has not changed for the last six financial years. Any movement up or down is due to variations in the
amount of accrued leave taken or not taken during the financial year by the director concerned.
C. Service agreements There are no service agreements in existence and entitlements on termination would be subject to assessment by the remuneration committee within legislative
framework at the time.

Directors’ Report
Page 8
Remuneration report – audited (continued)
D. Key management personnel transactionsMovement in shares
The number of ordinary shares in the Company held during the financial year by each director of CTI Logistics Limited, includ ing their personally-related entities,
are set out below. There were no shares granted during the reporting period as remuneration, additions relate to additional shares purchased during the year
or issued as part of the dividend reinvestment plan.
Balance at the
start of the
year
Additions during
the year
Other Balance at the end of
the year
P J Leonhardt 651,338 - - 651,338
D A Mellor 4,271,340 - - 4,271,340
B E Saxild 3,327,963 - - 3,327,963
D R Watson 25,902,933 - - 25,902,933
E. Consequences of performance on shareholder wealthAs there is no remuneration link between management compensation and the performance of the Company on the Australian Securit ies Exchange disclosure of the
past four years results is deemed not necessary.
Having regard to the size and structure of the Group, the nature of its operations, and the close involvement of the three executive directors, it is the opinion
of the directors that there are no other key management personnel apart from the directors.
Employee Share Plan
ESP shares
The number of ESP shares in the Company held during the financial year by each director of CTI Logistics Limited, including their personally-related
entities, are set out below.
Number at the start
of the year
Issued during the year Exercised Number at the end
of the year
D A Mellor (issued 05/12/11, 01/12/14) 330,000 - - 330,000
B E Saxild (issued 05/12/11, 01/12/14) 330,000 - - 330,000
The shares vested 2 years after issue and may be purchased with the assistance of an interest-free, limited recourse loan for a term of 10 years. The shares
were priced using a Black-Scholes pricing model to determine the fair value and amortised through the statement of profit or loss and other comprehensive
income.
DAVID WATSON
Director
Perth, WA
31 August 2020

KPMG, an Australian partnership and a member firm of the KPMG network of independent member firms affiliated with KPMG International Cooperative (“KPMG International”), a Swiss entity.
Liability limited by a scheme approved under Professional Standards Legislation.
Lead Auditor’s Independence Declaration under
Section 307C of the Corporations Act 2001
To the Directors of CTI Logistics Limited
I declare that, to the best of my knowledge and belief, in relation to the audit of CTI Logistics Limited for the financial year ended 30 June 2020 there have been:
i. no contraventions of the auditor independence requirements as set out in the Corporations Act 2001 in relation to the audit; and
ii. no contraventions of any applicable code of professional conduct in relation to the audit.
KPMG Graham Hogg
Partner
Perth
31 August 2020

Page 10
Consolidated Statement of Profit or Loss and other Comprehensive Income
for the year ended 30 June 2020
Consolidated
2020 2019
Notes $ $
Revenue from operations 5 215,209,363 212,030,564
Other income+ 6 1,527,970 945,728
Changes in inventories of finished goods and work in progress 31,014 (27,281)
Raw materials and consumables used (1,071,721) (1,004,672)
Employee benefits expense (71,374,148) (70,137,134)
Subcontractor expense (71,199,715) (68,386,845)
Depreciation and amortisation expense+ 7 (21,817,627) (9,032,827)
Motor vehicle and transport costs (26,764,106) (27,193,290)
Impairment 15 (5,771,500) -
Property costs+ (2,863,822) (17,188,546)
Other expenses (14,689,728) (16,167,953)
Results from operating activities 1,215,980 3,837,744
Finance income 15,250 45,972
Finance expenses+ 7 (5,111,900) (2,089,853)
Net finance costs (5,096,650) (2,043,881)
Profit/(loss) before income tax (3,880,670) 1,793,863
Income tax expense 8 (468,169) (1,005,789)
Profit/(loss) for the year (4,348,839) 788,074
Other comprehensive income
Items that will not be reclassified to profit or loss
Equity investments at FVOCI – net change in fair value 2,306 15,630
Total comprehensive income (4,346,533) 803,704
Earnings per share for profit attributable to the ordinary equity holders of the
Company
Cents
Cents
Basic earnings/(loss) per share 29a (5.79) 1.05
Diluted earnings/(loss) per share 29b (5.79) 1.05
The above consolidated statement of profit or loss and other comprehensive income should be read in conjunction with the accompanying notes.
+The comparative period has not been restated for the adoption of AASB 16. Refer to Note 1 and 12 for further information. There is $11,986,277 included
within the depreciation and amortisation expense related to the right-of-use assets and $3,392,679 of interest on lease liabilities within finance expenses (refer
Note 12).

Page 11
Consolidated Statement of Financial Position
as at 30 June 2020 Consolidated
2020 2019
Notes $ $
ASSETS
Current assets
Cash and cash equivalents 9 7,611,064 2,186,341
Trade and other receivables 10 29,936,811 30,793,668
Income tax receivable - 504,167
Inventories 165,359 134,345
Total current assets 37,713,234 33,618,521
Non-current assets
Other investments 44,144 70,980
Property, plant and equipment+ 11 90,001,535 98,031,641
Right-of-use assets+ 12 43,233,588 -
Investment properties 13 2,207,021 2,207,021
Deferred tax assets+ 8 4,003,829 567,952
Intangible assets 14 32,797,412 34,048,840
Total non-current assets 172,287,529 134,926,434
Total assets 210,000,763 168,544,955
LIABILITIES
Current liabilities
Trade and other payables+ 16 17,532,246 21,694,937
Lease liabilities+ 17 14,915,331 2,209,975
Current tax liabilities 137,864 -
Provisions 19 6,713,668 6,000,414
Total current liabilities 39,299,109 29,905,326
Non-current liabilities
Lease liabilities+ 18 44,157,058 2,060,156
Loans and borrowings 18 42,770,000 44,300,000
Provisions 19 2,160,411 1,981,997
Total non-current liabilities 89,087,469 48,342,153
Total liabilities 128,386,578 78,247,479
Net assets 81,614,185 90,297,476
EQUITY
Contributed equity 20 27,248,025 27,248,025
Reserves 21a 1,926,478 1,893,175
Retained profits 21b 52,439,682 61,156,276
Total equity 81,614,185 90,297,476
The above consolidated statement of financial position should be read in conjunction with the accompanying notes.
+The comparative period has not been restated for the adoption of AASB 16. Refer to Note 1 and 12 for further information.

Page 12
Consolidated Statement of Changes in Equity
for the year ended 30 June 2020
Contributed equity
Reserves
Retained profits
Total equity
Notes $ $ $ $
Consolidated
Balance at 1 July 2018 26,727,285 1,778,533 63,354,100 91,859,918
Total comprehensive income for the year - 15,630 788,074 803,704
Transactions with equity holders in their capacity
as equity holders:
Contributions of equity /share issue 20 498,585 - - 498,585
Share-based payment transactions 31 - 99,012 - 99,012
Dividends provided for or paid 22 22,155 - (2,985,898) (2,963,743)
Balance at 30 June 2019 27,248,025 1,893,175 61,156,276 90,297,476
Balance at 30 June 2019 27,248,025 1,893,175 61,156,276 90,297,476
Adoption of AASB 16, net of tax 1 - - (4,367,755) (4,367,755)
Restated at 1 July 2019 27,248,025 1,893,175 56,788,521 85,929,721
Total comprehensive income for the year - 2,306 (4,348,839) (4,346,533)
Transactions with equity holders in their capacity
as equity holders:
Share-based payment transactions 31 - 30,997 - 30,997
Balance at 30 June 2020 27,248,025 1,926,478 52,439,682 81,614,185
The above consolidated statement of changes in equity should be read in conjunction with the accompanying notes.

Page 13
Consolidated Statement of Cash Flows
for the year ended 30 June 2020
Consolidated
2020 2019
Notes $ $
Cash flows from operating activities
Receipts from customers (inclusive of goods and services tax) 238,029,899 234,348,467
Payments to suppliers and employees (inclusive of goods and services tax) (209,201,046) (220,262,986)
Dividends received 2,382 2,757
Interest received 15,250 45,972
Interest paid (4,782,804) (1,728,630)
Income taxes paid net of income tax refunded (731,532) (2,581,835)
Net cash inflow from operating activities 28 23,332,149 9,823,745
Cash flows from investing activities
Payments for property, plant and equipment (1,729,754) (2,339,188)
Payments for intangibles - security lines (71,575) (5,272)
Payments for intangibles - software (886,150) (490,189)
Purchase of business - (6,964,510)
Proceed from sale of investment 16,668 -
Proceeds from sale of property, plant and equipment 692,788 786,812
Net cash outflow from investing activities (1,978,023) (9,012,347)
Cash flows from financing activities
Proceeds from borrowings 9,500,000 17,600,000
Proceeds from issue of shares - 520,740
Repayment of borrowings (11,030,000) (15,750,689)
Repayment of lease liabilities (14,399,403) -
Dividend paid to Company’s shareholders - (2,985,898)
Net cash outflow from financing activities (15,929,403) (615,847)
Net increase in cash and cash equivalents 5,424,723 195,551
Cash and cash equivalents at the beginning of the financial year 2,186,341 1,990,790
Cash and cash equivalents at the end of the financial year 9 7,611,064 2,186,341
The above consolidated statement of cash flows should be read in conjunction with the accompanying notes.

Notes to the Financial Statements
Page 14
REPORTING ENTITY
CTI Logistics Limited (the “Company”) is a company domiciled in Australia. The address of the Company’s registered office is 1 Drummond Place, West Perth,
Western Australia. The consolidated financial statements of the Company as at and for the year ended 30 June 2020 comprise the Company and its subsidiaries
(together referred to as the “Group” and individually as “Group entities”). The Group is a for-profit entity and is primarily involved in the provision of logistics
and transport services, rental of property and provision of security services.
As the COVID-19 pandemic continues to impact the Australia and the world, the Group’s focus remains on keeping its people well, and mainta ining safe and reliable
operations. The Group has considered the impact of COVID-19 on each of its significant accounting judgements and estimates, particularly with respect to assumptions
used in determining expected credit losses on receivables, impairment of non-current assets and going concern. At this stage no further significant estimates have
been identified as a result of COVID-19, however management is monitoring the increased level of uncertainty in all future cash flow forecasts used in asset valuation
and financial viability.
1. SUMMARY OF SIGNIFICANT ACCOUNTING POLICIES
The principal accounting policies adopted in the preparation of the consolidated financial report are set out below. These policies have been consistently applied to
all the years presented, except as described below. The financial report is for the consolidated entity consisting of CTI Logistics Limited and its subsidiaries.
CHANGES IN SIGNIFICANT ACCOUNTING POLICIES
AASB16 Leases
The Group initially applied AASB 16 Leases from 1 July 2019.
The Group applied AASB 16 using the modified retrospective approach, under which the cumulative effect of initial application is recognised in retained earnings at
1 July 2019. Accordingly, the comparative information for the year ending 30 June 2019 is not restated. The details of the changes in accounting policies are
disclosed below. Additionally, the disclosure requirements in AASB 16 have not generally been applied to comparative informat ion.
A. Definition of a lease
Previously, the Group determined at contract inception whether an arrangement was or contained a lease under IFRIC 4 Determining whether an Arrangement
contains a Lease. The Group now assesses whether a contract is or contains a lease based on the definition of a lease under AASB 16.
On transition to AASB 16, the Group elected to apply the practical expedients to grandfather the assessment of which transactions are leases at the 1 July 2019
date of implementation. The Group applied AASB 16 only to contracts that were previously identified as leases. Contracts that were not identified as leases under
AASB 117 and IFRIC 4 were not reassessed for whether there is a lease under AASB 16. Therefore, the definition of a lease under AASB 16 was only applied to
contracts entered into or changed on or after 1 July 2019.
B. As a lessee
As a lessee, the Group leases many assets including property, plant and equipment. The Group previously classified leases as operating or finance leases based on
its assessment of whether the lease transferred significantly all of the risks and rewards incidental to ownership of the underlying asset to the Group. Under AASB
16, the Group recognises right-of-use assets and lease liabilities for most of these leases.
At commencement or on modification of a contract that contains a lease component, the Group allocates the consideration in the contract to each lease component
on the basis of its relative stand-alone price.
However, for leases of property the Group has elected not to separate non-lease components and account for the lease and associated non-lease components as a
single lease component.

Notes to the Financial Statements
Page 15
1. SUMMARY OF SIGNIFICANT ACCOUNTING POLICIES (continued)
i. Leases classified as operating leases under AASB 117
Previously the Group classified property leases and certain plant and equipment leases as operating leases under AASB 117. On transition, for these leases, lease
liabilities were measured at the present value of the remaining lease payments, discounted at the Group’s incremental borrowing rate as at 1 July 2019. Right-of-
use assets are measured at either:
• Their carrying amount as if AASB 16 had been applied since the lease commencement date, discounted using the Group’s incremen tal borrowing rate at
the date of initial application: the Group applied this approach to it’s property leases; or
• An amount equal to the lease liability, adjusted by the amount of any prepaid or accrued lease payments the Group applied thi s approach to all other
leases.
The Group has tested its right-of-use assets for impairment on the 1 July 2019 date of transition using the practical expedient to rely on its previous assessment
of onerous leases at 30 June 2019.
The Group used a number of practical expedients when applying AASB 16 to leases previously classified as operating leases under AASB 117. In particular, the Group
- did not recognise right-of-use assets and liabilities for leases for which the lease term ends within 12 months of the date of initial application;
- did not recognise right-of-use assets and liabilities for leases of low value assets;
- excluded initial direct costs from the measurement of the right-of-use asset at the date of initial application; and
- used hindsight when determining the lease term.
ii Leases classified as finance leases under AASB 117
The Group leases a number of items of plant and equipment. These leases were classified as finance leases under AASB 117. For these financ e leases, the carrying
amount of the asset and the lease liability at 1 July 2019 were determined at the carrying amount of the lease asset and lease liability under AASB 117 immediately
before that date.
C. As a lessor
The Group leases out its property, including own investment property and right-of use assets on other property leases. The Group has classified these leases as
operating leases.
The Group is not required to make any adjustments on transition to AASB 16 for leases in which it acts as lessor.
D. Impact on financial statements
On transition to AASB 16, the Group recognised right-of-use assets and additional lease liabilities, recognising the difference in retained earnings. The impact on
transition is summarised below.
1 July 2019
$
Right-of-use assets* 53,530,633
Deferred tax asset 2,933,144
Trade and other payables** 2,476,247
Lease liabilities (63,307,779)
Retained earnings (4,367,755)
*The carrying amount of previously recognised property, plant and equipment finance lease assets have not been transferred to right-of-use assets on transition, they
remain with their respective category of property, plant and equipment. The net book value of these at transition was $5,568,929.
Notes to the Financial Statements
Page 16
1. SUMMARY OF SIGNIFICANT ACCOUNTING POLICIES (continued)
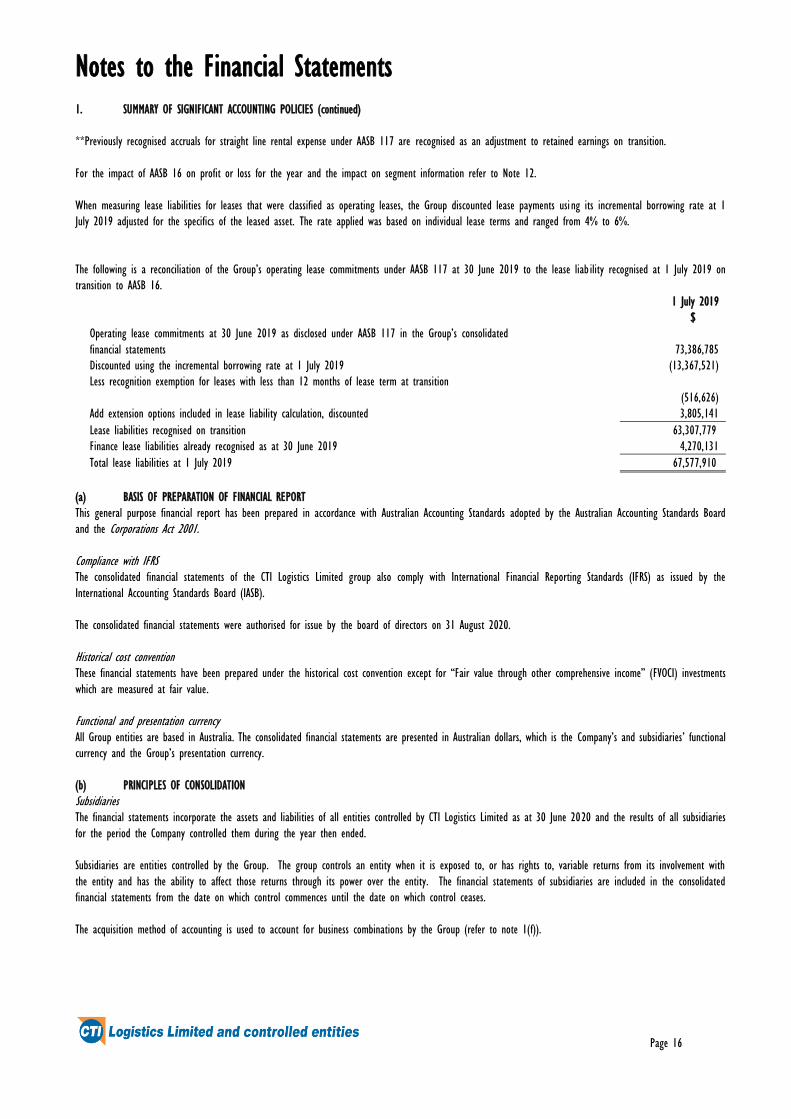
**Previously recognised accruals for straight line rental expense under AASB 117 are recognised as an adjustment to retained earnings on transition.
For the impact of AASB 16 on profit or loss for the year and the impact on segment information refer to Note 12.
When measuring lease liabilities for leases that were classified as operating leases, the Group discounted lease payments usi ng its incremental borrowing rate at 1
July 2019 adjusted for the specifics of the leased asset. The rate applied was based on individual lease terms and ranged from 4% to 6%.
The following is a reconciliation of the Group’s operating lease commitments under AASB 117 at 30 June 2019 to the lease liab ility recognised at 1 July 2019 on
transition to AASB 16.
1 July 2019
$
Operating lease commitments at 30 June 2019 as disclosed under AASB 117 in the Group’s consolidated
financial statements
73,386,785
Discounted using the incremental borrowing rate at 1 July 2019 (13,367,521)
Less recognition exemption for leases with less than 12 months of lease term at transition
(516,626)
Add extension options included in lease liability calculation, discounted 3,805,141
Lease liabilities recognised on transition 63,307,779
Finance lease liabilities already recognised as at 30 June 2019 4,270,131
Total lease liabilities at 1 July 2019 67,577,910
(a) BASIS OF PREPARATION OF FINANCIAL REPORT
This general purpose financial report has been prepared in accordance with Australian Accounting Standards adopted by the Australian Accounting Standards Board
and the Corporations Act 2001.
Compliance with IFRS The consolidated financial statements of the CTI Logistics Limited group also comply with International Financial Reporting Standards (IFRS) as issued by the
International Accounting Standards Board (IASB).
The consolidated financial statements were authorised for issue by the board of directors on 31 August 2020.
Historical cost convention These financial statements have been prepared under the historical cost convention except for “Fair value through other comprehensive income” (FVOCI) investments
which are measured at fair value.
Functional and presentation currency All Group entities are based in Australia. The consolidated financial statements are presented in Australian dollars, which is the Company’s and subsidiaries’ functional
currency and the Group’s presentation currency.
(b) PRINCIPLES OF CONSOLIDATION
Subsidiaries The financial statements incorporate the assets and liabilities of all entities controlled by CTI Logistics Limited as at 30 June 2020 and the results of all subsidiaries
for the period the Company controlled them during the year then ended.
Subsidiaries are entities controlled by the Group. The group controls an entity when it is exposed to, or has rights to, variable returns from its involvement with
the entity and has the ability to affect those returns through its power over the entity. The financial statements of subsidiaries are included in the consolidated
financial statements from the date on which control commences until the date on which control ceases.
The acquisition method of accounting is used to account for business combinations by the Group (refer to note 1(f)).

Notes to the Financial Statements
Page 17
1. SUMMARY OF SIGNIFICANT ACCOUNTING POLICIES (continued)
Intercompany transactions, balances and unrealised gains on transactions within the Group are eliminated. Unrealised losses are also eliminated unless the transaction
provides evidence of the impairment of the asset transferred.
(c) SEGMENT REPORTING
Determination and presentation of operating segments An operating segment is a component of the Group that engages in business activities from which it may earn revenues and incur expenses, including revenues and
expenses that relate to transactions with any of the Group’s other components. All operating segments’ operating results are reviewed regularly by the Group’s
Executive Chairman to make decisions about resources to be allocated to the segment and to assess its performance, and for which discrete financ ial information is
available.
Segment results that are reported to the Group’s Executive Chairman include items directly attributable to a segment as well as those that can be allocated on a
reasonable basis. Unallocated items comprise mainly parent company and items that cannot be allocated to specific segments in respect of revenue, profit, assets
and liabilities.
(d) INCOME TAX
Income tax expense comprises current and deferred tax. Current and deferred tax are recognised in profit or loss except to the extent that it relates to a business
combination, or items recognised directly in equity or in other comprehensive income.
The income tax expense or benefit for the period is the tax payable on the current period’s taxable income based on the notional income tax rate adjusted by
changes in deferred tax assets and liabilities attributable to temporary differences between the tax bases of assets and liab ilities and their carrying amounts in the
financial statements, and to unused tax losses.
Deferred income tax is provided in full, using the liability method, on temporary differences arising between the tax bases of assets and liabilities and their carrying
amounts in the consolidated financial statements. However, the deferred income tax is not accounted for if it arises from initi al recognition of an asset or liability
in a transaction other than a business combination that at the time of the transaction affects neither accounting nor taxable profit or loss. Deferred income tax is
determined using tax rates (and laws) that have been enacted or substantially enacted by the balance sheet date and are expected to apply when the related
deferred income tax asset is realised or the deferred income tax liability is settled.
Deferred tax assets are recognised for deductible temporary differences and unused tax losses only if it is probable that future taxable amounts will be available to
utilise those temporary differences and losses.
Deferred tax assets and liabilities are offset when there is a legally enforceable right to offset current tax assets and lia bilities and when the deferred tax balances
relate to the same taxation authority. Current tax assets and tax liabilities are offset where the entity has a legally enforceable right to offset and intends either
to settle on a net basis or to realise the asset and settle the liability simultaneously.
Tax consolidation CTI Logistics Limited and its wholly-owned Australian controlled entities have implemented the tax consolidation legislation. As a consequence, these entities are
taxed as a single entity and the deferred tax assets and liabilities of these entities are set off in the consolidated financial statements.
Assets or liabilities arising under tax funding agreements with the tax consolidated entities are recognised as amounts recei vable from or payable to other entities
in the Group.
Any difference between the amounts assumed and amounts receivable or payable under the tax funding agreement are recognised as a contribution to (or distribution
from) wholly-owned tax consolidated entities.
(e) LEASES
The Group has applied AASB 16 using the modified retrospective approach and therefore the comparative information has not been restated and continues to be
reported under AASB 17 and IFRIC 4. The details of accounting policies under AASB 17 and IFRIC 4 are disclosed separately.
Notes to the Financial Statements
Page 18
1. SUMMARY OF SIGNIFICANT ACCOUNTING POLICIES (continued)
Policy applicable from 1 July 2019
At inception of a contract, the Group assesses whether a contract is, or contains, a lease. A contract is, or contains, a lea se if the contract conveys the right to
control the use of an identified asset for a period of time in exchange for consideration. To assess whether a contract conveys the right to control the use o f an
identified asset, the Group uses the definition of a lease in AASB 16.
This policy is applied to contracts entered into, on or after 1 July 2019.
i. As a lessee
At commencement or on modification of a contract that contains a lease component, the Group allocates the consideration in the contract to each lease component
on the basis of its relative stand-alone prices. However, for the leases of property the Group has elected not to separate non-lease components and account for the
lease and non-lease components as a single lease component
The Group recognises a right-of-use asset and a lease liability at the lease commencement date. The right-of-use asset is initially measured at cost, which compromises
the initial amount of the lease liability adjusted for any lease payments made at or before the commencement date, plus any initial direct costs incurred and an
estimate of costs to dismantle and remove the underlying asset or to restore the underlying asset or the site on which it is located, less any lease incentives
received.
The right-of-use asset is subsequently depreciated using the straight-line method from the commencement date to the end of the lease term, unless the lease transfers
ownership of the underlying asset to the Group by the end of the lease term or the cost of the right-of-use asset reflects that the Group will exercise a purchase
option. In that case the right-of-use asset will be depreciated over the useful life of the underlying asset, which is determined on the same basis as those of
property, plant and equipment. In addition, the right-of-use asset is periodically reduced by impairment losses, if any, and adjusted for certain remeasurements of
the lease liability.
The lease liability is initially measured at the present value of the lease payments that are not paid at the commencement date, discounted using the interest rate
implicit in the lease or, if the rate cannot be readily determined, the Group’s incremental borrowing rate. Generally, the Group uses its incremental borrowing rate
as the discount rate.
The Group determines its incremental borrowing rate by obtaining interest rates from various external financing sources and makes certain adjustments to reflect
the terms of the lease and type of the asset leased.
Lease payments included in the measurement of the lease liability comprise the following:
• fixed payments, including in-substance fixed payments;
• variable lease payments that depend on an index or a rate, initially measured using the index or rate as at the commencement date;
• amounts expected to be payable under a residual value guarantee; and
• the exercise price under a purchase option that the Group is reasonably certain to exercise, lease payments in an optional renewal period if the Group
is reasonably certain to exercise an extension option, and penalties for early termination of a lease unless the Group is reasonably certain not to
terminate early.
The lease liability is measured at amortised cost using the effective interest method. It is remeasured when there is a change in future lease payments arising from
a change in an index or rate, if there is a change in the Group’s estimate of the amount expected to be payable under a residual value guarantee, if the Group
changes its assessment of whether it will exercise a purchase, extension or termination option or if there is a revised in-substance fixed lease payment.
When the lease liability is remeasured in this way, a corresponding adjustment is made to the carrying amount of the right-of-use asset, or is recorded in profit or
loss if the carrying amount of the right-of use has been reduced to zero.
The Group presents right-of-use assets that do not meet the definition of investment property in ‘property, plant and equipment’ or ‘right-of-use assets’ and lease
liabilities in ‘loans and borrowings’ in the statement of financial position.

Notes to the Financial Statements
Page 19
1. SUMMARY OF SIGNIFICANT ACCOUNTING POLICIES (continued)
Short-term leases and leases of low-value assets
The Group has elected not to recognise the right-of-use assets and lease liabilities for leases of low-value assets and short-term leases, including IT equipment. The
Group recognises the lease payments associated with these leases as an expense on a straight-line basis over the lease term.
ii. As a lessor
At inception or on modification of a contract that contains a lease component, the Group allocates the consideration in the contract to each lea se component on
the basis of their relative stand-alone prices.
When the Group acts as a lessor, it determines at lease inception whether each lease is a finance lease or operating lease.
To classify each lease, the Group makes an overall assessment of whether the lease transfers substantially all of the risks and rewards incidental to ownership of the
underlying asset. If this is the case, then the lease is a finance lease, if not, then it is an operating lease, as part of this assessment, the Group considers certain
indicators such as whether the lease is for the major part of the economic life of the asset.
When the Group is an intermediate lessor, it accounts for its interests in the lead lease and the sub-lease separately. It assesses the lease classification of a sub-
lease with reference to the right-of-use asset arising from the head lease, not with reference to the underlying asset. If a head lease is a short-term lease to which
the Group applies the exemption described above, then it classifies the sub-lease as an operating lease.
If an arrangement contains lease and non-lease components, then the Group applies AASB 15 to allocate the consideration in the contract.
The Group recognises lease payments received under operating leases as income on a straight-line basis over the lease term as part of ‘other income’.
Generally, the accounting policies applicable to the Group as a lessor in the comparative period were not different from AASB 16.
Policy applicable before 1 July 2019
Leases of property, plant and equipment where the Group has substantially all the risks and rewards of ownership, are classified as finance leases. Finance leases
are capitalised at the lease’s inception at the lower of the fair value of the leased property and the present value of the minimum lease payments. The corresponding
rental obligations, net of finance charges are included in other long term payables. Each lease payment is allocated between the liability and finance cost. The
finance cost is charged to profit and loss over the lease period so as to produce a constant periodic rate of interest on the remaining balance of the liability for
each period.
The property, plant and equipment acquired under finance leases is depreciated over the shorter of the asset’s useful life and the lease term.
Leases in which a significant portion of the risks and rewards of ownership are retained by the lessor are classified as operating leases. Payments made under
operating leases (net of any incentives received from the lessor) are charged to profit and loss on a straight-line basis over the period of the lease.
Lease income from operating leases is recognised in income on a straight-line basis over the lease term.
(f) BUSINESS COMBINATIONS
The acquisition method of accounting is used to account for all business combinations entities regardless of whether equity instruments or other assets are acquired.
The consideration transferred for the acquisition of a subsidiary comprises the fair values of the assets transferred, the liabilities incurred and the equity interests
issued by the Group. The consideration transferred also includes the fair value of any asset or liability resulting from a contingent consideration arrangement and
the fair value of any pre-existing equity interest in the subsidiary. Acquisition-related costs are expensed as incurred. Identifiable assets acquired and liabilities and
contingent liabilities assumed in a business combination are, with limited exceptions, measured initially at their fair values at the acquisition date. On an acquisition-
by-acquisition basis, the Group recognises any non-controlling interest in the acquiree either at fair value or at the non-controlling interest’s proportionate share of
the acquiree’s net identifiable assets.
The excess of the consideration transferred, the amount of any non-controlling interest in the acquiree and the acquisition date fair value of any previous equity
interest in the acquiree over the fair value of the Group’s share of the net identifiable assets acquired is recorded as goodwill. If those amounts are less than the
fair value of the net identifiable assets of the subsidiary acquired and the measurement of all amounts has been reviewed, the difference is recognised directly in
profit or loss as a bargain purchase.

Notes to the Financial Statements
Page 20
1. SUMMARY OF SIGNIFICANT ACCOUNTING POLICIES (continued)
Where settlement of any part of cash consideration is deferred, the amounts payable in the future are discounted to their present value as at the date of exchange.
The discount rate used is the entity’s incremental borrowing rate, being the rate at which a similar borrowing could be obtained from an independent financier
under comparable terms and conditions.
Contingent consideration is classified either as equity or a financial liability. Amounts classified as a financial liability are subsequently remeasured to fair value with
changes in fair value recognised in profit or loss.
(g) IMPAIRMENT OF ASSETS
Non-derivative financial assets Financial instruments The Group recognises loss allowances for Expected Credit Losses (“ECLs”) on financial assets measured at amortised cost, being trade and other receivables.
These loss allowances are measured at an amount equal to lifetime ECLs. Lifetime ECLs are ECLs that result from all possible default events over the expected life
of a financial instrument.
When determining whether the credit risk of a financial asset has increased significantly since initial recognition and when estimating ECLs, the Group considers
reasonable and supportable information that is relevant and available without undue cost or effort. This includes both quanti tative and qualitative information and
analysis, based on the Group’s historical experience and informed credit assessment and including forward-looking information.
The Group assumes that the credit risk on a financial asset has increased significantly if it is more than 30 days past due.
The Group considers a financial asset to be in default when the borrower is unlikely to pay its credit obligations to the Group in full, without recourse by the
Group to actions such as realising security (if any held).
Measurement of ECLs ECLs are probability-weighted estimates of credit losses. Credit losses are measured as the present value of all cash shortfalls (i.e. the difference between the cash
flows due to the entity in accordance with the contract and the cash flows that the Group expects to receive).
ECLs are discounted at the effective interest rate of the financial asset.
Credit-impaired financial assets At each reporting date, the Group assesses whether financial assets carried at amortised cost are credit-impaired. A financial asset is ‘credit-impaired’ when one or
more events that have a detrimental impact on the estimated future cash flows of the financial asset have occurred.
Evidence that a financial asset is credit-impaired includes the following observable data:
- Significant financial difficulty of the borrower or issuer;
- A breach of contract such as a default or being more than 60 days past due;
- It is probable that the borrower will enter bankruptcy or other financial reorganisation; or
- The disappearance of an active market for a security because of financial difficulties.
Presentation of allowance for ECL in the statement of financial position Loss allowance for financial assets measured at amortised cost are deducted from the gross carrying amount of the assets.
Write-off The gross carrying amount of a financial asset is written off when the Group has no reasonable expectations of recovering a financial asset in its entirety or a
portion thereof. The Group individually makes an assessment of customers with respect to the timing and amount of write-off based on whether there is a reasonable
expectation of recovery. The Group expects no significant recovery from the amount written off. However, financial assets that are written off could still be subject
to enforcement activities in order to comply with the Group’s procedures for recovery of the amount due.
Notes to the Financial Statements
Page 21
1. SUMMARY OF SIGNIFICANT ACCOUNTING POLICIES (continued)
(i) Assets classified as available-for-sale Impairment losses on available-for-sale financial assets are recognised by reclassifying the losses accumulated in the fair value reserve in equity to profit or loss. The
cumulative loss that is reclassified from equity to profit or loss is the difference between the acquisition cost, net of any principal repayment and amortisation, and
the current fair value, less any impairment loss previously recognised in profit or loss.
Changes in impairment provisions attributable to application of the effective interest method are reflected as a component of interest income. Any subsequent
recovery in the fair value of an impaired available-for-sale equity security is recognised in other comprehensive income. Non-financial assets Goodwill and intangible assets that have an indefinite useful life are not subject to amortisation and are tested annually for impairment, or more frequently if events
or changes in circumstances indicate that they might be impaired. Other assets are tested for impairment whenever events or changes in circumstances indicate that
the carrying amount may not be recoverable. An impairment loss is recognised for the amount by which the asset's carrying amount exceeds its recoverable amount.
The recoverable amount is the higher of an asset's fair value less costs to sell and value in use. For the purposes of assess ing impairment, assets are grouped at
the lowest levels for which there are separately identifiable cash inflows which are largely independent of the cash inflows from other assets or g roups of assets
(cash-generating units). Non-financial assets other than goodwill that suffered an impairment are reviewed for possible reversal of the impairment at the end of each
reporting period. Value-in-use calculations are described in note 15.
(h) CASH AND CASH EQUIVALENTS
Cash and cash equivalents includes cash on hand, deposits held at call with financial institutions, other short-term, highly liquid investments with original maturities
of three months or less that are readily convertible to known amounts of cash and which are subject to an insignificant risk of changes in value, and bank
overdrafts. Bank overdrafts are shown within borrowings in current liabilities on the statement of financial position.
(i) INVENTORIES
Raw materials, work in progress and finished goods are stated at the lower of cost and net realisable value.
Cost comprises direct materials, direct labour and an appropriated proportion of variable and fixed overhead expenditure, the latter being allocated on the basis
of normal operating capacity. Costs are assigned to individual items of inventory on the basis of weighted average costs. Net realisable value is the estimated
selling price in the ordinary course of business less the estimated costs of completion and the estimated costs necessary to make the sale.
(j) FINANCIAL ASSETS
(i) Recognition and initial measurement Trade receivables are initially recognised when they are originated. All other financial assets and financial liabilities are initially recognised when the Group becomes
a party to the contractual provisions of the instrument.
A financial asset (unless it is a trade receivable without a significant financing component) or financial liability is initi ally measured at fair value plus, for an item
not at FVTPL, transaction costs that are directly attributable to its acquisition or issue. A trade receivable without a significant financing component is initially
measured at the transaction price.
(ii) Classification and subsequent measurement On initial recognition, a financial asset is classified as measured at: amortised cost; FVOCI – equity investment; or FVTPL.
Financial assets are not reclassified subsequent to their initial recognition unless the Group changes its business model for managing financial assets, in which case
all affected financial assets are reclassified on the first day of the first reporting period following the change in the bus iness model.
A financial asset is measured at amortised cost if it meets both of the following conditions and is not designated as at FVTPL:
- It is held with the objective to collect contractual cash flows; and
- Its contractual terms give rise on specified dates to cash flows that are solely payments of principal and interest on the pr incipal amount outstanding.
On initial recognition of an equity investment that is not held for trading, the Group may irrevocably elect to present subsequent changes in the investment’s fair
value in OCI. This election is made on an investment-by-investment basis.
Notes to the Financial Statements
Page 22
1. SUMMARY OF SIGNIFICANT ACCOUNTING POLICIES (continued)
All financial assets not classified as measured at amortised cost or FVOCI as described above are measured at FVTPL. On initial recognition, the Group may irrevocably
designate a financial asset that otherwise meets the requirements to be measured at amortised cost or at FVOCI as at FVTPL if doing so eliminates or significantly
reduces an accounting mismatch that would otherwise arise.
Subsequent measurement and gains and losses
Financial assets at FVTPL These assets are subsequently measured at fair value. Net gains and losses, including any interest or dividend
income, are recognised in profit or loss.
Financial assets at amortised cost These assets are subsequently measured at amortised cost using the effective interest method. The amortised cost
is reduced by impairment losses. Interest income and impairment are recognised in profit or loss. Any gain or
loss de-recognition is recognised in profit or loss.
Equity investments at FVOCI These assets are subsequently measured at fair value. Dividends are recognised as income in profit or loss unless
the dividend clearly represents a recovery of part of the cost of the investment. Other net gains and losses are
recognised in OCI and are never reclassified to profit or loss.
(iii) De-recognition The Group de-recognises a financial asset when the contractual rights to the cash flows from the financial asset expire, or it transfers the right to receive the
contractual cash flows in a transaction in which substantially all of the risks and rewards of ownership of the financial asset are transferred, or in which the Group
neither transfers nor retains substantially all of the risks and rewards of ownership and it does not retain control of the financial asset.
(k) PROPERTY, PLANT AND EQUIPMENT
Property, plant and equipment other than freehold land is stated at historical cost less depreciation. Historical cost includes expenditure that is directly attributable
to the acquisition of the items.
Subsequent costs are included in the asset’s carrying amount or recognised as a separate asset, as appropriate, only when it is probable that future economic
benefits associated with the item will flow to the Group and the cost of the item can be measured reliably. All other repairs and maintenance are charged to profit
and loss during the financial period in which they are incurred.
Land is recorded at historical cost and not depreciated. Depreciation on other assets is calculated using the straight line method to allocate their cost net of their
residual values, over their estimated useful lives, as follows:
Buildings 25 - 40 years
Plant and equipment 5 - 15 years
Motor vehicles 5 - 10 years
Furniture and fittings 3 - 8 years
The assets’ residual values and useful lives are reviewed, and adjusted if appropriate, at each balance sheet date.
An asset’s carrying amount is written down immediately to its recoverable amount if the asset’s carrying amount is greater than its estimated recoverable amount
(note 1(g)).
Gains and losses on disposals are determined by comparing proceeds with carrying amounts. These are included in profit or loss under other income and other
expenses.
(l) INVESTMENT PROPERTY
Investment property, principally comprising freehold land and buildings, is held for long-term rental yields and is not occupied by the Group. Investment property is
held at historical cost less depreciation. Investment property includes properties that are under construction for future use as investment property and is carried at
historical cost. Investment buildings are depreciated using the straight line method over their estimated useful lives of 10 to 40 years.
Notes to the Financial Statements
Page 23
1. SUMMARY OF SIGNIFICANT ACCOUNTING POLICIES (continued)
(m) INTANGIBLE ASSETS
(i) Goodwill Goodwill represents the excess of the cost of an acquisition over the fair value of the Group’s share of the net identifiable assets acquired. Goodwill is not amortised.
Instead, goodwill is tested for impairment annually, or more frequently if events or changes in circumstances indicate that i t might be impaired, and is carried at
cost less accumulated impairment losses. Gains and losses on the disposal of an entity include the carrying amount of goodwill relating to the entity sold.
Goodwill is allocated to cash-generating units for the purpose of impairment testing. The allocation is made to those cash-generating units or groups of cash-
generating units that are expected to benefit from the business combination in which the goodwill arose, identified according to operating segments (note 4).
(ii) Security Lines Security lines have a finite useful life and are carried at cost less accumulated amortisation and impairment losses.
(iii) Software Costs incurred in acquiring software and licences that will contribute to future period financial benefits through revenue generation and/or cost reduction are
capitalised to software.
(iv) Trade names Trade names have a finite useful life and are carried at cost less accumulated amortisation and impairment losses.
(v) Customer relationships Customer relationships acquired as part of a business combination are recognised separately from goodwill. The customer relationships are carried at their fair value
at the date of acquisition less accumulated amortisation and impairment losses.
Subsequent expenditure Subsequent expenditure is capitalised only when it increases the future economic benefits embodied in the specific asset to which it relates. All other expenditure,
including expenditure on internally generated goodwill is recognised in profit or loss as incurred.
Amortisation Amortisation is calculated over the cost of the asset less its residual value. Amortisation is recognised in profit or loss on a straight-line basis over the estimated
useful lives of intangible assets, other than goodwill, from the date that they are available for use. The estimated useful lives for the current and comparative
periods are as follows:
Security lines 5 - 7 years
Software 2.5 - 4 years
Trade names 5 - 8 years
Customer relationships 5 - 6 years
Amortisation methods, useful lives and residual values are reviewed at each financial year-end and adjusted if appropriate.
(n) TRADE AND OTHER PAYABLES
These amounts represent liabilities for goods and services provided to the Group prior to the end of the financial year and which are unpaid. The amounts are
unsecured and are paid based on the terms of trade which are usually 30 to 60 days from the date of recognition. Trade and other payables are presented as
current liabilities unless payment is not due within 12 months from the reporting date. They are recognised initially at their fair value and subsequently measured
at amortised cost using the effective interest method.
(o) BORROWINGS
Borrowings are initially recognised at fair value, net of transaction costs incurred. Borrowings are subsequently measured at amortised cost. Any difference between
the proceeds (net of transaction costs) and the redemption amount is recognised in profit or loss over the period of the borrowings using the effective interest
method.
The Group de-recognises a financial liability when its contractual obligations are discharged or cancelled or expire.
Borrowings are classified as current liabilities unless the Group has an unconditional right to defer settlement of the liability for at least 12 months after the
reporting date.
(p) BORROWING COSTS
Borrowing costs incurred for the construction of any qualifying asset are capitalised during the period of time that is required to complete and prepare the asset
for its intended use or sale. Other borrowing costs are expensed.

Notes to the Financial Statements
Page 24
1. SUMMARY OF SIGNIFICANT ACCOUNTING POLICIES (continued)
(q) PROVISIONS
Provisions are recognised when the Group has a present legal or constructive obligation as a result of past events, it is more likely than not that an outflow of
resources will be required to settle the obligation, and the amount has been reliably estimated. Provisions are not recognised for future operating losses.
Provisions are measured at the present value of management’s best estimate of the expenditure required to settle the present obligation at the reporting date.
(r) EMPLOYEE BENEFITS
(i) Short-term obligations Liabilities for wages and salaries, including non-monetary benefits and annual leave expected to be settled within 12 months after the end of the period in which
the employees render the related service are recognised in respect of employees' services up to the end of the reporting period and are measured at the amounts
expected to be paid when the liabilities are settled. The liability for annual leave is recognised in the provision for employee benefits. All other short-term employee
benefit obligations are presented as payables.
(ii) Other long-term employee benefit obligations The liability for long service leave and annual leave which is not expected to be settled within 12 months after the end of the period in which the employees
render the related service is recognised in the provision for employee benefits and measured as the present value of expected future payments to be made in respect
of services provided by employees up to the end of the reporting period. Consideration is given to expected future wage and salary levels, experience of employee
departures and periods of service. Expected future payments are discounted using market yields on national government bonds at the end of the reporting period
with terms to maturity and currency that match, as closely as possible, the estimated future cash outflows.
(iii) Retirement benefit obligations Contributions to the defined contribution fund are recognised as an expense as they become payable. Prepaid contributions are recognised as an asset to the extent
that a cash refund or a reduction in the future payments is available.
(iv) Bonus The Group recognises a liability and an expense for bonuses where contractually obliged or when past events have created a constructive obligation.
(v) Share-based payment transactions An Employee Share Plan (“ESP”) allows certain Group employees to acquire shares of the Company. The grant date fair value of the shares granted to employees
is recognised as an employee expense with a corresponding increase in equity, over the period during which the employees become unconditionally entitled to the
shares. The fair value of the shares granted is measured using a Black-Scholes pricing model, taking into account the terms and conditions upon which the shares
were granted. The amount recognised as an expense is adjusted to reflect the actual number of shares that vest.
Employees have been granted a limited recourse 10 year interest-free loan in which to acquire the shares. The loan has not been recognised as the Company only
has recourse to the value of the shares.
(s) CONTRIBUTED EQUITY
Ordinary shares are classified as equity. Incremental costs directly attributable to the issue of ordinary shares and share options are recognised as a deduction from
equity, net of any tax effects.
(t) DIVIDENDS
Provision is made for the amount of any dividend declared, determined or publicly recommended by the directors on or before the end of the year but not
distributed at balance date.
(u) EARNINGS PER SHARE
(i) Basic earnings per share Basic earnings per share is determined by dividing profit for the year by the weighted average number of ordinary shares outstanding during the year.
(ii) Diluted earnings per share Diluted earnings per share adjusts the figures used in the determination of basic earnings per share to take into account the after income tax effect of interest and
other financing costs associated with dilutive potential ordinary shares and the weighted average number of additional ordinary shares that would have been
outstanding assuming the conversion of all dilutive potential ordinary shares.
Notes to the Financial Statements
Page 25
1. SUMMARY OF SIGNIFICANT ACCOUNTING POLICIES (continued)
(v) GOODS AND SERVICES TAX (“GST”)
Revenues, expenses and assets are recognised net of the amount of associated GST, unless the GST incurred is not recoverable from the taxation authority. In this
case it is recognised as part of the cost of acquisition of the asset or as part of the expense.
Receivables and payables are stated inclusive of the amounts of GST receivable or payable. The net amount of GST recoverable from, or payable to, the taxation
authority is included with other receivables or payables in the balance sheet.
Cash flows are presented on a gross basis. The GST components of cash flows arising from investing or financing activities which are recoverable from, or payable
to the taxation authority, are presented as operating cash flow.
(w) PARENT ENTITY FINANCIAL INFORMATION
The financial information for the parent entity, CTI Logistics Limited, disclosed in note 30 has been prepared on the same basis as the consolidated financial
statements, except as set out below.
(i) Investments in subsidiaries Investments in subsidiaries are accounted for at cost less any impairment in the financial statements of CTI Logistics Limited.
(ii) Tax consolidation legislation CTI Logistics Limited and its wholly-owned Australian controlled entities have implemented the tax consolidation legislation.
The head entity, CTI Logistics Limited, and the controlled entities in the tax consolidated group continue to account for their own current and deferred tax amounts.
These tax amounts are measured as if each entity in the tax consolidated group continues to be a stand alone taxpayer in its own right.
In addition to its own current and deferred tax amounts, CTI Logistics Limited also recognises the current tax liabilities (or assets) and the deferred tax assets
arising from unused tax losses and unused tax credits assumed from controlled entities in the tax consolidated group.
The entities have also entered into tax sharing and funding agreements. Under the terms of these agreements, the controlled entities will reimburse the Company
for any current tax payable by the Company arising in respect of their activities and the Company will reimburse the controlled entities for any tax refund due to
the Company arising in respect of their activities. The reimbursements are payable by the Company and will limit the joint and several liability of the controlled
entities in the case of default by the Company.
Assets or liabilities arising under tax funding agreements with the tax consolidated entities are recognised as amounts recei vable from or payable to other entities
in the Group.
Any difference between the amounts assumed and amounts receivable or payable under the tax funding agreement are recognised as a contribution to (or distribution
from) wholly-owned tax consolidated entities.
(iii) Financial guarantees Where the parent entity has provided financial guarantees in relation to loans and payables of subsidiaries for no compensation, the fair values of these guarantees
is not recognised as contributions or as part of the cost of the investment.
(x) ASSETS HELD FOR SALE
Non-current assets are classified as held-for-sale if it is highly probable that they will be recovered primarily through sale rather than through continuing use.
Such assets are generally measured at the lower of their carrying amount and fair value less costs to sell. Impairment losses on initial classification as held-for-
sale and subsequent gains and losses on re-measurement are recognised in profit or loss.
Once classified as held-for-sale, property, plant and equipment are no longer depreciated.
(y) REVENUE RECOGNITION
Under AASB 15, revenue is recognised when a customer obtains control of the goods or services. Determining the timing of the transfer of control – at a point in
time or over time – requires judgement. The details of the Group’s revenue recognition for major business activities are set out below:

Notes to the Financial Statements
Page 26
1. SUMMARY OF SIGNIFICANT ACCOUNTING POLICIES (continued)
(i) Logistics and transport
Revenue is recognised over the period of time that the goods or services are being delivered to or collected by a customer in accordance with the arrangements
made within the Group. The provision of these services and sale of goods is in most cases either performed on the same day, or within a week for long distance
freight.
(ii) Security, manufacturing and other
A sale is recorded when goods have been despatched to a customer pursuant to a sales order and control has transferred to the customer. A sale is recorded for
services over the period of time the service is performed.
Other income outside the scope of AASB 15 (ii) Interest income
Interest income is recognised on a time proportion basis using the effective interest method.
(iv) Dividends
Dividends are recognised as revenue when the right to receive payment is established.
(v) Other revenue
Revenue from outside the operating activities includes rent. This revenue is recognised over time on a straight-line basis.
(z) NEW ACCOUNTING STANDARDS AND INTERPRETATIONS NOT YET ADOPTED
The Group has adopted all new and revised Standards and Interpretations issued by the Australian Accounting Standards Board (AASB) that are relevant to its
operations and effective for the current reporting period.
Notes to the Financial Statements
Page 27
2. CRITICAL ACCOUNTING ESTIMATES AND JUDGEMENTS
Estimates, assumptions and judgements may be used to assess the measurement of certain items of income and expense, and asset s and liabilities. Such estimates,
assumptions and judgements are regularly evaluated and are based on historical experience and other factors, including expectations of future events that are believed
to be reasonable under the circumstances.
Where estimates and assumptions are made concerning the future, the resulting accounting estimates may not equal the related actual outcome. The estimates and
assumptions which give rise to a risk of causing an adjustment to the carrying amounts of assets and liabilities within the next financial year are discussed below.
Intangible assets The Group tests annually whether goodwill has suffered any impairment, in accordance with the accounting policy stated in note 1(g). The recoverable amounts of
cash-generating units have been determined based on value-in-use calculations as described in note 15.
The fair value of trade names acquired in a business combination is based on the discounted estimated royalty payments that are expected to be avoided as a
result of the trade names being owned. The fair value of customer relationships acquired in a business combination is determined using the multi-period excess
earnings method, whereby the subject asset is valued after deducting a fair return on all other assets that are part of creat ing the related cash flows.
Property, plant and equipment and Right-of-use assets Property, plant and equipment and Right-of-use assets are tested for impairment where there is an indicator of impairment, in accordance with the accounting policy
stated in note 1(g). The recoverable amounts of cash-generating units have been determined based on value-in-use calculations or fair value less cost to dispose as
described in note 15.
3. FINANCIAL RISK MANAGEMENT
Overview The Group has exposure to the following risks from their use of financial instruments:
(a) Market risk (b) Credit risk (c) Liquidity risk
This note presents information about the Group’s exposure to each of the above risks, the Group’s objectives, policies and processes for measuring and managing
risk, and the Group’s management of capital.
Risk management framework The board of directors has overall responsibility for the establishment and oversight of the risk management framework. Risk management is carried out by the
director responsible for finance under the guidance of the board of directors. The board of directors considers principles for overall risk management, as well as
determining policies covering specific areas, such as mitigating interest rate and credit risks and investing excess liquidity.
The Group’s risk management policies are established to identify and analyse the risks faced by the Group. These policies are reviewed regularly to reflect changes
in market conditions and the Group’s activities.
(a) Market risk
(i) Price risk The Group is exposed to equity securities price risk. This arises from investments held by the Group and classified on the balance sheet as other investments.
The price risk for listed and unlisted securities is immaterial in terms of the possible impact on profit or loss or total equity. Therefore no sensitivity analysis is
completed.
The Group is not exposed to commodity price risk, or foreign exchange risk from currency exposure.
(ii) Cash flow and fair value interest rate risk The Group’s interest rate risk arises from borrowings and cash and cash equivalents. Borrowings and Lease liabilities - hire purchases issued at variable rates expose
the Group to cash flow interest rate risk. Borrowings and lease liabilities issued at fixed rates expose the Group to fair value interest rate risk. At the year end
30.82% (2019 – 31.03%) of borrowings and lease liabilities were at fixed rates.
Notes to the Financial Statements
Page 28
3. FINANCIAL RISK MANAGEMENT (continued)
(iii) Borrowings and cash and cash equivalents At the reporting date the Group had the following borrowings and cash and cash equivalents.
Consolidated
Weighted
average interest
rate
2020
%
2020
$
Weighted
average interest
rate
2019
%
2019
$
Cash and cash equivalents 0.52 7,611,064 1.33 2,186,341
Bank loans 1.40 42,770,000 2.55 44,300,000
Lease liabilities (2019: finance lease liabilities) 5.42 59,072,389 4.07 4,270,131
An analysis by maturities is provided in 3(c) below.
The Group manages interest rate risk by assessing the appropriateness of fixed or floating rate debt when funding is required.
The Group monitors loan covenants on a regular basis to ensure compliance with agreements.
Group sensitivity The Group’s main interest rate risk arises from loans and cash and cash equivalents. At 30 June 2020, if the interest rates had changed by -/+ 100 basis points
from the year-end rates with all other variables held constant, post-tax profit for the year would have been higher/lower by $299,390(2019 - change of 100bps:
$310,100 higher/lower) for loans and higher/lower by $53,277 (2019 - change of 100bps: $15,304 higher/lower) for cash and cash equivalents, mainly as a result
of higher/lower interest expense from borrowings and higher/lower interest income from cash and cash equivalents.
(b) Credit risk
Credit risk is managed on a group basis. Credit risk arises from cash and cash equivalents and deposits with banks and financial institutions, as well as credit
exposures to wholesale and retail customers, including outstanding receivables and committed transactions.
The Group has policies in place to ensure that sales of products and services are made to customers with an appropriate credit history. The Group has no significant
concentrations of credit risk. Cash transactions are limited to high credit quality financial institutions. The Group has policies that limit the amount of credit
exposure to any one financial institution.
There is no independent rating of individual customers. Financial institutions have credit ratings of AA* and higher at 30 June 2020. Risk control assesses the
credit quality of the customer, taking into account its financial position, past experience and other factors. Customers that are graded as “high risk” are placed on
a restricted customer list and monitored on a weekly basis. Receivables balances are monitored on an ongoing basis.
*Standard and Poor credit rating The maximum exposure to credit risk at the reporting date is the carrying amount of the financial assets as follows:
Consolidated
2020
$
2019
$
Cash and cash equivalents 7,611,064 2,186,341
Trade receivables 25,526,279 26,931,853
Other receivables 2,751,528 2,396,015
35,888,871 31,514,209
Trade receivables are non-interest bearing and terms of trade are 30 days from month end. At 30 June 2020, 7.78% (2019 – 6.61%) of trade receivables of the
Group exceed 30 days.
Other receivables are non-interest bearing and have repayment terms exceeding 30 days but are not considered impaired.

Notes to the Financial Statements
Page 29
3. FINANCIAL RISK MANAGEMENT (continued)
The ageing of receivables that are past due but not impaired at the reporting date is as follows:
Past due but not impaired
30-60 days
$
> 60 days
$
Total
$
2020
Consolidated
Trade receivables 1,238,407 778,291 2,016,698
2019
Consolidated
Trade receivables 706,436 1,087,182 1,793,618
The Group uses an allowance matrix to measure the expected credit losses (ECLs) of trade receivables from individual customers, which comprise a very large number
of small balances.
Loss rates are calculated using a ‘roll rate’ method based on the probability of a receivable progressing through successive stages of delinquency to write-off. Loss
rates are based on actual credit loss experience over the past 5 years, adjusted to reflect differences between economic conditions during the period over which the
historical data has been collected, current conditions and the Group’s view of economic conditions over the expected lives of the receivables.
ECLs in the current year have been increased to reflect current uncertainty in economic conditions associated with COVID 19. The Group’s monitoring of recoverability
of receivables has increased due to the changes in market conditions arising from COVID 19. Credit limits continue to be monitored.
The following table provides information about the ECLs for trade receivables as at 30 June.
Consolidated
2020
$
2019
$
1 to 30 days 93,344 32,695
31 to 60 days 47,135 18,010
Over 60 days 268,912 163,768
Total 409,391 214,473
Provision for expected credit losses Movements in the ECLs of receivables are as follows:
Balance 1 July 214,473 130,650
Net loss allowance recognised 235,094 95,145
Receivables written off during the year as uncollectable (40,176) (11,322)
Balance 30 June 409,391 214,473
The creation and release of the ECLs provision has been included in ‘other expenses’ in profit or loss. Amounts charged to the allowance account are generally
written off when there is no expectation of recovering cash.
(c) Liquidity risk
Prudent liquidity risk management implies maintaining sufficient cash and marketable securities and the availability of funding through an adequate amount of
committed credit facilities. The Group manages liquidity risk by continuously monitoring forecast and actual cash flows and matching the maturity profiles of current
financial assets and liabilities. Due to the dynamic nature of the underlying businesses, the board of directors aims at maintaining flexibility in funding by keeping
committed credit lines available with a variety of counterparties. Surplus funds are generally only invested in instruments that are tradeable in highly liquid markets.

Notes to the Financial Statements
Page 30
3. FINANCIAL RISK MANAGEMENT (continued)
Financing arrangements The Group had access to the following undrawn borrowing facilities at the reporting date:
Consolidated
2020
$
2019
$
Floating rate
Expiring beyond one year (note 18c) 6,000,000 10,036,000
6,000,000 10,036,000
The bank loan facilities may be drawn at any time subject to the continuance of satisfactory credit ratings and are also subject to annual review. The bill acceptance
facilities have defined maturity dates.
Maturities of financial liabilities The table below sets out the Group’s financial liabilities into relevant maturity groupings based on the remaining period at the reporting date to the contractual
maturity date. The amounts disclosed in the table are the contractual undiscounted cash flows.
Variable rate borrowings mature between July 2021 and October 2021, and are revised on an ongoing basis. The Group expects these borrowings to be renewed for
a further period prior to maturity.
Maturity
Consolidated
1 year or
less
$
1 to 2 years
$
2 to 5 years
$
> 5 Years
$
Total contractual cash
flows
$
Carrying amount
$
2020
Trade and other payables (Non-interest
bearing)
17,532,246 - - - 17,532,246 17,532,246
Lease liabilities* 17,074,938 17,316,890 33,220,053 14,441,334 82,053,215 59,072,388
Borrowings 571,448 42,893,307 - - 43,464,755 42,770,000
Total 35,178,632 60,210,197 33,220,053 14,441,334 143,050,216 119,374,634
2019
Trade and other payables (Non-interest
bearing)
21,694,937 - - - 21,694,937 21,694,937
Borrowings 1,128,118 44,780,356 - - 45,908,474 44,300,000
Lease liabilities 2,331,797 1,458,836 724,589 - 4,515,222 4,270,131
Total 25,154,852 46,239,192 724,589 - 72,118,633 70,265,068
*Lease liability cash flows include fixed rate contractual cash flows of $5,898,000 which are linked to hire purchase liabilities with a carrying value o f $5,652,000
(included within lease liabilities).
(d) Fair value estimation
The fair value of financial assets and financial liabilities must be estimated for recognition and measurement or for disclosure purposes. The Group has not disclosed
the fair value for financial instruments such as short-term trade receivables and payables, because their carrying amounts are a reasonable approximation of fair
values.
The following tables present the Group’s assets measured and recognised at fair value at 30 June 2020.
Consolidated
2020 2019
Level 1 Level 1
Other investments
$
$
Equity securities 44,144 70,980

Notes to the Financial Statements
Page 31
3. FINANCIAL RISK MANAGEMENT (continued)
Capital risk management The Group’s objectives when managing capital are to safeguard their ability to continue as a going concern, so that they continue to provide returns for shareholders
and benefits for other stakeholders and to maintain an optimal capital structure to reduce the cost of capital.
In order to maintain or adjust the capital structure, the Group may adjust the amount of dividends paid to shareholders, return capital to shareholders, issue new
shares or sell assets to reduce debt.
Consistently with others in the industry, the Group monitors capital on the basis of the gearing ratio. This ratio is calculated as net debt divided by total capital.
Net debt is calculated as total borrowings (including ‘borrowings’ and ‘trade and other payables’ as shown in the statement of financial position) less cash and cash
equivalents. Total capital is calculated as ‘equity’ as shown in the statement of financial position plus net debt.
During 2020, the Group’s gearing ratio increased significantly as a result of implementing AASB 16. However had the prior period been restated to reflect this, the
gearing ratio has declined.
The gearing ratios at 30 June 2020 and 30 June 2019 were as follows:
Consolidated
Notes 2020 2019
$ $
Total payables and borrowings 16,17,18 119,374,635 70,265,068
Less: cash and cash equivalents 9 (7,611,064) (2,186,341)
Net debt 111,763,571 68,078,727
Total equity 81,614,185 90,297,476
Total capital 193,377,756 158,376,203
Gearing ratio 58% 43%
Gearing ratio – adjusted for AASB 16 58% 60%
4. SEGMENT INFORMATION
(a) Description of segments
Management has determined the operating segments based on the reports reviewed by the Group’s Executive Chairman.
The Group’s Executive Chairman considers the business from a product and services perspective and has identified three reportable segments: logistics, transport
and property.
The reportable segments operate solely in Australia and are involved in the following operations:
• Transport services - includes the provision of courier, taxi truck, parcel distribution and fleet management and line haul freight.
• Logistics services - includes the provision of warehousing and distribution, specialised flooring logistics, supply based management services and document
storage services.
• Property - rental of owner-occupied and investment property.
“Other” segments includes the provision of security services. These segments do not meet any of the quantitative thresholds for determining reportable segments.
The Group does not have a single external customer which represents greater than 10% of the entity’s revenue.
The Group’s Executive Chairman assesses the performance of the operating segments based on segment profit before income tax, as included in internal management
reports. Segment profit is used to measure performance as management believes that such information is the most relevant in evaluating the results of certain
segments relative to other entities that operate within these industries.
Notes to the Financial Statements
Page 32
4. SEGMENT INFORMATION (continued)
(b) Accounting policies
Segment information is prepared in conformity with the accounting policies of the entity as disclosed in note 1(c) and accounting standard AASB 8 Operating Segments. Inter-segment transfers Segment revenues, expenses and results include transfers between segments. Such transfers are priced on an arm’s length basis and are eliminated on consolidation.
Segment assets and liabilities Segment assets are allocated based on the operations of the segment and the physical location of the asset. Segment liabilities are allocated based on the operations
of the segment. Unallocated amounts Unallocated amounts are made up of the parent company and amounts that cannot be allocated to specific segments in respect of revenue, profit, assets and
liabilities.
(c) Information about reportable segments
The segment information provided to the Group’s Executive Chairman for the reportable segments for the year ended 30 June 2020 is as follows:
Transport
$
Logistics
$
Property
$
Other
$
Consolidated
$
2020
Reportable segment revenue
Sales to external customers 126,819,307 82,095,427 161,026 6,007,122 215,082,882
Intra and inter-segment revenue 17,672,349 52,273 3,813,125 688,451 22,226,198
Total segment revenue 144,491,656 82,147,700 3,974,151 6,695,573 237,309,080
Other income 217,421 750,587 - (1,038) 966,970
Interest expense 598,499 3,086,272 520,694 - 4,205,465
Depreciation and amortisation 6,233,101 13,181,451 821,831 520,024 20,756,407
Reportable segment profit/(loss) before income tax 3,943,990
197,685 (4,587,208)
407,651 (37,882)
Reportable segment assets 51,746,493 79,123,244 66,873,078 1,989,378 199,732,193
Reportable segment liabilities 32,421,176 53,270,771 38,592,450 1,623,229 125,907,626
2019
Reportable segment revenue
Sales to external customers 121,048,375 84,381,291 168,683 6,138,800 211,737,149
Intra and inter-segment revenue 15,669,061 175,866 3,687,601 666,713 20,199,241
Total segment revenue 136,717,436 84,557,157 3,856,284 6,805,513 231,936,390
Other income 611,382 128,905 62,080 9,091 811,458
Interest expense 221,008 59,660 775,970 - 1,056,638
Depreciation and amortisation 3,835,529 3,262,933 828,801 543,616 8,470,879
Reportable segment profit before income tax 1,999,678
1,933,244 701,843
537,134 5,171,899
Reportable segment assets 44,576,930 43,103,204 73,559,587 2,694,217 163,933,938
Reportable segment liabilities 24,631,275 7,851,919 38,630,577 1,641,809 72,755,580

Notes to the Financial Statements
Page 33
4. SEGMENT INFORMATION (continued)
The Group initially applied AASB 16 at 1 July 2019, which requires the recognition of right-of-use assets and lease liabilities for lease contracts that were
previously classified as operating leases (see note 1). As a result, the Group recognised $53,530,633 of right-of-use assets and an additional $63,307,779 of
liabilities from those lease contracts for a total lease liability of $67,577,910. The assets and liabilities are included within the Transport and Logistics segments as
at 30 June 2020. The Group has applied the modified retrospective approach, under which comparative information is not restated.
(d) Reconciliations of reportable segment revenues, profit, assets and liabilities and other material items
Consolidated
Notes 2020
$
2019
$
Revenues
Total segment revenue for reportable segments 237,309,080 231,936,390
Elimination of intra-segment and inter-segment revenue (22,226,198) (20,199,241)
Unallocated revenue 126,481 293,415
Consolidated revenue 5 215,209,363 212,030,564
Profit/(loss)
Total profit/(loss) before tax for reportable segments (37,882) 5,171,899
Unallocated amounts (3,842,788) (3,378,036)
Consolidated profit/(loss) before income tax (3,880,670) 1,793,863
Assets
Total assets for reportable segments 199,732,193 163,933,938
Unallocated amounts 10,268,570 4,611,017
Consolidated total assets 210,000,763 168,544,955
Liabilities
Total liabilities for reportable segments 125,907,626 72,755,580
Unallocated amounts 2,478,952 5,491,899
Consolidated total liabilities 128,386,578 78,247,479
Other material items
Interest Income
Unallocated amounts 15,250 45,972
Consolidated interest income 15,250 45,972
Other income
Total for reportable segments 966,970 811,458
Unallocated amounts 561,000 134,270
Consolidated other income 1,527,970 945,728
Interest expense
Total for reportable segments 4,205,465 1,056,638
Unallocated amounts 609,349 715,508
Consolidated interest expense 4,814,814 1,772,146
Depreciation and amortisation
Total for reportable segments 20,756,407 8,470,879
Unallocated amounts 1,061,220 561,948
Consolidated depreciation and amortisation 7 21,817,627 9,032,827
The reports provided to the Group’s Executive Chairman with respect to reconciliation of reportable segment revenues, profit/(loss), assets and liabilities are measured
in a manner consistent with that of the financial statements.

Notes to the Financial Statements
Page 34
5. REVENUE
The Group generates revenue primarily from the provision of transport, logistics and security services. Other sources of revenue include rental income from investment
properties and dividends from other investments (refer note 1(y)).
In the following table, revenue from contracts with customers is disaggregated by major services provided.
Consolidated
2020 2019
$ $
Revenue from contracts with customers
Sales revenue
Transport 126,819,307 121,048,375
Logistics 82,095,427 84,381,291
Security services 6,007,122 6,128,591
Other 124,099 300,867
215,045,955 211,859,124
Other revenue
Dividends 2,382 2,757
Rent 161,026 168,683
163,408 171,440
215,209,363 212,030,564
6. OTHER INCOME
Net gain on disposal of:
- motor vehicles 170,981 375,186
- plant and equipment 23,425 7,451
JobKeeper 561,000 -
Other 772,564 563,091
1,527,970 945,728

Notes to the Financial Statements
Page 35
7. EXPENSES
Consolidated
2020 2019
$ $
Profit/(loss) before income tax includes the following specific expenses:
Employee benefits Defined contribution superannuation 5,058,550 5,064,016
Share-based payments 30,997 99,012
Depreciation and amortisation
Buildings 1,210,972 1,085,512
Plant and equipment and motor vehicles 6,411,225 6,406,424
Right-of-use assets 11,986,277 -
Security lines 15,855 14,410
Software 922,512 224,077
Trade name and customer relationships 1,270,786 1,302,404
21,817,627 9,032,827
Finance expenses
Interest 4,814,814 1,772,146
Finance charges 297,086 317,707
5,111,900 2,089,853
8. INCOME TAXES
(a) Income tax expense
Current tax 1,278,045 1,925,133
Deferred tax (501,753) (485,752)
Over provided in prior years (308,123) (433,592)
Income tax expense 468,169 1,005,789
Deferred income tax (benefit) included in income tax expense comprises:
Decrease/(increase) in deferred tax assets (note 8d) (538,907) (161,889)
Decrease in deferred tax liabilities (note 8e) 37,154 (323,863)
(501,753) (485,752)
(b) Numerical reconciliation of income tax
expense to prima facie tax payable
Profit/(loss) before income tax expense (3,880,670) 1,793,863
Tax at the Australian rate of 30% (2019 - 30%) (1,164,201) 538,159
Tax effect of amounts which are not deductible/(taxable) in calculating taxable income:
Amortisation 114,808 124,293
Impairment 1,731,450 -
Share-based payment 9,299 29,704
Rebatable dividends (1,021) (1,182)
Contingent payment related to business acquisition (note 32) - 702,000
Sundry items 85,957 46,407
776,292 1,439,381
Over provision in prior years (308,123) (433,592)
Income tax expense 468,169 1,005,789
Notes to the Financial Statements
Page 36
8. INCOME TAXES (continued)
Consolidated
2020 2019
$ $
(c) Amounts recognised directly in equity
Net deferred tax – debited directly to equity (note 8d) 980 7,699
(d) Deferred tax assets
The balance comprises temporary differences attributable to:
Amounts recognised in profit or loss
Doubtful debts 122,700 64,341
Employee benefits 2,662,223 2,306,841
Depreciation and amortisation 317,962 380,328
Right-of-use assets 3,107,135 -
Other 22,350 1,110
6,232,370 2,752,620
Amounts recognised directly in equity
Other investments 980 7,699
6,233,350 2,760,319
Set-off of deferred tax liabilities (note 8e) (2,229,521) (2,192,367)
Net deferred tax assets 4,003,829 567,952
Movements
Balance 1 July 2,760,319 2,396,745
Adoption of AASB 16 2,933,144 -
Credited to profit or loss 538,907 161,889
Purchase of business (note 32) - 193,986
Debited to equity 980 7,699
Balance 30 June 6,233,350 2,760,319
(e) Deferred tax liabilities
The balance comprises temporary differences attributable to:
Amounts recognised in profit or loss
Depreciation and amortisaton 1,147,953 844,371
Intangible assets 1,081,568 1,347,996
2,229,521 2,192,367
Set-off of deferred tax assets (note 8d) (2,229,521) (2,192,367)
Net deferred tax liabilities - -
Movements (deferred tax liabilities)
Balance 1 July 2,192,367 2,516,230 Credited to profit or loss 37,154 (323,863)
Balance 30 June 2,229,521 2,192,367
9. CURRENT ASSETS - CASH AND CASH EQUIVALENTS
Cash at bank and in hand at the end of the financial year as shown in the statement of cash
flows 7,611,064 2,186,341
Cash at bank earns interest at varying rates between nil and 0.52% per annum (2019 - nil and 1.10% per annum).
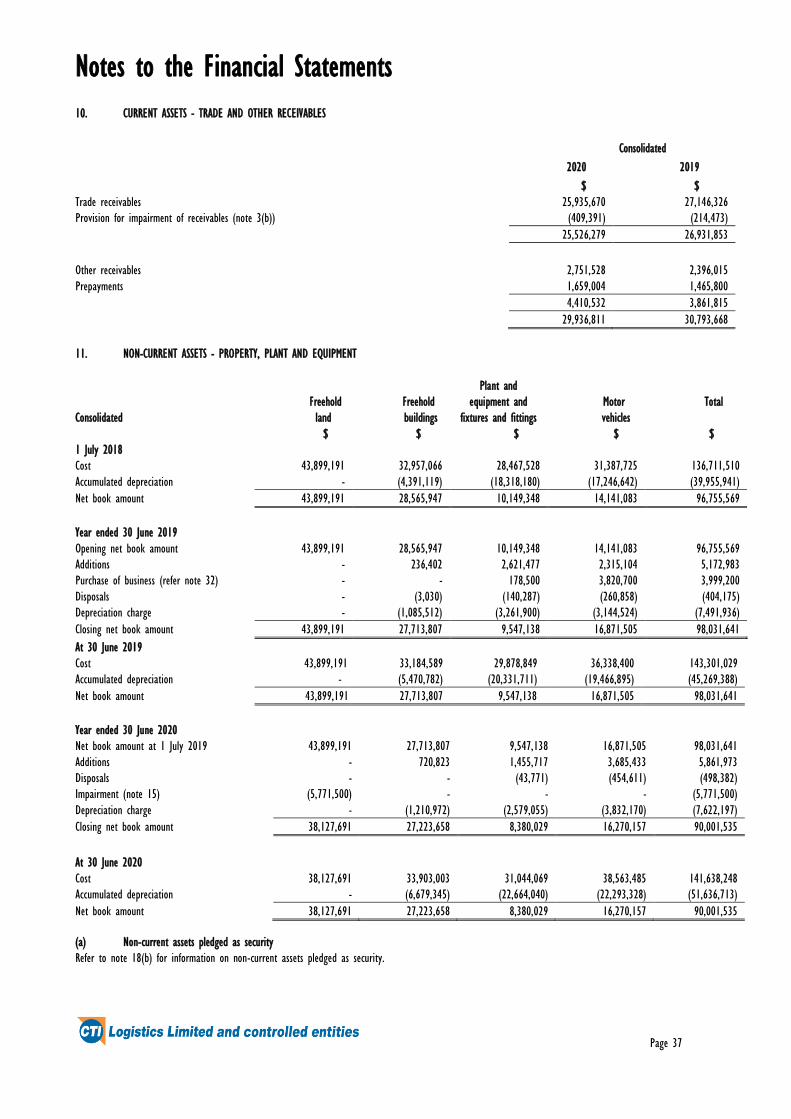
Notes to the Financial Statements
Page 37
10. CURRENT ASSETS - TRADE AND OTHER RECEIVABLES
Consolidated
2020 2019
$ $
Trade receivables 25,935,670 27,146,326
Provision for impairment of receivables (note 3(b)) (409,391) (214,473)
25,526,279 26,931,853
Other receivables 2,751,528 2,396,015
Prepayments 1,659,004 1,465,800
4,410,532 3,861,815
29,936,811 30,793,668
11. NON-CURRENT ASSETS - PROPERTY, PLANT AND EQUIPMENT
Consolidated
Freehold
land
Freehold
buildings
Plant and
equipment and
fixtures and fittings
Motor
vehicles
Total
$ $ $ $ $
1 July 2018
Cost 43,899,191 32,957,066 28,467,528 31,387,725 136,711,510
Accumulated depreciation - (4,391,119) (18,318,180) (17,246,642) (39,955,941)
Net book amount 43,899,191 28,565,947 10,149,348 14,141,083 96,755,569
Year ended 30 June 2019
Opening net book amount 43,899,191 28,565,947 10,149,348 14,141,083 96,755,569
Additions - 236,402 2,621,477 2,315,104 5,172,983
Purchase of business (refer note 32) - - 178,500 3,820,700 3,999,200
Disposals - (3,030) (140,287) (260,858) (404,175)
Depreciation charge - (1,085,512) (3,261,900) (3,144,524) (7,491,936)
Closing net book amount 43,899,191 27,713,807 9,547,138 16,871,505 98,031,641
At 30 June 2019
Cost 43,899,191 33,184,589 29,878,849 36,338,400 143,301,029
Accumulated depreciation - (5,470,782) (20,331,711) (19,466,895) (45,269,388)
Net book amount 43,899,191 27,713,807 9,547,138 16,871,505 98,031,641
Year ended 30 June 2020
Net book amount at 1 July 2019 43,899,191 27,713,807 9,547,138 16,871,505 98,031,641
Additions - 720,823 1,455,717 3,685,433 5,861,973
Disposals - - (43,771) (454,611) (498,382)
Impairment (note 15) (5,771,500) - - - (5,771,500)
Depreciation charge - (1,210,972) (2,579,055) (3,832,170) (7,622,197)
Closing net book amount 38,127,691 27,223,658 8,380,029 16,270,157 90,001,535
At 30 June 2020
Cost 38,127,691 33,903,003 31,044,069 38,563,485 141,638,248
Accumulated depreciation - (6,679,345) (22,664,040) (22,293,328) (51,636,713)
Net book amount 38,127,691 27,223,658 8,380,029 16,270,157 90,001,535 (a) Non-current assets pledged as security
Refer to note 18(b) for information on non-current assets pledged as security.

Notes to the Financial Statements
Page 38
12. NON-CURRENT ASSETS – RIGHT-OF-USE ASSETS
A. Leases as lessee (AASB 16)
The Group leases warehouse and transport depot facilities. These leases typically run for a period of 5 years, however range from 1 year to 12 years, generally with
an option to renew the lease after that date. Lease payments increase with CPI or fixed percentages based on the underlying lease, with market reviews generally
coming into effect at the time of renewal.
These property leases provide for the payment of outgoings in addition to rent payments. These payments are determined to be variable in nature and have not
been included within the calculation of the lease liability.
Prior to the implementation of AASB 16, leases of property, which combined land and buildings, were classified as operating leases under AASB 117.
The Group also leases plant and equipment, these leases were previously either classified as operating or finance leases based on the underlying terms of the contract
under the previous AASB 117 standard.
Information about leases for which the Group is a lessee is presented below.
i. Right-of-use assets Land and buildings Plant and
equipment
Total
$ $ $
Balance at 1 July 2019 52,213,271 1,317,362 53,530,633
Depreciation for the period (11,114,012) (872,265) (11,986,277)
Additions to right-of-use assets 451,389 1,310,273 1,761,662
Disposal of right-of-use assets - (72,430) (72,430)
Balance at 30 June 2020 41,550,648 1,682,940 43,233,588
Included within the balance sheet caption Property, plant and equipment are right-of-use assets with a carrying value of $7,648,361 at 30 June 2020, these assets
have hire purchase liabilities and would previously have been classified as finance leases under AASB 117. Additions to these assets during the year totalled $4,029,219
with depreciation of $1,036,331.
ii. Amounts recognised in profit or loss $
30 June 2020 – Leases under AASB 16
Interest on lease liabilities 3,392,679
Income from sub-leasing right-of-use assets presented in “other income” (635,930)
Expenses relating to short-term leases 2,542,230
Expenses relating to leases of low-value assets 58,847
Variable lease payments excluded from lease liability calculations 1,692,716
30 June 2019 – Operating leases under AASB 117
Lease expense $15,577,554
iii. Extension options Some property leases contain certain extension options exercisable by the Group prior to the end of the non-cancellable contract period. Where practicable, the
Group seeks to include the extension options in new leases to provide operational flexibility. The extension options held are exercisable only by the Group and not
by the lessors. The Group assesses at lease commencement date whether it is reasonably certain to exercise the extension options. The Group reassesses whether it
is reasonably certain to exercise the options if there is a significant event or significant changes in circumstances within its control.
B. Leases as lessor
The Group leases out its investment property. The Group has classified these leases as operating leases, because they do not transfer substantially all of the risks
and rewards incidental to the ownership of the assets.
Rental income recognised by the Group during the period was $161,026 (2019: $168,683).

Notes to the Financial Statements
Page 39
13. NON-CURRENT ASSETS - INVESTMENT PROPERTIES
Consolidated
Freehold
land
Freehold
buildings Total
$ $ $
Year ended 30 June 2020
Opening net book amount 2,207,021 - 2,207,021
Depreciation - - -
Closing net book amount 2,207,021 - 2,207,021
At 30 June 2020
Cost 2,207,021 200,000 2,407,021
Accumulated depreciation - (200,000) (200,000)
Net book amount 2,207,021 - 2,207,021
(a) Valuations
Investment freehold land and buildings were recorded at cost (net of prior impairments) at 30 June 2020 at $2,207,021, which approximates fair value (2019 -
$2,207,021). The basis of the valuation for impairment testing purposes of investment properties is fair value being the amounts for which the properties could be
exchanged between willing parties in an arm’s length transaction, based on current prices in an active market for similar properties in the same location and
condition and subject to similar leases.
(b) Contractual obligations
There are no contractual obligations to purchase, construct or develop investment property or for repairs, maintenance or enhancements.
(c) Leasing arrangements
Policy applicable before 1 July 2019 The Group has investment properties that are leased to tenants on monthly operating leases or fixed terms not exceeding five years.
Commitments in relation to these leases that are contracted for at reporting date but not recognised as assets are: a) receivable within one year - $15,240 (2019
- $58,794); b) receivable later than one year but not later than five years - $nil (2019 - $14,698).
14. NON-CURRENT ASSETS - INTANGIBLE ASSETS
Consolidated Goodwill Trade names
Customer
relationships
Security
lines Software Consolidated Total
At 1 July 2018 $ $ $ $ $ $
Cost 26,461,029 3,221,391 9,178,756 1,520,820 2,106,907 42,488,903
Accumulated amortisation - (1,191,142) (4,081,043) (1,483,327) (1,144,644) (7,900,156)
Net book amount 26,461,029 2,030,249 5,097,713 37,493 962,263 34,588,747
Year ended 30 June 2019
Opening net book amount 26,461,029 2,030,249 5,097,713 37,493 962,263 34,588,747
Purchase of business (refer note 32) - 505,523 - - - 505,523
Additions - - - 5,272 490,189 495,461
Amortisation charge - (487,074) (815,330) (14,410) (224,077) (1,540,891)
Closing net book amount 26,461,029 2,048,698 4,282,383 28,355 1,228,375 34,048,840
At 30 June 2019
Cost 26,461,029 3,726,914 9,178,756 1,526,092 2,553,746 43,446,537
Accumulated amortisation - (1,678,216) (4,896,373) (1,497,737) (1,325,371) (9,397,697)
Net book amount 26,461,029 2,048,698 4,282,383 28,355 1,228,375 34,048,840
Year ended 30 June 2020
Opening net book amount 26,461,029 2,048,698 4,282,383 28,355 1,228,375 34,048,840
Additions - - - 71,575 886,150 957,725
Amortisation charge - (465,456) (805,330) (15,855) (922,512) (2,209,153)
Closing net book amount 26,461,029 1,583,242 3,477,053 84,075 1,192,013 32,797,412
At 30 June 2020
Cost 26,461,029 3,726,914 9,178,756 1,597,667 2,812,041 43,776,407
Accumulated amortisation - (2,143,672) (5,701,703) (1,513,592) (1,620,028) (10,978,995)
Net book amount 26,461,029 1,583,242 3,477,053 84,075 1,192,013 32,797,412
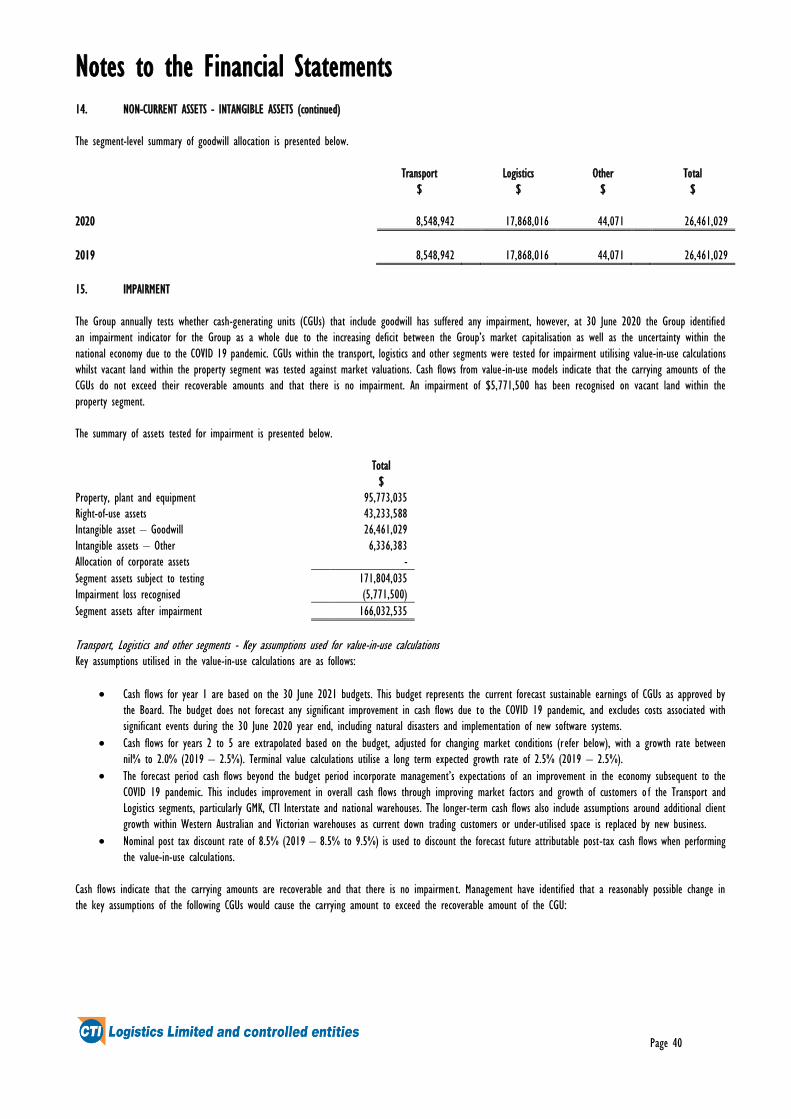
Notes to the Financial Statements
Page 40
14. NON-CURRENT ASSETS - INTANGIBLE ASSETS (continued)
The segment-level summary of goodwill allocation is presented below.
Transport Logistics Other Total
$ $ $ $
2020 8,548,942 17,868,016 44,071 26,461,029
2019 8,548,942 17,868,016 44,071 26,461,029
15. IMPAIRMENT
The Group annually tests whether cash-generating units (CGUs) that include goodwill has suffered any impairment, however, at 30 June 2020 the Group identified
an impairment indicator for the Group as a whole due to the increasing deficit between the Group’s market capitalisation as well as the uncertainty within the
national economy due to the COVID 19 pandemic. CGUs within the transport, logistics and other segments were tested for impairment utilising value-in-use calculations
whilst vacant land within the property segment was tested against market valuations. Cash flows from value-in-use models indicate that the carrying amounts of the
CGUs do not exceed their recoverable amounts and that there is no impairment. An impairment of $5,771,500 has been recognised on vacant land within the
property segment.
The summary of assets tested for impairment is presented below.
Total
$
Property, plant and equipment 95,773,035
Right-of-use assets 43,233,588
Intangible asset – Goodwill 26,461,029
Intangible assets – Other 6,336,383
Allocation of corporate assets -
Segment assets subject to testing 171,804,035
Impairment loss recognised (5,771,500)
Segment assets after impairment 166,032,535
Transport, Logistics and other segments - Key assumptions used for value-in-use calculations Key assumptions utilised in the value-in-use calculations are as follows:
• Cash flows for year 1 are based on the 30 June 2021 budgets. This budget represents the current forecast sustainable earnings of CGUs as approved by
the Board. The budget does not forecast any significant improvement in cash flows due to the COVID 19 pandemic, and excludes costs associated with
significant events during the 30 June 2020 year end, including natural disasters and implementation of new software systems.
• Cash flows for years 2 to 5 are extrapolated based on the budget, adjusted for changing market conditions (refer below), with a growth rate between
nil% to 2.0% (2019 – 2.5%). Terminal value calculations utilise a long term expected growth rate of 2.5% (2019 – 2.5%).
• The forecast period cash flows beyond the budget period incorporate management’s expectations of an improvement in the economy subsequent to the
COVID 19 pandemic. This includes improvement in overall cash flows through improving market factors and growth of customers o f the Transport and
Logistics segments, particularly GMK, CTI Interstate and national warehouses. The longer-term cash flows also include assumptions around additional client
growth within Western Australian and Victorian warehouses as current down trading customers or under-utilised space is replaced by new business.
• Nominal post tax discount rate of 8.5% (2019 – 8.5% to 9.5%) is used to discount the forecast future attributable post-tax cash flows when performing
the value-in-use calculations.
Cash flows indicate that the carrying amounts are recoverable and that there is no impairment. Management have identified that a reasonably possible change in
the key assumptions of the following CGUs would cause the carrying amount to exceed the recoverable amount of the CGU:

Notes to the Financial Statements
Page 41
15. IMPAIRMENT (continued)
Value-in-use
recoverable amount
Carrying amount of
assets
Headroom
$ $ $
Transport – CTI Interstate 15,678,723 15,627,743 50,980
Logistics – Western Australian warehouses 53,000,017 47,808,351 5,191,666
Logistics – Victorian warehouse 3,460,602 2,598,412 862,190
Management have determined that reasonably possible changes associated with these CGUs are a 1% increase in the discount rate, 7.5% reduction in EBITDA margins
or achieving only 70% of forecast improvements in underlying cash flows associated with economic normalisation or customer growth. The below shows the potential
impairment associated with each of these sensitivities in isolation. Should a combination of these sensitivities occur in the same manner the potential impairment
could be larger.
Increased discount
rate
Reduction in EBITDA
Margin
Cash flow
improvements not
achieved
$ $ $
Potential impairment to CGU
Transport – CTI Interstate (1,653,837) (2,176,519) (1,029,161)
Logistics – Western Australian warehouses (352,174) (910,223) -
Logistics – Victorian warehouse - (147,810) (445,493)
Management have determined that there are no other reasonably possible changes that could result in material impairments to o ther CGUs, however management
recognise the uncertainty associated with the national economy due to the COVID 19 pandemic which could result in a significant worsening of the Group’s
performance should there be a material change in the national economy. These outcomes have not been reflected in management’s assessment.
Property segment – fair value less cost to dispose An independent valuation of the three vacant blocks of land at Hazelmere within the property segment was performed at 30 June 2020. The valuation was based
on a price per square metre through comparison to similar sales of land in a comparable area and is considered to be a level 3 valuation in accordance with
Accounting Standards. This valuation indicated a combined value of $23,300,000, after adjusting for expected selling costs, the Group has recognised an impairment
of $5,771,500 at 30 June 2020.
The independent valuation of property as at 30 June 2020 has noted the heightened risk of material market movements as a result of the COVID-19 environment,
which is expected to continue into the foreseeable future. As such there remains inherent uncertainty surrounding the impact that the COVID-19 pandemic will have
on the fair value of property in future periods. Management will continue to monitor movements in valuations.
Other property that is held within the Property segment is expected to be recovered through value-in-use as the property is utilised within the underlying operations
of the business. No impairment has been recognised in relation to other property.
16. CURRENT LIABILITIES - TRADE AND OTHER PAYABLES
Consolidated
2020 2019
$ $
Trade payables 8,551,039 8,809,391
Other payables 8,981,207 12,885,546
17,532,246 21,694,937
17. CURRENT LIABILITIES – LEASE LIABILITIES AND LOANS AND BORROWINGS
Lease liabilities 14,915,331 2,209,975

Notes to the Financial Statements
Page 42
18. NON-CURRENT LIABILITIES – LEASE LIABILITIES AND LOANS AND BORROWINGS
Consolidated
2020 2019
$ $
Bank loans 42,770,000 44,300,000
Lease liabilities 44,157,058 2,060,156
Total non-current interest-bearing borrowings 86,927,058 46,360,156
(a) Total secured liabilities
The total secured liabilities (current and non-current) are as follows:
Secured Bank loans 42,770,000 44,300,000
Lease liabilities* 5,652,010 4,270,131
Total secured liabilities 48,422,010 48,570,131
*Represents hire purchase liabilities included within the lease liabilities balance.
(b) Assets pledged as security
Bank overdrafts and bank loans are secured by mortgages over the Group’s freehold land and buildings, investment properties and fixed and floating charges over
the remaining Group assets.
Hire purchase liabilities are effectively secured as the rights to the assets recognised in the financial statements revert to the financier in the event of default.
The carrying amounts of assets pledged as security for current and non-current interest-bearing liabilities are:
Consolidated
2020 2019
Current $ $
Floating charge
Cash and cash equivalents 7,611,064 2,186,341
Receivables 28,277,807 29,327,868
Inventories 165,359 134,345
Total current assets pledged as security 36,054,230 31,648,554
First mortgage
Freehold land and buildings 37,870,973 38,677,487
Floating charge
Other investments 44,144 70,980
Plant, equipment and motor vehicles 24,650,186 26,418,643
Freehold land and buildings 27,485,500 32,935,511
Investment properties 2,207,021 2,207,021
Intangible assets 1,276,088 1,256,730
55,662,939 62,888,885
Total non-current assets pledged as security 93,533,912 99,566,372
Total assets pledged as security 129,588,142 131,214,926
(c) Financing arrangements
Unrestricted access was available at balance date to the following lines of credit:
Credit standby arrangements Total facilities
Secured financial guarantee and documentary credit 1,883,000 1,708,000
Secured bill acceptance facility 48,770,000 54,315,000
50,653,000 56,023,000
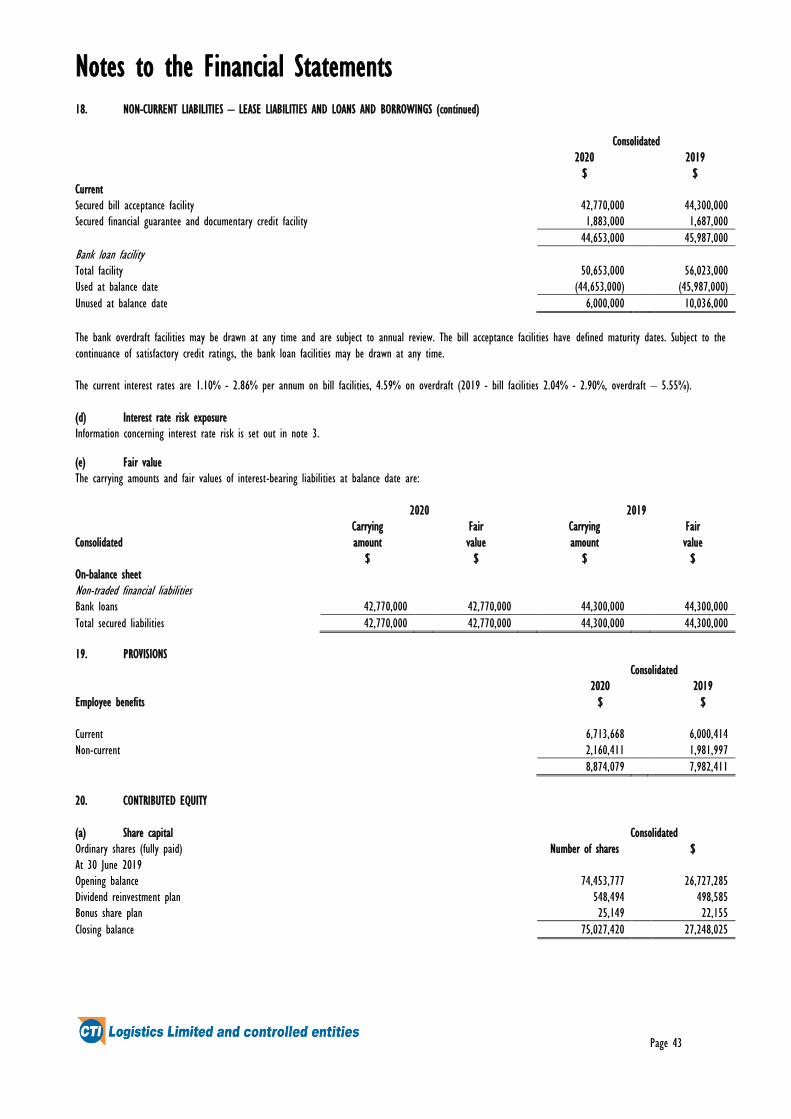
Notes to the Financial Statements
Page 43
18. NON-CURRENT LIABILITIES – LEASE LIABILITIES AND LOANS AND BORROWINGS (continued)
Consolidated
2020 2019
$ $
Current
Secured bill acceptance facility 42,770,000 44,300,000
Secured financial guarantee and documentary credit facility 1,883,000 1,687,000
44,653,000 45,987,000
Bank loan facility Total facility 50,653,000 56,023,000
Used at balance date (44,653,000) (45,987,000)
Unused at balance date 6,000,000 10,036,000
The bank overdraft facilities may be drawn at any time and are subject to annual review. The bill acceptance facilities have defined maturity dates. Subject to the
continuance of satisfactory credit ratings, the bank loan facilities may be drawn at any time.
The current interest rates are 1.10% - 2.86% per annum on bill facilities, 4.59% on overdraft (2019 - bill facilities 2.04% - 2.90%, overdraft – 5.55%).
(d) Interest rate risk exposure
Information concerning interest rate risk is set out in note 3.
(e) Fair value
The carrying amounts and fair values of interest-bearing liabilities at balance date are:
2020 2019
Carrying Fair Carrying Fair
Consolidated amount value amount value
$ $ $ $
On-balance sheet
Non-traded financial liabilities Bank loans 42,770,000 42,770,000 44,300,000 44,300,000
Total secured liabilities 42,770,000 42,770,000 44,300,000 44,300,000
19. PROVISIONS
Consolidated
2020 2019
Employee benefits $ $
Current 6,713,668 6,000,414
Non-current 2,160,411 1,981,997
8,874,079 7,982,411
20. CONTRIBUTED EQUITY
(a) Share capital Consolidated
Ordinary shares (fully paid) Number of shares $
At 30 June 2019
Opening balance 74,453,777 26,727,285
Dividend reinvestment plan 548,494 498,585
Bonus share plan 25,149 22,155
Closing balance 75,027,420 27,248,025

Notes to the Financial Statements
Page 44
20. CONTRIBUTED EQUITY (continued)
Consolidated
Number of shares $
At 30 June 2020
Opening balance 75,027,420 27,248,025
Closing balance 75,027,420 27,248,025
At 30 June 2020 there were 2,685,000 contingently issuable shares (2019 – 2,685,000) relating to shares issued under the Company’s Employee Share Plan. During
the year no contingently issuable shares were issued to any employees under the Company’s Employee Share Plan (2019 - nil).
(b) Ordinary shares
All ordinary shares are fully paid and entitle the holder to participate in dividends and the proceeds on winding up of the Company in proportion to the number
of shares held. On a show of hands every holder of ordinary shares present at a meeting in person or by proxy, is entitled to one vote, and upon a poll each
share is entitled to one vote.
21. RESERVES AND RETAINED PROFITS
Consolidated
2020 2019
$ $
(a) Reserves
Fair value reserve (2,629) (4,935)
Share-based payment reserve 1,929,107 1,898,110
1,926,478 1,893,175
Fair value reserve Balance 1 July (4,935) (20.565)
Revaluation, net of tax 2,306 15,630
Balance 30 June (2,629) (4,935)
Share-based payment reserve Balance 1 July 1,898,110 1,799,098
Share-based payment transactions 30,997 99,012
Balance 30 June 1,929,107 1,898,110
(b) Retained profits
Movements Balance 1 July 61,156,276 63,354,100
Adoption of AASB 16, net of tax (4,367,755) -
Restated at 1 July 2019 56,788,521 63,354,100
Profit/(loss) for the year (4,348,839) 788,074
Dividends - (2,985,898)
52,439,682 61,156,276
(c) Nature and purpose of reserves
Fair value reserveChanges in the fair value of investments, such as equities, classified as FVOCI, are taken to the fair value reserve, as described in note 1(j).
Share-based payment reserve The share-based payment reserve comprises the expenses incurred from the issue of the Company’s shares under the Employee Share Plan. Refer to note 31 and
note 1(r).

Notes to the Financial Statements
Page 45
22. DIVIDENDS
Parent Entity
2020 2019
$ $
Ordinary shares
Final dividend for the year ended 30 June 2019 of nil cents (2018 – 2.0 cents) per fully paid share
Fully franked dividend based on tax paid @ 30% (2019 - 30%) - 1,489,076
Less – bonus issue of ordinary shares under the Company’s Bonus Share Plan. - (11,199)
- 1,477,877
22. DIVIDENDS (continued)
Parent Entity
2020 2019
$ $
Interim dividend for the year ended 30 June 2020 of nil cents (2019 – 2.0 cents) per fully paid share
Fully franked dividend based on tax paid @ 30% (2019 - 30%) - 1,496,822
Less – bonus issue of ordinary shares under the Company’s Bonus Share Plan. - (10,956)
- 1,485,866
No final dividend has been declared after balance sheet date (2019 – nil cents).
Franked dividends
Franking credits available at 30 June 2020 for subsequent financial years based on a tax rate of 30% - $21,855,582 (2019 - $21,130,229 - 30%).
23. RELATED PARTIES
(a) Parent entity
CTI Logistics Limited is the ultimate Australian parent entity of the Group and head entity of the tax consolidated Group.
(b) Transactions with key management personnel
Key management personnel compensation Consolidated
2020 2019
$ $
Key management personnel compensation comprised the following:
Short-term 1,624,815 1,592,055
Post-employment 74,880 76,463
1,699,695 1,668,518
24. REMUNERATION OF AUDITORS
During the year the following fees were paid or payable for services provided by the auditor
of the parent entity, its related practices and non-related audit firms:
Audit services
KPMG Australia
Audit and review of financial reports 177,280 167,000
25. COMMITMENTS
Capital commitments
Capital expenditure contracted for at the reporting date but not recognised as liabilities:
Property, plant and equipment
Payable within one year - 329,319

Notes to the Financial Statements
Page 46
26. SUBSIDIARIES
All subsidiaries are incorporated in Australia.
The consolidated financial statements incorporate the assets, liabilities and results of the following subsidiaries in accordance with the accounting policy described in
note 1(b):
Country of
Incorporation
Equity holding
(Ordinary shares)
Name of entity 2020
%
2019
%
CTI Logistics Limited Australia
Directly controlled by CTI Logistics Limited
Controlled entities
Bring Transport Industries Pty Ltd Australia 100 100
Mercury Messengers Pty Ltd Australia 100 100
CTI Security Services Pty Ltd Australia 100 100
CTI Transport Systems Pty Ltd Australia 100 100
CTI Taxi Trucks Pty Ltd Australia 100 100
CTI Security Systems Pty Ltd Australia 100 100
CTI Transport Services Pty Ltd Australia 100 100
CTI Freight Management Pty Ltd Australia 100 100
Action Logistics (WA) Pty Ltd Australia 100 100
CTI Freight Systems Pty Ltd Australia 100 100
CTI Couriers Pty Ltd Australia 100 100
CTI Swinglift Services Pty Ltd Australia 100 100
CTI Xpress Systems Pty Ltd Australia 100 100
CTI Nationwide Logistics Pty Ltd Australia 100 100
Consolidated Transport Industries Pty Ltd Australia 100 100
CTI Logistics (NSW) Pty Ltd Australia 100 100
Other controlled entities
Directly controlled by CTI Nationwide Logistics Pty Ltd
Lafe (WA) Pty Ltd Australia 100 100
CTI Freightlines Pty Ltd Australia 100 100
Blackwood Industries Pty Ltd Australia 100 100
Australian Fulfilment Services Pty Ltd Australia 100 100
Directly controlled by Blackwood Industries Pty Ltd
CTI Logistics (Vic) Pty Ltd Australia 100 100
CTI Online Pty Ltd Australia 100 100
CTI Records Management Pty Ltd Australia 100 100
CTI Quarantine & Fumigation Services Pty Ltd Australia 100 100
Directly controlled by Consolidated Transport Industries Pty Ltd
Foxline Logistics Pty Ltd Australia 100 100
Directly controlled by CTI Logistics (NSW) Pty Ltd
G.M. Kane & Sons Pty Ltd Australia 100 100
These subsidiaries have been granted relief from the necessity to prepare financial reports in accordance with Class Order 2016/785 issued by the Australian Securities
and Investments Commission. For further information refer to note 27.
27. DEED OF CROSS GUARANTEE
CTI Logistics Limited and its wholly-owned entities are parties to a deed of cross guarantee under which each company guarantees the debts of the others. By
entering into the deed, the wholly-owned entities have been relieved from the requirement to prepare a financial report and directors’ report under Class Order
2016/785 issued by the Australian Securities and Investments Commission. The above companies represent a ‘Closed Group’ for the purposes of the Class Order, and
as there are no other parties to the Deed of Cross Guarantee, they also represent the Extended Closed Group.
The consolidated results of the Company and all the parties to the Deed are the same as the consolidated results of the Group

Notes to the Financial Statements
Page 47
28. RECONCILIATION OF PROFIT AFTER INCOME TAX TO NET CASH INFLOW FROM OPERATING ACTIVITIES
Consolidated
2020 2019
$ $
Profit/(loss) for the year (4,348,839) 788,074
Depreciation and amortisation 21,817,627 9,032,827
Impairment 5,771,500 -
Provision for doubtful debts 194,918 83,823
Net gain on sale of non-current assets (194,406) (382,637)
Share-based payment expense 30,997 99,012
Additional expense for acquisition of Jayde - 2,340,000
Change in operating assets and liabilities
Decrease/(increase) in trade and other debtors 1,001,739 (473,955)
Decrease/(increase) in inventories (31,014) 27,281
Increase/(decrease) in provision for income taxes 642,031 (1,070,896)
Increase/(decrease) in deferred tax 3,435,877 (687,437)
(Decrease)/Increase in trade creditors, employee benefits and other provisions (4,988,281) 67,653
Net cash inflow from operating activities 23,332,149 9,823,745
29. EARNINGS PER SHARE
Consolidated
2020
2019
(a) Basic earnings per share Cents per share
Basic earnings/(loss) per share attributable to the ordinary equity holders of the Company. (5.79) 1.05
$ $
Profit/(loss) attributable to ordinary shareholders used in calculating basic earnings per share. (4,348,839) 788,074
Number Number
Weighted average number of ordinary shares used as the denominator in calculating basic earnings
per share. 75,027,420 74,732,946
2020
2019
(b) Diluted earnings/(loss) per share Cents per share
Diluted earnings/(loss) per share attributable to the ordinary equity holders of the Company. (5.79) 1.05
$ $
Profit/(loss) attributable to ordinary shareholders used in calculating diluted earnings per share. (4,348,839) 788,074
2020 2019
Number Number
Weighted average number of ordinary shares used as the denominator in calculating diluted earnings per share.
Weighted average number of shares (basic) 75,027,420 74,732,946
The effect of the vesting of contingently issuable shares - 37,673
Weighted average number of shares (diluted) 75,027,420 74,770,619
The average market value of the Company’s shares for the purposes of calculating the dilutive effect of the vesting of contingently issuable shares was based on
quoted market prices for the period during which the contingently issuable shares were outstanding.
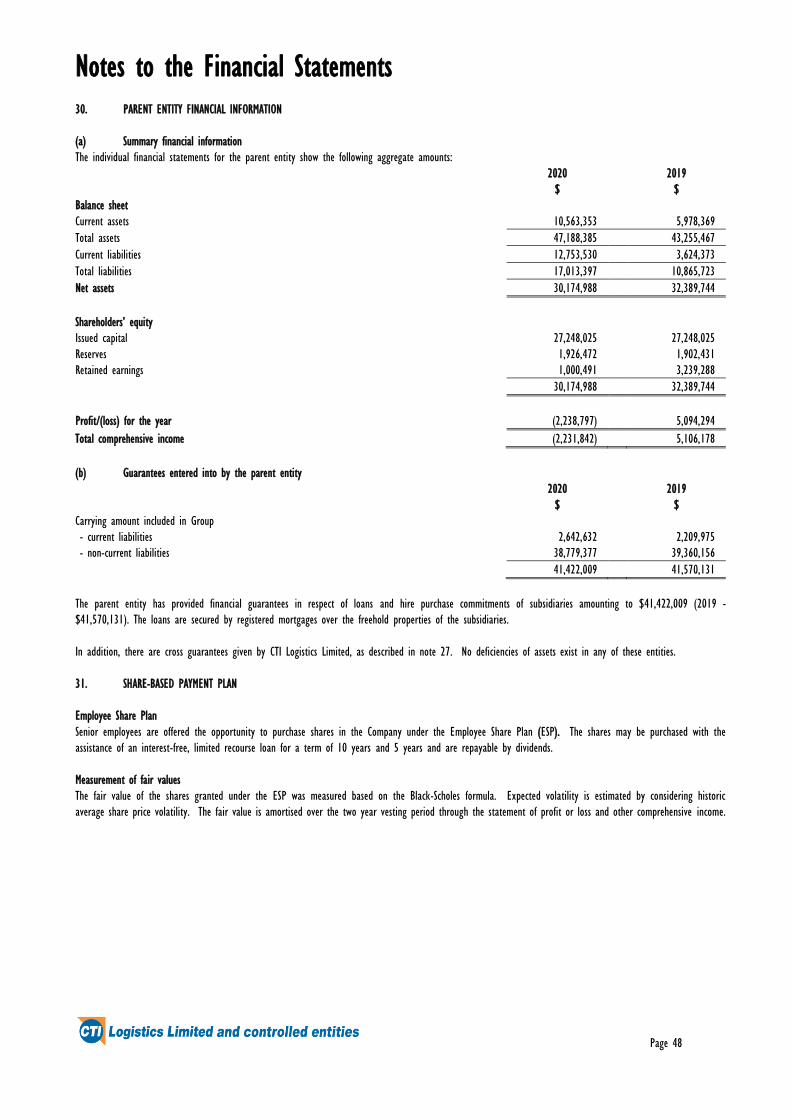
Notes to the Financial Statements
Page 48
30. PARENT ENTITY FINANCIAL INFORMATION
(a) Summary financial information
The individual financial statements for the parent entity show the following aggregate amounts:
2020 2019
$ $
Balance sheet
Current assets 10,563,353 5,978,369
Total assets 47,188,385 43,255,467
Current liabilities 12,753,530 3,624,373
Total liabilities 17,013,397 10,865,723
Net assets 30,174,988 32,389,744
Shareholders’ equity
Issued capital 27,248,025 27,248,025
Reserves 1,926,472 1,902,431
Retained earnings 1,000,491 3,239,288
30,174,988 32,389,744
Profit/(loss) for the year (2,238,797) 5,094,294
Total comprehensive income (2,231,842) 5,106,178
(b) Guarantees entered into by the parent entity
2020 2019
$ $
Carrying amount included in Group
- current liabilities 2,642,632 2,209,975
- non-current liabilities 38,779,377 39,360,156
41,422,009 41,570,131
The parent entity has provided financial guarantees in respect of loans and hire purchase commitments of subsidiaries amounting to $41,422,009 (2019 -
$41,570,131). The loans are secured by registered mortgages over the freehold properties of the subsidiaries.
In addition, there are cross guarantees given by CTI Logistics Limited, as described in note 27. No deficiencies of assets exist in any of these entities.
31. SHARE-BASED PAYMENT PLAN
Employee Share Plan
Senior employees are offered the opportunity to purchase shares in the Company under the Employee Share Plan (ESP). The shares may be purchased with the
assistance of an interest-free, limited recourse loan for a term of 10 years and 5 years and are repayable by dividends.
Measurement of fair values
The fair value of the shares granted under the ESP was measured based on the Black-Scholes formula. Expected volatility is estimated by considering historic
average share price volatility. The fair value is amortised over the two year vesting period through the statement of profit or loss and other comprehensive income.
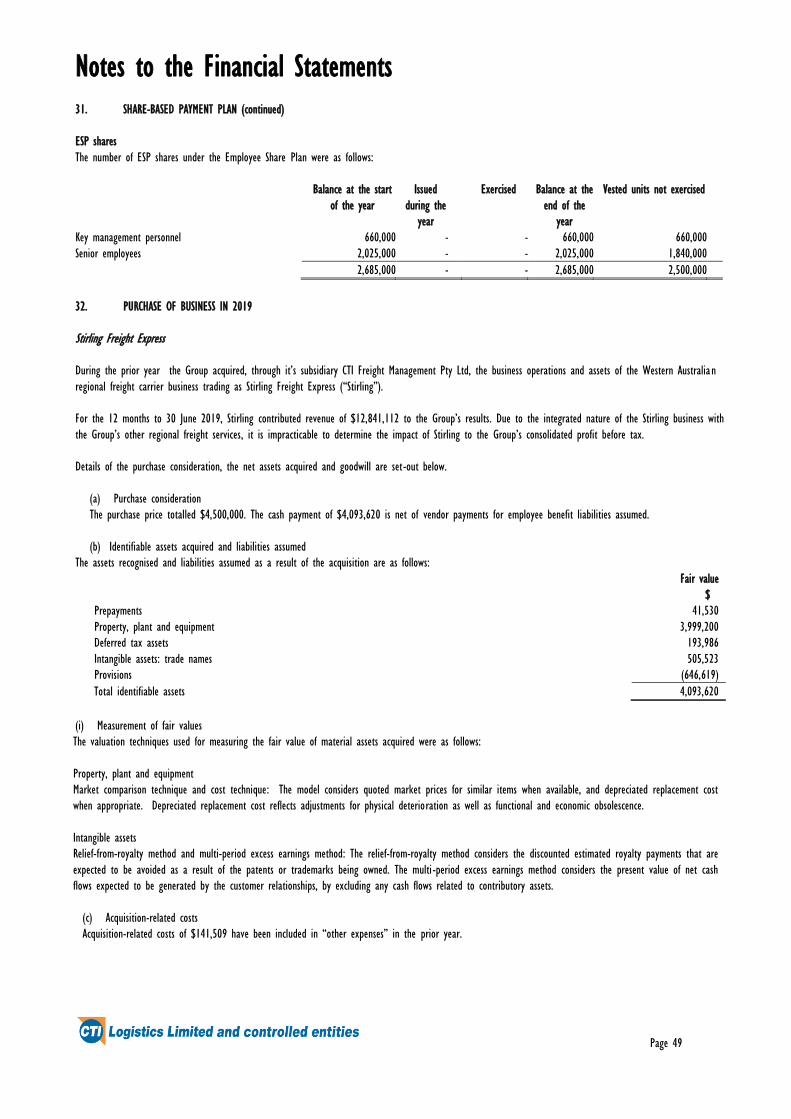
Notes to the Financial Statements
Page 49
31. SHARE-BASED PAYMENT PLAN (continued)
ESP shares
The number of ESP shares under the Employee Share Plan were as follows:
Balance at the start
of the year
Issued
during the
year
Exercised
Balance at the
end of the
year
Vested units not exercised
Key management personnel 660,000 - - 660,000 660,000
Senior employees 2,025,000 - - 2,025,000 1,840,000
2,685,000 - - 2,685,000 2,500,000
32. PURCHASE OF BUSINESS IN 2019
Stirling Freight Express During the prior year the Group acquired, through it’s subsidiary CTI Freight Management Pty Ltd, the business operations and assets of the Western Australian
regional freight carrier business trading as Stirling Freight Express (“Stirling”).
For the 12 months to 30 June 2019, Stirling contributed revenue of $12,841,112 to the Group’s results. Due to the integrated nature of the Stirling business with
the Group’s other regional freight services, it is impracticable to determine the impact of Stirling to the Group’s consolidated profit before tax.
Details of the purchase consideration, the net assets acquired and goodwill are set-out below.
(a) Purchase consideration
The purchase price totalled $4,500,000. The cash payment of $4,093,620 is net of vendor payments for employee benefit liabilities assumed.
(b) Identifiable assets acquired and liabilities assumed
The assets recognised and liabilities assumed as a result of the acquisition are as follows:
Fair value
$
Prepayments 41,530
Property, plant and equipment 3,999,200
Deferred tax assets 193,986
Intangible assets: trade names 505,523
Provisions (646,619)
Total identifiable assets 4,093,620
(i) Measurement of fair values
The valuation techniques used for measuring the fair value of material assets acquired were as follows:
Property, plant and equipment
Market comparison technique and cost technique: The model considers quoted market prices for similar items when available, and depreciated replacement cost
when appropriate. Depreciated replacement cost reflects adjustments for physical deterioration as well as functional and economic obsolescence.
Intangible assets
Relief-from-royalty method and multi-period excess earnings method: The relief-from-royalty method considers the discounted estimated royalty payments that are
expected to be avoided as a result of the patents or trademarks being owned. The multi-period excess earnings method considers the present value of net cash
flows expected to be generated by the customer relationships, by excluding any cash flows related to contributory assets.
(c) Acquisition-related costs
Acquisition-related costs of $141,509 have been included in “other expenses” in the prior year.

Notes to the Financial Statements
Page 50
33. EVENTS OCCURRING AFTER THE BALANCE SHEET DATE
There are no other events since the end of the financial year that provide additional evidence of conditions that existed at the end of the financial year or that
reveal for the first time a condition that existed at the end of the financial year.

Page 51
Directors’ Declaration
In the opinion of the directors of CTI Logistics Limited (‘the Company’):
(a) the consolidated financial statements and notes that are set out on pages 14 to 50 and the remuneration report on pages 7 to 8 in the Directors’ Report, are in
accordance with the Corporations Act 2001, including:
(i) giving a true and fair view of the Group’s financial position as at 30 June 2020 and of its performance, for the financial year ended on that date; and
(ii) complying with Australian Accounting Standards and the Corporations Regulations 2001; and
(b) there are reasonable grounds to believe that the Company will be able to pay its debts as and when they become due and payable.
There are reasonable grounds to believe that the Company and the Group entities identified in note 26 will be able to meet any obligations or liabilities to which they
are or may become subject to by virtue of the Deed of Cross Guarantee between the Company and those Group entities pursuant to ASIC Class Order 2016/785.
Note 1(a) confirms that the financial statements also comply with International Financial Reporting Standards as issued by the International Accounting Standards Board.
The directors have been given the declarations by the chief executive officer and chief financial officer required by section 295A of the Corporations Act 2001.
This declaration is made in accordance with a resolution of the directors.
DAVID WATSON
Director
Perth, WA
31 August 2020

KPMG, an Australian partnership and a member firm of the KPMG network of independent member firms affiliated with KPMG International Cooperative (“KPMG International”), a Swiss entity.
Liability limited by a scheme approved under Professional Standards Legislation.
Independent Auditor’s Report
To the shareholders of CTI Logistics Limited
Report on the audit of the Financial Report
Opinion
We have audited the Financial Report of CTI Logistics Limited (the Company).
In our opinion, the accompanying Financial Report of the Company is in accordance with the Corporations Act 2001, including:
• Giving a true and fair view of the Group's financial position as at 30 June 2020 and of its financial performance for the year ended on that date; and
• Complying with Australian Accounting Standards and the Corporations Regulations 2001.
The Financial Report comprises the:
• Consolidated statement of financial position as at 30 June 2020.
• Consolidated statement of profit or loss and other comprehensive income, Consolidated statement of changes in equity, and Consolidated statement of cash flows for the year then ended.
• Notes including a summary of significant accounting policies.
• Directors' Declaration.
The Group consists of CTI Logistics Limited (the Company) and the entities it controlled at the year end or from time to time during the financial year.
Basis for opinion
We conducted our audit in accordance with Australian Auditing Standards. We believe that the audit evidence we have obtained is sufficient and appropriate to provide a basis for our opinion.
Our responsibilities under those standards are further described in the Auditor’s responsibilities for the audit of the Financial Report section of our report.
We are independent of the Group in accordance with the Corporations Act 2001 and the ethical requirements of the Accounting Professional and Ethical Standards Board’s APES 110 Code of Ethics for Professional Accountants (including Independence Standards) (the Code) that are relevant to our audit of the Financial Report in Australia. We have fulfilled our other ethical responsibilities in accordance with the Code.
Key Audit Matters
Key Audit Matters are those matters that, in our professional judgement, were of most significance in our audit of the Financial Report of the current period.
This matter was addressed in the context of our audit of the Financial Report as a whole, and in forming our opinion thereon, and we do not provide a separate opinion on this matter.

Value of property, plant and equipment, right-of-use assets and intangible assets ($166,032,535)
Refer to Note 15 to the Financial Report
The key audit matter How the matter was addressed in our audit
The carrying value of property, plant and equipment and intangible assets is a key audit matter due to the:
• Size of property, plant and equipment and intangible assets balances which, in aggregate, represent 79% of total assets.
• Group’s market capitalisation was less than the carrying amount of the Group’s net assets at year end. This increases the possibility of property, plant and equipment and intangible assets being impaired and, as a result, increased our audit effort in this area.
• Group’s results have been negatively impacted by the state of the Australian economy, including the impacts of COVID-19, with reductions in activity and increased EBITDA margin pressure. There is uncertainty regarding the continuation of these conditions given the ongoing impact of COVID-19. This further increases the risk of impairment as well as the risk of inaccurate forecasts or a wider range of possible outcomes for us to consider.
• Group’s impairment of vacant land adjacent to one of its operating businesses, based on its fair value less cost of disposal determined through an external valuation.
We focused on the significant forward-looking assumptions the Group applied in its value in use models, including:
• Forecast operating cash flows, EBITDA margins, growth rates and terminal growth rates. In addition to the uncertainties described above, the Group’s value in use models are highly sensitive to small changes in EBITDA margins, discount rate and cash flow improvements associated with new customers and changes to existing customer arrangements, reducing available headroom. This drives additional audit effort specific to their feasibility.
Our procedures included:
• We considered the appropriateness of the value in use method applied by the Group to assess the carrying value of property, plant and equipment and intangible assets against the criteria in the accounting standards.
• We considered the Group’s determination of their CGUs based on our understanding of the operations of the Group’s business, how independent cash flows were generated, and against the requirements of the accounting standards.
• We assessed the accuracy of previous Group forecasts to inform our evaluation of forecasts incorporated in the models. We noted previous trends where the Group’s results have been negatively impacted by the state of the Australian economy, necessitating further sensitivity analysis.
• We considered the sensitivity of the models by varying key assumptions, such as forecast EBITDA margins, discount rate and cash flow improvements associated with new customers and changes to existing customer arrangements, within a reasonably possible range. We did this to identify those CGUs at higher risk of impairment and to focus our further procedures.
• We challenged the Group’s significant forecast cash flows, EBITDA margin and growth assumptions considering the continued downturn in business activity. We compared forecasts to Board approved budgets and we assessed forecast EBITDA margins through comparison to historical performance and agreed pricing arrangements with key customers. We applied increased scepticism where previous forecasts were not achieved, using our knowledge of the challenging economic environment.

• Discount rate – this is complicated in nature and varies according to the conditions and environment the specific Cash Generating Units (CGUs) are subject to from time to time.
The Group also has many operating businesses and service lines necessitating our consideration of the Group’s determination of CGUs, based on their ability to generate independent cash flows.
We involved valuation specialists to supplement our senior audit team members in assessing this key audit matter.
• We compared forecast growth rates and terminal growth rates to published studies of industry trends and expectations, and considered differences for the Group’s operations. We used our knowledge of the Group, its past performance, business and customers, and our industry experience.
• Working with our valuation specialists, we:
– Independently developed a discount rate range considered comparable using publicly available market data for comparable entities.
– Assessed the integrity of the value in use model used, including the accuracy of the underlying calculation formulas.
– Assessed the Group’s analysis of the difference between the market capitalisation and net assets of the Group. We did this by comparing the implicit earnings multiple in the Group’s models to market multiples of comparable entities.
• For the impaired vacant land we recalculated the impairment charge and compared this amount to the impairment expense in the financial statements. We involved property valuation specialists to assess the methodology and significant assumptions used by the Group’s valuation expert and we assessed the expert’s competence, scope and objectivity.
• We assessed the disclosures in the financial report using the results of our testing and against the requirements of the accounting standards.

Other Information
Other Information is financial and non-financial information in CTI Logistics Limited’s annual reporting which is provided in addition to the Financial Report and the Auditor’s Report. The Directors are responsible for the Other Information.
The Other Information we obtained prior to the date of this Auditor’s Report was the Directors’ Report. The Chairman’s Statement, Corporate Governance Statement and Shareholder Information are expected to be made available to us after the date of the Auditors Report.
Our opinion on the Financial Report does not cover the Other Information and, accordingly, we do not and will not express an audit opinion or any form of assurance conclusion thereon, with the exception of the Remuneration Report and our related assurance opinion.
In connection with our audit of the Financial Report, our responsibility is to read the Other Information. In doing so, we consider whether the Other Information is materially inconsistent with the Financial Report or our knowledge obtained in the audit, or otherwise appears to be materially misstated.
We are required to report if we conclude that there is a material misstatement of this Other Information, and based on the work we have performed on the Other Information that we obtained prior to the date of this Auditor’s Report we have nothing to report.
Responsibilities of the Directors for the Financial Report
The Directors are responsible for:
• Preparing the Financial Report that gives a true and fair view in accordance with Australian Accounting Standards and the Corporations Act 2001.
• Implementing necessary internal control to enable the preparation of a Financial Report that gives a true and fair view and is free from material misstatement, whether due to fraud or error.
• Assessing the Group and Company’s ability to continue as a going concern and whether the use of the going concern basis of accounting is appropriate. This includes disclosing, as applicable, matters related to going concern and using the going concern basis of accounting unless they either intend to liquidate the Group and Company or to cease operations, or have no realistic alternative but to do so.
Auditor’s responsibilities for the audit of the Financial Report
Our objective is:
• To obtain reasonable assurance about whether the Financial Report as a whole is free from material misstatement, whether due to fraud or error; and
• To issue an Auditor’s Report that includes our opinion.
Reasonable assurance is a high level of assurance, but is not a guarantee that an audit conducted in accordance with Australian Auditing Standards will always detect a material misstatement when it exists.
Misstatements can arise from fraud or error. They are considered material if, individually or in the aggregate, they could reasonably be expected to influence the economic decisions of users taken on the basis of the Financial Report.
A further description of our responsibilities for the audit of the Financial Report is located at the Auditing and Assurance Standards Board website at: http://www.auasb.gov.au/auditors_responsibilities/ar1_2020.pdf. This description forms part of our Auditor’s Report.

Report on the Remuneration Report
Opinion
In our opinion, the Remuneration Report of CTI Logistics Limited for the year ended 30 June 2020, complies with Section 300A of the Corporations Act 2001.
Directors’ responsibilities
The Directors of the Company are responsible for the preparation and presentation of the Remuneration Report in accordance with Section 300A of the Corporations Act 2001.
Our responsibilities
We have audited the Remuneration Report included in the Directors’ report for the year ended 30 June 2020.
Our responsibility is to express an opinion on the Remuneration Report, based on our audit conducted in accordance with Australian Auditing Standards.
KPMG Graham Hogg
Partner
Perth
31 August 2020

Corporate Governance Statement
Page 57
The Australian Securities Exchange Corporate Governance Council has published a number of principles and recommendations relating to the direction and management
of companies. These guidelines form a corporate governance framework intended to provide a practical guide for listed companies and their investors.
The Company’s Board of directors (Board) are fully cognisant of the Corporate Governance Principles and Recommendations published by the ASX Corporate Governance
Council (“CGC”) and have adopted those recommendations where they are appropriate to the Company’s circumstances.
Under the Australian Securities Exchange Listing Rules companies are required to provide a statement disclosing the extent to which they have followed all the
recommendations and identify the recommendations that have not been followed and give reasons for not following them.
Role of the Board
Due to the size and structure of the group and the nature of its operations, the three executive directors have a close involvement with the management of the
businesses. A Board Charter has not been formally adopted at this time.
The Board’s primary objective is to oversee the group’s business activities and management for the benefit of all stakeholder s by:
• setting objectives, goals and strategic direction with management with a view to maximising long term shareholder value;
• overseeing the financial position and monitoring the business and financial affairs of the Company;
• establishing corporate governance, ethical, environmental and health and safety standards;
• ensuring significant business risks are identified and appropriately managed;
• monitoring management’s performance and implementation of strategy;
• ensuring appropriate resources are available;
• ensuring the composition of the Board is appropriate, selecting directors for appointment to the Board and reviewing the performance of the Board and
the contribution of individual directors; and
• ensuring the integrity of risk management, internal control, legal compliance and management information systems.
The Board has delegated responsibilities and authorities to management to enable management to conduct the Company’s day to day businesses. Core business
management issues are handled by the Executive Committee which comprises senior managers from within the Company. Matters which are not within these delegations,
such as expenditure and activity approvals which exceed certain parameters, require separate Board approval.
The directors have not entered into letters of appointment with the Company.
Board Composition
The Board comprises four directors including three executive directors. Due to the size of the Company and its operations, and to avoid additional layers of management,
the executive directors are necessarily involved in the day to day operations of the group businesses.
The Board has, and will continue to consider the appointment of additional non-executive directors, including a process for succession. A nomination committee is not
considered necessary at this time given the size and nature of the Company and the relative infrequency of Board changes. However, should the Company appoint a
new director, the Company will perform checks which include a check on a person’s character, experience, education, criminal record and bankruptcy history.
Non-executive director Peter Leonhardt is an independent director.
Due to the executive directors’ individual separate operational functions, the Board is able to effectively review the performance of management and exercise independent
judgement.
The directors have a broad range of qualifications, experience and expertise. External professional advisors are engaged by the Company to supplement the Board’s
skills when required. Details of individual directors are set out in the Annual Report. The role of chairman and chief executive officer is filled by David Watson the
founder of the business, who is also a substantial shareholder. His knowledge, experience and understanding of the businesses comprising the group are considered
essential to perform these roles. The Board considers that no value would be added by separating the roles.
The Board has adopted a formal policy on access to independent professional advice which provides that directors are entitled to seek such advice for the purposes of
the proper performance of their duties. The advice is at the Company’s expense and is made available to all directors.
Company Secretary
The appointment and removal of a company secretary is a matter for decision by the Board. The company secretary is accountable directly to the Board (through the
Chairman) on all matters to do with the proper functioning of the Board. Details of the company secretary are set out in the Annual Report.

Corporate Governance Statement
Page 58
Ethical and Responsible Decision Making
The Company has clarified the ethical behaviour expected of directors and staff, as well as its attitude towards trading in the Company’s securities.
The Company’s business conduct and ethics policy, anti-bribery and anti-corruption policy, code of conduct, and the policy on trading in company securities, are
published on the Company’s web site, www.ctilogistics.com.
Diversity
The Company is committed to diversity and equality in all areas and all levels of its operations. Diversity means those attributes which may differ from person to
person, including gender, age, ethnicity and cultural background.
The Company recognises that the strength of the business is built on the understanding of individual strengths and differences and seeks to respect these. The Company
is committed to providing an inclusive work environment with equal opportunities for all current and prospective employees, customers and suppliers and does not
condone harassment or unlawful discrimination of any kind.
The Company recognises that there are many areas in which people experience discrimination and will continue to work towards an anti -discriminatory environment,
based on open discussions with employees, customers, suppliers and others on perceptions of discrimination and by ensuring that our practices reflect relevant legislation
and good practice.
The Company reports annually to the Workplace Gender Equality Agency (WGEA) and WGEA has confirmed that the Company is compliant with the Workplace Gender
Equality Act 2012 (ACT).
Currently the gender split of the group’s employees is 76% male : 24% female. At management levels the split is 89% male : 11% female. There are no female board
members.
The Company’s diversity policy is published on the Company’s web site www.ctilogistics.com.
Integrity in Financial Reporting
The Company has formed an audit and risk committee consisting of independent director Peter Leonhardt (chair) and executive director Bruce Saxild. Meetings are also
attended by David Mellor (executive director and chief financial officer) and Owen Venter (company secretary). The audit and risk committee has a formal charte r
which has been approved by the Board. The charter is published on the Company’s website, www.ctilogistics.com. The size and composition of the audit and risk
committee is considered to be appropriate for the size and complexity of the Company.
The audit and risk committee reports directly to the Board and has unlimited access to the Company’s external auditors and company employees. The audit and risk
committee meets regularly with the external auditors and reviews all comments and findings from them.
The external auditors meet with the Board at least twice a year to review their audit procedures and findings. It is the poli cy of the external auditors to rotate the
audit partner at 5 yearly intervals. The Board is satisfied with the external auditor’s competence and independence.
In accordance with the Australian Securities Exchange Corporate Governance Council principles and recommendations, the chief executive officer and the chief financial
officer have written to the Board giving assurances as the accuracy and integrity of the Company’s financial statements.
Timely and Balanced Disclosure
The Board is committed to ensuring that all matters which should be disclosed to the market are disclosed in a timely and balanced manner. All matters for disclosure
are vetted and authorised by the Board prior to disclosure.
The Company’s continuous disclosure policy aims to ensure that:
• there is full and timely disclosure of CTI's activities to shareholders, investors and other interested parties (stakeholders ) in accordance with all statutory
obligations;
• all parties have equal access to externally available information about the Company.
The Policy reflects CTI's responsibility to comply with the disclosure requirements of the Australian Securities Exchange (ASX) and is reviewed regularly to reflect any
changes in legislative or regulatory requirements and best practice. The continuous disclosure policy is published on the Company’s website www.ctilogistics.com.
Corporate Governance Statement
Page 59
Rights of Shareholders
The Board encourages direct communication with shareholders.
Shareholders are encouraged to attend general meetings where formal and informal discussions can take place with Board members, senior employees and the external
auditors.
The Company’s external auditors are always invited to attend the Company’s Annual General Meeting and are available to answer shareholders’ queries at that time.
Shareholders may also communicate freely with Board members at any time either directly or via our investor relations email address [email protected].
The Company recognises the importance and value of keeping shareholders fully informed of all matters, in addition to those prescribed by law, which may impact
upon their financial interest in the Company. The Company’s shareholder communication strategy is published on the Company’s website www.ctilogistics.com.
The Company’s website will continue to be developed as a medium to facilitate communication with shareholders.
Risk Recognition and Management
The Board has established policies and procedures to recognise, minimise and manage all aspects of risk affecting the Company . Although in a number of cases these
policies are not formally documented, they are considered appropriate for a company of this size and are reviewed periodicall y.
The Board has overseen with the management of each business unit the drawing up of a risk management plan. Management has submitted reports to the Board on
the areas of risk, the impacts and risk categorisation affecting the business units.
A robust system for identifying, monitoring and mitigating material risk throughout the group has been establis hed and each business unit can access the system on-
line. It is reviewed annually and updated immediately a change is identified.
The audit and risk committee has the ability to review internal financial control procedures.
A risk and disaster management plan covering the Company’s electronic data facilities is in place and is reviewed periodically.
Whilst there is no formal internal audit function, the Company’s chief financial officer performs and delegates certain internal audit procedures on a rotational basis
throughout the year.
The chairman and chief executive officer as well as the chief financial officer sign a letter of representation to the external auditors in relation to the matters contained
in the annual accounts.
The Australian Securities Exchange Corporate Governance Council principles and recommendations recommend that the chief executive officer and the chief financial
officer write to the Board giving assurances regarding risk recognition and management, so that the Board is assured of considering all relevant factors. This was not
considered necessary as the chief executive officer is also the chairman of the Company’s Board and the chief financial officer is also a member of the Company’s
Board.
Enhanced Performance
The Board evaluates the performance of key executives in an annual review process measured against a range of performance criteria determined by the Board.
The current composition of the Board obviates a measurable review of the Board’s performance and the size of the Company does not warrant an independent
assessment.
Board members have access to continuing education within their spheres of operation and the Board encourages directors and staff to embark on continuing professional
development.
Directors have access to all information required to efficiently discharge responsibility and may request additional information from management at any time. Board
meetings are rotated around the Company’s various locations and operational management are invited to attend Board meetings on a regular basis to facilitate
directors’ understanding of operational matters.

Corporate Governance Statement
Page 60
Remuneration
The Company has established a remuneration committee comprising Peter Leonhardt (chair) and David Watson, which is considered appropriate given the size and
nature of the Company. This committee reviews and makes recommendations on remuneration policies for the Company including, in particular, those governing the
directors. Remuneration of directors is periodically benchmarked against similar listed companies.
Although the Company has an Employee Share and Option Plan the Board has the discretion to reward employees via equity based remuneration.
Interests of Stakeholders
The Board acknowledges the legitimate interests of all stakeholders and its legal and other obligations to employees, clients and the community as a whole.
The Company has adopted a code of conduct to provide a set of guiding principles, practices and standards of behaviour which are to be observed by all employees,
contractors and business partners.
The Board encourages all employees to conduct business in a fair and ethical manner and to report any instances where standards may be at risk.

Shareholder Information
Page 61
THE TWENTY LARGEST SHAREHOLDERS AS AT 30 SEPTEMBER 2020
NUMBER OF SHARES PERCENTAGE
David R Watson 18,062,683 23.24
JP Morgan Nominees Australia Limited 9,931,723 12.78
Simon Dirk Kenworthy-Groen 3,906,399 5.03
Parmelia Pty Ltd 3,488,551 4.49
David Watson Nominees Pty Ltd 2,942,489 3.79
Bruce E Saxild and Michelle P Saxild 2,579,302 3.32
DAM Nominees Pty Ltd 2,231,714 2.87
Citicorp Nominees Pty Ltd 2,040,899 2.63
HSBC Custody Nominees (Australia) Limited 2,007,394 2.58
W W Nominees Pty Ltd 1,886,322 2.43
Catherine R Watson 1,823,486 2.35
Dixson Trust Pty Ltd 1,686,633 2.17
Peachtree Pty Ltd 1,134,315 1.46
NCH Pty Ltd 988,378 1.27
Coram Pty Ltd 685,950 0.88
Aberdeen Management Pty Ltd 635,448 0.82
David A Mellor 522,080 0.67
Mr Walter Hall and Mrs Hilary Hall 521,000 0.67
Dewver Pty Ltd 500,000 0.64
HSBC Custody Nominees (Australia) Limited – A/C 2 449,628 0.58
58,024,394 74.6
SUBSTANTIAL SHAREHOLDERS AS AT 30 SEPTEMBER 2020
The Company’s register of substantial shareholders recorded the following information as at 30 September 2020.
NUMBER OF SHARES PERCENTAGE
David R Watson 25,902,933 33.41
Forager Funds Management Pty Ltd 6,435,968 8.53
David A Mellor 4,564,851 6.14
DISTRIBUTION OF EQUITY SECURITIES AS AT 30 SEPTEMBER 2020
(i) Distribution schedule of holdings NUMBER OF SHAREHOLDERS
ORDINARY SHARES
1 - 1,000 143
1,001 - 5000 297
5,001 - 10,000 159
10,001 - 100,000 292
100,001 and over 70
961
(ii) There were 110 shareholders holding less than a marketable parcel of ordinary shares.
(iii) There were a total of 77,712,420 ordinary shares on issue.
VOTING RIGHTS
Ordinary shares carry voting rights of one vote per share.