
Acknowledgements - duo.uio.no · Acknowledgements First of all, I would like to thank my supervisor...
63
Acknowledgements First of all, I would like to thank my supervisor Göran E. Nilsson for having me as a master student in his group, for his good mood and the many good advices during this master thesis. A special thank you to Stian Ellefsen who has always been helpful and been there to relieve my frustrations - you have been an incredible supervisor! A great thank you to Guro for always smiling and helping me with everything!! You are a fantastic friend who I will miss a lot – I hope we will keep in touch after our time here at the Program for Physiology. Thank you, Kåre-Olav for the many helpful talks and advices. Thanks to the rest of my group for cake-meetings and social happenings, with a special gratitude to Kristine for encouragement and English-skills and to Miriam and Cathrine for helping you in the lab and making me repeat the work I’ve done more than twice! Thank you Finn-Arne Weltzien for reading my thesis and for very helpful feedback. Thanks to Kjell Fugelli for arrangement of seminars and guidance in this process, to Trude, Kjetil, Idorna and Tove for valuable help. A big thank you to everybody in the study room for encouragement and lunch breaks. I’m very grateful for all the social events, support and feedback from everyone at the Program for Physiology – thank you for a memorable time!! Without the support from my family and friends these years would have been so much harder to carry out – thank you! To my wonderful Richard; thank you for all support, motivation and patience. You always see the positive in things and I could not have done this without you. Thank you for being my boyfriend! Oslo, 22.11.2006 Helene Kile Larsen 1
-
Upload
nguyenduong -
Category
Documents
-
view
228 -
download
0
Transcript of Acknowledgements - duo.uio.no · Acknowledgements First of all, I would like to thank my supervisor...

Acknowledgements
First of all, I would like to thank my supervisor Göran E. Nilsson for having me
as a master student in his group, for his good mood and the many good advices during
this master thesis. A special thank you to Stian Ellefsen who has always been helpful and
been there to relieve my frustrations - you have been an incredible supervisor!
A great thank you to Guro for always smiling and helping me with everything!!
You are a fantastic friend who I will miss a lot – I hope we will keep in touch after our
time here at the Program for Physiology. Thank you, Kåre-Olav for the many helpful
talks and advices. Thanks to the rest of my group for cake-meetings and social
happenings, with a special gratitude to Kristine for encouragement and English-skills and
to Miriam and Cathrine for helping you in the lab and making me repeat the work I’ve
done more than twice!
Thank you Finn-Arne Weltzien for reading my thesis and for very helpful
feedback. Thanks to Kjell Fugelli for arrangement of seminars and guidance in this
process, to Trude, Kjetil, Idorna and Tove for valuable help. A big thank you to
everybody in the study room for encouragement and lunch breaks. I’m very grateful for
all the social events, support and feedback from everyone at the Program for Physiology
– thank you for a memorable time!!
Without the support from my family and friends these years would have been so
much harder to carry out – thank you!
To my wonderful Richard; thank you for all support, motivation and patience.
You always see the positive in things and I could not have done this without you. Thank
you for being my boyfriend!
Oslo, 22.11.2006
Helene Kile Larsen
1

Abstract
The crucian carp (Carassius carassius) manage to live without oxygen for months
at low temperatures, and the only way to produce ATP is through the glycolytic pathway,
which yields less than 10% of the ATP formed through aerobic metabolism. There are
two options for compensating for the lowered ATP production efficiency; (1) increase the
rate of ATP production and/or (2) reduce the rate of ATP consumption. An energy saving
decrease of ion permeability (“channel arrest”) is displayed by the red-eared slider turtle
(Trachemys scripta) during anoxia. To examine if a similar strategy is used by the
crucian carp, brain mRNA levels of α-subunits of voltage-gated Na+ and Ca2+ (Nav and
Cav) channels were quantified by real-time RT-PCR after exposure to 1-7 days of anoxia
and anoxia followed by reoxygenation (all at 11°C).
Heat shock proteins (Hsps) are known for protecting cells against detrimental
effects of various stressors, including anoxia. Of the many functions proposed for Hsps,
one is to refold proteins to their functional structure and another is to designate damaged
proteins for degradation. In this thesis brain mRNA levels of Hsp90, Hsp70.1, Hsp70.2,
Hsc70 and Hsp30 were quantified by real-time RT-PCR in crucian carp exposed to
anoxia at two temperatures, 8°C and 13°C.
No changes were found in mRNA levels of the α-subunits of the voltage-gated ion
channels. Thus, the results do not support the “channel-arrest” hypothesis in crucian carp
brain. By contrast, for Hsps a significant increase was found in both Hsp70.1 and
Hsp70.2 mRNA levels at 13°C, while the response of these two paralogs showed
divergent changes at 8°C. During anoxia, a decrease was found in Hsc70 and Hsp90
mRNA at 8°C, while at 13°C a significant decrease was found in Hsc70 and Hsp30
mRNA. These findings support the possibility that the Hsps are involved in the anoxia
response of crucian carp brain, and that temperature has an effect on the regulation of
some Hsps.
2

Table of contents Acknowledgements ........................................................................................................... 1
Abstract.............................................................................................................................. 2
1 Introduction.................................................................................................................... 5 1.1 Anoxia....................................................................................................................... 6
1.1.1 The anoxic disaster ............................................................................................ 6 1.1.2 Surviving anoxia ................................................................................................ 6
1.2 Voltage-gated ion channels....................................................................................... 8 1.2.1 Voltage-gated Na+ channels............................................................................... 9 1.2.2 Voltage-gated Ca2+ channels............................................................................ 10
1.3 Heat shock proteins................................................................................................. 13 1.3.1 Hsp70 ............................................................................................................... 14 1.3.2 Hsp90 ............................................................................................................... 15 1.3.3 Hsp30 ............................................................................................................... 15
1.4 Real-time RT-PCR.................................................................................................. 16
1.5 Aims of the study .................................................................................................... 17
2 Materials and methods ................................................................................................ 18
2.1 Animal handling...................................................................................................... 18 2.1.1 Animals ............................................................................................................ 18 2.1.2 Anoxia exposure and tissue sampling.............................................................. 18
2.2 Isolation of total RNA............................................................................................. 20 2.2.1 Quality check of total RNA ............................................................................. 20
2.3 cDNA synthesis ...................................................................................................... 21
2.4 Partial cloning and sequencing ............................................................................... 21
2.5 Quantification of mRNA expression with real-time RT-PCR................................ 23 2.5.1 Primer design ................................................................................................... 23 2.5.2 Real-time RT-PCR........................................................................................... 24
2.6 Statistical analyzes .................................................................................................. 28
3 Results ........................................................................................................................... 29 3.1 Real-time RT-PCR efficiency calculations............................................................. 29
3.2 Relative mRNA levels of voltage-gated ion channels ............................................ 30
3.3 Relative mRNA levels of heat shock proteins ........................................................ 32
3

4 Discussion...................................................................................................................... 36
4.1 Methodological considerations ............................................................................... 36
4.2 Effect of anoxia on mRNA levels of voltage-gated ion channels........................... 37
4.2.1 Relative mRNA expression of voltage-gated Na+ channels ................................ 38
4.2.2 Relative mRNA expression of voltage-gated Ca2+ channels ............................... 38
4.3 Effect of anoxia and temperature on mRNA levels of Hsps................................... 39
4.4 Conclusions............................................................................................................. 43
Appendices....................................................................................................................... 44 Appendix I .................................................................................................................... 45
Appendix II ................................................................................................................... 46
Appendix III.................................................................................................................. 48
Appendix IV.................................................................................................................. 49
References........................................................................................................................ 53
4

Introduction
1 Introduction
Oxygen depletion (anoxia) is lethal to most vertebrates. However, there are
exceptions and a few species like the crucian carp (Carassius carassius) and the red-
eared slider turtle (Trachemys scripta) manage to cope with the detrimental effects of
anoxia, surviving without oxygen for months at low temperatures (Ultsch, 1985;
Piironen, 1986). During the anoxic state, such animals are completely dependent on
anaerobic ATP production (glycolysis) to meet the energy needs. Glycolytic ATP
production is about 10% less efficient than aerobic ATP production (Hochachka, 1984),
indicating that a lowering of ATP use may be necessary to balance ATP expenditure
during anoxia. In this regard, much attention has been directed towards brain tissue.
Under normal conditions, the vertebrate brain has a high rate of ATP use, most of which
is associated with ion pumping needed to maintain ion gradients across the cell
membrane (Erecinska & Silver, 1989). Hence, by depressing these ion-fluxes the ATP
usage of neurons could be lowered. Such a depression has been shown to occur in brain
tissue of anoxic red-eared sliders where electroencephalogram (EEG) recordings indicate
reduced neuronal activity in anoxic individuals (Fernandes et al., 1997). Moreover, in
anoxic red-eared slider turtles metabolic rate is reduced to 5-10% compared to normoxic
turtles (Buck et al., 1993), indicating a nearly comatose state (Feng et al., 1988; Chih et
al., 1989). Similarly, in crucian carp sensory functions have been demonstrated to be
depressed during anoxia (Johansson et al., 1997), while heat production in brain tissue is
reduced to 60% in response to anoxia (Johansson et al., 1995). The depression of
neuronal activity described in turtles and in crucian carp has for long been hypothesized
to be mediated through a phenomenon termed “channel arrest”, the lowering of ion
permeability of ion channels (Lutz et al., 1985; Hochachka, 1988).
In nature, the anoxia tolerance of both crucian carp and slider turtles have evolved
in response to over-wintering in anoxic conditions at near 0°C under the ice of ponds and
streams. Crucian carp has been demonstrated to move to colder water during hypoxia
(Rausch et al., 2000), a strategy that will suppress the metabolic rate. Furthermore,
studies have shown that anoxia tolerance is increased at low temperatures in both turtle
and fish (Herbert & Jackson, 1985; Ultsch, 1985).
5

Introduction
This thesis aims to investigate the validity of the channel arrest hypothesis in
anoxic crucian carp tissue by looking at the relative mRNA expression of voltage-gated
ion channels using real-time reverse transcriptase polymerase chain reaction (real-time
RT-PCR). Moreover, being exposed to anoxia is a stressor for most organisms, and heat
shock proteins (Hsps) are well-known for having a protective role under cellular stress
(Lindquist & Craig, 1988). Therefore, this thesis also investigates the relative mRNA
expression of Hsps in anoxic brain tissue and in addition, at two different temperatures to
study possible effects of temperature as well.
1.1 Anoxia
1.1.1 The anoxic disaster
In most vertebrates oxygen is needed to make sufficient amounts of ATP to fuel
cellular pathways. Sufficient ATP is especially important for proper function of the
Na+/K+-ATPase, which is responsible for keeping the ion distribution across the cell
membrane and the membrane potential at a steady state. In brain the Na+/K+-ATPase may
spend 50 % of the ATP produced, and the membrane potential is rapidly disturbed when
ATP levels drop (Erecinska & Silver, 1989; Hochachka et al., 1996). This implies that
when oxygen supply is cut off, Na+/K+-ATPase activity will diminish, leading to collapse
of ion gradients and a coinciding depolarization of neurons. A subsequent massive
release of excitatory neurotransmitters results in additional depolarization, leading to an
uncontrolled rise in the intracellular Ca2+ level. Consequently, cellular functions are
disturbed to such a degree that the cell will disintegrate or go into apoptosis (Lutz, 2003)
Thus, lack of oxygen in anoxia-sensitive brains will rapidly lead to cell death (Hansen,
1985; Silver & Erecinska, 1990).
1.1.2 Surviving anoxia
To survive prolonged anoxia, ATP production must balance cellular ATP
demands. Thus, the cells of anoxia-tolerant vertebrates have two options for
6

Introduction
compensating the lowered ATP production efficiency; (1) to increase the rate of ATP
production and/or (2) to reduce the rate of ATP consumption.
The only ATP producing machinery in the absence of oxygen is the glycolytic
pathway, and glycogen must therefore be available throughout the anoxic period.
Glycogen makes up 15 % of the crucian carp liver, and this is the largest glycogen store
of any known vertebrate (Hyvarinen et al., 1985). Also, the glycogen stores in the crucian
carp brain are larger than for other vertebrates study (Schmidt, 1988). Thus, the crucian
carp is capable of keeping ATP production at a respectable level as long as glycogen is
available throughout the anoxic period.
Both the red-eared slider turtle and the crucian carp respond to anoxia through
approximately a doubling of brain blood flow within the first minutes. While this increase
in brain blood flow is sustained in the anoxic crucian carp (Nilsson et al., 1994), it falls
back to almost pre-anoxic levels in the red-eared slider after about one hour of anoxia
(Hylland et al., 1994; Stecyk et al., 2004), which probably correspond to the onset of
deep hypometabolism in the turtle. Another outcome of the anoxic response is increased
extracellular levels of adenosine, which probably is a result of a minor ATP breakdown
(Nilsson, 1992). Adenosine seems to help prevent toxic levels of intracellular Ca2+ and
cellular death in anoxic goldfish (Carassius auratus), another anoxia-tolerant animal that
is a close relative to the crucian carp (Krumschnabel et al., 2000; Lutz & Prentice, 2002;
Lutz & Nilsson, 2004).
To reduce ATP consumption, the metabolic rate of the crucian carp is reduced to
some 60-70 % during anoxia, as indicated by microcalorimetric measurements of heat
production in crucian carp brain slices (Johansson et al., 1995). Moreover, swimming
activity is reduced by 50 % at 9 °C under anoxic conditions (Nilsson, 1993), and sensory
functions like hearing (Suzue et al., 1987) and vision (Johansson et al., 1997) are also
depressed during anoxia.
Glutamate is the main excitatory neurotransmitter in the central nervous system
(CNS) and hence, the glutamate-receptors play a central role in mediating excitatory
synaptic transmission. Recent data suggest that the mRNA levels of glutamate-receptors,
such as the N-methyl-D-aspartate receptor (NMDAR) and the α-amino-5-hydroxy-3-
methyl-4-isoxasole propionic acid receptor (AMPAR) are relatively unaffected by anoxia
7

Introduction
in crucian carp, although a tendency towards a decrease was seen in some of the receptor-
subunits (Ellefsen, 2006). In the case of the freshwater turtle, it has been shown that the
NMDAR number falls in anoxia (Bickler & Buck, 1998).
Levels of gamma-aminobutyric acid (GABA), the main inhibitory
neurotransmitter in the CNS, show an 80-fold increase of normoxic levels in the red-
eared slider turtle (Nilsson & Lutz, 1991), and a 2 fold increase is seen in the crucian carp
after 5 h of anoxia at 10 °C (Hylland & Nilsson, 1999a). Higher levels of GABA may
contribute to a neuronal depression that will reduce ATP use.
Neuronal depression may also be influenced by decreased ion channel permeability
across cell membranes, referred to as “channel arrest” (Hochachka, 1986; Bickler &
Buck, 1998). The “channel arrest” hypothesis proposes that key ion channels, such as
voltage-gated ion channels, may alter gating properties via e.g. conformational changes
or gene expression, to save energy during anoxia. Such an arrest of ion channels could
also function to reduce a toxic increase of intracellular of Ca2+ levels (Bickler & Buck,
1998). However, investigations of a possible “channel arrest” where performed on brain
tissue of anoxic crucian carp, due to ion permeability of Ca2+ and K+, but no detectable
changes in the ion permeability were found (Johansson & Nilsson, 1995; Thorén, 2000).
Yet, reduced ion permeability of voltage-gated Na+ and Ca2+ channels might still be a
possibility to reduce neuronal activity and decrease the ATP use. In this study, changes in
mRNA levels of the pore-forming subunit of voltage-gated Na+ and Ca2+ channels were
measured to examine the possibility of a transcriptional depression of these key ion
channels during anoxia.
1.2 Voltage-gated ion channels
Voltage-gated ion channels consist of Na+-, Ca2+- and K+ channels, and are
responsible for the formation and modulation of action potentials and transmitter release
in neurons. The isoforms within each ion channel family are named according to
differences in their α-subunit, the pore-forming unit. The number of subunits differs
among the three ion channel families, but the α-subunit is similar. Often, expression of
the α-subunit alone is sufficient for a functional ion channel (Goldin et al., 1986;
8

Introduction
Takahashi et al., 1987), but auxiliary subunits may modify opening and closing
mechanisms of the channels (Catterall, 2000a, 2000b).
In this thesis, mRNA levels of pore-forming α-subunits in voltage gated Na+ and
Ca2+ channels have been studied on anoxic crucian carp brain tissue. It should be noted
that the following information is mostly based on studies of mammals, and may not
necessarily apply to fish.
1.2.1 Voltage-gated Na+ channels
Voltage-gated Na+ (Nav) channels make up a family of nine functionally
expressed α-subunit isoforms. Out of these, four isoforms are present in the brain: Nav
1.1, Nav 1.2, Nav 1.3 and Nav 1.6 (Goldin, 2001). The Nav channels in brain consist of
one pore-forming α-subunit (260 kDa) and two auxiliary subunits β1 (36 kDa) and β2 (33
kDa) (Catterall, 1975; Messner & Catterall, 1985) (Figure 1.1). The β-subunits are
important for kinetics of the Nav channel and help regulate opening and closing of the
channel (Isom et al., 1992; Isom et al., 1995).
Figure 1.1. Structure of voltage-gated Na+ channel. The three subunits are shown; α, β1 and β2.
The pore-forming α subunit consists of four domains (I-IV) with six transmembrane segments (S1-
S6) in each domain. From Catterall (2000a)
9

Introduction
The functional role of Nav channels is primarily to form and conduct action
potentials in excitable cells, and they also influence subthreshold electric activity via
persistent Na+ currents (Ogata & Ohishi, 2002). Persistent Na+ currents occur when Nav
channels remain open for longer periods (Taylor & Meldrum, 1995), and in rat neurons it
has been shown that the amplitude of persistent Na+ currents is increased in response to
hypoxia (Ju et al., 1996). By decreasing the conductivity through Nav channels in
mammalian CNS, neuronal injury induced by hypoxia may be reduced, and hence favor
survival during oxygen depletion. In anoxic turtle brain Perez-Pinzon et al. (1992)
reported a decrease of Nav channels, and suggested this was due to the physiological
events related to anoxia.
Several modulating factors can influence the activity of Nav channels.
Biochemical studies of Nav channels in brain synaptosomes show that Nav channels are
rapidly phosphorylated by cAMP-dependent protein kinase (Costa & Catterall, 1984a),
and studies have reported a reduction of peak Na+ currents in brain neurons in response to
these modulations (Li et al., 1992). Also dopamine and protein kinase C (PKC) may
modulate Nav channels in such a way that Na+ currents and generation of action potential
are reduced (Costa & Catterall, 1984b; Calabresi et al., 1987). Thus, modulations of the
pore-forming subunit of Nav channels may regulate the generation of action potentials in
neuronal cells, and hence affect neuronal transmission and information processing. Under
extreme conditions such as anoxia, modulating mechanisms may play a part in regulating
Nav channels to cope with the anoxic challenge.
1.2.2 Voltage-gated Ca2+ channels
The voltage-gated calcium (Cav) channels are divided into three families
according to the characteristics of their α-subunits and type of Ca2+ currents that is
mediated; Cav 1 (L-type), Cav 2 (P/Q-, N-, and R-type) and Cav 3 (T-type). Cav channels
play roles in muscle contraction, hormone secretion, synaptic transmission, signal
transduction and gene expression. In this thesis, only Cav 2 and Cav 3 channels have been
10

Introduction
investigated, because the Cav 1 channels are not highly expressed in brain tissue
(Catterall, 2000b).
Compared to functional Nav channels which are comprised of three subunits,
functional Cav channels consist of five subunits; one α1-subunit (200-250 kDa), one α2-
subunit which forms a complex with one δ-subunit (170 kDa), one modulating β-subunit
of 55 kDa and one transmembrane γ-subunit of 33 kDa (Curtis & Catterall, 1984;
Takahashi et al., 1987; Gurnett et al., 1996).
Figure 1.2. Structure of voltage-gated Ca2+ channel from skeletal muscle. The five subunits are
shown; α1, α2, β, δ and γ. The pore-forming α1 subunit consists of four domains (I-IV) with six
transmembrane segments (S1-S6) in each domain. From Catterall (2000b).
The Cav 2 family includes three channels; Cav 2.1, Cav 2.2 and Cav 2.3. They are
mostly found in synapses, and are the main mediators of Ca2+ fluxes associated with
release of neurotransmitters. A regulation of these could as a result directly affect
neuronal activity in the anoxic crucian carp. The members of the Cav 2 family need
strong depolarization to be activated, and are therefore called high-voltage activated
(HVA) Ca2+ channels (Catterall, 2000b).
Among many modulating factors that may influence the function of the Cav 2
channels, neurotransmitters and multiple G-protein coupled pathways are the most
studied (Bean, 1989; Hille, 1994; Dolphin, 1995; Ikeda, 1996). Studies have shown that
11

Introduction
G-protein coupled pathways inhibit Ca2+ currents in a manner that can be transiently
reversed by strong depolarizations (Elmslie et al., 1990; Ikeda, 1991; Hille, 1994). Also,
reversion of G-protein coupled pathways can be obtained by phosphorylating intracellular
sites of the Cav channels by neurotransmitters acting through protein kinase C (Swartz et
al., 1993).
The Cav 3 family also includes three channels; Cav 3.1, Cav 3.2, Cav 3.3, where
each channel conducts transient Ca2+ currents (T-type Ca2+ currents). The Cav 3 channels
are located in the soma and dendrites of neurons in contrast to the Cav 2 channels, which
are mostly found in presynaptic areas. Because only weak depolarizations are needed to
activate Cav 3 channels, they are also known as low-voltage-activated Ca2+ channels
(LVA) (Catterall, 2000b). This implies that T-type Ca2+ currents are not likely to induce
neurotransmitter release, and may function primarily as a modulator of synaptic efficacy,
helping to shape and strengthen changes in local synaptic potentials, thereby controlling
action potentials (McCobb & Beam, 1991; Huguenard, 1996; Lambert et al., 1998;
Yunker & McEnery, 2003). Furthermore, different splice variants exist for each of the
three α1 subunits in the Cav 3 family, a source of variation that may be important in
membrane targeting, channel stability, and/or channel modulation (Yunker & McEnery,
2003).
Cav 3 channels are commonly observed in early development of cells and it has
been shown that the density, amplitude and property of neuronal Cav 3 channels change
over time (Gottmann et al., 1988; Desmadryl et al., 1998). Modulation of Cav 3 channels
are not much studied, but Ca2+/calmodulin-dependent protein kinase II has been found to
affect gating of Cav 3 channels (Lu et al., 1994). Moreover, it has been reported that
angiotensin II acting via G-protein pathways, inhibits Ca2+ fluxes in neuroblastoma cells
(Buisson et al., 1992; Lu et al., 1996).
Calcium entry is one of the central causes of cellular damage under anoxia, and a
putative strategy for surviving anoxia would be to reduce the permeability of voltage-
gated Ca2+ channels.
12

Introduction
1.3 Heat shock proteins
Heat shock proteins (Hsps) constitute a large family of proteins classified into
several groups according to molecular size and amino acid sequence. The Hsps are
normally grouped into five subfamilies: the high molecular weight (100-110 kDa) family;
the 83-90 kDa family; the 70 kDa family (66-78 kDa), the 60 kDa family, and the small
Hsps (15-30 kDa) (Franklin et al., 2005). In this thesis Hsp90, three members of the 70
kDa family and Hsp30 have been studied in crucian carp.
Hsps are known to protect vertebrate cells against a wide spectrum of stressors,
like toxins, heavy metals, oxygen depletion, and variation in temperature (Feige & van
Eden, 1996; Airaksinen et al., 1998; Lee et al., 2001; Ramaglia & Buck, 2004). In this
respect, two main functions have been proposed for Hsps; a molecular chaperone
function, and a protein degradation function (Burel et al., 1992; Parsell & Lindquist,
1993). Acting as molecular chaperones, Hsps recognize unstable proteins and facilitate
proper protein folding, and facilitate refolding of denatured proteins in both normal and
stressful conditions. In protein degradation, Hsps are involved in presenting damaged
substrates for proteolysis, thus repairing damage after periods of stress (Ohtsuka & Hata,
2000).
Hsps protect cells from stress in a complex and poorly understood manner, in
which different Hsps serve different roles at different locations in the cells, some needing
co-proteins for proper function (Freeman et al., 1995; Demand et al., 1998; Mayer &
Bukau, 1998). Another aspect of this complexity is reflected through a cross-species view
of Hsps, where different species respond to similar types of stress using different Hsps
(Parsell & Lindquist, 1993).
When an organism is exposed to a stressor, cellular pathways are rapidly affected
and it is a clear advantage to be able to minimize negative effects through a strong
defense system. Findings show that most Hsps are expressed in both normal and stressed
cells, with their synthesis being enhanced by exposure to stressors (Becker & Craig,
1994; Hartl et al., 1994). This has led to the idea that Hsp function is required in normal
cells, but that it is needed to an even greater extent in stressed cells (Parsell & Lindquist,
1993; Parsell et al., 1993; Latchman, 2005). It could be reasonable to expect that stress-
13

Introduction
tolerant animals could be adapted by having a raised defense against the stressor. As an
example, high levels of Hsp70 found in normoxic turtle brain contrast with low Hsp70
levels in the anoxia-sensitive mammal brain, indicating that the anoxia-tolerant turtle is
prepared for stressful situations (Prentice et al., 2004).
1.3.1 Hsp70
The Hsp70 family, and more specifically Hsp70, is the best characterized of the
heat shock proteins. Amino acid sequences of Hsp70 are ~50% identical between
prokaryotes and eukaryotes (Gupta & Singh, 1992; Mayer & Bukau, 1998), indicating
that Hsp70 function has been extremely well conserved throughout evolution (Parsell &
Lindquist, 1993). Several functions have been denoted Hsp70, such as regulation of
apoptosis, molecular chaperoning, antigene presentation, uncoating clathrin-coated
vesicles, nuclear transport, synaptic vesicle trafficking and synaptic plasticity (Pelham,
1986; Rothman & Schmid, 1986; DeLuca-Flaherty et al., 1990; Rordorf et al., 1991;
Ohtsuka & Suzuki, 2000). Hsp70 is expressed at low levels in normal cells, but the
Hsp70 expression is highly induced by stressors, including ischemia and hypoxia
(Murphy et al., 1999; Snoeckx et al., 2001).
Heat shock cognate 70 (Hsc70), a constitutively expressed member of Hsp70
family (Craig et al., 1983), is highly expressed in non-stressed tissues and is only slightly
inducible by stress (Snoeckx et al., 2001). This indicates different functions between
Hsp70 and Hsc70. Loones et al. (2000) suggested that Hsc70 is localized in neurons and
that it is involved in axonal transport, possibly ensuring transport of properly folded
proteins along the axon (Black et al., 1991; Bechtold et al., 2000).
Due to one additional gene duplication in fish compared to tetrapods, several
paralogs of genes is often found. In this thesis two paralogs of Hsp70 (Hsp70.1 and
Hsp70.2) and one paralog of Hsc70 were characterized and investigated in crucian carp,
to assess potential differences in gene expression patterns in response to anoxia.
14

Introduction
1.3.2 Hsp90
Hsp90 is abundantly expressed in unstressed cells, but its expression is normally
enhanced by stress (Lindquist & Craig, 1988). For example, Hsp90 is essential for
cellular function at all temperatures in yeast, indicating that Hsp90 might have vital basic
functions in eukaryotic cells (Borkovich et al., 1989).
Hsp90, and other members of the 83-90 kDa family of Hsps, are primarily located
in cytosolic and nuclear compartments of eukaryotic cells (Parsell & Lindquist, 1993).
These Hsps interact with several proteins, such as steroid-hormone receptors (Catelli et
al., 1985; Sanchez et al., 1985), actin filaments (Koyasu et al., 1986), different kinases
(Miyata & Yahara, 1992, 1995), and calmodulin (Minami et al., 1993). The binding of
Hsp90 to steroid-hormone receptors has been shown to be crucial for regulating the
receptor’s ability to bind to promoter regions of genomic DNA, giving Hsp90 a role as a
regulator of hormone receptor activity (Rose et al., 1989). Like Hsc70, Hsp90 bind actin
and may also play a role in cytosolic transport (Nishida et al., 1986).
1.3.3 Hsp30
In accordance with the other families of Hsps, small Hsps have been suggested to
play a role in stress responses, but they have also been assigned a role in growth and
development (Lindquist & Craig, 1988). Small Hsps may exert their function through
influencing signal transduction pathways, and through protection of microfilament
networks during stress exposures (Landry & Huot, 1995). Compared to other families of
Hsps, amino acid sequences of small Hsps have been less conserved throughout evolution
(Parsell & Lindquist, 1993).
Growth and development is probably a low priority under anoxia, because energy
use needs to be minimized. However, protection of the cytoskeleton and microfilaments
may be given high priority under anoxic conditions, to preserve the integrity of the
existing cells in due to a likely reduction in the formation of new cells.
15

Introduction
1.4 Real-time RT-PCR
In this study real-time reverse transcription polymerase chain reaction (real-time
RT-PCR) was used to estimate levels of mRNA of the genes of interest. The simplicity,
specificity and sensitivity, together with the potential for high throughput has made real-
time RT-PCR an attractive technology for detection and/or comparison of RNA levels
(Schwaller et al., 1997; Wang et al., 1999) This method involves two steps: (1) synthesis
of complementary DNA (cDNA), and (2) amplification of target genes by real-time RT-
PCR. A fluorescent reporter molecule, SYBR green, intercalates with double-stranded
DNA formed in the PCR reaction, and thereby makes it possible to monitor the
accumulation of PCR products as the PCR reaction proceeds. Generally, two
quantification strategies can be performed; absolute quantification and relative
quantification (Freeman et al., 1999). Absolute quantification attempts to determine the
number of mRNA copy per cell by comparison with calibration curves (Pfaffl &
Hageleit, 2001). This approach makes it possible to compare results between laboratories
because the calibration curve is supposed to be reliable and stable, although the precise
quantification of RNA for the construction of calibration curve can be problematic. In
relative quantification, which is used in this thesis, mRNA levels of the genes of interest
are normalized to the levels of an internal RNA reference gene, preferably a gene which
show stable mRNA levels across the experimental groups of the study. Relative
quantification is the most adequate approach to investigate physiological changes in gene
expression levels and is the most common approach (Freeman et al., 1999).
Traditional internal RNA controls include β-actin, glyceraldehydes-3-phosphate
dehydrogenase (GAPDH) and peptidylpropyl isomerase A (PPIA). However, it has been
found that mRNA levels of these genes change under some conditions (Schmittgen &
Zakrajsek, 2000; Suzuki et al., 2000; Radonic et al., 2004), and a thorough evaluation of
these genes is vital to avoid misinterpretations of gene expression data. This is
particularly important in extreme experimental insults, such as anoxia. In such
experiments, an external RNA reference can be used to monitor levels of the internal
RNA references (Baker et al., 2005). Additional approaches have been developed to
improve normalization of relative gene expression data, such as the use of total RNA
16

Introduction
(Bustin, 2002). The disadvantage of this approach is that total RNA includes large
amounts of ribosomal RNA (rRNA) and transfer RNA (tRNA) which can vary relatively
to the amount of mRNA, and that the amount of total RNA of a tissue has been found to
change in response to various treatments (Smith et al., 1999).
1.5 Aims of the study
Because a reduced or altered ion channel function has the potential to
significantly lower the energy use of the brain, I found it relevant to look for changes in
mRNA levels of selected voltage-gated ion channel subunits in brain tissue. Anoxia is an
extreme stressor for most animals, and it is possible that Hsps could be involved in
counteracting the effects of this stressor. Moreover, anoxia is likely to be a more severe
challenge at high temperature since the rate of ATP use increase with temperature.
Therefore, I chose to study the expression of heat shock proteins at two different
temperatures under anoxic conditions.
Thus, the aim of this study was to investigate the effects of anoxia on the mRNA
levels of the pore-forming subunits of voltage-gated Na+ and Ca2+ channels, as well as to
quantify the effects of anoxia at two temperatures on the mRNA levels of Hsps in crucian
carp brain.
17

Materials and methods
2 Materials and methods
This thesis consists of three experiments; (1) quantification of relative mRNA
levels of voltage-gated ion channels in fish exposed to anoxia at 11°C (2), quantification
of relative mRNA levels of Hsps in fish exposed to anoxia at 8°C and (3) quantification
of relative mRNA levels of Hsps of fish exposed to anoxia at 13°C.
2.1 Animal handling
2.1.1 Animals
Crucian carp were captured in Tjernsrud pond, Oslo community. Experiments
were performed at three different temperatures, using two different batches of fish. The
first batch was captured in June 2004, and was used in the ion channel experiments at
11°C, while the second batch was captured in June 2005 and was used in Hsps
experiments at 8°C and 13°C. Both batches were kept in 750-litre tanks at the aquarium
facility of the Department of Molecular Biosciences, University of Oslo. These tanks
were continuously supplied with aerated and dechlorinated water from Maridalsvannet,
Oslo. The photoperiod was held at 12h light/12h darkness, and the fish were fed daily
with commercial fish food (Tetrapond, Tetra), except during experiments. Experimental
animals weighed 40±13g.
2.1.2 Anoxia exposure and tissue sampling
Anoxia exposures were performed at three temperatures, 8°C, 11°C and 13°C,
where each temperature included four exposure groups; 7 days normoxia (N7), 1 day
anoxia (A1), 7 days anoxia (A7), or 7 days anoxia followed by 3 or 7 days of normoxia
(A7N3 or A7N7), see table 2.1 for details. Exposures were carried out in circular 25-litre
tanks, continuously supplied with dechlorinated, aerated/de-oxygenated water (0.5-1
ml/second). De-oxygenation was achieved by N2-bubbling (Nitrogen 99.99%), and
oxygen levels were monitored using a galvanometric oxygen electrode (WTW 340i from
Wissenschaftlich Technische werkstätten, Weilhem, Germany) connected to a printer
18

Materials and methods
(Figure 2.1). Fish were left to acclimate in the 25-litre tanks for 12 hours prior to
exposure, followed by removal of excrements and closure of tanks with tight lids.
Table 2.1. Overview of the experiments.
Crucian carp
(time of capture)
Experimental period Temp Exposure groups
June 2004 November 2004 11 °C N7, A1, A7, A7N7
June 2005 November 2005 13 °C N7, A1, A7, A7N7
June 2005 January-February 2006 8 °C N7, A1, A7, A7N3 N7= normoxia 7 days, A1=anoxia 1 day, A7=anoxia 7 days, A7N3/N7=anoxia 7 days followed by
normoxia 3 or 7 days.
Oslo water (Dechlorinated)
Oximeter N2
O2
Printer
Water drainage
Normoxia-exposure
Anoxia-exposure
Figure 2.1. Set-up for anoxia exposure. Left circular tank represents normoxia experiment, while right
circular tank represent anoxia experiment. The oxygen level and temperature were registered by an oxygen
electrode, and recorded by a printer.
Immediately after the respective exposures, crucian carp was carefully captured
and killed by cutting the spinal column, close to the head. Brain tissue was dissected
excluding the olfactory tracts and spinal cord and snap-frozen in liquid nitrogen within 3
19

Materials and methods
minutes of capture. The brain tissue was subsequently stored at -80°C until further
analysis. The number of fish included in each exposure group is listed in table 2.2.
Table 2.2. Number of fish in each exposure group at the different temperatures
Exposure 8 °C 11 °C 13 °C
N7 6 5 6
A1 5 5 6
A7 7 6 6
A7N3 / A7N7 4 5 6
2.2 Isolation of total RNA
Brains were weighed in a frozen condition (8°C; 107.5±28 mg, 11°C; 129.7±19
mg, 13°C; 137.8±15 mg), and quickly transferred to a homogenizer placed on ice,
containing 500 µl TRIzol (Invitrogen). Prior to homogenization, an external RNA
reference (denoted; 2A-4, from cyanobacterium, Unpublished) was added on a pg-per-
mg-basis in addition to a total volume of 15 µl TRIzol pr mg tissue. Total RNA from
brain tissue was isolated according to the manufacturer’s protocol (Invitrogen). Duall
glass homogenizers (Kontes) were used to homogenize the brain tissue in the 11°C
experiments, and an electrical homogenizer (Ultra-Turrax T 8, IKA) was used to
homogenize the brain tissue in the 8°C and 13°C experiments.
2.2.1 Quality check of total RNA
To check the quality of the extracted total RNA, one microliter of 1:10 dilutions
of total RNA solution was analyzed on a 2100 Bioanalyzer (Agilent) using the RNA 6000
Nano Lab Chip ® Kit (Agilent) according to the manufacturer’s protocol. Ratios of 28S
to 18S ribosomal RNA were estimated, and were found to be approximately 1.5, a value
indicating high-integrity RNA.
To measure the concentration of RNA, optical density (OD) measurements were
performed using a NanoDrop spectrophotometer (NanoDrop technologies) on 1:10
20

Materials and methods
dilutions of total RNA. Technical triplicates were performed on each sample, and the
concentrations were found to be in the order of 1500-2500 ng/μl undiluted total RNA
solution. OD 260/280 ratio showed values between 1.8 and 2.1 and the 260/230 ratio
showed values above 1.8. Lower values of OD 260/280 and OD 260/230 indicate
polluted RNA.
2.3 cDNA synthesis
Two μg total RNA was treated with 2 units DNase I (amplification grade, Sigma),
prior to cDNA synthesis to remove all traces of genomic DNA. However, during this
master thesis the lab encountered problems with the DNase I treatment, and hence, total
RNA from crucian carp exposed to different oxygen regimes at 8°C were not DNase I
treated. Reverse transcription was performed using SuperscriptTM III Reverse
Transcriptase (Invitrogen) and 500 ng oligo(dT)18. Both DNase I treatment and cDNA
synthesis were performed according to the manufacturer’s protocol. For each RNA
sample two cDNA syntheses were carried out, and the cDNA was diluted 1:25 with
DEPC (diethylpyrocarbonate)-milliQ water. Note; all non-DNase I treated RNA samples
were controlled for contamination of genomic DNA by performing real-time RT-PCR
reactions on 1:750 dilutions of RNA.
2.4 Partial cloning and sequencing
Cloning and sequencing of the following genes were done from crucian carp brain
to be able to design functional primers for the real-time RT-PCR assay; Nav 1.1, Nav 1.6,
Cav 2.1, Cav 2.3, Cav 3.1, Cav 3.2, Hsp70.2 and Hsp90. For the genes Nav 1.3, Hsp30,
Hsp70.1 and Hsc70, sequences were available for the closely related goldfishi and thus,
suitable sequences for synthesizing real-time RT-PCR primers for crucian carp (see table
i To point out the close relationship; 0.4 mutations pr 100bp were detected in Hsp30 sequences in between the two crucian carp and goldfish (acc. AB177389), and 3 mutations pr 100bp were detected in the sequences of Hsc70 (goldfish; acc. AB092840), after cloning of the real-time RT-PCR products from crucian carp.
21

Materials and methods
2.3 for accession no.). Cloning was performed on cDNA from normoxic crucian carp
brain tissue.
Primers for cloning were obtained by aligning nucleotide sequences of genes of
interest from a number of species (retrieved from GenBank) using Clustal X (1.83) and
Genedoc (version 2.6.002). Primers were designed in conserved regions of the genes
using the web-based Primer3 resource (http://frodo.wi.mit.edu/cgi-
bin/primer3/primer3_www.cgi), and synthesized by Invitrogen (see table 2.3). All
primers had a melting temperature of approximately 60°C.
Table 2.3. Primers used for cloning and the accession number for the goldfish sequences.
Gene Acc. nr Forward primer 5’→3’ Reverse primer 5’→3’ NaV1.1 TGTAACAGAGTTTGTGGATTTGG ACAGCCAGGATGAGGTTCAC
NaV1.3 AF372583
NaV1.6 TGTAACAGAGTTTGTGGATTTGG ACAGCCAGGATGAGGTTCAC
CaV2.1 ACTTCATCCCGCTCATCATC TTCCTCAGAGACGCCCAATA
CaV2.3 TCCTCATCGTCTACAAGCTGTTT CCCTGACGCAGGAGTTTAAT
CaV3.1 GCCCGTCATGAATTACAACC CAAGACCTTCACAGGGGTGT
CaV3.2 CATCACGCTTGAGGAAATTG ATCCATCTCCGCCTCCTC
Hsp70.1 AB092839
Hsp70.2 ATCCTGACGATTGAGGATGG CGGCTGGTTATCGGAATATG
Hsc70 AB092840
Hsp90 CGTAATAGGGTAGCCAATGAACT CGTAATAGGGTAGCCAATGAACT
Hsp30 AB177389
Cloning of the genes of interest was achieved by using FastStart Taq DNA
polymerase (Roche Diagnostics) and 39 cycles of amplification (PCR program; Taq
activation at 94°C (10 min), 39 cycles of 94°C (10 sec), 50°C/55°C (1 min), 72°C (1
min), and extension at 72°C (10min)). PCR-products were ligated into pGEM®-T Easy
Vector (Promega) and transformed into CaCl2-competent cells, and subsequently applied
on IPTG/X-Gal agar plates. A number of colonies were picked, and amplified by PCR
22

Materials and methods
with primer annealing temperatures of 55°C, using M13 forward and reverse primers
(Invitrogen). The colony PCR-products were sequenced by ABI-lab at CEES,
Departments of Biology and Molecular Sciences, University of Oslo.
All obtained sequences can be found in appendix IV. It should be noted that
cloning of three of the genes of interest; Nav 1.2, Cav 2.2 and Cav 3.3, failed.
2.5 Quantification of mRNA expression with real-time RT-PCR
2.5.1 Primer design
Real-time RT-PCR primers were designed based on cloned crucian carp
sequences and available goldfish sequences (see appendix IV for acc.), using the
LightCycler Probe Design Software (version 1.0 Roche). The primers were synthesized
by Invitrogen, and their specificity was verified by cloning and sequencing the real-time
RT-PCR products. See table 2.4 for information on real-time primers.
Table 2.4. Primers used for real-time RT-PCR. Gene Forward primer 5’→3’ Reverse primer 5’→3’ NaV1.1 CGTAATCCTGACTATGGC CAAAGAAGATCATATAGGGCT NaV1.3 AGCATCATGGGAGTCAA GTAATACTGCGTGCTGTT NaV1.6 GGTCGCAATCCAAACTATG GCTCTCAGGGTCAGCA CaV2.1 GGTGATTTTGGCTGACG CCTTATATCTCCATCTCTATCCT CaV2.3 GTGCCAAACCTTTGACT GTGTTTAAGGGCGATCAT CaV3.1 AAATCGAGGTCAATGCTT AAGAGGAGACCCAGATTC CaV3.2 TTCCTCACTTTGTTCCGC CCCAGCACGAATGTCA Hsp70.1 ACAAGCGACTAAAGACG GTACGCCAACAGCTTC
Hsp70.2 CATCCTGATGGGCGAC GGTTATCGGAATATGTGGAGA
Hsc70 GCTATTGCTTACGGTCTG CCGCGAACTTGAGACA
Hsp90 GGAATCTTCCGCTGGAG CGAGTGCTTCTTGACGA
Hsp30 GACGCTGGACACTAAAG ACTGCCGACTAAATGACC
23

Materials and methods
2.5.2 Real-time RT-PCR
Quantification of mRNA levels of the genes of interest (see table 2.4) were
performed on a Lightcycler®2.0 instrument, using LightCycler FastStart DNA MasterPLUS
SYBR Green I kit (Roche Diagnostics). The expression of each gene was quantified by
performing four real-time RT-PCR reactions on each fish; two reactions on each of the
two cDNA syntheses (Figure 2.2).
Total RNA sample
cDNA synthesis no.1
Quantification by real-time
RT-PCR
cDNA synthesis no.2
Quantification by real-time
RT-PCR
Quantification by real-time
RT-PCR
Quantification by real-time
RT-PCR
Figure 2.2. Overview of the quantification procedure. Two cDNA syntheses were performed on total
RNA of each fish, whereby each cDNA was quantified twice on every primer pair using real-time RT-PCR.
β-actin and GAPDH was chosen as internal RNA reference genes on the basis of
previous testing of the stability of three putative internal RNA reference genes; β-actin,
GAPDH and PPIA during the anoxia exposures (Ellefsen. S, Unpublished) (Figure 2.3).
The expression profiles of these three genes were related to the external RNA reference
gene (2A-4) added to the brain tissue prior to RNA extraction on a pg-per-mg basis. The
external RNA reference gene enables comparison of gene expression between the
different exposure groups. PPIA mRNA levels showed a significant change at 13°C and
therefore discarded as internal reference gene. β-actin was chosen as internal RNA
reference gene at 11°C, because of a nearly significant increase in mRNA of GAPDH in
the A7 group (P=0.0597, One-way ANOVA, Tukey-Kramer post test), indicating a
possible response to anoxia. GAPDH was found to be the most stable RNA reference
gene at 8°C and 13°C, while the mRNA levels of β-actin showed a relatively large
variance at 13°C (P=0.1053, One-way ANOVA, Tukey-Kramer post test). Therefore,
24

Materials and methods
real-time RT-PCR was performed using β-actin as the internal reference gene for the
11°C experiment, and GAPDH as the internal reference gene for the 8°C and 13°C
experiments. As reference genes, the internal reference genes were preferred to the
external reference gene (2A-4), since there was a considerably higher sample-to-sample
variation in 2A-4 compared to the external reference genes. There was also an aliquot-to-
aliquot variation in 2A-4 mRNA levels between the three temperatures, but this will not
influence the results obtained within each of the three experiments (8°C, 11°C, and 13°C)
as the RNA extraction of each experiment was performed using the same aliquot.
25

Materials and methods
A)
GAPDH, 8°C
0
5000
B)
C)
Figure 2.3. Stability of internal reference genes during anoxia exposures at different temperatures.
mRNA levels of internal reference genes at 8°C (A), 11°C (B) and 13°C (C), normalized to the external
reference gene. GAPDH was chosen as internal reference gene for experiments at 8°C and 13°C, while β-
actin was chosen as internal reference gene for experiments at 11°C. P-values for the 8°C experiments (all
three by Kruskal-Wallis, Dunn’s post test); GAPDH P=0.4678, β-actin P=0.5249, and PPIA P=0.5783. P-
values for the 11°C experiments; GAPDH P=0.0597 (One-way ANOVA, Tukey-Karmer post test), β-actin
P=0.2370 (One-way ANOVA, Tukey-Kramer post test) and PPIA P=0.3344 (Kruskal-Wallis, Dunn’s post
test). P-values for the 13°C experiments; GAPDH P=0.5385 (Kruskal-Wallis, Dunn’s post test), β-actin
P=0.1053 (One-way ANOVA, Tukey-Kramer post test) and PPIA P=0.0039 (Kruskal-Wallis test, Dunn’s
post test).
10000
15000
20000
25000
0 1 2 3 4
mR
NA
leve
l in
% o
f 2-A
5
4
β-actin, 8°C
0
1000
2000
3000
4000
5000
6000
0 1 2 3 4 5
mR
NA
leve
l in
% o
f 2-A
4
N7 A1 A7 A7N3
PPIA, 8°C
0
1000
2000
3000
4000
5000
6000
0 1 2 3 4 5
mR
NA
leve
l in
% o
f 2-A
4
N7 A1 A7 A7N3 N7 A1 A7 A7N3
GAPDH, 11°C
0
2000
4000
6000
8000
10000
0 1 2 3 4
mR
NA
leve
l in
-A
5
% o
f 24
N7 A1 A7 A7N7
β-actin, 11°C
0
200
400
600
800
1000
0 1 2 3 4 5
mR
NA
leve
l in
% o
f 2-A
PPIA, 11°C
0
1000
2000
3000
4000
5000
0 1 2 3 4 5
mR
NA
leve
l in
% o
f 2-A
4
N7 A1 A7 A7N7
4
N7 A1 A7 A7N7
GAPDH, 13°C
0
1000
2000
000
000
000
0 1 2 3 4 5
mR
NA
leve
l in
% o
f 2-A
3
4
54
β-actin, 13°C
0
100
200
300
400
500
0 1 2 3 4 5
mR
NA
leve
l in
% o
f 2-A
4
N7 A1 A7 A7N7
PPIA, 13°C
0
500
1000
1500
2000
2500
3000
0 1 2 3 4
mR
NA
leve
l in
% o
f 2-A
5
4
N7 A1 A7 A7N7
*
N7 A1 A7 A7N7
26

Materials and methods
Real-time RT-PCR was performed according to the manufacturer’s protocol, with
the adjustment of halving each reaction from 20 µl to 10 µl. Five µl of 1/25 dilutions of
cDNA was used as template. The real-time RT-PCR program was set to 40 cycles of 10
sec at 95°C, 12 sec at 60°C and 8 sec at 72°C after 10 min (95°C) of Taq activation. A
melting curve analysis was generated according to the manufacturer’s protocol.
To correlate real-time RT-PCR reaction curves to amounts of initial starting
template, a reference point in the curve is needed. This point is called crossing point (Cp)
and is defined as the fractional cycle number at which the fluorescence has reach a
threshold value. The following information was calculated from each real-time RT-PCR
reaction; (1) Cp was calculated using the second derivative maximum method
(LightCycler Software version 3.5, Roche Diagnostics) and (2) efficiency (E) was
estimated for each PCR reaction using LinRegPCR (version 7.5), (Ramakers et al., 2003)
wherein each efficiency calculation was visually inspected. Efficiencies lying in
suboptimal regions of the graphs were manually corrected. These individual efficiency
estimations were subsequently used to calculate the mean efficiency of every amplicon.
This mean efficiency was used to calculate the level of relative mRNA abundance.
Moreover, quantification of GAPDH and Hsp mRNA levels was performed on both 8°C
and 13°C brains. For these genes a mutual mean efficiency was calculated based on data
from both temperatures. It should be noted that Cp values within the acceptable range
(<36 cycles) could not be retrieved for the gene Hsp70.2 in the 13°C group of fish. The
FitPoint method (LightCycler Software version 3.5, Roche Diagnostics) was therefore
used to define the level of expression (Rasmussen, 2001).
exp
exp
CpTar
CpRef
EE
Relative mRNA level =
Formula for calculating relative mRNA levels of each sample. The mean efficiency for each gene of
interest was calculated using LinRegPCR (version 7.5). E=efficiency, Cp=crossing point, Ref= (internal)
reference gene, Tar=target gene, exp=exposure group (N7, A1, A7 or A7N3/N7).
27

Materials and methods
2.6 Statistical analyzes
The data were normality tested using the method of Kolmogorov and Smirnov.
Bartlett’s test was used to test for significant differences in SD. One-way ANOVA with
Dunnett multiple comparison tests was used to test for significant changes in gene
expression compared to control (N7) in data sets passing the normality test. Kruskal-
Wallis test with Dunn’s post test was used when data sets showed significant variation in
SD or did not pass the normality test. P≤0.05 was considered significant. The statistical
calculations were done using GraphPad InStat (GraphPad® version 3.06).
28

Results
3 Results
Normoxia/anoxia exposures were carried out at three temperatures; 8°C, 11°C and
13°C. Fish exposed to 7 days anoxia at 8°C and 11°C were still active, while fish exposed
to 7 days anoxia at 13°C showed a highly reduced activity.
The exposure groups are here abbreviated as N7 (normoxia 7 days), A1 (anoxia 1
day), A7 (anoxia 7 days), and A7N3 or A7N7 (anoxia 7 days followed by normoxia for 3
or 7 days, respectively). Statistical information for all results is listed in appendix III.
3.1 Real-time RT-PCR efficiency calculations
Mean efficiencies for the genes that were studied are presented in table 3.1.
Quantification of GAPDH and heat shock protein mRNA levels was performed on both
8°C and 13°C brains, and a common mean efficiency was calculated based on data from
both temperatures.
Table 3.1. Mean efficiencies calculated from LightCycler real-time RT-PCR reactions.
Gene of interest Mean efficiency,
11°C
SD Gene of interest Mean efficiency,
8°C and 13°C
SD
β-actin 1.833 0.020 GAPDH 1,890 0,038
Cav 2.1 1.848 0.012 Hsp30 1,886 0,024
Cav 2.3 1.903 0.016 Hsp70.1 1,866 0,033
Cav 3.1 1.874 0.012 Hsp70.2 1,835 0,025
Cav 3.2 1.892 0.030 Hsc70 1,879 0,031
Nav 1.1 1.892 0.015 Hsp90 1,894 0,038
Nav 1.3 1.888 0.013
Nav 1.6 1.889 0.021 Individual efficiencies for each PCR reaction were initially estimated using LinReg software. n=84 for
voltage-gated ion-channels and β-actin; n=184 for heat shock proteins and GAPDH (8°C; n=88 and 13°C;
n=96).
29

Results
3.2 Relative mRNA levels of voltage-gated ion channels
Quantifications of mRNA levels of the α-subunit of voltage-gated ion channels
were performed on total RNA from brains of crucian carp exposed to different oxygen
regimes at 11°C. Gene expression data of each gene was normalized using β-actin as
internal reference gene.
With regard to Nav channels only mRNA levels the Nav 1.3 channel α-subunit in
the A1 group showed a significant decrease compared to N7 (Kruskal-Wallis, Dunn’s
post test, P<0.05) (Figure 3.1). No significant changes were detected in the expression of
the α-subunits of Nav 1.1 compared to the N7 group, although the one-way ANOVA
indicated differences between the exposure groups (P=0.0289). With regard to the Nav
1.6 α-subunit, no significant changes were detected compared to the N7 group.
Nav 1.1
0
4
8
12
16
0 1 2 3 4 5
mR
NA
leve
l in
% o
f
Figure 3.1. Relative mRNA levels of members of the Nav channels in the brain of crucian carp, exposed
to different oxygen regimes at 11°C. The data are normalized using β-actin as internal reference gene and
are presented as individual values with lines representing mean values. * =P<0.05, compared to N7. For
number of fish in each exposure group, see table 2.2. For statistical details, see appendix III.
β-a
ctin
N7 A1 A7 A7N7
Nav 1.3
0,0
0,2
0,4
0,6
0,8
1,0
0 1 2 3 4
mR
NA
leve
l in
% o
f β-a
ctin
5 N7 A1 A7 A7N7
*
Nav 1.6
0
2
4
6
8
10
12
0 1 2 3 4 5
mR
NA
leve
l in
% o
f β-a
ctin
N7 A1 A7 A7N7
30

Results
No significant changes were found in mRNA levels of the α-subunits in the Cav 2
family (Cav 2.1 and Cav 2.3) in response to anoxia in crucian carp brain (Figure 3.2).
Noticeable, the relative amount of mRNA were similar for both Cav 2 channels.
CaV 2.1
0
2
4
6
8
10
0 1 2 3 4 5
mR
NA
leve
l in
% o
f β-a
ctin
N7 A1 A7 A7N7
Cav 2.3
0
2
4
6
8
10
0 1 2 3 4 5m
RN
A le
vel i
n %
of β
-act
in N7 A1 A7 A7N7
Figure 3.2. Relative mRNA levels of members of the Cav 2 channel subunits in the brain of crucian carp,
exposed to different oxygen regimes at 11°C. The data are normalized using β-actin as internal reference gene
and are presented as individual values with lines representing mean values. For number of fish in each exposure
group, see table 2.2. For statistical details, see appendix III.
Similarly, the Dunnett post-test did not detect any changes in the mRNA levels of
the α-subunits of the Cav 3 family compared to the N7 group (Figure 3.3). However, for
the Cav 3.1 α-subunit, a P value of 0.0087 was obtained in the one-way ANOVA,
indicating differences between the exposure groups.
31

Results
Cav 3.1
0
2
4
6
8
10
0 1 2 3 4 5
Figure 3.3. Relative mRNA levels of members of the Cav 3 channel subunits in the brain of crucian
carp, exposed to different oxygen regimes at 11°C. The data are normalized using β-actin as internal
reference gene and are presented as individual values with lines representing mean values. For number of fish
in each exposure group, see table 2.2. For statistical details, see appendix III.
3.3 Relative mRNA levels of heat shock proteins
Relative quantifications of mRNA levels of heat shock proteins were performed
on total RNA from brains of crucian carp exposed to different oxygen regimes at 8°C or
13°C. Gene expression data of each gene was normalized using GAPDH as internal RNA
reference gene.
Two paralogs of Hsp70 were found in the crucian carp transcriptome, and these
are here denoted Hsp70.1 and Hsp70.2.
At 8°C, Hsp70.1 mRNA levels were found to be significantly higher in the A7N3
group compared to N7 (P<0.05, Kruskal-Wallis with Dunn’s post test) (Figure 3.4). At
13°C the mRNA expression of Hsp70.1 showed a quite different response with a 9 fold
higher mRNA level in the A7 group compared to the N7 group (P<0.001, Kruskal-Wallis
with Dunn’s post test) followed by a decrease of mRNA in the A7N7 group.
Interestingly, relative mRNA levels at N7 were found to be 7.5 times higher at 8°C than
they were at 13°C.
mR
NA
leve
l in
% o
f β-a
ctin
Cav 3.2
0
1
2
3
4
5
0 1 2 3 4 5
mR
NA
leve
l to
% o
f β-a
ctin
N7 A1 A7 A7N7 N7 A1 A7 A7N7
32

Results
Hsp70.1 8°C
0,0
0,4
0,8
1,2
1,6
2,0
0 1 2 3 4 5
mR
NA
leve
l in
% o
f GA
PDH
Hsp70.1, 13°C
0,0
0,4
0,8
1,2
1,6
2,0
0 1 2 3 4
mR
NA
leve
l in
% o
f GA
PD
5
H
N7 A1 A7 A7N7
***
N7 A1 A7 A7N3
*
Figure 3.4. Relative mRNA levels of Hsp70.1 in the brain of crucian carp, exposed to different oxygen
regimes at 8°C or 13°C. The data are normalized using GAPDH as internal reference gene and are presented
as individual values with lines representing mean values. * =P<0.05, compared to N7, *** =P<0.001,
compared to N7. For number of fish in each exposure group, see table 2.2. For statistical details, see appendix
III.
At 8°C the relative mRNA levels of Hsp70.2 showed significantly higher values in both A1
and A7 compared to N7 (P<0.05, Kruskal-Wallis with Dunn’s post test) (Figure 3.5).
Significantly higher levels of mRNA in the A7 group were also found at 13°C (P<0.05,
Kruskal-Wallis with Dunn’s post test). The mRNA levels of Hsp70.2 were found to be
expressed at lower levels at both temperatures in the N7 group compared to its paralog,
Hsp70.1.
Hsp70.2, 8°C
0
0,1
0,2
0,3
0,4
0,5
0 1 2 3 4
Figure 3.5. Relative mRNA levels of Hsp70.2 in the brain of crucian carp, exposed to different oxygen
regimes at 8°C or 13°C. The data are normalized using GAPDH as internal reference gene and are presented
as individual values with lines representing mean values. * =P<0.05, compared to N7. For number of fish in
each exposure group, see table 2.2. For statistical details, see appendix III.
5
mR
NA
leve
l in
% o
f GA
PDH
Hsp70.2, 13°C
0,0
0,2
0,4
0,6
0,8
1,0
0 1 2 3 4
mR
NA
leve
l in
% o
f GA
PD
5
H
N7 A1 A7 A7N7
*
N7 A1 A7 A7N3
**
33

Results
The relative mRNA levels of Hsc70 at 8°C were significantly lower in the A7 group
compared to the N7 group (P<0.05, Kruskal-Wallis with Dunn’s post test) (Figure 3.6). A
similar response was detected at 13°C, although with a more substantial decrease of Hsc70
mRNA levels in the A7 group (P< 0.01, One-way ANOVA with Dunnett post test).
Hsc70, 8°C
0
10
20
30
40
0 1 2 3 4 5
mR
NA
leve
l in
% o
f GA
PDH
N7 A1 A7 A7N3
*
Hsc70, 13°C
0
4
8
12
16
20
0 1 2 3 4 5m
RN
A le
vel i
n %
of G
APD
H N7 A1 A7 A7N7
**
Figure 3.6. Relative mRNA levels of Hsc70 in the brain of crucian carp, exposed to different oxygen
regimes at 8°C or 13°C. The data are normalized using GAPDH as internal reference gene and are presented
as individual values with lines representing mean values. * =P<0.05, compared to N7, ** =P<0.01, compared to
N7. For number of fish in each exposure group, see table 2.2. For statistical details, see appendix III.
At 8°C Hsp90 mRNA levels were found to be significantly lower in the A7 group
compared to the N7 (Kruskal-Wallis Test, P=0.0013) (Figure 3.7). The tendency was
similar at 13°C although no significant change of mRNA was detected at this
temperature.
34

Results
Hsp90, 8°C
0
4
8
12
16
20
0 1 2 3 4 5
mR
NA
leve
l in
% o
f GA
PDH
N7 A1 A7 A7N3
**
Hsp90, 13°C
0
2
4
6
8
10
0 1 2 3 4 5
mR
NA
leve
l in
% o
f GA
PDH
N7 A1 A7 A7N7
Figure 3.7. Relative mRNA levels of Hsp90 in the brain of crucian carp, exposed to different oxygen
regimes at 8°C or 13°C. The data are normalized using GAPDH as internal reference gene and are presented
as individual values with lines representing mean values. ** =P<0.01, compared to N7. For number of fish in
each exposure group, see table 2.2. For statistical details, see appendix III.
No significant changes of Hsp30 mRNA levels were detected at 8°C (Figure 3.8).
However, at 13°C significantly lower mRNA levels of Hsp30 were seen in the A1
(P<0.05, One-way ANOVA with Dunnett post test) and A7 groups (P<0.01, One-way
ANOVA with Dunnett post test), compared to N7.
Hsp30, 8°C
0,0
0,2
0,4
0,6
0,8
1,0
1,2
0 1 2 3 4 5
mR
NA
leve
l in
% o
f GA
PDH
N7 A1 A7 A7N3
Hsp30, 13°C
0,0
0,2
0,4
0,6
0,8
1,0
1,2
0 1 2 3 4
mR
NA
leve
l in
% o
f GA
PD
5
H
N7 A1 A7 A7N7
***
Figure 3.8. Relative mRNA levels of Hsp30 in the brain of crucian carp, exposed to different oxygen
regimes at 8°C or 13°C. The data are normalized using GAPDH as internal reference gene and are presented
as individual values with lines representing mean values. * =P<0.05, compared to N7, ** =P<0.01. For
number of fish in each exposure group, see table 2.2. For statistical details, see appendix III.
35

Discussion
4 Discussion
In the present study, mRNA levels of 12 different genes hypothesized to be
related to anoxic survival strategies were quantified in brain tissue of crucian carp, as a
first step to assess their role in anoxia tolerance. The studied genes included subunits of
voltage-gated Na+ (Nav) and Ca2+ (Cav) channels and heat shock proteins (Hsps).
Relative mRNA levels of the α-subunits of seven voltage-gated ion channels were
quantified to investigate the potential presence of “channel arrest” in brain tissue of
crucian carp exposed to anoxia. Even though the crucian carp remains active during
anoxia, its activity is reduced indicating that a reduction of neuronal ion permeability
could form a part of its survival strategy.
Hsps are well-known to play protective roles in cells subjected to stress (Brown,
1990; Airaksinen et al., 1998; Lee et al., 2001). Therefore, the mRNA of five different
Hsps was quantified in crucian carp brain to assess the possibility that these proteins are
involved in protective mechanisms during anoxia. This was done in crucian carp kept at
8°C or 13°C to examine if temperature affects anoxic survival mechanisms.
4.1 Methodological considerations
As noted in section 2.4, cloning of three voltage-gated ion channel isoforms
failed; Nav 1.1, Cav 2.2 and Cav 3.3, and it may be several reasons for this. Firstly,
homology in-between ion channel families could complicate the cloning. Moreover, the
primers were designed primarily from zebrafish (Danio rerio) sequences, and although
this species is a close relative to the crucian carp, these particular gene sequences may
have evolved differently in crucian carp and zebrafish. Therefore, the non-crucian carp
specific primers may have failed to align to the crucian carp sequences of these three ion
channel isoforms. Other possibilities are that these isoforms are lacking in the crucian
carp genome or are not expressed, or only expressed at very low levels.
Most current knowledge on the functions of voltage-gated ion channels comes
from mammalian studies, and the properties of these proteins may not necessarily be the
same in fish. Moreover, one additional genome duplication is found in fish compared to
36

Discussion
mammals. Thus, it is possible that fish show an even more complex expression of ion
channel subunits. An ion channel diversity that appears higher than in mammals has been
observed for other ion channels in crucian carp, such as AMPAR and NMDAR (Ellefsen,
S., Unpublished).
In the crucian carp habitat, anoxia is most likely to occur during the winter, and
hence at temperatures close to 0°C. The temperatures at which crucian carp were exposed
to anoxia in this thesis are likely to be higher than those naturally experienced by anoxic
crucian carp. Still, virtually all previous studies on physiological and molecular responses
to anoxia of anoxia tolerant vertebrates have been done at temperatures considerably
higher than 0°C. With regard to goldfish and turtles, most studies have been done at room
temperature. Although it can be argued that such studies are better performed at low
“natural” temperatures, running anoxia exposures at higher temperatures are generally
more practical and may also speed up the anoxic responses and even exaggerate them to
make them more clear cut. After all, these animals do tolerate anoxia at temperatures
above 0°C. Indeed, the observed differences in mRNA expression between fish going
through anoxia at 13°C compared to 8°C are likely to provide additional insight in to the
survival mechanisms involved.
It should be acknowledged that studying heat shock proteins and voltage-gated
ion channels at the level of mRNA, may not necessarily translate into changes in protein
function, which is a general problem associated with surveying mRNA levels. Smith et
al. (1999) found a general decrease in the rate of RNA synthesis in anoxic crucian carp
brain, while an earlier study by the same authors failed to detect a general decrease in
brain protein synthesis under the same conditions (Smith et al., 1996). Still, analyzing
molecular responses on the mRNA level has proven to give valuable insights in
numerous physiological and pathological processes and is the technical fundament of
functional genomics.
4.2 Effect of anoxia on mRNA levels of voltage-gated ion channels.
As described in section 2.5.2, mRNA levels of the α-subunit of voltage-gated ion
channels were normalized to β-actin as internal reference gene, since the β-actin
37
Discussion
expression profile remained relatively unaffected by anoxia at the respective temperature
(Figure 2.3 B).
4.2.1 Relative mRNA expression of voltage-gated Na+ channels
Nav channels are important for conducting action potentials along neurons and a
decrease in their expression was hypothesized to occur in neurons of anoxic crucian carp
to save energy.
No significant changes in mRNA levels of the α-subunits of Nav 1.1 or in Nav 1.6
were seen during anoxia (Figure 3.1). However, mRNA levels of the Nav 1.3 α-subunit
showed a significant decrease in the A1 group compared to N7, but the expression of this
subunit appeared to recover after seven days of anoxia. This trend was seen in all Nav
channel subunits studied with the common feature of coinciding levels of mRNA in the
N7 and A7N7 groups. The results may indicate that the crucian carp alters the expression
of the Nav channel genes slightly as an immediate response to anoxia, but overall the Nav
channel α-subunit expression remained strikingly stable in face of anoxia. These findings
were not in accordance with our hypotheses where a decrease in mRNA levels in
response to anoxia was expected. However, other factors could influence the opening
properties of the Nav channels such as phosphorylation by cAMP-dependent kinase or
protein kinase C (PKC) (Catterall, 2000a), and a modulation of the auxiliary subunits can
also occur (Isom et al., 1992; Isom et al., 1995). Bickler and Buck (1998) suggested that
an effect from PKC may influence the activity of ion channel activity by labeling the ion
channel for internalization and hence, put it out of action.
4.2.2 Relative mRNA expression of voltage-gated Ca2+ channels
Disruption of the Ca2+ gradient in cells under anoxia may contribute to
uncontrolled intracellular signaling and eventually cell death (Bickler & Buck, 1998).
Moreover, a reduced Ca2+ permeability is likely to suppress neurotransmission and
thereby reduce neuronal energy use. It was therefore hypothesized that the expression of
Cav channels would change in response to anoxia.
38

Discussion
However, none of the Cav channel subunits investigated showed a significantly
altered expression in response to the different exposures (Figure 3.2 and 3.3). It could be
noted that all Cav channel subunits displayed a similar trend of mRNA expression as the
Nav channel subunits, tending to show a small immediate response to anoxia, but in
general their expression was strikingly stable.
Like with Nav channels, there are several ways of controlling the activity of Cav
channels except altering their expression. These include modulation by G-protein-
coupled pathways and phosphorylation of the ion channels by kinases such as cAMP-
dependent kinase or protein kinase C (Brown & Birnbaumer, 1990; Hille, 1994; Ikeda,
1996; Catterall, 2000b). Alterations of the auxiliary subunits may also, affect the opening
mechanisms of the ion channels (Gurnett et al., 1996). Recent data suggest that the α2-
subunit control internalization via conformational effects exert by the pore-forming
subunit (Bernstein & Jones, In press).
4.3 Effect of anoxia and temperature on mRNA levels of Hsps
Hsp mRNA levels were normalized to GAPDH as internal RNA reference gene
and quantified at two different temperatures. GAPDH was chosen since it showed the
most stable expression profile in these experimental groups (Figure 2.3 A and C).
Brain tissue of crucian carp exposed to anoxia showed increased mRNA levels of
Hsp70.1 (Figure 3.4). A moderate but continuous increase of Hsp70.1 mRNA levels was
seen at 8°C, in contrast to a stronger increase in response to 7 days of anoxia at 13°C,
followed by a decrease after reoxygenation. Moreover, the relative Hsp70.1 mRNA level
in normoxia at 8°C was more than 7 times higher compared to normoxia at 13°C.
However, it can not be excluded that these apparent differences were, at least partly,
related to a change in the expression of the reference gene (GAPDH) in response to
temperature.
The mRNA levels of Hsp70.2 at 8°C showed an increase in response to anoxia
(both in A1 and A7), but in contrast to Hsp70.1, it fell back to nearly pre-anoxic levels
after reoxygenation (Figure 3.5). Moreover, at 8°C the mRNA level of Hsp70.2 in the N7
group was about 1/7 of those of Hsp70.1 in the same group. However, at 13°C, the
39

Discussion
response in mRNA expression was quite similar for both paralogs, with a distinct
increase of mRNA in the A7 group. Figure 4.1 summarizes the data on Hsp70.1 and
Hsp70.2 expression in crucian carp brain tissue at 8°C and 13°C. Interestingly, the sharp
rise in the Hsp70.1 mRNA level at 13°C made it coincide with that at 8°C in the A7
group, while the mRNA levels of Hsp70.2 coincide at both temperatures in the N7 and
A7N3/N7 group. But then again, this could be an effect of possible changes in the
expression of the internal reference gene, GAPDH, in response to temperature.
These findings indicate that mRNA expressions of both Hsp70.1 and Hsp70.2 are
induced by anoxia, but that they may serve slightly different functions in brain tissue of
crucian carp exposed to anoxia at 8°C.
Hsp70.1
0,00,20,40,60,81,01,21,41,61,82,0
0 1 2 3 4 5
mR
NA
leve
l in
% o
f GA
PDH
N7 A1 A7 A7N3/N7
8°C
Hsp70.2
0,00,10,20,30,40,50,60,70,80,91,0
0 1 2 3 4 5
mR
NA
leve
l in
% o
f GA
PDH
N7 A1 A7 A7N3/N7
8°C 13°C 13°C
Figure 4.1. Relative mRNA level of Hsp70.1 in crucian carp brain at both 8°C (black) and 13°C (red).
Data are normalized using GAPDH as internal reference gene, and are presented as individual values, with lines
representing mean values.
Because anoxia is probably most likely to occur during the winter when ice
covers the lakes, and the water temperature is close to 0°C, the changes in Hsp70.1
expression may reflect the expectation of an approaching anoxic winter. Previous
experiments on an anoxia-tolerant tropical species, the epaulette shark, have shown
significant increase of Hsp70 levels in response to anoxic preconditioning, while acute
hypoxia exposure was without effect (Renshaw et al., 2004). In the case of the epaulette
shark, which live in a habitat where a few short hypoxic episodes are often followed by
longer more severe hypoxia, hypoxic preconditioning may be important for hypoxic
survival. For the crucian carp, low temperatures could serve as a similar function by
40

Discussion
triggering physiological and molecular changes that prepares the fish for the anoxic
winter. At this temperature a week-long anoxic bout may serve a similar preparatory
function, as indicated by the continued rise in Hsp70.1 mRNA levels at 8°C. Thus, the
present data suggest that both low temperature and low oxygen serve as stimuli to
increase the expression of Hsp70.1 in crucian carp brain.
Relative mRNA levels of Hsc70 showed a significant decrease in the A7 group at
both temperatures (Figure 3.7). However, mRNA levels of Hsc70 were found to be nearly
4 fold higher in the N7 group at 8°C compared to the N7 group at 13°C (assuming that
GAPDH mRNA expression was unaltered by temperature). The decrease of mRNA
levels in the A7 groups compare to the N7 was greater at 13°C than at 8°C. Furthermore,
at 8°C normoxic Hsc70 mRNA levels were almost 30 times higher than Hsp70.1, and
almost 200 times higher than Hsp70.2. Hsc70 is generally regarded to be highly
expressed under normal conditions while Hsp70 is normally expressed at low levels and
is induced by stressors. A suggested function for Hsc70 is axonal transport of properly
folded proteins to synapses (Black et al., 1991), and the depression of Hsc70 mRNA
expression found in this study may reflect a reduced synaptic transmission and, thus,
suppressed neuronal activity. Previous studies have shown a significant increase in the
level of extracellular GABA in anoxic crucian carp brain, which is likely to cause a
reduction in synaptic transmission (Hylland & Nilsson, 1999b).
Figure 4.2 illustrates mRNA expression of Hsc70 in crucian carp heart at 8°C and
13°C (Ellefsen, S., Stensløkken, K-O, & Nilsson, G., Unpublished), where no significant
decrease is detected in response to anoxia. Instead, an increase of mRNA expression is
found in heart in A7 and A7N3/N7 groups compared to normoxia. The difference in
Hsc70 expression pattern in brain versus heart strengthens the hypotheses that brain
Hsc70 plays a role in the synapses and that the need for synaptic transport is reduced in
anoxia.
41

Discussion
Hsc70 in Cc Heart, 8°C
0100200300400500600700
0 1 2 3 4 5
mR
NA
leve
l in
% o
f 2A
4
N7 A1 A7 A7N3
****
Hsc70 in Cc Heart, 13°C
0
50
100
150
200
250
300
0 1 2 3 4 5
mR
NA
leve
l in
% o
f 2A
4
N7 A1 A7 A7N7
***
Figure 4.2. Relative mRNA level of Hsc70 in crucian carp heart at 8°C and 13°C. The data are
normalized using external reference gene (2A-4) and are presented as individual values with lines
representing mean values. * = P<0.05, **=P<0.01, One-way ANOVA, Dunnett post test at 8°C, and
Kruskal-Wallis, Dunn’s post test, at 13°C. (Unpublished data from Ellefsen, S., Stensløkken, K-O., and
Nilsson, G.)
A significant decrease of Hsp90 mRNA was detected at 8°C after 7 days of anoxia
while at 13°C no significant change was found (Figure 3.8). With regard to Hsp30, a
significant decrease in the mRNA levels was found at 13°C in response to anoxia, but no
change was seen at 8°C. Both proteins may have roles in maintaining the cytoskeleton
and interact with microfilaments, and a fall in their mRNA levels might indicate that
intracellular transport and formation of new cells are given a lower priority under anoxic
conditions or are suppressed to save energy. Mitosis has been found to be depressed in
anoxic crucian carp tissues (gills, liver and intestine) (Sollid et al., 2005), although the
brain remains to be examined in this respect.
42

Discussion
4.4 Conclusions
Relative mRNA levels of voltage-gated ion channels did not change significantly in
the crucian carp brain, except for the temporarily fall in the mRNA level of Nav 1.3 α-
subunit. This was not in accordance with the “channel-arrest” hypothesis. However, a
reduced channel activity cannot be excluded since channel function can be modulated in
many other ways than by changes in mRNA levels. Moreover, the results do support an
earlier study on crucian carp brain showing a lack of change in membrane Ca2+
permeability (Thorén, 2000). Also, a study of K+ permeability of crucian carp brain failed
to detect a change in anoxia (Johansson & Nilsson, 1995). Thus, Nilsson (2001)
suggested that “channel arrest” may be a too drastic strategy for anoxic metabolic
depression in crucian carp, since this animal, in contrast to turtles, remain active in
anoxia. For crucian carp, altered neurotransmitter release may represent a better and more
subtle way of depressing energy use in anoxia.
An increased mRNA expression of Hsp70.1 at 8°C suggests a possible adaptation of
the crucian carp for an approaching anoxic winter. Two forms of Hsp70 were found and
the dissimilar expression of Hsp70.1 compared to Hsp70.2 at 8°C points to some
difference in the functions of these two forms, although at 13°C both paralogs were
induced by anoxia in a similar fashion.
A significant decrease in Hsc70 mRNA levels was found after 7 days of anoxia at
both 8°C and 13°C. This could relate to the suggested function of Hsc70 in axonal
transport which may play a part in anoxia-induced suppression of neuronal transmission.
A significant decrease was found in Hsp90 and Hsp30 compared to normoxia, at
8°C and 13°C, respectively. Both proteins have been suggested to participate in
maintenance of the cytoskeleton and microfilaments, and the changes may reflect a
reduced formation of new cells and lowered cytosolic trafficking during anoxia.
43

Appendices
Appendices
Appendix I Abbreviations
Appendix II Reagents, equipment and software
Appendix III Statistical details
Appendix IV Sequences and real-time RT-PCR products
44

Appendices
Appendix I
Abbreviations A1 anoxia exposure 1 day A7 anoxia exposure 7 days A7N3 anoxia exposure 7 days followed by normoxia 3 days A7N7 anoxia exposure 7 days followed by normoxia 7 days Acc. accession number (from GenBank) AMPA α-amino-5-hydroxy-3-methyl-4-isoxasole propionic acid receptor ANOVA analysis of variance ATP adenosine triphosphate cAMP cyclic adenosine 5'-monophosphate-activated protein Ca Carassius auratus (goldfish) Cav voltage-gated calcium (channel) Cc Carassius carassius (crucian carp) cDNA complementary deoxyribo nucleic acid CNS central nervous system EEG electroencephalogram EST expressed sequence tag GABA gamma-aminobutyric acid GAPDH glyceraldehydes-3-phosphate dehydrogenase Hsc cognate heat shock protein Hsp heat shock protein IPTG isopropyl-beta-D-thiogalactopyranoside mRNA messenger ribonucleic acid N7 normoxia 7 days Nav voltage-gated sodium (channel) NMDA N-methyl-D-aspartate receptor OD optical density PCR polymerase chain reaction PKC protein kinase C PPIA peptidylpropyl isomerase A RT reverse transcriptase SD standard deviation X-Gal 5-bromo-4-chloro-3-indolyl-beta-D-galactopyranoside
45

Appendices
Appendix II
Reagents, equipment and software The following reagents, equipment and software were used in this thesis.
Reagents (product, catalogue number and manufacturer)
Agarose, SeaKem®, 50004, Cambrex Ampicillin (D[-]-α-Aminobenzylpenicillin), A-9518, Sigma Chloroform, C2432, Sigma DEPC (dietyl pyrokarbonat), SD5758, Sigma DNase I (Amplification grade), 18068-015, Invitrogen dNTP-mix, 10297-018, Invitrogen Etidium bromide, 443922U, BDH-Electron FastStart Taq Polymerase, 03515885001, Roche Diagnostics LightCycler® FastStart DNA MasterPLUS SYBR Green I, 03515885001, Roche
Diagnostics pGEM®-T East Vector Systems, A1360, Promega RNA 6000 Nano Lab Chip ® Kit, 5065-4474, Agilent RNA 6000 Nano Reagents PartI, 5067-1511, Agilent SOC medium, 15544-034, Invitrogen SuperscriptTM III Reverse Transcriptase, 18080-(044), Invitrogen T7 RNA Polymerase, 18033-019, Invitrogen TRIzol® Reagent, 15596-018, Invitrogen X-Gal, V3941, Promega Equipment (product, catalogue number/model and manufacturer)
Agilent Bioanalyzer, G2938B, Agilent BioDoc-ItTM System, UVP Eppendorf centrifuge, 5417R, Eppendorf Finnpipettes, U23386, T27033, T27388, T28301, Thermo Labsystems Homogenizer, Duall® 22, Kontes glass Homogenizer, Ultra-Turrax T 8, IKA LightCycler Capillaries (20 μl), 11909339001, Roche Diagnostics LightCycler Carousel Centrifuge, 12189682001, Roche Diagnostics LightCycler 2.0 Instrument, 03531414201, Roche Diagnostics NanoDrop®, Model ND-1000, NanoDrop Technologies N2-gas, AGA Software
Bioanalyzer 2100 expert, version B.01.02 SII36, Agilent Technologies GraphPad InStat 3.06, GraphPad Software Inc. LightCycler3 Data Analysis, version 3.5.28, Idaho Technology Inc. LightCycler3 Front, version 3.5.17, Idaho Technology Inc.
46

Appendices
LightCycler Probe Design Software, version 1.0, Roche Diagnostics LightCycler3 Run, version 5.32, Idaho Technology Inc./Roche Diagnostics NanoDrop 3.0.1, Coleman Technologies Inc. Freeware
BioEdit Sequence alignment editor, version (http://www.mbio.ncsu.edu/BioEdit/page2.html), © 1997-2005 by Tom Hall
ClustalX, version 1.81, June 2000 (ftp://ftp-igbmc.u-strasbg.fr/pub/ClustalX/) GeneDoc (http://www.psc.edu/biomed/genedoc/), © 2000 by Karl Nicholas GENSCAN (http://gens.mit.edu/GENSCAN.html) © 1997-2000 by Christopher Burge LinReg, version 7.5 (Available on request; e-mail: [email protected]; subject: LinReg
PCR), Dr. J. M. Ruijter, Department of Anatomy and Embryology, Academic Medical Centre, Amsterdam, Netherlands
Primer3 (http://frodo.wi.mit.edu/cgi-bin/primer3/primer3_www.cgi), © 2004 Whitehead Institute for Biomedical Research
47

Appendices
Appendix III
Statistical details The following information shows statistical details of each gene of interest, with the
reference to where a graphical presentation is found in this thesis.
Gene of interest
Test P-value Post-test n in each group
Reference
Nav 1.1 One-way ANOVA
0.0289 Dunnett 5 and 6(A7N7) Figure 3.1
Nav 1.3 Kruskal-Wallis 0.0361 Dunn’s 5 and 6(A7N7) Figure 3.1
Nav 1.6 One-way ANOVA
0.1595 Dunnett 5 and 6(A7N7) Figure 3.1
Cav 2.1 One-way ANOVA
0.0545 Dunnett 5 and 6(A7N7) Figure 3.2
Cav 2.3 One-way ANOVA
0.1565 Dunnett 5 and 6(A7N7) Figure 3.2
Cav 3.1 One-way ANOVA
0.0087 Dunnett 5 and 6(A7N7) Figure 3.3
Cav 3.2 One-way ANOVA
0.1425 Dunnett 5 and 6(A7N7) Figure 3.3
Hsp70.1, 8°C Kruskal-Wallis 0.0026 Dunn’s 6,5,7,4 Figure 3.4
Hsp70.2, 8°C Kruskal-Wallis 0.0111 Dunn’s 6,5,7,4 Figure 3.5
Hsc70, 8°C Kruskal-Wallis 0.0012 Dunn’s 6,5,7,4 Figure 3.7
Hsp90, 8°C Kruskal-Wallis 0.0013 Dunn’s 6,5,7,4 Figure 3.8
Hsp30, 8°C Kruskal-Wallis 0.0190 Dunn’s 6,5,7,4 Figure 3.9
Hsp70.1, 13°C Kruskal-Wallis 0.0004 Dunn’s 6 Figure 3.4
Hsp70.2, 13°C Kruskal-Wallis 0.0008 Dunn’s 6 Figure 3.5
Hsc70, 13°C One-way ANOVA
< 0.0001 Dunnett 6 Figure 3.6
Hsp90, 13°C Kruskal-Wallis 0.0100 Dunn’s 6 Figure 3.7
Hsp30, 13°C One-way ANOVA
< 0.0001 Dunnett 6 Figure 3.8
48

Appendices
Appendix IV
Sequences and real-time RT-PCR products The following sequences of crucian carp (Cc) were obtained by cloning and sequencing
of cDNA. Sequences of goldfish (Ca) were retrieved from GenBank and are listed with
the respective accession number. The real-time RT-PCR products from each gene are
highlighted in blue.
Nav 1.1_Cc_637bp real-time RT-PCR-Product: 439-585 CGTAACAGATTTTGTGGATTTGGGCAATGTCTCAGCACTGAGAACCTTCAGGGTTTTACGAGCACTCAAAACTATATCAGTGATTCCAGGTCTGAAGACTATCGTTGGCGCTCTAATCCAGTCGGTGAAGAAGCTGTCAGATGTGATGATCCTGACTGTGTTCTGTCTGAGTGTGTTTGCTCTGATTGGACTGCAGCTCTTCATGGGAAACCTGCGGCAGAAGTGTGTGAAGATTCCAKAGGTCAATGTCACTGAAAACCTGACCGCCACGCTGAACTACAGCACCGGTTTAGAGCTGCACAGCACCTTTAACTGGACAGAGTACATTAGTGATGCGAGCAATTACTATTTCCTCCCAGACCGCAGAGATCCTTTGCTATGTGGAAATTCRAGTGATGCAGGGCAGTGTCCAGAGGGCTTCATGTGTATAAAAGCAGGTCGTAATCCTGACTATGGCTACACAAGCTTTGACACATTCAGCTGGGCCTTCCTCTCACTCTTCCGACTCATGACACAAGACTTCTGGGAAAACCTCTACCAACAGAACCCTGCGTGCAGCTGGAAAGCCCTATATGATCTTCTTTGTTCTTGTGATTTTCCTGGGCTCCTTCTATCTGGTGAACCTCATCCTGGCTGT Nav 1.3_Ca_589bp (Acc. AF372583) real-time RT-PCR-Product: 385-514 AGCGCTGGCATTTGAAGACATTTACATTGAGCAAAGGAAAGTGGTCAAAGTGGTGCTTGAATACGCAGACAAGATCTTCACCTACATCTTCATCTTGGAAATGGGTCTGAAGTGGATCGCCTACGGTTTCAGGAAGTACTTCACCAACTACTGGTGCTGGCTTGACTTCCTCATTGTGGATGTGTCTCCCGTAAGCCTTGTAGCAAACACGCTGGGCTACTCGGACTTTTCTGCCATCAAATCTCTCCGAACGCTTAGAGCCCTCAGACCGCTGAGAGCACTGTCCCGGTTTGAAGGCATGAGGGTGGTGGTGAACGCTCTGATCGGGGCGATCCCGTCCATCATGAACGTGCTGCTGGTGTGTCTCATCTTCTGGCTCATCTTCAGCATCATGGGAGTCAATCCGTTCGCCGGGAAGTTCGGCCGCTGTGTCAACCGCACCGGCTTCATCTTCAACGCCTCCTTCATCAACAACAAGAGCGAGTGTCTGGAGATGAACAGCACGCAGTATTACTGGAGCAAAGTCAAGGTTAACTTCGATAACGTGGGCGCTGGGTACCTCGCTCTGCTGCAGGTGGCCACGTTCAAG Nav 1.6_Cc_609bp real-time RT-PCR-Product: 409-528 TGTAACAGAGTTTGTGGATTTGGGGAATGTATCTGCGCTGAGAACATTCAGAGTTCTCCGAGCATTGAAAACTATCTCTGTCATTCCAGGTCTGAAGACCATTGTTGGCGCTTTGATCCAGTCGGTGAAGAAGCTGTCAGATGTGATGATCCTCACCGTTTTCTGCCTCAGTGTCTTTGCCCTCATTGGTCTGCAGCTCTTCATGGGAAATCTGCGGCACAAGTGTGTCATCTGGCCCATCAACATGACAGAAAAATACCAGGCCAATGGCACCCATGCATTCAACTGGGATGAGTACATCATGAATGATACCAATTTCTACTTCCTGCCGGACCAGCTTGATGCTCTTCTATGTGGAAACAGCTCTGATTCAGGTCGCTGTCCTGAAGGCTACACATGCATGAAGGCTGGTCGCAATCCAAACTATGGGTACACCAGCTTTGACAGTTTTGGCTGGGCTTTCCTGGCTCTATTCCGCCTCATGACGCAGGACTTTTGGGAGAACTTGTACATGCTGACCCTGAGAGCAGCGGGGAAAACATACATGATTTTCTTTGTGCTGGTTATCTTTGTTGGCTCATTCTACCTTGTGAACCTCATCCTGGCTGT
49
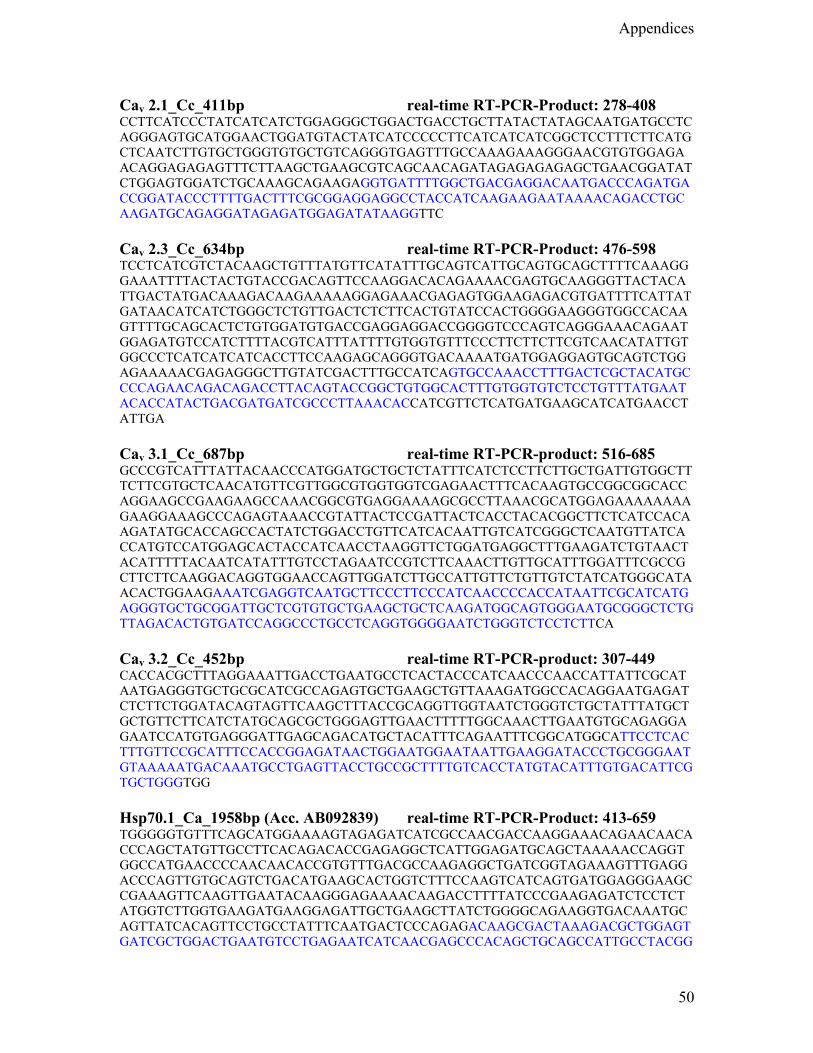
Appendices
Cav 2.1_Cc_411bp real-time RT-PCR-Product: 278-408 CCTTCATCCCTATCATCATCTGGAGGGCTGGACTGACCTGCTTATACTATAGCAATGATGCCTCAGGGAGTGCATGGAACTGGATGTACTATCATCCCCCTTCATCATCATCGGCTCCTTTCTTCATGCTCAATCTTGTGCTGGGTGTGCTGTCAGGGTGAGTTTGCCAAAGAAAGGGAACGTGTGGAGAACAGGAGAGAGTTTCTTAAGCTGAAGCGTCAGCAACAGATAGAGAGAGAGCTGAACGGATATCTGGAGTGGATCTGCAAAGCAGAAGAGGTGATTTTGGCTGACGAGGACAATGACCCAGATGACCGGATACCCTTTTGACTTTCGCGGAGGAGGCCTACCATCAAGAAGAATAAAACAGACCTGCAAGATGCAGAGGATAGAGATGGAGATATAAGGTTC Cav 2.3_Cc_634bp real-time RT-PCR-Product: 476-598 TCCTCATCGTCTACAAGCTGTTTATGTTCATATTTGCAGTCATTGCAGTGCAGCTTTTCAAAGGGAAATTTTACTACTGTACCGACAGTTCCAAGGACACAGAAAACGAGTGCAAGGGTTACTACATTGACTATGACAAAGACAAGAAAAAGGAGAAACGAGAGTGGAAGAGACGTGATTTTCATTATGATAACATCATCTGGGCTCTGTTGACTCTCTTCACTGTATCCACTGGGGAAGGGTGGCCACAAGTTTTGCAGCACTCTGTGGATGTGACCGAGGAGGACCGGGGTCCCAGTCAGGGAAACAGAATGGAGATGTCCATCTTTTACGTCATTTATTTTGTGGTGTTTCCCTTCTTCTTCGTCAACATATTGTGGCCCTCATCATCATCACCTTCCAAGAGCAGGGTGACAAAATGATGGAGGAGTGCAGTCTGGAGAAAAACGAGAGGGCTTGTATCGACTTTGCCATCAGTGCCAAACCTTTGACTCGCTACATGCCCCAGAACAGACAGACCTTACAGTACCGGCTGTGGCACTTTGTGGTGTCTCCTGTTTATGAATACACCATACTGACGATGATCGCCCTTAAACACCATCGTTCTCATGATGAAGCATCATGAACCTATTGA Cav 3.1_Cc_687bp real-time RT-PCR-product: 516-685 GCCCGTCATTTATTACAACCCATGGATGCTGCTCTATTTCATCTCCTTCTTGCTGATTGTGGCTTTCTTCGTGCTCAACATGTTCGTTGGCGTGGTGGTCGAGAACTTTCACAAGTGCCGGCGGCACCAGGAAGCCGAAGAAGCCAAACGGCGTGAGGAAAAGCGCCTTAAACGCATGGAGAAAAAAAAGAAGGAAAGCCCAGAGTAAACCGTATTACTCCGATTACTCACCTACACGGCTTCTCATCCACAAGATATGCACCAGCCACTATCTGGACCTGTTCATCACAATTGTCATCGGGCTCAATGTTATCACCATGTCCATGGAGCACTACCATCAACCTAAGGTTCTGGATGAGGCTTTGAAGATCTGTAACTACATTTTTACAATCATATTTGTCCTAGAATCCGTCTTCAAACTTGTTGCATTTGGATTTCGCCGCTTCTTCAAGGACAGGTGGAACCAGTTGGATCTTGCCATTGTTCTGTTGTCTATCATGGGCATAACACTGGAAGAAATCGAGGTCAATGCTTCCCTTCCCATCAACCCCACCATAATTCGCATCATGAGGGTGCTGCGGATTGCTCGTGTGCTGAAGCTGCTCAAGATGGCAGTGGGAATGCGGGCTCTGTTAGACACTGTGATCCAGGCCCTGCCTCAGGTGGGGAATCTGGGTCTCCTCTTCA Cav 3.2_Cc_452bp real-time RT-PCR-product: 307-449 CACCACGCTTTAGGAAATTGACCTGAATGCCTCACTACCCATCAACCCAACCATTATTCGCATAATGAGGGTGCTGCGCATCGCCAGAGTGCTGAAGCTGTTAAAGATGGCCACAGGAATGAGATCTCTTCTGGATACAGTAGTTCAAGCTTTACCGCAGGTTGGTAATCTGGGTCTGCTATTTATGCTGCTGTTCTTCATCTATGCAGCGCTGGGAGTTGAACTTTTTGGCAAACTTGAATGTGCAGAGGAGAATCCATGTGAGGGATTGAGCAGACATGCTACATTTCAGAATTTCGGCATGGCATTCCTCACTTTGTTCCGCATTTCCACCGGAGATAACTGGAATGGAATAATTGAAGGATACCCTGCGGGAATGTAAAAATGACAAATGCCTGAGTTACCTGCCGCTTTTGTCACCTATGTACATTTGTGACATTCGTGCTGGGTGG Hsp70.1_Ca_1958bp (Acc. AB092839) real-time RT-PCR-Product: 413-659 TGGGGGTGTTTCAGCATGGAAAAGTAGAGATCATCGCCAACGACCAAGGAAACAGAACAACACCCAGCTATGTTGCCTTCACAGACACCGAGAGGCTCATTGGAGATGCAGCTAAAAACCAGGTGGCCATGAACCCCAACAACACCGTGTTTGACGCCAAGAGGCTGATCGGTAGAAAGTTTGAGGACCCAGTTGTGCAGTCTGACATGAAGCACTGGTCTTTCCAAGTCATCAGTGATGGAGGGAAGCCGAAAGTTCAAGTTGAATACAAGGGAGAAAACAAGACCTTTTATCCCGAAGAGATCTCCTCTATGGTCTTGGTGAAGATGAAGGAGATTGCTGAAGCTTATCTGGGGCAGAAGGTGACAAATGCAGTTATCACAGTTCCTGCCTATTTCAATGACTCCCAGAGACAAGCGACTAAAGACGCTGGAGTGATCGCTGGACTGAATGTCCTGAGAATCATCAACGAGCCCACAGCTGCAGCCATTGCCTACGG
50

Appendices
CCTCGACAAAGGCAAAGCTTCAGAGCGCAACGTGCTGATCTTTGACCTGGGAGGAGGCACCTTTGATGTGTCCATCCTGACCATTGAAGATGGCATCTTTGAGGTGAAGGCCACGGCTGGAGACACTCATCTGGGCGGAGAGGACTTCGACAACCGCATGGTGAATCACTTTGTTGAAGAATTCAAGAGGAAGCACAAGAAGGACATCAGTCAGAACAAGAGAGCCCTGAGGAGGCTGAGGACAGCGTGTGAGCGAGCCAAGAGGACCCTCTCGTCCAGCTCTCAGGCCAGCATTGAGATCGACTCGCTGTACGAGGGCATCGACTTCTACACGTCCATCACCAGAGCTCGCTTTGAAGAGATGTGCTCGGACCTCTTCAGAGGAACACTTGAGCCTGTGGAAAAAGCCCTGAGAGACGCCCAGATGGACAAGTCTCAGATCAATGACGTTGTGCTGGTCGGAGGATCGACAAGAATCCCAAAGATCCAGAAGCTTCTGCAGGATTTCTTCAACGGCAGAGACTTGAACAAGAGCATCAACCCAGACGAGGCAGTGGCTTATGGTGCCGCGGTCCAAGCCGCCATCCTCATGGGAGACACATCTGGAAACGTCCAGGACCTGCTGCTGCTGGATGTGGCTCGTCTGTCCCTGGGTATCGAAACCGCAGGCGGAGTCATGACGGCCCTCATCAAACGCAACACCACCATCCCCACCAAACAGACCCAGACCTTCAGCACCTACTCAGACAACCAGCCCGGTGTCCTGATCCAGGTCTACGAGGGAGAGAGGGCCATGACAAAAGACAACAACCTGCTGGGTAAATTTGAGCTGACAGGAATCCCACCTGCTCCACGTGGAGTCCCGCAGATCGAAGTCACCTTTGACATCGACGCCAACGGAATCCTAAATGTGTCGGCAGTGGACAAAAGCACCGGAAAAGAGAACAAGATCACCATCACCAATGACAAGGGCAGACTGAGTAAAGACGAGATCGAGAGGATGGTGCAGGAAGCAGACAAGTACAAAGCTGAAGACGATCTGCAAAGAGAGAAGATTGCTGCCAAAAACTCTCTGGAGTCTTACGCCTTCAACATGAAGAACAGTGTGGAAGATGAGGACCTGAAGGGAAAGATCAGCGAGGACGACAAGAAGAAAGTTATTGAGAAATGTAACGAGGCCGTCAGCTGGCTAGAAAACAACCAGCTGGCTGACAAAGAGGAGTATGAACATCATCTGAAGGAGCTGGAGAAAGTCTGCAATCCAATCATCACTAAACTGTATCAGGGAGGGATGCCAGCTGGAGGATGTGGAGCTCAGACACGTGGAGGATCAGGGCCGGTGCTCAGGGGCCCAACTATTGAAGAAGTGGATTAAAACACCTCATGAACTGAATGGTGAAGGGACTGATAAACCTCTTTCCTCATTGACTCTTCCATTTATTTAAAAAAAAAAAAAAAA Hsp70.2_Cc_684bp real-time RT-PCR-Product: 510-679 ATCCTGACGATTGAGGATGGGATCTTTGAGGTCAAAGCCACAGCAGGAGACACTCACCTGGGTGGGGAGGACTTCGACAACCGGATGGTGAAGCACTTTGTTGAAGAGTTTAAGAGGAAGCACAAGAAGGACATCAGTCAGAATAAGAGAGCAGTGAGAAGGCTCCGCACGGCCTGCGAAAGAGCTAAAAGGACCCTCTCATCTAGCACTCAGGCCAGTATTGAGATCGATTCCCTGTTTGAAGGCATCGATTTCTATACTTCCATCACAAGGGCTCGATTTGAAGAGCTTAACGCTGAGCTCTTTAGAGGCACGCTGGAACCAGTAGAGAAGGCTTTGGGAGATGCTAAAATGGACAAGTCCCAGATCCATGACATTGTTCTGGTTGGCGGCTCCACCAGGATTCCCAAAATCCAAAAGCTTTTGCAGGATTTCTTCAATGGCAGGGATCTCAACAAGAGCATCAACCCAGATGAGGCGGTGGCATATGGAGCCGCGGTGCAGGCCGCCATCCTGATGGGCGACACCTCGGAAAACGTTCAGGACTTGTTGCTTCTGGACGTGGCTCCTTTGTCCTTGGGTATCGAGACCGCAGGAGGAGTCATGACTGCTCTGATCAAACGAAACACCACCATCCCCACTAAGCAAACGCAGATCTTCTCCACATATTCCGATAACCAGCCG Hsc70_Ca_2208bp (Acc. AB092840) real-time RT-PCR-Product: 486-690 TAGGTGTTTTCCAACATGGAAAAGTTGAAATCATTGCTAATGACCAAGGGAACAGGACCACTCCAAGCTATGTAGCTTTCACAGATACTGAGAGATTGATTGGAGATGCTGCAAAAAATCAGGTCGCAATGAACCCCACCAACACAGTCTTTGATGCCAAGCGTCTGATTGGCCGCAAGTTTGATGATGGCGTTGTTCAGTCTGACATGAAGCACTGGCCTTTTAATGTCATCAATGACAATTCCCGTCCCAAGGTCCAGGTTGAATACAAGGGTGAAGCCAATTCCTTCTACCCTGAAGAGATTTCCTCCATGGTTCTTACCAAGATGAAGGAAATTGCAGAGGCCTACCTGGGAAAGACTGTTTCCAACGCTGTCGTCACCGTGCCTGCCTACTTCAACGATTCTCAGCGACAGGCCACCAAGGATGCTGGAACCATCTCTGGCTTGAATGTTCTGCGTATCATCAATGAACCAACTGCTGCTGCTATTGCTTACGGTCTGGACAAAAAGGTTGGTGCTGAGAGAAATGTCCTCATTTTCGATCTTGGTGGTGGCACTTTCGATGTGTCTATCCTCACCATTGAGGATGGCATCTTCGAGGTCAAATCTACTGCTGGAGACACTCACTTGGGTGGAGAAGACTTTGACAACCGCATGGTGAACCACTTCATCACAGAGTTCAAGCGCCAGCACAAGAAGGACATCACCGACGACAAGAGAGCCGTTCGCCGTCTCCGCACTGCCTGCGAGAGGGCCAAGCGTACCCTATCCTCCAGCACTCAGGCCAGTATTGAGATCGACTCTCTCTATGAGGGTATCGATTTCTATACCTCAATCACCAGGGCCCGTTTTGAGGAGCTCAATGCTGACCTCTTCCGTGGCACCTTGGACCCAGTTGAGAAGTCTCTTCGTGATGCCAAGATGGACAAGGCTCAGATCCACGACATTGTCTTGGTTGGTGGCTCCACTCGCATTCCCAAAATCCAGAAGCTGCTCCAAGACTACTTC
51

Appendices
AATGGCAAGGAGCTCAATAAGAGCATCAATCCCGATGAGGCTGTGGCCTACGGAGCAGCGGTTCAGGCTGCCATCCTGTCTGGTGACAAGTCTGAGAATGTTCAGGACTTGCTGTTGCTAGATGTCACTCCTCTGTCCCTTGGAATTGAGACCGCTGGTGGAGTCATGACTGTCCTCATCAAGCGTAACACCACTATCCCAACCAAACAGACTCAGACTTTCACCACCTATTCTGACAACCAGCCCGGTGTGCTCATTCAGGTCTATGAGGGCGAGCGTGCAATGACAAAGGATAACAACTTGCTGGGCAAGTTTGAGCTTACTGGAATCCCCCCTGCACCTCGTGGTGTTCCCCAGATTGAGGTCACCTTTGACATTGATGCCAATGGCATCATGAATGTTTCAGCTGCAGATAAGAGCACTGGCAAGGAGAACAAAATAACCATCACCTACGACAAGGGTCGTCTCAGCAAGGAGGACATTGAGCGCATGGTGCACGAGGCAGAGAAGTACAAGTCCGAGGATGATGTGCAGCGTGAAAAGGTGTCTGCCAAGAATGGTCTGGAGTCGTACGCCTTCAACATGAAGTCCACTGTTGAGGATGAGAAACTGAAGGGCAAGATCAGTGATGAGGACAAGCAGAAGATCCTTGACAAGTGCAATGAAGTCATCAGTTGGCTTGACAAGAATCAGACTGCTGAGAAGGAAGAGTTTGAGCACCAGCAGAAGGAGCTGGAGAAGATCTGCAACCCCATCATCACCAAGCTGTACCAGAGTGCTGGAGGCATGCCAGGTGGAATGCCTGATGGTATGCCCGGTGGCTTCCCAGGGGCCGGCTCCGCTCCAGGAGGTGGATCCTCTGGCCCAACCATTGAGGAGGTCGACTAAGACATTCCAAAGCCACTGTGCTGCCTCCATAGCAATATTTACTGTTGCCCTCTATAGTTGGACTCCCCTAAAATGGTTACTTTGACGACGTTTTGGACGACTTCAACTTGCAGAGTGATTGTTGCAATTCTAAAAAAGGGGATTAACGGGTCACATTTCTAGATCACTGGGAACAGACTTTCTACCTAGATTGCACAACCTATTTATTGACTTGTGAACTAAGTTCATAAGCCTTATCAAACCACCTCAATGCTTTAAAGAAAACGAATAAAATGGTGACTTGTTCTCAATGAAAAAAAAAAAAAAAAAA Hsp90_Cc_707bp real-time RT-PCR-Product: 423-570 TTCCAGGCTGAGATTGCTCAGCTGATGTCTCTCATCATCAACACTTTCTATTCCAACAAAGAGATCTTCCTCAGGGAGCTCATCTCCAACTCTTCAGATGCTCTGGATAAAATCCGCTATGAGAGTCTCACAGACCCGAGCAAGCTGGACTCAGGAAAAGACCTTAAAATCGAAATCATTCCCAACAAACAAGAGCGCACGCTGACCCTCGTCGACACCGGCATCGGCATGACCAAAGCTGACCTCATCAACAACCTGGGAACCATCGCCAAATCCGGCACCAAGGCCTTCATGGAGGCTCTGCAGGCCGGAGCGGACATCTCCATGATCGGTCAGTTCGGAGTGGGCTTCTATTCCGCCTACTTAGTGGCCGAGAAAGTGACGGTCATCACCAAACACAACGATGACGAGCAGTACGCCTGGGAATCTTCCGCTGGAGGATCCTTCACCGTTAAAGTGGACAGCTCCGAGCCGATCGGTCGAGGAACTAGAGTGATCCTGCATCTGAAGGAGGATCAGACGGAGTACATCGAAGAGCGACGGATCAAAGAGATCGTCAAGAAGCACTCGCAGTTCATTGGCTACCCTATTACGAATCACTAGTGAATTCGCGGCCGCCTGCAGGTCGACCATATGGGAGAGCTCCCAACGCGTTGGATGCATAGCTTGAGTATTCTATAGTGTCACCTAAATAGCTTGGCGTAATC Hsp30_Ca_865bp (Acc. AB177389) real-time RT-PCR-product: 324-561 CCAAATCTAAAAGCCTTACGACGCCACCAGAGAGACAACTCGACTGAGGAGCAAAACTAAAAGCCATTGAAAATGTTGAGCCTGCATGGATTCCAGCCTTCCCTCAGCTCATTCATGGGAATGGACTGGCCAGTGCGCAGTCTCTGGCCGGAGATCACATCTCTTTACAGACATGGAAAAGAACTGCAGGAGCTGAAGAGAAGCCTAGAGCAGCTGGGGAAATTTCAGGATAAGATCCTTGAGGAGATCCAGCTGATGCCACCCTCACAGGAGATCTACCCAGTGGCCTGCACAATGGAGAAAGAAGGAAGCGGCTTTGCTTTGACGCTGGACACTAAAGACTTTTCCCCAGAAGAACTGTCAGTCAGACAGGTGGGCAGGAAGCTGCATGTCAGCGGAAAGAGTGAGAAGAAGCAGGAGGATGGGAAGGGCTCGTACTCTTTCAGAACCCAAGAGTTCAGGCGGGTGTTTGATCTTCCTCAAGGAGTGAATCCTGAGGCGGTGACCTGCTCCATGGCTGATGGAAAGCTCTATATACAGGCACCAGTAAATCAGCCGTCAGATGCTGCTGAGAGGATGCTGCCCATTGACTGTCAAACTGTGAAGACAACGCAGCCGGAGACAGCCGACACCAGCACCACCCAGACGACACTCAACAATCCTGAAAGCACTGAGCACAGAGTACAACCCTCTGCTGGACAATCTTAAATAATGATGTTTTGTTTTATTTAAAAACATTGTGTTGTACTTAATTGTTTTCTGGTCTTTAAGTAATCTAAATGAACAAAAAGATGGATTTTTTATTTTTGAATATATACATGGAATTAAATAAAATAAGAACAGCAAAAAAAAAAAAAAAAAAAAA
52

References
References
Airaksinen S, Rabergh CMI, Sistonen L & Nikinmaa M. (1998). Effects of heat shock and hypoxia on protein synthesis in rainbow trout (Oncorhynchus mykiss) cells. Journal Of Experimental Biology 201, 2543-2551.
Baker SC, Bauer SR, Beyer RP, Brenton JD, Bromley B, Burrill J, Causton H, et al.
(2005). The external RNA controls consortium: a progress report. Nature Methods 2, 731-734.
Bean BP. (1989). Neurotransmitter inhibition of neuronal calcium currents by changes in
channel voltage dependence. Nature 340, 153-156. Bechtold DA, Rush SJ & Brown IR. (2000). Localization of the Heat-Shock Protein
Hsp70 to the Synapse Following Hyperthermic Stress in the Brain. Journal of Neurochemistry 74, 641-646.
Becker J & Craig EA. (1994). Heat-Shock Proteins As Molecular Chaperones. European
Journal Of Biochemistry 219, 11-23. Bernstein GM & Jones OT. (In press). Kinetics of internalization and degradation of N-
type voltage-gated calcium channels: Role of the [alpha]2/[delta] subunit. Cell Calcium In Press, Corrected Proof.
Bickler PE & Buck LT. (1998). Adaptations of vertebrate neurons to hypoxia and anoxia:
maintaining critical Ca2+ concentrations. J Exp Biol 201, 1141-1152. Black MM, Chestnut MH, Pleasure IT & Keen JH. (1991). Stable clathrin: uncoating
protein (hsc70) complexes in intact neurons and their axonal transport. J Neurosci 11, 1163-1172.
Borkovich KA, Farrelly FW, Finkelstein DB, Taulien J & Lindquist S. (1989). hsp82 is
an essential protein that is required in higher concentrations for growth of cells at higher temperatures. Mol Cell Biol 9, 3919-3930.
Brown AM & Birnbaumer L. (1990). Ionic channels and their regulation by G protein
subunits. Annu Rev Physiol 52, 197-213. Brown IR. (1990). Induction Of Heat-Shock (Stress) Genes In The Mammalian Brain By
Hyperthermia And Other Traumatic Events - A Current Perspective. Journal Of Neuroscience Research 27, 247-255.
Buck LT, Land SC & Hochachka PW. (1993). Anoxia-tolerant hepatocytes: model
system for study of reversible metabolic suppression. Am J Physiol 265, R49-56.
53

References
Buisson B, Bottari SP, de Gasparo M, Gallo-Payet N & Payet MD. (1992). The angiotensin AT2 receptor modulates T-type calcium current in non-differentiated NG108-15 cells. FEBS Letters 309, 161.
Burel C, Mezger V, Pinto M, Rallu M, Trigon S & Morange M. (1992). Mammalian heat
shock protein families. Expression and functions. Experientia 48, 629-634. Bustin SA. (2002). Quantification of mRNA using real-time reverse transcription PCR
(RT-PCR): trends and problems. J Mol Endocrinol 29, 23-39. Calabresi P, Mercuri N, Stanzione P, Stefani A & Bernardi G. (1987). Intracellular
Studies On The Dopamine-Induced Firing Inhibition Of Neostriatal Neurons Invitro - Evidence For D1-Receptor Involvement. Neuroscience 20, 757-771.
Catelli MG, Binart N, Jung-Testas I, Renoir JM, Baulieu EE, Feramisco JR & Welch WJ.
(1985). The common 90-kd protein component of non-transformed '8S' steroid receptors is a heat-shock protein. Embo J 4, 3131-3135.
Catterall WA. (1975). Cooperative activation of action potential Na+ ionophore by
neurotoxins. Proc Natl Acad Sci U S A 72, 1782-1786. Catterall WA. (2000a). From ionic currents to molecular mechanisms: the structure and
function of voltage-gated sodium channels. Neuron 26, 13-25. Catterall WA. (2000b). Structure and regulation of voltage-gated Ca2+ channels. Annu
Rev Cell Dev Biol 16, 521-555. Chih CP, Feng ZC, Rosenthal M, Lutz PL & Sick TJ. (1989). Energy metabolism, ion
homeostasis, and evoked potentials in anoxic turtle brain. Am J Physiol 257, R854-860.
Costa MR & Catterall WA. (1984a). Cyclic AMP-dependent phosphorylation of the
alpha subunit of the sodium channel in synaptic nerve ending particles. J Biol Chem 259, 8210-8218.
Costa MR & Catterall WA. (1984b). Phosphorylation of the alpha subunit of the sodium
channel by protein kinase C. Cell Mol Neurobiol 4, 291-297. Craig EA, Ingolia TD & Manseau LJ. (1983). Expression of Drosophila heat-shock
cognate genes during heat shock and development. Dev Biol 99, 418-426. Curtis BM & Catterall WA. (1984). Purification of the calcium antagonist receptor of the
voltage-sensitive calcium channel from skeletal muscle transverse tubules. Biochemistry 23, 2113-2118.
54

References
DeLuca-Flaherty C, McKay DB, Parham P & Hill BL. (1990). Uncoating protein (hsc70) binds a conformationally labile domain of clathrin light chain LCa to stimulate ATP hydrolysis. Cell 62, 875-887.
Demand J, Luders J & Hohfeld J. (1998). The carboxy-terminal domain of Hsc70
provides binding sites for a distinct set of chaperone cofactors. Molecular And Cellular Biology 18, 2023-2028.
Desmadryl G, Hilaire C, Vigues S, Diochot S & Valmier J. (1998). Developmental
regulation of T-, N- and L-type calcium currents in mouse embryonic sensory neurones. European Journal Of Neuroscience 10, 545-552.
Dolphin AC. (1995). Voltage-Dependent Calcium Channels And Their Modulation By
Neurotransmitters And G-Proteins. Experimental Physiology 80, 1-36. Ellefsen S, Sandvik, G K, Steenhoff Hov, D.A., Kristensen, T., Nilsson, G. (2006).
Studies of gene expression in brain of anoxic crucian carp. Elmslie KS, Zhou W & Jones SW. (1990). Lhrh And Gtp-Gamma-S Modify Calcium
Current Activation In Bullfrog Sympathetic Neurons. Neuron 5, 75-80. Erecinska M & Silver IA. (1989). Atp and Brain-Function. Journal of Cerebral Blood
Flow and Metabolism 9, 2-19. Feige U & van Eden W. (1996). Infection, autoimmunity and autoimmune disease. Exs
77, 359-373. Feng ZC, Rosenthal M & Sick TJ. (1988). Suppression of evoked potentials with
continued ion transport during anoxia in turtle brain. Am J Physiol 255, R478-484.
Fernandes JA, Lutz PL, Tannenbaum A, Todorov AT, Liebovitch L & Vertes R. (1997).
Electroencephalogram activity in the anoxic turtle brain. Am J Physiol 273, R911-919.
Franklin TB, Krueger-Naug AM, Clarke DB, Arrigo AP & Currie RW. (2005). The role
of heat shock proteins Hsp70 and Hsp27 in cellular protection of the central nervous system. Int J Hyperthermia 21, 379-392.
Freeman BC, Myers MP, Schumacher R & Morimoto RI. (1995). Identification Of A
Regulatory Motif In Hsp70 That Affects Atpase Activity, Substrate-Binding And Interaction With Hdj-1. Embo Journal 14, 2281-2292.
Freeman WM, Walker SJ & Vrana KE. (1999). Quantitative RT-PCR: Pitfalls and
potential. Biotechniques 26, 112-+.
55

References
Goldin AL. (2001). Resurgence of sodium channel research. Annu Rev Physiol 63, 871-894.
Goldin AL, Snutch T, Lubbert H, Dowsett A, Marshall J, Auld V, Downey W, et al.
(1986). Messenger RNA coding for only the alpha subunit of the rat brain Na channel is sufficient for expression of functional channels in Xenopus oocytes. Proc Natl Acad Sci U S A 83, 7503-7507.
Gottmann K, Dietzel ID, Lux HD, Huck S & Rohrer H. (1988). Development Of Inward
Currents In Chick Sensory And Autonomic Neuronal Precursor Cells In Culture. Journal Of Neuroscience 8, 3722-3732.
Gupta RS & Singh B. (1992). Cloning of the HSP70 gene from Halobacterium
marismortui: relatedness of archaebacterial HSP70 to its eubacterial homologs and a model for the evolution of the HSP70 gene. J Bacteriol 174, 4594-4605.
Gurnett CA, De Waard M & Campbell KP. (1996). Dual function of the voltage-
dependent Ca2+ channel alpha 2 delta subunit in current stimulation and subunit interaction. Neuron 16, 431-440.
Hansen AJ. (1985). Effect of anoxia on ion distribution in the brain. Physiol Rev 65, 101-
148. Hartl FU, Hlodan R & Langer T. (1994). Molecular Chaperones In Protein-Folding - The
Art Of Avoiding Sticky Situations. Trends In Biochemical Sciences 19, 20-25. Herbert CV & Jackson DC. (1985). Temperature Effects On The Responses To
Prolonged Submergence In The Turtle Chrysemys-Picta-Bellii.2. Metabolic-Rate, Blood Acid-Base And Ionic Changes, And Cardiovascular Function In Aerated And Anoxic Water. Physiological Zoology 58, 670-681.
Hille B. (1994). Modulation of ion-channel function by G-protein-coupled receptors.
Trends Neurosci 17, 531-536. Hochachka PW. (1986). Defense strategies against hypoxia and hypothermia. Science
231, 234-241. Hochachka PW. (1988). Metabolic-Coupled, Channel-Coupled, and Pump-Coupled
Functions - Constraints and Compromises of Coadaptation. Canadian Journal of Zoology-Revue Canadienne De Zoologie 66, 1015-1027.
Hochachka PW, Buck LT, Doll CJ & Land SC. (1996). Unifying theory of hypoxia
tolerance: molecular/metabolic defense and rescue mechanisms for surviving oxygen lack. Proc Natl Acad Sci U S A 93, 9493-9498.
Hochachka PW, Somero, G.N. (1984). Biochemical adaptation. 15-54.
56

References
Huguenard JR. (1996). Low-threshold calcium currents in central nervous system
neurons. Annu Rev Physiol 58, 329-348. Hylland P & Nilsson GE. (1999a). Extracellular levels of amino acid neurotransmitters
during anoxia and forced energy deficiency in crucian carp brain. Brain Research 823, 49-58.
Hylland P & Nilsson GE. (1999b). Extracellular levels of amino acid neurotransmitters
during anoxia and forced energy deficiency in crucian carp brain. Brain Res 823, 49-58.
Hylland P, Nilsson GE & Lutz PL. (1994). Time course of anoxia-induced increase in
cerebral blood flow rate in turtles: evidence for a role of adenosine. J Cereb Blood Flow Metab 14, 877-881.
Hyvarinen H, Holopainen IJ & Piironen J. (1985). Anaerobic Wintering Of Crucian Carp
(Carassius-Carassius L).1. Annual Dynamics Of Glycogen Reserves In Nature. Comparative Biochemistry And Physiology A-Physiology 82, 797-803.
Ikeda SR. (1991). Double-pulse calcium channel current facilitation in adult rat
sympathetic neurones. J Physiol (Lond) 439, 181-214. Ikeda SR. (1996). Voltage-dependent modulation of N-type calcium channels by G-
protein beta gamma subunits. Nature 380, 255-258. Isom LL, De Jongh KS, Patton DE, Reber BF, Offord J, Charbonneau H, Walsh K,
Goldin AL & Catterall WA. (1992). Primary structure and functional expression of the beta 1 subunit of the rat brain sodium channel. Science 256, 839-842.
Isom LL, Ragsdale DS, De Jongh KS, Westenbroek RE, Reber BF, Scheuer T & Catterall
WA. (1995). Structure and function of the beta 2 subunit of brain sodium channels, a transmembrane glycoprotein with a CAM motif. Cell 83, 433-442.
Johansson D & Nilsson G. (1995). Roles of energy status, KATP channels and channel
arrest in fish brain K+ gradient dissipation during anoxia. J Exp Biol 198, 2575-2580.
Johansson D, Nilsson G, Ouml & Rnblom E. (1995). Effects of anoxia on energy
metabolism in crucian carp brain slices studied with microcalorimetry. J Exp Biol 198, 853-859.
Johansson D, Nilsson GE & Doving KB. (1997). Anoxic depression of light-evoked
potentials in retina and optic tectum of crucian carp. Neurosci Lett 237, 73-76.
57
References
Ju YK, Saint DA & Gage PW. (1996). Hypoxia increases persistent sodium current in rat ventricular myocytes. Journal of Physiology-London 497, 337-347.
Koyasu S, Nishida E, Kadowaki T, Matsuzaki F, Iida K, Harada F, Kasuga M, Sakai H &
Yahara I. (1986). 2 Mammalian Heat-Shock Proteins, Hsp90 And Hsp100, Are Actin-Binding Proteins. Proceedings Of The National Academy Of Sciences Of The United States Of America 83, 8054-8058.
Krumschnabel G, Biasi C & Wieser W. (2000). Action of adenosine on energetics,
protein synthesis and K(+) homeostasis in teleost hepatocytes. J Exp Biol 203, 2657-2665.
Lambert RC, McKenna F, Maulet Y, Talley EM, Bayliss DA, Cribbs LL, Lee JH, Perez-
Reyes E & Feltz A. (1998). Low-voltage-activated Ca2+ currents are generated by members of the CavT subunit family (alpha1G/H) in rat primary sensory neurons. J Neurosci 18, 8605-8613.
Landry J & Huot J. (1995). Modulation of actin dynamics during stress and physiological
stimulation by a signaling pathway involving p38 MAP kinase and heat-shock protein 27. Biochem Cell Biol 73, 703-707.
Latchman DS. (2005). HSP27 and cell survival in neurones. Int J Hyperthermia 21, 393-
402. Lee JE, Yenari MA, Sun GH, Xu L, Emond MR, Cheng D, Steinberg GK & Giffard RG.
(2001). Differential neuroprotection from human heat shock protein 70 overexpression in in vitro and in vivo models of ischemia and ischemia-like conditions. Exp Neurol 170, 129-139.
Li M, West JW, Lai Y, Scheuer T & Catterall WA. (1992). Functional Modulation Of
Brain Sodium-Channels By Camp-Dependent Phosphorylation. Neuron 8, 1151-1159.
Lindquist S & Craig EA. (1988). The heat-shock proteins. Annu Rev Genet 22, 631-677. Loones MT, Chang Y & Morange M. (2000). The distribution of heat shock proteins in
the nervous system of the unstressed mouse embryo suggests a role in neuronal and non-neuronal differentiation. Cell Stress & Chaperones 5, 291-305.
Lu HK, Fern RJ, Luthin D, Linden J, Liu LP, Cohen CJ & Barrett PQ. (1996).
Angiotensin II stimulates T-type Ca2+ channel currents via activation of a G protein, Gi. Am J Physiol Cell Physiol 271, C1340-1349.
Lu HK, Fern RJ, Nee JJ & Barrett PQ. (1994). Ca(2+)-dependent activation of T-type
Ca2+ channels by calmodulin-dependent protein kinase II. Am J Physiol Renal Physiol 267, F183-189.
58

References
Lutz PL, Nilsson G.E., Prentice, H. (2003). The brain without oxygen. 252 pp. Lutz PL & Nilsson GE. (2004). Vertebrate brains at the pilot light. Respir Physiol
Neurobiol 141, 285-296. Lutz PL & Prentice HM. (2002). Sensing and responding to hypoxia, molecular and
physiological mechanisms. Integrative And Comparative Biology 42, 463-468. Lutz PL, Rosenthal M & Sick TJ. (1985). Living without Oxygen - Turtle Brain as a
Model of Anaerobic Metabolism. Molecular Physiology 8, 411-425. Mayer MP & Bukau B. (1998). Hsp70 chaperone systems: diversity of cellular functions
and mechanism of action. Biol Chem 379, 261-268. McCobb DP & Beam KG. (1991). Action potential waveform voltage-clamp commands
reveal striking differences in calcium entry via low and high voltage-activated calcium channels. Neuron 7, 119-127.
Messner DJ & Catterall WA. (1985). The sodium channel from rat brain. Separation and
characterization of subunits. J Biol Chem 260, 10597-10604. Minami Y, Kawasaki H, Suzuki K & Yahara I. (1993). The calmodulin-binding domain
of the mouse 90-kDa heat shock protein. J Biol Chem 268, 9604-9610. Miyata Y & Yahara I. (1992). The 90-kDa heat shock protein, HSP90, binds and protects
casein kinase II from self-aggregation and enhances its kinase activity. J Biol Chem 267, 7042-7047.
Miyata Y & Yahara I. (1995). Interaction between casein kinase II and the 90-kDa stress
protein, HSP90. Biochemistry 34, 8123-8129. Murphy SJ, Song D, Welsh FA, Wilson DF & Pastuszko A. (1999). Regional expression
of heat shock protein 72 mRNA following mild and severe hypoxia in neonatal piglet brain. Adv Exp Med Biol 471, 155-163.
Nilsson GE. (2001). Surviving anoxia with the brain turned on. News Physiol Sci 16, 217-
221. Nilsson GE, Hylland P & Lofman CO. (1994). Anoxia and adenosine induce increased
cerebral blood flow rate in crucian carp. Am J Physiol 267, R590-595. Nilsson GE & Lutz PL. (1991). Release of inhibitory neurotransmitters in response to
anoxia in turtle brain. Am J Physiol 261, R32-37.
59

References
Nilsson GE, Lutz, P.L. (1992). Adenosine release in the anoxic turtle brain: a possible mechanism for anoxic survival. J exp Biol 162: 345-351.
Nilsson GE, Rosén. P., Johansson, D. (1993). Anoxic depression of spontanous
locomotor activity in crucian carp quantified by a computerized imaging technique.
Nishida E, Koyasu S, Sakai H & Yahara I. (1986). Calmodulin-Regulated Binding Of
The 90-Kda Heat-Shock Protein To Actin-Filaments. Journal Of Biological Chemistry 261, 6033-6036.
Ogata N & Ohishi Y. (2002). Molecular diversity of structure and function of the voltage-
gated Na+ channels. Jpn J Pharmacol 88, 365-377. Ohtsuka K & Hata M. (2000). Molecular chaperone function of mammalian Hsp70 and
Hsp40--a review. Int J Hyperthermia 16, 231-245. Ohtsuka K & Suzuki T. (2000). Roles of molecular chaperones in the nervous system.
Brain Res Bull 53, 141-146. Parsell DA & Lindquist S. (1993). The function of heat-shock proteins in stress tolerance:
degradation and reactivation of damaged proteins. Annu Rev Genet 27, 437-496. Parsell DA, Taulien J & Lindquist S. (1993). The role of heat-shock proteins in
thermotolerance. Philos Trans R Soc Lond B Biol Sci 339, 279-285; discussion 285-276.
Pelham HR. (1986). Speculations on the functions of the major heat shock and glucose-
regulated proteins. Cell 46, 959-961. Perez-Pinzon MA, Rosenthal M, Sick TJ, Lutz PL, Pablo J & Mash D. (1992).
Downregulation of sodium channels during anoxia: a putative survival strategy of turtle brain. Am J Physiol 262, R712-715.
Pfaffl MW & Hageleit M. (2001). Validities of mRNA quantification using recombinant
RNA and recombinant DNA external calibration curves in real-time RT-PCR. Biotechnology Letters 23, 275-282.
Piironen J, Holopainen, I. J. (1986). A note on seasonality in anoxia tolerance of crucian
carp (Carassius carassius (L.)) in the laboratory. Prentice HM, Milton SL, Scheurle D & Lutz PL. (2004). The upregulation of cognate and
inducible heat shock proteins in the anoxic turtle brain. J Cereb Blood Flow Metab 24, 826-828.
60

References
Radonic A, Thulke S, Mackay IM, Landt O, Siegert W & Nitsche A. (2004). Guideline to reference gene selection for quantitative real-time PCR. Biochem Biophys Res Commun 313, 856-862.
Ramaglia V & Buck LT. (2004). Time-dependent expression of heat shock proteins 70
and 90 in tissues of the anoxic western painted turtle. J Exp Biol 207, 3775-3784. Ramakers C, Ruijter JM, Deprez RHL & Moorman AFM. (2003). Assumption-free
analysis of quantitative real-time polymerase chain reaction (PCR) data. Neuroscience Letters 339, 62.
Rasmussen R. (2001). Quantification on the LigtCycler. 21-34. Rausch RN, Crawshaw LI & Wallace HL. (2000). Effects of hypoxia, anoxia, and
endogenous ethanol on thermoregulation in goldfish, Carassius auratus. Am J Physiol Regul Integr Comp Physiol 278, R545-555.
Renshaw GM, Warburton J & Girjes A. (2004). Oxygen sensors and energy sensors act
synergistically to achieve a graded alteration in gene expression: consequences for assessing the level of neuroprotection in response to stressors. Front Biosci 9, 110-116.
Rordorf G, Koroshetz WJ & Bonventre JV. (1991). Heat shock protects cultured neurons
from glutamate toxicity. Neuron 7, 1043-1051. Rose DW, Welch WJ, Kramer G & Hardesty B. (1989). Possible involvement of the 90-
kDa heat shock protein in the regulation of protein synthesis. J Biol Chem 264, 6239-6244.
Rothman JE & Schmid SL. (1986). Enzymatic recycling of clathrin from coated vesicles.
Cell 46, 5-9. Sanchez ER, Toft DO, Schlesinger MJ & Pratt WB. (1985). Evidence that the 90-kDa
phosphoprotein associated with the untransformed L-cell glucocorticoid receptor is a murine heat shock protein. J Biol Chem 260, 12398-12401.
Schmidt H, Wegener, G. (1988). Glycogen phosphorylase in fish brain (Carassius
carassius) during hypoxia. Trans Biochem Soc 16, 621-622. Schmittgen TD & Zakrajsek BA. (2000). Effect of experimental treatment on
housekeeping gene expression: validation by real-time, quantitative RT-PCR. J Biochem Biophys Methods 46, 69-81.
Schwaller J, Pabst T, Bickel M, Borisch B, Fey MF & Tobler A. (1997). Comparative
detection and quantitation of human CDK inhibitor mRNA expression of p15INK4B, p16INK4A, p16beta, p18INK4C, p19INK4D, p21WAF1, p27KIP1
61

References
and p57KIP2 by RT-PCR using a polycompetitive internal standard. Br J Haematol 99, 896-900.
Silver IA & Erecinska M. (1990). Intracellular and Extracellular Changes of [Ca2+] in
Hypoxia and Ischemia in Rat-Brain Invivo. Journal of General Physiology 95, 837-866.
Smith RW, Houlihan DF, Nilsson GE & Alexandre J. (1999). Tissue-specific changes in
RNA synthesis in vivo during anoxia in crucian carp. Am J Physiol 277, R690-697.
Smith RW, Houlihan DF, Nilsson GE & Brechin JG. (1996). Tissue-specific changes in
protein synthesis rates in vivo during anoxia in crucian carp. American Journal Of Physiology-Regulatory Integrative And Comparative Physiology 40, R897-R904.
Snoeckx LH, Cornelussen RN, Van Nieuwenhoven FA, Reneman RS & Van Der Vusse
GJ. (2001). Heat shock proteins and cardiovascular pathophysiology. Physiol Rev 81, 1461-1497.
Sollid J, Kjernsli A, De Angelis PM, Rohr AK & Nilsson GE. (2005). Cell proliferation
and gill morphology in anoxic crucian carp. American Journal Of Physiology-Regulatory Integrative And Comparative Physiology 289, R1196-R1201.
Stecyk JA, Overgaard J, Farrell AP & Wang T. (2004). Alpha-adrenergic regulation of
systemic peripheral resistance and blood flow distribution in the turtle Trachemys scripta during anoxic submergence at 5 degrees C and 21 degrees C. J Exp Biol 207, 269-283.
Suzue T, Wu GB & Furukawa T. (1987). High susceptibility to hypoxia of afferent
synaptic transmission in the goldfish sacculus. J Neurophysiol 58, 1066-1079. Suzuki T, Higgins PJ & Crawford DR. (2000). Control selection for RNA quantitation.
Biotechniques 29, 332-337. Swartz KJ, Merritt A, Bean BP & Lovinger DM. (1993). Protein kinase C modulates
glutamate receptor inhibition of Ca2+ channels and synaptic transmission. Nature 361, 165-168.
Takahashi M, Seagar MJ, Jones JF, Reber BF & Catterall WA. (1987). Subunit structure
of dihydropyridine-sensitive calcium channels from skeletal muscle. Proc Natl Acad Sci U S A 84, 5478-5482.
Taylor CP & Meldrum BS. (1995). Na+ channels as targets for neuroprotective drugs.
Trends Pharmacol Sci 16, 309-316.
62

References
Thorén A, Nilsson, G. (2000). Maintainace of intracellular Ca2+ in brain slices from crucian carp - an anoxia tolerant vertebrate.
Ultsch GR. (1985). The viability of nearctic freshwater turtles submerged in anoxia and
normoxia at 3 and 10 degrees C. Comp Biochem Physiol A 81, 607-611. Wang SM, Khandekar JD, Kaul KL, Winchester DJ & Morimoto RI. (1999). A method
for the quantitative analysis of human heat shock gene expression using a multiplex RT-PCR assay. Cell Stress Chaperones 4, 153-161.
Yunker AM & McEnery MW. (2003). Low-voltage-activated ("T-Type") calcium
channels in review. J Bioenerg Biomembr 35, 533-575.
63