ACHIEVING OUR GOALS Umschlag FGB05 e RZ.qxd 17.03.2006 12:26
208
ACHIEVING OUR GOALS Annual Report 2005
Transcript of ACHIEVING OUR GOALS Umschlag FGB05 e RZ.qxd 17.03.2006 12:26

Corporate Head Office
Else-Kröner-Strasse 1
Bad Homburg v.d.H.
Postal address
Fresenius AG
61346 Bad Homburg v.d.H.
Contact for shareholders
Investor Relations
Telephone: ++496172608-2485
++496172608-2486
++496172608-2487
Telefax: ++496172608-2488
e-mail: [email protected]
Contact for journalists
Corporate Communications
Telephone: ++496172608-2302
Telefax: ++496172608-2294
e-mail: [email protected]
Fresenius Group in Figures
Report on 1st quarter 2006
Conference call May 3, 2006
Annual General Meeting,
Frankfurt am Main (Germany) May 10, 2006
Payment of dividend* May 11, 2006
Report on 1st half 2006
Analysts‘ meeting, Bad Homburg v.d.H.
Live webcast August 4, 2006
Report on 1st-3rd quarters 2006
Analysts‘ meeting, Bad Homburg v.d.H.
Live webcast
Press conference, Bad Homburg v.d.H.
Live webcast November 3, 2006
* subject to the prior approval of the Annual General Meeting
Financial calendar
in million € 2005 2004 2003 2002 2001US GAAP US GAAP US GAAP US GAAP US GAAP
Results of operations
Sales 7,889 7,271 7,064 7,507 7,307
EBIT 1) 969 845 781 837 762
Net income 222 168 115 134 93
Depreciation and amortization 320 315 325 341 494
Operating cash flow 780 851 776 697 509
Operating cash flow in % of sales 9.9% 11.7% 11.0% 9.3% 7.0%
Earnings per ordinary share in € 1) 5.28 4.08 2.79 3.25 2.27
Earnings per preference share in € 1) 5.31 4.11 2.82 3.28 2.30
Balance sheet
Total assets 11,594 8,188 8,347 8,915 9,867
Non-current assets 8,063 5,433 5,603 6,172 6,837
Shareholders’ equity 2) 5,130 3,347 3,214 3,369 3,689
Equity ratio 2) 44% 41% 39% 38% 37%
Investments 3) 2,247 421 430 507 1,233
Profitability
EBIT margin 1) 12.3% 11.6% 11.1% 11.1% 10.4%
Return on equity after taxes (ROE)4) 11.4% 10.5% 7.5% 8.3% 5.3%
Return on operating assets (ROOA)4) 11.7% 11.1% 9.8% 9.7% 9.0%
Return on invested capital (ROIC)4) 8.0% 7.4% 6.3% 6.5% 7.5%
Dividend per ordinary share in € 1.485) 1.35 1.23 1.14 1.03
Dividend per preference share in € 1.515) 1.38 1.26 1.17 1.06
Employees (December 31) 91,971 68,494 66,264 63,638 60,667
1) 2001: before special charge for US legal matters of Fresenius Medical Care2) Shareholders’ equity including minority interest3) Property, plant and equipment and intangible assets, acquisitions4) 2005: balance sheet adjusted for acquisition of HELIOS Kliniken5) Proposal
A 10-year overview is available on our website: www.fresenius-ag.com/Investor Relations
An
nu
al R
epor
t 20
05
ACHIEVING OUR GOALSAnnual Report 2005
Design concept/Realization: Hilger&Boie GmbH, WiesbadenPrint: Kempkes, GladenbachPhotography: Peter Granser, Stuttgart
The German version of this Annual Report is legally binding.
The financial statements of Fresenius AG and the consolidated statements in accordance with IFRS accounting principlesare available on our website and may be obtained upon request.
Further information and current news about our company are available on our website at: http://www.fresenius-ag.com
Forward-looking statements:This Annual Report contains forward-looking statements. These statements represent assessments which we have madeon the basis of the information available to us at the time. Should the assumptions on which the statements are basednot occur, or if risks should arise – as mentioned in the risk report – the actual results could differ materially from theresults currently expected.
Umschlag_FGB05_e_RZ.qxd 17.03.2006 12:26 Uhr Seite 1

Corporate Head Office
Else-Kröner-Strasse 1
Bad Homburg v.d.H.
Postal address
Fresenius AG
61346 Bad Homburg v.d.H.
Contact for shareholders
Investor Relations
Telephone: ++496172608-2485
++496172608-2486
++496172608-2487
Telefax: ++496172608-2488
e-mail: [email protected]
Contact for journalists
Corporate Communications
Telephone: ++496172608-2302
Telefax: ++496172608-2294
e-mail: [email protected]
Fresenius Group in Figures
Report on 1st quarter 2006
Conference call May 3, 2006
Annual General Meeting,
Frankfurt am Main (Germany) May 10, 2006
Payment of dividend* May 11, 2006
Report on 1st half 2006
Analysts‘ meeting, Bad Homburg v.d.H.
Live webcast August 4, 2006
Report on 1st-3rd quarters 2006
Analysts‘ meeting, Bad Homburg v.d.H.
Live webcast
Press conference, Bad Homburg v.d.H.
Live webcast November 3, 2006
* subject to the prior approval of the Annual General Meeting
Financial calendar
in million € 2005 2004 2003 2002 2001US GAAP US GAAP US GAAP US GAAP US GAAP
Results of operations
Sales 7,889 7,271 7,064 7,507 7,307
EBIT 1) 969 845 781 837 762
Net income 222 168 115 134 93
Depreciation and amortization 320 315 325 341 494
Operating cash flow 780 851 776 697 509
Operating cash flow in % of sales 9.9% 11.7% 11.0% 9.3% 7.0%
Earnings per ordinary share in € 1) 5.28 4.08 2.79 3.25 2.27
Earnings per preference share in € 1) 5.31 4.11 2.82 3.28 2.30
Balance sheet
Total assets 11,594 8,188 8,347 8,915 9,867
Non-current assets 8,063 5,433 5,603 6,172 6,837
Shareholders’ equity 2) 5,130 3,347 3,214 3,369 3,689
Equity ratio 2) 44% 41% 39% 38% 37%
Investments 3) 2,247 421 430 507 1,233
Profitability
EBIT margin 1) 12.3% 11.6% 11.1% 11.1% 10.4%
Return on equity after taxes (ROE)4) 11.4% 10.5% 7.5% 8.3% 5.3%
Return on operating assets (ROOA)4) 11.7% 11.1% 9.8% 9.7% 9.0%
Return on invested capital (ROIC)4) 8.0% 7.4% 6.3% 6.5% 7.5%
Dividend per ordinary share in € 1.485) 1.35 1.23 1.14 1.03
Dividend per preference share in € 1.515) 1.38 1.26 1.17 1.06
Employees (December 31) 91,971 68,494 66,264 63,638 60,667
1) 2001: before special charge for US legal matters of Fresenius Medical Care2) Shareholders’ equity including minority interest3) Property, plant and equipment and intangible assets, acquisitions4) 2005: balance sheet adjusted for acquisition of HELIOS Kliniken5) Proposal
A 10-year overview is available on our website: www.fresenius-ag.com/Investor Relations
An
nu
al R
epor
t 20
05
ACHIEVING OUR GOALSAnnual Report 2005
Design concept/Realization: Hilger&Boie GmbH, WiesbadenPrint: Kempkes, GladenbachPhotography: Peter Granser, Stuttgart
The German version of this Annual Report is legally binding.
The financial statements of Fresenius AG and the consolidated statements in accordance with IFRS accounting principlesare available on our website and may be obtained upon request.
Further information and current news about our company are available on our website at: http://www.fresenius-ag.com
Forward-looking statements:This Annual Report contains forward-looking statements. These statements represent assessments which we have madeon the basis of the information available to us at the time. Should the assumptions on which the statements are basednot occur, or if risks should arise – as mentioned in the risk report – the actual results could differ materially from theresults currently expected.
Umschlag_FGB05_e_RZ.qxd 17.03.2006 17:03 Uhr Seite 1

TRANSFUSION TECHNOLOGY
Ω Blood bags
Ω Blood bag systems with in-line
filters
Ω Leukocyte filters
Ω Mixing devices
Ω Cooling and transportation systems
Ω Automatic blood component
processing systems
Ω Sealing devices
Ω Sterile docking devices
Ω Blood cell separators for
– Hemapheresis
– Therapeutic apheresis
Ω Stem cell bags
Ω Solutions
HELIOS KLINIKEN GROUP
The HELIOS Kliniken Group
consists of:
Ω HELIOS Kliniken GmbH:
– Group of clinics with acute hospi-
tals for all medical disciplines
– High quality medical treatment of
patients at all levels of care, up to
maximum care
Ω Wittgensteiner Kliniken AG (WKA):
– Operation and management of
post acute hospitals
VAMED
Worldwide projects and services
for health facilities:
Ω Feasibility studies
Ω Operational and organisational
planning
Ω IT planning
Ω Architectural planning
Ω Planning of medical-technical
equipment
Ω Complete medical and technical
equipment for hospitals /packages
Ω Medical-technical maintenance
Ω Building technology planning
Ω Facility management
Ω Project development and
management
Ω Turn-key projects
Ω Financial engineering
Ω General and technical management
of health facilities
VAMED is also responsible for the
projects of hospitalia international.
PHARMAPLAN
Engineering and plant design for the
pharmaceutical and medical device
industry:
Ω Feasibility studies
Ω Consulting and engineering
Ω Turn-key projects
Ω Validation and quality management
Ω Logistics and warehousing
Ω Services for pharmaceutical
production
Ω Training
Ω Facility management for
pharmaceutical companies
Ω Supply, installation and mainten-
ance of water systems/preparation
systems for the pharmaceutical
industry (Pharmatec)
BIOTECHNOLOGY
Ω Immunosuppressive agent
ATG-Fresenius S
Ω Fluids and disposables for organ
perfusion and preservation
Ω Cell products for research and
clinical application
Ω Vector production gene therapy
Fresenius ProServe Fresenius Biotech
Pro
duct
s an
d S
ervi
ces
of o
ur B
usin
ess
Seg
men
ts
HEMODIALYSIS
Ω Machines for
– Hemodialysis
– Hemodiafiltration
– Hemofiltration
Ω High- and Low-flux dialyzers
(Fresenius Polysulfone®)
Ω FX-class dialyzers (Helixone®)
Ω Heparin syringes
Ω Dialysis fluid filters
Ω Blood lines
Ω Dialysis cannulae
Ω Hemodiafilters
Ω Dialysis concentrates (liquid, dry)
Ω Rinsing solutions
Ω Disinfectants
Ω Water treatment systems
Ω Analysis devices
Ω Data management systems
ACUTE DIALYSIS
Ω Machines for acute dialysis
Ω Hemofilters
Ω Hemofiltration solutions
Ω Dialysis fluid concentrates
Ω Dialysis catheters
Ω Blood lines
Ω Plasma filters
PERITONEAL DIALYSIS
Ω Machines and tubing systems for
Automated Peritoneal Dialysis (APD)
Ω Peritoneal dialysis solutions
Ω CAPD systems
Ω CAPD double chamber systems
Ω Peritoneal dialysis catheters
Ω Accessories
Ω Data Management Systems
(Patient OnLine)
DIALYSIS CARE
Ω Dialysis clinics for chronic
hemodialysis treatment
Ω Acute inpatient dialysis treatment
Ω Training (hemodialysis and
peritoneal dialysis)
Ω Planning and installation of water
treatment systems for hemodialysis
Ω Planning of hemodialysis centers
SPECTRA RENAL
MANAGEMENT
Ω Laboratory and diagnostic dialysis-
related services
Ω Data management
Ω Managed care services for dialysis
patients
LIVER SUPPORT THERAPY
Ω Machines for liver support therapy
Ω Albumin filters
Ω Anion exchanger
Ω Neutral resin adsorber
Ω Citrate calcium anticoagulation
THERAPEUTICAL APHERESIS
LDL apheresis:
Ω DALI®
Immunoadsorption:
Ω PROSORBA®
Ω Immunosorba
Ω GLOBAFFIN
Ω CORAFFIN
INFUSION THERAPY
Ω Basic solutions
Ω Infusion solutions for osmotic
therapy
Ω Irrigation solutions/urology
Ω Infusion solutions for blood volume
replacement and hemodilution
therapy
Ω I.V. anaesthetics
Ω I.V. anti-infective drugs
Ω I.V. catecholamines
Ω I.V. analgesics
Ω Innovative packaging systems for
I.V. products
Ω Patient individual cytostatic infusion
therapies
Ω Medical devices
– PDMS – Patient data management
systems
– Volumetric infusion pumps and
syringe pumps
– Infusion and clinical fluid mana-
gement systems
– I.V. disposables and accessories
– I.V. anaesthesia and analgesia
systems
– Clinical medical systems for
wound drainage
– Technical equipment for irrigation
solutions
– Suprapubic drainage systems
– In-dwelling venous cannulae
– Implantable port systems
– Portable drug pumps
– Autotransfusion systems
– Blood gas and electrolytes analyzer
for point of care
Ω Disinfectants
CLINICAL NUTRITION
Parenteral nutrition
Ω Industrially compounded admix-
tures (2 and 3 chamber bags, all
in one bags)
Ω Standard and special amino acid
solutions
Ω Lipid emulsions
Ω Additives
Ω Compounding systems including
empty bags and calculation soft-
ware for nutrition therapy
Ω Patient-individual concept for
outpatient parenteral nutrition
Ω Scientific support and information
Ω Training and education
Ω Medical devices
– Devices for parenteral nutrition
and its application
– Volumetric infusion pumps
– Disposables and accessories
Enteral nutrition
Ω Sip and tube feeds
– Standard diets
– Disease-specific diets
– Nutritional supplements
Ω Oral amino acids/Keto acids
Ω Scientific support and information
Ω Training and education
Ω Management and provision of
outpatient therapies
Ω Medical devices
– Feeding tubes
– Transnasal tubes
– Percutaneous tubes
– Application technology
– Feeding pumps
– Giving sets
– Accessories
Fresenius Medical Care Fresenius Kabi
in million € 2005 2004 Change
Sales 809 813 0%
EBIT 20 9 122%
Net income 2 -10 –
Operating cash flow 19 23 -17%
Capital expenditure/acquisitions 1,519 29 –
Order intake 341 244 40%
Employees (December 31) 26,664* 9,398 –
* Includes the employees of HELIOS Kliniken since the company was consolidated effective December 31, 2005.
Key figures of the business segments
in million US$ 2005 2004 Change
Sales 6,772 6,228 9%
EBIT 939 852 10%
Net income 455 402 13%
Operating cash flow 670 828 -19%
Capital expenditure/acquisitions 449 399 13%
R+D expenses 51 51 0%
Employees (December 31) 50,250 46,949 7%
Dialysis products,Dialysis care,Extracorporeal therapies
in million € 2005 2004 Change
Sales 1,681 1,491 13%
EBIT 234 176 33%
Net income 111 79 41%
Operating cash flow 237 170 39%
Capital expenditure/acquisitions 351 68 –
R+D expenses 64 56 14%
Employees (December 31) 14,453 11,577 25%
Fresenius is a health care Group with products and services
for dialysis, the hospital and the medical care of patients at
home. In addition, Fresenius focuses on hospital operations
as well as on engineering and services for hospitals and the
pharmaceutical industry. Nearly 92,000 employees work with
dedication in the service of health in around 100 countries of
the globe.
Key
fig
ures
of
the
busi
ness
seg
men
ts
Infusion therapy,Clinical nutrition,Transfusion technology
Hospital operations, Services for hospitals, Engineering and services for the pharmaceutical industry
Umschlag_FGB05_e_RZ.qxd 17.03.2006 17:03 Uhr Seite 2

We are pursuing our long-term goals with energy and
commitment, and are seizing on our opportunities.
Our products and services offer a future for seriously
ill patients.
Read more about our goals in this Annual Report.
Ω Delivering the best therapies
Ω Growing through new products and services
Ω Expanding in growth markets
Ω Enhancing earnings power
ACHIEVING OUR GOALS
FRESENIUS KABI –
Achieve sustainable and
profitable growth
Page 7 FRESENIUS MEDICAL CARE –
Increase market leadership
Page 25 FRESENIUS PROSERVE –
Be a leading private hospital
operator in Germany
Page 57

Contents2
2511 Achieving our Goals
4 To our Shareholders
6 Management Board
7 Our Goal: Achieve Sustainable and Profitable Growth
12 Summary of the Fiscal Year
14 Fresenius Shares and Corporate Governance Report
25 Our Goal: Increase Market Leadership
30 Business Segments
30 Fresenius Medical Care
38 Fresenius Kabi
44 Fresenius ProServe
48 Additional Information on the Fiscal Year
48 Employees
50 Research and Development
55 Environmental Management

3To our Shareholders Summary Fresenius Shares Business Segments Additional Information Management Report
57 9696 Key Figures of Major Affiliated Companies
98 Consolidated Financial Statements
110 Notes
194 Report of the Supervisory Board
197 Supervisory Board
198 Glossary
200 Index
57 Our Goal: Be a Leading Private Hospital Operator
in Germany
62 Management Report
63 Operations and Business Environment
63 Group Structure and Business
65 Corporate Performance Measures, Goals
and Strategy
66 Research and Development
67 Overall Business Development
71 Results of Operations, Financial Position,
Assets and Liabilities
72 Results of Operations
75 Financial Position
80 Assets and Liabilities
82 Non-Financial Performance Indicators
84 Overall Assessment of the Business Situation
84 Risk Report
89 Subsequent Events
89 Outlook

To our Shareholders4
To our Shareholders:
For Fresenius, 2005 was an extraordinary and hugely successful year. We put in place strate-
gic intiatives to build our company into a leading global health care group. In particular,
we took advantage of significant acquisition opportunities. At the same time, all our business
segments continued to show profitable organic growth.
I would like to describe in greater detail the key strategic steps of 2005:
The acquisition of Renal Care Group provides an excellent fit with Fresenius Medical Care’s
North American operations. With Renal Care Group, Fresenius Medical Care can build on
its leading position in dialysis care and create additional growth opportunities for its dialy-
sis products business. Renal Care Group is both fast-growing and highly profitable. This
acquisition largely completes the consolidation of the US dialysis market and strengthens
Fresenius Medical Care’s unique position.
We converted Fresenius Medical Care’s preference shares into ordinary shares and changed
its legal form to a KGaA. Both are important structural steps that increase the financial
flexibility of Fresenius Medical Care and pave the way for future profitable growth. The
ordinary shares are now more attractive to investors. At the same time, it is important that
Fresenius retains management control and continues to consolidate this largest business
segment. We have emphasized that we will maintain the highest standards of corporate
governance as well as transparency and openness in our corporate communications with
this change in legal form.

5To our Shareholders Summary Fresenius Shares Business Segments Additional Information Management Report
Fresenius Kabi’s acquisitions of Labesfal and Clinico provide an excellent platform for future
growth and fit perfectly with our strategic objectives. They significantly extend Fresenius
Kabi’s product portfolio of generic IV drugs and medical devices related to infusion and nutri-
tion therapies. Fresenius Kabi has a strong distribution network for the hospital sector and
will market the new product lines internationally.
Following the acquisition of HELIOS Kliniken, Fresenius ProServe has developed into our third
strong business segment. The combination of HELIOS Kliniken with our own hospital chain
makes us a leading private hospital operator in Germany. The key rationale for the acquisition
was to gain access to HELIOS’ expertise in hospital operations, especially in quality manage-
ment. The company has proven since its inception that it is possible to align the highest quality
levels of medical care with financial success. HELIOS is an excellent platform for Fresenius
to strengthen our position in acute care hospitals and to participate in the privatization of the
German hospital industry.
In addition to these significant strategic initiatives, we achieved excellent financial results in
2005. Sales and earnings reached record levels. Sales increased by 8 percent to € 7.9 billion
and net income rose by 32 percent to € 222 million. These are outstanding achievements and
I would like to thank our associates whose dedication and hard work made them happen.
As a result of its acquisitions in 2005, Fresenius has expanded significantly. For the first time,
sales are expected to exceed € 10 billion in 2006. We will have more than 100,000 employees
worldwide. Now our focus is on the integration of the new companies into the group and on
continued profitable growth. Our management team is committed to creating value for share-
holders. The company’s mid-term financial goals remain unchanged – in addition to organic
revenue growth of 5 to 6 percent, we will continue to target growth through selective acquisi-
tions. Net income is expected to increase at a significantly higher rate than sales. At the
same time, we aim to improve our debt ratios following the landmark investments of 2005.
With courageous strategic steps, solid operations management and commercial prudence,
we will continue to build our company and achieve our corporate goals. I very much appreci-
ate your continued trust and support on this path.
Dr. Ulf M. Schneider
Chairman of the Management Board

Management Board6
MANAGEMENT BOARD
Dr. Ulf M. Schneider
Frankfurt am Main
Chairman
Corporate OfficesSupervisory BoardFresenius Kabi AG (Chairman) Fresenius Medical Care AG (until February 10, 2006)Fresenius Medical Care Management AG (Chairman) (since April 8, 2005)Eufets AG (Chairman)Fresenius Kabi Austria GmbH, Austria Fresenius Medical Care Groupe France S.A., France(Chairman)Fresenius HemoCare Netherlands B.V., Netherlands Board of DirectorsFHC (Holdings), Ltd., Great Britain
Andreas Gaddum
(since July 1, 2005)
Mainz
Business Segment
Fresenius ProServe
Corporate OfficesSupervisory BoardVAMED AG, Austria (since September 16, 2005)Wittgensteiner Kliniken AG (Chairman) (since September 23, 2005)
Dr. Ben Lipps
Boston, Massachusetts (USA)
Business Segment
Fresenius Medical Care
Corporate OfficesManagement BoardFresenius Medical Care AG (Chairman)(until February 10, 2006)Fresenius Medical Care Management AG (Chairman) (since December 21, 2005)
Rainer Baule
Ettlingen
Business Segment Fresenius Kabi
Corporate OfficesSupervisory BoardFresenius Kabi Austria GmbH, Austria (Chairman)Fresenius HemoCare Netherlands B.V., Netherlands(Chairman)Fresenius Kabi Groupe France S.A., FranceBoard of DirectorsFHC (Holdings), Ltd., Great Britain
Rainer Hohmann
(until May 20, 2005)
Bochum
Business Segment
Fresenius ProServe
Corporate OfficesSupervisory BoardVAMED AG, Austria (until June 30, 2005)Wittgensteiner Kliniken AG (Chairman)(until March 16, 2005)
Stephan Sturm
Hofheim am Taunus
Chief Financial Officer and
Labor Relations Director
Corporate Offices Supervisory BoardFresenius Kabi AG (since January 19, 2005)Wittgensteiner Kliniken AG (since February 22, 2005)Fresenius HemoCare Netherlands B.V., Netherlands (since June 24, 2005)Board of DirectorsFHC (Holdings), Ltd., Great Britain (since January 21, 2005)

7To our Shareholders Summary Fresenius Shares Business Segments Additional Information Management Report
OUR GOAL:
ACHIEVE SUSTAINABLE AND
PROFITABLE GROWTH
INTERNATIONALIZE NEW
PRODUCT PORTFOLIO
Distribute Clinico’s products in Europe,
Asia-Pacific and Latin America, in 2007
introduce Labesfal’s products to Europe
2006/2007
EXPAND MARKET
LEADERSHIP
Profitable growth –
organically and through
selected acquisitions
Following years
PRODUCT PORTFOLIO OF I.V. DRUGSAND MEDICAL DEVICES EXPANDEDAcquisitions of Labesfal and Clinico
2005
MARKET POSITION IN ASIA-PACIFIC, LATIN
AMERICA AND SOUTH AFRICA STRENGTHENED
Expanded market presence through acquisitions
2000
MARKET LEADER IN INFUSION
THERAPY AND CLINICAL NUTRITION
IN EUROPE
Acquisition of the international infusion
solution business of Pharmacia & Upjohn
1998

Fresenius Kabi – Achieve sustainable and profitable growth8
Intravenously administered drugs and medical devices in an intensive care unit.

9To our Shareholders Summary Fresenius Shares Business Segments Additional Information Management Report
OUR MILESTONES:
ACQUISITIONS OF LABESFAL AND CLINICO
Fresenius Kabi provides infusion therapies and clinical nutrition for critically and chronically ill
patients. As the market leader in Europe, and with leading positions in Asia-Pacific and Latin
America, our strategy is to offer products for all core segments of infusion therapy and clinical
nutrition. These products include generic intravenously administered drugs and medical devices,
two areas in which we reached significant milestones in 2005.
A strategically important step was the acquisition of Labesfal, which produces generic intravenously
administered drugs for the domestic Portuguese market. The acquisition substantially expands our
portfolio in this product area. We will market Labesfal’s products to hospitals throughout Europe, where
the market is currently worth € 2.5 to 3.0 billion. Our today’s portfolio addresses a market volume of
€ 1.2 billion. We are striving to expand our product portfolio.
Another milestone was the acquisition of Clinico, a manufacturer of medical devices. Clinico’s prod-
ucts ideally complement Fresenius Kabi’s existing portfolio. This acquisition enhances our market
position and offers exceptional opportunities for international growth.
Both acquisitions strengthen our market position. Fresenius Kabi already is one of the five largest
hospital suppliers in Europe.
Innovative medical devices increase
safety during drug infusion.

Fresenius Kabi – Achieve sustainable and profitable growth10
OUR WAY FORWARD:
BENEFIT FROM AN INTERNATIONAL SALES
AND PRODUCTION NETWORK
Fresenius Kabi’s strong position in the hospital market is an excellent platform for profitable
growth. We will take advantage of our European sales network of more than 20 subsidiaries for the
introduction of the Labesfal products. The documentation for regulatory approval of the first eight
drugs was submitted early in 2006 – market launch in Europe is planned to start early in 2007. We
have offered infusion devices as well as products to administer infusion therapies and clinical nutri-
tion for many years. With Clinico’s product portfolio we add a comprehensive range of disposables to
our devices and application systems. We have already taken the necessary initial steps to market
these products internationally via our sales organizations in Europe as well as in Asia-Pacific and
Latin America. In this way, not only do we immediately access these markets, but by using existing
sales and marketing channels we also improve our returns on invested capital.
To create sustainable and profitable growth, we employ the strategy to extend our value-added
chain. Both acquisitions broaden our global development and production network and expand our
value-added chain. This has a positive effect on the quality of our products as well as on production
costs. Labesfal has a high-tech production plant in Portugal. Its state-of-the-art technology and vast
production capacity will make it our competence center for the production of intravenously adminis-
tered drugs. Clinico has a development center and a tool-making site in Germany, as well as plants
with advanced production technologies in Poland and China.
Clinco’s and Labesfal’s modern tech-
nologies ensure top-quality products.

11To our Shareholders Summary Fresenius Shares Business Segments Additional Information Management Report
The production of intravenously administered drugs requires a maximum level of technological know-how.

Summary12
Ω In both North America and Europe, our largest markets,
we had strong growth rates of 8%.
Ω In Latin America, we achieved an outstanding growth
rate of 30%, while we grew by 16% in Africa.
Ω In the Asia-Pacific region, sales increased by 2%. Here,
Fresenius ProServe’s sales decreased due to the lower
project volume.
SALES
Consolidated sales increased by 8% to € 7,889 billion.
Organic growth contributed 7% and acquisitions 2%
to overall growth. Divestments had a -1% effect on sales.
Currency translation had hardly any impact, primarily
because the average US dollar/euro rate for the year was
unchanged.
EARNINGS
Earnings growth in 2005 reflected the excellent business
performance at Fresenius Medical Care and Fresenius Kabi.
Improvements at Fresenius ProServe, lower net interest ex-
penses and a lower tax rate also had positive effects.
Ω Operating income (EBIT) grew by 15%. The EBIT margin
increased from 11.6% in 2004 to 12.3% in 2005.
Ω Net interest improved to € -203 million due to positive
effects from a lower debt level in combination with lower
interest rates from various refinancing measures.
Ω Net income grew by 32% to € 222 million.
Change inconstant
in million € 2005 2004 Change currency
EBIT 969 845 15% 14%
Net interest -203 -209 3% 3%
Income taxes -298 -253 -18% -17%
Minority interest -246 -215 -14% -13%
Net income 222 168 32% 31%
SUMMARY OF THE FISCAL YEAR
SALES BY REGION
Europe 38%
North America 47%Asia-Pacific 7%
Latin America and
other regions 8%
2005: € 7.9 billion

13To our Shareholders Summary Fresenius Shares Business Segments Additional Information Management Report
CASH FLOW
Group operating cash flow once again was at a high level
in 2005. The cash flow rate was 9.9%.
BALANCE SHEET
The balance sheet was affected by the acquisitions, partic-
ularly the purchase of HELIOS, as well as by the capital
increase and a bridge financing. Total assets rose by 42%
to € 11,594 million.
Ω Operating cash flow was € 780 million (2004: € 851
million). The decrease was primarily attributable to tax
payments for previous years at Fresenius Medical Care.
Ω Despite higher capital expenditure (€ -331 million),
cash flow before acquisitions and dividends amounted
to € 449 million (2004: € 565 million). Dividends and
20% of the 2005 acquisitions (€ 1,606 million, net) were
financed through cash flow.
Ω The balance sheet is solid: including minority interest,
the equity ratio improved to 44.2%.
Ω Debt increased by € 767 million to € 3,502 million,
mainly due to acquisition financing.
Ω Including minority interest, shareholders’ equity rose
to € 5,130 million, reflecting the capital increase and
the excellent earnings growth.
Equity and minority interest
Debt
Other liabilities
Non-current assets
Trade accounts receivable
Other current assets
EQUITY AND LIABILITIES
14%
ASSETS
70%
16%
15%
66%
19%
30%
44%
26%
33%
26%
2001 2003 2004 2005
900
800
700
600
500
400
300
200
100
697
776
851
2002
509
OPERATING CASH FLOW, IN MILLION €
780
Dec 31, 2005 Dec 31, 2004 Dec 31, 2005 Dec 31, 2004
8,18811,594 11,594 8,188 Total assets in million €
41%

14 Fresenius Shares
FRESENIUS SHARES AND
CORPORATE GOVERNANCE REPORT
Ω In terms of market capitalization, Fresenius is one of the 35 largest publicly traded companies in Germany.
Ω The ordinary share rose 42% in 2005 and the preference share67%. The ordinary share outperformed the DAX by around 15%, the preference share by approximately 40%.
Ω Capital was increased with the successful issue of 4.7 millionnew ordinary and 4.7 million new preference shares.
Ω Another dividend increase is proposed.
Dec 30, 2004 = 100
Jan 05 Feb 05 Mar 05 Apr 05 May 05 Jun 05 Jul 05 Aug 05 Sep 05 Oct 05 Nov 05 Dec 05
RELATIVE SHARE PRICE PERFORMANCE
180
170
160
150
140
130
120
110
100
90
Ordinary Share Preference Share DAX MDAX

15To our Shareholders Summary Fresenius Shares Business Segments Additional Information Management Report
2005 was a very successful year for equity markets with robust growth among many
German and European stocks. The excellent business performance, positive market
sentiment and new strategic initiatives led to a strong increase in the Fresenius shares.
STOCK MARKETS
The DAX closed the year 2005 at 5,408 points, correspond-
ing to an impressive increase of 27.1%. In other major
European stock markets, only the Swiss and the Swedish
primary indices performed better, with increases of 33.2%
and 29.4%, respectively. The European Blue Chip index
Dow Jones STOXX 50 rose 20.7% last year. In comparison,
the US markets were markedly weaker. The S & P 500 ended
the year only 3.0% higher, while the Dow Jones Industrial
Average fell 0.6%.
After a modest start, the DAX climbed almost continu-
ously from 4,224 points in early May to the end of the year,
staying above 5,000 points from November on. Mid and
small-cap stocks once again enjoyed especially strong de-
mand. The MDAX closed near to its new record of 7,336
points, growing 36% year-on-year, and outpacing the DAX
for the sixth consecutive time. The SDAX also performed
strongly, rising by 35.2%. Corporate earnings growth played
a pivotal role in this development. Outperformers in the
European sectors of the Dow Jones STOXX 600 index were
basic resources (49.4%), industrial goods and services
(33.2%), and construction and materials (31.4%). Only tele-
communications ended the year with a loss (-1.8%).
Further economic recovery and corporate earnings
growth should drive the German equity market in 2006. Weak-
ening cyclical impulses, lower cost-savings potential from
restructuring measures and further increases in oil prices
as well as geopolitical turbulence – specially in the Middle
East – could potentially slow the positive momentum.
FRESENIUS SHARES
In 2005, the ordinary share rose 42.0% and the preference
share 66.6%. Both shares easily outperformed the DAX and
even exceeded the better performing MDAX. This was the
third consecutive year in which the Fresenius shares outper-
formed the DAX. We were also able to outpace the Europe-
an Dow Jones STOXX 600 Healthcare index (27.8%) as well
as the German Prime Pharma & Healthcare index (26.1%).
At the start of 2005, both shares were trading at their
low for the year, with the ordinary share at € 75.58 and
the preference share at € 68.94. With little exception, both
showed a continuous upward trend throughout the year,
peaking on November 3, 2005, when the ordinary share was
at € 109.15 and the preference share at € 119.50. The ordi-
nary share closed 2005 at € 106.00 and the preference share
ended at € 114.65. Over the last three years, the ordinary
share price has more than tripled and the preference share
price more than doubled.
During 2005, Fresenius increased its market capitaliza-
tion by about € 2 billion to approximately € 5.6 billion on
December 31, 2005 (2004 number of shares adjusted by the
capital increase). The average Xetra daily trading volume

Fresenius Shares16
of the ordinary share more than tripled from around 4,400
shares in 2004 to approximately 14,300 shares last year.
Similarly, the daily Xetra volume of the preference share
increased significantly from around 48,500 shares to an
average of 81,400 shares.
DIVIDEND
We are committed to continuing our profit-driven dividend
policy and to increasing our dividend once again as a result of
the substantial advance in earnings of our business segments.
We are proposing to our shareholders a dividend of € 1.48
per ordinary share (2004: € 1.35) and € 1.51 per preference
share (2004: € 1.38). This is an average increase of 10%. As
the 9.4 million new shares from the capital increase are fully
entitled to the 2005 dividend, the total dividend distribution
will be € 75.8 million (2004: € 55.9 million), representing
34% of the Group’s net income.
SHARE RETURN
The Fresenius shares have performed exceptionally over a
10-year period. An investor who spent € 10,000 on Fresenius
preference shares at the end of 1995 would have owned
stock worth € 32,783.03 at the end of 2005. This corresponds
to an average annual return of 13.7% (not including divi-
dends and subscription rights). The MDAX achieved an ave-
rage annual return of about 10.7% over the same period.
CAPITAL STRUCTURE
To finance the acquisitions of HELIOS and Clinico, we in-
creased our capital in November 2005. We issued 4.7 million
ordinary shares and 4.7 million preference shares. In addi-
tion, exercised stock options led to an increase in the number
of shares in both classes of 175,621 each. Accordingly, the
subscribed capital of Fresenius AG rose to € 129,849,036.80
on December 31, 2005. At the end of the year, 50,772,280
shares were outstanding, divided into 25,361,140 bearer ordi-
nary shares and 25,361,140 bearer preference shares.
Please see Note 28 for further information on stock
option plans.
SHAREHOLDER STRUCTURE
The Else Kröner-Fresenius-Foundation is Fresenius’ largest
shareholder with 61.2% of the voting shares. According to
Allianz Lebensversicherungs-AG the company holds between
5 and 10% of the voting shares.
2005*1996 1997
1.60
1.,40
1.20
1.00
0.80
0.60
0.40
0.20
1.51
0.500.56
0.67
0.80
0.96
1.06
1.17
1.26
1.38
1998 1999 2000 2001 2002 2003 2004
DIVIDEND PREFERENCE SHARE IN €
* Proposal
17To our Shareholders Summary Fresenius Shares Business Segments Additional Information Management Report
At the beginning of 2006, we conducted a shareholder survey
which identified 81% of total outstanding shares. We were
thus able to identify nearly all of the ordinary shares and 63%
of the preference shares.
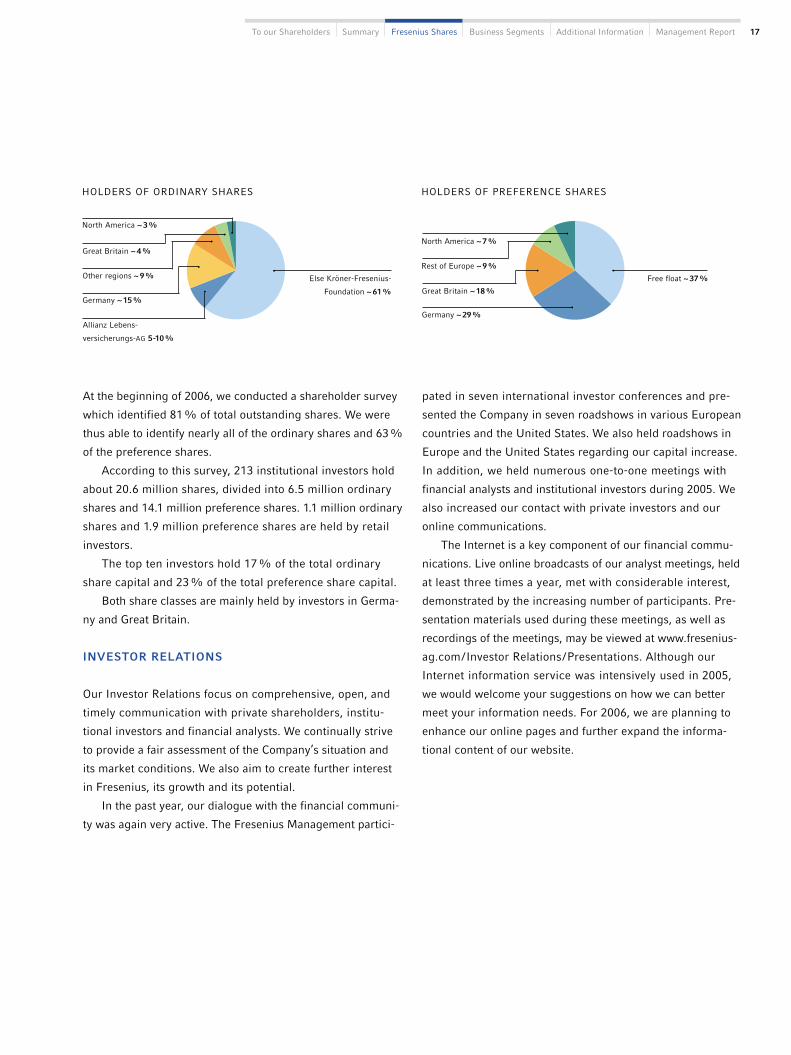
According to this survey, 213 institutional investors hold
about 20.6 million shares, divided into 6.5 million ordinary
shares and 14.1 million preference shares. 1.1 million ordinary
shares and 1.9 million preference shares are held by retail
investors.
The top ten investors hold 17% of the total ordinary
share capital and 23% of the total preference share capital.
Both share classes are mainly held by investors in Germa-
ny and Great Britain.
INVESTOR RELATIONS
Our Investor Relations focus on comprehensive, open, and
timely communication with private shareholders, institu-
tional investors and financial analysts. We continually strive
to provide a fair assessment of the Company’s situation and
its market conditions. We also aim to create further interest
in Fresenius, its growth and its potential.
In the past year, our dialogue with the financial communi-
ty was again very active. The Fresenius Management partici-
pated in seven international investor conferences and pre-
sented the Company in seven roadshows in various European
countries and the United States. We also held roadshows in
Europe and the United States regarding our capital increase.
In addition, we held numerous one-to-one meetings with
financial analysts and institutional investors during 2005. We
also increased our contact with private investors and our
online communications.
The Internet is a key component of our financial commu-
nications. Live online broadcasts of our analyst meetings, held
at least three times a year, met with considerable interest,
demonstrated by the increasing number of participants. Pre-
sentation materials used during these meetings, as well as
recordings of the meetings, may be viewed at www.fresenius-
ag.com/Investor Relations/Presentations. Although our
Internet information service was intensively used in 2005,
we would welcome your suggestions on how we can better
meet your information needs. For 2006, we are planning to
enhance our online pages and further expand the informa-
tional content of our website.
HOLDERS OF PREFERENCE SHARES
Germany ~ 29%
Free float ~ 37%
Rest of Europe ~ 9%
North America ~ 7%
North America ~ 3%
Great Britain ~ 18%
HOLDERS OF ORDINARY SHARES
Great Britain ~ 4%
Else Kröner-Fresenius-
Foundation ~ 61%Germany ~ 15%
Other regions ~ 9%
Allianz Lebens-
versicherungs-AG 5-10%

Fresenius Shares18
EARNINGS PER SHARE
2005 2004
Net income (million €) 222 168
Earnings per ordinary share (€) 5.28 4.08
Earnings per preference share (€) 5.31 4.11
Fully diluted earnings per ordinary share (€) 5.24 4.07
Fully diluted earnings per preference share (€) 5.27 4.10
Average number of shares outstanding 41,880,416 40,969,910
Average number of shares outstanding fully diluted 42,205,914 41,093,404
BASIC SHARE INFORMATION
Ordinary share Preference share
Securities Identification no. 578 560 578 563
Ticker symbol FRE FRE3
ISIN DE0005785604 DE0005785638
Bloomberg symbol FRE GR FRE3 GR
Reuters symbol FREG.de FREG_p.de
Main trading location Frankfurt/Xetra Frankfurt/Xetra
In 2005, Fresenius was once again recognized for the excel-
lence of its financial communications. In the competition for
the best annual report held by the business magazine “man-
ager magazine”, more than 200 annual reports from publicly
traded German and other European companies were evalu-
ated. We were placed second in the MDAX category.
EARNINGS PER SHARE
In 2005, the Fresenius Group achieved earnings per ordinary
share of € 5.28 and earnings per preference share of € 5.31
(2004: € 4.08 per ordinary share and € 4.11 per preference
share). Through the capital increase, the average number of
shares outstanding rose by 0.78 million to approximately
41.88 million. Further details on earnings per share are pro-
vided on page 74 of the Management Report and on page
139 of the Notes.

19To our Shareholders Summary Fresenius Shares Business Segments Additional Information Management Report
ANALYST RECOMMENDATION
Bankhaus Metzler February 2006 Buy
BHF-Bank February 2006 Buy
Cheuvreux February 2006 Outperform
Commerzbank September 2005 Hold
Deutsche Bank* February 2005 Buy
DZ Bank* November 2005 Buy
equinet February 2006 Hold
Goldman Sachs November 2005 Outperform
Helaba Trust February 2006 Buy
HypoVereinsbank* November 2005 Underperform
Landesbank Baden-Württemberg* October 2005 Buy
Landesbank Rheinland-Pfalz February 2006 Outperform
Main First Bank February 2006 Buy
Merrill Lynch February 2006 Buy
M.M. Warburg February 2005 Hold
NordLB November 2005 Hold
Sal. Oppenheim February 2006 Buy
WestLB* November 2005 Outperform
*No publication of research as these banks supported the Fresenius Group in various transactions.
mendations prevailed. Until February 24, 2006 we were
rated with 13 “buy”, 4 “hold” and one “sell” recommenda-
tions. This reflects their confidence in the long-term earning
power of the Fresenius Group and the potential for our shares.
The table below lists the banks providing analyst coverage to
Fresenius and their recommendations.
ANALYST RECOMMENDATIONS
The recommendations of financial analysts are an important
factor for both institutional as well as private investors when
making investment decisions. Statistics from the sector ser-
vice I/B/E/S and our own surveys showed that “buy” recom-

Fresenius Shares20
Code and are committed to responsible management that is
focused at achieving a sustainable increase in the value of
the Company. Key elements of this approach are solid finan-
cial management, long-term corporate strategies and strict
adherence to legal and ethical business standards. Trans-
parent corporate communications is a further commitment.
Good Corporate Governance has been established cor-
porate policy at Fresenius long before the German Corpo-
rate Governance Code was introduced. Our value-enhancing
KEY DATA OF THE FRESENIUS SHARES
2005 2004 2003 2002 2001
Number of shares 50,722,280 40,971,038 40,969,684 40,969,684 40,969,548
Ordinary shares 25,361,140 20,485,519 20,484,842 20,484,842 20,484,774
Preference shares 25,361,140 20,485,519 20,484,842 20,484,842 20,484,774
Stock exchange quotation ordinary share1) (€)
High 109.15 83.49 68.50 80.50 113.75
Low 75.58 60.29 32.50 20.45 76.98
Year-end quotation 106.00 74.65 64.50 36.05 81.00
Stock exchange quotation preference share1) (€)
High 119.50 72.27 57.55 91.25 143.00
Low 68.94 50.87 36.01 21.48 86.70
Year-end quotation 114.65 68.83 54.55 36.45 91.30
Market capitalization2) (million €) 5,596 2,939 2,437 1,485 3,530
Total dividend distribution (million €) 75.83) 55.9 51.0 47.3 42.8
Per share in €
Dividend ordinary share 1.483) 1.35 1.23 1.14 1.03
Dividend preference share 1.513) 1.38 1.26 1.17 1.06
Earnings per ordinary share 5.28 4.08 2.79 3.25 2.27
Earnings per preference share 5.31 4.11 2.82 3.28 2.30
1) Final Xetra quotations on the Frankfurt Stock Exchange2) Total number of ordinary and preference shares multiplied by the respective Xetra year-end quotations on the Frankfurt Stock Exchange3) Proposal
CORPORATE GOVERNANCE REPORT
The German Corporate Governance Code was established
to increase the level of trust in the corporate management of
publicly traded companies. It aims to provide more trans-
parency for investors on existing regulations covering the
management and monitoring of companies. The Manage-
ment and Supervisory Boards of Fresenius AG support the
principles set out in the German Corporate Governance

21To our Shareholders Summary Fresenius Shares Business Segments Additional Information Management Report
ments, review the quarterly reports and – following discussion
with the Management Board – appoint the auditor for the
financial statements and agree the auditor’s fees. The Person-
nel Committee is responsible for approving the employment
terms of members of the Management Board. The Mediation
Committee performs its duties as set out in § 31 paragraph 3,
sentence 1 of the Co-determination Act and proposes poten-
tial Management Board members to the Supervisory Board,
if the required two-thirds majority was not achieved in the
first ballot.
Supervisory Board Efficiency Evaluation
The Supervisory Board performs regular efficiency evalua-
tions in accordance with Clause 5.6. of the German Corpo-
rate Governance Code. So far, the self-evaluations have
shown that the Supervisory Board is organized efficiently
and that there is good cooperation between both boards.
According to Clause 5.1.3. the Supervisory Board has estab-
lished rules of procedure.
Management Board
The Management Board of Fresenius AG is responsible for
managing the Company and conducts Fresenius’ business.
Its actions and decisions are focused on the interests of the
Company. The Management Board has five members, who
are listed on page 6 of this Annual Report.
Cooperation between the Management and
Supervisory Boards
The Management and Supervisory Boards work closely
together in the interest of the Company. The Management
Board informs the Supervisory Board regularly, promptly,
and comprehensively on the Group’s and the business divi-
sions’ development, on corporate planning, and on key
undertakings. Important business transactions require the
approval of the Supervisory Board. In addition, the Man-
agement Board regularly informs the Supervisory Board
strategies, as well as the majority of the guidelines, recom-
mendations and proposals that are contained in the Code,
have been firm components of Fresenius’ activities for
many years.
Supervisory Board
The Supervisory Board of Fresenius AG appoints the mem-
bers of the Management Board and advises and supervises
them. The Supervisory Board of Fresenius AG has 12 mem-
bers. Six are elected by the Annual General Meeting in ac-
cordance with the German Stock Corporation Act (Aktienge-
setz) and six are elected by the employees in compliance with
the German Co-determination Act (Mitbestimmungsgesetz).
The terms of office of the current Supervisory Board mem-
bers end at the close of the 2008 Annual General Meeting.
The members of the Supervisory Board are listed on page 197
of this Annual Report. One Supervisory Board member is a
partner in a law firm that provides legal advice to Fresenius
AG. The Supervisory Board approved this mandate. There
are no other consulting and service contracts between the
Company and other members of the Supervisory Board. The
Supervisory Board is not aware of any conflicts of interest in-
volving members of the Supervisory or Management Boards.
Members are required to promptly notify the Supervisory
Board should such conflicts arise.
Supervisory Board Committees
The Supervisory Board of Fresenius AG has formed three
committees. Each consists of three members of the Supervi-
sory Board except for the Mediation Committee, which has
four members. The chairman of a committee is appointed in
line with Clauses 5.2. and 5.3.2 of the German Corporate
Governance Code. The members of the committees are listed
on page 197 of this Annual Report. The Audit Committee’s
function is to prepare the Supervisory Board’s approval of
the financial statements and the consolidated financial state-

Fresenius Shares22
about the risk situation and risk management of the Group
and discusses with the Supervisory Board the Company’s
strategic focus.
Compensation of the Management and
Supervisory Boards
Total payments to the Management Board for carrying out
their duties in Fresenius AG and its subsidiaries amounted
to € 5,482 thousand in 2005. Of this, € 2,998 thousand was
fixed compensation and € 2,484 thousand was variable com-
pensation. The variable compensation is dependent on the
earnings of the Fresenius Group and/or its business seg-
ments. In addition, the members of the Management Board
received 51,170 convertible bonds pursuant to the 2003
Fresenius AG stock option plan. At the end of 2005, the
members of the Management Board held 143,336 stock
options under the 1998 stock option plan and 134,018 con-
vertible bonds under the 2003 stock option plan. 110,936
stock options were exercised in 2005.
Payments to the Supervisory Board are determined by
the Annual General Meeting and are subject to the provisions
of § 13 of the articles of association of Fresenius AG. Total
payments to the Supervisory Board of Fresenius AG for 2005
amounted to € 1,027 thousand. This included € 249 thou-
sand in fixed compensation and € 778 thousand in variable
compensation. Each Supervisory Board member receives
€ 13 thousand in fixed compensation. The Chairman receives
double this amount and the Deputy Chairman one and a
half times the compensation of a Supervisory Board member.
Variable compensation of each member of the Supervisory
Board for 2005 amounted to € 65 thousand. The members of
the Audit Committee and the Personnel Committee receive
an additional € 10 thousand each. Chairmen of the committees
receive twice the additional compensation.
Stock Option Plans
Fresenius AG has had a stock option plan since 1998. A new
stock option plan was approved by the Annual General
Meeting in 2003 that is based on the issuance of convertible
bonds. The convertible bonds mature in 10 years from the
date of issue. The beneficiaries may exercise the correspond-
ing conversion rights for one third of their bonds two
years after the relevant grant. A further one third may be
converted three years after their issue and the remaining
one third may be converted in their fourth year. Convertible
bonds of bearer ordinary shares and convertible bonds of
non-voting bearer preference shares can only be converted
in the same amount. The conversion price for non-contin-
gent convertible bonds shall correspond to the average stock
exchange price of the bearer ordinary share as well as the
non-voting bearer preference share of the Company over the
last 30 trading days prior to the grant of the bonds, less
the par value of the converted bond. The conversion price
for convertible bonds which are subject to a success tar-
get shall correspond to the stock price of the bearer ordinary
share, as well as the non-voting bearer preference share
when the target is first reached, less the par value of the
converted bond.
Directors & Officers-Insurance (D & O)
Fresenius AG has arranged a consequential loss liability
insurance policy (D & O insurance) for the members of the
Management and Supervisory Boards of Fresenius AG and
for all representative bodies of its German and international
affiliates. The D&O policy applies worldwide and runs until
the end of June 2006. The policy covers the legal defense
costs of a member of a representative body should a claim
be made and, where relevant, any damages awarded. Mem-
bers of the Supervisory Board and the Management Board
are subject to an appropriate retention fee.

23To our Shareholders Summary Fresenius Shares Business Segments Additional Information Management Report
Annual General Meeting
About 400 shareholders attended the Annual General Mee-
ting (AGM) on May 25, 2005 in Frankfurt /Main, representing
about 85% of the ordinary and approximately 11% of the
preference share capital. As in the previous year, we broad-
cast the speech of the Chairman of the Management Board
live over the Internet for those shareholders unable to attend
the AGM. The recording of the speech (in German) is avail-
able at www.fresenius-ag.com/Investor Relations/Annual
General Meeting.
Shareholders can appoint a proxy to exercise their voting
rights at the AGM. In accordance with the principles of the
German Corporate Governance Code, Fresenius AG appoints
one or more voting representatives to vote according to
shareholders’ instructions.
In accordance with the Act on Corporate Integrity and
Modernization of the Right of Avoidance (UMAG) passed
November 1, 2005, we will amend the registration and verifi-
cation of shareholders attending the AGM. The main change
will be to move the record date for shareholders to 21 days
prior to the AGM, in line with international practice.
Transparency and Communication
Fresenius AG adheres to all recommendations of Clause 6 of
the German Corporate Governance Code. Transparency and
speedy communication are highly valued by Fresenius AG.
We promptly notify our shareholders of significant new devel-
opments as well as changes in voting rights in the Company.
All publications are posted on the Internet without delay, and
we regularly inform our shareholders about important dates.
Our financial reports are published in accordance with the
timing recommendations of the German Corporate Govern-
ance Code. We also publish Directors’ Dealings, which have
to be notified in accordance with § 15a of the German Secu-
rities Trading Act (Wertpapierhandelsgesetz) on the Internet
at www.fresenius-ag.com/Investor Relations/Corporate
Governance.
The members of the Management and the Supervisory
Boards together held less than 1% of the total outstanding
shares on December 31, 2005.
Compliance
Compliance with legal and ethical principles is an integral
part of the corporate culture of Fresenius. Fresenius has
made provisions to ensure compliance with, for example,
the new insider trading laws as well as putting in place
provisions for combating corruption.
Risk Management
We consider that the responsible handling of risks is an
element of good corporate governance. Fresenius practices
systematic risk management that allows the Management
Board to react promptly to relevant changes in the risk profile.
The risk management system is reviewed as part of the an-
nual audit. Further information may be found in the risk re-
port on page 84.
Financial Accounting and Reporting
Fresenius prepares its group financial statements in accord-
ance with the United States Generally Accepted Accounting
Principles (US GAAP). As from the 2005 fiscal year, Fresenius,
as a publicly traded company based in a member country
of the European Union, is required to prepare and publish
its financial statements in accordance with International
Financial Reporting Standards (IFRS) pursuant to § 315a
of the German Commercial Code. Our largest subsidiary,
Fresenius Medical Care, prepares its financial statements in
accordance with US GAAP, therefore, we will continue to
publish our financial statements in accordance with US GAAP

Fresenius Shares24
to make them comparable and transparent for our sharehold-
ers. Additionally, we will publish our financial statements in
accordance with IFRS, as required by law.
Implementation of the German Corporate Governance
Code Guidelines
The Management Board and Supervisory Boards of Fresenius
AG have made a Declaration of Compliance pursuant to § 161
German Stock Corporation Act (Aktiengesetz), in accord-
ance with the German Corporate Governance Code of June 2,
2005 and have made it available to the shareholders. In
accordance with Clause 3.10. of the Code, this declaration,
as well as past declarations, is available on our website at
www.fresenius-ag.com/Investor Relations/Corporate Govern-
ance.
On December 1, 2005, the Management and Supervisory
Boards of Fresenius AG issued their fourth Declaration of
Compliance with § 161 of German Stock Corporation Act.
Herein, it is stated that the recommendations of the German
Corporate Governance Code as amended on June 2, 2005
have been and are being met. The Management and Supervi-
sory Boards also intend to follow any future recommenda-
tion of the German Corporate Governance Code. The follow-
ing recommendations are the only ones that have not been
or are not being met:
Ω Disclosure of individual compensation for each member
of the Management Board, according to Clause 4.2.4.,
sentence 2, in our view limits the structuring of compen-
sation so that it is differentiated by individual perform-
ance and responsibility.
Ω Clause 4.2.3. paragraph 2, sentence 2 recommends that
stock options and similar instruments should be linked
to demanding, relevant comparison parameters. This is
not common practice internationally. As a global compa-
ny, Fresenius competes on a worldwide basis for highly
qualified staff. Therefore, under the current stock option
plan it is possible to refrain from a success target.

25To our Shareholders Summary Fresenius Shares Business Segments Additional Information Management Report
OUR GOAL:
INCREASE MARKET
LEADERSHIP
EXPANSION OF DIALYSYIS
PORTFOLIO
Additional growth through new
dialysis services and renal drugs
Following years
2006
FOUNDATION OF FRESENIUS MEDICAL CARE
The world’s largest dialysis company
1996
INTRODUCTION OF SINGLE-USE
DIALYZERS IN THE US
As part of the UltraCare™ concept, Fresenius
Medical Care converts its clinics from re-use
to single-use dialyzers
2002
CLOSING OF ACQUISITION AND FOCUS
ON INTEGRATION
Renal Care Group acquisition expected to be
closed in the first quarter of 2006. Fresenius
Medical Care to focus its US activities on the
successful integration of the company
2005 ACQUISITION OF RENAL CARE GROUPIncrease leading market position in the UnitedStates – the largest dialysis market in the world

Fresenius Medical Care – Increase market leadership26
Fresenius Medical Care has won the 2006 German Business Innovation Award for its 5008 dialysis therapy system.

27To our Shareholders Summary Fresenius Shares Business Segments Additional Information Management Report
OUR MILESTONE:
ACQUISITION OF RENAL CARE GROUP
For Fresenius Medical Care, 2005 was marked by the largest acquisition in its history – Renal
Care Group, the fourth-largest dialysis care provider in the United States. This acquisition is
a key strategic step.
Enhance position as the world’s leading dialysis provider. Fresenius Medical Care took advan-
tage of the unique growth opportunity in a largely consolidated market, since DaVita purchased
Gambro’s clinic business last year. The closing of the Renal Care Group acquisition expected in
the first quarter of 2006 will assure our leading position in the most important dialysis market in
the world.
Renal Care Group and Fresenius Medical Care bring together the key success factors in the
dialysis industry – an attractive customer base and cost leadership in products. The highly-profit-
able Renal Care Group will significantly improve earnings potential and growth opportunities
for Fresenius Medical Care. Renal Care Group generates an industry-leading share of its revenue
from private payors. Renal Care Group serves more than 32,500 patients in over 450 clinics while
Fresenius Medical Care treats approximately 89,300 patients in 1,155 dialysis centers in the United
States. With its service network, Renal Care Group provides the perfect geographic match for
Fresenius Medical Care’s operations.
The new 5008 dialysis therapy system
sets itself apart with a simple interface
and improved treatment quality. Rou-
tine procedures and maintenance have
been significantly reduced.

Fresenius Medical Care – Increase market leadership28
OUR WAY FORWARD:
CONTINUALLY IMPROVING THE QUALITY
OF PRODUCTS AND CARE
Valuable synergies. While Fresenius Medical Care benefits from the entire value chain as an inte-
grated company, Renal Care Group is a dialysis care provider without its own product business. This
creates additional growth opportunities for Fresenius Medical Care in dialysis machines, dialyzers,
and disposables and improves its competitiveness. Purchasing in larger quantities allows for better
terms. Including savings in administration, from 2007, synergy benefits of US$ 40 to US$ 50 million
are a distinct possibility.
Both companies strive for the best-possible treatment quality and innovative therapies. Renal
Care Group not only fits well geographically and strategically with Fresenius Medical Care, but
the two companies are also similar in corporate culture and goals. Both have recognized quality
criteria in conformity with the highest medical standards. Treatment results from individual clinics
are compared within the own clinic network as well as with national and international standards to
safeguard uniform, high-quality care. Both companies have made significant progress in this sphere
in recent years – Renal Care Group’s treatment results, for example, are well above the US aver-
age. With its UltraCare™ program, Fresenius Medical Care is the only provider that uses single-use
dialyzers exclusively. This advance is expected to lower the mortality rate in the mid- to long-term.
When the most successful dialysis company in the world joins with Renal Care Group in 2006,
combining its resources and expertise, it will be another key step on our way – using innovative
therapies to increase life expectancy and enhance patients’ quality of life.
The dialyzer or “artificial kidney” is a key
component of hemodialysis treatment. We
are committed to continually improving
the effectiveness of this product.

29To our Shareholders Summary Fresenius Shares Business Segments Additional Information Management Report
Fresenius Medical Care produces approximately 60 million dialyzers per year.

Business Segments3030
FRESENIUS MEDICAL CARE
Ω Excellent business performance continues.
Ω In 2005, Fresenius Medical Care treated 131,450 patients;the number of treatments increased by 5% to 19.7 million.
Ω Renal Care Group acquisition strengthens market leadership.
Ω Conversion of preference shares into ordinary shares andtransformation of legal form completed.
DIALYSIS CLINICS AND NUMBER OF PATIENTS TREATED
Asia-Pacific
3,500 patients
40 clinics
North America
89,300 patients
1,155 clinics
As at December 31, 2005
Latin America
15,800 patients
160 clinics
Europe
22,850 patients
325 clinics

31To our Shareholders Summary Fresenius Shares Business Segments Additional Information Management Report
Fresenius Medical Care – the world’s leading provider of dialysis products and dialysis
care – achieved an excellent performance in 2005: Dialysis care sales increased by 8%;
dialysis product sales grew by 10%. Net income of Fresenius Medical Care rose by 13%.
BUSINESS DEVELOPMENT
In 2005, sales rose 9% to US$ 6,772 million (2004: US$ 6,228
million). Constant-currency sales growth was 8%. 68% of
sales was achieved in North America, 23% in Europe and
9% in the remaining regions of the world.
Dialysis care accounted for 72% of Fresenius Medical
Care’s sales and dialysis products for 28%. Sales in dialysis
care grew by 8% to US$ 4,867 million (2004: US$ 4,501 mil-
lion) while sales of dialysis products rose by 10% to US$ 1,905
million. Growth in dialysis care is largely driven by the US
market. Excellent growth was also achieved by the interna-
tional products business.
Fresenius Medical Care increased EBIT by 10% to US$ 939
million (2004: US$ 852 million). Net income was US$ 455
million (2004: US$ 402 million) representing an exceptional
growth of 13%.
An outstanding event for Fresenius Medical Care in 2005
was the acquisition of the US dialysis care provider Renal
Care Group. The acquisition is expected to close in the first
quarter of 2006. In 2005, Renal Care Group achieved sales
of US$ 1.57 billion. Please see pages 25 to 29 of this report
for further details. In addition, the conversion of Fresenius
Medical Care’s preference shares into ordinary shares and
the change in the company’s legal form to a KGaA were
important milestones. More on these changes can be found
on page 112 and 113.
NORTH AMERICA
The business in our largest region developed exceptionally
well last year as shown in the following table:
2005 2004 Change
Sales (in million US$) 4,577 4,248 8%
Dialysis clinics (December 31) 1,155 1,130 2%
Dialysis patients (December31) 89,300 86,350 3%
Treatments (in millions) 13.5 13.0 4%
Total number of dialysis
patients in the region* ~385,000
Increase in the number
of patients* ~4%
* Internal estimates
Mexico was included to the North America region in 2005. Figures for 2004 have been adjustedto reflect this change.
Dialysis care continues to be our major activity in North
America. Sales in this area increased by 7% to 4.05 US$
billion. We were able to significantly increase revenues per
treatment to US$ 302 from US$ 290 in 2004. This was due
to the higher number of privately insured patients we treated.
Private payors provide a higher reimbursement rate than
public health insurance plans. Furthermore, we were able to
increase reimbursement rate from private payors. In 2005,

Business Segments32
we increased our percentage of sales with private payors
from 37% to 40%. The percentage of patients Fresenius
Medical Care treated in 2005 was 27% of the total market.
UltraCareTM remained the focus of our dialysis care activi-
ities in 2005. All our North American clinics now use this
therapy, which features single-use dialyzers instead of re-use
dialyzers. Our goal is to achieve the best possible clinical
outcomes and therefore improve the quality of life of our pa-
tients. At the same time, this therapy concept allows us to
further expand and strengthen our position as market leader.
For this reason, comprehensive marketing programs were
launched to raise the level of awareness of UltraCareTM among
external dialysis providers.
Our nocturnal dialysis treatment program is attracting
strong interest. Patients usually spend every second night at
one of our clinics to undergo dialysis while they sleep. In
2005 we broadened the network of clinics offering nocturnal
dialysis. The demand for home hemodialysis is also grow-
ing. Approximately 1,800 of our patients underwent dialysis
at home at the end of 2005. We also successfully expanded
our products and services for home hemodialysis: We provide
patients with a dialysis machine tailored for home hemo-
dialysis – the 2008K@Home – as well as with comprehensive
training and informational materials.
In spring of 2005, Fresenius Medical Care introduced a
new information system in the United States that improves
the recording of treatment data and the analysis of treatment
quality. The new information system will improve monitoring
functions and can more quickly adapt to new billing models
within the existing workflow. Implementation of the new
system is expected to be complete in 2008 and will require
an investment of more than US$ 100 million.
Our dialysis products business also developed positively.
It includes products for hemo- and peritoneal dialysis as
well as hospital services such as extracorporeal therapies
and laboratory services. Sales rose to US$ 523 million in
2005, an increase of 17%. This was mainly due to strong
demand for Optiflux dialyzers and the 2008K dialysis ma-
chine. Our market share for these product groups in the net
available external market, which we define as dialysis clin-
ics that are not part of a chain, is almost 70%. The 2008K
is the leading machine – we have produced nearly 10,000
units for the North American market. We also enjoyed above-
average growth in dialyzers and set a sales record of more
than 26 million Optiflux units. At the end of 2005, about 60%
of all hemodialysis patients in the United States were dial-
yzed using single-use dialyzers from Fresenius Medical Care.
We increased our market share in peritoneal dialysis from
27% in 2004 to 31%. Here we expanded our product port-
folio.
Fresenius Medical Care also made further advancements
in Disease Management. Our programs offer fully integrated
therapies that include, besides dialysis treatment, vascular
access care and patient nutrition – all aiming to avoid unnec-
essary hospital stays. Last year we bought out our partners in
Optimal Renal Care and Renaissance Health Care and merged
the companies into a single unit. We took this step to combine

33To our Shareholders Summary Fresenius Shares Business Segments Additional Information Management Report
the strengths of both organizations and operate Disease
Management even more efficiently. At the end of 2005 we had
contracts with private health insurers to care for about
4,000 patients.
For the first time, the Center for Medicare and Medicaid
Services (CMS) has awarded us a contract to operate a four-
year demonstration project for dialysis patients. CMS oversees
the public US health insurance programs. For the project,
Fresenius Medical Care is paid a monthly per-patient fee ra-
ther than billing for each individual service. The agreed fee
covers all health care services for the patients included in the
program. The project will include several thousand patients.
We are convinced that this comprehensive care program and
method of reimbursement will result in improved treatment
for our patients. As a vertically integrated provider of dialysis
products and care, Fresenius Medical Care considers itself
to be well positioned to profit from the future development
of Disease Management programs.
Laboratory tests are the decisive factor for nephrologists
when deciding on the dialysis therapy for their patients. There-
fore, test results contribute significantly to a patient’s treat-
ment quality and to quality of life. Our subsidiary Spectra Renal
Management performs these laboratory services for about
125,000 dialysis patients. It is the largest clinical laboratory
for dialysis-related services in North America, with a market
share of around 42% and almost 42 million tests performed
in 2005 (2004: 41 million).
EUROPE/MIDDLE EAST/AFRICA
These regions developed very positively, with sales growth
outpacing the market in many countries. This growth enabled
Fresenius Medical Care to expand its position as the leading
provider of dialysis care and products. The number of dialysis
patients also increased substantially, as the following table
shows:
2005 2004 Change
Sales (in million US$) 1,592 1,458 9%
Dialysis clinics (December 31) 325 285 14%
Dialysis patients (December 31) 22,850 20,250 13%
Treatments (in millions) 3.38 3.07 10%
Total number of dialysis
patients in the regions* ~440,000
Growth in the number
of patients* ~5%
* Internal estimates
Last year, 35% of sales was generated in dialysis care
(US$ 550 million) and 65% in dialysis products (US$ 1,042
million).
Europe is a fragmented region. We are active in more
than 35 individual markets, some of which have fundamen-
tal differences in their reimbursement policies and market
access. Some countries, including Germany, currently pro-

Business Segments34
hibit private companies from operating dialysis clinics, while
in Eastern Europe a move toward privatization is creating
additional growth opportunities for Fresenius Medical Care.
In Central Europe we are primarily active in dialysis
products. This market did not grow despite increasing patient
numbers, underlining the high level of competition we face
in this region. Nevertheless, we were very successful in this
region and achieved good sales growth.
The successful introduction of our 5008 therapy system
was a milestone in 2005. This new generation of dialysis
machines generated very positive demand from our cus-
tomers. With this system our lead in innovation is once more
sustained.
We also continued to achieve good growth with our
FX-class dialyzers, enabling us to further expand our market
share. We now supply over 50% of all dialyzers used in
Germany.
Sales in products for acute dialysis also increased. We
expanded our market share with Multifiltrate, a system
specially designed for treating acute kidney failure. The
Genius therapy system is also attracting wider accept-
ance and is marketed in various countries such as Belgium,
Austria, Switzerland, Italy, and Poland.
In peritoneal dialysis, a South Korean study documented
the superiority of our biocompatible dialysis solutions. These
results also generated considerable interest in Europe and
had a positive impact on the sales of our bicaVera forte and
balance dialysis solutions. In Belgium, for example, bicaVera
became established as the standard peritoneal dialysis so-
lution.
In contrast to the markets of Central Europe, where
Fresenius Medical Care is primarily active in dialysis prod-
ucts, in many other areas of Europe we have positioned our-
selves as a provider of dialysis care.
We were very successful in France where the number of
treatments rose by 5%. By the end of the year we had treated
about 1,400 patients there. In product sales, we achieved a
new record with more than 1.1 million dialyzers sold. Thus,
a quarter of all dialyzers used in France are produced by
Fresenius Medical Care.
In Spain and Portugal we are the leading dialysis care
provider. The number of our patients exceeded 8,000 – more
than a quarter of all patients on the Iberian Peninsula. The
introduction of the 5008 dialysis machine was especially
successful in Portugal.
We had an exceptional success in Great Britain, where
we achieved significant growth in both dialysis products
and dialysis care. We treated approximately 2,100 hemodial-
ysis patients in Great Britain in 2005. In 2006, we expect
further positive developments. In Ireland, we plan to open
our first dialysis clinic.
East and southeast Europe were among our regions
showing the strongest growth in 2005. Turkey is now one
of our key markets. We increased the number of patients
there by nearly 10% and treated about 4,100 dialysis pa-
tients in approximately 40 clinics by the end of the year.
In addition, the reimbursement rate for dialysis treatments
increased by approximately 20%, making a further contri-
bution to our positive results in Turkey. Peritoneal dialysis
also developed very favorably. By the end of 2005, we had
treated around 1,300 patients with our peritoneal dialysis
products (2004: 1,000 patients).
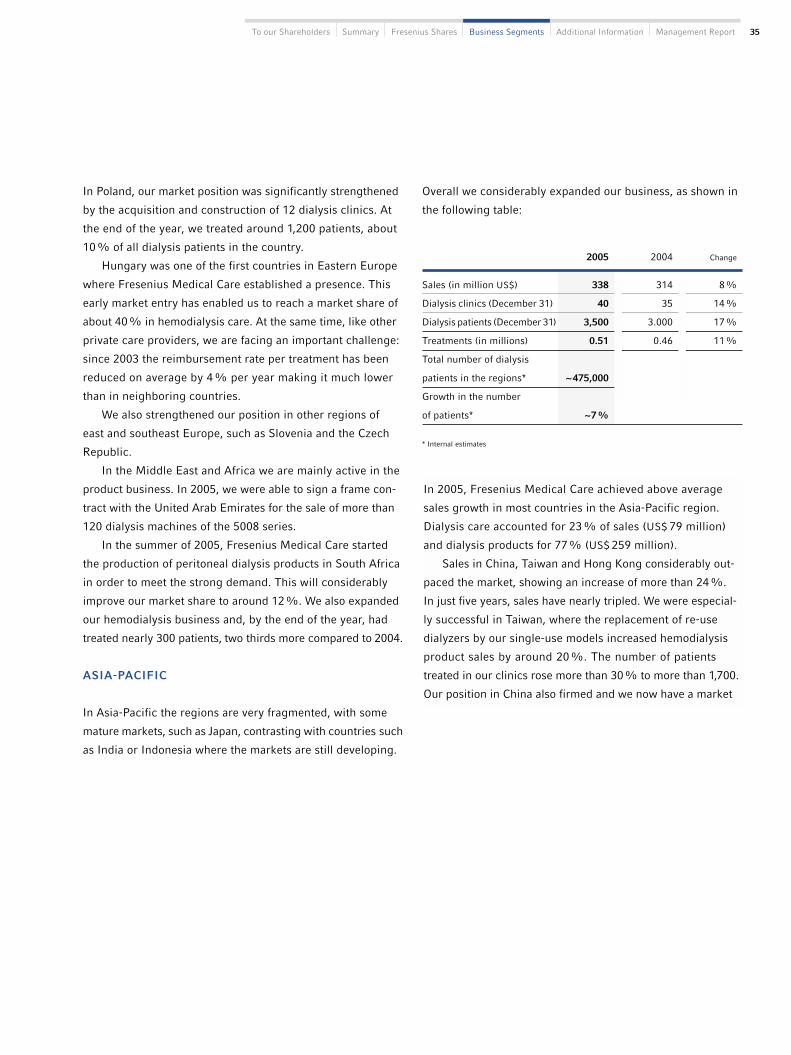
35To our Shareholders Summary Fresenius Shares Business Segments Additional Information Management Report
Overall we considerably expanded our business, as shown in
the following table:
In Poland, our market position was significantly strengthened
by the acquisition and construction of 12 dialysis clinics. At
the end of the year, we treated around 1,200 patients, about
10% of all dialysis patients in the country.
Hungary was one of the first countries in Eastern Europe
where Fresenius Medical Care established a presence. This
early market entry has enabled us to reach a market share of
about 40% in hemodialysis care. At the same time, like other
private care providers, we are facing an important challenge:
since 2003 the reimbursement rate per treatment has been
reduced on average by 4% per year making it much lower
than in neighboring countries.
We also strengthened our position in other regions of
east and southeast Europe, such as Slovenia and the Czech
Republic.
In the Middle East and Africa we are mainly active in the
product business. In 2005, we were able to sign a frame con-
tract with the United Arab Emirates for the sale of more than
120 dialysis machines of the 5008 series.
In the summer of 2005, Fresenius Medical Care started
the production of peritoneal dialysis products in South Africa
in order to meet the strong demand. This will considerably
improve our market share to around 12%. We also expanded
our hemodialysis business and, by the end of the year, had
treated nearly 300 patients, two thirds more compared to 2004.
ASIA-PACIFIC
In Asia-Pacific the regions are very fragmented, with some
mature markets, such as Japan, contrasting with countries such
as India or Indonesia where the markets are still developing.
2005 2004 Change
Sales (in million US$) 338 314 8%
Dialysis clinics (December 31) 40 35 14%
Dialysis patients (December 31) 3,500 3.000 17%
Treatments (in millions) 0.51 0.46 11%
Total number of dialysis
patients in the regions* ~475,000
Growth in the number
of patients* ~7%
* Internal estimates
In 2005, Fresenius Medical Care achieved above average
sales growth in most countries in the Asia-Pacific region.
Dialysis care accounted for 23% of sales (US$ 79 million)
and dialysis products for 77% (US$ 259 million).
Sales in China, Taiwan and Hong Kong considerably out-
paced the market, showing an increase of more than 24%.
In just five years, sales have nearly tripled. We were especial-
ly successful in Taiwan, where the replacement of re-use
dialyzers by our single-use models increased hemodialysis
product sales by around 20%. The number of patients
treated in our clinics rose more than 30% to more than 1,700.
Our position in China also firmed and we now have a market

Business Segments36
In 2005, the Japanese dialysis market was once again marked
by price pressure and strong competition, which kept market
growth below the increase in patient numbers.
At the beginning of 2005, Fresenius Medical Care altered
the production and marketing cooperation with Kawasumi
Laboratories, and will now supply the partner with polysul-
fone fibers rather than contract manufacturing-made dial-
yzers. In dialysis products, we reaffirmed our position as one
of the leading providers.
Growth in the Asia-Pacific area is expected to continue.
We intend to outpace the overall market for dialysis products
and dialysis care in 2006 and position ourselves as a best
partner in dialysis therapy.
LATIN AMERICA
Our business activities in Latin America developed extremely
well. This is a consequence of the region’s robust economic
development and a sharp increase in patient numbers.
share of more than 40% in dialyzers and dialysis machines.
In Hong Kong, peritoneal dialysis is the dominant treatment
method. We treat more than 1,100 patients there.
Peritoneal dialysis developed very positively in South
Korea, where we supply our products to more than 2,000 pa-
tients. Sales growth was also generated by new products:
We installed our new 5008 machines in the dialysis center of
a leading university clinic. In addition, in 2006 we will be-
gin marketing our dialysis concentrates, which are produced
locally with a partner.
In Australia we are not only planning and building the
necessary dialysis infrastructure, we also offer fully integrat-
ed dialysis management services for hemo and peritoneal
dialysis patients. At the beginning of 2006 we won the tender
to provide comprehensive care to home hemodialysis pa-
tients in Western Australia. Moreover, we care for around
200 peritoneal dialysis patients. The quality of treatment
provided is increasingly important, and our high quality stand-
ards have, in some cases, enabled us to achieve a higher
reimbursement rate per treatment.
Fresenius Medical Care also expanded its market share
in the product business in the southeast Asia-Pacific region.
With about 250,000 dialysis patients, Japan is the big-
gest market in the region and accounts for about 20% of
all dialysis patients worldwide. Fresenius Medical Care is
mainly active in two areas: dialysis products and, through
its subsidiary NephroCare Japan, as a provider of compre-
hensive consulting services for dialysis centers.
2005 2004 Change
Sales (in million US$) 264 208 27%
Dialysis clinics (December 31) 160 155 3%
Dialysis patients (December 31) 15,800 14,800 7%
Treatments (in millions) 2.37 2.27 4%
Total number of dialysis
patients in the regions* ~145,000
Growth in the number
of patients* ~6-7%
* Internal estimates

37To our Shareholders Summary Fresenius Shares Business Segments Additional Information Management Report
ics – international companies are prohibited from operating
dialysis centers – we were able to exceed market growth. Last
year we also signed our first contract for Disease Management.
Our business also grew in Colombia, where the number
of hemodialysis patients treated rose by 14% to more than
3,100. The sale of dialysis products also developed positive-
ly. In 2005, we increased production of dialysis solutions to
meet domestic demand and intensified exports to neighbor-
ing countries.
In Venezuela, our business developed very positively,
with the number of peritoneal dialysis patients treated in-
creasing by about 150 to more than 700. Our hemodialysis
business also grew faster than the market. By the end of
2005 we cared for about 1,300 hemodialysis patients and
now have a market share of about 20%.
In 2005, we achieved a constant-currency sales increase
of 17%. Dialysis care accounted for 70% of sales (US$ 184
million) and dialysis products for 30% (US$ 80 million).
Argentina is Fresenius Medical Care’s most important
market in the region with about 7,000 patients cared for in
over 80 dialysis clinics. This represents about 5% more
patients than in 2004. Last year we expanded our acute dial-
ysis activities. Decision-makers in the health care sector
are becoming increasingly aware of the importance of qual-
ity in dialysis treatment. As a result, we succeeded in in-
creasing our number of Disease Management contracts from
two to seven in 2005.
In Brazil, we are the leading provider of hemodialysis
products and we extended this position in 2005. More than
half of all dialyzers used in Brazil are supplied by Fresenius
Medical Care. With about 4,100 patients in our partner clin-
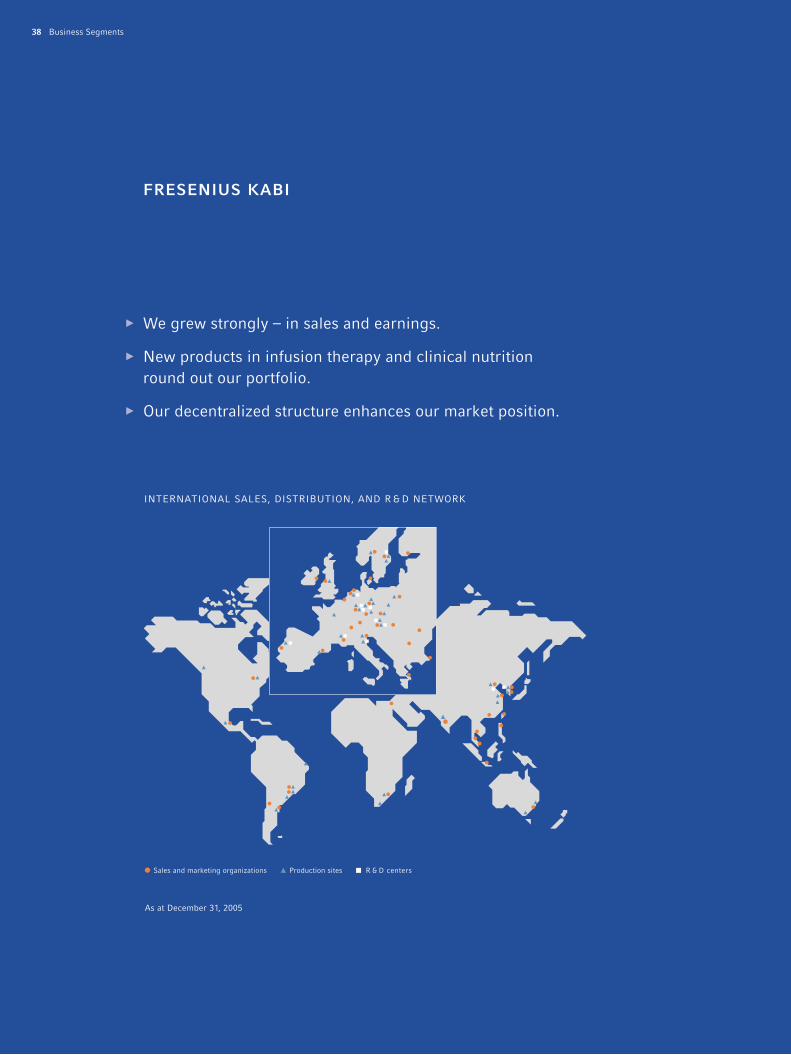
Business Segments38
FRESENIUS KABI
Ω We grew strongly – in sales and earnings.
Ω New products in infusion therapy and clinical nutritionround out our portfolio.
Ω Our decentralized structure enhances our market position.
INTERNATIONAL SALES, DISTRIBUTION, AND R & D NETWORK
Sales and marketing organizations
As at December 31, 2005
R & D centersProduction sites

39To our Shareholders Summary Fresenius Shares Business Segments Additional Information Management Report
2005 was an exceptional year for Fresenius Kabi with significant increase in earnings
and high organic sales growth in all regions. The successful integration of our 2005
acquisitions will foster our dynamic growth in our business units.
Fresenius Kabi is one of the few companies to offer infusion
therapy, clinical nutrition, and related medical devices. Our
market position is strong: We are the market leader in Eu-
rope and leading in almost all of our markets in Latin America
and Asia-Pacific.
Fresenius Kabi offers an integrated product portfolio. We
develop, manufacture, and market pharmaceutical products
as well as medical devices and disposables for infusion and
nutrition therapies. We focus on products for the treatment
and care of critically and chronically ill patients.
In infusion therapy we offer products for fluid and blood
volume replacement as well as generic intravenously admin-
istered drugs (IV drugs). We also supply infusion technolo-
gies, infusion disposables, and patient data management
systems.
In clinical nutrition we provide parenteral (administered
intravenously) and enteral nutrition (administered via the
gastrointestinal tract). Other products include inpatient and
outpatient infusion technologies, infusion disposables, and
patient data management systems.
Our products are used in the entire network of medical
care: in the emergency room, during operations, in intensive
care, in regular hospital wards as well as in outpatient care.
A further business unit of Fresenius Kabi is transfusion
technology, where we offer a range of products for use by blood
banks and blood donation units to produce blood products.
BUSINESS DEVELOPMENT
In 2005, Fresenius Kabi achieved a significant increase in
sales of 13% to € 1,681 million (2004: € 1,491 million). Organ-
ic growth rose by a strong 7%. Acquisitions increased sales
by 5%, primarily due to Labesfal. Currency translation added
2% to sales, divestments had a -1% effect.
The table shows the development by region:
Organicin million € 2005 2004 Change growth
Germany 405 401 1% 1%
Europe ex Germany 819 712 15% 5%
Asia-Pacific 183 157 17% 15%
Latin America 101 79 28% 14%
Other regions 173 142 22% 18%
In Europe we considerably increased sales and achieved
organic growth of 4%. In Germany, sales grew by 1% de-
spite cost-saving measures in the health care sector.
Outside Europe, in the international segment, we con-
tinued our usual high level of growth.

Business Segments40
Sales by product segment were as follows: In March 2005 we closed our acquisition of Labesfal. This
company produces and markets generic intravenously ad-
ministered drugs for hospitals.
Halfway through the year we increased our stake in the
Chinese joint venture Beijing Fresenius Kabi Pharmaceu-
tical Co., Ltd. (BFP) from 65% to 100%, buying out 35%
from the Beijing Double Crane Pharmaceutical Co., Ltd. In
2005, BFP achieved sales of € 46 million. The company’s
approximately 450 employees produce infusion solutions
and IV anesthetics. Founded in 1994, the company is one
of our most successful subsidiaries in the Asia-Pacific re-
gion. The BFP-produced blood volume replacement solu-
tion HAES-steril® and the anesthetic Propofol Fresenius rank
among the seven most successful products recently intro-
duced in China by foreign firms. Since 1982 we have also
been active in China with another joint venture, the Sino
Swed Pharmaceutical Co. Ltd. Last year, to maximize the
opportunities offered by the dynamic development of the
Chinese healthcare market, we founded a holding company
based in Beijing to coordinate all of our subsidiaries’ ac-
tivities in the country.
In August 2005, we signed a contract to acquire a 25%
stake in E-Wha International, Inc., an owner-managed South
Korean medical technology company. E-Wha, which is based
in Seoul, develops, produces and markets disposable infusion
systems. As a result, we have acquired the worldwide rights
to market, distribute and further develop the E-Wha infusion
systems. The company’s main product group is disposable
infusion pumps primarily used in outpatients for administer-
ing medication in cancer and for pain therapy.
Organicin million € 2005 2004 growth
Infusion therapy 895 759 7%
Clinical nutrition 674 624 8%
Transfusion technology 112 108 1%
Fresenius Kabi significantly increased earnings. EBIT rose
by 33% last year to € 234 million (2004: € 176 million). Our
EBIT margin was 13.9% (2004: 11.8%). We clearly exceed-
ed the projected full-year EBIT margin target of > 13.5%,
which was raised at the mid of 2005.
Our business developed extremely well in both Europe
and the international segment. In Europe we achieved an
EBIT of € 216 million (2004: € 172 million), corresponding to
an increase of 26% and an EBIT margin of 17.6% (2004:
15.5%). In the international segment, EBIT rose by 35% to
€ 74 million (2004: € 55 million). The EBIT margin increased
to 16.2% (2004: 14.6%). Corporate costs and corporate
research and development expenses amounted to € 56 mil-
lion (2004: € 51 million).
ACQUISITIONS AND INTERNATIONAL EXPANSION
A key goal for 2005 was to broaden our international pres-
ence and our product portfolio – via acquisitions and through
the foundation and strengthening of subsidiaries.
On January 1, 2005 we set up a subsidiary in the Philip-
pines. It is an important step towards expanding of our busi-
ness in this country. Previously, we were only represented
by two distribution partners.

41To our Shareholders Summary Fresenius Shares Business Segments Additional Information Management Report
On September 1, 2005, we established a subsidiary in Malay-
sia, where previously we had only been represented by our
distribution partners.
In December 2005, we completed the acquisition of the
business of Clinico GmbH, a German manufacturer of medi-
cal devices.
On January 1, 2006, Fresenius Kabi increased its stake in
Pharmatel Fresenius Kabi Pty Ltd. from 25.1% to 50.1%.
Launched in 2004, the Australian joint venture compounds
intravenously administered drugs and is also active in par-
enteral nutrition.
INFUSION THERAPY
In 2005, Fresenius Kabi strengthened its position as market
leader in Europe and expanded its market presence in Asia-
Pacific, Latin America, and South Africa.
Fresenius Kabi has been active in the field of blood vol-
ume replacement for several decades. Our replacement solu-
tions contain hydroxyethyl starch (HES), which is made from
maize. HES products are artificial colloids that can be used
with any blood group. We are market leader in this field in
Europe, Asia-Pacific, and Latin America. We have estab-
lished a new generation of colloids with our product Voluven®,
which we sell in approximately 70 countries. Its medical
superiority and safety in use have won us widespread accept-
ance of this product. In Brazil for example, only one year
after its introduction, Voluven® has become the blood volume
replacement solution of choice and the leader in artificial
colloids.
Propofol Fresenius is an anesthetic agent that we sell in
more than 80 countries. We achieved high growth rates in
Asia-Pacific, where we already rank among the largest sup-
pliers. We concluded the regulatory approval process for
our new Propofol variety with medium-chain and long-chain
fatty acids in 2005 and started their launch in the EU and
Switzerland. Propofol Fresenius is a highly effective and easily
controllable anesthetic. These properties have resulted in its
increasing use in diagnostic procedures such as endoscopy.
In 2005, we introduced numerous new medical devices
for infusion therapy. At MEDICA, the world’s largest trade fair
for medical technology, we presented the first product from
our new Agilia line. The Injectomat Agilia is a high precision
syringe pump for the intravenous administration of medi-
cation. Ease of use and safety were priorities in the pump’s
development. A simple menu enables it to be configured
for use in general and intensive care, during surgery, and in
emergency rooms. Data saved in the Injectomat Agilia –
such as flow rate and volume – can be transferred directly
to hospitals’ data management systems.
We also introduced a new device for the instant diag-
nosis of blood parameters: EasyLab measures, monitors, and
documents blood parameters such as electrolytes, pH-levels,
oxygen, and carbon dioxide partial pressure, as well as hema-
tocrit levels. The device can be used in intensive care and
during surgery, but also in dialysis and by the general practi-
tioner for monitoring lung function.
Another new product in 2005 was Ambix ANAPA, a dispos-
able pump for administering medication that can be used
for all types of infusions. Among the single-use pumps on the
market, Ambix ANAPA is distinguished by its precision, safe-
ty, and easy handling. Designed especially for outpatient care,
the pump is used primarily for cancer and pain therapies.
Ambix ANAPA is a product of E-Wha infusion systems.

Business Segments42
Fresenius Kabi makes substantial contributions to the train-
ing and education of the specialist medical community world-
wide. Our scientific symposium FRACTA (Fresenius Kabi
Advanced Course on Transfusion Alternatives) was held in
India and Russia in 2005. The intensive, scientific discus-
sion about current strategies for using infusions in volume
therapies was greeted with very strong interest. The scar-
city of blood will increasingly become an important topic in
many emerging markets.
CLINICAL NUTRITION
Clinical nutrition can improve the general condition of pa-
tients and accelerate the recovery process. We lead this field
in most of our markets in Europe, Asia-Pacific, Latin Ameri-
ca, and South Africa. In 2005, we were able to increase our
market share, especially in growth regions.
In parenteral nutrition our multi-chamber bag portfolio
continues to attract strong interest. Each bag contains all the
patient’s daily nutritional requirements. We offer nutrition
in 1, 2 and 3-chamber bags to accord with the patient’s in-
dividual need. In 2005, we introduced our 3-chamber bag
Kabiven® in various countries, such as Australia, Brazil, Rus-
sia, and the Philippines.
We also successfully introduced our new product Structo-
Kabiven® electrolyte-free, which was specially developed for
the needs of dialysis patients receiving parenteral nutrition.
We launched StructoKabiven® electrolyte-free in Great Britain
at the end of 2005 and plan to introduce it in additional Eu-
ropean countries in 2006.
SMOFlipid® is a lipid emulsion containing four different
lipid components to combine all the advantages of various
fatty acids. The correct balance of fatty acids is important in
the parenteral nutrition therapy of patients in intensive care
and helps to shorten hospital stays. The high acceptance of
SMOFlipid® by medical experts was confirmed during an in-
ternational symposium for clinical nutrition held by the Euro-
pean Society of Intensive Care Medicine in 2005. Experts
and opinion leaders are showing increasing interest in using
special lipids in nutritional therapies for patients in intensive
care. In 2005, we introduced this product in several more
European countries.
Our expertise in clinical nutrition is based, among other
things, on the fact that we offer both parenteral and enteral
therapies. One of our priorities in 2005 was to further expand
our enteral nutrition products internationally. South Korea
was one of the countries where we launched our Fresubin®
products as part of our strategy to enlarge our product range
in the Asian markets.
We also launched the enteral sip feed Fresubin® protein
energy Drink in several European countries and now market
it in over 20 countries. Malnourished patients have increased
protein and energy requirements. The dosage of the nutrients
and the proven superior taste have enabled us to establish
this product very successfully on the market. In 2005, we in-
troduced Fresubin® protein energy Drink in Great Britain,
Scandinavia, South Africa, and other countries.
Ketosteril® is used to treat chronic kidney disease. It con-
tains all the amino acids essential for these patients. Studies
show that a Ketosteril®-supplemented, low-protein diet helps
to preserve residual renal function, thus slowing the disease’s
progress and delaying the start of dialysis.
Ketosteril® is registered in over 50 countries and is being
successfully marketed in Asia, Latin America, and Eastern
Europe. In 2005, we received regulatory approval for South
Korea and began distributing the product there toward the
end of the year.

43To our Shareholders Summary Fresenius Shares Business Segments Additional Information Management Report
In the field of medical devices for enteral nutrition, we also
introduced a new transnasal feeding tube for use in the
early stages of intensive care. To save patients from under-
going additional surgery, the feeding tube is placed via
the mouth or nose. The new feeding tube Freka® Easy In
consists of an intestinal tube and a gastric tube. The nutri-
tion is administered via the intestinal tube, and secretions
are removed via the gastric tube. In 2005, we introduced
this product in Germany, Austria, and the Netherlands.
Fresenius Kabi’s BodyScout is a new device for measur-
ing body components (for example, fat mass, muscle mass,
and intra- and extracellular water). Based on a new spectro-
scopic multifrequency measuring technique, the device de-
termines and monitors the nutritional status and fluid levels
of a patient. We introduced the product at MEDICA 2005.
We held our scientific symposium “Fresenius Kabi Ad-
vanced Nutrition Course” (FRANC) in Brazil, Germany, and
Australia in 2005. Eminent physicians and nutritionists lec-
tured on the latest developments in clinical nutrition therapy
for seriously and chronically ill patients. Workshops on spe-
cialized topics provided participants with a platform for a
vigorous exchange of ideas.
TRANSFUSION TECHNOLOGY
In the area of transfusion technology, we offer disposable
systems and medical devices for collecting and processing
blood and blood products.
We consolidated our market leadership in in-line filter
blood bag systems in Germany, Italy, Austria and Brazil and
were able to expand our positions in Eastern Europe and
Turkey. Last year we sold approximately 9.5 million blood bag
systems worldwide. We made significant advances in intro-
ducing our devices for whole blood processing to interna-
tional markets. Our mixing device Hemolight plus and Hemo-
seal, a device for the disconnection of PVC-tubing, were
successfully introduced in around 20 countries in Eastern
Europe, the Middle East, and Asia-Pacific. Altogether, we
now sell this product in 59 countries. CompoGuard, another
mixing device model, also did well on the market. We were
able to extend our leading market position in this product in
Great Britain, Italy, France, and Spain in 2005.
Our COM.TEC cell separator was introduced in China and
other markets in 2005. As a result of the very high accept-
ance of this product, we were able to achieve double-digit
growth in sales.
We built a new production line for blood bag systems at
our subsidiary Infusia in Horatev, near Prague in the Czech
Republic. Its high quality of production and strategic location
have provided us with the perfect platform for expanding
our transfusion technology products business in Central and
Eastern Europe.

Business Segments44
FRESENIUS PROSERVE
Ω The acquisition of HELIOS significantly strengthened our hospital operations business.
Ω Orders in the project business increased by 40%.
Ω We secured new contracts in the hospital services business.
ACUTE CARE AND POST ACUTE CARE HOSPITALS OF THE HELIOS GROUP
As at December 31, 2005
Acute care Post acute care Maximum-care hospital

45To our Shareholders Summary Fresenius Shares Business Segments Additional Information Management Report
2005 was a pivotal year for Fresenius ProServe. The acquisition of HELIOS makes us a
leading private hospital operator in Germany and gives us an excellent platform for
further growth in the German hospital market. Our hospital engineering and services
business achieved strong order intake growth as did the engineering and services
business for the pharmaceutical industry.
BUSINESS DEVELOPMENT
In 2005, Fresenius ProServe achieved sales of € 809 million
(2004: € 813 million). On a comparable basis, excluding the
nursing home business that was sold in 2004 and the interna-
tional hospital management business that was discontinued
in the same year, sales grew 5%.
Sales at the hospital operations business (WKA) rose 2%
to € 350 million (2004: € 343 million). Sales at the hospital
engineering and services division (VAMED) reached € 377
million, 7% above the previous year (2004: € 352 million).
The engineering and services business for the pharmaceuti-
cal industry (Pharmaplan) had sales of € 82 million, 4%
above the € 79 million of 2004. The moderate sales develop-
ment in the engineering business resulted from postpone-
ments in the billing for major projects in the fourth quarter
of 2005. The overall good business development in 2005 is
reflected in the strong order intake and order backlog: Order
intake on December 31, 2005 reached € 341 million (2004:
€ 244 million), an increase of 40%. Order backlog achieved
€ 360 million (2004: € 335 million), corresponding to 7%
growth.
EBIT of Fresenius ProServe was € 20 million, significantly
above the previous year’s figure (2004: € 9 million; € 17 million
before one-time expenses).
THE ACQUISITION OF HELIOS KLINIKEN
HELIOS is one of the largest hospital chains in Germany with
sales of € 1.2 billion in 2005. The company owns 24 hospitals
with a total capacity of around 9,300 beds. It employs approx-
imately 17,300 people.
HELIOS and the hospitals of the Wittgensteiner Group
(WKA) will become a single unit. WKA will operate under the
leadership of HELIOS. Both companies are highly comple-
mentary in terms of medical focus and geographical fit. Com-
bining the acute clinics of HELIOS with the post acute care
activities of WKA will create new opportunities for high quali-
ty medical treatment provided by a single operator.
Further information about HELIOS is on pages 57 to 61 of
this Annual Report.
HOSPITAL OPERATIONS BUSINESS
WKA owns 16 post acute care clinics and 11 acute care hos-
pitals in Germany and the Czech Republic with a total capacity
of about 5,000 beds.
The introduction of Diagnosis Related Groups (DRGs) in
2004 in Germany has increased the importance for transpar-
ency and quality in hospitals. In future, these will be key
competitive factors in the hospital market in addition to profit-
ability. In 2005, German hospitals were asked for the first
time to prepare structured quality reports. These reports in-

Business Segments46
clude information on the quality of treatment and are to be
made available to the general public. Structured quality re-
ports will enable patients, health insurers, and physicians to
make better comparisons of the performance and the quality
of individual hospitals. In the long term, only hospitals that
provide high quality care will be able to persist. WKA adapted
to the new conditions and optimized its range of medical
services as well as internal structures and processes.
One example of innovative medicine is ReValving, a new
cardiac technology performed for the first time in Germany at
the Klinikum Siegburg Rhein-Sieg GmbH. During ReValving,
an artificial heart valve is implanted without surgically re-
moving the old valve. A catheter is used to transport the new
valve to the heart through a peripheral artery. There it self-
expands, taking over the function of the defective valve. This
method is especially beneficial to high-risk patients because
it eliminates the need of open-heart surgery.
In 2005, WKA continued to focus on innovative medical
treatments in its post acute clinics. Combined with a high
degree of specialization, this will provide valuable experience
for physicians as well as increase the level of quality. The
rehabilitation clinic at Bad Ems, Germany, is just one exam-
ple. The previous broad range of care services is now fo-
cused on cardiology and orthopedics.
Shorter average stays at acute care hospitals have in-
creased the demand for early rehabilitation therapies. This
is especially true for patients with complex diseases who
are referred for rehabilitation. Two WKA clinics now have
mechanical ventilation equipment to assist in early reha-
bilitation.
The Seehospital Sahlenburg in Cuxhaven added a new
outpatient department. A new uro-oncology ward opened
at the Klinik Bergisch Land in Wuppertal. The new ward spe-
cializes in providing care for patients with bladder and pros-
tate cancer, helping to meet the demand from the increasing
numbers of patients with these diseases. Various infrastructure
projects were also completed to provide better service and
comfort for patients.
Cost-reduction projects were successfully continued. For
example, we further consolidated our product range in pro-
curement, optimizing our purchase bundling. WKA also in-
vested in its IT systems in 2005 to record patient data more
efficiently and further simplify billing.
These and other measures strengthened the competitive-
ness of WKA last year, improved the service for our patients,
and increased our profile among referrers.
HOSPITAL ENGINEERING AND SERVICES
VAMED specializes in international hospital projects and is a
world leader in the development and construction of major
hospital projects. The company is uniquely positioned, offer-
ing a comprehensive portfolio of services. These range from
project development, planning and construction to facility
management and management of hospitals and other health
care facilities. The company is also pioneering public private
partnership (PPPs) for hospitals and other health care facil-
ities in Central Europe.
VAMED won the contract to build, equip, and manage one
of the most modern hospitals in Malaysia, the Prince Court
Medical Center in Kuala Lumpur. As part of the efforts to pro-
vide relief for tsunami victims in Southeast Asia, Austrian
and Hungarian aid organizations commissioned VAMED to
construct a pediatric clinic in Banda Aceh – the biggest re-
construction project in the entire disaster area. Another major
contract was won in Vietnam for the modernization of six
hospitals. A modernization project for six hospitals in China
is progressing according to plan. New contracts for equip-
ping the new central hospital in Libreville, Gabun were se-
cured. We also completed the modernization of two univer-
sity hospitals in Nigeria.

47To our Shareholders Summary Fresenius Shares Business Segments Additional Information Management Report
VAMED is the leading provider of technical hospital manage-
ment in Europe and 2005 was another successful year for
this business. The Vienna General Hospital (AKH), one of
Europe’s largest hospitals with about 2,200 beds, extend-
ed its contract for technical management with VAMED. In
Germany, VAMED and its bidding consortium were awarded
a contract to take over and manage the non-medical ser-
vices activities of Berlin’s Charité university hospital. This is
one of the largest service contracts recently awarded in Eu-
rope. Three major projects in Austria strengthened VAMED’s
domestic market leadership in health care facilities and
thermal spas.
Government clients in the health care sector are showing
increasing interest in public private partnerships. In this
business model, public and private partners plan, construct,
finance, and operate hospitals or other health care facil-
ities through a joint company. Such projects provide cost and
quality benefits for both partners. In 2005, VAMED won
additional contracts with existing PPP partners, such as with
three maximum-care hospitals and various post acute clin-
ics in Austria.
In 2006, VAMED’s focus in Europe will be the completion
of its various fully-integrated turnkey projects and PPPs. In
such projects, VAMED contributes its core competencies and
experience in the organization and execution of PPPs, making
it a valuable strategic partner. Outside Europe, the focus
will be on customized engineering and services for hospitals.
ENGINEERING AND SERVICES FOR THE
PHARMACEUTICAL INDUSTRY
Pharmaplan provides services such as the planning, con-
struction, and supervision of pharmaceutical and medical-
technical production plants.
Last year, Pharmaplan significantly improved its order in-
take. This positive development was driven by increased
manufacturing orders from pharmaceutical and biotechnol-
ogy companies. Pharmaplan acquired contracts of well-
known companies in Germany, France and Switzerland and
won a contract to build the largest modular biotechnology
production plant in Europe. It also won the contract for a
major project in Germany for the production of highly effec-
tive drugs from a multinational pharmaceutical company.
In Korea the company won various planning contracts.
In addition, Pharmaplan strengthened its presence in East-
ern Europe with the founding of a joint venture in Prague
to service the markets in the Czech Republic, Slovakia and
other Eastern European countries. A sales and marketing
office was opened in Kuala Lumpur, Malaysia, to expand our
position in Southeast Asia.
Pharmatec, a Pharmaplan subsidiary, secured a major
contract in Germany for delivery of innovative systems to
cleanse bio-pharmaceutical production plants. To meet in-
creased demand in this sector, Pharmatec began working
with the leading manufacturer of fermentation systems in
Germany. This cooperation will allow Pharmatec to offer
the full service range necessary for the production of bio-
pharmaceutical products.

Additional Information48
ADDITIONAL INFORMATION ON THE FISCAL YEAR
Ω We offer career opportunities for our employees.
Ω We broadened our human resources development activities.
Ω In our R&D we are committed to deliver effective help forseverely ill patients with our products and therapies.
Ω Active environmental protection is part of our corporateresponsibility.

49To our Shareholders Summary Fresenius Shares Business Segments Additional Information Management Report
EMPLOYEES
Fresenius has excellent perspectives for the future. These per-
spectives create opportunities for our employees. Fresenius
is an attractive employer – not only for national and interna-
tional university graduates and specialists but also for high
school leavers and trainees.
The successes to date motivate us to continue develop-
ing our activities in human resources. We are conscious, too,
of our socio-political responsibilities as a major employer.
We have expanded our family support program for example.
We pay parents a day care allowance starting when their
child is born.
For Fresenius, training and education are particularly im-
portant. Today, training opportunities for school leavers are
lacking in Germany, but demographics will soon reverse this
situation. We are preparing ourselves for growing competi-
tion for talented job applicants. This includes attractive train-
ing programs not only for apprentices but also for universi-
ty graduates. This should help us to recruit dedicated young
people and win their loyalty. Last year, the number of ap-
prenticeships offered remained at a high level and we trained
over 450 young people. At the same time we have made it
easier for them to seek jobs within the company after their
training. A “trainee database” now launched provides a
platform through which trainees can introduce themselves,
proactively and individually, to our managers.
Employee development and personnel marketing
For us, the development of our employees is an ongoing
mission. Our development program for top executives is
based on our “entrepreneur in the enterprise” corporate
philosophy. This program was continued last year and ex-
tended to further management levels. Besides potential
and needs analyses, which are followed through with ap-
propriate skill development measures, we are now focusing
increasingly on personalized on-the-job training to support
executives in their daily work. One example is the use of ex-
ternal “sparring partners” to mentor executive staff. The
development portfolio is supplemented by feedback from
supervisors and colleagues on interpersonal and profes-
sional skills. Our longstanding cooperation with the busi-
ness school INSEAD in Fontainebleau and Singapore is ac-
quiring still greater importance in this context. We also
cooperate with other international business schools.
Top positions for highly qualified specialists are not
easy to fill. Therefore, we have adopted and further refined
the concept of “alternative career opportunities.” It creates
three potential career tracks – management, specialist or
project manager. This is implemented through potential
and needs review processes. Our goal is to offer develop-
ment opportunities for employees within a flat hierarchi-
cal structure.
Fresenius strives to project its reputation as an attractive
employer more strongly in the domestic and international

Additional Information50
job market. Here, we are focusing on our online recruitment
activities as the majority of candidates today use this medium
for job seeking.
Profit-sharing scheme and stock option plan
It is tradition at Fresenius for employees to participate in the
company’s success. We consider identification with the com-
pany to be a key success factor.
There is a stock option plan for the members of the Man-
agement Board and selected executives at Fresenius AG
and its affiliated companies. Executives at Fresenius Medical
Care AG and its affiliated companies have a separate stock
option plan. For further information on the stock option plan
please see page 183 and the following pages of the Notes.
Non-executive employees can participate in the compa-
ny’s financial success through bonus shares. The company’s
EBIT determines the level of the bonus. The amount to be
paid in 2006 per entitled employee for 2005 under the profit-
sharing scheme is € 1,000.00 gross (full-time equivalents).
Two-thirds of the amount is paid in shares. Entitled employ-
ees can opt to have the remaining third paid in cash or in
additional shares. The profit-sharing scheme enjoys high ac-
ceptance: last year more than half of the employees chose
to have the entire bonus paid in shares. This clearly indicates
the strong confidence Fresenius employees have in their
company.
team@work – The Fresenius Employee Award
Last year Fresenius launched the team@work-Award and en-
dowed it with over € 50,000. The award has been created to
foster team spirit, strengthen cooperation and, ultimately,
realize cost savings more intensively within the Fresenius
Group. Solutions to problems in one business segment can
often be applied to other areas within the Fresenius Group.
Passing on ideas and working together are the keywords.
26 teams with a total of about 150 employees from ten coun-
tries competed for the award. The high quality of these co-
operation projects was convincing: the team@work-Award
will be repeated again this year. If employees bundle their
knowledge, experience and technologies this creates a win-
win situation for everyone – those with the ideas, those
who use them and Fresenius. The synergies could be the key
advantage that helps us to maintain a leading position in
our markets.
RESEARCH AND DEVELOPMENT
We place great importance on our research and development.
The challenge and commitment in our R&D efforts is to help
severely ill effectively with our products and therapies. Our
aim is to provide patients with optimal care so that they enjoy
a better quality of life and live longer.
Dialysis
Research and development at Fresenius Medical Care is focus-
ed on products and therapies for dialysis and other extra-
corporeal blood treatments. Fresenius Medical Care profits
from its unique position as a vertically integrated company
and the experience it gathers daily from treating patients with
kidney disease. This allows us to clearly identify the needs
of patients, physicians and nurses: easy-to-use products, best
treatment results and maximum safety. This experience is
constantly fed back into our R&D activities.
In 2005, we focused on completing the development of
our new 5008 therapy system. Features of the system are its
simple interface and improved treatment quality. Routine
processes and maintenance have been significantly reduced.
Side-effects occur less often than with conventional dialysis
machines. Long-term treatment with the newly developed

51To our Shareholders Summary Fresenius Shares Business Segments Additional Information Management Report
machine has also proven to be gentler. For the first time,
Online-Hemodiafiltration (Online-HDF) is standard in the new
5008 therapy system. This best-possible therapy for patients
with chronic kidney failure has a positive effect on risk fac-
tors related to cardiovascular diseases and could further
lower the mortality rate. This was confirmed by a study pub-
lished at the beginning of June. Patients in the study who
received Online-HDF treatment had a better chance of sur-
vival than those receiving conventional hemodialysis treat-
ment. The developers were able to build on the experience
gathered at Fresenius Medical Care’s 1,680 own dialysis
clinics around the world. The machine was not only inten-
sively tested in the laboratory but also at a number of dial-
ysis centers. Before they were released the machines were
successfully tested in more than 240,000 treatments. This
close relationship with clinics allowed the machine to be op-
timized for the needs of patients and treatment personnel.
Aside from the dialysis machine, the dialyzer is another
key component of dialysis. Fresenius Medical Care is re-
searching into dialysis membranes that function selectively
and would influence the treatment process. Membranes
could either have specific adsorption properties or contain
substances for targeted release.
Another field of development is anticoagulants which
temporarily reduce the coagulability of the blood. Here, we
are looking for an alternative to the drug Heparin. Our aim
is to reduce the coagulability of the blood only when in extra-
corporeal circulation and not within the patient’s circulatory
system. A solution containing citrate is introduced into the
patient’s blood as it enters the extracorporeal circulation.
Through complexation of the calcium ions in the blood, it
effectively interrupts the clotting cascade. The controlled
addition of a calcium solution at the end of the extracorpo-
real circulation reinstates the original coagulability. The
correct dosing of both solutions requires appropriate pump-
ing units as well as computer-aided calculations and broad
practical experience with the kinetics of these solutions in
extracorporeal circulation.
We are also focusing on peritoneal dialysis. Special
design details and the simple and safe handling of the tubes
and connectors used in transferring the peritoneal dialysis
solution into the abdominal cavity reduce the risk of bacterial
contamination which could, for example, lead to peritonitis.
Peritonitis can restrict the effectiveness of the peritoneum, the
body’s own filter used in peritoneal dialysis treatment, or
render it unsuitable for use in further treatments. The com-
position of the solutions themselves as well as the buffer
systems used can also influence the long-term success of
peritoneal dialysis treatment.
The good tolerance of our biocompatible peritoneal dial-
ysis solution balance* was proven in a study conducted in
South Korea. This was the largest study to date that compar-
ed mortality rates of patients using standard PD solutions
and the new biocompatible PD solutions. The study showed
that the use of biocompatible solutions leads to a lower
mortality rate and better protects the peritoneum.
Extracorporeal therapies for the treatment of liver disease
are another focus of our R & D activities, and are based on
the experiences and technologies used in dialysis. In many
cases, these therapies are able to provide additional time
until liver transplantation is possible, or the liver uses its re-
generative abilities and heals itself. Fresenius Medical Care’s
Prometheus® system is currently in clinical development. A
clinical study showed that detoxification with this system is
highly effective. A Europe-wide, multi-center study started
in 2005 should now verify the therapy success. Beyond this,
we are also developing bioreactors with functioning cells
and are evaluating the effectiveness in potential treatment
areas that include the liver-support application.
*Peritoneal Dialysis International (Vol. 25, pp 248-255)

Additional Information52
Infusion therapy and clinical nutrition
At Fresenius Kabi, the focus of R & D activities is on develop-
ing high-quality products and technologies, which are at
the same time both innovative and safe, to improve the treat-
ment of critically and chronically ill patients. In 2005, we
worked on the development of new products and on further
product enhancements. The emphasis here was on all prod-
uct components – the primary packaging, the pharmaceutical
solution for infusion therapy and clinical nutrition, the related
medical devices for the application, and the manufacturing
technology.
In parenteral nutrition we successfully completed de-
velopment of the new primary packaging for SMOFlipid®.
SMOFlipid® is administered intravenously to intensive care
patients. The product was introduced in 2004 and has es-
tablished itself in many markets as the innovative lipid emul-
sion. Until now, it was offered exclusively in glass bottles.
In 2006, we will begin offering it in 1-chamber bags. Clinical
studies evaluating SMOFlipid® as the lipid component in
3-chamber bags have also been successfully completed. The
launch of this multi-chamber bag with the new lipid emul-
sion is planned for 2007.
The high therapeutic relevance of SMOFlipid® can also
play an important role in parenteral nutrition for critically ill
children. Last year we successfully completed the first clin-
ical study for the use of this product in pediatric care and plan
to submit the application for regulatory approval in 2007.
StructoKabiven® provides nutrition for severely ill patients.
It contains both medium-and long-chain fatty acids, glucose
and amino acids. Last year we successfully completed the de-
velopment of an additional StructoKabiven® product. The
new StructoKabiven® electrolyte-free is specially developed
for the needs of dialysis patients receiving parenteral nutri-
tion. These require individual doses of electrolytes. The new
product provides nutrients while intravenously infusing the
necessary amount of electrolytes individually required. We
launched this product on European markets in 2005.
In enteral nutrition we offer sip and tube feeding as well
as specialized products. Patients often are not able to ingest
enough nutrients – they do not want or cannot eat enough.
This is the case with patients who are recovering from sur-
gery or are struggling with weakness, for instance as a re-
sult of cancer. These patients require additional enteral sip
feeding to maintain bodily functions. The willingness to
consume these regularly is decisive for a patient’s health to
improve. So we have focused on optimizing the taste of our
sip feeds and have refined various recipes in the Fresubin®
Protein Energy Drink product family.
In 2005, we obtained positive results from the study on
our ProvideXtra® enteral sip feed. ProvideXtra® is used for in-
stance in chronic inflammatory bowel disease such as Mor-
bus Crohn. The effectiveness of insulin can be limited during
so-called insulin resistance, especially after surgery. Insulin
is a hormone produced by the pancreas that supports pro-
cesses to lower blood sugar levels while helping to build
tissue. Our study showed that pre-operative treatment with
ProvideXtra® reduced insulin resistance in surgical patients.
Based on the results of the study, the applications for the
product can be expanded which will further improve the care
for chronically and critically ill people.
For Intestamin®, we worked on another galenic applica-
tion. Intestamin® is used in the early nutrition of critically ill
intensive care patients. It contains key nutrients to support

53To our Shareholders Summary Fresenius Shares Business Segments Additional Information Management Report
the gut and protect against malnourishment, which could
adversely affect the course of the disease or recovery. The
new product will simplify the use of enteral nutrition in the
early post-operative phase. We expect a market launch in
2006.
We completed a clinical study on our product Diben last
year. The results confirm its high therapeutic effect in dia-
betes patients. Diben is one of the few enteral nutrition prod-
ucts that contribute to a long-term improvement in the blood-
sugar levels of diabetes patients.
Fresenius is also the global leader in artificial colloids.
This makes it our responsibility to continue developing inno-
vative products for blood volume replacement and contrib-
ute to a high level of quality in the care of patients in emer-
gency and intensive care medicine. In 2005, we worked on
the development of a new variant of Voluven®. Voluven® is an
international reference product for blood volume replace-
ment. The new product will widen the applications for blood
volume replacement substances.
We are also developing a novel technology platform
based on our research in colloids (hydroxyethyl starch). Our
aim is to use the so-called HESylation procedure to couple
hydoxyethyl starch with drugs. One of the benefits is that this
can extend the circulating life of the drug in the blood and
therefore prolong its effect. The development of HESylation
as a new technology platform is in the preclinical stage.
In infusion technology we worked on further devices in
our Agilia generation. Our goal here is to develop solutions
that meet the demands in the operating theater and intensive
care wards as well as general hospital wards. For example,
we focused on the development of an infusion pump that is
designed for use in cardiac surgery. Dosages during such
operations are critical. Our new pump will allow exact dosing
and the use of units such as milligram per kilogram of body
weight per minute or per hour. An integrated medical library
which includes the hospital’s own specific standards simpli-
fies the handling for the hospital personnel and offers addi-
tional protection from incorrect dosages.
Another product from the Agilia family is a new volume-
tric pump that can be used universally and within the Agilia
concept. Flow rates can be controlled precisely and the easy
handling of the interface allows use of the machine both in
and outside the hospital. The international market launch
for both products is planned for 2006.
The development of our 3-chamber bag has set new
technology standards in primary packaging systems in paren-
teral nutrition. Last year we worked on the development of
a new generation of the 3-chamber packaging system. A new-
ly developed port technology used in this system is a further
step of eliminating application errors and increase patient
safety. A new packaging design and improvements in filling
technology will make production more efficient. The launch
of this product is planned for 2006. At the same time, work
continued on the development of our own production line
for the new 3-chamber bag, which will be implemented at
other sites when completed.
In the field of packaging technology for infusion therapies
we worked on a new bottle-pack container. The bottle-pack
container cap is another innovative development that makes
for maximum patient safety. Patent disclose took place at
the end of 2005. The new bottle-pack container is due to be
launched in 2006.

Additional Information54
Antibody and cell therapies
Fresenius Biotech develops innovative therapies with trifunc-
tional antibodies for the treatment of cancer as well as cell
therapies for the treatment of various organ systems (such as
the immune system). In the field of polyclonal antibodies,
Fresenius Biotech has successfully marketed ATG-Fresenius S
for many years. ATG-Fresenius S is an immunosuppressive
agent used to suppress graft rejection following organ trans-
plantation.
In cancer therapy, the results of two clinical studies were
presented at the 2005 American Society of Clinical Oncology
(ASCO) Annual Meeting and were very well received.
A first phase I study with the trifunctional antibody
rexomun® in metastatic breast cancer was successfully com-
pleted. The antibody is safe and tolerable when applied intra-
venously and was effective in single cases. Last year we pre-
pared a phase II study and the first patient should be included
in the study in the spring of 2006.
The second phase I study with the trifunctional antibody
removab® presented at the ASCO meeting proved to be safe
and tolerable in an intra-peritoneal application in patients with
peritoneal carcinomatosis. Preparations for two phase II
studies to treat advanced gastric cancer have already started.
The first study will investigate the antibody as an additional
therapy to surgery. The second study will investigate the use
of the antibody in combination with chemotherapy since
chemotherapy will play a bigger role in gastric cancer treat-
ment in the future.
Further studies have been conducted with the antibody
removab®. Their status is as follows:
Ω The recruitment phase for an European study to receive
regulatory approval for treatment of symptomatic ascites
caused by malignant tumors was completed. A final re-
port is expected in the second half of 2006 once the clin-
ical data from more than 200 patients has been analyzed.
Ω The patient recruitment for a study to determine dosages
in the treatment of malignant pleural effusion was com-
pleted. A final report will also be available in the second
half of 2006.
Ω Together with the consortium of gynecological oncolo-
gists (Arbeitsgemeinschaft Gynäkologischer Onkologen
or AGO), the recruitment for a phase IIa study treating
advanced ovarian cancer was completed. The final report
is expected in the first half of 2006.
In the area of polyclonal antibodies, our immunosuppressive
agent ATG-Fresenius S was further developed in two clinical
projects:
A study with ATG-Fresenius S is being conducted with
a view to launching the product on the US market. The aim
of the study is to prove that the use of ATG-Fresenius S can
lower the organ rejection reaction after lung transplantation.
Since our partner, Enzon Pharmaceuticals, will not con-
tinue the program through to the regulatory approval and
marketing of ATG-Fresenius S since it is refocusing its R & D
activities, we are currently in negotiations with a potential
partner to continue the clinical development program.
A second project with ATG-Fresenius S is a study for the
prophylaxis of acute Graft-versus-Host Disease after stem
cell transplantation. In this study, the standard therapy (i. e.
Cyclosporin A and methotrexate) is being compared with
the standard therapy with additional administration of ATG-
Fresenius S. As planned, we were able to add further study
centers in Europe and recruit patients during 2005. The first
preliminary results confirm the safety of ATG-Fresenius S
in the selected dosage. The final report is expected for 2009.
In the area of transplantation immunology, the observa-
tion of patients in a pilot study of immunotolerance following
organ transplantation was continued. The aim of this devel-

55To our Shareholders Summary Fresenius Shares Business Segments Additional Information Management Report
opment approach is to achieve immunotolerance to the
implanted organ by modifying cells of the organ donor.
R & D financial figures can be found in the Management
Report on page 66.
ENVIRONMENTAL MANAGEMENT
As a health care company, Fresenius is committed to protect
nature as the basis of life and to use its resources responsib-
ly. It is our mission to constantly improve our performance
in the areas of environmental protection, occupational health
and technical safety, product responsibility and logistics, and
to comply with legal requirements.
Environmental management in accordance with ISO
14001:1996 and 14001:2004 is in place at various produc-
tion plants and dialysis clinics. Additional sites, for instance
in France and Italy, were certified last year. The new 14001:
2004 standard places greater focus on a continuous evalua-
tion of a production site’s impact on the environment with
emphasis on emissions and waste.
Active environmental protection at our production sites
and related logistics activities means that we constantly
strive to make our processes more environmentally friendly.
This often results in cost savings. For example, at our plant
in St. Wendel, Germany, we have been able to significantly
reduce our consumption of steam and packaging materials:
13,300 tones of steam were saved through an improved heat
recovery system as well as the introduction of an electric
sealing system for the production of peritoneal dialysis bags.
The standardization of packaging materials created savings
of 15 tones of cardboard and lowered transport costs for dial-
yzers by 12%. Moreover, we were able to save 61 tones of
plastic foil by using a more compact method for the sterile
packaging of medical devices.
Environmental protection measures do not just kick in at
the production level, but are an integral part of the product
development process: The 5008 dialysis machine developed
at our plant in Schweinfurt, Germany, requires up to 30%
less water and electricity than our previous machines, making
for a significant reduction in operating costs. This presents
enormous potential for saving resources as our dialysis clinics
outside North America start using the machines in the mid
to long term.
Our North American dialysis clinics practice sort-clean
separation of waste, which reduces the volume of residual
waste. This program was rolled out in 2005 from 640 loca-
tions to 880 Fresenius Medical Care clinics and allows us
to recycle almost 2,600 tones of paper and cardboard pack-
aging. The more than 70 water treatment systems for the
preparation of ultra-pure water are another environmental
measure. These can prepare about three-fourths of the
water required and save nearly 100 liters of freshwater per
dialysis treatment. Ultra-pure water is a key quality com-
ponent in the production of dialyzers as well as in dialysis
treatment. Because of the large quantities used, small
adjustments in consumption can lead to significant savings.
We also further exploited the potential for reducing the
natural resources used in the shipping of goods and prod-
ucts between production facilities, warehouses and dialysis
clinics. We have increased our use of double-decker trucks
since they can transport significantly more at one time.
An initiative to reduce waste was also introduced at our
plant in Friedberg, Germany. The use of a new preparation
technology for the production of infusion solutions, using
silos instead of sacks for raw materials, has cut the volume
of waste by nearly 6%. With a recycling rate of about 94%,
some 5,300 tones of materials are re-used.
For the eighth time, Fresenius Kabi in Graz, Austria was
awarded as an especially environmentally friendly produc-
tion site by the local ÖKOPROFIT® program. The Fresenius

Additional Information56
Kabi site has been a partner in the program for ten years.
The aim of ÖKOPROFIT®, an initiative of the city of Graz that
is now imitated internationally, is to combine financial with
ecological benefits. Innovative technologies can reduce both
the consumption of resources and the volume of waste and
emissions. This results in cost savings and improves a com-
pany’s financial performance. At the same time, through
conservation efforts of this kind ÖKOPROFIT® makes a posi-
tive contribution to the environment. The environmental
protection agency, companies and external consultants collab-
orate closely on a training program. In Germany, more than
1,000 companies in 54 cities participate in the project, includ-
ing our enteral nutrition production site in Bad Homburg.
The environmental protection program at our production site
in Uppsala, where we produce parenteral nutrition products,
focuses on reducing waste as well as effluent and emissions
as an ongoing process. One project targets energy savings
and reduced use of non-fossil fuels with a view to minimizing
the emission of greenhouse gases into the atmosphere. In
another project a membrane filter system was installed to
purify wastewater from fat. The filtering capacity is 95%.
This reduces the volume of waste and the related disposal
costs. The amount of waste per ton of nutrition solution
produced was cut by as much as 24%.

57To our Shareholders Summary Fresenius Shares Business Segments Additional Information Management Report
OUR GOAL:
BE A LEADING PRIVATE
HOSPITAL OPERATOR IN
GERMANY
ACQUISITION OF HELIOSAcquisition of HELIOS Kliniken, one of the largest private hospital chainsin Germany
2005
EXCELLENT GROWTH
OPPORTUNITIES
Experts expect the share of
private hospitals in Germany
to rise to about 40% in
2020.
Following years
2006
ENTRY INTO HOSPITAL OPERATIONS
Acquisition of Wittgensteiner Kliniken (WKA)
2001
RESTRUCTURING AND
NEW STRATEGIC FOCUS
Cost reduction and process
optimization at WKA clinics
2003/2004
FOCUS ON INTEGRATION
Integration of HELIOS; WKA will operate
under the leadership of HELIOS

Fresenius ProServe – Be a leading private hospital operator in Germany58
Treatment quality and its benefits for patients is our highest priority.

59To our Shareholders Summary Fresenius Shares Business Segments Additional Information Management Report
OUR MILESTONE:
ACQUISITION OF HELIOS KLINIKEN
Two factors are vital for long-term success in hospital operations: The first is a successful network
of hospitals with high medical standards and efficient operations. The second is the expertise to
acquire, integrate and manage new hospitals profitably. The strategy we used to acquire a major
hospital group was based on these two key elements. In the fall of 2005, the opportunity to
acquire HELIOS Kliniken arose.
Through this acquisition, Fresenius is now one of the three leading private hospital operators in
Germany. With sales of about € 1.5 billion in 2005, HELIOS* ranks among the largest and most profi-
table private hospital chains in Germany. HELIOS owns 51 hospitals with a total capacity of approxi-
mately 14,300 beds including four maximum-care hospitals with more than 1,000 beds each. The
company performs around 420,000 inpatient treatments annually.
Fresenius and HELIOS are committed to providing best-in-class treatment. HELIOS is recognized
as the industry leader in medical quality standards. The company provides excellent care that reflects
and advances the latest scientific knowledge, benefiting both our patients and insurers.
* All figures pro forma, including Wittgensteiner Kliniken.
The HELIOS Kliniken Group offers
expertise in all areas and at all
levels of clinical care, including
maximum care.

Fresenius ProServe – Be a leading private hospital operator in Germany60
OUR WAY FORWARD:
CONVINCE WITH QUALITY,
GROW THROUGH ACQUISITIONS
This commitment can only be achieved through strict quality control. At the HELIOS clinics, quan-
tifiable medical targets and internal benchmarking have yielded mortality rates below the German
average for most internal medicine diagnoses and surgeries. HELIOS has evaluated approximately
1.8 million inpatients cases – the largest non-institutional quality management project ever under-
taken. Payment to the clinics’ chief physicians and commercial managers is tied to specific medical
targets. Quality is a core competitive factor.
The German hospital sector is on the move to further privatization. Rising costs and the crisis in
public finance are putting more pressure on hospitals to improve efficiency while providing high
standards of medical quality. Hospitals with a favorable cost structure and efficient workflows will
remain competitive. Private hospital operators often respond better than public hospitals to these
market requirements. Through its use of innovative medicine, strict quality control and knowledge
management, HELIOS is proof that hospitals are able to operate profitably. In the first year after
acquiring a hospital, HELIOS expects to achieve an EBITDA margin of 3% with an increase to around
15% in five years. Only about 9% of hospital beds in Germany are currently privatized. Experts
expect this number to increase considerably in the coming years. The acquisition of HELIOS puts us
in a strong position to profit from the excellent growth opportunities offered by the privatization of
the German hospital market.
Since 1999 HELIOS has published a
comprehensive annual report on the
quality of the medical care in its clinics.
These reports are available online at
www.helios-kliniken.de (in German).

61To our Shareholders Summary Fresenius Shares Business Segments Additional Information Management Report
Knowledge is the basis of our comprehensive patient care.

Management Report62
MANAGEMENT REPORT
Ω Sales up 8%, net income up 32%.
Ω Operating cash flow of € 780 million achieved.
Ω Outlook for 2006: Sales expected to exceed € 10 billion, net income projected to grow by more than 30%.

63To our Shareholders Summary Fresenius Shares Business Segments Additional Information Management Report
The business of the Fresenius Group developed very positively in 2005. We again achieved new
sales and earnings records while improving our profitability. Fresenius Kabi and Fresenius ProServe
were strengthened by the acquisitions of Labesfal, HELIOS and Clinico. Fresenius Medical Care
announced plans to acquire the US dialysis care provider Renal Care Group. Investments in acquisi-
tions rose substantially and were financed using a mix of equity and debt.
OPERATIONS AND BUSINESS ENVIRONMENT
Group Structure and Business
Fresenius is an international healthcare group with products
and services for dialysis, the hospital and outpatient medical
care. In addition, Fresenius focuses on hospital operations as
well as on engineering and services for hospitals and the
pharmaceutical industry.
Our operating business comprises the business segments
Fresenius Medical Care, Fresenius Kabi and Fresenius
ProServe, which are legally independent and are managed
by the operating parent company, Fresenius AG. The corpo-
rate structure remained unchanged in the reporting period.
Fresenius Medical Care mainly focuses on dialysis care
and manufactures and markets products for the treatment
of patients with End Stage Renal Disease (ESRD). Fresenius
Kabi specializes in the production and sale of products for
infusion therapy, clinical nutrition and transfusion technology.
Fresenius ProServe is active in hospital operations and offers
engineering and services for hospitals and other health care
facilities as well as for the pharmaceutical industry. The seg-
ment Corporate/Other comprises the holding activities of
Fresenius AG, the IT service provider Fresenius Netcare as
well as Fresenius Biotech. Fresenius Biotech is active in the
research and development of antibody and cell therapies.
The segment Corporate/Other also performs consolidation
activities between the segments.
Fresenius operates internationally so the business seg-
ments have a regional and decentralized structure. Respon-
sibilities are clearly defined in line with the company’s
“entrepreneur in the enterprise” management principle. Ad-
ditionally, management accountability is reinforced by an
earnings and target-linked compensation system.
Fresenius has an international marketing and production
network with more than 50 production sites worldwide.
Key production sites are located in the United States, Japan,
Germany and Sweden. Beyond this, Fresenius has manu-
facturing plants in other European countries, Latin America,
Asia and South Africa. The international production network
allows us to implement our business model while meeting
the most exacting logistics and regulatory demands. The
decentralized structure of the production sites also has the
advantage that it significantly reduces transportation costs
and currency exposure.
Management and control
The corporate organs of the Group are the Management
Board, the Supervisory Board and the Annual General Meet-
ing. In accordance with the German Stock Corporation Act
(AktG), Fresenius AG has a dual management and control
system consisting of the Management Board and the Super-
visory Board. These two boards work independently of each
other. No one person is allowed to be a member of both
organs.
The Management Board conducts the business and
represents the company in dealings with third parties. The
Management Board has five members. According to the
Management Board’s rules of procedure, each member is
accountable for his area of responsibility. However, the
members have joint responsibility for the management of

Management Report64
the Group. The Management Board is required to report to
the Supervisory Board regularly, in particular on its corpo-
rate policy and strategies, the profitability of the business,
current operations and any other matters that could be of
significant importance for the company’s profitability and
liquidity.
The Supervisory Board appoints the members of the
Management Board and supervises and advises the Manage-
ment Board in managing the company. However, the Super-
visory Board is fundamentally prohibited from managing the
company in any way. The Management Board’s rules of pro-
cedure require it to obtain the Supervisory Board’s approval
for specific activities. The Supervisory Board comprises six
shareholders’ representatives and six employees’ represent-
atives. The shareholders’ representatives are elected by the
Annual General Meeting. The employees’ representatives
are elected in accordance with the German Co-Determination
Act (MitbestG). The Supervisory Board must meet at least
twice per calendar year.
For information on compensation, please see pages 189
and 190 in the Notes.
Key Products, Services and Business Processes
Fresenius offers a comprehensive range of products for hemo-
dialysis and peritoneal dialysis and provides dialysis care in
its own dialysis clinics. Dialysis products are sold to internal
clinics as well as to external dialysis care providers. In addi-
tion, Fresenius is one of the few companies to offer a com-
prehensive portfolio of enteral and parenteral nutrition ther-
apies. Fresenius also offers a broad spectrum of products for
fluid and blood volume replacement as well as a portfolio
of generic intravenously administered (IV) drugs. Fresenius
Kabi markets its products primarily to hospitals and other
health care facilities. Fresenius ProServe is active as a private
hospital operator in Germany and the Czech Republic
through HELIOS and Wittgensteiner Kliniken. It also offers
engineering and services for hospitals and health care facili-
ties through VAMED and engineering and services for the
pharmaceutical industry through Pharmaplan.
Important Markets and Competitive Position
Fresenius operates in around 60 countries through its sub-
sidiaries. The United States and Europe are the main markets
where Fresenius generates 47% and 38% of its sales, re-
spectively.
Fresenius Medical Care is the largest dialysis company
in the world. Fresenius Kabi holds leading positions in Europe
and in the growth markets of Asia-Pacific, Latin America
and South Africa. The acquisition of HELIOS has established
Fresenius ProServe as one of the leading private hospital
operators in Germany.
Legal and Economic Factors
The markets of Fresenius are fundamentally stable and rela-
tively independent of economic cycles because of the central
importance of the life-saving and life-sustaining products
and treatments which the Group offers. Furthermore, the
markets in which Fresenius operates are expanding. This
is due, on the one hand, to demographics and the demand
for innovative therapies in industrialized counties and, on
the other hand, to the increasing availability of high-quality
health care in developing countries.
The statement of income and the balance sheet can be
influenced by currency translation effects as a result of
exchange rate fluctuations, especially in the rate of the US
dollar to the euro. This had hardly any affect on the state-
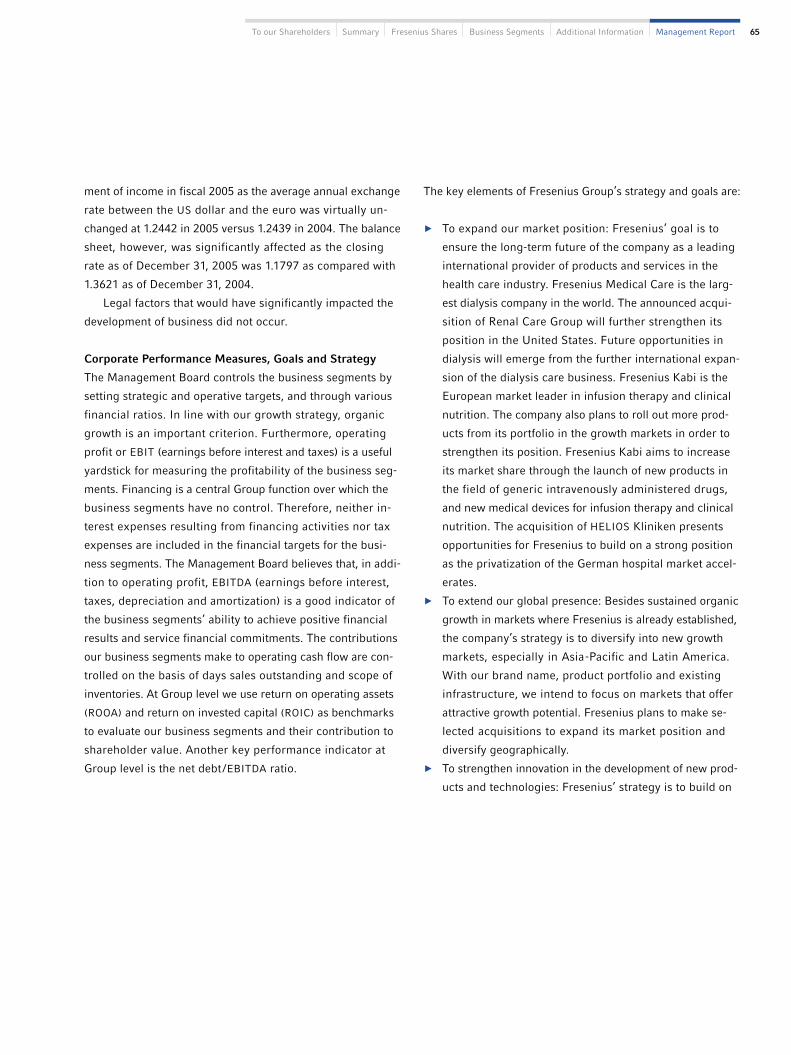
65To our Shareholders Summary Fresenius Shares Business Segments Additional Information Management Report
ment of income in fiscal 2005 as the average annual exchange
rate between the US dollar and the euro was virtually un-
changed at 1.2442 in 2005 versus 1.2439 in 2004. The balance
sheet, however, was significantly affected as the closing
rate as of December 31, 2005 was 1.1797 as compared with
1.3621 as of December 31, 2004.
Legal factors that would have significantly impacted the
development of business did not occur.
Corporate Performance Measures, Goals and Strategy
The Management Board controls the business segments by
setting strategic and operative targets, and through various
financial ratios. In line with our growth strategy, organic
growth is an important criterion. Furthermore, operating
profit or EBIT (earnings before interest and taxes) is a useful
yardstick for measuring the profitability of the business seg-
ments. Financing is a central Group function over which the
business segments have no control. Therefore, neither in-
terest expenses resulting from financing activities nor tax
expenses are included in the financial targets for the busi-
ness segments. The Management Board believes that, in addi-
tion to operating profit, EBITDA (earnings before interest,
taxes, depreciation and amortization) is a good indicator of
the business segments’ ability to achieve positive financial
results and service financial commitments. The contributions
our business segments make to operating cash flow are con-
trolled on the basis of days sales outstanding and scope of
inventories. At Group level we use return on operating assets
(ROOA) and return on invested capital (ROIC) as benchmarks
to evaluate our business segments and their contribution to
shareholder value. Another key performance indicator at
Group level is the net debt /EBITDA ratio.
The key elements of Fresenius Group’s strategy and goals are:
Ω To expand our market position: Fresenius’ goal is to
ensure the long-term future of the company as a leading
international provider of products and services in the
health care industry. Fresenius Medical Care is the larg-
est dialysis company in the world. The announced acqui-
sition of Renal Care Group will further strengthen its
position in the United States. Future opportunities in
dialysis will emerge from the further international expan-
sion of the dialysis care business. Fresenius Kabi is the
European market leader in infusion therapy and clinical
nutrition. The company also plans to roll out more prod-
ucts from its portfolio in the growth markets in order to
strengthen its position. Fresenius Kabi aims to increase
its market share through the launch of new products in
the field of generic intravenously administered drugs,
and new medical devices for infusion therapy and clinical
nutrition. The acquisition of HELIOS Kliniken presents
opportunities for Fresenius to build on a strong position
as the privatization of the German hospital market accel-
erates.
Ω To extend our global presence: Besides sustained organic
growth in markets where Fresenius is already established,
the company’s strategy is to diversify into new growth
markets, especially in Asia-Pacific and Latin America.
With our brand name, product portfolio and existing
infrastructure, we intend to focus on markets that offer
attractive growth potential. Fresenius plans to make se-
lected acquisitions to expand its market position and
diversify geographically.
Ω To strengthen innovation in the development of new prod-
ucts and technologies: Fresenius’ strategy is to build on

Management Report66
its strong position in technology, its expertise in patient
care and its ability to manufacture cost-effectively. We
believe that our R & D expertise can be leveraged in daily
operations to tailor products and systems to individual
patient needs while providing a high level of safety and
ease of use. Fresenius will continue to meet the require-
ments of best-of-class medical standards by developing
and producing effective products and treatment methods
for the critically ill. Fresenius ProServe’s goal is to widen
the brand-name recognition of its health care services
and innovative therapies.
Ω To enhance profitability: Our goal is to continue im-
proving Group profitability. On the costs side, Fresenius
is concentrating particularly on making its production
plants still more efficient, exploiting economies of scale,
leveraging the existing marketing and distribution infra-
structure more intensively, and practicing strict cost con-
trol. Focusing on operating cash flow with efficient work-
ing capital management will increase our flexibility for
investments and improve the financial ratios.
Research and Development
Fresenius focuses its R&D efforts on the core activities of the
business segments. These are:
Ω Dialysis and other extracorporeal therapies
Ω Infusion and nutrition therapies as well as
medical technology
Ω Antibody and cell therapies
Besides products, we are concentrating on developing opti-
mized or completely new therapies, treatment methods and
services. In 2005, we successfully continued numerous proj-
ects. Several new products were launched.
Fresenius Medical Care continued to invest in improving
treatment therapies. The main focus of the projects was on
the further development of dialyzers and especially on a new
generation of dialysis machines for hemodialysis. The new
5008 dialysis machine was introduced in 2005. Another area
was peritoneal dialysis and other extracorporeal therapies.
Fresenius Kabi focused on developing new products and
product enhancements in its core areas of infusion therapy,
clinical nutrition and medical technology. In 2005, we suc-
cessfully completed the development of the new primary
packaging for our SMOFlipid® parenteral nutrition product.
We also worked on a new variety of our blood volume replace-
ment Voluven®. In infusion technology the focus was on
additional devices for our Agilia generation. Important proj-
ects at Fresenius Biotech involved antibody therapies: Clini-
cal studies on the treatment of cancer continued last year.
We expect the results from studies covering a range of indi-
cations in 2006.
Expenses on research and development amounted to
€ 149 million in 2005, 12% more than the €133 million
spent the previous year. We invested around 5% of our
product sales in R&D. The chart shows R&D expenses by
business segment. Fresenius Kabi hiked its R&D spending
considerably, from € 56 million in 2004 to € 64 million in
Fresenius
Medical Care 28%
Fresenius Kabi 43%
Corporate/Fresenius
Biotech 29%
R & D EXPENSES BY BUSINESS SEGMENT
2005: € 149 million

67To our Shareholders Summary Fresenius Shares Business Segments Additional Information Management Report
2005. R&D expenses in the Corporate segment were up from
€ 36 million in 2004 to € 43 million last year. This was driven
by Fresenius Biotech.
As of December 31, 2005, 856 people were employed in
research and development (December 31, 2004: 819). Of that
figure, 353 people were employed by Fresenius Medical Care,
432 by Fresenius Kabi and 71 by Fresenius Biotech.
Our main research sites are in Europe, while the United
States and China perform production-related research. Our
R & D activities are mainly conducted in-house. External R & D
activities are commissioned only on a limited scale.
Overall Business Development
Economic environment
Although the global economy continued to grow strongly in
2005, the 4.5% increase in gross domestic product (GDP)
failed to match previous year’s 5.0%. The drastic rise in oil
prices was the primary restraint on economic development.
The price of crude Brent oil was under US$ 40 per barrel at
the beginning of 2005 but had climbed to more than US$ 55
by mid-March and hit record levels of nearly US$ 70 in the
following months. International trade was again the key
driver of the global economy, and low interest rates continued
to have a positive effect. The development of local econo-
mies was mixed. The economies of China and the United
States remained robust in contrast to the weaker economies
of Japan and countries in the euro zone.
Ω Europe
GDP in the euro zone rose by 1.5% (2004: 1.8%) although
growth rates varied from country to country. Spain (3.4%)
and Ireland (4.5%) boasted the highest GDP growth while
Germany (1.1%), Portugal (1.0%), the Netherlands
(0.7%) and Italy (0.2%) were at the lower end. The, in
part, poor economic development was due in the main
to subdued consumer spending, a reflection of the weak
labor market, as well as lower corporate investment
spending despite improved profits and low interest rates.
Public finances in the euro countries remained strained
and almost half of the countries overshot the deficit level
of 3% agreed in the Economic Stability Treaty. Germany’s
economic development was once again supported by
robust export growth while domestic demand failed to
recover. Some EU countries that do not use the euro also
experienced weaker economies, but not at the same level
as the countries in the currency union. The economic
momentum of the new member countries continued but,
at 5.2%, their aggregate GDP growth was lower in 2005
than in 2004 (7.0%).
Ω United States
The US economy slowed only slightly in 2005 despite the
Federal Reserve’s rate tightening from 2.25% to 4.5%,
the strong climb in oil prices and the damage from hur-
ricanes. Strong domestic demand supported the 3.5%
increase in GDP (2004: 4.2%). Consumer spending and in-
vestments were the main drivers, supported by positive
developments on the labor market. Imports rose faster than
exports, leading to a further increase in the trade deficit.
Ω Asia
Asia (excluding Japan) was once again the world’s fastest-
growing region with a 7.7% increase in GDP (2004:
8.0%). After a temporary downturn in the second half
of 2004, Japan’s GDP rose 2.7% in 2005 (2004: 2.3%).
Growing disposable incomes stimulated the economy.
China continued its impressive growth track, with GDP
up 9.4% in 2005 (2004: 9.5%). Exports also played a
significant role. In India, the IT and pharmaceutical indus-
tries supported the economy. With GDP growth of 7.7%
last year, India remains one of the growth centers of the

Management Report68
world (2004: 7.2%). Oil-importing countries such as
South Korea and Thailand, with GDP increases of 3.8%
and 4.5%, respectively, felt the dampening effect of
higher oil prices. By contrast, oil-exporting nations such
as Indonesia and Malaysia performed better and con-
tinued their dynamic growth with rates of 5.1% and
5.0%.
Ω Latin America
Although growth in Latin America remained robust with
a rise in GDP of 4.3%, it was significantly lower than the
6.1% in 2004. Argentina saw GDP growth of 8.7%, Brazil
2.5% and Mexico 3.1%. Drivers were the growth of the
global economy and the sustained demand for raw mate-
rials. Especially the commodity exporting countries in
Latin America benefited from these trends. The positive
economic environment was dampened by emerging in-
flationary risks. This is especially true in Argentina where
price inflation doubled to about 12% in 2005. Mexico
and Brazil weakened domestic demand with their mone-
tary policies.
Health care industry
The health care sector is one of the world’s most stable in-
dustries and has set itself apart through years of continuous
growth and its relative insensitivity to economic fluctuations.
Aging populations, demand for innovative medicine especial-
ly in industrialized nations, and the demand for primary care
in developing countries are the main contributing factors.
At the same time, the cost of health care is rising and is
claiming an ever increasing share of national income. Health
care spending in the OECD countries has climbed from an
average of 7.1% of GDP in 1990 to an average of 8.8% in
2003. In 2003, the United States had the highest health care
spending relative to GDP of 15%, followed by Switzerland
with 11.5% and Germany with 11.1%.
Reforms and cost-control measures are the main reactions
to the explosion in costs in the health care systems. Disease
prevention programs and innovative reimbursement models,
where the quality of treatment is used as the key parameter,
are also gaining in importance. By educating patients better
about how to lead a healthy life and on prophylactic meas-
ures, numerous costly treatments can be prevented in the
long-term. The quality of treatment is a key factor in im-
proving medical results and reducing treatment costs.
The following describes the development of our most
important markets:
Ω The dialysis market
About 1.45 million people worldwide who suffer from
chronic kidney failure regularly receive dialysis treat-
ment. More than 89% of dialysis patients receive hemo-
dialysis while about 11% choose peritoneal dialysis. An
aging population and an increase in diabetes and high
blood pressure, which often lead to terminal kidney
failure, are the main factors behind the rise in patient
numbers. Optimized treatments that extend the lives of
patients and higher standards of living in developing
nations are additional reasons for the increase in patient
numbers.
The prevalence, or the number of patients treated for
terminal kidney failure as a proportion of the population,
differs substantially. The 20 strongest economies, which
include the two largest dialysis markets, the United States
and Japan, have an average prevalence of more than
1,000 patients per million population. In countries with
lower economic outputs the prevalence is about 500 pa-
tients per million population and in countries with weak
economies it is less than 100 patients per million popula-
tion. These numbers show how limited the access to
dialysis treatment remains in many parts of the world.
Source: Bank research, German Council of Economic Experts Annual Report 2005/2006

69To our Shareholders Summary Fresenius Shares Business Segments Additional Information Management Report
The majority of hemodialysis patients are treated in dial-
ysis clinics. There are more than 23,500 dialysis centers
worldwide, with an average of 55 hemodialysis patients
receiving treatment per clinic. In the United States, most
of the centers are run privately and less than 5% of the
approximately 4,500 clinics are publicly operated. By com-
parison, some 60% of the approximately 4,000 dialysis
clinics in Europe are publicly owned. Overall, the number
of patients grew about 6% in 2005. As they increase
their level of health care coverage, economically weak
regions show growth rates of about 10%, well above
those in the United States, Japan and Western and Cen-
tral Europe. In 2005, the global market for dialysis prod-
ucts was worth more than US$ 8 billion.
The ongoing consolidation of the dialysis industry in
recent years continued with the DaVita/Gambro Healthcare
deal. DaVita acquired the US dialysis clinics of Gambro in
2005. Fresenius Medical Care announced plans to acquire
Renal Care Group in May 2005.
Because treatment costs in the United States are
covered primarily by public health insurers, competition
among providers is primarily with respect to quality and
availability. Outside the United States, Fresenius Medical
Care competes in most countries mainly with independent
clinics and clinics that are affiliated to hospitals.
Fresenius Medical Care is the leading global company
in dialysis care as well as in dialysis products, where its
market share is approximately 28%.
Ω The market for infusion therapy and clinical nutrition
Demographic changes, the resulting higher need for
medical services and the demand for innovative ther-
apies are the main growth drivers in our markets. How-
ever, market conditions vary widely from region to region.
In Central and Western Europe, cost-saving measures
and health care reforms are the key factors shaping the
public health systems. At the same time, the cost pres-
sure in these countries is triggering new demand. Ther-
apies that lead to better clinical results while reducing
hospital stays and speeding up the recovery of the pa-
tients are gaining in importance. Cost pressure in hos-
pitals, budget caps and new health care savings plans are
resulting in outpatient and inpatient care being linked
more and more closely, and are leading to an increase
in outpatient treatment.
The overall market for infusion therapy and clinical
nutrition is growing in Central and Western Europe at
a low single-digit rate. The growth in generic intrave-
nously administered drugs for hospitals is in the mid-
single-digit range. Continuing cost pressure at hospi-
tals and increasing use of generic drugs as well as the
expiration of numerous patents will accelerate this
growth in the future.
The market for medical devices for infusion therapy
and clinical nutrition continues to grow in Europe at a
mid-single-digit rate. Innovative technologies in particu-
lar ensure that the treatment of patients is made even
safer while the efficiency of therapies increases.
In the growth regions of Asia-Pacific, Latin America
and Eastern Europe, the health care systems are develop-
ing rapidly. The main focus here is to provide primary
health care to the population, which is continuously in-
creasing the demand for health-related services. Growth
rates in our product markets here are in the high single-
digit and sometimes double-digit region.
Ω The German hospital market
In 2004, the German hospital market consisted of 2,166
acute care hospitals with a total of 531,333 beds. More
than 16.8 million treatments were performed. From 1999
through 2004, the average stay of a patient in an acute

Management Report70
care clinic dropped by one day to 8.7 days in 2004 (2003:
8.9 days). At the same time, the bed utilization rate
fell between 1999 and 2004 from 82.2% to 75.5%. The
market is worth about € 65 billion.
Government health policy has unleashed significant
pressure for change in the hospital market, especially
among care providers. A new reimbursement system
based on diagnosis-related groups (DRGs) was introduced
in Germany in 2004. Patients are categorized into a DRG
based on their diagnosis and proposed treatment, in
order to classify them according to the level of costs
incurred. Each treatment group has a specific DRG value
that is based on the average cost at comparable hospitals.
The reimbursement rate for a complex heart bypass
surgery is higher than for a standard appendectomy.
Before the DRG program was introduced, reimbursement
was based on the principle of refunded costs which en-
couraged unnecessarily long stays in hospital and inef-
ficient treatment.
To promote transparency in hospital services, the
German government has introduced a system of struc-
tured quality reports. All acute care hospitals had to sub-
mit these reports for the first time in 2005. The reports
include key figures of hospital operations such as the
number of treatments and information on quality manage-
ment. Furthermore, the system allows for patients and
their practitioners to select hospitals based on objective
criteria for the first time.
The standardized DRG-based reimbursement will in-
crease competition between hospitals and force them
to place much more emphasis on quality and patient
satisfaction than before. There will be consequences for
clinics with unfavorable cost structures and inefficient
workflows.
According to a survey last year by the German Hospital
Institute, the financial situation of hospitals continues
to be marked by a decrease in the number of inpatient
cases and growing difficulties in financing investments.
The investment rate decreased to 11.3% in 2004 (2003:
13.6%). Of the 319 hospitals in the survey, 40% expect
funds for investments to decrease further over the next
three years.
Strained public finances are the reason for this devel-
opment. In general, hospitals in Germany are entitled to
government-supported investments. Therefore, such
investments are not included in the revenues for health
services. Public insurers cover only the operating costs.
After the changes introduced in 2004, many hospitals
find it difficult to maintain high medical and technical
standards as well as to cope with their investment needs.
Overall, about 40% of the hospitals involved in the study
rated their economic situation as “unsatisfactory” while
18% said it was “good“. 39% were undecided.
The introduction of the DRG system has led to a re-
duction in the length of hospital stays and consequently
in staff cuts, especially in nursing staff. The number of
doctors, however, has increased, as has the number of
personnel in medical controlling and documentation.
2005 saw the first privatization of a university hospital,
the Giessen and Marburg University Hospital.
The Management Board’s assessment of the effect of
general economic developments and developments in
the health care sector for Fresenius
On the whole, the global economy and the health care sector
– in both the mature and growth markets – developed posi-
tively for Fresenius in 2005. This triggered a large part of the
Group’s growth, although Fresenius, with its excellent prod-
ucts and services, outpaced the expansion of the health care
industry as a whole.
Source: Federal Statistical Office of Germany, OECD Indicators – 2005 Edition, KrankenhausBarometer Survey 2005

71To our Shareholders Summary Fresenius Shares Business Segments Additional Information Management Report
Significant factors affecting business development
Last year no significant factors arose or existed that could
have a significant influence on the Group statement of in-
come. The positive business development was primarily the
result of the good performance of Fresenius Medical Care
and Fresenius Kabi, which achieved significant increases in
sales as well as earnings. The balance sheet of the Fresenius
Group as of December 31, 2005 was affected by the first-
time consolidation of HELIOS Kliniken GmbH as well as the
capital increase at Fresenius AG and the bridge financing.
The Management Board’s assessment of business results
The Management Board is of the opinion that the economic
development of the Fresenius Group was extremely positive
in 2005. The two main business segments Fresenius Medical
Care and Fresenius Kabi especially profited from the con-
tinued strong demand for products and services and did bet-
ter than the market on the whole. This was reflected in sus-
tained strong organic growth and higher profitability.
Fresenius ProServe also achieved an improvement in ear-
nings. Order intake, an indicator of future sales, increased
significantly in Fresenius ProServe’s project business.
Comparison of the actual business results with forecasts
The targets set by Fresenius for 2005 were either achieved
or exceeded. With an actual currency-adjusted sales increase
of 8%, Fresenius was well within its forecast of 6% to 9%.
The guidance of currency-adjusted net income growth of
>25% was exceeded at 31%. This was mainly due to the
better-than expected performance at Fresenius Medical Care
and Fresenius Kabi. The net debt /EBITDA ratio was lower
than the predicted 2.5 despite the acquisition of HELIOS, and
came to 2.3% on December 31, 2005 on a pro forma basis.
Since HELIOS’s debt was recognized in the balance sheet as
at December 31, 2005, but the HELIOS business was not yet
included in the Group statement of income, the ratio has
been calculated on a pro forma basis including the EBITDA
of HELIOS. Please refer to page 133 of the Notes.
RESULTS OF OPERATIONS, FINANCIAL POSITION,
ASSETS AND LIABILITIES
In the year under review, Fresenius completed the following
significant acquisitions:
In December 2005, the group acquired HELIOS Kliniken
GmbH, Fulda, Germany, one of the largest private hospital
operators in the country. HELIOS owns 24 clinics with a total
capacity of approximately 9,300 beds in Germany (Decem-
ber 31, 2005). The purchase price for 100% of the HELIOS
shares was € 1.5 billion plus € 100 million for the net cash
position. Fresenius acquired 94% of the HELIOS shares, 6%
will continue to be held by the HELIOS management.
Fresenius also made two other major acquisitions in the
Fresenius Kabi business segment. In January, Fresenius Kabi
acquired Labesfal – Laboratório de Especialidades Farma-
cêuticas Almiro S.A., which operates in the Portuguese mar-
ket for generic intravenously administered drugs. In Decem-
ber 2005, Fresenius Kabi acquired the business of Clinico
GmbH, Germany, a manufacturer of medical devices. Labesfal
was consolidated in the Group financial statements as from
January 1, 2005 while HELIOS Kliniken and the business of
Clinico were consolidated as of December 31, 2005.
Owing to the size of the HELIOS acquisition, a pro forma
calculation of business results in 2005 including the HELIOS
business is shown below.
in million € 2005 2005pro forma as reported
Sales 9,086 7,889
EBIT 1,073 969
Net income 265 222

Management Report72
Results of operations
Sales
In 2005, Group sales increased by 8% to € 7,889 million.
Organic growth contributed 7% while acquisitions/divest-
ments contributed 1% to this sales growth. Currency trans-
lation effects had hardly any impact. The chart shows the
respective influences on the sales growth of the Fresenius
Group. There were no significant price effects or effects
from changes in product mix and none are expected in the
foreseeable future.
The largest regions in the Group were North America,
which contributed 47% of total sales, and Europe 38%,
followed by Asia-Pacific with 7%, Latin America 5% and
Africa 3%. Germany contributed 12% to Group sales.
We increased sales in all regions of the world. The highest
growth rates were achieved in Latin America with 30% and
Africa with 16%. North America also performed strongly
with currency-adjusted growth of 8%. This was primarily
driven by the good sales development in the dialysis care
segment at Fresenius Medical Care. Sales in Europe were up
8%. In Asia-Pacific we achieved a sales growth of only 2%,
since sales of Fresenius ProServe in this region fell due to the
lower project volume .
Sales development by business segment was as follows:
Ω Fresenius Medical Care grew sales by 9% to € 5,443 mil-
lion (2004: € 5,007 million). Organic growth contributed
7%, and acquisitions and currency translation effects 1%
each. In particular, dialysis care in North America and
dialysis products and dialysis care in Europe posted strong
sales increases.
Ω Sales of Fresenius Kabi rose to € 1,681 million in 2005,
13% above the € 1,491 million in 2004. The company
ReportedDivestmentsAcquisitionsOrganic
growth
SALES GROWTH ANALYSIS
7%
-1%
8%
2%
Organic Currency Acquisitions/ % of totalin million € 2005 2004 Change growth translation effects Divestments sales 2005
Europe 3,032 2,802 8% 7% 0% 1% 38%
North America 3,746 3,478 8% 7% 0% 1% 47%
Asia-Pacific 557 547 2% 0% 2% 0% 7%
Latin America 354 272 30% 16% 10% 4% 5%
Africa 200 172 16% 15% 0% 1% 3%
Total 7,889 7,271 8% 7% 0% 1% 100%

73To our Shareholders Summary Fresenius Shares Business Segments Additional Information Management Report
achieved strong organic growth of 7%. Acquisitions in-
creased sales by 5%, driven primarily by the purchase of
Labesfal. Currency translation effects added 2% while
divestments lopped off 1%.
In Europe, Fresenius Kabi posted organic growth of
4%, which was a considerable improvement on the 1%
of the previous year when sales were affected by a 6%
decline in Germany. The main reasons at that time were
the cost-cutting measures in the health care system and
related price pressure. In Asia-Pacific and Latin America
strong organic growth of 15% and 14% was achieved.
Ω Fresenius ProServe generated sales of € 809 million in
2005 (2004: € 813 million). On a like-for-like basis (with-
out the nursing home business that was sold in 2004 and
the international hospital management business that was
closed), sales were 5% higher than the previous year.
Order intake and order backlog were significantly
higher than in the previous year. Order intake in Fresenius
ProServe’s project business rose by 40% to € 341 mil-
lion (2004: € 244 million), while order backlog at year-
end was up 7% to € 360 million (December 31, 2004:
€ 335 million).
Earnings Structure
We achieved excellent growth rates in net income. Group
net income rose 32% to € 222 million (31% at constant ex-
change rates). The successful development is mainly due to
the results of the two largest business segments, Fresenius
Medical Care and Fresenius Kabi. Improvements at Fresenius
ProServe and a lower Group tax ratio also had a positive im-
pact. Currency translation effects had a slight positive impact
overall. Inflation had no significant effect on the results of
operations last year.
Group earnings before interest, taxes, depreciation and
amortization (EBITDA) rose 11% to € 1,289 million (2004:
€ 1,160 million). Group EBIT was up 14% at constant ex-
change rates and up 15% at actual rates to € 969 million
(2004: € 845 million).
EBIT contributions from the three business segments de-
veloped as follows:
Ω Fresenius Medical Care achieved EBIT growth of 10%
to € 755 million (2004: € 685 million). The EBIT margin
came to 13.9% (2004: 13.7%). This includes one-time
expenses of € 18 million for the change of Fresenius
Organic Currency Acquisitions/ % of totalin million € 2005 2004 Change growth translation effects Divestments sales 2005
Fresenius Medical Care 5,443 5,007 9% 7% 1% 1% 69%
Fresenius Kabi 1,681 1,491 13% 7% 2% 4% 21%
Fresenius ProServe 809 813 0% 5% 0% -5% 10%
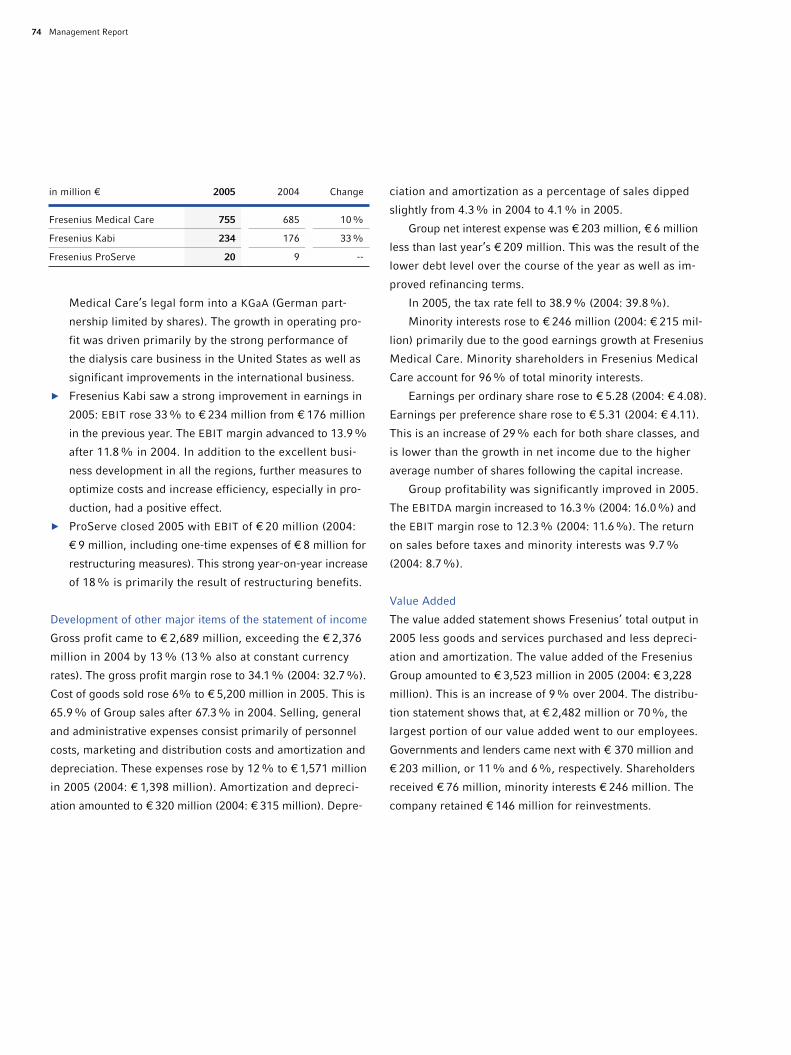
Management Report74
Medical Care’s legal form into a KGaA (German part-
nership limited by shares). The growth in operating pro-
fit was driven primarily by the strong performance of
the dialysis care business in the United States as well as
significant improvements in the international business.
Ω Fresenius Kabi saw a strong improvement in earnings in
2005: EBIT rose 33% to € 234 million from € 176 million
in the previous year. The EBIT margin advanced to 13.9%
after 11.8% in 2004. In addition to the excellent busi-
ness development in all the regions, further measures to
optimize costs and increase efficiency, especially in pro-
duction, had a positive effect.
Ω ProServe closed 2005 with EBIT of € 20 million (2004:
€ 9 million, including one-time expenses of € 8 million for
restructuring measures). This strong year-on-year increase
of 18% is primarily the result of restructuring benefits.
Development of other major items of the statement of income
Gross profit came to € 2,689 million, exceeding the € 2,376
million in 2004 by 13% (13% also at constant currency
rates). The gross profit margin rose to 34.1% (2004: 32.7%).
Cost of goods sold rose 6% to € 5,200 million in 2005. This is
65.9% of Group sales after 67.3% in 2004. Selling, general
and administrative expenses consist primarily of personnel
costs, marketing and distribution costs and amortization and
depreciation. These expenses rose by 12% to € 1,571 million
in 2005 (2004: € 1,398 million). Amortization and depreci-
ation amounted to € 320 million (2004: € 315 million). Depre-
ciation and amortization as a percentage of sales dipped
slightly from 4.3% in 2004 to 4.1% in 2005.
Group net interest expense was € 203 million, € 6 million
less than last year’s € 209 million. This was the result of the
lower debt level over the course of the year as well as im-
proved refinancing terms.
In 2005, the tax rate fell to 38.9% (2004: 39.8%).
Minority interests rose to € 246 million (2004: € 215 mil-
lion) primarily due to the good earnings growth at Fresenius
Medical Care. Minority shareholders in Fresenius Medical
Care account for 96% of total minority interests.
Earnings per ordinary share rose to € 5.28 (2004: € 4.08).
Earnings per preference share rose to € 5.31 (2004: € 4.11).
This is an increase of 29% each for both share classes, and
is lower than the growth in net income due to the higher
average number of shares following the capital increase.
Group profitability was significantly improved in 2005.
The EBITDA margin increased to 16.3% (2004: 16.0%) and
the EBIT margin rose to 12.3% (2004: 11.6%). The return
on sales before taxes and minority interests was 9.7%
(2004: 8.7%).
Value Added
The value added statement shows Fresenius’ total output in
2005 less goods and services purchased and less depreci-
ation and amortization. The value added of the Fresenius
Group amounted to € 3,523 million in 2005 (2004: € 3,228
million). This is an increase of 9% over 2004. The distribu-
tion statement shows that, at € 2,482 million or 70%, the
largest portion of our value added went to our employees.
Governments and lenders came next with € 370 million and
€ 203 million, or 11% and 6%, respectively. Shareholders
received € 76 million, minority interests € 246 million. The
company retained € 146 million for reinvestments.
in million € 2005 2004 Change
Fresenius Medical Care 755 685 10%
Fresenius Kabi 234 176 33%
Fresenius ProServe 20 9 --
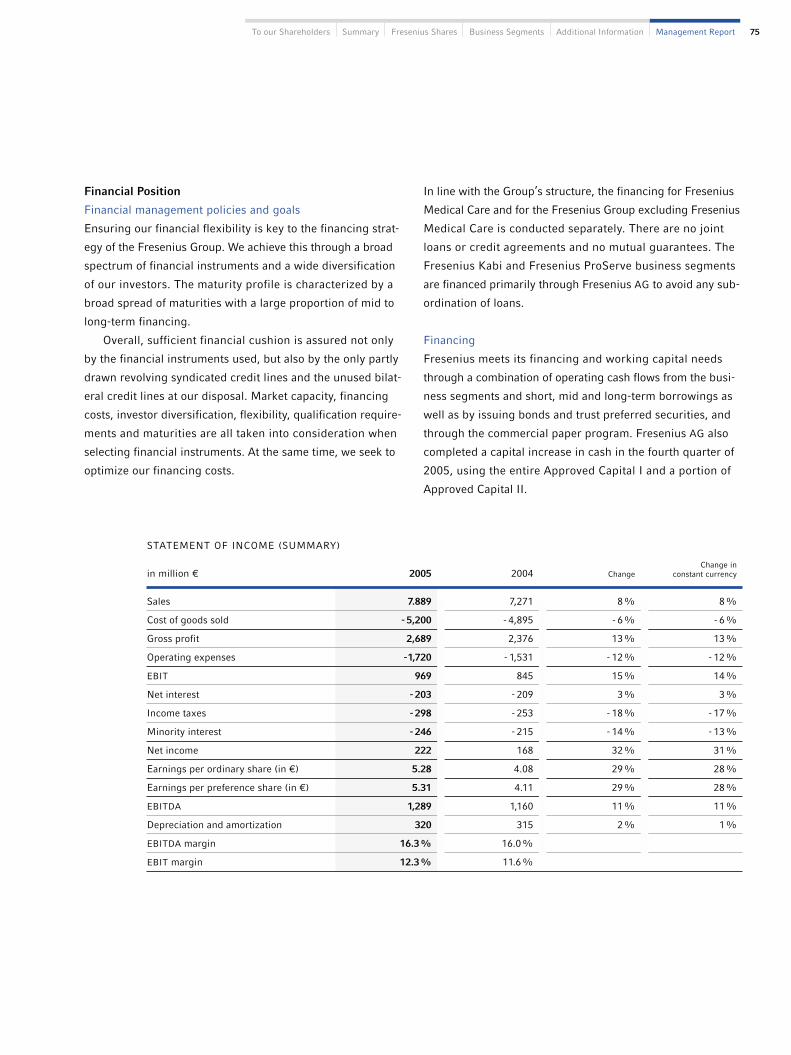
75To our Shareholders Summary Fresenius Shares Business Segments Additional Information Management Report
Financial Position
Financial management policies and goals
Ensuring our financial flexibility is key to the financing strat-
egy of the Fresenius Group. We achieve this through a broad
spectrum of financial instruments and a wide diversification
of our investors. The maturity profile is characterized by a
broad spread of maturities with a large proportion of mid to
long-term financing.
Overall, sufficient financial cushion is assured not only
by the financial instruments used, but also by the only partly
drawn revolving syndicated credit lines and the unused bilat-
eral credit lines at our disposal. Market capacity, financing
costs, investor diversification, flexibility, qualification require-
ments and maturities are all taken into consideration when
selecting financial instruments. At the same time, we seek to
optimize our financing costs.
In line with the Group’s structure, the financing for Fresenius
Medical Care and for the Fresenius Group excluding Fresenius
Medical Care is conducted separately. There are no joint
loans or credit agreements and no mutual guarantees. The
Fresenius Kabi and Fresenius ProServe business segments
are financed primarily through Fresenius AG to avoid any sub-
ordination of loans.
Financing
Fresenius meets its financing and working capital needs
through a combination of operating cash flows from the busi-
ness segments and short, mid and long-term borrowings as
well as by issuing bonds and trust preferred securities, and
through the commercial paper program. Fresenius AG also
completed a capital increase in cash in the fourth quarter of
2005, using the entire Approved Capital I and a portion of
Approved Capital II.
STATEMENT OF INCOME (SUMMARY)
Change inin million € 2005 2004 Change constant currency
Sales 7.889 7,271 8% 8%
Cost of goods sold - 5,200 - 4,895 - 6% - 6%
Gross profit 2,689 2,376 13% 13%
Operating expenses -1,720 - 1,531 - 12% - 12%
EBIT 969 845 15% 14%
Net interest - 203 - 209 3% 3%
Income taxes - 298 - 253 - 18% - 17%
Minority interest - 246 - 215 - 14% - 13%
Net income 222 168 32% 31%
Earnings per ordinary share (in €) 5.28 4.08 29% 28%
Earnings per preference share (in €) 5.31 4.11 29% 28%
EBITDA 1,289 1,160 11% 11%
Depreciation and amortization 320 315 2% 1%
EBITDA margin 16.3% 16.0%
EBIT margin 12.3% 11.6%

Management Report76
Group financing activities in 2005 were primarily to finance
the acquisition of HELIOS at the end of 2005 as well as the
acquisition of Renal Care Group that was announced in May
2005. Detailed financing plans approved by the banks were
already in place when the acquisitions were announced. The
loans were arranged at advantageous conditions because of
the positive acceptance of our corporate business strategy
by the capital markets and the financing mix. The good busi-
ness performance and sustained cash flows also had a posi-
tive effect on the financing conditions. A significant reduc-
tion in debt in recent years and the improved financial ratios
have strengthened investor confidence in Fresenius. Despite
some volatility in the second quarter of 2005, the positive
bond market environment was also beneficial. The banking
markets in Europe, the United States and Japan were very
receptive to the Fresenius debt offerings.
On May 3, 2005, Fresenius Medical Care received financing
confirmation totaling US$ 5 billion from Bank of America
and Deutsche Bank for the Renal Care Group acquisition, one
to be provided by a syndicate of banks and the other by a
syndicate of banks and other institutional investors. In ac-
cordance with the new credit agreement, the senior credit
facilities may be drawn to pay the purchase price of Renal
Care Group and, among other things, to refinance existing
loans under Fresenius Medical Care’s 2003 credit agreement
as well as certain liabilities of Renal Care Group, or for gen-
eral corporate purposes.
The new senior loan comprises a US$ 1 billion revolving
credit facility with a maturity of five years, a loan (Term Loan
A) of US$ 2 billion with a maturity of five years as well as a
US$ 2 billion loan (Term Loan B) with a maturity of seven
years. The revolving credit line and Term Loan A were syndi-
cated in July of 2005. Syndication of Term Loan B is planned
to be completed shortly before the closing of the acquisition
of Renal Care Group.
VALUE ADDED STATEMENT
in million € 2005 % 2004 %
Creation
Company output 7,907 100 7,278 100
- Materials and services purchased 4,064 51 3,735 52
Gross value added 3,843 49 3,543 48
- Depreciation and amortization 320 4 315 4
Net value added 3,523 45 3,228 44
Distribution
Employees 2,482 70 2,318 72
Governments 370 11 318 10
Lenders 203 6 209 6
Shareholders 76 2 56 2
Company and minority interests 392 11 327 10
Net value added 3,523 100 3,228 100

77To our Shareholders Summary Fresenius Shares Business Segments Additional Information Management Report
Interest rates of the new senior bank loan are based on the
prevailing market reference rates plus a spread. The appli-
cable spread is variable and depends on the ratio of Fresenius
Medical Care’s debt to EBITDA. Fresenius Medical Care has
largely limited its risk exposure to higher interest payments
from rising variable reference rates by entering into appro-
priate interest hedging transactions. The credit agreements
contain covenants that limit Fresenius Medical Care’s debt
ratio and require it to meet certain fixed-cost coverage ratios.
There are other restrictions, too, regarding collateral, asset
disposals, investments etc.
The Fresenius Medical Care Senior Note (Schuldschein-
darlehen) of € 128.5 million from 2001 due in July 2005 was
refinanced with a four-year € 200 million Senior Note due in
July 2009. This Senior Note also contains covenants limiting
financial leverage.
Fresenius Medical Care also entered a credit agreement
with the European Investment Bank (EIB) in July 2005 worth
€ 131 million consisting of a € 90 million revolving line of
credit and a loan of € 41 million. The facility has a maturity
of eight years. The loan was drawn in September 2005 while
no funds had been drawn from the revolving credit line as of
December 31, 2005.
The HELIOS acquisition and the purchase of the Clinico
business were financed by a capital increase and a bond issue.
The capital increase was carried out in November 2005 with
proceeds of € 919 million (gross). Shareholders were offered
4.7 million new ordinary shares and 4.7 million new pref-
erence shares at the rate of two new shares for every nine
shares held. The subscription price was € 93 per new ordi-
nary share and € 102 per new preference share.
The HELIOS acquisition was bridge financed between
December 2005 and the time the bond was issued. The bridge
loan was used to pay the purchase price for HELIOS on De-
cember 22, 2005. On January 20, 2006 this loan was repaid
with the proceeds from the bond issue.
This bond generated gross proceeds of € 1 billion. The
size of the issue was initially € 700 million but was increased
to exploit an advantageous opportunity to refinance a € 300
million bond issued in 2003 and due in 2009. We offered to
redeem this bond at 105.168% of its nominal value. 71%
(€ 212 million) accepted the tender offer. A call option will
allow the remaining € 88 million outstanding volume to be
redeemed beginning on April 30, 2006.
The new bond comprises one tranche with a nominal
value of € 500 million, a maturity of 7 years and an annual
interest rate of 5.0% and a second tranche with a nominal
value of € 500 million, a maturity of 10 years and an annual
interest rate of 5.5% as well as a call option for the issuer
after five years.
The terms of the bond contain usual conditions. These
limit certain payments, such as dividends and share buybacks,
and place restrictions on increasing debt beyond refinancings
and an agreed financing cushion if the EBITDA/interest ratio
falls below 2.5. We believe this agreement gives us enough
room to maneuver and achieve our goals without limiting
our financial flexibility.
Fresenius AG has a commercial paper program under
which up to € 250 million in short-term notes can be issued.
On December 31, 2005, only € 22 million was used (Decem-
ber 31, 2004: € 10 million).
The Fresenius Group has drawn about €1,540 million of
bilateral and syndicated credit lines. In addition, on Decem-
ber 31, 2005 the Group had approximately €1,500 million in
unused credit lines at its disposal, including a confirmed
credit line of €1,000 million. These credit facilities are gen-
erally used for covering corporate purposes and are usually
unsecured.
As of December 31, 2005, both Fresenius AG and Fresenius
Medical Care AG, including all subsidiaries, complied with all
the covenants under all the credit agreements.

Management Report78
Effect of off-balance-sheet financing instruments on
financial position and assets and liabilities
Fresenius is not involved in any off-balance-sheet transactions
that could have or will have a significant effect on its financial
position, expenses or earnings, profitability, liquidity, invest-
ments, assets or capitalization.
Liquidity analysis
In 2005, key sources of liquidity were operating cash flow,
short-term borrowings and long-term loans as well as the
issuance of new bearer ordinary shares and new bearer pref-
erence shares. Cash flow from operations is influenced by
the profitability of Fresenius’ business and by working capital,
especially accounts receivable. Cash flow can be generated
from short-term borrowings through the sale of receivables
under the Fresenius Medical Care accounts receivable secu-
ritization program which is included in the balance sheet, as
well as through the use of the commercial paper program.
Long-term funding is provided by the revolving credit facil-
ities of Fresenius Medical Care, bonds issued by Fresenius
AG, bank credit agreements and trust preferred securities
issued by Fresenius Medical Care. Fresenius believes that
the existing and new credit facilities as well as the operating
cash flow and additional short-term borrowings are sufficient
to meet the company’s forecast liquidity needs.
Dividend
The Management and Supervisory Boards will propose a
dividend increase to the Annual General Meeting. For 2005,
a dividend of € 1.48 per ordinary share (2004: € 1.35) and
€ 1.51 (2004: € 1.38) per preference share is proposed. This
is an average increase of 10%. The total distribution will be
€ 75.8 million (2004: € 55.9 million).
Cash Flow Analysis
The Group cash flow statement shows a sustained devel-
opment. Group cash flow increased 10% to € 789 million
in 2005 (2004: € 718 million) due to the strong increase in
net income. The change in working capital was € -9 million
(2004: € 133 million). Higher income tax payments at
Fresenius Medical Care had a negative effect.
Operating cash flow came to € 780 million in 2005 (2004:
€ 851 million). Operating cash flow was more than sufficient
to meet all the financing needs for investments excluding
acquisitions. Cash used for investments in the Group totaled
€ 353 million, while proceeds from the sale of property, plant
and equipment amounted to € 22 million (2004: € 308 mil-
lion and € 22 million, respectively). Cash flow before acqui-
sitions and dividends came to € 449 million (2004: € 565
million). Cash flow was sufficient to finance all of the divi-
dends of € 132 million and 20% of net acquisitions in 2005.
The balance was financed through bank debt and the capital
increase.
CASH FLOW STATEMENT IN MILLION €
Change in working capital
Operating cash flow
Capital expenditure (net)
Cash flow (before acquisitions and dividends)
Acquisitions and dividends
Free cash flow (after acquisitions and dividends)
789
-9
780
331
449
1,738
-1,289
Cash flow

79To our Shareholders Summary Fresenius Shares Business Segments Additional Information Management Report
Cash provided from financing activities (without dividends
paid) amounted to €1,256 million in 2005 (2004: € -458 mil-
lion) and was primarily influenced by the capital increase and
the bridge loan in connection with the HELIOS acquisition.
Dividend payments in 2005 resulted in a total payout of €132
million (2004: €122 million), with the Fresenius AG dividend
accounting for € 56 million (2004: € 51 million). Cash and
cash equivalents amounted to € 252 million on December
31, 2005 (2004: €140 million).
Investments and Acquisitions
In 2005, the Fresenius Group invested € 2.247 million (2003:
€ 421 million) This was the highest investment volume in the
company’s history. € 353 million (2004: € 308 million) was
invested in property, plant and equipment and intangible
assets. € 1,894 million was invested in acquisitions (2004:
€ 113 million). Of the total investment volume, 16% was
invested in property, plant and equipment and intangible
assets. 84% was invested in acquisitions.
The largest acquisition was the purchase of 94% of the
shares of HELIOS. Funds were also invested in the expansion
of our global dialysis care business through the purchase of
dialysis clinics by Fresenius Medical Care. At Fresenius Kabi,
the funds were mainly used for the expansion of its product
portfolio: generic intravenously administered drugs and in
the medical devices business.
The major investments in property, plant and equipment
and intangible assets were as follows:
Ω Start-up of new dialysis clinics, primarily in the United
States, as well as the expansion and modernization of
existing clinics
Ω Expansion and optimization of production sites at
Fresenius Medical Care and Fresenius Kabi
Ω Hospital modernization and investments in IT at
Fresenius ProServe
Ω Expansion of the corporate headquarters in Bad
Homburg, Germany
CASH FLOW STATEMENT (SUMMARY)
in million € 2005 2004
Net income before minority interests 468 383
Depreciation and amortization 320 315
Change in pension provisions 1 20
Cash flow 789 718
Change in working capital - 9 133
Operating cash flow 780 851
Property, plant and equipment and intangible assets - 353 - 308
Proceeds from the sale of property, plant and equipment 22 22
Cash flow before acquisitions and dividends 449 565
Cash used for acquisitions/proceeds from disposals -1,606 - 90
Dividends -132 -122
Free cash flow after acquisitions and dividends -1,289 353
Cash provided from financing activities (without dividends paid) 1,388 - 336
Currency-adjusted change in cash and cash equivalents 13 -2
Change in cash and cash equivalents 112 15
The detailed cash flow statement is shown in the consolidated financial statements.

Management Report80
The table below shows the distribution of investments by
business segment. The chart on the right shows the regional
breakdown of investments.
To continue with major investments that were already
underway on the last reporting date, investments in property,
plant and equipment of about € 150 million will be made in
2006. This is chiefly for investment obligations for hospitals
at Fresenius ProServe as well as for investments to expand
and optimize production plants.
These projects will be financed from operating cash flow.
Assets and Liabilities
Asset and liability structure
The total assets of the Group rose by € 3,406 million (42%)
to €11,594 million (December 31, 2004: € 8,188 million). At
constant exchange rates, assets grew by 33%. € 2.5 billion
(30%) of the strong growth in total assets is acquisition-
related, mainly attributable to HELIOS. Business expansion
contributed 3% to the increase. Inflation had no significant
effect on the assets of Fresenius in 2005.
Non-current assets came to € 8,063 million (2004:
€ 5,433 million). Based on the closing exchange rates as of
December 31, 2004, the increase was 39%. High additions
in property, plant and equipment as well as goodwill had a
significant effect here. Goodwill from acquisitions amounted
to €1,426 million on December 31, 2005, of which €1,190
million resulted from the purchase of HELIOS.
Current assets amounted to € 3,531 million (2004:
€ 2,755 million), an increase of 21% at constant exchange
rates. Within current assets, trade accounts receivable rose
to €1.871 million (2004: €1,528 million), primarily due to
business expansion. Adjusted for currency effects, receiv-
ables grew by 14%. Benefits were felt from more efficient
receivables management. Days sales outstanding improved
further to 79 days (2004: 80 days). These improved ratios
INVESTMENTS BY BUSINESS SEGMENT
Thereof property,plant and
equipment and Thereofin million € 2005 2004 intangible assets acquisitions Change % of total
Fresenius Medical Care 361 320 253 108 13% 16%
Fresenius Kabi 351 68 77 274 -- 16%
Fresenius ProServe 1,519 29 12 1,507 -- 68%
Corporate/Other 16 4 11 5 -- 0%
Total 2,247 421 353 1,894 -- 100%
INVESTMENTS BY REGION
Europe 88%
Other regions 1%
Asia-Pacific 2%
2005: € 2,247 million
North America 9%

81To our Shareholders Summary Fresenius Shares Business Segments Additional Information Management Report
reduced the amount of capital tied up within the Group. In-
ventory turnover increased slightly in 2005 to 48 days (2004:
46 days).
The liabilities and equity side of the balance sheet was
marked primarily by the capital increase. Shareholders’
equity including minority interests rose 53% to € 5,130 mil-
lion (2004: € 3,347 million). Adjusted for currency effects,
the increase was 40%. Group net income increased share-
holders’ equity by € 222 million. The capital increase in
the fourth quarter of 2005 had an effect of € 872 million (net)
on the capital reserves and of € 24 million on subscribed
capital. The equity ratio including minority interests rose from
40.9% on December 31, 2004 to 44.2% at the end of 2005.
The liabilities and equity side of the balance sheet reflects
our solid financing structure. Shareholders’ equity of the
Group including minority interests covers 64% of non-current
assets (2004: 62%). Shareholders’ equity, minority interests
and long-term liabilities cover all non-current assets including
all inventories.
The long-term liabilities of € 3,967 million on December
31, 2005 were €1,182 million or 42% above the € 2,785 mil-
lion of the previous year (38% at constant exchange rates).
The short-term liabilities were € 2,497 million or 21% above
the previous year’s figure (€ 2,056 million). Adjusted for cur-
rency effects, short-term liabilities would have been 15%
higher than in 2004.
The Group has no significant accruals. The largest single
accrual is for the settlement of fraudulent conveyance claims
and all other legal matters in connection with the National
Medical Care transaction in 1996 resulting from the bank-
ruptcy of W.R. Grace & Co. This accrual amounts to US$ 115
million (€ 97 million). Please see page 148 of the Notes for
details.
Bank loans, Eurobonds, commercial papers and trust pre-
ferred securities of the Group increased primarily due to the
acquisition of HELIOS and Clinico to € 3,502 million (Decem-
ber 31, 2004: € 2,735 million); at constant exchange rates:
€ 3,384 million. Of the group’s financial liabilities, 30% are
in US dollars. Liabilities with a remaining term of up to one
year came to € 447 million (December 31, 2004: € 583 mil-
lion) and with a remaining term of one to five years and over
five years amounted to € 3,055 million (December 31, 2004:
€ 2,152 million).
The net debt to equity ratio including minorities (gearing)
decreased from 78% in 2004 to 63%. The return on equity
after taxes rose to 11.4% (2004: 10.5%). The return on total
assets after taxes and excluding minority interests was 4.9%
in 2005 (2004: 4.7%). In calculating the profitability ratios,
the respective balance sheet items were adjusted for the
effects of the capital increase and for HELIOS, since HELIOS
was consolidated for the first time as of December 31, 2005
so its results of operations are not included.
DEVELOPMENT OF INVESTMENTS, OPERATING CASH FLOW,
DEPRECIATION AND AMORTIZATION IN MILLION €
Investments Operating cash flow Depreciation and amortization
2001 2002 2004
780
320
1,233
494341 325
509
697 776
2,247
2003
507 430
2005
851
315
421

The following table shows other key asset and capital ratios:
Management Report82
In the segment Corporate/Other the increase was largely
attributable to Fresenius Biotech.
The chart shows the regions where our employees work.
These percentages roughly correspond to the sales contri-
butions of the respective continents. 29,975 people are em-
ployed in Germany.
In 2005, personnel expenses of the Fresenius Group
came to € 2,482 million, an increase of 7% versus the pre-
vious year’s figure of € 2,318 million. Personnel expenses
per employee amounted to € 34,700 (2004: € 34,200).
There were no significant changes to compensation or
employment agreements in 2005.
Procurement
The efficient procurement of goods and services is important
for Group profitability since the health care sector faces cost
cuts from health insurance companies as well as price pres-
sure. We are constantly striving to optimize our purchasing
processes and to establish pricing structures that allow flex-
ibility within our strict quality and safety standards. Fresenius
coordinates global procurement centrally so as to bundle
similar requirements and negotiate global frame contracts.
The central coordinating offices coordinate purchasing for
the production sites and organize comprehensive quality and
safety checks of purchased goods. Current market and price
developments are analyzed on an ongoing basis.
The Purchasing Consulting Center (PCC) of Fresenius
Medical Care, as the key coordinator, last year continued
with the internationalization of our procurement strategy to
find suppliers to better meet our stringent demands while
reducing our exposure to currency exchange fluctuations.
Standardized products are key as they provide cost efficiency
benefits. They simplify logistics, for example, since transpor-
tation can be better coordinated and loading capacities used
more efficiently. Furthermore, we are able to purchase pack-
ing materials at lower prices as a result of standardization.
Number of employees Dec 31, 2004 Dec 31, 2003 Change
Fresenius Medical Care 50,250 46,949 7%
Fresenius Kabi 14,453 11,577 25%
Fresenius ProServe 26,664 9,398 184%
Corporate/Other 604 570 6%
Total 91,971 68,494 34%
Dec 31, 2005 Dec 31, 2004
Debt/EBITDA ratio pro-forma* 2.5 2.4
Net debt/EBITDA ratio pro-forma* 2.3 2.2
EBITDA/interest ratio 6.3 5.6
* including EBITDA of HELIOS of the fiscal year 2005.
Currency and interest risk management
On December 31, 2005, the nominal value of all foreign cur-
rency hedging contracts was €1,390 million. These contracts
had a market value of € -3 million. The nominal value of inter-
est rate hedging contracts was € 3,386 million, with a market
value of €18 million. Further information is available in the
Risk Report on page 85 and in the Notes on pages 172 to 178.
NON-FINANCIAL PERFORMANCE INDICATORS
Employees
The Fresenius Group employed 91,971 people worldwide at
the end of 2005, an increase of 23,477 or 34% (December 31,
2004: 68,494). This is mainly due to the HELIOS acquisition.
The number of employees in the business segments developed
as follows:

83To our Shareholders Summary Fresenius Shares Business Segments Additional Information Management Report
One of our most important task last year was the ongoing
procurement of oil-based products such as polycarbonate, a
key raw material for manufacturing dialyzers. Here we faced
price increases because of the rise in oil prices and the strong
demand from China. For these reasons, prices for plastic
pellets and packing materials such as foil also increased.
Long-term supply contracts helped to stabilize purchase
prices of chlorides and glucose at 2004 levels. This strategy
also applied to energy and media in 2005, since we entered
into long-term service agreements at unchanged conditions.
Prices for cardboard boxes were also kept stable with a multi-
year contract.
At Fresenius Kabi, a new negotiation strategy and efforts
to bundle demand became fully effective in 2005. This led to
significant savings for amino acids and glass containers for
instance. The production sites in Portugal and the Czech
Republic that joined the Group in 2005 were integrated into
the Strategic Purchasing of Fresenius Kabi. New supply
agreements were negotiated which led to significant savings.
Together with Fresenius Medical Care, Fresenius Kabi
entered into a supply agreement that covers most of our
demand for starches – especially dextrose – from a single
global supplier, therefore achieving lower prices. The procure-
ment of plastics for Fresenius Kabi was also affected by the
sustained high oil prices. This led to an increase in prices for
all derivative products.
Quality management
Our process-oriented quality management fulfills ISO 9001:
2000 standards and is designed to meet the demands of our
customers. This covers not only the quality of our products
but also all business processes and additional services and
therapies we provide. The quality management system inte-
grates all product groups, such as drugs, medical products
and nutrition and it also includes clinics. The system is regu-
larly evaluated through internal quality audits and external
certification bodies. Its effectiveness was again confirmed
in 2005.
Our products receive intense review as an integral part
of our development activities. The drugs are subject to regu-
latory approval requirements and related documents are
carefully reviewed by the respective approval agencies.
Medical products undergo a conformity assessment proce-
dure, and compliance with the appropriate norms is docu-
mented. In enteral nutrition, we already follow the Hazard
Analysis Critical Control Point (HACCP) principle during
the development process.
We have established quality assurance systems in all our
production facilities. In addition to the controlled use of raw
materials, validated production procedures as well as am-
bience and in-process controls, each batch also undergoes
final controls and a formal release procedure. Our produc-
tion facilities are regularly inspected by regulatory author-
ities or other independent institutions. All audits and inspec-
tions led to the renewal of the respective manufacturing
authorization or certification.
Sales and marketing are also an integral part of the quality
management system. For example, the system monitors dis-
tribution and can – at any time – trace the location of a par-
ticular batch with a particular client.
The external certification of our subsidiaries according to
ISO 9001:2000 was further rolled out in 2005. All European
production sites of Fresenius Kabi, for example, were certi-
North America 33%
Europe 53%
Asia-Pacific 5%
Latin America and
other regions 9%
2005: 91,971
EMPLOYEES BY REGION

Management Report84
fied in a matrix according to ISO 9001, and its sales and mar-
keting activities in Germany were certified. The demands of
patients, doctors and health insurers for the best possible
and most cost-effective care were the focus of this certification.
A continuous improvement process creates opportunities for
optimization and increases competitiveness through better
cost structures. With the certification we have set uniform
standards to further enhance the quality of care.
The two new companies, Infusia and Labesfal, have been
integrated into the quality management system. Infusia’s
production in the Czech Republic has already been included
in Fresenius Kabi’s certification. Certification for the produc-
tion of medical products (EN 13485, MDD and ISO 9001:2000)
was received in November from the German TÜV Product
Service.
Fresenius Medical Care continued integrating dialysis
clinics into the quality management system. The certification
according to ISO 9001:2000 of clinics in Slovenia, the Czech
Republic and specially in Hungary was the focus in 2005.
OVERALL ASSESSMENT OF THE BUSINESS
SITUATION
The Management Board continued to assess the development
of the Fresenius Group as positive at the time this Manage-
ment Report was prepared. There is a strong demand around
the world for our products and services. The development in
the first few weeks of 2006, with further increases in sales
and earnings, fully met our expectations.
RISK REPORT
Through its continuous expansion, especially in international
markets, and the increasing complexity and dynamics of our
business, the Fresenius Group is exposed to a number of
risks. These risks are directly related to business activity and
have to be entered into if opportunities are to be exploited.
As a provider of often life-saving products and services for
severely and chronically ill people, we are relatively indepen-
dent of economic cycles. Our experience in the development
and manufacture of products as well as in our markets is a
solid base from which we can safely assess risks.
Risk management
The management of risks is a continuous task so the identifi-
cation, evaluation and control of risks are key tools of Group
management.
The Fresenius risk management system is an integral part
of corporate strategy and is based on its guidelines. Through
the combination of our internal monitoring system, our risk
controlling and an early-warning system derived from our
risk management system, we can identify and counteract at
an early stage those potential developments which could
threaten the companies’ future. We have assigned the respon-
sibilities for the processes and for monitoring risks in the
individual business segments as follows:
Ω Risk situations are evaluated regularly with standardized
processes and compared with given requirements. Re-
sponses can be initiated at an early stage when negative
developments emerge.
Ω The managers responsible are required to report relevant
changes in the risk profile without delay to the Manage-
ment Board.
Ω Constant observation of the markets as well as close
contacts to customers, suppliers and institutions allow us
to swiftly identify and react to changes in our business
environment.
Risk management measures are supported both at Group
level and in the individual business segments by our risk
controlling as well as our management information system.
Based on detailed monthly and quarterly financial reports,

85To our Shareholders Summary Fresenius Shares Business Segments Additional Information Management Report
deviations in earnings and assets from budget figures are
identified and analyzed. In addition to risk management, a
monitoring system has been established comprising organi-
zational processes and measures as well as internal controls
and audits.
Our risk management system is regularly evaluated and
adjusted to allow us to react early to changes in the markets,
and the current system has proven effective to date.
The international operations of the Fresenius Group ex-
pose us to a variety of currency risks. In addition, the financ-
ing of the business exposes us to certain interest rate risks.
We use derivative financial instruments as part of our risk
management to avoid the negative impacts of these risks. We
limit ourselves to non-exchange-traded, marketable instru-
ments that are used exclusively to hedge our operations and
not for trading or speculation.
The Fresenius Group’s currency and interest rate risk
management activities are based on a policy approved by the
Management Board that defines the targets, organization and
handling of the risk management processes. In particular, the
guidelines assign responsibilities for risk determination, the
execution of hedging transactions and for the regular report-
ing of risk management activities. These responsibilities are
coordinated with the management structures in the other busi-
ness areas of the Group. Hedging transactions using deriva-
tives are carried out solely by the Corporate Treasury Depart-
ment of the Fresenius Group, apart from a few exceptions
in order to adhere to foreign currency regulations, and are
subject to stringent internal controls. This ensures that the
Management Board is fully informed of all significant risks
and current hedging activities.
The functionality and effectiveness of the risk manage-
ment system is reviewed as part of the audit of the annual
financial statements. Conclusions arising from the audit are
taken into account in the ongoing refinement of our risk
management system.
Risk areas
The main risk areas to the operations of the Fresenius Group
are as follows:
Ω General economic risks
From today’s point of view, the development of the global
economy presents no significant risk to the Fresenius
Group. In 2006, we expect overall economic growth to
continue. For the Fresenius Group, we expect continued
strong demand for our life-saving and life-sustaining
products and services.
Ω Risks in the general operating framework conditions
The risk situation of each individual business segment
depends on the development of its markets. Therefore,
political, legal and financial conditions are monitored and
evaluated carefully. In addition, the continuous interna-
tionalization of the markets of the Fresenius Group re-
quires us to keep abreast of country-specific risks.
Ω Risks in the health care sector
Risks related to changes in health care market conditions
are of major importance to the Fresenius Group. The
main risks are the development of new products and ther-
apies by competitors, the financing of health care systems
and reimbursement in the health care sector. This is es-
pecially true in the United States, where a large portion of
our sales are generated, and where changes in the reim-
bursement system could have an impact on our business.
The same is valid for the hospital market in Germany. The
introduction of Diagnosis Related Groups should increase
the efficiency of hospitals while reducing expenses of the
health care system. Patients are largely assigned to hos-
pitals by the public health and pension insurers. It is espe-
cially important that the contracts with these insurers and
health care institutions are maintained. For this reason,
we not only continually monitor legislative changes but

Management Report86
pro-actively work together with governmental health care
institutions. Furthermore, our close ties with the medical
and scientific communities allow us to identify and sup-
port relevant technological innovations and keep abreast
of current developments in alternative treatment methods.
This allows us to evaluate and adjust our corporate strat-
egy if necessary.
Ω Operating risks
Ω Production, products and services
We confront potential risks in production and services
with the following measures: Compliance with product
and manufacturing regulations is ensured by quality
management systems in accordance with the internation-
ally recognized quality standards ISO 9001 and ISO 9002
and the corresponding internal standards as defined, for
example, by our quality and work procedure manuals.
Regular audits are carried out by quality management
officers at each of the group’s production sites and dialysis
clinics to test compliance with all regulations in all areas
from management and administration to production and
clinical services and patient satisfaction. Our production
facilities comply with the international “Good Manufactur-
ing Practice” (GMP) guidelines or other nationally and
internationally recognized standards. In addition, the
Quality Management and Compliance Programs docu-
ment and ensure that business is performed in line with
high ethical standards, and in accordance with official
guidelines. Internal and external audits review the legal-
ity and efficiency of our operations as well as the effec-
tiveness of our internal monitoring systems. Potential
risks, such as those arising from the start-up of a new
production site or the introduction of new technologies,
are countered through careful planning, regular analysis
and continual progress reviews. Performing medical pro-
cedures on patients in our acute and post acute care hos-
pitals presents inherent risks; operational risks include
the need for hygiene and sterile conditions. We counter-
act these risks with structured operating procedures,
continuous personnel training and patient-oriented work-
ing methods. Risks can also arise from increasing pres-
sure on our product prices and from price increases on
the procurement side. Changes in the reimbursement
guidelines or the dosages for erythropoietin (EPO), a hor-
mone used in dialysis that stimulates the production of
red blood cells, could have a significant impact on the
sales and earnings of Fresenius. A change in the procure-
ment conditions for EPO could also significantly increase
Fresenius’ costs. Reimbursement and revenues from the
administration of EPO accounted for approximately 10%
of total sales of the Fresenius Group in 2005.
Ω Research and Development
The development of new products and therapies always
carries the risk that the development target is not achieved.
Regulatory approval of new products requires compre-
hensive, cost-intensive pre-clinical and clinical studies. The
Fresenius Group spreads its risk widely by conducting
development activities in various product segments. We
also counteract risks from research and development pro-
jects by regularly analyzing and assessing development
trends and examining the progress of research projects.
We also strictly comply with the legal regulations for
clinical and chemical-pharmaceutical research and devel-
opment.
Ω Risks from the integration of acquisitions
The integration of acquisitions or potential acquisitions
carries risks that can adversely affect assets and liabilities,
financial position and results of operations of Fresenius.

87To our Shareholders Summary Fresenius Shares Business Segments Additional Information Management Report
Following an acquisition, the infrastructure of the acquired
company must be integrated while legal questions and
contractual obligations are clarified. Marketing, patient
services and logistics must also be unified. Ongoing
business processes as well as relationships with custom-
ers can be harmed by losing key managers during inte-
gration. The integration process could prove to be more
difficult and cost-intensive or last longer than expected.
Risks could arise from the operations of the newly acquired
company that Fresenius believed to be insignificant or
was unaware of. An acquisition may also prove to be less
beneficial than initially believed.
Ω Other risks
Risks in personnel marketing are not considered to be
significant. Nevertheless, the Group uses comprehensive
recruiting and personnel development programs to coun-
teract a possible shortage of skilled personnel. Fresenius
counters the general shortage of specialized hospital per-
sonnel through targeted personnel marketing measures
in order to recruit a qualified and dedicated workforce,
and thus ensure the high standards of treatment quality.
Other risks, including those in our IT systems, are also
not considered to be significant. IT risks are countered
through security measures such as controls and moni-
toring. In addition, we counter these risks with constant
investment in hardware and software as well as by im-
proving our system expertise.
Ω Financial risks
Potential financial risks that arise from exposure to foreign
currencies and interest rates are countered by a special
risk management program. Derivative financial instru-
ments are used to hedge against interest rate and foreign
currency risks. These instruments are used solely for
hedging current operations and are not allowed for trading
or speculative purposes. Further details are available on
pages 172 to 178 of the Notes. Potential financial risks
that could arise from acquisitions and investments in
property, plant and equipment and intangible assets are
assessed in advance by performing careful and in-depth
reviews, sometimes with the support of external consult-
ants. As a globally active company, Fresenius is widely
exposed to translation effects due to foreign exchange
rate fluctuations. The US dollar /euro exchange rate is of
particular importance due to our extensive US operations.
The considerable debt of Fresenius could limit its ability
to pay dividends or implement its corporate strategy.
Ω Government reimbursement payments
Fresenius is subject to comprehensive government regu-
lations in nearly all countries where it is active. This is
especially true in the United States and Germany. In addi-
tion, Fresenius must adhere to general rules of law, which
can vary from country to country. There can be far-reach-
ing legal repercussions if Fresenius fails to comply with
any of these laws or regulations. The majority of Group
revenues derives from government reimbursement pro-
grams such as the US Government, Medicare and Medicaid
reimbursement programs. Legal changes, or changes in
the reimbursement method, could affect the amount of
these payments and have a significant adverse impact
on the assets and liabilities, financial position and results
of operations of the Group.
Ω Legal risks
Risks that arise from legal issues are continually identi-
fied, analyzed and communicated.
At the beginning of 2003, a definitive agreement was
signed regarding the settlement of fraudulent conveyance
claims and all other legal matters in connection with the

Management Report88
National Medical Care transaction in 1996 arising from
the bankruptcy of W.R. Grace. Under the Settlement
Agreement, Fresenius Medical Care will pay a total of
US$ 115 million to the W.R. Grace &Co. bankruptcy estate,
or as otherwise directed by the Court, upon plan confirm-
ation. The Settlement Agreement has been approved by
the U.S. District Court. Also, the claims which were made
out of court by certain private US health insurers were
settled by an agreement. Consequently, all legal issues
resulting from the NMC transaction have been concluded.
Please see page 148 and page 169 of the Notes for details.
In October 2004, Fresenius Medical Care Holdings,
Inc., and its subsidiary Spectra Renal Management,
received subpoenas from the US Department of Justice,
Eastern District of New York. The subpoenas require pro-
duction of a broad range of documents relating to the
companies’ operations, with specific attention to docu-
ments relating to a certain hormone test and vitamin D
therapies for dialysis patients. Furthermore, in April 2005
Fresenius Medical Care Holdings, Inc. received a sub-
poena from the US Department of Justice in St. Louis
(Missouri) in connection with civil and criminal investi-
gations. Documentation must be provided on clinical
quality programs, business development activities, com-
pensation of clinic managers, contractual relationships
with doctors, joint ventures, and our anemia treatment
therapy. Please see page 170 and page 171 of the Notes
for further details.
Furthermore, the Fresenius Group is involved in
various legal issues resulting from business operations.
Although it is not possible to predict the outcome of
these disputes, none are expected to have a significant
adverse impact on the assets and liabilities, financial
position and results of operations of the Group.
Overall risk
The basis for evaluating overall risk is the risk management
system that is regularly audited by management. Potential
risks for the Group include factors outside or only partially
within its control such as the development of national and
global economies, which Fresenius constantly monitors.
Risks also include factors within its control such as operating
risks, which the Company anticipates early and reacts to
appropriately. At the current time, there are no recognizable
risks regarding future performance that appear to present a
long-term and material threat to the assets and liabilities,
financial position and results of operations of the Group. We
have created organizational structures that include all the
conditions needed to quickly alert us to emerging risk situ-
ations.
Corporate rating
The planned acquisition of Renal Care Group, Inc., which will
be entirely financed with bank debt, led to a slight adjust-
ment in the rating of Fresenius Medical Care and Fresenius
AG. Standard & Poors placed the ratings on Credit Watch and
announced it would alter the rating from BB+, watch negative,
to BB, negative outlook, when the acquisition was closed.
Moody’s lowered the ratings of Fresenius Medical Care and
Fresenius AG before the planned acquisition from Ba1 to
Ba2. The outlook is stable. Given our intention to finance the
acquisition with bank debt, we anticipated these downgrades.
The financing mix used in the acquisition of HELIOS and
the business of Clinico at the end of 2005 did not cause any
change in the ratings of Fresenius AG.

89To our Shareholders Summary Fresenius Shares Business Segments Additional Information Management Report
SUBSEQUENT EVENTS
On May 3, 2005, Fresenius Medical Care entered a contract
to acquire all of the share capital of Renal Care Group, Inc.,
a US dialysis care company, for approximately US$ 3.5 billion
in cash. Renal Care Group had preliminary revenues of US$
1.5 to 1.6 billion in 2005. Fresenius Medical Care expects to
close the acquisition in the first quarter of 2006. In February
2006, Fresenius Medical Care Holdings and Renal Care Group
entered into a definitive agreement to sell approximately 100
dialysis clinics serving an average of approximately 60 to 65
patients per clinic to National Renal Institutes, Inc. The ex-
ecution of this agreement is an important step toward con-
cluding the review by the United States Federal Trade Com-
mission (FTC) of Fresenius Medical Care’s acquisition of Renal
Care Group. The purchase price for the divested clinics is
approximately US$ 450 million to be paid in cash, subject to
post-closing adjustments to current assets and other routine
matters. For details on the financing of this acquisition please
refer to page 76 of the Management Report.
In 2005, Fresenius Medical Care also initiated a change
in its corporate structure, consisting of the conversion of the
preference shares of Fresenius Medical Care into ordinary
shares and a change of legal form into a Kommanditgesell-
schaft auf Aktien or KGaA (German partnership limited by
shares). 96% of the preference shareholders exchanged their
shares at a ratio of 1:1 and a conversion premium of € 9.75
per tendered preference share. The conversion and the change
in legal form of Fresenius Medical Care AG to a KGaA was
completed in February 2006. The company is now legally an
AG & Co. KGaA. Fresenius AG now holds 36.77% of the voting
capital of Fresenius Medical Care AG & Co. KGaA.
The change in legal form and the creation of just one share
class are strategic initiatives to broaden the future financial
flexibility of Fresenius Medical Care. With the focus on one
share class, the liquidity of the ordinary shares will increase
significantly, the share structure will be simpler and the stock
will become more attractive to investors. Only a KGaA struc-
ture allows Fresenius AG to retain its controlling position
over Fresenius Medical Care and to continue to consolidate
Fresenius Medical Care in its financial statements.
In January 2006, Fresenius issued a bond with a total value
of €1 billion through its wholly-owned subsidiary Fresenius
Finance B.V., the Netherlands. The proceeds from the bond,
together with the capital increase at the end of 2005, were
used to finance the purchase of HELIOS, to replace a € 300
million bond, 71% of which was redeemed for cash, and
for general corporate purposes.
Otherwise, no major changes in the situation of the com-
pany or our sector have occurred since the beginning of 2006.
There are also no plans for major changes to the structure,
administration or legal form of the Group or in human re-
sources. No other events of material importance have occurred
since the close of the fiscal year.
OUTLOOK
This Management Report contains forward-looking state-
ments, including statements on future sales, expenses and
investments as well as potential changes in the health care
FRESENIUS AG RATINGS
Rating Outlook
Standard & Poors BB+ watch neg.
Moody’s Ba2 stable

Management Report90
sector, our competitive environment and our financial situ-
ation. These statements were made on the basis of the ex-
pectations and assessments of the Management Board con-
cerning events that possibly could affect the company in the
future. Such forward-looking statements are subject as a
matter of course to risks, uncertainties, assumptions and
other factors, so that the actual results, including the finan-
cial position and profitability of Fresenius, could differ mater-
ially from or be more negative than those expressly or im-
plicitly assumed or described in these statements. For further
information, please see our Risks Report on page 84 f.
General outlook
The outlook remains positive for the Fresenius Group in the
coming years. The Group expects organic sales growth of
about 5 to 6% with earnings growing even faster. Within the
business segments, the acquisition of HELIOS will lead to a
stronger contribution to the Group from Fresenius ProServe.
On a pro forma basis including the HELIOS acquisition,
Fresenius ProServe would have contributed 22% of Group
sales last year rather than the reported 10%. The acquisi-
tion of HELIOS in 2005 and the planned acquisition of Renal
Care Group in 2006 will lead to a significant increase in
debt with a related impact on interest expenses. Our goal is to
further improve the debt ratios of the Group. The integration
of these acquisitions into the Group will be another focus of
our efforts this year so as to avoid potential future risks.
Economic outlook
For the year 2006, continued growth in the global economy
is expected. The United States and China will once again be
the driving forces. Economists expect GDP growth in 2006
of up to 4.0% in the United States, the world’s biggest econ-
omy, and 8.5% in China. However, these positive forecasts
could be jeopardized by further rising oil prices. Many econ-
omists believe that the growing US trade deficit could be a
major risk for the global economy, since it could lead to a
significant devaluation of the dollar.
Ω Europe
Current surveys expect a slight economic recovery among
the euro countries. Increasing corporate profits, stronger
order intake and the growing need for investments and
modernization will increase momentum for investment.
Consumer spending is expected to develop slightly better
than in 2005. The growth in exports should accelerate
if the global economy continues to grow and the euro
weakens further. At the same time, imports are likely to
rise on stronger domestic demand. The trade balance
will therefore only provide limited stimulus in 2006. Also,
the European Central Bank is expected to raise interest
rates during 2006. Overall, GDP growth of 2.1% is ex-
pected in the euro countries.
Germany’s domestic demand is still not expected to
recover substantially. A number of special effects – the
Soccer World Cup and the bringing forward of purchases
ahead of the VAT hike in 2007 – should bolster GDP.
GDP growth of 1.5% is expected in Germany in 2006.
Ω United States
Consumer spending is expected to grow more slowly in
2006 since energy prices are likely to remain high and
the Federal Reserve could make further rate hikes. High
employment and rising incomes should partially compen-
sate for these effects and help to maintain robust growth
in consumer spending. The budget deficit will widen
further in 2006 due in part to the massive public spend-
ing to repair the hurricane damages sustained in 2005.
Overall, GDP growth of about 3.75% is expected.

91To our Shareholders Summary Fresenius Shares Business Segments Additional Information Management Report
Ω Asia
Observers expect GDP growth of 7.2% in Asia (excluding
Japan) in 2006. Thanks to its highly competitive export
industry, China will continue to drive the growth but at a
slightly slower pace than in 2005. In addition, the indus-
trial economies could see stronger momentum than last
year, which will also support China’s growth. China is
expected to achieve overall economic growth of 8.5%.
The Japanese economy appears to be heading in the
right direction. The main challenge for the Japanese gov-
ernment is further budget consolidation. GDP growth in
Japan is expected to be 3.1%.
Ω Latin America
Its high foreign debt continues to be a risk for Latin
America, and it could quickly become more severe as inter-
national interest rates pick up. Sustained economic recov-
ery could also be threatened by the double-digit inflation
rates that still prevail in some countries, political uncer-
tainties from a number of parliamentary and presidential
elections as well as capital outflows. Growth in the region
should remain robust, with overall economic growth of
nearly 4.0% expected for 2006. More than 50% of Latin
America’s exports are raw materials. The development of
the raw material markets will therefore be a significant
factor for the relatively good economic outlook for Latin
American countries.
Health care sector and markets
The health care market offers us exceptional opportunities as
described below. Its three key characteristics – it is global, it is
innovation-driven and demand is steadily growing – are the
factors that drive our business. Fresenius responded to these
challenges, entering the international markets early on, and
has successfully met the growing demands of the market
with innovative and technologically superior products and
therapies.
Ω The dialysis market
We expect the number of dialysis patients to rise to ap-
proximately 2 million by 2010. For 2006, we expexct
growth of 5 to 7% although significant regional diffe-
rences are anticipated. In industrialized nations such
as the United States, Japan and the countries of Central
and Western Europe, we expect below-average patient
growth. While the population of industrialized nations
has access to dialysis treatment, the needs of patients
with chronic kidney failure are still not met sufficiently
in many developing nations, so we predict an average
growth rate in these markets of around 10%. The fact
that 80% of the world’s population lives in these growth
countries highlights the enormous potential of the dial-
ysis market in developing nations.
In addition, the reimbursement of dialysis treatment
according to quality-based criteria remains a central
issue. In this reimbursement model, the quality of treat-
ment would increase while the total cost of treating a
dialysis patient would remain constant.
Fresenius Medical Care is active in many countries
with a variety of health care systems and reimbursement
schemes. In the United States, our largest market, patients
covered by the public health insurers Medicare and
Medicaid account for about 60% of Fresenius Medical
Care’s sales. Beginning on April 1, 2006, a new guideline
will take effect that governs the treatment of dialysis
patients with anemia. To treat anemia, EPO is administered
during the dialysis treatment. The EPO dosage is deter-
mined by a patient’s hematocrit level. The new guideline
Source: Bank research, German Council of Economic Experts (Annual Report 2005/2006).

Management Report92
has increased the recommended hematocrit range for dial-
ysis patients from between 33% and 36% to 39%. The
reimbursement scheme was adjusted accordingly. At the
beginning of 2005, the reimbursement rate per dialysis
treatment (composite rate) was increased by 1.6%. At the
end of 2005 a bill was introduced in the United States
Congress proposing a further increase in the composite
rate by 1.6%. This bill became law at the beginning of
2006 and the reimbursement rate has been increased
retroactively as from January 1, 2006. A new reimburse-
ment system was developed for separately billable dialy-
sis drugs. Reimbursement was previously based on the
average wholesale price (AWP) of dialysis drugs. Now the
average sale price (ASP) plus 6% is the basis for reim-
bursement. We expect these changes will have no or a
slightly positive effect on the business of Fresenius
Medical Care.
We have identified no significant changes to the reim-
bursement schemes in the other world markets. Also, it is
not foreseeable when private companies will be allowed
to operate dialysis clinics in Germany and Japan.
Ω The market for infusion therapy and clinical nutrition
Medical advances and demographic developments will
remain the growth drivers in the health care market. Cost
pressure and health care reforms are expected in Europe,
particularly in Central and Western Europe. Despite these
trends, we forecast an increase in demand for innovative
therapies and cost-effective products. We expect mid-
single-digit growth rates in the market for infusion therapy
and clinical nutrition in Central and Western Europe. The
market for generic intravenous drugs in Europe should
see growth in the high single digits.
High growth potential continues to be presented in
the regions of Asia-Pacific, Latin America and Eastern
Europe. Increasing demand for primary care in hospitals,
which creates higher demand for medical products, will
result in strong growth rates in many of these countries.
In Eastern Europe and among the new EU countries, we
foresee market growth in the high single digits. Growth is
expected to continue at a double-digit rate in Asia-Pacific
and Latin America, with sharply increasing demand for
medical devices. The strong interest in improving primary
health care in these regions will not diminish in the
coming years.
Ω The German hospital market
Pressure on the profitability and transparency of the Ger-
man hospital market will continue to increase in the
coming years. Growing competition, especially in per-
formance and quality, will require significant structural
changes in hospitals. Strained public finances limit the
ability of public hospitals to rationalize and invest in
modernization, which impairs their competitiveness.
However, private hospital chains and alliances are able
to respond better to the pressure to improve profitability.
They have more experience, enabling them to improve
the efficiency of structures and processes and to achieve
cost benefits in procurement. In addition, they are gener-
ally better placed to finance the necessary investments.
Therefore, the privatization of public hospitals is expected
to further accelerate.
Private hospital operators forecast further growth
opportunities through the acquisition of public institu-
tions. Overall, experts expect the market share of private
operators to increase from 25% currently to about 40%
in 2020. The average hospital stay should decrease by
another 20% to approximately seven days in 2020.
Source: Krankenhaus Barometer Survey 2005, Allianz Group

93To our Shareholders Summary Fresenius Shares Business Segments Additional Information Management Report
Group sales
With its international production and sales platform and its
market-oriented products the Fresenius Group is ideally pos-
itioned for continued growth. In addition, the developments
described in the chapter “Health care sector and markets”
provide a solid basis. In 2006, we expect to increase Group
sales to approximately €10.5 billion at 2005 exchange rates.
Much of the sales growth this year will be due to the first-
time consolidation of Renal Care Group and the inclusion of
HELIOS in the statement of income. So organic growth needs
to be mentioned separately. For 2006, this should be in the
region of 5 to 6%.
While our traditional markets in Europe and North America
are growing at low to mid-single digit rates, we expect to see
continued stronger expansion in the Asia-Pacific and Latin
America regions. This will also be reflected in the develop-
ment of sales: while we expect single-digit rates of growth in
our major markets of the United States and Europe, sales in
the growth regions should increase at double-digit rates.
Group earnings
We again expect a significant increase in Group net income
in 2006 due to sustained sales growth and ongoing cost-
saving measures, with a special focus on production. Fur-
thermore, acquisitions are expected to contribute to this
increase.
Net income is projected to grow by more than 30% in
constant currency despite the cost-cutting and price pressure
in the market. The net income guidance already includes an
amount of € 30 million (after tax) associated with expected
one-time expenses for the integration of Renal Care Group
and the refinancing of debt as well as for costs related to the
change of accounting principles for stock options. Due to
the higher number of shares issued in December 2005, earn-
ings per share are projected to increase by approximately
10% in constant currency.
Sales and Earnings of the Business Segments
Overall, we expect good improvements in sales and earnings
in 2006 in each of our business segments: The number of
dialysis patients should rise by about 5 to 7% in 2006, lead-
ing to a continued growth in demand for dialysis products
and a higher number of treatments. For the full year 2006,
Fresenius Medical Care expects revenue growth at constant
currencies of approximately 25% on a pro forma basis,
giving effect to the RCG merger as compared to 2005 reported
revenues. Pro forma amounts assume consolidation of RCG’s
operations into Fresenius Medical Care for the full twelve
months of 2006. For the full year 2006, Fresenius Medical
Care expects to report revenue of more than US$ 8 billion.
Fresenius Medical Care’s projected net income growth on a
pro forma basis for 2006 is expected to be between 10 and
15%, based on the US$ 472 million net income excluding one-
time costs achieved in 2005. This guidance does not take
into effect any expected one-time items and the change of
accounting principles for stock options. Fresenius Medical
Care expects the after tax impact of the one-time items and the
change of accounting principles to be around US$ 50 million.
Fresenius Kabi expects the positive development to con-
tinue in 2006. Sales are expected to increase about 10% in
constant currency. The Asia-Pacific and Latin America regions
are projected to continue their growth pattern. The first-time
consolidation of Clinico in the statement of income and the
consolidation of Pharmatel will also have a positive effect on
sales. Pharmatel is an Australian company, in which Fresenius
Kabi increased its stake from 25.1% to 50.1% at the begin-
ning of 2006. The projected sales growth combined with cost
optimizations will result in a significant earnings improve-
ment in 2006. Fresenius Kabi’s EBIT margin is projected to
increase to 14.5 to 15.0%.

Management Report94
At Fresenius ProServe, the statement of income will be sig-
nificantly affected by the first-time consolidation of HELIOS
Kliniken in the statement of income. We will concentrate on
improving earnings in our hospital operations business. More-
over, we will see growth in our engineering and services busi-
ness due to the excellent order intake development. On a pro
forma basis, Fresenius ProServe achieved sales of €2,009
million and EBIT of €125 million in 2005. For 2006, Fresenius
ProServe expects an organic sales growth of 1 to 3% based
on 2005 sales of € 2,009 million. Projected EBIT will be be-
tween € 140 million and € 150 million.
Fresenius Biotech will continue its clinical study program.
For 2006, Fresenius Biotech’s activities should lead to EBIT
in the range of € -45 to -50 million. This increase is largely
due to the expanded clinical study program.
Financing
In 2005, we generated a solid operating cash flow thanks to
the good development of earnings and the further improve-
ment in receivables management. The cash flow margin came
to 9.9%. For 2006, we anticipate a sustainable high cash
flow. The cash flow margin, however, is expected to be below
the 2005 figure.
A key figure for the Fresenius Group is the net debt /
EBITDA ratio. On December 31, 2005 this ratio stood at 2.3,
adjusted by the EBITDA of HELIOS (see page 82 of the Man-
agement Report). This figure will climb to about 3.5 in 2006
because of the fully debt financed Renal Care Group acquisi-
tion. Our goal is to reach a ratio of < 3.0 by 2008. We will con-
centrate on increasing earnings and on a continued strong
cash flow and debt reduction. Selected acquisitions must meet
our profitability criteria.
Overall, we have sufficient financial cushion with syndi-
cated credit lines, an only partially utilized receivables securi-
tization program at Fresenius Medical Care, the unused
portion of the commercial paper program and substantial
open bilateral credit lines available from banks. On December
31, 2005, the Fresenius Group had a commercial paper pro-
gram of € 250 million, of which only € 22 million was used,
as well as substantial open bilateral credit lines at its disposal.
Investments
Fresenius is planning to invest in further growth and to in-
crease investment spending. In 2006, investments in prop-
erty, plant and equipment and intangible assets are projected
to increase to approximately € 550 to 600 million (2005:
€ 353 million). The bulk will be invested at Fresenius Medical
Care and Fresenius ProServe, with Fresenius Medical Care
accounting for about two-thirds and Fresenius Kabi and
Fresenius ProServe for the remaining third. The focus of the
investments at Fresenius Medical Care will be on the con-
struction and expansion of dialysis clinics as well as on the
expansion and maintenance of production sites. Investments
at Fresenius Kabi will also be used to expand and maintain
production plants and introduce new manufacturing technolo-
gy. At Fresenius ProServe we will invest primarily in the
modernization and equipment of hospitals. The regional focus
of the investments will be on Europe and North America,
each with around 45%. The remainder will be invested in
Asia, Latin America and Africa. About 30% of the funds will
be invested in Germany.
Procurement
Procurement optimization, including price and conditions
as well as product quality, is an important component of earn-
ings growth. We will also focus on optimizing the procure-
ment process as well as the cooperation between individual
sites. Procurement alliances across various sectors will
allow us to increase purchasing volumes and strengthen our
negotiation position with our suppliers.

95To our Shareholders Summary Fresenius Shares Business Segments Additional Information Management Report
In 2006, a key project at Fresenius Medical Care will be to
ensure a constant supply of plastics. We will identify several
suppliers per product to guarantee a steady flow of the high-
quality materials we require. Because suppliers of inter-
mediate petroleum-based products adjust their prices every
quarter, we expect the prices of these products to fluctuate.
We project a significant price increase in energy and media
for 2006.
Fresenius Kabi will also increase its use of the Asian pro-
curement market. This will lower prices for materials such as
amino acids and related raw materials. However, considerably
higher prices for energy and energy-related products such as
glass containers will have a noticeable impact.
Research and Development
Our R&D activities will continue to play a key role in securing
the Group’s long-term growth through innovative and new
therapies. We are concentrating our R&D on products for the
treatment of patients with chronic kidney failure with an
emphasis on dialysis membranes and other products, and on
dialysis machines. We are also focusing on other extracor-
poreal therapies, such as the treatment of patients with liver
disease, as well as on alternative anticoagulants. Another
focus is research on infusion and nutrition therapies. We are
also concentrating on targeted development in the biotech-
nology sector in the field of antibody therapies where we
expect results from clinical studies in 2006.
We are planning to invest more in R&D in 2006. The in-
crease should be higher than the forecast organic growth in
sales. The number of employees in research and develop-
ment will also be increased.
Market-oriented R&D with strict time-to-market manage-
ment processes is crucial to the success of new products. We
continually review our R&D results based on clearly-defined
milestones.
Innovative ideas, product development and therapies with
a high level of quality will continue to be the basis for our
market-leading products.
Corporate legal structure and organization
The Fresenius Group is divided into three business segments,
each of which is a legally independent entity. The business
segments are organized on a regional and decentralized basis
to provide the greatest flexibility to meet the demands of
their respective markets. The “entrepreneur in the enterprise”
principle with clearly defined responsibilities has proven
itself over many years. We will continue to follow this princi-
ple. We are not planning to change Fresenius’ legal structure.
Planned changes in human resources and the social area
The number of employees in the Group will top the 100,000
mark in 2006 when the employees of Renal Care Group are
included for the first time. Almost 50% of the employees
will be located in Europe, about 40% in North America and
approximately 10% in Asia-Pacific, Latin America and Africa.
The number of employees in our traditional businesses will
also be increased in order to achieve our organic growth
targets but the rate of increase will be below the expected
organic sales growth.
Dividend
Continuity in our dividend policy remains an important pri-
ority. This has been demonstrated impressively by steady divi-
dend increases over the last twelve years. Also for the fiscal
year 2006, we want to remain true to this policy and offer our
shareholders a dividend in line with our positive earnings
forecasts.

Held by Sales Profit/Loss1) EquityFresenius 2005 2005 Dec 31, 2005 Employees
Company in % in million US$ in million US$ in million US$ Dec 31, 2005
Europe
1 Fresenius Medical Care AG shareholdings: 36.40 6,772 455 3,973.7 50,250Hof an der Saale, Germany share of votes: 50.762)
(sub-group/US GAAP)
Held by Sales Profit/Loss1) EquityFresenius 2005 2005 Dec 31, 2005 Employees
Company in % in million € in million € in million € Dec 31, 2005
Europe
2 Fresenius Kabi Deutschland GmbH 100 509.7 – 314.5 1,659Bad Homburg v.d.H., Germany(with profit transfer agreement)
3 Fresenius HemoCare Deutschland GmbH 100 28.3 – 9.1 162Bad Homburg v.d.H., Germany(with profit transfer agreement)
4 MC Medizintechnik GmbH 100 26.6 – 2.2 92Alzenau, Germany(with profit transfer agreement)
5 V. Krütten Medizinische Einmalgeräte GmbH 100 16.2 – 2.3 119Idstein, Germany(with profit transfer agreement)
6 Pharmaplan Group 100 82.5 4.03) 16.0 464Bad Homburg v.d.H., Germany
7 Wittgensteiner Kliniken Group 100 349.6 -9.4 73.8 6,983Bad Berleburg, Germany
8 Fresenius Kabi France S.A.S. 100 118.3 1.2 27.7 552Sèvres, France
9 Fresenius Vial S.A.S. 100 49.5 3.5 20.0 232Brézins, France
10 Calea France S.A.S. 100 17.8 0.2 1.2 129Sèvres, France
11 Fresenius Kabi Italia S.p.A. 100 61.9 0.5 46.8 271Verona, Italy
12 Fresenius HemoCare Italia S.r.l. 100 39.4 0.3 7.9 180Medolla/Modena, Italy
13 Fresenius Kabi España S.A. 100 47.8 2.6 21.4 183Barcelona, Spain
14 Labesfal – Laboratório de Especialidades Farmacêuticas Almiro S.A. 100 62.0 13.6 47.7 364Campo de Besteiros, Portugal
15 Fresenius Kabi Ltd. 100 102.0 3.1 5.6 303Basingstoke/Hampshire, Great Britain
KEY FIGURES OF MAJOR AFFILIATED COMPANIES
Major Affiliated Companies96

Held by Sales Profit/Loss1) EquityFresenius 2005 2005 Dec 31, 2005 Employees
Company in % in million € in million € in million € Dec 31, 2005
Europe
16 Fresenius Kabi Austria GmbH 100 162.0 20.4 57.2 546Graz, Austria
17 VAMED Group 77 367.6 15.7 78.1 1,884Vienna, Austria
18 Fresenius Kabi (Schweiz) AG 100 19.8 0.6 4.6 47Stans, Switzerland
19 Fresenius HemoCare Netherlands B.V. 100 114.7 3.5 29.8 1,127Emmen, The Netherlands
20 Fresenius Kabi Nederland B.V. 100 20.1 1.9 2.0 13‘s-Hertogenbosch, The Netherlands
21 Fresenius Kabi N.V. 100 27.9 -0.5 2.4 39Schelle, Belgium
22 Fresenius Kabi Norge A.S. 100 57.9 7.6 20.5 378Halden, Norway
23 Fresenius Kabi AB 100 170.1 14.9 174.8 745Stockholm, Sweden
24 Fresenius Kabi Polzka Sp.Z.o.o. 100 19.5 -0.5 12.1 231Warsaw, Poland
25 Fresenius Kabi S.r.o. 100 18.6 -0.8 3.3 186Prague, Czech Republic
America
26 Calea Ltd. 100 69.8 5.2 11.4 275Toronto, Canada
27 Grupo Fresenius México S.A. de C.V. 100 29.0 3.6 28.5 503Guadalajara, Mexico
28 Fresenius Kabi Brasil Ltda. 100 40.8 -0.8 7.1 1,036Campinas/São Paulo, Brazil
Asia
29 Sino-Swed Pharmaceutical Corporation Ltd. 51 58.5 12.8 50.7 992Wuxi, China
30 Beijing Fresenius Kabi Pharmaceutical Co., Ltd. 100 45.6 5.8 25.2 451Beijing, China
31 Fresenius Kabi Korea Ltd. 100 21.9 0.6 6.2 104Yongin, Korea
Africa
32 Fresenius Kabi South Africa Ltd. 100 67.1 10.1 42.4 501Midrand, South Africa
1) net income/loss2) In February 2006, 96% of all outstanding Fresenius Medical Care preference shares were tendered into ordinary shares and the transformation of the company’s legal form into a KGaA became
effective. Fresenius AG owns 36.77% of the voting ordinary shares of Fresenius Medical Care AG & Co. KGaA.3) € 0.1 million before loss transfer according to profit and loss transfer agreement
The complete list of investment holdings will be filed with the Commercial Register of the District Court of Bad Homburg v.d.H.
Affiliated Companies Consolidated Financial Statements Report Supervisory Board Supervisory Board Glossary Index 97

Consolidated Financial Statements98
99 Consolidated statement of income
100 Consolidated balance sheet
102 Consolidated cash flow statement
104 Consolidated statement of shareholders’ equity
106 Segment reporting
110 Notes
99
CONTENTS

Affiliated Companies Consolidated Financial Statements Report Supervisory Board Supervisory Board Glossary Index 99
CONSOLIDATED STATEMENT OF INCOME
January 1 to December 31, in million € Note 2005 2004
Sales 3 7,889 7,271
Cost of goods sold 4 -5,200 -4,895
Gross profit 2,689 2,376
Selling, general and administrative expenses 6 -1,571 -1,398
Research and development expenses -149 -133
Operating income (EBIT) 969 845
Interest income 7 20 15
Interest expenses 7 -223 -224
Earnings before income taxes and minority interest 766 636
Income taxes 8 -298 -253
Minority interest 21 -246 -215
Net income 222 168
Basic earnings per ordinary share in € 9 5.28 4.08
Fully diluted earnings per ordinary share in € 9 5.24 4.07
Basic earnings per preference share in € 9 5.31 4.11
Fully diluted earnings per preference share in € 9 5.27 4.10
The following Notes are an integral part of the Consolidated Financial Statements.

Consolidated Balance Sheet100
CONSOLIDATED BALANCE SHEET
ASSETS
as of December 31, in million € Note 2005 2004
Cash and cash equivalents 10 252 140
Trade accounts receivable, less allowances
for doubtful accounts 11 1,871 1,528
Accounts receivable and loans from related parties 15 17
Inventories 12 727 619
Prepaid expenses and other current assets 13 478 283
Deferred taxes 8 188 168
I. Total current assets 3,531 2,755
Property, plant and equipment 14 2,356 1,696
Goodwill 15 4,680 2,905
Other intangible assets 15 541 480
Other non-current assets 13 359 234
Deferred taxes 8 127 118
II. Total non-current assets 8,063 5,433
Total assets 11,594 8,188

Affiliated Companies Consolidated Financial Statements Report Supervisory Board Supervisory Board Glossary Index 101
LIABILITIES AND SHAREHOLDERS’ EQUITY
in million € Note 2005 2004
Trade accounts payable 353 273
Short-term accounts payable to related parties 2 1
Short-term accrued expenses and other current liabilities 16, 17 1,522 986
Short-term borrowings 18 224 391
Short-term liabilities and loans from related parties 1 2
Current portion of long-term debt and capital lease obligations 18 222 190
Accruals for income taxes 146 195
Deferred taxes 8 27 18
A. Total short-term liabilities 2,497 2,056
Long-term debt and capital lease
obligations, less current portion 18 2,055 1,219
Long-term liabilities and loans from related parties – –
Long-term accrued expenses and other long-term liabilities 16, 17 304 160
Pension obligations 19 305 228
Deferred taxes 8 303 245
Trust preferred securities of Fresenius Medical Care Capital Trusts 20 1,000 933
B. Total long-term liabilities 3,967 2,785
I. Total liabilities 6,464 4,841
II. Minority interest 21 2,289 1,744
Subscribed capital 22 130 105
Capital reserve 1,546 645
Other reserves 1,061 895
Accumulated other comprehensive income (loss) 23 104 -42
III. Total shareholders’ equity 2,841 1,603
Total liabilities and shareholders’ equity 11,594 8,188
The following Notes are an integral part of the Consolidated Finanical Statements.

Consolidated Cash Flow Statement102
CONSOLIDATED CASH FLOW STATEMENT
January 1 to December 31, in million € Note 2005 2004
Cash provided by/used for operating activities
Net income 222 168
Minority interest 21 246 215
Adjustments to reconcile net income to cash and
cash equivalents provided by operating activities
Cash inflow from hedging 0 12
Depreciation and amortization 320 315
Gain from sale of investments 0 -14
Change in deferred taxes 10 25
Gain/loss on sale of fixed assets 7 -1
Change in assets and liabilities, net of amounts
from businesses acquired or disposed of
Change in trade accounts receivable, net 11 -42 -20
Change in inventories 12 -12 9
Change in prepaid expenses and other current and non-current assets 13 -101 100
Change in accounts receivable from/payable to related parties 6 4
Change in trade accounts payable,
accruals and other short-term and long-term liabilities 195 36
Change in accruals for income taxes -71 2
Cash provided by operating activities 780 851
Cash provided by/used for investing activities
Purchase of property, plant and equipment -353 -308
Proceeds from the sale of property, plant and equipment 22 22
Purchase of shares in related companies and investments, net 2, 26 -1,608 -100
Proceeds from the sale of shares in related companies and investments, net 26 2 10
Cash used for investing activities -1,937 -376

Affiliated Companies Consolidated Financial Statements Report Supervisory Board Supervisory Board Glossary Index 103
in million € Note 2005 2004
Cash provided by/used for financing activities
Proceeds from short-term borrowings 18 37 87
Repayments of short-term borrowings 18 -70 -77
Proceeds from short-term and long-term borrowings from related parties 0 1
Repayments of short-term and long-term borrowings from related parties -4 -1
Proceeds from long-term debt and capital lease obligations 18 945 607
Repayments of long-term debt and capital lease obligations 18 -310 -1,096
Changes of accounts receivable facility 18 -194 143
Proceeds from exercise of stock options 90 3
Dividends paid -132 -122
Proceeds from issuance of bearer ordinary shares 22 438 0
Proceeds from issuance of bearer preference shares 22 481 0
Payments of additional costs of capital increase 22 -22 0
Change in minority interest 21 -1 –
Payments on hedge contracts for intercompany loans in foreign currency -2 -3
Cash provided by/used for financing activities 1,256 -458
Effect of exchange rate changes on cash and cash equivalents 13 -2
Net increase in cash and cash equivalents 112 15
Cash and cash equivalents at the beginning of the year 10 140 125
Cash and cash equivalents at the end of the year 10 252 140
The following Notes are an integral part of the Consolidated Financial Statements.

Consolidated Statement of Shareholders’ Equity104
CONSOLIDATED STATEMENT OF SHAREHOLDERS’ EQUITY
Ordinary shares Preference shares Subscribed capital
Number Numberof shares Amount of shares Amount Amount Amount
in million € Note (thousand) (thousand €) (thousand) (thousand €) (thousand €) (million €)
As of December 31, 2003 20,485 52,441 20,485 52,441 104,882 105
Issuance of bearer ordinary and bearer preference shares 22
Proceeds from exercise of stock options 28 1 2 1 2 4 –
Compensation expense related to stock options 28
Dividends paid 22
Comprehensive income (loss)
Net income
Other comprehensive income (loss) related to
Cash flow hedges 23, 25
Foreign currency translation 23
Minimum pension liability 19, 23
Comprehensive income (loss)
As of December 31, 2004 20,486 52,443 20,486 52,443 104,886 105
Issuance of bearer ordinary and bearer preference shares 22 4,700 12,032 4,700 12,032 24,064 24
Proceeds from the exercise of stock options 28 175 449 175 449 898 1
Compensation expense related to stock options 28
Dividends paid 22
Comprehensive income (loss)
Net income
Other comprehensive income (loss) related to
Cash flow hedges 23, 25
Foreign currency translation 23
Minimum pension liability 19, 23
Comprehensive income (loss)
As of December 31, 2005 25,361 64,924 25,361 64,924 129,848 130

Affiliated Companies Consolidated Financial Statements Report Supervisory Board Supervisory Board Glossary Index 105
Reserves Other comprehensive income (loss)
ForeignCapital Other currency Cash flow
in million € Note reserve reserves translation hedges Pensions Total
As of December 31, 2003 644 778 40 4 -35 1,536
Issuance of bearer ordinary and bearer preference shares 22 0
Proceeds from exercise of stock options 28 – –
Compensation expense related to stock options 28 1 1
Dividends paid 22 -51 -51
Comprehensive income (loss)
Net income 168 168
Other comprehensive income (loss) related to
Cash flow hedges 23, 25 -22 -22
Foreign currency translation 23 -20 -20
Minimum pension liability 19, 23 -9 -9
Comprehensive income (loss) 0 168 -20 -22 -9 117
As of December 31, 2004 645 895 20 -18 -44 1,603
Issuance of bearer ordinary and bearer preference shares 22 872 896
Proceeds from the exercise of stock options 28 25 26
Compensation expense related to stock options 28 4 4
Dividends paid 22 -56 -56
Comprehensive income (loss)
Net income 222 222
Other comprehensive income (loss) related to
Cash flow hedges 23, 25 32 32
Foreign currency translation 23 141 141
Minimum pension liability 19, 23 -27 -27
Comprehensive income (loss) 0 222 141 32 -27 368
As of December 31, 2005 1,546 1,061 161 14 -71 2,841
The following Notes are an integral part of the Consolidated Financial Statements.

Segment Reporting106
Fresenius Medical Care Fresenius Kabi
in million € 2005 2004 Change 2005 2004 Change
Sales 5,443 5,007 9% 1,681 1,491 13%
thereof contribution to consolidated sales 5,418 4,979 9% 1,651 1,465 13%
thereof intercompany sales 25 28 -11% 30 26 15%
contribution to consolidated sales 69 % 69 % 21% 20%
EBITDA 957 872 10% 318 258 23%
Depreciation and amortization 202 187 8% 84 82 2%
EBIT 755 685 10% 234 176 33%
Net interest -139 -147 5% -51 -46 -11%
Net income 366 323 13% 111 79 41%
Operating cash flow 539 665 -19% 237 170 39%
Cash flow before acquisitions and dividends 300 456 -34% 167 121 38%
Debt 1,857 1,820 2% 903 709 27%
Total assets 6,767 5,845 16% 1,867 1,518 23%
Capital expenditure 253 224 13% 77 55 40%
Acquisitions 108 96 13% 274 13 --
Research and development expenses 41 41 0% 64 56 14%
Employees (per capita on balance sheet date) 50,250 46,949 7% 14,453 11,577 25%
Key figures
EBITDA margin 17.6% 17.4% 18.9% 17.3%
EBIT margin 13.9% 13.7% 13.9% 11.8%
ROOA 12.6% 11.8% 14.5% 13.4%
Depreciation and amortization in % of sales 3.7% 3.7% 5.0% 5.5%
SEGMENT REPORTINGby business segments

Affiliated Companies Consolidated Financial Statements Report Supervisory Board Supervisory Board Glossary Index 107
Fresenius ProServe Corporate/Other Fresenius Group
2005 2004 Change 2005 2004 Change 2005 2004 Change
809 813 0% -44 -40 -10% 7,889 7,271 8%
804 811 -1% 16 16 0% 7,889 7,271 8%
5 2 150% -60 -56 -7% 0 0
10% 11% 0% 0% 100% 100%
45 39 15% -31 -9 -- 1,289 1,160 11%
25 30 -17% 9 16 -44% 320 315 2%
20 9 122% -40 -25 -60% 969 845 15%
-10 -11 9% -3 -5 40% -203 -209 3%
2 -10 120% -257 -224 -15% 222 168 32%
19 23 -17% -15 -7 -114% 780 851 -8%
7 -1 -- -25 -11 -127% 449 565 -21%
229 222 3% 513 -16 -- 3,502 2,735 28%
2,859 742 -- 101 83 22% 11,594 8,188 42%
12 25 -52% 11 4 -- 353 308 15%
1,507 4 -- 5 0 -- 1,894 113 --
1 0 -- 43 36 19% 149 133 12%
26,664 9,398 184% 604 570 6% 91,971 68,494 34%
5.6% 4.8% 16.3% 16.0%
2.5% 1.1% 12.3% 11.6%
3.6% 1.5% 11.7% 11.1%
3.1% 3.7% 4.1% 4.3%
The segment reporting is integral part of the Notes.The following Notes are an integral part of the Consolidated Financial Statements.

Segment Reporting108
by region
Europe North America
in million € 2005 2004 Change 2005 2004 Change
Sales 3,032 2,802 8% 3,746 3,478 8%
contribution to consolidated sales 38% 39% 47% 48%
EBIT 337 295 14% 522 478 9%
Depreciation and amortization 170 182 -7% 112 102 10%
Total assets 5,784 3,269 77% 4,747 4,046 17%
Capital expanditure 179 145 23% 141 132 7%
Acquisitions 1,791 41 -- 62 52 19%
Employees (per capita on balance sheet date) 48,169 27,373 76% 31,031 29,690 5%
SEGMENT REPORTING

Affiliated Companies Consolidated Financial Statements Report Supervisory Board Supervisory Board Glossary Index 109
Asia-Pacific Latin America Africa Fresenius Group
2005 2004 Change 2005 2004 Change 2005 2004 Change 2005 2004 Change
557 547 2% 354 272 30% 200 172 16% 7,889 7,271 8%
7% 7% 5% 4% 3% 2% 100% 100%
59 36 64% 31 19 63% 20 17 18% 969 845 15%
22 19 16% 14 10 40% 2 2 0% 320 315 2%
556 472 18% 431 330 31% 76 71 7% 11,594 8,188 42%
14 14 0% 17 13 31% 2 4 -50% 353 308 15%
33 15 120% 7 0 -- 1 5 -80% 1,894 113 --
4,296 3,633 18% 7,772 7,126 9% 703 672 5% 91,971 68,494 34%
The segment reporting is integral part of the Notes.The following Notes are an integral part of the Consolidated Financial Statements.
111
140
167134
CONTENTS
Notes110
111 1. Principles
111 I. Group structure
112 II. Transformation of Fresenius Medical
Care AG’s legal form and conversion of
its preference shares
114 III. Basis of presentation
114 IV. Summary of significant accounting
policies
126 V. Critical accounting policies
129 2. Acquisitions and divestitures
134 NOTES ON THE CONSOLIDATED
STATEMENT OF INCOME
134 3. Sales
134 4. Cost of sales
134 5. Personnel expenses
135 6. Selling, general and administrative
expenses
135 7. Net interest
136 8. Income taxes
139 9. Earnings per share
140 NOTES ON THE CONSOLIDATED
BALANCE SHEET
140 10. Cash and cash equivalents
140 11. Trade accounts receivable
140 12. Inventories
141 13. Prepaid expenses and other current and
non-current assets
142 14. Property, plant and equipment
143 15. Goodwill and other intangible assets
146 16. Other accrued expenses
149 17. Other liabilities
149 18. Debt and capital lease obligations
156 19. Pensions and similar obligations
162 20. Trust preferred securities
163 21. Minority interest
163 22. Shareholders’ equity
166 23. Other comprehensive income (loss)
167 OTHER NOTES
167 24. Commitments and contingent liabilities
172 25. Financial instruments
178 26. Supplementary information
on cash flow statement
179 27. Notes on segment reporting
183 28. Stock options
189 29. Additional information relating
to the Management Board and the
Supervisory Board
190 30. Related party transactions
191 31. Fees for the auditor
191 32. Subsequent events
192 33. Corporate Governance
192 34. Proposal for the distribution of earnings

Affiliated Companies Consolidated Financial Statements Report Supervisory Board Supervisory Board Glossary Index 111
1. PRINCIPLES
I. Group structure
Fresenius is a health care Group with products and services for dialysis, the hospital and the medical
care of patients at home. Further areas of activity are hospital operations as well as engineering and
services for hospitals and the pharmaceutical industry. In addition to the activities of the Fresenius AG,
the operating activities are split into the following legally-independent business segments (sub-
groups) as of December 31, 2005:
Ω Fresenius Medical Care Ω Fresenius Kabi Ω Fresenius ProServe
Fresenius Medical Care is the world’s leading provider of dialysis products and dialysis care for the
life-saving treatment of patients with chronic kidney failure. Fresenius Medical Care treats about
131,450 patients in its own dialysis clinics.
Fresenius Kabi is Europe’s leading company in the field of infusion therapy and clinical nutrition
with subsidiaries and distributors worldwide. Fresenius Kabi’s products are used in hospitals as well
as in out-patient medical care. Within the scope of this care chain, the company offers products for
fluid and blood volume replacement, generic intravenously administered drugs, parenteral and enteral
nutrition products and medical devices. Fresenius Kabi is also a leading provider of transfusion
technology products in Europe.
Fresenius ProServe focuses on hospital operations as well as on engineering and services for hospi-
tals, health care facilities and the pharmaceutical industry.
Fresenius AG continued to own 50.76% of the ordinary voting shares of Fresenius Medical Care AG
at the end of the 2005 fiscal year. Fresenius AG’s share of the total subscribed capital of Fresenius
Medical Care AG (ordinary and preference shares) continued to be 36.4% at December 31, 2005.
Fresenius AG continued to hold 100% of the management companies of the business segments
Fresenius Kabi (Fresenius Kabi AG) and Fresenius ProServe (Fresenius ProServe GmbH) on Decem-
ber 31, 2005.
In addition, Fresenius AG holds interests in companies with holding functions regarding real estate,
financing and insurance, as well as in Fresenius Netcare GmbH which offers services in the field of
information technology and in Fresenius Biotech Beteiligungs GmbH.

Notes112
The reporting currency in the Fresenius Group is the euro. In order to make the presentation clearer,
amounts are mostly shown in million euros. Amounts which are lower than one million euros after
they have been rounded are marked with “–”.
II. Transformation of Fresenius Medical Care AG’s legal form and conversion of its preference
shares
On February 10, 2006, Fresenius Medical Care completed a transformation of its legal form under
German law as approved by its shareholders during an Extraordinary General Meeting held on
August 30, 2005 (EGM). Upon registration of the transformation of legal form in the commercial
register of the local court in Hof an der Saale, on February 10, 2006, Fresenius Medical Care AG’s
legal form was changed from a stock corporation (Aktiengesellschaft) to a partnership limited by
shares (Kommanditgesellschaft auf Aktien) with the name Fresenius Medical Care AG & Co. KGaA
(FMC-AG & Co. KGaA). Fresenius Medical Care as a KGaA is the same legal entity under German
law, rather than a successor to the AG. Fresenius Medical Care Management AG, a subsidiary of
Fresenius AG, the majority voting shareholder of Fresenius Medical Care AG prior to the transfor-
mation, is the general partner of FMC-AG & Co. KGaA. Upon effectiveness of the transformation
of legal form, the share capital of Fresenius Medical Care AG became the share capital of FMC-
AG & Co. KGaA, and persons who were shareholders of Fresenius Medical Care AG became share-
holders of FMC-AG & Co. KGaA.
This transformation has no impact on the consolidation of Fresenius Medical Care in the consolidated
financial statement of the Fresenius Group.
In conjunction with the transformation of legal form, Fresenius Medical Care AG offered holders of its
non-voting preference shares (including preference shares represented by American Depositary
Shares (ADSs)) the opportunity to convert their shares into ordinary shares at a conversion ratio of
one preference share plus a conversion premium of € 9.75 per ordinary share. The conversion was
completed on February 10, 2006.
Several ordinary shareholders challenged the resolutions adopted at the EGM approving the con-
version of the preference shares into ordinary shares, the adjustment of the employee participation
programs, the creation of authorized capital and the transformation of the legal form of Fresenius
Medical Care AG with the objective of having the resolutions declared null and void. On December
19, 2005 Fresenius Medical Care AG and the claimants agreed to a settlement with the participation
of Fresenius AG and Fresenius Medical Care Management AG and all proceedings were terminated.

Affiliated Companies Consolidated Financial Statements Report Supervisory Board Supervisory Board Glossary Index 113
Pursuant to the settlement Fresenius Medical Care Management AG undertook to (i) make an ex
gratia payment to the ordinary shareholders of Fresenius Medical Care (other than Fresenius AG), of
€ 0.12 for every share issued as an ordinary share up to August 30, 2005 and (ii) to pay to ordinary
shareholders who, at the EGM of August 30, 2005, voted against the conversion proposal, an additional
€ 0.69 per ordinary share. Ordinary shareholders who were shareholders at the close of business on
the day of registration of the conversion and transformation with the commercial register were entitled
to a payment under (i) above. Ordinary shareholders who voted against the conversion resolution
in the extraordinary general meeting on August 30, 2005, as evidenced by the voting cards held by
Fresenius Medical Care AG, were entitled to a payment under (ii) above, but only in respect of shares
voted against the conversion resolution. The right to receive payment under (ii) will lapsed as to any
shareholder who does not make a written claim for payment with Fresenius Medical Care by Feb-
ruary 28, 2006.
Fresenius Medical Care also agreed to bear court fees and shareholder legal expenses in connection
with the settlement.
The total costs of the settlement are estimated to be approximately € 5.9 million. A further part of
the settlement agreement and German law require that these costs be borne by Fresenius AG and
Fresenius Medical Care Management AG.
As part of the settlement, Fresenius Medical Care, with the participation of Fresenius AG and the
general partner, Fresenius Medical Care Management AG, also agreed to establish, at the first ordinary
general meeting after registration of the transformation of legal form, a joint committee (the Joint
Committee) (gemeinsamer Ausschuss) of the supervisory boards of Fresenius Medical Care Manage-
ment AG and FMC-AG & Co. KGaA with authority to advise and decide on certain significant transac-
tions between FMC-AG & Co. KGaA and Fresenius AG and to approve certain significant acquisitions,
dispositions, spin-offs and similar matters. FMC-AG & Co. KGaA also agreed to establish an Audit
and Corporate Governance Committee of the FMC-AG & Co. KGaA Supervisory Board to review the
report of the general partner on relations with related parties and report to the overall supervisory
board thereon.

Notes114
III. Basis of presentation
The accompanying consolidated financial statements have been prepared in accordance with the
United States Generally Accepted Accounting Principles (US GAAP).
From January 1, 2005 on, Fresenius AG as a stock exchange listed company in a member state of the
European Union has to prepare and to publish the consolidated financial statements in accordance
with the International Financial Reporting Standards (IFRS) applying § 315a of the German Commer-
cial Code (HGB). The Fresenius Group continues to prepare and publish the consolidated financial
statements in accordance with US GAAP and in addition will prepare and publish the consolidated
financial statements according to IFRS as legally required.
In order to improve clarity of presentation, various items are aggregated in the consolidated balance
sheet and statement of income. These items are analyzed separately in the Notes where this provides
useful information to the users of the consolidated financial statements.
The consolidated balance sheet is classified on the basis of the maturity of assets and liabilities; the
consolidated statement of income is classified using the cost of sales format.
IV. Summary of significant accounting policies
a) Principles of consolidation
The financial statements of consolidated entities have been prepared using uniform accounting
methods.
Capital consolidation is performed according to SFAS No. 141 (Business Combinations) and SFAS
No. 142 (Goodwill and other intangible assets) by offsetting investments in subsidiaries against the
underlying equity at the dates of acquisition. The identifiable assets and liabilities of subsidiaries
are included at their fair values. Any remaining debit balance is recognized as goodwill and is tested
at least once a year for impairment.
The equity method is performed according to APB No. 18 (The Equity Method of Accounting for
Investments in Common Stock).
All significant intercompany revenues, expenses, income, receivables and payables are eliminated.
Profits and losses on items of property, plant and equipment and inventory acquired from other group
entities are also eliminated.
Deferred tax assets and liabilities are recognized on temporary differences resulting from consoli-
dation procedures.
Minority interest comprise the interest of minority shareholders in the consolidated equity of group
entities, including profits and losses attributable to the minority shareholders.

Affiliated Companies Consolidated Financial Statements Report Supervisory Board Supervisory Board Glossary Index 115
b) Composition of the Group
The consolidated financial statements include all material companies in which Fresenius AG has legal
or effective control. In addition, the Fresenius Group consolidates variable interest entities (VIEs)
for which it is deemed the primary beneficiary. If material, the equity method of accounting is used
for investments in associated companies (usually 20% to 50% owned). All other investments are
recorded at acquisition costs.
Fresenius Medical Care enters into various arrangements with certain dialysis clinics to provide
management services, financing and product supply. Some of these clinics are VIEs. Under FIN 46R
(Consolidation of Variable Interest Entities (revised)) these clinics are consolidated if Fresenius
Medical Care is determined to be the primary beneficiary. These VIEs generate approximately
€ 48 million (US$ 59 million) in annual revenue.
In accordance with FIN 46R, the VIEs are fully consolidated. The interest held by the other share-
holders in these consolidated VIEs is reported as minority interest in the consolidated balance sheet
at December 31, 2005.
Fresenius ProServe participates in long-term project entities which are set up for long-term defined
periods of time and for the specific purpose of constructing and operating thermal centers. Some of
these project entities qualify as VIEs, whereby Fresenius ProServe is not the primary beneficiary. The
project entities generate approximately € 28 million in annual revenue. From today’s perspective and
due to the contractual situation, Fresenius ProServe is not exposed to any material risk of loss from
these VIEs.
The consolidated financial statements of the year 2005 include, in addition to Fresenius AG,
117 (2004: 77) German and 634 (2004: 629) foreign companies.
The composition of the Group changed as follows:
Germany Abroad Total
December 31, 2004 77 629 706
Additions 47 52 99
of which newly founded 0 13 13
of which acquired 46 23 69
Disposals 7 47 54
of which no longer consolidated 2 24 26
of which merged 5 23 28
December 31, 2005 117 634 751

Notes116
17 companies (2004: 11) were accounted for under the equity method.
The complete list of the investments of Fresenius AG will be submitted to the Commercial Register of
the District Court of Bad Homburg v.d.H. under the number HRB 2617.
c) Classifications
Certain items in the previous year’s consolidated financial statements have been reclassified to con-
form with the current year’s presentation. Net operating results have not been materially affected by
the reclassifications.
d) Sales recognition policy
Sales from services are recognized at amounts estimated to be received under reimbursement arrange-
ments. Sales are recognized on the date services and related products are provided and the payor is
obligated to pay.
Product sales are recognized when title to the product passes to the customers either at the time of
shipment, upon receipt by the customer or upon any other terms that clearly define passage of title.
As product returns are not typical, an appropriate reduction to sales, cost of sales and accounts recei-
vable is made in the event a return is actual.
In the business segment Fresenius ProServe, sales are recognized for long-term production contracts
depending on the individual agreement and in accordance with the percentage of completion method.
The sales to be recognized are calculated as a percentage of the costs already incurred based on the
estimated total cost of the contract or milestones laid down in the contract.
e) Research and development expenses
Research and development expenses are expensed as incurred.
f) Impairment
The Fresenius Group reviews the carrying value of its property, plant and equipment, its intangible
assets with definite useful lives as well as other non-current assets for impairment whenever events
or changes in circumstances indicate that the carrying value of these assets may not be recoverable
in accordance with SFAS No. 144 (Accounting for the Impairment or Disposal of Long-Lived Assets).
Recoverability of these assets is measured in a first step by a comparison of the carrying value of
an asset to the future net cash flow directly associated with the asset. If assets are considered to be

Affiliated Companies Consolidated Financial Statements Report Supervisory Board Supervisory Board Glossary Index 117
impaired, the impairment recognized is the amount by which the carrying value exceeds the fair
value of the asset. The Fresenius Group uses various valuation factors, including market prices and
present value techniques to assess fair value.
In accordance with SFAS No. 144, long-lived assets to be disposed of by sale are reported at the
lower of carrying value or fair value less cost to sell and depreciation is ceased. Long-lived assets to
be disposed of other than by sale are considered to be held and used until disposal.
g) Interest
The Fresenius Group includes interests which are directly attributable to the acquisition, construction
or manufacture of qualifying assets in accordance with SFAS No. 34 (Capitalization of Interest Costs).
For the fiscal years 2005 and 2004, interest of € 2 million and € 1 million, based on an average in-
terest rate of 7.2% and 8.0%, respectively, was recognized as a component of the cost of assets.
h) Income taxes
In accordance with SFAS No. 109 (Accounting for Income Taxes), deferred tax assets and liabilities
are recognized for the future consequences attributable to temporary differences between the finan-
cial statement carrying amounts of existing assets and liabilities and their respective tax basis as well
as on consolidation procedures affecting net income. Deferred tax assets also include claims to future
tax reductions which arise from the expected usage of existing tax losses available for carryforward
where future recoverability is probable.
Deferred taxes are computed using enacted or adopted tax rates in the relevant national jurisdictions
when the amounts are recovered. Tax rates, which will be valid in the future, but are not adopted till
the balance sheet date, are not considered.
The carrying amount of a deferred tax asset shall be reduced to the extent that it is no longer probable
that sufficient taxable profit will be available to allow the benefit of part or all of that deferred tax
asset to be utilized. Reduction shall be reversed to the date and extent that it becomes probable that
sufficient taxable profit will be available (See Note 8, Income taxes).
i) Earnings per share
Basic earnings per ordinary share and preference share for all years presented have been calculated
in accordance with SFAS No. 128 (Earnings per Share) using the two-class method based upon the

Notes118
weighted average number of ordinary and preference shares outstanding. Basic earnings per ordinary
share are computed by dividing net income less preference amounts by the weighted average num-
ber of ordinary shares and preference shares outstanding during the year. For the purposes of com-
puting earnings per preference share, the additional amount payable on preference shares is added
to earnings per ordinary share. Diluted earnings per share include the effect of all potentially dilutive
instruments on ordinary shares and preference shares that would have been outstanding during the
year. The awards granted under the Fresenius’ and Fresenius Medical Care’s stock incentive plans
(see Note 28, Stock options), are potentially dilutive equity instruments.
j) Cash and cash equivalents
Cash and cash equivalents comprise cash funds and all short-term, liquid investments with an original
maturity of up to three months.
k) Trade accounts receivable
Trade accounts receivable are stated at their nominal value less allowances for doubtful debts. Allow-
ances are estimated mainly on the basis of payment history to date, the age structure of balances
and the contractual partner involved. In order to assess the appropriateness of allowances, checks
are carried out at regular intervals by Fresenius Group, to determine whether there have been any
divergences to previous payment history.
l) Inventories
Inventories are stated at the lower of cost (acquisition or manufacturing cost determined by using
the average or first-in, first-out method) or market value. Manufacturing cost comprises direct costs,
production and material overheads and depreciation.
m) Property, plant and equipment
Property, plant and equipment are stated at acquisition and manufacturing cost less accumulated
depreciation. Significant improvements are capitalized; repair and maintenance costs that do not
extend the useful lives of the assets are charged to expenses as incurred. Depreciation on property,
plant and equipment is calculated using the straight-line method over the estimated useful lives of
the assets ranging from 5 to 50 years for buildings and improvements (with a weighted average life of
19 years) and 3 to 15 years for machinery and equipment (with a weighted average life of 10 years).

Affiliated Companies Consolidated Financial Statements Report Supervisory Board Supervisory Board Glossary Index 119
n) Intangible assets with definite useful lives
In accordance with SFAS No. 142 (Goodwill and Other Intangible Assets), intangible assets with definite
useful lives are amortized over their respective useful lives and reviewed for impairment in accordance
with SFAS No. 144 (Accounting for Impairment or Disposal of Long-Lived Assets) (see Note 1. IV. f,
Impairment).
Purchased intangible assets, for example patents and distribution rights are stated at cost less straight-
line amortization and are amortized over their contractual or estimated useful lives.
Impairment losses are recognized in the event of losses in value of a lasting nature.
o) Goodwill and other intangible assets with indefinite useful lives
Intangible assets such as tradenames and management contracts acquired in a purchase method
business combination are recognized and reported apart from goodwill, pursuant to the criteria spe-
cified by SFAS No. 141 (Business Combinations). They are recorded at acquisition costs.
Goodwill and intangible assets with indefinite lives are not amortized, but tested for impairment
annually or when an event becomes known that could trigger an impairment.
To evaluate the recoverability of goodwill, the Fresenius Group identified reporting units in accordance
with SFAS No. 142 and determined the carrying value of each reporting unit by assigning the assets
and liabilities, including existing goodwill and intangible assets, to those reporting units. At least once
a year the company compares the fair value of each reporting unit to the reporting unit’s carrying
amount. The fair value of a reporting unit is determined using a discounted cash flow approach. In the
case that the fair value of the reporting unit is less than its carrying value, a second step is performed
which compares the fair value of the reporting unit’s goodwill to the carrying value of its goodwill. If
the fair value of the goodwill is less than the carrying value, the difference is recorded as an im-
pairment.
To evaluate the recoverability of separable intangible assets with indefinite useful lives, the Fresenius
Group compares the fair values of intangible assets with their carrying values. An intangible asset’s
fair value is determined using a discounted cash flow approach and other suitable methods.

Notes120
The recoverability of goodwill and other separable intangible assets with indefinite useful lives re-
corded in the Group’s consolidated balance sheet was verified. Thereof the Fresenius Group did not
record any impairment losses in 2005. In the year 2004 an impairment loss of € 4 million in the
business segment Fresenius Biotech was recorded.
p) Leases
Leased assets, assigned to Fresenius Group based on chances and risks (i.e. finance leases) are recog-
nized as property, plant and equipment in accordance with SFAS No. 13 (Accounting for Leases)
and measured on receipt date at their present values of lease payments as long as their fair values are
not lower. Leased assets are depreciated in straight-line over their useful lives. If there is doubt as
to whether title to the asset passes at a later stage and there is no purchase option the asset is depre-
ciated over the lease term, if this is shorter. The payment obligations relating to future lease in-
stalments are recognized as financial liabilities. An impairment loss is recognized if the recoverable
amount is lower than the amortized cost of the leased asset.
Finance lease liabilities are measured at the present value of the future lease payments.
Property, plant and equipment, which is rented by Fresenius Group is accounted at its purchase costs.
Its depreciation is calculated using the straight-line method over the leasing time and its expected
residual value.
q) Derivative financial instruments
In accordance with SFAS No. 133 (Accounting for Derivative Instruments and Hedging Activities)
derivative financial instruments which primarily include foreign currency forward contracts and in-
terest rate swaps are recognized as assets or liabilities at fair value in the balance sheet. Changes
in fair value of derivative financial instruments are recognized periodically either in earnings or, in
the case of cash flow hedges, as other comprehensive income (loss) in shareholders’ equity.
In the case of a fair value hedge, the hedge-effective portion of fair value gains or losses on the
hedged item and on the derivative financial instrument is recognized in profit or loss. In the case of
a cash flow hedge, fair value gains or losses are recognized directly in equity until the hedged item
itself is recognized in profit or loss. The non-effective portion of a cash flow hedge is recognized im-
mediately in profit or loss.

Affiliated Companies Consolidated Financial Statements Report Supervisory Board Supervisory Board Glossary Index 121
Amounts due from and payable to the counterparties of interest rate swaps are recorded on an accrual
basis at each reporting date at amounts computed by reference to the respective interest rate swap
contract. Realized gains and losses that occur from the early termination or expiration of contracts
are deferred and recorded in income over the remaining period of the original swap agreement if
the corresponding debt is still outstanding. Gains and losses arising from interest differential on con-
tracts that hedge specific borrowings are recorded as interest expense over the life of the contract.
In the event the hedged asset is sold, or otherwise disposed of, or liability is terminated, the gain or
loss on the interest rate swap would be matched with the offsetting gain or loss of the related item
(see Note 25, Financial Instruments).
r) Liabilities
Liabilities are stated generally at present value which normally corresponds to the value of products
or services which are delivered. Short time liabilities are measured as a general rule at their repay-
ment amount.
s) Legal costs
The Fresenius Group record accruals for legal issues when they are probable and their amount can
be reasonably estimated. These accruals include expenses for legal and consulting services in con-
nection with these legal issues.
t) Other accrued expenses
In accordance with SFAS No. 5 (Accounting for Contingencies), accruals for taxes and other obliga-
tions are recognized when there is a present obligation to a third party arising from past events, it is
probable that the obligation will be settled in the future and a reliable estimate can be made of the
amount.
Tax accruals include obligations for the current year and for earlier periods.
u) Pension accruals and similar obligations
Pension accruals for post-employment benefits are measured using the projected unit credit method
in accordance with SFAS No. 87 (Employers’ Accounting for Pensions), taking into account future
salary and pension increase trends. Actuarial gains and losses that exceed a corridor of 10% of the
present value of the defined benefit obligation are spread over the expected average remaining
working lives, adjusted for fluctuation, of the employees participating in the plans.

Notes122
v) Debt issuance costs
Costs related to the issuance of debt are amortized over the term of the related obligation.
w) Stock option plans
The Fresenius Group accounts for its stock option plans in accordance with the provisions of APB
No. 25 (Accounting for Stock Issued to Employees) and related interpretations. As such, compen-
sation expense is recorded only if the current market price of the underlying stock exceeds the
exercise price on the measurement date.
Fair Value of Stock Options
In electing to continue to follow APB Opinion No. 25 for expense recognition purposes, the Fresenius
Group is obliged to provide the expanded disclosures required under SFAS No. 123 (Accounting for
Stock-Based Compensation) for stock-based compensation granted, including disclosure of proforma
net earnings and earnings per share had compensation expense relating to grants been measured
under the fair value recognition provisions of SFAS No. 123 (Accounting for Stock-Based Compensation).
The per share weighted-average fair value of stock options granted during 2005 and 2004 was € 31.89
and € 25.31, respectively, on the date of the grant using the Black-Scholes option-pricing model with
the weighted-average assumptions presented below.
Weighted-average assumptions 2005 2004
Expected dividend yield 2.10% 2.05%
Risk-free interest rate 2.50% 3.50%
Expected volatility 40.00% 40.00%
Expected life of options 5.3 years 5.3 years

Affiliated Companies Consolidated Financial Statements Report Supervisory Board Supervisory Board Glossary Index 123
The following table illustrates the effect on net income and earnings per share if the Fresenius Group
had applied the fair value recognition provisions of SFAS No. 123 to stock-based employee compen-
sation:
in million €, except the amounts per share (€) 2005 2004
Net income
as reported 222 168
Net income as reported less preference on preference shares 221 167
plus share-based employee compensation expense
according to APB No. 25, net of tax 3 –
less share-based employee compensation expense
according to SFAS No. 123, net of tax -9 -8
Pro-forma less preference on preference shares 215 159
Pro-forma 216 160
Basic earnings per ordinary share
As reported 5.28 4.08
Pro-forma 5.14 3.88
Basic earnings per preference share
As reported 5.31 4.11
Pro-forma 5.17 3.91
Fully-diluted earnings per ordinary share
As reported 5.24 4.07
Pro-forma 5.10 3.87
Fully-diluted earnings per preference share
As reported 5.27 4.10
Pro-forma 5.13 3.90
x) Self-insurance programs
The largest subsidiary of the Fresenius Group in North America is partially self-insured for profession-
al, product and general liability, auto liability and worker’s compensation claims under which the
company assumes responsibility for incurred claims up to predetermined amounts above which third
party insurance applies. Reported balances for the year include estimates of the anticipated expense
for claims incurred (both reported and incurred but not reported) based on historical experience and
existing claim activity. This experience includes both the rate of claims incidence (number) and claim
severity (cost) and is combined with individual claim expectations to estimate the reported amounts.

Notes124
z) Use of estimates
The preparation of consolidated financial statements in conformity with US GAAP requires manage-
ment to make estimates and assumptions that affect the reported amounts of assets and liabilities,
the disclosure of contingent assets and liabilities at the balance sheet date and the reported amounts
of income and expenses during the reporting period. Actual results could differ from those estimates
and would be recognized in earnings when more accurate knowledge exists.
aa) Receivables management
The companies of the Fresenius Group perform ongoing evaluations of the financial situation of their
customers and generally do not require a collateral from the customers for the supply of products
and provision of services. Approximately 25% and 26%, respectively, of the sales of the Fresenius
Group in 2005 and 2004 are subject to the regulations and the governmental health care programs
in the United States, especially Medicare and Medicaid.
Year-end Year-end Average Averageexchange rate* exchange rate* exchange rate exchange rate
Dec 31, 2005 Dec 31, 2004 2005 2004
US dollar per € 1.1797 1.3621 1.2442 1.2439
Pound sterling per € 0.6853 0.7051 0.6839 0.6787
Swedish krona per € 9.3885 9.0206 9.2816 9.1243
Chinese renminbi per € 9.5204 11.2891 10.1639 10.1813
Japanese yen per € 138.90 139.65 136.86 134.44
* mean rate on balance sheet date
y) Foreign currency translation
The reporting currency is the euro. The Fresenius Group follows the provisions of SFAS No. 52 (For-
eign Currency Translation). Substantially all assets and liabilities of the foreign subsidiaries are trans-
lated at year-end exchange rates, while revenues and expenses are translated at average exchange
rate. Adjustments for foreign currency translation fluctuations are excluded from net earnings and are
reported in accumulated other comprehensive income (loss). In addition, the translation adjustments
of certain intercompany borrowings, which are considered foreign equity investments, are reported
in accumulated other comprehensive income (loss).
The exchange rates of the main currencies affecting foreign currency translation developed as follows:

Affiliated Companies Consolidated Financial Statements Report Supervisory Board Supervisory Board Glossary Index 125
bb) Recent pronouncements and accounting changes
In November 2004, the Financial Accounting Standards Board (FASB) issued SFAS No. 151 (Inventory
Costs – an amendment of ARB No. 43, Chapter 4 (FAS 151)) which is the result of its efforts to conver-
ge US accounting standards for inventories with International Financial Reporting Standards. This
statement requires abnormal amounts of idle facility expense, freight, handling costs, and wasted
material (spoilage) to be recognized as current-period charges. It also requires that allocation of fixed
production overheads to the costs of conversion be based on the normal capacity of the production
facilities. SFAS No. 151 will be effective for inventory costs incurred during fiscal years beginning after
June 15, 2005. As of January 1, 2006, the Fresenius Group will adopt SFAS No. 151, which is not ex-
pected to have a material impact on its consolidated financial statements.
In December 2004, the Financial Accounting Standards Board issued its final standard on accounting
for share-based payments, SFAS No. 123R (Share-Based Payment (SBP) (revised)), that requires com-
panies to expense the cost of employee stock options and similar awards. SFAS No. 123R requires
determining the cost that will be measured at fair value on the date of the SBP awards based upon an
estimate of the number of awards expected to vest. There will be no right of reversal of cost if the
awards expire without being exercised. Fair value of the SBP awards will be estimated using an option-
pricing model that appropriately reflects the specific circumstances and economics of the awards.
Compensation cost for the SBP awards, which are not deductable according to German tax law, will
be recognized as they vest. The Fresenius Group will have two alternative transition methods, each
having a different reporting implication. The effective date is for interim and annual periods beginn-
ing after June 15, 2005. The Fresenius Group adopted SFAS No. 123R as of January 1, 2006 and is
in the process of determining the transition method it is going to adopt and the potential impact on
its consolidated financial statement.
In May 2005, the FASB issued SFAS No. 154 (Accounting Changes and Error Corrections) – a replace-
ment of APB No. 20 (Accounting Changes) and FASB Statement No. 3 (Reporting Accounting Changes
in Interim Financial Statements). This Statement changes the requirements for the accounting for
and reporting of a change in accounting principle. It applies to all voluntary changes in accounting
principle, error corrections and required changes due to new accounting pronouncements which do
not specify a certain transition method. SFAS No. 154 generally requires retrospective application to

Notes126
prior periods’ financial statements of changes in accounting principle, unless it is impracticable to
determine either the period-specific effects or the cumulative effect of the change. This Statement
requires that retrospective application of a change in accounting principle be limited to the direct
effects of the change. This Statement also requires that a change in depreciation, amortization, or
depletion method for long-lived, nonfinancial assets be accounted for on a prospective basis. This
Statement also carries forward without change the guidance contained in APB No. 20 for reporting
the correction of an error in previously issued financial statements and a change in accounting es-
timate. The effective date is for all fiscal years beginning after December 15, 2005. The Fresenius
Group adopted this standard as of January 1, 2006 and will report future accounting changes and
error corrections, if any, in accordance with this standard.
In June 2005, the FASB ratified EITF No. 05-5 (Accounting for Early Retirement or Postemployment
Programs with Specific Features (such as Terms Specified in Altersteilzeit Early Retirement Arrange-
ments)). EITF No. 05-5 provides guidance on the accounting for the German early retirement pro-
gram providing an incentive for employees, within a certain age group, to transition from full or
part-time employment into retirement before their legal retirement age. The program provides the
employee with a bonus as salary or social security which is reimbursed by subsidies from the Ger-
man government if certain conditions are met. According to EITF No. 05-5, the bonuses provided by
the employer should be accounted for as postemployment benefits under SFAS No. 112 (Employer’s
Accounting for Postretirement Benefits), with compensation cost recognized over the remaining serv-
ice period beginning when the individual agreement is signed by the employee and ending when
the active service period ends. The government subsidy should be recognized when the employer
meets the necessary criteria and is entitled to the subsidy. The effect of applying EITF No. 05-5
should be recognized prospectively as a change in accounting estimate in fiscal years beginning
after December 15, 2005. The first time adoption has to be recorded as a change in accounting
estimate. The Fresenius Group is in compliance with EITF 05-5
V. Critical accounting policies
In our opinion, the following accounting policies and topics are critical for the consolidated financial
statements in the present economic environment. The influences and judgements as well as the
uncertainties which affect them are also important factors to be considered when looking at present
and future operating earnings.

Affiliated Companies Consolidated Financial Statements Report Supervisory Board Supervisory Board Glossary Index 127
a) Recoverability of goodwill and intangible assets with indefinite useful lives
Fresenius Group’s acquisitions in the fiscal year have created a significant amount of intangible assets,
including goodwill, tradenames and management contracts. At December 31, 2005 and December
31, 2004, the carrying amount of goodwill and non-amortizable intangible assets amounted to € 5,069
million and € 3,244 million, respectively, which represented 44% and 40%, respectively, of total
assets.
In accordance with SFAS No. 142 (Goodwill and Other Intangible Assets) an impairment test of good-
will and non-amortizable intangible assets is performed at least once a year, or if events occur or
circumstances change that would indicate the carrying value might be impaired (see Note 1. IV. o,
Goodwill and other intangible assets with indefinite useful lives).
To comply with the regulation of SFAS No. 142 and determine possible impairments of these assets,
the fair value of the reporting unit is compared to the reporting units carrying amount. The fair value
of each reporting unit is estimated using estimated future cash flows for the unit discounted by a
weighted average cost of capital specific to that unit. Estimated cash flows are based on budgets for
the next three years, and projections for the following years based on an expected growth rate. The
growth rates are based on industry and internal projections. The discount rate reflects any inflation
in local cash flows and risks inherent to each reporting unit. If the fair value of the reporting unit is
less than its carrying value, a second step is performed which compares the fair value of the reporting
unit’s goodwill to the carrying value of its goodwill. If the fair value of the goodwill is less than its
carrying value, the difference is recorded as an impairment.
A prolonged downturn in the health care industry with higher than expected costs for providing health
care services could adversely affect the estimated future cash flows of certain countries or segments.
Future adverse changes in a reporting unit’s economic environment could affect the discount rate. A
decrease in the estimated future cash flows and/or a decline in the reporting units economic environ-
ment could result in impairment charges to goodwill and other intangible assets with indefinite lives
which could materially and adversely affect the Group’s future operating results.

Notes128
b) Legal contingencies
The Fresenius Group is involved in several legal matters arising from the ordinary course of Fresenius
Groups business. Furthermore, Fresenius Medical Care is party to litigation in connection with the
NMC transaction in 1996 for the purchase of the National Medical Care, Inc. For details, please see
Note 24, Commitments and contingent liabilities.
The Fresenius Group regularly analyses current information including, as applicable, its legal defenses
and provides accruals for probable contingent losses including the estimated legal expenses to resolve
the matters. Fresenius uses the resources of its internal legal department as well as external lawyers
for the assessment. In making the decision regarding the need for loss accrual, the degree of prob-
ability of an unfavorable outcome and the ability to make a reasonable estimate of the amount of loss
is considered.
If an unfavorable outcome is probable but the amount of loss cannot be reasonably estimated by
management, appropriate disclosure is provided, but no contingent losses are accrued. The filing of
a suit or formal assertion of a claim or assessment, or the disclosure of any such suit or assertion,
does not automatically indicate that accrual of a loss has be done.
c) Allowance for doubtful accounts
Trade accounts receivable are a significant asset of the Group and the allowance for doubtful accounts
is a significant estimate made by management. Trade accounts receivable were € 1,871 million and
€ 1,528 million in 2005 and 2004, respectively. More than one third of receivables derives from the
business segment Fresenius Medical Care and mainly relates to the dialysis care business in North
America.
The allowance for doubtful accounts was € 200 million and € 166 million as of December 31, 2005
and December 31, 2004, respectively.
Sales are invoiced at amounts estimated to be receivable under reimbursement arrangements with
third party payors. Estimates for the allowances for doubtful accounts are mainly based on historic
collection experience, taking into account the aging of accounts receivable and the contract part-
ners. The Fresenius Group believes that these analyses result in a well-founded estimate of allowances
for doubtful accounts. From time to time the Fresenius Group reviews changes in collection experi-
ence to ensure the appropriateness of the allowances.
Deterioration in the aging of receivables and collection difficulties could require that Fresenius in-
creases the estimates of allowances for doubtful accounts. Additional expenses for uncollectible recei-
vables could have a significant negative impact on future operating results.

Affiliated Companies Consolidated Financial Statements Report Supervisory Board Supervisory Board Glossary Index 129
d) Self-insurance programs
The largest subsidiary of the Fresenius Group in North America is partially self-insured for profes-
sional, product and general liability, auto liability and workers’ compensation claims under which
the Company assumes responsibility for incurred claims up to predetermined amounts above which
third party insurance applies. Reported balances for the year include estimates of the anticipated
expense for claims incurred (both reported and incurred but not reported) based on historical expe-
rience and existing claim activity. This experience includes both the rate of claims incidence (num-
ber) and claim severity (cost) and is combined with individual claim expectations to estimate the
reported amounts.
2. ACQUISITIONS AND DIVESTITURES
Acquisitions
The Fresenius Group made acquisitions totaling € 1,894 million and € 113 million in 2005 and 2004,
respectively. Of this total, Fresenius Medical Care invested € 108 million and € 96 million, respectively,
Fresenius Kabi € 274 million and € 13 million, Fresenius ProServe € 1,507 million and € 4 million, the
segment Corporate/Other € 5 million and made no acquisitions in the previous year.
All acquisitions have been accounted for by the purchase method and accordingly have been consoli-
dated from the date of acquisition. The excess of the total acquisition costs over the fair value of
the net assets acquired amounted to € 1,493 million and € 88 million in 2005 and 2004, respectively.
Fresenius Medical Care made acquisitions in 2005 amounting to € 108 million, of which € 101 million
was paid in cash. Purchase price consideration of € 7 million will be paid in subsequent years. The
majority of this amount (€ 76 million) was used to purchase dialysis clinics.
On May 3, 2005, Fresenius Medical Care entered into a definitive merger agreement for the acquisition
(Acquisition) of Renal Care Group, Inc. (RCG), a Delaware corporation with principle offices in Nash-
ville, Tennessee, for an all cash purchase price of approximately US$ 3.5 billion. At December 31, 2005,
RCG provided dialysis and ancillary services to over 32,360 patients through more than 450 owned
outpatient dialysis centers in 34 states within the United States, in addition to providing acute dialysis
services to more than 200 hospitals. Completion of the Acquisition, approved by RCG’s stockholders
in a vote held on August 24, 2005, is subject to governmental approvals (including termination or expi-
ration of the waiting period under the Hart-Scott-Rodino Antitrust Improvements Act of 1976, as
amended, (the Act)) and other regulatory approvals.

Notes130
On February 15, 2006, Fresenius Medical Care announced that Fresenius Medical Care and RCG had
entered into a definitive agreement to sell approximately 100 dialysis centers serving on average
approximately 60-65 patients per center to National Renal Institutes, Inc., a wholly owned subsidiary
of DSI Holding Company, Inc. The divestiture of these centers is an important step toward conclud-
ing the review by the United States Federal Trade Commission (FTC) of Fresenius Medical Care’s
acquisition of RCG. The purchase price for the divested centers is approximately US$ 450 million to
be paid in cash, subject to post-closing adjustments for working capital and other routine matters.
The sale of the centers is expected to close shortly after the completion of Fresenius Medical Care’s
acquisition of RCG. Both the divestiture and the acquisition of RCG remain subject to FTC approval.
In connection with the Acquisition, Fresenius Medical Care has entered into a commitment letter
pursuant to which Bank of America, N.A. (BofA) and Deutsche Bank AG (DB) have agreed, subject to
certain conditions, to underwrite an aggregate US$ 5 billion in principal amount of term and re-
volving loans to be syndicated to other financial institutions. Funding is subject to customary closing
conditions and BofA’s and DB’s acquiescence to any material modification to the merger agreement
and any waiver of any material conditions precedent under that agreement. Interest on the new senior
credit facilities will be at the option of Fresenius Medical Care at a rate equal to either (i) LIBOR
plus an applicable margin, or (ii) the higher of BofA’s prime rate or the Federal Funds rate plus 0.5%
plus an applicable margin. The applicable margin is variable and depends on the consolidated lever-
age ratio of Fresenius Medical Care (Margin). The financing will be available to Fresenius Medical
Care, among other uses, to pay the purchase price and related expenses for the proposed acquisi-
tion of RCG, to refinance outstanding indebtedness under the Fresenius Medical Care 2003 Senior
Credit Agreement (see Note 18, Debt and capital lease obligations) and certain indebtedness of RCG,
and for general corporate purposes. In conjunction with the forecasted utilization of the new senior
credit facilities and the related variable rate based interest payments, Fresenius Medical Care enter-
ed into forward starting interest rate swaps in the notional amount of US$ 2,465 million. These instru-
ments, designated as cash flow hedges, effectively convert forecasted LIBOR based interest payments
into fixed rate based interest payments which fix the interest rates on US$ 2,465 million of the fore-
casted financing under the new senior credit facility at 4.32% plus Margin.
On November 30, 2005, Fresenius Medical Care announced it had commenced a cash tender offer
(Tender Offer), contingent upon satisfaction of the conditions to the closing of the Acquisition, for
all the US$ 159.685 million of RCG’s 9% Senior Subordinated Notes (Notes). Under the terms of the
Tender Offer, the total consideration to be paid for validly tendered and accepted Notes will be the
present value of the future cash flows up to and including November 1, 2007, based on an assumption
that the Notes will be redeemed at a price of US$ 1,045 per US$ 1,000 principal amount of Notes
on such date, discounted at a rate equal to 50 basis points over the yield to maturity on the 4.25%

Affiliated Companies Consolidated Financial Statements Report Supervisory Board Supervisory Board Glossary Index 131
US Treasury Note due October 31, 2007. The terms of the offer also require certain consents, (Con-
sents), to certain proposed amendments to the Indenture governing the Notes that would eliminate
substantially all restrictive covenants and certain other provisions of Indenture. Upon consumma-
tion of the Tender Offer, holders of Notes tendered together with Consents before the end of business
on December 13, 2005 will receive a consent payment of US$ 30 per US$ 1,000 principal amount of
Notes tendered which will be included in Fresenius Medical Care’s costs of the Acquisition. Notes
and Consents tendered after this date cannot be withdrawn and are not entitled to receive the con-
sent payment. Holders of Notes tendered and not withdrawn will receive accrued and unpaid interest
from the last interest date up to, but not including, the date payment is made for the Notes. As most
recently extended, the offer expires February 27, 2006, unless further extended by FMC-AG & Co. KGaA.
The Tender Offer is contingent upon receipt of consents from the holders of a majority in aggregate
outstanding principal amount of the Notes and satisfaction of the conditions to the Acquisition. As of
5:00 p.m., New York City time, on January 27, 2006, 99.87% of the outstanding aggregate principal
amount of the Notes had been tendered. Tendered notes may no longer be withdrawn.
On October 25, 2004, RCG received a subpoena from the office of the United States Attorney for the
Eastern District of New York. The subpoena requires the production of documents related to nume-
rous aspects of their business and operations, including those of RenaLab, Inc., their laboratory. The
subpoena includes specific requests for documents related to testing for parathyroid hormone (PTH)
levels and vitamin D therapies. RCG has announced that it intends to cooperate with the government’s
investigation.
On August 9, 2005, RCG received with a subpoena from the office of the United States Attorney for the
Eastern District of Missouri in connection with a joint civil and criminal investigation. The subpoena
requires the production of documents related to numerous aspects of RCG’s business and operations.
The areas covered by the subpoena include RCG’s supply company, pharmaceutical and other serv-
ices that RCG provides to patients, RCG’s relationships to pharmaceutical companies, RCG’s relation-
ships with physicians, medical director compensation, joint ventures with physicians and purchase of
dialysis equipment from Fresenius Medical Care. RCG has announced that it intends to cooperate
with the government’s investigation.
Upon the closing of the proposed acquisition, Fresenius Medical Care will assume RCG’s obligations
to comply with these subpoenas.
Fresenius Medical Care believes the proposed acquisition will be consummated late in the first quarter
of 2006 and it will be earnings neutral to slightly accretive in 2006 after excluding transaction related
expenses and accretive from 2007 onward.

Notes132
Fresenius Medical Care made acquisitions in 2004 amounting to € 96 million, of which € 84 million was
paid in cash. Consideration paid in the form of debt waivers amounted to € 7 million. Purchase price
consideration of € 5 million will be paid in subsequent years. The majority of this amount (€ 83 million)
was used to purchase dialysis clinics. The largest single acquisition related to the acquisition of dial-
ysis clinics in Memphis, USA, for a consideration of € 24 million.
In the year 2005 Fresenius Kabi made acquisitions of € 274 million, referring mainly to the acquisi-
tion of the Portuguese company Labesfal – Laboratório de Especialidades Farmacêuticas Almiro S.A.
(Labesfal), the Czech company Infusia a.s., the acquisition of the remaining 35% shares of Beijing
Fresenius Kabi Pharmaceutical Co., Ltd., China and the business of Clinico GmbH, Bad Hersfeld,
Germany (Clinico).
In the year 2004, acquisitions made by Fresenius Kabi amounting to € 13 million related to the pur-
chase of the 20% minority interest in Fresenius Kabi Korea Ltd., Korea, a research entity with a focus
on HESylation, the Biotechnologie-Gesellschaft Mittelhessen mbH, Gießen and the acquisition of
the compounding activities of Isotec Ltd. in South Africa as well as the first purchase price payment
for the compounding joint venture Pharmatel Pty Ltd., Australia; an other payment was made in
December 2005.
In December 2005 Fresenius AG acquired HELIOS Kliniken GmbH, Fulda, Germany (HELIOS). The
hospitals of HELIOS and the Fresenius hospitals of the Wittgensteiner Group will operate under the
leadership and brand of HELIOS in the business segment Fresenius ProServe. The purchase price for
100% of the HELIOS shares is € 1.5 billion plus € 100 million for the net cash position. Fresenius AG
acquired 94% of the HELIOS shares while 6% continued to be held by the HELIOS management.
In December 2005, Fresenius AG assigned its share in HELIOS Kliniken GmbH, Fulda, to Fresenius
ProServe GmbH. In addition to the contractually agreed purchase price, Fresenius AG also incurred
additional acquisition costs amounting to € 2 million. The excess of the purchase price (including
additional acquisition costs) over the group’s share of equity was recognized as goodwill with an
initial carrying amount of € 1,190 million. The acquisitions of the HELIOS Kliniken GmbH and of
the business of Clinico GmbH were financed by a share capital increase (see Note 22, Shareholders
equity) and a bond (see Note 32, Subsequent events). Bridge financing arrangements were put in
place for the period between the announcement of the acquisition of HELIOS Kliniken GmbH and
the issue of the bond (see Note 18, Debt and capital lease obligations).

Affiliated Companies Consolidated Financial Statements Report Supervisory Board Supervisory Board Glossary Index 133
Acquisitions made by Fresenius ProServe in 2004 amounting to € 4 million related principally to an
investment in the project development company, THK Therme Laa in Austria.
In 2005, Fresenius Biotech paid additional cost in an amount of € 4 million for the investment in the
Trion Pharma GmbH, München, Germany aquired in 2002. In the prior year they made no acquisitions.
Divestitures
In 2005, there have been no significant divestitures.
In December 2004 Fresenius ProServe sold its subsidiary hospitalia care to Kursana Residenzen
GmbH, Berlin, Germany. Prior to the sale, hospitalia care had sales of € 38 million in 2004.
Impacts on the Fresenius Group resulting from acquisitions
The acquisitions completed in 2005, or which were included in the consolidated statements for the
first full year, contributed, compared to the previous year, the following amounts to the development
of sales and earnings:
in million € 2005
Sales 106
EBITDA 33
EBIT 27
Net interest -9
Net income 12
The acquisitions increased the total assets of the Fresenius Group by € 2,466 million.
The acquisition of HELIOS, placed at the end of December 2005, had no impact on the Groups income
statement of 2005. If the acquisition of HELIOS would had taken place at January 1, 2005 it would have
affected the consolidated statement of income as follows:
in million € as reported pro forma
Sales 7,889 9,086
EBITDA 1,289 1,424
EBIT 969 1,073
Net interest -203 -239
Net income 222 265

Notes 134
NOTES ON THE CONSOLIDATED STATEMENT OF INCOME
3. SALES
Sales by activity are as follows:
An analysis of sales by business segment and region is shown in the segment information on pages
106 to 109.
4. COST OF SALES
Cost of sales comprises the following:
5. PERSONNEL EXPENSES
Cost of goods sold, selling, general and administrative expenses and expenditure on research and
development, include personnel expenses amounting to € 2,482 million and € 2,318 million in 2005
and 2004, respectively. Personnel expenses comprise the following:
in million € 2005 2004
Costs of services 3,277 3,109
Manufacturing cost of products and related goods 1,670 1,519
Cost of long-term production contracts 253 267
Other cost of sales – –
Cost of sales 5,200 4,895
in million € 2005 2004
Sales of services 4,462 4,167
Sales of products and related goods 3,113 2,786
Sales from long-term production contracts 314 318
Other sales – –
Sales 7,889 7,217

Affiliated Companies Consolidated Financial Statements Report Supervisory Board Supervisory Board Glossary Index 135135
The annual average number of employees in the Fresenius Group was:
6. SELLING, GENERAL AND ADMINISTRATIVE EXPENSES
Selling expenses amount to € 402 million (2004: € 391 million) and include expenditure for sales
personnel amounting to € 184 million (2004: € 171 million).
General and administrative expenses amounted to € 1,169 million (2004: € 1,007 million) and related
to expenditure for administrative functions not attributable to development, production or selling.
7. NET INTEREST
The negativ net interest in an amount of € 203 million, resuting from interest income in an amount of
€ 20 million and interest expenses in an amount of € 223 million, includes interest income on interest-
bearing securities and loans, gains and losses relating to current securities and all interest expenses.
It also includes profit-share and dividend income from current and non-current securities.
by function 2005 2004
Production and service 53,334 50,759
Administration 11,084 10,679
Sales and marketing 6,340 5,576
Research and development 853 824
Total employees 71,611 67,838
in million € 2005 2004
Wages and salaries 1,990 1,851
Social security contributions and cost of retirement pensions and social assistance 492 467
thereof amount for retirement pensions 58 52
Personnel expenses 2,482 2,318

Notes 136
Income tax expense (benefit) for the years 2005 and 2004 consists of the following:
2005 2004in million € Germany Abroad Total Germany Abroad Total
Current taxes 37 251 288 44 180 224
Deferred taxes -12 22 10 -5 34 29
Income taxes 25 273 298 39 214 253
in million € 2005 2004
Germany 90 25
Abroad 676 611
Total 766 636
8. INCOME TAXES
Earnings before income taxes and minority interest is attributable to the following geographic regions:
In 2005 and 2004, Fresenius AG is subject to German federal corporation income tax at a base rate of
25% plus a solidarity surcharge of 5.5% on federal corporation taxes payable.
A reconciliation between the expected and actual income tax expense is shown below. The expected
corporate income tax expense is computed by applying the German corporation tax rate (including
the solidarity surcharge) and the effective trade tax rate on income before income taxes and minority
interest. The respective combined tax rates are 37.31% for 2005 and 37.42% for 2004.
in million € 2005 2004
Computed “expected” income tax expense 286 238
Increase (reduction) in income taxes resulting from:
Items not recognized for tax purposes 31 14
Foreign tax rate differential -23 3
Tax-free income -18 -23
Taxes for prior years 23 13
Changes in valuation allowances on deferred tax assets 17 28
Other -18 -20
Income taxes 298 253
Effective tax rate 38.9% 39.8%

Affiliated Companies Consolidated Financial Statements Report Supervisory Board Supervisory Board Glossary Index 137
The tax effects of the temporary differences that give rise to deferred tax assets and liabilities at
December 31 are presented below:
in million € 2005 2004
Deferred tax assets
Accounts receivable 25 27
Inventories 40 33
Other current assets 7 2
Other non-current assets 32 55
Accrued expenses 175 137
Other short-term liabilities 14 12
Other liabilities 10 6
Pension obligations 25 16
Losses carried forward from previous years 157 151
Deferred tax assets, before valuation allowance 485 439
Less valuation allowance 112 95
Deferred tax assets 373 344
Deferred tax liabilities
Accounts receivable 10 10
Inventories 12 12
Other current assets 2 3
Other non-current assets 270 225
Accrued expenses 22 36
Other short-term liabilities 47 15
Other liabilities 25 20
Deferred tax liabilities 388 321
Accumulated deferred taxes -15 23

Notes 138
for the fiscal years in million €
2006 7
2007 13
2008 11
2009 16
2010 13
2011 5
2012 3
2013 –
2014 2
2015 6
Thereafter 6
Total 82
The total remaining operating losses of € 382 million can mainly be carried forward for an unlimited
period.
In assessing the realizability of deferred tax assets, Management considers whether it is more likely
than not that some portion or all of the deferred tax assets will not be realized. The ultimate realization
of deferred tax assets is dependent upon the generation of future taxable income during the periods
in which those temporary differences become deductible. Management considers the scheduled
reversal of deferred tax liabilities and projected future taxable income in making this assessment.
Based upon the level of historical taxable income and projections of future taxable income over the
As of December 31, 2005 the valuation allowance on deferred tax assets in an amount of € 112 mil-
lion increased by € 17 million compared to the prior year amount of € 95 million as a result of the
increase in the volume of tax losses which the Fresenius Group anticipates will not be recovered.
The following table shows the amounts, and the years in which operating losses expire:
2005 2004in million € thereof long-term thereof long-term
Deferred tax assets 315 127 286 118
Deferred tax liabilities 330 303 263 245
Accumulated deferred taxes -15 -176 23 -127

Affiliated Companies Consolidated Financial Statements Report Supervisory Board Supervisory Board Glossary Index 139
periods in which the deferred tax assets are deductible, the Management believes it is more likely
than not that the Fresenius Group will realize the benefits of these deductible differences, net of the
existing valuation allowances at December 31, 2005.
Provision has not been made for additional taxes on € 622 million undistributed earnings of foreign
subsidiaries of Fresenius Medical Care as these earnings are considered permanently reinvested.
9. EARNINGS PER SHARE
The following table is a reconciliation of the numerators and denominators of the basic and diluted
earnings per share computations.
in million €, except for amounts per share (€) 2005 2004
Numerators
Net income 222 168
less preference on preference shares 1 1
Income available to all class of shares 221 167
Denominators (number of shares)
Weighted average number of ordinary shares outstanding 20,940,208 20,484,955
Weighted average number of preference shares outstanding 20,940,208 20,484,955
Total weighted average number of shares outstanding of all classes 41,880,416 40,969,910
Potentially dilutive ordinary shares 162,749 61,747
Potentially dilutive preference shares 162,749 61,747
Total weighted average shares outstanding of all classes assuming dilution 42,205,914 41,093,404
Total weighted average ordinary shares assuming dilution 21,102,957 20,546,702
Total weighted average preference shares assuming dilution 21,102,957 20,546,702
Basic earnings per ordinary share 5.28 4.08
Preference per preference share 0.03 0.03
Basic earnings per preference share 5.31 4.11
Fully diluted earnings per ordinary share 5.24 4.07
Preference per preference share 0.03 0.03
Fully diluted earnings per preference share 5.27 4.10
The owners of preference shares are entitled to a preference of € 0.03 per bearer preference share
per fiscal year.

Notes 140
in million € 2005 2004
Cash 209 127
Securities (with a maturity of up to 90 days) 43 13
Total cash and cash equivalents 252 140
in million € 2005 2004
Trade accounts receivables 2,071 1,694
less allowance 200 166
Trade accounts receivable (net) 1,871 1,528
NOTES ON THE CONSOLIDATED BALANCE SHEET
10. CASH AND CASH EQUIVALENTS
11. TRADE ACCOUNTS RECEIVABLE
12. INVENTORIES
As of December 31, inventories consist of the following:
The companies of the Fresenius Group are obligated to purchase approximately € 295 million of raw
materials and purchased components, of which € 183 million is committed at December 31, 2005 for
2006. The terms of these agreements run one to four years. Advance payments from customers of
€ 63 million have been offset against inventories.
in million € 2005 2004
Raw materials and purchased components 176 134
Work in progress 117 93
Finished goods 465 426
less reserves 31 34
Inventories (net) 727 619
All trade accounts receivable are due within one year.

Affiliated Companies Consolidated Financial Statements Report Supervisory Board Supervisory Board Glossary Index 141
Impairment losses of € 3 million and € 7 million were recognized on other non-current assets in the
fiscal years 2005 and 2004, respectively. In 2005 there were no reclassifications to other non-current
assets. In 2004 reclassification amounted to € 3 million.
Inventories as of December 31, 2005 and as of December 31, 2004 include approximately € 23 million
and approximately € 16 million, respectively, of the product Erythropoietin (EPO) which is supplied
by a single source supplier in the United States. Delays, stoppages, or interruptions in the supply
of EPO could adversely affect the operating results of Fresenius Medical Care. Revenues from EPO
accounted for 10% and 11% of total sales of the Fresenius Group for 2005 and 2004, respectively.
13. PREPAID EXPENSES AND OTHER CURRENT AND NON-CURRENT ASSETS
As of December 31, prepaid expenses and other current and non-current assets comprise the
following:
2005 2004in million € thereof short-term thereof short-term
Accounts receivable resulting from German “Krankenhausgesetz” 175 105 4 4
Tax receivables 118 115 73 71
Investments and long-term loans 69 0 53 0
Derivative financial instruments 52 9 53 14
Advances made 43 22 25 23
Prepaid expenses 39 10 39 7
Re-insurance claims 24 0 19 0
Accounts receivable from management contracts in clinics 18 18 14 14
Other assets 306 205 245 155
Prepaid expenses and other assets, gross 844 484 525 288
less allowances 7 6 8 5
Prepaid expenses and other assets, net 837 478 517 283

Notes 142
Depreciation
As of Foreign Changes in As ofJanuary 1, currency entities Reclassifi- December 31,
in million € 2005 translation consolidated Additions cations Disposals 2005
Land and land facilities 0 0 0 0 0 0 0
Buildings and improvements 423 28 92 74 4 23 598
Machinery and equipment 1,061 42 77 188 -4 99 1,265
Machinery, equipment and rental
equipment under capital leases 69 2 0 13 0 9 75
Construction in progress 1 1 0 0 0 1 1
Property, plant and equipment 1,554 73 169 275 0 132 1,939
in million € December 31, 2005 December 31, 2004
Land and land facilities 166 97
Buildings and improvements 1,019 721
Machinery and equipment 817 682
Machinery, equipment and rental equipment under capitalized leases 98 98
Construction in progress 256 98
Property, plant and equipment 2,356 1,696
14. PROPERTY, PLANT AND EQUIPMENT
As of December 31, the acquisition and manufacturing costs and accumulated depreciation of prop-
erty, plant and equipment consist of the following:
Acquisition and manufacturing costs
Carrying amounts
As of Foreign Changes in As ofJanuary 1, currency entities Reclassifi- December 31,
in million € 2005 translation consolidated Additions cations Disposals 2005
Land and land facilities 97 2 69 1 0 3 166
Buildings and improvements 1,144 71 350 58 27 33 1,617
Machinery and equipment 1,743 94 167 152 34 108 2,082
Machinery, equipment and rental
equipment under capital leases 167 0 3 15 -1 11 173
Construction in progress 99 4 94 122 -60 2 257
Property, plant and equipment 3,250 171 683 348 0 157 4,295

Affiliated Companies Consolidated Financial Statements Report Supervisory Board Supervisory Board Glossary Index 143
The depreciation expense for 2005 and 2004 amounted to € 275 million and € 265 million,
respectively.
Included in property, plant and equipment as of December 31, 2005 and 2004 were € 111 million and
€ 93 million, respectively, of peritoneal dialysis cycler machines which Fresenius Medical Care leases
to customers with end-stage renal disease on a month-to-month basis and hemodialysis machines
which Fresenius Medical Care leases to physicians under operating leases.
To a lesser extent, property, plant and equipment are also leased for the treatment of patients by
other business segments.
Depreciation on machinery, equipment and rental equipment under capital leases amounted to € 13
million and € 10 million in 2005 and 2004, respectively.
For details of minimum lease payments see Note 18, Debt and capital lease obligations.
In conjunction with financial services activities, the companies of the Fresenius Group lease out their
own products. For the year 2005 the cost and accumulated depreciation on such assets amounted to
€ 151 million and € 33 million, respectively. Minimum lease payments under non-cancellable opera-
ting leases in an amount of € 4 million fall due as follows:
As of Foreign Changes in As ofJanuar 1, currency entities Reclassifi- December 31,
in million € 2005 translation consolidated Additions cations Disposals 2005
Goodwill 2,909 349 107 1,328 0 9 4,684
Patient relationships 202 24 12 1 1 103 137
Tradenames and patents 223 26 0 1 1 1 250
Distribution rights 20 0 3 1 0 0 24
Other 346 43 12 13 -2 25 387
Goodwill and other
intangible assets 3,700 442 134 1,344 0 138 5,482
15. GOODWILL AND OTHER INTANGIBLE ASSETS
As of December 31, 2005, the acquisition cost and accumulated amortization of intangible assets
consist of the following:
Acquisition cost
in million € 2005
Due within one year 1
Due in between one and five years 3
Due later than five years 0

Notes144
in million € December 31, 2005 December 31, 2004
Goodwill 4,680 2,905
Patient relationships 41 36
Tradenames and patents 217 192
Distribution rights 10 13
Other 273 239
Goodwill and other intangible assets 5,221 3,385
Carrying amounts
The split of intangible assets into regularly amortizable and non-amortizable intangible assets is
shown in the following table:
Regularly amortizable intangible assets
December 31, 2005 December 31, 2004Acquisition Accumulated Carrying Acquisition Accumulated Carrying
in million € cost amortization amounts cost amortization amounts
Patient relationships 137 96 41 202 166 36
Patents 46 33 13 44 31 13
Distribution rights 24 14 10 20 7 13
Other 202 114 88 186 107 79
Total 409 257 152 452 311 141
As of Foreign Changes in As ofJanuary 1, currency entities Reclassifi- December 31,
in million € 2005 translation consolidated Additions cations Disposals 2005
Goodwill 4 0 0 0 0 0 4
Patient relationships 166 19 0 14 0 103 96
Tradenames and patents 31 0 0 4 0 2 33
Distribution rights 7 0 2 5 0 0 14
Other 107 7 7 19 0 26 114
Goodwill and other
intangible assets 315 26 9 42 0 131 261
Amortization

Affiliated Companies Consolidated Financial Statements Report Supervisory Board Supervisory Board Glossary Index 145
December 31, 2005 December 31, 2004Acquisition Accumulated Carrying Acquisition Accumulated Carrying
in million € cost amortization amounts cost amortization amounts
Tradenames 204 0 204 179 0 179
Management contracts 185 0 185 160 0 160
Subtotal 389 0 389 339 0 339
Goodwill 4,684 4 4,680 2,909 4 2,905
Total 5,073 4 5,069 3,248 4 3,244
Since the implementation of SFAS No. 142, the accumulated amortization of non-amortizable intangible
assets is due to impairments.
Amortization on intangible assets amounted to € 42 million and € 43 million for 2005 and 2004,
respectively.
The regularly amortizable intangible assets have an average useful life of 15 years (patient relation-
ships an average of 12 years, patents an average of 11 years, distribution rights an average of 4 years,
other intangible assets an average of 19 years).
In 2002, in connection with an acquisition, the Group acquired research results which have an alter-
native future use. The costs of € 12 million were recognized as assets and are being amortized over
their estimated useful life. In 2005 € 4 million were recognized as subsequent acquisition cost.
In 2004, a goodwill impairment loss of € 4 million was recognized in the Fresenius Biotech business
segment (which is part of the Group/Other segment) since the prospects for one project have changed
in the light of results of clinical studies, thus resulted in a reduction of the present value of expected
cash flows.
Non-amortizable intangible assets

Notes146
The increase in the carrying amount mainly results from the addition of the goodwill due to the
HELIOS acquisition in an amount of approximately € 1.2 billion and from foreign currency translation
effects mainly referring to the goodwill of Fresenius Medical Care.
16. OTHER ACCRUED EXPENSES
As of December 31, other accrued expenses consist of the following:
2005 2004in million € thereof short-term thereof short-term
Personnel expenses 242 242 198 198
Special charge for legal matters 100 100 90 90
Advances received 85 85 58 58
Self-insurance programs 64 64 42 42
Bonuses and discounts 38 38 34 34
Legal matters, advisory and audit fees 23 23 18 18
Warranties and complaints 21 21 19 19
Commissions 20 20 21 21
Physician compensation 18 18 16 16
All other accrued expenses 262 193 126 101
Other accured expenses 873 804 622 597
in million € 2006 2007 2008 2009 2010
Estimated amortization expenses
for the next five fiscal years 37 30 22 17 13
in million €
Carrying amount as of January 1, 2005 2,905
Additions/disposals, net 1,426
Impairment 0
Reclassifications 0
Foreing currency translation 349
Carrying amount as of December 31, 2005 4,680
The carrying amount of goodwill has developed as follows:
Estimated regular amortization expenses of intangible assets for the next five years are shown in the
following table:

Affiliated Companies Consolidated Financial Statements Report Supervisory Board Supervisory Board Glossary Index 147
Other accrued expenses develop in the fiscal year as follows:
As of Changes in Foreign As ofJanuary 1, entities Reclassifi- currency December 31,
in million € 2005 consolidated Additions cations Utilized Reversed translation 2005
Personnel expenses 198 21 107 0 71 12 -1 242
Special charge for
legal matters 90 0 0 0 4 0 14 100
Advances received 58 15 93 1 68 12 -2 85
Self-insurance programs 42 0 16 0 0 0 6 64
Bonuses and discounts 34 3 29 -2 24 3 1 38
Legal matters, advisory
and audit fees 18 3 14 0 10 2 0 23
Warranties and complaints 19 0 17 1 8 6 -2 21
Commissions 21 0 20 0 20 2 1 20
Physician compensation 16 0 0 0 0 0 2 18
All other accrued expenses 126 92 137 0 74 8 -11 262
Total 622 134 433 0 279 45 8 873
At December 31, 2005, there is a balance of US$ 118 million (€ 100 million), including US$ 115 million
for a settlement payment relating to the accrual for the special charge for legal matters of Fresenius
Medical Care as described below. Fresenius Medical Care believes that these provisions are adequate
for the settlement of those matters. During 2005, US$ 5 million (€ 4 million) were applied against the
accrual for the special charge for legal matters.

Notes 148
In 2001, Fresenius Medical Care recorded a US$ 258 million special charge to address 1996 merger-
related legal matters, estimated liabilities and legal expenses arising in connection with the W.R.
Grace &Co. Chapter 11 proceedings (Grace Chapter 11 Proceedings) and the cost of resolving pending
litigation and other disputes with certain commercial insurers (see Note 24, Commitments and con-
tingent liabilities).
Fresenius Medical Care accrued US$ 172 million principally representing a provision for income taxes
payable for the years prior to the 1996 merger for which W.R. Grace &Co. had agreed to indemnify
Fresenius Medical Care, but which Fresenius Medical Care may ultimately be obligated to pay as a
result of Grace’s Chapter 11 Proceedings. In addition, that amount included the costs of defending
the Fresenius Medical Care in litigation arising out of the Grace Chapter 11 Proceedings (see Note
24, Commitments and contingent liabilities).
Fresenius Medical Care included US$ 55 million in the special charge to provide for settlement obli-
gations, legal expenses and the resolution of disputed accounts receivable relating to various insur-
ance companies.
The remaining amount of the special charge of US$ 31 million was accrued mainly for (1) assets and
receivables that are impaired in connection with other legal matters and (2) anticipated expenses
associated with the continued defense and resolution of the legal matters.
During the second quarter of 2003, the court supervising the Grace Chapter 11 Proceedings approved
the definitive settlement agreement entered into among Fresenius Medical Care, the committee
representing the asbestos creditors and W.R. Grace &Co (see Note 24, Commitments and contingent
liabilities). Under the settlement agreement, Fresenius Medical Care will pay US$ 115 million upon
plan confirmation. Based on these developments, Fresenius Medical Care reduced its estimate in
2003 for the settlement and related costs of the Grace Chapter 11 Proceedings by US$ 39 million.
This reduction of the provision for the W.R. Grace &Co. matter has been applied to the other compo-
nents of the special charge (i.e. reserves for settlement obligations and disputed accounts receivable
from commercial insurers and other merger-related legal matters described in this Note).

Affiliated Companies Consolidated Financial Statements Report Supervisory Board Supervisory Board Glossary Index 149
Of the total amount of other non-current liabilities amounting to € 235 million at December 31, 2005
€ 158 million are due in between one and five years and € 77 million are due later than five years.
The caption long-term accrued expenses and other long-term liabilities in an amount of € 304 mil-
lion includes also long-term accrued expenses in an amount of € 69 million as of December 2005.
18. DEBT AND CAPITAL LEASE OBLIGATIONS
Short-term borrowings
Lines of credit and short-term borrowings
Short-term borrowings of € 224 million and € 391 million at December 31, 2005, and 2004, respect-
ively, represent amounts borrowed by certain subsidiaries of the Fresenius Group under lines of credit
with commercial banks. The average interest rates on these borrowings in 2005 and 2004 was 4.7%
and 3.8% p.a., respectively.
Excluding amounts available under the Fresenius Medical Care 2003 Senior Credit Agreement (as
described below), at December 31, 2005 and 2004, the Fresenius Group had € 610 million and € 490
million, respectively, available under such commercial bank agreements. In some instances, lines of
credit are secured by assets of the Fresenius Group’s subsidiary that is party to the agreement and
may contain various covenants including, but not limited to, requirements for maintaining defined
levels of working capital, net worth, capital expenditures and certain financial ratios.
17. OTHER LIABILITIES
As of December 31, other liabilities consist of the following:
2005 2004in million € thereof short-term thereof short-term
Accounts receivable resulting from German “Krankenhausgesetz” 172 127 5 5
Personnel liabilities 113 110 66 49
Advance payments from customers 87 82 66 66
Tax liabilities 80 77 53 51
Accounts receivable credit balance 44 13 33 9
Derivative financial instruments 39 15 74 15
Interest liabilities 27 27 20 20
Accounts payable to government institutions 2 2 26 26
All other liabilities 389 265 181 149
Other liabilities 953 718 524 390

Notes 150
Accouts receivable facility
Fresenius Medical Care has an asset securitization facility (accounts receivable facility), which provides
borrowings up to a maximum of US$ 460 million (€ 390 million). Under the facility, certain receivables
are sold to NMC Funding Corporation (NMC Funding)., a wholly-owned subsidiary of Fresenius Medical
Care. NMC Funding then assigns undivided ownership interests in the accounts receivable to certain
bank investors. Under the terms of the accounts receivable facility, NMC Funding retains the right to
recall all transferred interests in the accounts receivable assigned to the banks under the facility. As
Fresenius Medical Care has the right at any time to recall the then outstanding interests, the receivables
remain on the consolidated balance sheet and the proceeds from the transfer of undivided interests
are recorded as short-term borrowings.
At December 31, 2005 there are outstanding short-term borrowings under the facility of US$ 94 mil-
lion (€ 80 million). NMC Funding pays interest to the bank investors, calculated based on the com-
mercial paper rates for the particular tranches selected. The effective interest rate during the twelve
months ended December 31, 2005 ranged from 2.49% to 4.63%. The costs are expensed as incurred
and recorded as interest expense and related financing costs. On October 20, 2005 Fresenius Medical
Care amended the accounts receivable facility to extend the maturity date to October 19, 2006.
Long-term debt and liabilities from capital lease obligations
As of December 31, long-term debt and capital lease obligations consist of the following:
in milion € 2005 2004
Bridge loan facility 600 0
Euro Notes 460 389
Euro Bonds 400 400
Fresenius Medical Care 2003 Senior Credit Agreement 399 356
European Investment Bank agreement 41 0
Capital lease obligations 40 41
Other 337 223
Subtotal 2,277 1,409
less current portion 222 190
Long-term debt and capital lease obligations, less current portion 2,055 1,219

Affiliated Companies Consolidated Financial Statements Report Supervisory Board Supervisory Board Glossary Index 151
for the fiscal years in million €
2006 222
2007 260
2008 163
2009 766
2010 113
Subsequent years 753
Total 2,277
Aggregate annual repayments applicable to the Euro Notes, Fresenius Medical Care 2003 Senior
Credit Agreement, Bonds, capital leases and other borrowings for the five years subsequent to
December 31, 2005 (excluding borrowings underlying trust preferred securities, see Note 20, Trust
preferred securities) are:
in % 2005 2004
Liabilities to banks 6.1 6.7
Capital lease obligations 5.7 5.6
The weighted effective interest rates at the balance sheet date for long-term liabilities are shown in
the following table:
Bridge loan facility
In October 2005, Fresenius AG entered into an agreement pursuant to which two banks agreed to
provide a loan facility in the amount of € 700 million with a term of 364 days to bridge the issuance
of the Notes (see Note 32, Subsequent events). The loan facility was guaranteed by Fresenius Kabi AG
and Fresenius ProServe GmbH and was used in addition to the proceeds from the capital increase
(see Note 22, Shareholders’ equity) to fund the acquisition of HELIOS Kliniken GmbH and the busi-
ness of Clinico GmbH. From December 1, 2005, the bridge loan facility was reduced by € 100 million
to € 600 million because the proceeds from the capital increase exceeded the amount according
to the original finance concept. At the end of December 2005, the loan facility was fully used for the
purchase of the acquisitions and was repaid by the proceeds of the Notes issuance at the end of
January 2006 (see Note 32, Subsequent events). The bridge financing facility is shown under the
balance sheet caption long-term debt as of December 31, 2005, as it belongs to this long-term Note.

Notes 152
Euro Notes
Euro Notes (Schuldscheindarlehen) issued by Fresenius Finance B.V. amounting to € 260 million have
residual terms to maturity of up to 3 years. Interest rates are linked to EURIBOR. The Euro Notes
(Schuldscheindarlehen), which are mostly hedged through interest swaps, carried interest rates of
between 3.95% and 5.61% during the year 2005.
On July 27, 2005, Fresenius Medical Care issued new Euro Notes (Schuldscheindarlehen) totaling
€ 200 million with a € 126 million tranche at a fixed interest rate of 4.57% and a € 74 million tranche
with a floating rate at EURIBOR plus applicable margin resulting in an average interest rate of 4.10%
for the period ending December 31, 2005. The Euro Notes mature on July 27, 2009. The proceeds
were used to liquidate € 129 million of Euro Notes issued in 2001 that were due in July 2005 and for
working capital.
Euro Bonds
In April 2003, Fresenius Finance B.V. issued Euro Bonds for a total amount of € 400 million in two
tranches in order to repay short-term bank loans. Both tranches have a maturity of six years. The first
tranche of € 300 million bears interest at 7.75% p.a. and is three years non-callable by the issuer (for
the first time on April 30, 2006). If the company decides to apply its right to give notice to redeem
the Euro Bonds early, the redemption will be effected at different price levels which, depending on
the date on which notice is given, could exceed the issue price. The redemption prices were fixed at
the date of issue. The second tranche of € 100 million bears interest at 7.5% p.a. and is not callable
before maturity. The Fresenius Group applied to its right to give notice to redeem the bonds earlier
in January 2006 and 71% of the volume of the first tranche were repurchased (see Note 32, Subse-
quent events).
The fixed interest tranche with a nominal amount of € 400 million issued in the year 1999 was refi-
nanced in mid-May 2004 by senior notes for a total amount of € 260 million with a maturity of two to
five years. In addition short-term bank facilities and the commercial paper program were utilized.
The Euro Bonds of Fresenius Finance B.V., issued in April 2003, are guaranteed by Fresenius AG,
Fresenius Kabi AG and Fresenius ProServe GmbH. Fresenius AG has given a number of commitments
to provide protection to the bondholders, which, under certain circumstances, partly restrict the scope
of action of Fresenius AG and its subsidiaries (excluding FMC-AG & Co. KGaA and their subsidiaries).
These commitments include, amongst other things, restrictions in the amount of further debt that
can be raised, the payment of dividends, the volume of capital expenditure, the redemption of subord-
inated liabilities and the mortgaging or sale of assets. Some of these restrictions are lifted automati-
cally when the rating of the company reaches investment grade. In the event of non-compliance with

Affiliated Companies Consolidated Financial Statements Report Supervisory Board Supervisory Board Glossary Index 153
the terms of the Euro Bonds, the bondholders (owning in aggregate more than 25% of the outstand-
ing Euro Bonds) are entitled to call the Euro Bonds and demand immediate repayments plus interest.
As of December 31, 2005, the Fresenius Group is in compliance with all of its commitments.
Fresenius Medical Care 2003 Senior Credit Agreement
On February 21, 2003, Fresenius Medical Care entered into an amended and restated bank agreement
(Fresenius Medical Care 2003 Senior Credit Agreement) with Bank of America N.A., Credit Suisse
First Boston, Dresdner Bank AG New York, JPMorgan Chase Bank, The Bank of Nova Scotia and
certain other lenders (collectively: Lenders), replacing the 1996 NMC Senior Credit Agreement that
was scheduled to expire at September 30, 2003. Under the terms of the Fresenius Medical Care 2003
Senior Credit Agreement, the Lenders made available to Fresenius Medical Care and certain subsid-
iaries and affiliates an aggregate amount of up to US$ 1,500 million. Under the Fresenius Medical
Care 2003 Senior Credit Agreement, all principal payments made on term loans permanently reduce
the total amounts available.
Amendments in 2004 reduced the aggregate amount available to US$ 1,200 million while increasing
the available amounts under the revolving loan portion and reducing the amounts available under the
term loan portion. In the 2004 amendments, Fresenius Medical Care also reduced the interest rates
on the Revolving Credit by 62.5 basis points and the interest rates on certain of the term loan tranches
by 62.5 and 75 basis points while extending the termination date of the facility until February 28,
2010. In addition, under the 2004 amendments, Fresenius Medical Care can increase the amount of
the revolving credit facility by up to US$ 200 million during the extended life of the Fresenius Medical
Care 2003 Senior Credit Agreement.
The following table shows the available and outstanding credit under the Fresenius Medical Care
2003 Senior Credit Agreement as of December 31:
Maximum amount available Balance outstanding
in US$ million 2005 2004 2005 2004
Revolving Credit 750 750 46 35
Term Loan A-1 425 450 425 450
Total 1,175 1,200 471 485
As of December 31, 2005, US$ 80 million (€ 68 million) is committed by Fresenius Medical Care to
outstanding letters of credit which are not included as part of the Balance outstanding as of December
31, 2005.

Notes 154
The terms of the credit facilities available at December 31, 2005 are:
Ω a revolving credit facility of up to US$ 750 million (of which up to US$ 250 million is available for
letters of credit, up to US$ 300 million is available for borrowings in certain non-US currencies,
up to US$ 75 million is available as swing line in US dollars, up to US$ 250 million is available as
a competitive loan facility and up to US$ 50 million is available as swing line in certain non-US
currencies, the total of which cannot exceed US$ 750 million) which will be due and payable on
February 28, 2010.
Ω a term loan facility (Loan A-1) of US$ 450 million, also maturing on February 28, 2010. The terms
of the Fresenius Medical Care 2003 Senior Credit Agreement require payments that permanently
reduce the term loan facility. The repayment began in the fourth quarter of 2005 and amounts to
US$ 25 million per quarter. The remaining amount outstanding is due on February 28, 2010.
The revolving credit facility and Loan A-1 interest rates are equal to LIBOR plus an applicable margin,
or base rate, defined as the higher of the Bank of America prime rate or the Federal Funds rate plus
0.5% plus the applicable margin. The applicable margin is variable and depends on the ratio of
Fresenius Medical Care’s funded debt to EBITDA as defined in the Fresenius Medical Care 2003
Senior Credit Agreement.
In addition to scheduled principal payments, indebtedness outstanding under the Fresenius Medical
Care 2003 Senior Credit Agreement will be reduced by portions of the net cash proceeds from certain
sales of assets, securitization transactions other than Fresenius Medical Care’s existing accounts
receivable financing facility and the issuance of subordinated debt.
The Fresenius Medical Care 2003 Senior Credit Agreement contains affirmative and negative covenants
with respect to Fresenius Medical Care and its subsidiaries and other payment restrictions. Some of
the covenants limit indebtedness of and investments by Fresenius Medical Care, and require Fresenius
Medical Care to maintain certain ratios defined in the agreement. Additionally, the Fresenius Medical
Care 2003 Senior Credit Agreement provides for a dividend restriction which is US$200 million for
dividends paid in 2006, and increases in subsequent years. Fresenius Medical Care paid dividends
of US$137 million (€ 109 million) in 2005. In default, the outstanding balance under the Fresenius
Medical Care 2003 Senior Credit Agreement becomes immediately due and payable at the option
of the Lenders. At December 31, 2005 Fresenius Medical Care is in compliance with all financial
covenants under the Fresenius Medical Care 2003 Senior Credit Agreement.

Affiliated Companies Consolidated Financial Statements Report Supervisory Board Supervisory Board Glossary Index 155
In connection with the acquisition of Renal Care Group, Inc., the Fresenius Medical Care has entered
into a commitment letter pursuant to which Bank of America, N.A. and Deutsche Bank AG have agreed,
subject to certain conditions, to underwrite an aggregate US$ 5.0 billion in principal amount of term
and revolving loans for syndication to other financial institutions that would replace the Fresenius
Medical Care 2003 Senior Credit Agreement (see Note 2, Acquisitions and desinvestitures).
European Investment Bank agreement
Fresenius Medical Care entered into a credit agreement with the European Investment Bank (EIB) on
July 13, 2005 in the total amount of € 131 million consisting of a € 90 million revolving credit line
and a € 41 million term loan. The facility has an 8-year term with the revolving line terminating on
July 12, 2013 and the term loan terminating on September 13, 2013. Both loans bear variable interest
rates that change quarterly with Fresenius Medical Care having options to convert into fixed rates.
The EIB is a not-for-profit long-term, lending institution of the European Union that loans funds at
favorable rates for the purpose of capital investment projects, normally for up to half of the funds
required for such projects. Fresenius Medical Care will use these funds to refinance certain research
and development projects and investments in expansion and optimization of existing production
facilities in Germany. The loans are secured by bank guarantees and have customary covenants. The
term loan was drawn down on September 15, 2005 with average interest for the period ending
December 31, 2005 at 3.89%. There have been no drawdowns on the revolving credit facility as of
December 31, 2005.
Capital lease obligations
Details of capital lease obligations are given below:
in million € 2005
Capital lease obligations (minimum lease payments) 79
due within one year 11
due between one and five years 32
due later than five years 36
Interest component included in future minimum lease payments 39
due within one year 5
due between one and five years 17
later than five years 17
Present value of capital lease obligations (minimum lease payments) 40
due within one year 6
due between one and five years 15
due later than five years 19

Notes 156
19. PENSIONS AND SIMILAR OBLIGATIONS
General
Pension provisions are recognized for obligations for current and future pension benefits to current
and former employees of the Fresenius Group and their surviving dependents. Pension plans are
structured differently according to the legal, economic and financial circumstances in each relevant
country; in general, however, plan benefits are based on employee’s years of services and final salary.
A distinction must be made between defined benefit and defined contribution plans. Under defined
benefit plans, the entity is required to pay the benefits granted to current and former employees when
they are due. Defined benefit plans may be funded or unfunded. Within the Fresenius Group, funded
pension plans are in place in particular in the USA, Norway, the United Kingdom, the Netherlands
and Austria.
Under defined contribution plans, an entity pays fixed contributions into a separate entity or fund
during the life of the service relationship and does not assume any other obligations.
Pension obligations under defined benefit plans are computed on an actuarial basis at the level of the
defined benefit obligation. This computation requires the use of estimates. The main factors affecting
the level of the obligations are: assumptions on life expectancy, the discount rate and salary and pen-
sion level trends.
In the case of funded plans, the defined benefit obligation is offset against plan assets. A pension
asset is recognized (and reported under other assets) if the fair value of plan assets exceeds the defined
benefit obligation and if the entity has a right of reimbursement against the fund or a right to reduce
future payments to the fund. A pension liability is recognized if the defined benefit obligation exceeds
the fair value of plan assets. This liability is reported under pension provisions.
Actuarial gains and losses may result from increases or decreases in either the present value of the
defined benefit obligation or in the fair value of plan assets. Causes of actuarial gains or losses include
the effect of changes in assumptions, changes in estimates caused by the actual development of risks
impacting on pension obligations and differences between the actual and expected return on plan
assets.
Defined benefit pension plans
More than half of the pension obligations totaling € 305 million relate to the “Versorgungsordnung
der Fresenius-Unternehmen“ established in 1988, which applies for most of the German entities of
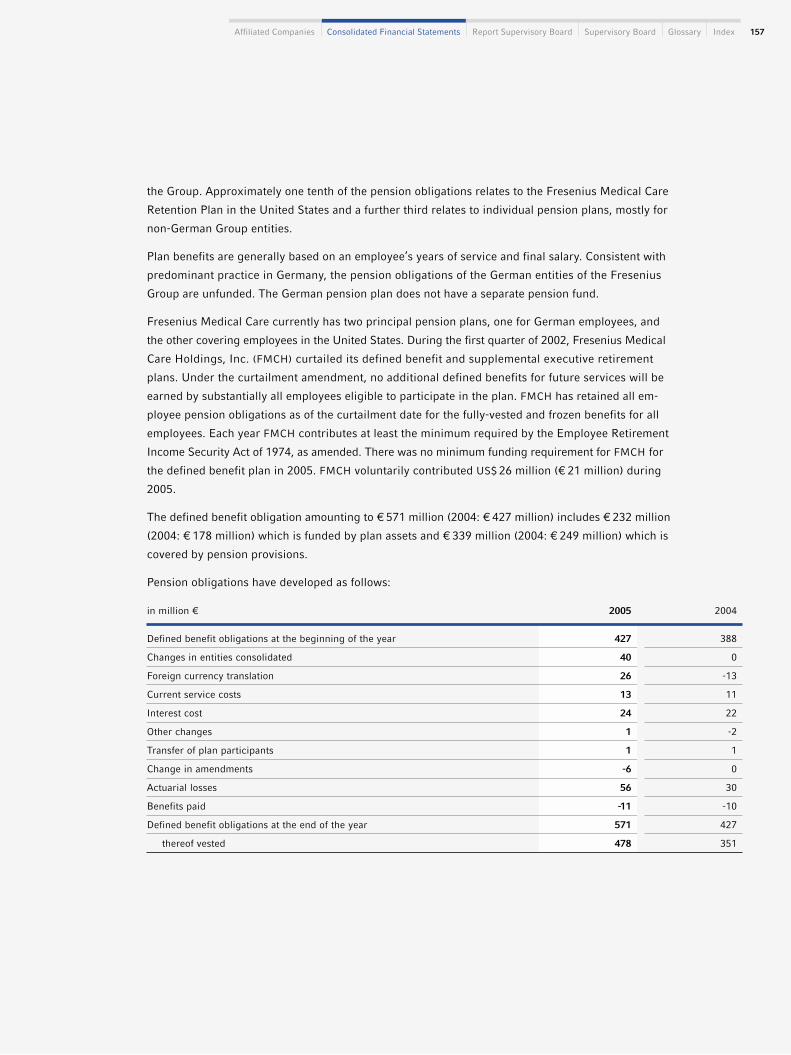
Affiliated Companies Consolidated Financial Statements Report Supervisory Board Supervisory Board Glossary Index 157
the Group. Approximately one tenth of the pension obligations relates to the Fresenius Medical Care
Retention Plan in the United States and a further third relates to individual pension plans, mostly for
non-German Group entities.
Plan benefits are generally based on an employee’s years of service and final salary. Consistent with
predominant practice in Germany, the pension obligations of the German entities of the Fresenius
Group are unfunded. The German pension plan does not have a separate pension fund.
Fresenius Medical Care currently has two principal pension plans, one for German employees, and
the other covering employees in the United States. During the first quarter of 2002, Fresenius Medical
Care Holdings, Inc. (FMCH) curtailed its defined benefit and supplemental executive retirement
plans. Under the curtailment amendment, no additional defined benefits for future services will be
earned by substantially all employees eligible to participate in the plan. FMCH has retained all em-
ployee pension obligations as of the curtailment date for the fully-vested and frozen benefits for all
employees. Each year FMCH contributes at least the minimum required by the Employee Retirement
Income Security Act of 1974, as amended. There was no minimum funding requirement for FMCH for
the defined benefit plan in 2005. FMCH voluntarily contributed US$ 26 million (€ 21 million) during
2005.
The defined benefit obligation amounting to € 571 million (2004: € 427 million) includes € 232 million
(2004: € 178 million) which is funded by plan assets and € 339 million (2004: € 249 million) which is
covered by pension provisions.
Pension obligations have developed as follows:
in million € 2005 2004
Defined benefit obligations at the beginning of the year 427 388
Changes in entities consolidated 40 0
Foreign currency translation 26 -13
Current service costs 13 11
Interest cost 24 22
Other changes 1 -2
Transfer of plan participants 1 1
Change in amendments -6 0
Actuarial losses 56 30
Benefits paid -11 -10
Defined benefit obligations at the end of the year 571 427
thereof vested 478 351

Notes 158
in million € 2005 2004
Fair value of plan assets at the beginning of the year 178 156
Changes in entities consolidated -1 0
Foreign currency translation 21 -10
Actual return on plan assets 14 13
Employee contribution 25 24
Benefits paid -5 -5
Fair value of plan assets at the end of the year 232 178
Pension obligations amounting to € 571 million (2004: € 427 million) include € 253 million (2004:
€ 208 million) relating to funded defined obligation pension plans.
The funded status of the plans has developed as follows:
The pension provision is derived as follows:
in million € 2005 2004
Funded status 339 249
Unrecognized actuarial gain/loss -148 -87
Unrecognized service costs of prior years 6 3
Unrecognized transition obligation -2 -2
Net amount recognized 195 163
The additional minimum pension liability* is calculated as follows:
in million € 2005 2004
Fair value of plan assets 232 178
Accumulated benefit obligation (ABO) 532 347
Minimum pension liability* 300 169
Accrued benefit costs* 190 104
Additional minimum pension liability* 110 65
thereof intangible assets 2 1
thereof accumulated other comprehensive income (loss) 108 64
Increase of the minimum pension liability included in
other comprehensive income (loss) 44 13
* This calculation refers only to companies with an ABO in excess of plan assets.

Affiliated Companies Consolidated Financial Statements Report Supervisory Board Supervisory Board Glossary Index 159
As of 31 December, the pension liability is calculated as follows:
in million € 2005 2004
Net amount recognized 195 163
Additional minimum pension liability 110 65
Pension liability, at December 31 305 228
in % 2005 2004
Weighted-average assumptions for pension benefit obligations
as of December 31
Discount rate 4.7 5.4
Rate of compensation increase 3.5 3.7
Rate of pension increase 1.4 1.5
The following assumptions for pension benefit obligations are applied:
Defined benefit pension plans gave rise to a net periodic benefit cost of € 28 million (2004: € 27 million)
for the Fresenius Group, comprising the following components:
in million € 2005 2004
Components of net periodic benefit cost
Service costs 13 11
Interest cost 24 22
Expected return on plan assets -14 -11
Amortization of transition obligations 1 1
Amortization of prior service costs 1 0
Amortization of unrealized losses, net 3 4
Net periodic benefit cost 28 27
Net periodic benefit cost is allocated as personnel expense to each of the income statement function
lines.
The following assumptions for net periodic benefit cost are applied:
in % 2005 2004
Weighted-average assumptions for the net periodic benefit cost,
as of December 31
Discount rate 5.4 5.5
Expected return on plan assets 7.1 7.1
Rate of compensation increase 3.7 3.6

Notes 160
Changes in the discount factor, inflation and mortality assumptions used for the actuarial computation
resulted in actuarial losses in 2005 which increased the fair value of the defined benefit obligation.
Unrecognized actuarial losses outside the 10% corridor for each defined benefit plan amounted to
€ 148 million (2004: € 87 million).
The following table shows an analysis of actual and expected pension payments for the next years:
The measurement date used to determine pension benefit measurements was December 31, 2005 for
the plans of FMCH and September 30, 2005 for all non-US plans.
Pension obligations at December 31, 2005 and 2004 relate to the following geographical regions:
in million € 2005
Cash used for pension obligations
Benefit payments prior year 10
Benefit payments current year 11
Expected future benefit payments
Expected benefit payments in 2006 14
Expected benefit payments in 2007 15
Expected benefit payments in 2008 16
Expected benefit payments in 2009 18
Expected benefit payments in 2010 19
Expected benefit payments between 2011 and 2015 119
Total expected benefit payments for the next 10 years 201
in million € 2005 2004
Germany 229 139
Europe (excluding Germany) 49 51
North America 27 36
Asia-Pacific 0 2
Latin America 0 –
Africa 0 0
Total pension obligations 305 228

Affiliated Companies Consolidated Financial Statements Report Supervisory Board Supervisory Board Glossary Index 161
The pension obligations relate mainly to Europe and North America, with approximately 75% relating
specifically to Germany, one sixth relating to the rest of Europe and one tenth relating to North
America, respectively.
Approximately two thirds of beneficiaries are located in North America, approximately one quarter in
Germany and the remainder throughout the rest of Europe and other continents.
Plan investment policy and strategy
The investment strategy for the Fresenius Medical Care North America pension plan is to earn a long-
term rate of return on assets of at least 7.5% compounded annually while utilizing a target investment
allocation of 36% equity and 64% long-term US bonds.
The investment policy considers that there will be a time horizon for invested funds of more than 5 years.
The total portfolio will be measured against a policy index that reflects the asset class benchmarks and
the target asset allocation. The Plan policy does not allow investments in securities of FMC-AG & Co.
KGaA or other related party stock. The performance benchmarks for the separate asset classes include:
S&P 500 Index, Russell 2000 Growth Index, MSCI EAFE Index, Lehman U.S. Long Government /
Credit Bond Index and the HFRI Fund of Funds Index.
The following schedule describes the Fresenius Group´s allocation of its plan assets.
in % Allocation 2005 Allocation 2004 Target allocation
Categories of plan assets
Equity securities 43 48 37
Debt securities 55 50 61
Real estate 1 1 1
Other 1 1 1
Total 100 100 100
The expected long-term rate of return on assets of Fresenius Group amounts to 7.0% compounded
annually. Allocations in the fiscal year 2006 are expected to amount to € 22 million.
Defined contribution plans
Fresenius Group’s total expenses under defined contribution plans for the years 2005 and 2004 was
€ 14 million each. The main part relates to the 401(k) savings plan, which employees of FMCH
are eligible to join. Fresenius Medical Care’s total expense under this defined contribution plan was
€ 12 million in 2005 and 2004.

Notes 162
20. TRUST PREFERRED SECURITIES
Fresenius Medical Care issued trust preferred securities through Fresenius Medical Care Capital
Trusts, statutory business trusts organized under the laws of the State of Delaware/USA. Fresenius
Medical Care owns all of the common securities of these trusts. The sole asset of each trust is a senior
subordinated note of Fresenius Medical Care AG or a wholly-owned subsidiary of Fresenius Medical
Care AG. FMC-AG & Co. KGaA, Fresenius Medical Care Deutschland GmbH and Fresenius Medical
Care Holdings, Inc. (Fresenius Medical Care Deutschland GmbH and Fresenius Medical Care Holdings,
Inc., being the Guarantor Subsidiaries) have guaranteed payment and performance of the senior sub-
ordinated notes to the respective Fresenius Medical Care Capital Trusts. The trust preferred securities
are guaranteed by Fresenius Medical Care through a series of undertakings by Fresenius Medical
Care and the Guarantor Subsidiaries.
The trust preferred securities entitle the holders to distributions at a fixed annual rate of the stated
amount and are mandatorily redeemable after 10 years. Earlier redemption at the option of the holders
may also occur upon a change of control followed by a rating decline or defined events of default
including a failure to pay interest. Upon liquidation of the trusts, the holders of trust preferred securi-
ties are entitled to a distribution equal to the stated amount. The trust preferred securities do not
hold voting rights in the trust except under limited circumstances.
The trust preferred securities agreements contain affirmative and negative covenants with respect to
Fresenius Medical Care and its subsidiaries and other payment restrictions. Some of the covenants
limit the Fresenius Medical Care’s indebtedness and its investments, and require Fresenius Medical
Care to maintain certain ratios defined in the agreement. Some of these covenants are subordinated
to the Fresenius Medical Care 2003 Senior Credit Agreement covenants. As of December 31, 2005,
Fresenius Medical Care is in compliance with all financial covenants under all trust preferred securi-
ties agreements.
The trust preferred securities outstanding as of December 31, 2005 and 2004 are as follows:
MandatoryYear Stated redemption 2005 2004
issued amount Interest rate date in million € in million €
Fresenius Medical Care Capital Trust II 1998 US$ 450 million 77/8% Feb 1, 2008 366 324
Fresenius Medical Care Capital Trust III 1998 DM 300 million 73/8% Feb 1, 2008 154 154
Fresenius Medical Care Capital Trust IV 2001 US$ 225 million 77/8% Jun 15, 2011 183 158
Fresenius Medical Care Capital Trust V 2001 € 300 million 73/8% Jun 15, 2011 297 297
Trust preferred securities 1,000 933

Affiliated Companies Consolidated Financial Statements Report Supervisory Board Supervisory Board Glossary Index 163
21. MINORITY INTEREST
As of December 31, minority interest in the Group is as follows:
in million € 2005 2004
Minority interest in Fresenius Medical Care AG 2,144 1,684
Minority interest in the business segments
Fresenius Medical Care 12 13
Fresenius Kabi 25 27
Fresenius ProServe 108 19
Corporate/Other – 1
Total minority interest 2,289 1,744
Minority interest increased in 2005 by € 545 million to € 2,289 million. The change resulted on the
one hand from the minorities‘ share of profit for 2005 (€ 246 million), and from the minorities‘ share
of dividend payments (€ 76 million), first-time consolidations and positive currency effects (€ 375 mil-
lion) on the other.
22. SHAREHOLDERS’ EQUITY
Subscribed capital
The Management Board resolved on October 25, 2005 and on November 15, 2005, with the approval
of the Supervisory Board on the same dates, to increase the issued share capital for cash consideration
by € 24,064,000 from € 105,785,036.80 to € 129,849,036.80 by issuing 4,700,000 new bearer ordinary
shares (new ordinary shares) and 4,700,000 new bearer preference shares (new preference shares).
The new ordinary shares and the new preference shares were offered to the shareholders at a ratio of
9:2 in each case. The subscription price per new ordinary share and per new preference share was
€ 93 and € 102, respectively. The capital increase generated gross proceeds of € 919 million.
The registration of the capital increase with the commercial register in Bad Homburg v.d.H. took
place on November 29, 2005.
Following the increase, the subscribed capital of Fresenius AG is divided into 25,361,140 bearer
ordinary shares and 25,361,140 non-voting bearer preference shares. The shares are issued as non-
par value shares and have a theoretical nominal value of € 2.56.
During the fiscal year 2005 351,242 stock options were exercised.

Notes 164
In a letter dated May 19, 2005, Vermögensverwaltungsgesellschaft Nachlass Else Kröner mbH notified
Fresenius AG that, effective May 12, 2005, the voting rights held by it in Fresenius AG, fell below the
50% threshold and that it no longer holds any of the company‘s voting rights. Also in a letter dated
May 19, 2005, Else Kröner-Fresenius-Stiftung, Bad Homburg v.d.H., which owns 100% of Vermögens-
verwaltungsgesellschaft Nachlass Else Kröner mbH, notified the company that, effective May 12,
2005, the voting rights held by it in Fresenius AG continued to exceed the 50% threshold and that it
still owns 74.241% of the voting rights. However since May 12, 2005, 67.286% of the voting rights
are no longer attributable according to § 22 section 1 No. 1 of the German Trade Securities Act (WpHG)
but are led directly – just as 2.226% of the voting rights have been. 4.729% of the shares continue
to be attributable to the Foundation in accordance with § 22 section 2 sentence 1, 1st clause of the
German Trade Securities Act (WpHG).
In a letter dated November 21, 2005, Allianz AG, Munich, notified Fresenius AG in accordance with
§ 21 section 1 and § 24 of the WpHG that the number of Fresenius AG voting rights held by AZ-Argos
19 AG – that in future will operate under the name Allianz Deutschland AG, Königinstraße 28, 80802
Munich – exceed the 5% threshold on November 17, 2005 due to an internal reorganization of the
group and that it now owns 9.73% of the voting stock. These voting rights are allocated to AZ-Argos
19 AG in accordance with § 22 section 1 sentence 1 No.1 of the WpHG. The number of the voting
rights of Fresenius AG, Bad Homburg v.d.H. held by Allianz Aktiengesellschaft, Königinstraße 28,
80802 Munich, has changed in a manner that not requires notification.
Approved capital
By resolution of the Annual General Meeting on May 31, 2001, the Management Board of Fresenius AG
was authorized, with the approval of the Supervisory Board, to increase by May 30, 2006
Ω the subscribed capital of Fresenius AG by a maximum nominal value of € 20,480,000.00 by
issuing new bearer ordinary shares and/or non-voting bearer preference shares for cash (Approved
Capital I),
Ω the subscribed capital of Fresenius AG by a maximum nominal amount of € 10,240,000.00 by
Capital II). The Management Board is authorised with the approval of the Supervisory Board to
preclude the subscription rights of the shareholders as a whole (§§ 203 Section 2, 186 Section
3 sentence 4 Stock Corporation Law (AktG)).
These authorizations were exercised to implement the capital increase described in the section
“subscribed capital“. Approved Capital I was exercised in full; and Approved Capital II was partly
exercised. The remaining Approved Capital II amounts to € 6,656,000.00 as of December 31, 2005.

Affiliated Companies Consolidated Financial Statements Report Supervisory Board Supervisory Board Glossary Index 165
in € Ordinary shares Preference shares Total
Conditional Capital I Fresenius AG Stock Option Plan 1998 1,646,272.00 1,646,272.00 3,292,544.00
Conditional Capital II Fresenius AG Stock Option Plan 2003 2,304,000.00 2,304,000.00 4,608,000.00
Total conditional capital as of January 1, 2005 3,950,272.00 3,950,272.00 7,900,544.00
Fresenius AG Stock Option Plan 1998 – options exercised -400,023.04 -400,023.04 -800,046.08
Fresenius AG Stock Option Plan 2003 – options exercised -49,566.72 -49,566.72 -99,133.44
Total conditional capital as of December 31, 2005 3,500,682.24 3,500,682.24 7,001,364.48
Conditional capital
By resolution of the Annual General Meeting on May 28, 2003, the previous conditional capital (Con-
ditional Capital I) of € 4,448,010.24 was reduced to € 3,296,010.24, divided into 643,752 bearer
ordinary shares and 643,752 bearer preference shares. This amount is required to secure the sub-
scription rights in connection with the stock options on bearer ordinary shares and bearer preference
shares authorized by the Annual General Meeting on June 18, 1998.
In order to enable the 2003 Stock Option Plan to be executed, the subscribed capital was increased
conditionally (Conditional Capital II) by up to € 4,608,000.00 through the issue of up to 900,000 bearer
ordinary shares and 900,000 non-voting bearer preference shares. The issue of bearer ordinary
shares and non-voting bearer preference shares is made at the specified conversion price. The con-
ditional capital increase can only be carried out to the extent that the convertible bonds are issued and
the owners of the convertible bonds exercise their conversion rights.
Conditional capital develop as follows:
Capital reserves
Capital reserves comprise the premium paid on the issue of shares and stock options (additional paid-
in capital). The costs of the share capital increase in an amount of € 23 million in 2005 have been set
off against the capital reserves directly without any impact on the consolidated statement of income.
Other reserves
Other reserves comprise earnings generated by group entities in previous years to the extent that
they have not been distributed.

Notes 166
Dividends
Under the German Stock Corporation Act, the amount of dividends available for distribution to share-
holders is based upon the unconsolidated retained earnings of Fresenius AG as reported in its balance
sheet determined in accordance with the German Commercial Code (HGB).
At the Annual General Meeting on May 25, 2005, a resolution was passed to pay a dividend of € 1.35
per bearer ordinary share and € 1.38 per bearer preference share, i.e. a total dividend of € 55.9 mil-
lion was resolved.
23. OTHER COMPREHENSIVE INCOME (LOSS)
Other comprehensive income/loss comprises all amounts recognized directly in equity resulting from
the translation of foreign subsidiaries and the effects (net of tax) of measuring financial instruments
at their fair value as well as the change in the minimum pension liability.
Changes in the components of other comprehensive income (loss) in 2005 and 2004 were as follows:
2005 2004Amount Amount Amount Amount
in million € before taxes Tax effect after taxes before taxes Tax effect after taxes
Change in unrealized gains/ losses 56 -23 33 -29 11 -18
Realized gains/ losses due
to reclassifications -1 – -1 -7 3 -4
Change in unrealized gains/ losses on
derivative financial instruments 55 -23 32 -36 14 -22
Minimum pension liability -44 17 -27 -13 4 -9
Foreign currency translation adjustment 141 0 141 -20 0 -20
Other comprehensive income (loss) 152 -6 146 -69 18 -51

Affiliated Companies Consolidated Financial Statements Report Supervisory Board Supervisory Board Glossary Index 167
As of December 31, 2005 reconstruction obligations exist up to the year 2010 from the acquisition
contracts from hospitals at projected costs of up to € 171 million. Thereof € 80 million relates to the
year 2006.
Other commitmens than the above mentioned contingent liabilities are immaterial.
OTHER NOTES
24. COMMITMENTS AND CONTINGENT LIABILITIES
for the fiscal years in million €
2006 249
2007 211
2008 175
2009 145
2010 115
Thereafter 475
Total 1,370
Operating leases and rental payments
The companies of the Fresenius Group lease office and manufacturing buildings as well as machinery
and equipment under various lease agreements expiring on dates through 2026. Rental expense
recorded for operating leases for the years ended December 31, 2005 and 2004 was € 297 million and
€ 289 million, respectively.
At December 31, 2004, Fresenius Medical Care acquired dialysis machines that were previously sold
in sale-lease back transactions. The machines were acquired for € 23 million and are included in capital
expenditures in the accompanying consolidated statement of cash flows 2004 of the Fresenius
Group.
Future minimum rental payments under non-cancellable operating leases for the five years succeeding
December 31, 2005 and thereafter are:

Notes 168
Legal proceedings
Commercial litigation
Fresenius Medical Care was originally formed as a result of a series of transactions pursuant to the
Agreement and Plan of Reorganization (the Merger) dated as of February 4, 1996 by and between
W.R. Grace &Co. and Fresenius AG. At the time of the Merger, a W.R. Grace &Co. subsidiary known
as W.R. Grace &Co.-Conn. had, and continues to have, significant liabilities arising out of product-
liability related litigation (including asbestos-related actions), pre-Merger tax claims and other claims
unrelated to National Medical Care, Inc. (NMC), which was W.R. Grace &Co.’s dialysis business prior
to the Merger. In connection with the Merger, W.R. Grace &Co.-Conn. agreed to indemnify Fresenius
Medical Care, Fresenius Medical Care Holdings, Inc. (FMCH) and NMC against all liabilities of W.R.
Grace &Co., whether relating to events occurring before or after the Merger, other than liabilities
arising from or relating to NMC’s operations. W.R. Grace &Co. and certain of its subsidiaries filed for
reorganization under Chapter 11 of the U.S. Bankruptcy Code (the Grace Chapter 11 Proceedings) on
April 2, 2001.
Pre-Merger tax claims or tax claims that would arise if events were to violate the tax-free nature of
the Merger, could ultimately be Fresenius Medical Care’s obligation. In particular, W.R. Grace &Co.
has disclosed in its filings with the Securities and Exchange Commission that: its tax returns for the
1993 to 1996 tax years are under audit by the US tax authorities Internal Revenue Service (the Service);
W.R. Grace &Co. has received the Service’s examination report on tax periods 1993 to 1996; that
during those years W.R. Grace &Co. deducted approximately US$ 122 million in interest attributable
to corporate owned life insurance (COLI) policy loans; and that a U.S. District Court ruling has denied
interest deductions of a taxpayer in a similar situation W.R. Grace &Co. has paid US$ 21 million of tax
and interest related to COLI deductions taken in tax years prior to 1993.
In October 2004, W.R. Grace &Co. obtained bankruptcy court approval to settle its COLI claims with
the Service. In January 2005, W.R. Grace &Co., FMCH and Sealed Air Corporation executed a settle-
ment agreement with respect to the Service’s COLI-related claims and other tax claims.

Affiliated Companies Consolidated Financial Statements Report Supervisory Board Supervisory Board Glossary Index 169
At April 14, 2005, W.R. Grace &Co. paid the Service approximately US$ 90 million in connection with
taxes owed for the tax periods 1993 to 1996 pursuant to a bankruptcy court order directing W.R.
Grace &Co. to make such payment. Subject to certain representations made by W.R. Grace &Co.,
Fresenius Medical Care and Fresenius AG, W.R. Grace &Co. and certain of its affiliates had agreed to
indemnify Fresenius Medical Care against this and other pre-Merger and Merger-related tax liabilities.
Prior to and after the commencement of the Grace Chapter 11 Proceedings, class action complaints
were filed against W.R. Grace &Co. and FMCH by plaintiffs claiming to be creditors of W.R. Grace &
Co.-Conn., and by the asbestos creditors’ committees on behalf of the W.R. Grace &Co. bankruptcy
estate in the Grace Chapter 11 Proceedings, alleging among other things that the Merger was a
fraudulent conveyance, violated the uniform fraudulent transfer act and constituted a conspiracy. All
such cases have been stayed and transferred to or are pending before the U.S. District Court as part
of the Grace Chapter 11 Proceedings.
In 2003, Fresenius Medical Care reached agreement with the asbestos creditors’ committees on behalf
of the W.R. Grace &Co. bankruptcy estate and W.R. Grace &Co. in the matters pending in the Grace
Chapter 11 Proceedings for the settlement of all fraudulent conveyance and tax claims against it and
other claims related to Fresenius Medical Care that arise out of the bankruptcy of W.R. Grace &Co.
Under the terms of the settlement agreement as amended (the Settlement Agreement), fraudulent
conveyance and other claims raised on behalf of asbestos claimants will be dismissed with prejudice
and Fresenius Medical Care will receive protection against existing and potential future W.R. Grace &
Co. related claims, including fraudulent conveyance and asbestos claims, and indemnification against
income tax claims related to the non-NMC members of the W.R. Grace &Co. consolidated tax group
upon confirmation of a W.R. Grace &Co. final bankruptcy reorganization plan that contains such pro-
visions. Under the Settlement Agreement, Fresenius Medical Care will pay a total of US$ 115 million
to the W.R. Grace &Co. bankruptcy estate, or as otherwise directed by the Court, upon plan con-
firmation. No admission of liability has been or will be made. The Settlement Agreement has been
approved by the U.S. District Court. Subsequent to the Merger, W.R. Grace &Co. was involved in a
multi-step transaction involving Sealed Air Corporation (Sealed Air, formerly known as Grace Holding,

Notes 170
Inc.). Fresenius Medical Care is engaged in litigation with Sealed Air to confirm its entitlement to
indemnification from Sealed Air for all losses and expenses incurred by Fresenius Medical Care relating
to pre-Merger tax liabilities and Merger-related claims. Under the Settlement Agreement, upon con-
firmation of a plan that satisfies the conditions of Fresenius Medical Care’s payment obligation, this
litigation will be dismissed with prejudice.
On April 4, 2003, FMCH filed a suit in the U.S. District Court for the Northern District of California,
(Fresenius USA, Inc., et al., v. Baxter International, Inc., et al.), Case No. C 03-1431, seeking a declara-
tory judgment that FMCH does not infringe on patents held by Baxter International, Inc. and its
subsidiaries and affiliates (Baxter), that the patents are invalid, and that Baxter is without right or
authority to threaten or maintain suit against FMCH for alleged infringement of Baxter’s patents. In
general, the alleged patents concern touch screens, conductivity alarms, power failure data storage,
and balance chambers for hemodialysis machines. Baxter has filed counterclaims against FMCH
seeking monetary damages and injunctive relief, and alleging that FMCH will fully infringed on Baxter’s
patents. Both parties have filed multiple dispositive motions, some of which have been decided by
the court. Trial is currently scheduled for June 2006. FMCH believes its claims are meritorious,
although the ultimate outcome of any such proceedings cannot be predicted at this time and an adverse
result could have a material adverse effect on Fresenius Medical Care’s business, financial condition,
and results of operations.
For information regarding the settlement of shareholder litigation that challenged the resolutions
approving Fresenius Medical Care’s transformation of legal form and the conversion of preference
shares to ordinary shares, see Note 1. II, Transformation of Fresenius Medical Care’s legal form and
conversion of its preference shares.
Other litigation and potential exposures
In October 2004, FMCH and its Spectra Renal Management subsidiary received subpoenas from the
U.S. Department of Justice, Eastern District of New York in connection with a civil and criminal investi-
gation, which requires production of a broad range of documents relating to the FMCH’s operations,
with specific attention to documents relating to laboratory testing for parathyroid hormone (PTH)

Affiliated Companies Consolidated Financial Statements Report Supervisory Board Supervisory Board Glossary Index 171
levels and vitamin D therapies. Fresenius Medical Care is cooperating with the government’s requests
for information. While Fresenius Medical Care believes that it has complied with applicable laws
relating to PTH testing and use of vitamin D therapies, an adverse determination in this investigation
could have a material adverse effect on Fresenius Medical Care’s business, financial condition, and
results of operations.
In April 2005, FMCH received a subpoena from the U.S. Department of Justice, Eastern District of
Missouri, in connection with a joint civil and criminal investigation. The subpoena requires production
of a broad range of documents relating to the FMCH’s operations, with specific attention to documents
related to clinical quality programs, business development activities, medical director compensation
and physician relations, joint ventures and anemia management programs. Fresenius Medical Care is
cooperating with the government’s requests for information. An adverse determination in this investi-
gation could have a material adverse effect on Fresenius Medical Care’s business, financial condition
and results of operations.
Accrued special charge of Fresenius Medical Care for legal matters
At December 31, 2001, Fresenius Medical Care recorded a pre-tax special charge to reflect anticipated
expenses associated with the defense and resolution of pre-Merger tax claims, Merger-related claims,
and commercial insurer claims. The costs associated with the Settlement Agreement and settlements
with insurers have been charged against this accrual. While Fresenius Medical Care believes that its
remaining accruals reasonably estimate its currently anticipated costs related to the continued defense
and resolution of the remaining matters, no assurances can be given that its actual costs incurred will
not exceed the amount of this accrual.
Furthermore, the Fresenius Group is involved in various legal disputes arising from the ordinary course
of its business. Although the ultimate outcome of these legal disputes cannot be predicted, we do not
expect any material adverse effects on the business, financial condition and results of operations of
the Group.

Notes 172
25. FINANCIAL INSTRUMENTS
Market risk
I.) General
The Fresenius Group is inevitably exposed to effects related to foreign exchange fluctuations in con-
nection with its international business activities that are denominated in various currencies. In order
to finance its business operations the Fresenius Group issues bonds, trust preferred securities and
commercial papers and concludes mainly long-term credit agreements and mid-term Euro Notes
(Schuldscheindarlehen) with banks. Due to these financing activities the Fresenius Group is exposed
to interest risk caused by changes in variable interest rates and the risk of changes in the fair value
of balance sheet items caused by changes in fixed interest rates.
In order to manage the risks of interest rate and foreign exchange rate fluctuations, the Fresenius
Group enters into appropriate hedging transactions with highly rated financial institutions as
authorized by the Management Board. Derivative financial instruments are not used for trading
purposes.
In general, the Fresenius Group conducts its derivative financial instrument activities under the
control of a single centralized department. The Fresenius Group has established guidelines derived
from best practice standards in the banking industry for risk assessment procedures and supervision
concerning the use of financial derivatives. These guidelines require, amongst other things a clear
segregation of duties in the areas of execution, administration, accounting and controlling.
The Fresenius Group calculates benchmarks for individual exposures in order to quantify interest
and foreign exchange risks. The benchmarks are derived from achievable and reasonable market
rates. Depending on the individual benchmarks appropriate hedge strategies are determined and
implemented as scheduled.
As of December 31, 2005 the notional amounts of Fresenius Group’s foreign exchange derivatives
amounted to € 1,390 million and the notional amounts of interest rate derivatives amounted to
€ 3,386 million. In the case of interest rate derivatives it should be voted that the notional amounts
generally only represent the base for contract specific computations and not necessarily the exchange
of amounts by the parties. A potential risk resulting from the use of interest rate derivatives therefore
cannot be measured solely on the bases of the notional amounts of the contracts.
Earnings of the Fresenius Group were not materially affected by hedge ineffectiveness in the reporting
period since the critical terms of the interest and foreign exchange derivatives matched the critical
terms of the underlying exposures.
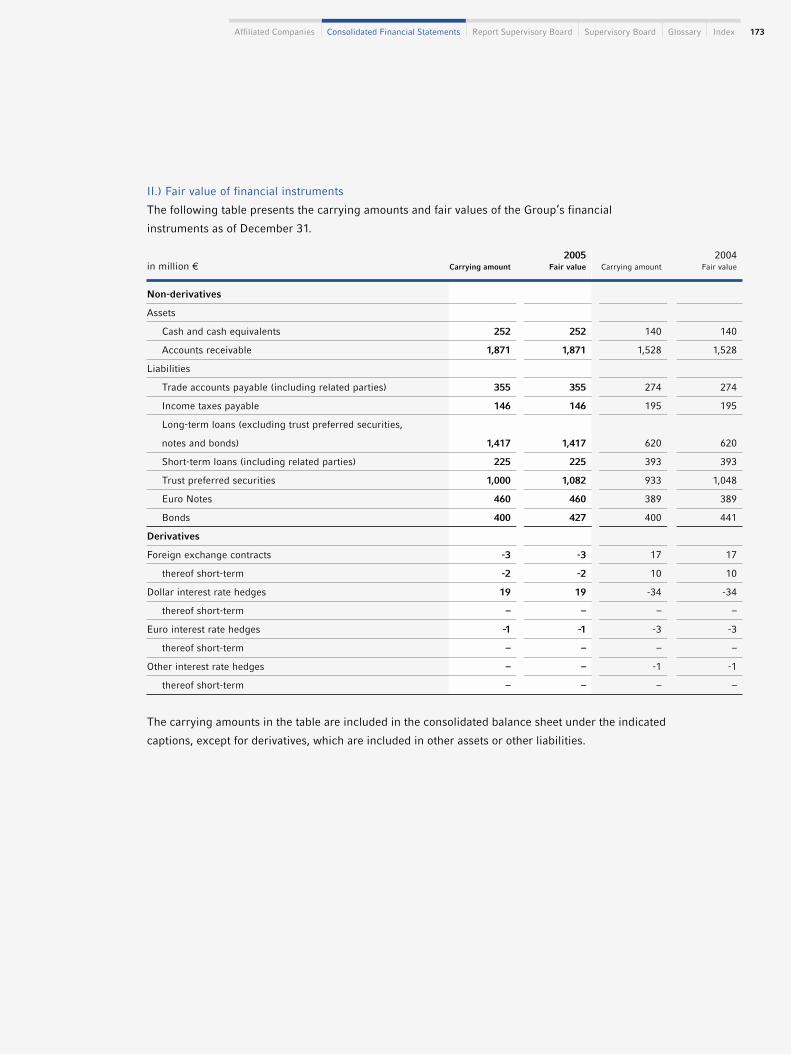
Affiliated Companies Consolidated Financial Statements Report Supervisory Board Supervisory Board Glossary Index 173
II.) Fair value of financial instruments
The following table presents the carrying amounts and fair values of the Group’s financial
instruments as of December 31.
2005 2004in million € Carrying amount Fair value Carrying amount Fair value
Non-derivatives
Assets
Cash and cash equivalents 252 252 140 140
Accounts receivable 1,871 1,871 1,528 1,528
Liabilities
Trade accounts payable (including related parties) 355 355 274 274
Income taxes payable 146 146 195 195
Long-term loans (excluding trust preferred securities,
notes and bonds) 1,417 1,417 620 620
Short-term loans (including related parties) 225 225 393 393
Trust preferred securities 1,000 1,082 933 1,048
Euro Notes 460 460 389 389
Bonds 400 427 400 441
Derivatives
Foreign exchange contracts -3 -3 17 17
thereof short-term -2 -2 10 10
Dollar interest rate hedges 19 19 -34 -34
thereof short-term – – – –
Euro interest rate hedges -1 -1 -3 -3
thereof short-term – – – –
Other interest rate hedges – – -1 -1
thereof short-term – – – –
The carrying amounts in the table are included in the consolidated balance sheet under the indicated
captions, except for derivatives, which are included in other assets or other liabilities.

Estimation of fair values
The significant methods and assumptions used to estimate the fair values of financial instruments are
as follows:
Short-term financial instruments are valued at their carrying amounts, which are reasonable estimates
of the fair value due to the relatively short period to maturity of the instruments. This approach applies
to cash and cash equivalents, receivables and accounts payables, including income tax payables.
Long-term bank debt of Fresenius Medical Care is valued at its carrying amount because the actual
drawings under the facility carry interest on a variable basis, mainly with an interest rate fixed for
three months. The interest rates reflect actual money market conditions, plus specific margins which
represent company-related financial ratios as well as the entire set of terms and conditions including
covenants as determined in the Fresenius Medical Care 2003 Senior Credit Agreement.
The fair value of the bonds and trust preferred securities is calculated based on market prices on the
balance sheet date. The fair value of the Euro Notes (Schuldscheindarlehen) is calculated as the
differential between the coupon and the market quotation at the reporting date including a company
specific margin. Due to the relatively short period between reporting date and the issuance of the
notes the specific margin changes since inception are deemed to be immaterial.
The fair value of financial instruments is defined as the amount including unrealized gains and losses
resulting from existing contracts at which the instrument could be exchanged between willing par-
ties. Dealer quotes are available for all material financial instruments of the Fresenius Group.
III.) Accounting for and reporting of non-derivative financial instruments
The carrying amounts of the non-derivative financial instruments are included in the consolidated
balance sheet under their related item.
IV.) Accounting for and reporting of derivative financial instruments (and hedge accounting)
Foreign exchange risk management
The Fresenius Group has determined the euro as its financial reporting currency. Therefore, foreign
exchange translation risks resulting from the fluctuation of exchange rates between the euro and the
local currencies in which the financial statements of the foreign subsidiaries are maintained, have an
impact on results of operations and financial position reported in the consolidated financial statements.
Notes 174

Affiliated Companies Consolidated Financial Statements Report Supervisory Board Supervisory Board Glossary Index 175
The Fresenius Group’s foreign exchange transaction risks mainly relate to transactions such as sales
and purchases as well as project business denominated in foreign currency. Particularly products
manufactured by Fresenius Group entities are denominated in the local currency of the respective
manufacturer and are delivered worldwide to various Fresenius Group entities. These intragroup sales
are denominated mainly in euro, US dollar and yen. Group companies are therefore exposed to changes
of the foreign exchange rates between the invoicing currencies and the local currencies in which
they conduct their businesses. For the purpose of hedging these existing and foreseeable foreign
exchange transaction risks the Fresenius Group enters into foreign exchange forward contracts and,
on a small scale, foreign exchange options. Foreign exchange forward contracts and options are not
used for purposes other than hedging foreign exchange exposures. As at December 31, 2005, the
Fresenius Group has no foreign exchange options.
In connection with intercompany loans in foreign currency the Fresenius Group normally uses foreign
exchange swaps thus assuring that no foreign exchange risks arise from those loans.
The hedge-effective portion of changes in the fair value of foreign exchange forward contracts that
are designated and qualified as cash flow hedges are reported in accumulated other comprehensive
income (loss). These amounts are subsequently reclassified into earnings as a component of cost of
goods sold, of selling, general and administrative expenses or as interest income or expenses in the
same period in which the hedged transaction affects earnings.
Recognized in equity
Cash flow hedgesCash flow hedges associated with foreign
of forecasted currency denominated inter-product purchases company financing transaction
affecting affectingnet income net income
Balance sheet date in million € probably in in million € probably in
Income/loss before tax December 31, 2005 -6.7 2006-2009 – –
December 31, 2004 1.8 2005-2006 -0.9 2005-2006
Income/loss after tax December 31, 2005 -5.0 2006-2009 – –
December 31, 2004 -1.4 2005-2006 -0.5 2005-2006

Notes 176
The after tax losses of € 18 million deferred in accumulated other comprehensive income (loss) at
December 31, 2004 had a low negative currency impact of € 2 million.
As of December 31, 2005, the notional volume and fair value of foreign exchange contracts relating to
foreign currency intercompany loans amounted to € 943 million and € 4 million, respectively. Hedge
accounting is not applied to these foreign exchange contracts. Accordingly, the foreign exchange
contracts are recognized as assets and liabilities and changes in fair values are recognized against
earnings.
As of December 31, 2005 the notional amounts of foreign exchange forward contracts in place to
hedge risks from operational business totalled € 447 million with a fair value of € -7 million.
As of December 31, 2005, the Fresenius Group was party to foreign exchange contracts with a
maximum maturity of 42 months.
Interest rate risk management
The Fresenius Group’s interest rate risks mainly arise from money market and capital market trans-
actions of the subgroup parent company in connection with the financing of the business segments
Fresenius ProServe, Fresenius Kabi and the subgroup Fresenius Medical Care. Interest rate hedging
transactions are therefore primarily concluded by Fresenius AG and FMC-AG & Co. KGaA.
The Fresenius Group enters into interest rate swaps and, on a small scale, into interest rate options
in order to hedge against interest rate exposures arising from short-term and long-term borrowings
and accounts receivable securitization programs at variable rates by swapping them into fixed rates
and to hedge against fluctuations in market interest rates by swapping fixed interest rates against
variable interest rates. In conjunction with interest rate swaps, the Fresenius Group agrees with other
parties to exchange, at specified intervals, the difference between fixed-rate and floating-rate interest
amounts calculated by reference to an agreed notional amount.
Cash flow hedgesCash flow hedges associated with foreign
of forecasted currency denominated inter-product purchases company financing transaction
Fiscal year in million € in million €
Income/loss before tax 2005 0.7 –
2004 -0.8 –
Income/loss after tax 2005 0.6 –
2004 -0.6 –
Recognized in the consolidated statement of income

Affiliated Companies Consolidated Financial Statements Report Supervisory Board Supervisory Board Glossary Index 177
Cash Flow Hedge
The Fresenius Group enters into interest rate swaps that are designated as cash flow hedges effectively
converting certain variable interest rate payments, resulting from existing revolving loans, Euro Notes
(Schuldscheindarlehen) and an accounts receivable facility mainly denominated in US dollar or euro,
into fixed interest rate payments. The US dollar interest rate swaps with a notional volume of US$ 800
million bear an average interest rate of 5.26% and expire at various dates between 2006 and 2009,
while the Euro interest rate swaps with a notional volume of € 222 million bear an average interest
rate of 3.17% and expire at various dates between 2007 and 2009.
In conjunction with the proposed acquisition of Renal Care Group, Inc. and the forecasted variable
rate based interest payments for its financing, Fresenius Medical Care has entered into forward starting
interest rate swaps in the notional amount of US$ 2,465 million. These instruments, designated as
cash flow hedges, effectively convert forecasted variable rate based interest payments into fixed rate
based interest payments with an average fixed rate of 4.32% plus an applicable margin. These swaps
are denominated in US dollars and expire at various dates between 2008 and 2012.
At December 31, 2005, after-tax gains of € 18.8 million (pre-tax € 30.6 million) were recognized in
accumulated other comprehensive income (loss). At December 31, 2004, the equivalent amounts
were € 18.8 million and € 31.1 million. Interest payable and interest receivable under the swap
agreements are accrued or deferred as appropriate and recorded as an adjustment to the interest
expense at each reporting date.
Fair Value Hedge
Fresenius Medical Care entered into US dollar interest rate swaps designated as fair value hedges to
hedge the risk of changes in the fair value of parts of its fixed interest borrowings. These interest rate
swaps effectively convert the fixed interest payments on Fresenius Medical Care Capital Trust II trust
preferred securities denominated in US dollars into variable interest rate payments. Since the critical
terms of the interest rate swap agreements are identical to the terms of Fresenius Medical Care
Capital Trust II trust preferred securities, the hedging relationship is highly effective and no ineffec-
tiveness is recognized in earnings. The interest rate swaps are reported at fair value in the balance
sheet. The reported amount of the hedged portion of fixed rate trust preferred securities includes an
adjustment representing the change in fair value attributable to the interest rate risk being hedged.
Changes in the fair value of interest rate swap contracts and trust preferred securities offset each
other in the income statement. At December 31, 2005, the notional volume of these swaps at Fresenius
Medical Care was US$ 450 million (€ 381 million).

Notes 178
in million € 2005 2004
Interest paid 208 228
Income taxes paid 360 180
Credit risk
The Fresenius Group is exposed to potential losses in the event of non-performance by counterparties
to financial instruments but does not expect any counterparties to fail to meet their obligations. The
current credit exposure of derivatives is represented by the fair value of contracts with a positive fair
value at the reporting date.
26. SUPPLEMENTARY INFORMATION ON CASH FLOW STATEMENT
The cash flow statements of the Fresenius Group for the fiscal years 2005 and 2004 are shown on
pages 102 to 103.
Cash funds reported in the cash flow statement comprise all cash and cash equivalent items reported
in the balance sheet (i.e. cash in hand, cheques, central bank balances, securities and cash at bank)
which are readily convertible within three months and are subject to insignificant risk of changes in
value.
The following summaries provide additional information with regard to the consolidated cash flow
statement:
in million € 2005 2004
Assets acquired 2,695 137
Liabilities assumed -602 -11
Minority interest -61 0
Notes assumed in connection with acquisitions -193 -13
Cash paid 1,839 113
Cash acquired -231 -13
Cash paid for acquisitions, net 1,608 100
The increase in income taxes paid refers mainly to taxes in an amount of US$ 119 million (€ 96 million)
paid by Fresenius Medical Care.
Cash paid for net-acquisitions includes proceeds from divestitures. In 2005 there were € 2 million
divestitures (2004: € 10 million).
Affiliated Companies Consolidated Financial Statements Report Supervisory Board Supervisory Board Glossary Index 179
27. NOTES ON SEGMENT REPORTING
General
The segment reporting tables shown on pages 106 to 109 of this annual report are an integral part
of the Notes.
The Fresenius Group has identified the business segments Fresenius Medical Care, Fresenius Kabi
and Fresenius ProServe which corresponds to the internal organizational and reporting structures
(Management Approach) at December 31, 2005.
The key data disclosed in conjunction with segment reporting correspond to the key data of the
internal reporting system in place across the Fresenius Group. Internal and external reporting and
accounting correspond to each other; the same key data and definitions are used.
Sales and proceeds between the segments are indicative of the actual sales and proceeds agreed
with third parties. Administrative services are billed in accordance with service level agreements.
The business segments were identified in accordance with SFAS No. 131 (Disclosures about Segments
of an Enterprise and Related Information), which defines the segment reporting requirements in
annual financial statements and interim reports with regard to the operating business, product and
service businesses and regions. The business segments of the Fresenius Group are as follows:
Fresenius Medical Care is the world’s leading provider of dialysis products and dialysis care for the
life-saving treatment of patients with chronic kidney failure. Fresenius Medical Care treats about
131,450 patients in its own dialysis clinics.
Fresenius Kabi is Europe’s leading company in the field of infusion therapy and clinical nutrition
with subsidiaries and distributors worldwide. Fresenius Kabi’s products are used in hospitals as well
as in out-patient medical care. Within the scope of this care chain, the company offers products for
fluid and blood volume replacement, generic intravenously administered drugs, parenteral and enteral
nutrition products and medical devices. Fresenius Kabi is also a leading provider of transfusion tech-
nology products in Europe.
Fresenius ProServe focuses on hospital operations as well as on engineering and services for hospitals,
health care facilities and the pharmaceutical industry.

Notes 180
With the exception of ROOA, the key data at the balance sheet date include, within the ProServe
segment, the figures for HELIOS Kliniken GmbH, Fulda, Germany, which was acquired in December
2005.
The segment Corporate /Other mainly comprises the holding functions of Fresenius AG as well as
Fresenius Netcare GmbH, which provides services in the field of information technology as well as
Fresenius Biotech, which does not fulfill the characteristics of a reportable segment. In addition, the
segment Corporate/Other includes intersegment consolidation adjustments.
Segment reporting by region takes account of geographical factors and the similarity of markets in
terms of opportunities and risks. The allocation to a particular region is based on the domicile of the
customers.
Notes on the business segments
The key figures used by the Management Board to assess segment performance, have been selected
in such a way that they include all items of income and expenses which fall under the area of respon-
sibility of the business segments. The Management Board is convinced that the most suitable perform-
ance indicator is the operating income (EBIT). The Management Board believes that, in addition to
the operating income, the figure for earnings before interest, taxes and depreciation /amortization
(EBITDA) can also help investors to assess the ability of the Fresenius Group to generate cash flows
and to meet its financial obligations. The EBITDA figure is also the basis for assessing Fresenius
Medical Care’s compliance with the terms of the 2003 Senior Credit Agreement and trust preferred
securities credit agreement with the European Investment Bank and that of Fresenius AG in conjunction
with the 2003 Eurobond.
Depreciation and amortization is presented for the intangible assets with definite useful lives and
property, plant and equipment of the respective business segment as well as impairment losses on
goodwill.
Net interest comprises interest and other similar expenses and income.
Net income is defined as earnings after income taxes and minority interest.
The operating cash flow comprises net income, minority interest, depreciation and amortization and
the change in working capital.
The cash flow before acquisitions and dividends is the operating cash flow less net capital expenditure.
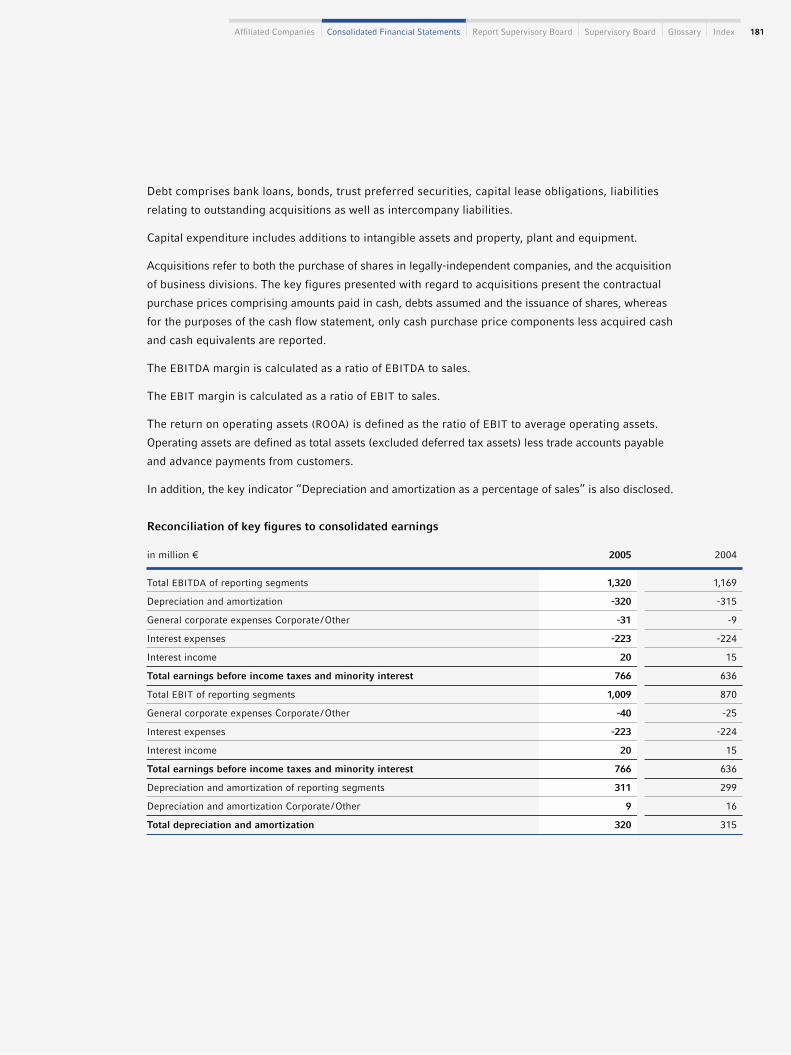
Affiliated Companies Consolidated Financial Statements Report Supervisory Board Supervisory Board Glossary Index 181
in million € 2005 2004
Total EBITDA of reporting segments 1,320 1,169
Depreciation and amortization -320 -315
General corporate expenses Corporate/Other -31 -9
Interest expenses -223 -224
Interest income 20 15
Total earnings before income taxes and minority interest 766 636
Total EBIT of reporting segments 1,009 870
General corporate expenses Corporate/Other -40 -25
Interest expenses -223 -224
Interest income 20 15
Total earnings before income taxes and minority interest 766 636
Depreciation and amortization of reporting segments 311 299
Depreciation and amortization Corporate/Other 9 16
Total depreciation and amortization 320 315
Debt comprises bank loans, bonds, trust preferred securities, capital lease obligations, liabilities
relating to outstanding acquisitions as well as intercompany liabilities.
Capital expenditure includes additions to intangible assets and property, plant and equipment.
Acquisitions refer to both the purchase of shares in legally-independent companies, and the acquisition
of business divisions. The key figures presented with regard to acquisitions present the contractual
purchase prices comprising amounts paid in cash, debts assumed and the issuance of shares, whereas
for the purposes of the cash flow statement, only cash purchase price components less acquired cash
and cash equivalents are reported.
The EBITDA margin is calculated as a ratio of EBITDA to sales.
The EBIT margin is calculated as a ratio of EBIT to sales.
The return on operating assets (ROOA) is defined as the ratio of EBIT to average operating assets.
Operating assets are defined as total assets (excluded deferred tax assets) less trade accounts payable
and advance payments from customers.
In addition, the key indicator “Depreciation and amortization as a percentage of sales” is also disclosed.
Reconciliation of key figures to consolidated earnings

Notes 182
Reconciliation of net debt
in million € December 31, 2005 December 31, 2004
Germany 2,154 813
Europe (excluding Germany) 1,592 969
North America 3,684 3,125
Asia-Pacific 168 209
Latin America 262 130
Africa 33 29
Total non-current assets* 7,893 5,275
* The aggregate amount of net non-current assets is the sum of non-current assets less deferred tax assets and derivative financial instruments.
in milion € December 31, 2005 December 31, 2004
Short-term borrowings 224 391
Short-term liabilities and loans from related parties 1 2
Current portion of long-term debt and capital lease obligations 222 190
Long-term debt and liabilities from capital lease obligations,
less current portion 2,055 1,219
Trust preferred securities of Fresenius Medical Care Capital Trusts 1,000 933
Debt 3,502 2,735
less cash and cash equivalents 252 140
Net debt 3,250 2,595
Non-current assets by geographical region

Affiliated Companies Consolidated Financial Statements Report Supervisory Board Supervisory Board Glossary Index 183
28. STOCK OPTIONS
Fresenius AG stock option plans
On December 31, 2005, Fresenius AG has two stock option plans in place. Besides the stock option
based program of 1998, the currently active plan from the year 2003 is based on convertible bonds.
The latter is currently the only plan under which options in the form of convertible bonds are granted.
Under the 2003 plan, convertible bonds with a principal of up to € 4.6 million may be issued to the
members of the Management Board, to members of the management of affiliated companies, to em-
ployees of the company and to employees of its affiliated companies representing grants for up to
900,000 bearer ordinary shares and up to 900,000 non-voting bearer preference shares. Members of
the Management Board and employees of FMC-AG & Co. KGaA and its affiliated companies which
are only affiliated with the company through FMC-AG & Co. KGaA are excluded. Members of the
Management Board of Fresenius AG are entitled, in total, up to 400,000 convertible bonds given the
right to subscribe up to 200,000 bearer ordinary shares and the same number of non-voting bearer
preference shares. Employees are entitled, in total, up to 1,400,000 convertible bonds given the right
to subscribe up to 700,000 bearer ordinary shares and the same number of non-voting bearer prefe-
rence shares.
The convertible bonds have a par value of € 2.56 and bear interest at a rate of 5.5%. Except for the
members of the Management Board, eligible employees may purchase the bonds by issuing a non-
recourse note with terms corresponding to the terms of the bond. Fresenius AG has the right to offset
its obligation on a bond against the employee’s obligation on the related note; therefore, the convertible
bond obligations and employee note receivables represent stock options issued by Fresenius AG and
are not reflected in the consolidated financial statements. The options expire in ten years and one
third of them can be exercised beginning after two, three or four years. Bonds issued to members of
the Management Board, to members of the management of affiliated companies, to employees of the
company and to employees of its affiliated companies who did not issue a note to the Company are
recognized as a liability on Fresenius Group’s consolidated balance sheet.

Notes 184
Upon issuance of the option, the employees have the right to choose options with or without a stock
price target. The conversion price of options subject to a stock price target becomes the stock exchange
quoted price of the ordinary or preference shares upon the first time the stock exchange quoted price
exceeds the Initial Value by at least 25%. The Initial Value is the joint average stock exchange price
of bearer ordinary shares and non-voting bearer preference shares during the last 30 trading days
prior to the date of grant. The conversion price of options without a stock price target is the Initial
Value. In the case of options not subject to a stock price target, the number of convertible bonds
awarded to the eligible employee would be 15% less than if the employee elected options subject to
the stock price target. Each option entitles the holder thereof, upon payment of the respective con-
version price, to acquire one ordinary or one preference share. Up to 20% of the total amount available
for the issuance of awards under the Fresenius AG 2003 Stock Option Plan may be issued each year.
At December 31, 2005, 767,324 stock options were outstanding, thereof 47,236 which are exercisable.
During 1998, Fresenius AG adopted a stock incentive plan (Fresenius AG 1998 Stock Option Plan) for
Fresenius AG’s key management and executive employees. This stock incentive plan was replaced by
the Fresenius AG 2003 plan and no options have been granted since 2003. Under this plan eligible
employees had the right to acquire ordinary and preference shares of Fresenius AG. Options granted
under this plan have a ten-year term, and one third of them vest on each of the second, third and
fourth anniversaries of the award date. One ordinary or one preference share can be acquired for each
option. At December 31, 2005, 763,266 stock options were outstanding, thereof 676,724 which are
exercisable.
Due to the capital increase completed in December 2005 which involved the granting of subscription
rights to stockholders the exercise prices under the 1998 plan and, for the past, the conversion prices
of the 2003 plan will be reduced in line with the provisions of both stock option plans. The amount of
reduction corresponds to an amount calculated on the basis of the average price of the stockholders‘

Affiliated Companies Consolidated Financial Statements Report Supervisory Board Supervisory Board Glossary Index 185
Average exercise Number of optionsOrdinary shares December 31 Number of options price in € exercisable
Balance 2003 738,684 73.31 316,300
Granted 131,226 69.66
Exercised 677 61.26
Forfeited 32,968 73.06
Balance 2004 836,265 72.75 433,251
Granted 155,101 90.49
Excercised 175,621 70.71
Forfeited 50,450 74.12
Balance 2005 765,295 73.67 361,980
Average exercise Number of optionsPreference shares December 31 Number of options price in € exercisable
Balance 2003 738,684 82.60 316,300
Granted 131,226 60.70
Exercised 677 65.45
Forfeited 32,968 82.09
Balance 2004 836,265 79.72 433,251
Granted 155,101 94.03
Excercised 175,621 78.28
Forfeited 50,450 82.13
Balance 2005 765,295 80.91 361,980
subscription right during their entire trading period on the Frankfurt Stock Exchange – rounded to
the nearest full € 0,05. For ordinary shares, this means a reduction of the exercise or conversion
price of € 1.90 per share and for preference shares € 2.05 per share.
Stock option transactions are summarized as follows:

Notes 186
Fresenius Medical Care stock option plans
At December 31, 2005, Fresenius Medical Care has awards outstanding under the terms of various
stock-based compensation plans, including the Fresenius Medical Care 2001 plan, which is the only
plan of Fresenius Medical Care with stock option awards currently available for grant. Under the
Fresenius Medical Care 2001 plan, convertible bonds with a principal of up to € 10.24 million may be
issued to the members of the Management Board and other employees of Fresenius Medical Care
Ordinary shares Number Average Average Number AverageRange of exercise of options remaining exercise of options exercise
price in € outstanding contractual life price in € exercisable price in €
40.01–45.00 89,303 7.50 40.96 20,601 40.96
50.01–55.00 16,426 7.50 54.54 3,017 54.54
55.01–60.00 84,523 6.50 59.36 41,252 59.36
65.01–70.00 159,367 6.92 66.33 50,298 67.33
80.01–85.00 56,675 4.06 80.40 42,512 80.36
85.01–90.00 132,774 9.50 85.95 0 85.95
90.01–95.00 204,300 5.60 92.15 204,300 92.15
105.01–110.00 21,927 9.50 106.54 0 106.54
765,295 6.91 73.67 361,980 80.35
Ordinary shares Number Average Average Number AverageRange of exercise of options remaining exercise of options exercise
price in € outstanding contractual life price in € exercisable price in €
35.01–40.00 89,303 7.50 35.47 20,601 35.47
40.01–45.00 16,426 7.50 43.58 3,017 43.58
55.01–60.00 109,069 8.50 57.00 0 57.00
60.01–65.00 84,523 6.50 63.40 41,252 63.40
75.01–80.00 64,461 4.60 77.48 50,298 77.37
85.01–90.00 175,286 7.82 88.53 42,512 88.81
100.01–105.00 108,272 6.58 104.18 108,272 104.18
115.01–120.00 21,927 9.50 115.55 0 115.55
125.01–130.00 96,028 4.50 126.37 96,028 126.37
765,295 6.91 80.91 361,980 95.47
The following table provides information with respect to stock options outstanding and exercisable
at December 31, 2005:

Affiliated Companies Consolidated Financial Statements Report Supervisory Board Supervisory Board Glossary Index 187
representing grants for up to 4 million non-voting preference shares. The convertible bonds have a
par value of € 2.56 and bear interest at a rate of 5.5%. Except for the members of the Management
Board, eligible employees may purchase the bonds by issuing a non-recourse note with terms corre-
sponding to the terms of and secured by the bond. Fresenius Medical Care has the right to offset its
obligation on a bond against the employee’s obligation on the related note; therefore, the convertible
bond obligations and employee note receivables represent stock options issued by Fresenius Medical
Care and are not reflected in Fresenius Medical Care’s consolidated financial statements. The options
expire in ten years and can be exercised beginning after two, three or four years. Bonds issued to
Management Board members, who did not issue a note to Fresenius Medical Care, are recognized as
a liability on Fresenius Medical Care’s balance sheet.
Upon issuance of the option, the employees have the right to choose options with or without a stock
price target. The conversion price of options subject to a stock price target becomes the stock exchange
quoted price of the preference shares upon the first time the stock exchange quoted price exceeds
the Initial Value by at least 25%. The Initial Value is the average price of the preference shares during
the last 30 trading days prior to the date of grant. In the case of options not subject to a stock price
target, the number of convertible bonds awarded to the eligible employee would be 15% less than if
the employee elected options subject to the stock price target. The conversion price of the options
without a stock price target is the Initial Value. Each option entitles the holder thereof, upon payment
the respective conversion price, to acquire one preference share. Up to 20% of the total amount
available for the issuance of awards under the Fresenius Medical Care 2001 plan may be issued each
year through May 22, 2006. At December 31, 2005, options for up to 172,224 preference shares are
still available for grant through May 22, 2006 under the Fresenius Medical Care 2001 Plan.
During 1998, Fresenius Medical Care adopted two stock incentive plans (Fresenius Medical Care 98
Plan 1 and Fresenius Medical Care 98 Plan 2) for Fresenius Medical Care’s key management and
executive employees. These stock incentive plans were replaced by the Fresenius Medical Care 2001
plan and no options have been granted since 2001. Under these plans eligible employees had the
right to acquire preference shares of Fresenius Medical Care AG. Options granted under these plans
have a ten-year term, and one third of them vest on each of the second, third and fourth anniversaries
of the award date. Each option can be exercised for one preference share.

In connection with the conversion of the Fresenius Medical Care’s preference shares into ordinary
shares, holders of options to acquire preference shares had the opportunity to convert their options
so that they would be exercisable to acquire ordinary shares. Holders of 234,311 options elected not
to convert. Holders of 3,863,470 options converted resulting in 2,849,318 options for ordinary shares
(see Note 1. II, Transformation of Fresenius Medical Care’s legal form and conversion of its pref-
erence shares).
Personnel expenses in connection with stock option plans of the Fresenius Group
The Fresenius Group applies APB Opinion No. 25 in accounting for stock compensation and, accord-
ingly, recognized compensation expenses of € 4 million in 2005 and € 1 million in 2004 for stock
options granted since 1998. The tax effect of differences between compensation expense for financial
statement and income tax purposes is recorded in income. Additional tax credits available upon
exercise of non-qualified stock options are recognized as a credit to additional paid-in capital.
Notes 188
Stock option transactions are summarized as follows:
Number of options Average exercise Number of optionsPreference shares December 31 (in thousand) price in € exercisable (in thousand)
Balance 2003 3,989 43.34 2,147
Granted 1,021 44.81
Exercised 83 33.92
Forfeited 266 46.74
Balance 2004 4,661 43.60 2,393
Granted 1,044 62.36
Exercised 1,466 44.51
Forfeited 136 44.94
Balance 2005 4,103 47.88 1,537
The following table provides information with respect to stock options outstanding and exercisable at
December 31, 2005:
Ordinary shares Number Average Average Number AverageRange of exercise of options remaining exercise of options exercise
price in € outstanding contractual life price in € exercisable price in €
25.01–35.00 1,154,792 6.42 31.16 572,967 31.23
35.01–45.00 1,035,044 7.75 43.40 186,221 42.51
45.01–55.00 162,365 4.79 49.60 162,365 49.60
55.01–65.00 1,176,695 7.19 56.97 501,859 57.81
65.01–90.00 573,643 8.98 70.76 113,505 73.38
4,102,539 7.27 47.92 1,536,917 46.33

Affiliated Companies Consolidated Financial Statements Report Supervisory Board Supervisory Board Glossary Index 189
29. ADDITIONAL INFORMATION RELATING TO THE MANAGEMENT BOARD
AND THE SUPERVISORY BOARD
Management Board
The Management Board conducts the business and represents the company in dealings with third
parties. The Management Board has five members. According to the Management Board’s rules
of procedure, each member is accountable for his area of responsibility. However, the members have
joint responsibility for the management of the Group. For the year ended December 31, 2005, the
total remuneration of the Management Board paid in cash for carrying out their duties in Fresenius AG
and its subsidiaries amounted to € 5,482 thousand. Of this amount, € 2,998 thousand was paid as
fixed salary and € 2,484 thousand was paid in the form of variable income. The amount of the variable
income depends on the earnings of the Fresenius Group and/or the business segments.
In addition in 2005, the members of the Management Board received 51,170 convertible bonds under
the 2003 Fresenius AG Stock Option Plan. At the end of the fiscal year 2005, the members of the
Management Board held 143,336 stock options and 134,018 convertible bonds. In fiscal year 2005,
110,936 stock options were exercised.
As of December 31, 2005 pension obligations of € 1,434 thousand are recognized by the Fresenius
Group to cover pension entitlements of current members of the Management Board.
€ 716 thousand was paid to former members of the Management Board and their surviving dependents.
The pension accrual for these persons amounts to € 10,079 thousand.
Fresenius AG has undertaken to exempt members of the Management Board of Fresenius AG from
claims that may arise due to their work for Fresenius AG and related companies and that may be
supported by foreign law as long as the claims extend beyond German law. To insure against this
risk, the Company has taken out Directors and Officers Insurance in a reasonable amount. The
exemption is valid for the tenure of respective Management Board members on the Management
Board and claims that may result from this time period after their tenure has ended.
Supervisory Board
The Supervisory Board appoints the members of the Management Board and supervises and advises
the Management Board in managing the company. However, the Supervisory Board is fundamentally
prohibited from managing the company in any way. The remuneration of the Supervisory Board is
determined by the Annual General Meeting and is subject to the provisions contained in § 13 of the
statutes of Fresenius AG. The total remuneration of the Supervisory Board of Fresenius AG in 2005
was € 1,027 thousand. This included € 249 thousand relating to fixed and € 778 thousand relating to
variable components. The fixed remuneration per Supervisory Board member was equivalent to € 13
thousand, whereby the Chairman receives double of this amount and the deputy to the Chairman
receives one and half times the amount of a Supervisory Board member. The members of the Audit

Notes 190
Committee and the Personnel Committee of the Supervisory Board receive an additional € 10 thousand
each and the Chairman of the committee receives a further € 10 thousand. For each full financial year
of service, the remuneration increases by 10% for each percentage point that the dividend paid on
each ordinary share for that year (gross dividend according to the resolution of the Annual General
Meeting) exceeds 13% of the amount equal to the subscribed capital divided by the number of non-par
value shares; residual amounts are interpolated. Thus, the variable remuneration per Supervisory
Board member amounted to € 65 thousand for 2005. All members of the Supervisory Board receive
appropriate compensation for costs of travel and accommodation incurred in connection with their
duties as members of the Supervisory Board.
One subsidiary paid € 22 thousand to the surviving dependents of a former Supervisory Board member.
The subsidiary accrued a pension provision for this purpose of € 48 thousand.
D&O Insurance
Fresenius AG has concluded a consequential loss liability insurance policy (D&O insurance), on an
excess amount basis, for the members of the Management Board and the Supervisory Board of
Fresenius AG and for all representative bodies of affiliates in Germany and elsewhere. The D&O policy
applies throughout the world and runs until the end of June 2006. The policy covers the legal defense
costs of a member of a representative body when a claim is made and, where relevant, any damages
to be paid which are covered by the policy.
30. RELATED PARTY TRANSACTIONS
A member of the Supervisory Board of Fresenius AG is a member of the Management Board of a bank,
while an other Member of the Supervisory Board of Fresenius AG is a member of the Management
Board of a sister company to this bank, which received € 3.9 million for services relating to the capital
increase and being the arrangeur for an Euro Note.
A member of the Supervisory Board of Fresenius AG is a member of the Advisory Board of an insurance
company which received a premium of € 4.3 million.
A member of the Supervisory Board of Fresenius AG is a partner in a law firm that provided services
to the Fresenius Group. The Fresenius Group paid to this law firm approximately € 1.9 million in the
year 2005.

Affiliated Companies Consolidated Financial Statements Report Supervisory Board Supervisory Board Glossary Index 191
in million € 2005 2004
Audit fees 4 3
Tax consulting fees – 1
Audit-related fees – –
Other fees 1 –
Total auditor fees 5 4
31. FEES FOR THE AUDITOR
In 2005 and 2004 fees for the auditor were expensed as follows:
32. SUBSEQUENT EVENTS
In January 2006, Fresenius issued a bond with a total value of € 1 billion through its wholly-owned
subsidiary Fresenius Finance B.V. The proceeds from the bond, together with the capital increase at
the end of 2005, were used to finance the purchase of HELIOS, to replace a € 300 million bond due
in the year 2009 and callable in the year 2006, 71% of which was redeemed for cash, and for general
company purposes. The new bond comprises one tranche with a nominal value of € 500 million, a
maturity of 7 years and an annual interest rate of 5.0% and a second tranche with a nominal value of
€ 500 million, a maturity of 10 years and an annual interest rate of 5.5% as well as a call option for
the issuer after five years. Fresenius AG, Fresenius Kabi AG and Fresenius ProServe GmbH are the
guarantees for this issue.
On February 10, 2006, Fresenius Medical Care AG completed the change in legal form, resolved by
the shareholders at the Extraordinary General Meeting held on August 30, 2005. In conjunction with
the conversion offer approximately 96% of its preference shares have been converted into ordinary
shares at the same date. The Company now operates as an AG & Co. KGaA (see Note 1. II, Transfor-
mation of Fresenius Medical Care’s legal form and conversion of its preference shares).
Significant events relating to the proposed acquisition of RCG are described in Note 2, Acquisitions
and divestitures.
There have been no further significant changes in the group position or environment sector since the
beginning of the fiscal year 2006. At present, the Fresenius Group is not planning to carry out any
significant changes in its structure, administration or legal form or in the area of personnel.

Notes 192
Bad Homburg v.d.H., February 24, 2006
The Management Board
Dr. U. M. Schneider R. Baule A. Gaddum Dr. B. Lipps S. Sturm
33. CORPORATE GOVERNANCE
The Management Boards and the Supervisory Boards of Fresenius AG and FMC-AG & Co. KGaA have
submitted the Declaration of Compliance pursuant to § 161 of the German Stock Corporation Act
(AktG) in accordance with the German Corporate Governance Code dated June 2, 2005 and made
this permanently available to the shareholders.
34. PROPOSAL FOR THE DISTRIBUTION OF EARNINGS
The Management Board of Fresenius AG proposes to the Annual General Meeting that the earnings
for 2005 of Fresenius AG be distributed as follows:
in €
Payment of a dividend of € 1.48 per bearer ordinary share on the 25,361,140
ordinary shares entitled to dividend 37,534,487.20
Payment of a dividend of € 1.51 per bearer preference share on the 25,361,140
preference shares entitled to dividend 38,295,321.40
Balance to be carried forward 222,908.07
76,052,716.67

Affiliated Companies Consolidated Financial Statements Report Supervisory Board Supervisory Board Glossary Index 193
AUDITOR’S REPORT
We have audited the consolidated financial statements prepared by the Fresenius Aktiengesellschaft,
Bad Homburg v.d. Höhe, comprising the balance sheet, the income statement, statement of changes
in equity, cash flow statement and the notes to the consolidated financial statements, together with
the group management report for the business year from January 1, 2005 to December 31, 2005. The
preparation of the consolidated financial statements in accordance with Accounting Principles Generally
Accepted in the United States of America (US-GAAP) and the group management report are the respon-
sibility of the parent company`s management. Our responsibility is to express an opinion on the
consolidated financial statements and on the group management report based on our audit.
We conducted our audit of the consolidated financial statements in accordance with Art. 317 HGB
(Handelsgesetzbuch “German Commercial Code“) and German generally accepted standards for the
audit of financial statements promulgated by the Institut der Wirtschaftsprüfer (IDW). Those standards
require that we plan and perform the audit such that misstatements materially affecting the presentation
of the net assets, financial position and results of operations in the consolidated financial statements
in accordance with Accounting Principles Generally Accepted in the United States of America (US-
GAAP) and in the group management report are detected with reasonable assurance. Knowledge of
the business activities and the economic and legal environment of the Group and expectations as to
possible misstatements are taken into account in the determination of audit procedures. The effec-
tiveness of the accounting-related internal control system and the evidence supporting the disclosures
in the consolidated financial statements and the group management report are examined primarily
on a test basis within the framework of the audit. The audit includes assessing the annual financial
statements of those entities included in consolidation, the determination of entities to be included in
consolidation, the accounting and consolidation principles used and significant estimates made by
management, as well as evaluating the overall presentation of the consolidated financial statements
and group management report. We believe that our audit provides a reasonable basis for our opinion.
Our audit has not led to any reservations.
In our opinion, based on the findings of our audit, the consolidated financial statements comply with
Accounting Principles Generally Accepted in the United States of America (US-GAAP) and give a true
and fair view of the net assets, financial position and results of operations of the Group in accordance
with these requirements. The group management report is consistent with the consolidated financial
statements and as a whole provides a suitable view of the Group’s position and suitably presents the
opportunities and risks of future development.
Frankfurt am Main, February 24, 2006
KPMG Deutsche Treuhand-Gesellschaft
Aktiengesellschaft
Wirtschaftsprüfungsgesellschaft
Hölzl Steckhan
German Public Auditor German Public Auditor

Report of the Supervisory Board
In 2005, the Supervisory Board performed the duties assigned to it by law and by the Company’s
Articles of Association, regularly advising and monitoring the Management Board. It was closely
involved in all decisions that were of major importance to the Group.
Business development and important transactions
The Management Board regularly informed the Supervisory Board of the business developments
and plans as well as of important business transactions concerning both the Group and the
individual business segments. The Supervisory Board held six joint meetings with the Manage-
ment Board to address business developments and policies in detail based on the reports
presented. The meetings focused on business operations and transactions requiring the approval
of the Supervisory Board. The emphasis was on Fresenius Medical Care AG’s change of legal
form to a partnership limited by shares (Kommanditgesellschaft auf Aktien, or KGaA), the
conversion of Fresenius Medical Care’s preference shares into ordinary shares and acquisitions
by the individual business segments as well as the related financing. The Supervisory Board
reviewed in detail the economic and legal reasons for the change of legal form and the pref-
erence share conversion. The Board also fully considered the opportunities and risks posed
by Fresenius Medical Care’s acquisition of Renal Care Group, the purchase of HELIOS Kliniken
by Fresenius AG and Clinico’s takeover by Fresenius Kabi. The Supervisory Board thoroughly
discussed these strategically important acquisitions with the Management Board and approved
each of them unanimously. The Supervisory Board also carefully reviewed and discussed the
Company’s strategic direction with the Management Board before giving its approval. After
consulting with the Management Board, it also approved financing the acquisitions through
a capital increase from approved capital, a bond and bank credit facilities. The Supervisory
Board also thoroughly reviewed and discussed all other significant business activities with
Report of the Supervisory Board194

the Management Board. The Supervisory Board approved the Group’s medium-term plan-
ning, following a detailed review and discussions with the Management Board. In addition, the
Supervisory Board received information about the Group’s risk management activities at
regular meetings and from the Audit Committee.
In accordance with the German Corporate Governance Code, the Management Board and the
Supervisory Board jointly issued a Declaration of Compliance.
In addition to the meetings, the Chairman of the Supervisory Board also received regular
updates about the Company’s current situation and all major transactions.
Work of the committees
The committee formed pursuant to § 27, Section 3 of the German Co-determination Law did
not meet in 2005. The Personnel Committee held two meetings and the Audit Committee held
four. The Audit Committee focused on the preliminary audit of the 2004 financial statements
of Fresenius AG and the Group and on reviewing the audit report with the auditors. The Audit
Committee also reviewed the 2005 quarterly reports and the risk management system.
To efficiently monitor the capital increase from approved capital, the Supervisory Board formed
an Ad-hoc 2005 Capital Increase Committee on October 13, 2005. After approving the increase
in capital and its main conditions, the Supervisory Board delegated to this committee the
authority to approve the definitive conditions shortly before the share issue. During three tele-
phone conferences, the Ad-hoc 2005 Capital Increase Committee passed the necessary reso-
lutions regarding primarily the final subscription price, the number of new shares to be issued
and the subscription ratio. The work of the Ad-hoc 2005 Capital Increase Committee was com-
pleted when the new shares were recorded in the Commercial Register on November 29, 2005.
Personnel
The following changes took place within the Supervisory Board and the Management Board
in 2005: Dr. Gerhard Rupprecht, Member of the Board of Management of Allianz AG and
Chairman of the Board of Management of Allianz Deutschland AG, was elected to the Super-
visory Board by a large majority at the Annual Shareholders’ Meeting, in accordance with § 8,
Section 3 of Fresenius AG’s Articles of Association. The Supervisory Board appointed Andreas
Gaddum as the Management Board’s member responsible for the Fresenius ProServe business
segment, effective July 1, 2005. Andreas Gaddum succeeds Rainer Hohmann who stepped
down from the Management Board effective May 20, 2005.
Affiliated Companies Consolidated Financial Statements Report Supervisory Board Supervisory Board Glossary Index 195

Report of the Supervisory Board196
Financial statements and consolidated financial statements
The accounting records, the Fresenius AG financial statements which were prepared according
to the German Commercial Code (HGB) and the Fresenius AG Management Report for 2005
were audited by KPMG Deutsche Treuhand-Gesellschaft Aktiengesellschaft Wirtschaftsprüfungs-
gesellschaft, Frankfurt am Main. They were elected as auditors at Fresenius AG’s Annual Share-
holders’ Meeting on May 25, 2005 and subsequently commissioned by the Supervisory Board.
The auditors issued their unqualified audit opinion for these statements. The same applies to
Fresenius AG’s consolidated financial statements, which were prepared according to IFRS
accounting principles, and the US GAAP statements, which were prepared voluntarily. Manage-
ment Reports were added to the consolidated financial statements. The financial statements,
consolidated financial statements, Management Reports and auditors’ reports were submitted
to the Supervisory Board within the required time limit. The Supervisory Board noted and
approved the auditors’ findings. The Supervisory Board’s own review found no objections in
the Fresenius AG financial statements or the consolidated financial statements. The auditors
attended all Supervisory Board meetings.
At its March 17, 2006 meeting, the Supervisory Board approved Fresenius AG’s financial state-
ments for the fiscal year 2005 as presented by the Management Board, thereby adopting them
as official. The Supervisory Board also approved the consolidated financial statements prepared
according to IFRS standards and the consolidated financial statements prepared voluntarily
according to US GAAP for 2005. The auditors gave a detailed report on the results of the audit
during the meeting. The Supervisory Board concurred with the proposal by the Management
Board on how to appropriate the 2005 retained earnings.
The Supervisory Board would like to thank the Management Board and all employees for their
achievements and commitment during the fiscal year 2005.
Bad Homburg v.d.H., March 17, 2006
The Supervisory Board
Dr. Gerd Krick
Chairman

Affiliated Companies Consolidated Financial Statements Report Supervisory Board Supervisory Board Glossary Index 197
Dr.h.c. Hans Kröner
Bad Homburg v.d.H.
Honorary Chairman of the Supervisory
Board
Dr. Gerd Krick
Königstein
Former Chairman of the
Management Board Fresenius AG
Chairman
Chairman of the Personnel CommitteeMember of the Audit Committee
Offices Supervisory BoardFresenius Medical Care AG & Co. KGaA (Chairman)Fresenius Medical Care Management AG(since December 21, 2005)VAMED AG, Austria (Chairman) Allianz Private Krankenversicherungs-AGAdvisory BoardHDI Haftpflichtverband der deutschen Industrie V.a.G.Board of Directors Adelphi Capital Europe Fund, Cayman IslandsBoard of TrusteesDonau-Universität Krems, Austria
Gerhard Herres
Beckingen-Haustadt
Member of the Trade Union
Deutscher Handels- und Industrie-
angestellten Verband im CGB
Chairman of the Works Council
St. Wendel plant
Spokesman of the Standing Committee
on Industry and Trade
Member of the General Works Council
Dr. Gabriele Kröner
Berg
Doctor
Offices Management BoardElse Kröner-Fresenius-Stiftung
Dr.rer. nat. Bernd Mathieu
Bad Homburg v.d.H.
Graduate chemist
Corporate OfficesBoard of DirectorsFresenius Medical Care Japan Co. Ltd., JapanFresenius-Kawasumi Co. Ltd., Japan
Christel Neumann
Schonungen
Chairlady of the Fresenius European
Employee Forum
Chairlady of the Works Council
Schweinfurt plant
Member of the General Works Council
Ilona Oesterle
Waldsolms
Deputy Chairlady of the Works Council
Bad Homburg v.d.H.
Dr. Gerhard Rupprecht
Gerlingen
Member of the Management Board
Allianz AG
Chairman of the Management Board
Allianz Deutschland AG
(since January 1, 2006)
Chairman of the Management Board
Allianz Lebensversicherungs-AG
(until December 31, 2005)
OfficesSupervisory BoardHeidelberger Druckmaschinen AGQuelle AGThyssenKrupp Automotive AGAllianz Lebensversicherungs-AG (Chairman) (since January 1, 2006)Allianz Versicherungs-AG (Chairman) (since January 1, 2006)Allianz Private Krankenversicherungs-AG (Chairman)(since January 1, 2006)Allianz Elementar Lebensversicherungs-AG, Austria (Chairman) (until January 16, 2006)Allianz Elementar Versicherungs-AG, Austria (until January 16, 2006)Allianz Life Insurance Company of North America, USA(until April 29, 2005)Allianz First Life Insurance Co. Ltd., Korea
Wilhelm Sachs
Friedrichsdorf
Chairman of the General Works Council
Deputy Chairman of the Works Council
Friedberg plant
Deputy Chairman of the Standing
Committee on Industry and Trade
Dr. Dieter Schenk
Munich
Lawyer and tax consultant
OfficesSupervisory BoardFresenius Medical Care AG & Co. KGaA (Deputy Chairman)Fresenius Medical Care Management AG (DeputyChairman) (since April 8, 2005)Gabor Shoes AG (Chairman)Greiffenberger AG (Deputy Chairman)TOPTICA Photonics AG (Deputy Chairman)
Dr. Karl Schneider
Mannheim
Former Spokesman of
Südzucker AG
Member of the Personnel Committee
Volker Weber
(since January 19, 2005)
Löhnberg
Deputy Chairman
(since March 18, 2005)
Full-time Secretary of the Trade Union
IG Bergbau, Chemie, Energie
Member of the Personnel CommitteeMember of the Audit Committee
OfficesSupervisory BoardSV Deutschland GmbH
Dr. Bernhard Wunderlin
Bad Homburg v.d.H.
Former Managing Director
Harald Quandt Holding GmbH
Chairman of the Audit Committee
OfficesSupervisory BoardHarald Quandt Holding GmbHAugsburger Aktienbank AGAdvisory BoardVon Rautenkranz Nachfolger GbRMarsh & McLennan Holdings GmbHAdministrative BoardSenckenbergische Naturforschende GesellschaftManagement BoardGemeinnützige Hertie-StiftungBoard of TrusteesHertie School of GovernanceFoundation CouncilPwC-Stiftung
SUPERVISORY BOARD

Glossary198
AntibodiesAntibodies are proteins that bind specifically to aparticular substance, its antigen. Antibodies areknown collectively as immmunoglobulins. Anti-bodies are produced by B-lymphocytes and plasmacells in response to infection or immunization, andbind to and neutralize pathogens thus preparingthem for uptake and destruction of phagocytes.
ApheresisProcess of obtaining blood from a donor or patientto separate of remove certain components (throm-bocytes plasma) before re-infusing the remainder.
AscitesAccumulation of excess fluid due to disturbedbalance of influx and efflux as a result of a malig-nant disease.
Blood volume replacement Infusion solution to compensate blood loss.
BiocompatibilityQuality and compatibility of the material, the sys-tem or the solution which prevent negative reac-tions by the organism of the patient.
CitrateSalt of the citric acid. By infusing citrate into thearterial limb of the extracorporeal blood circulation,blood clotting is avoided.
CompoundingMixing of different solutions or components for I.V. or parenteral nutrition therapy.
ColloidsBlood- and plasma substitutes.
DialysisA type of renal replacement therapy where a semi-permeable membrane – in peritoneal dialysis theperitoneum of the patient, and in hemodialysis themembrane of the dialyzer – is used for selectivesolute removal.
Dialysis machineThe hemodialysis process is controlled by a dialysismachine which pumps blood, adds anti-coagulants,regulates the cleansing process, and controls themixture of dialysate and its flow rate through thesystem.
DialyzerSpecial filter used in hemodialysis for removingtoxic substances and excess water from the blood.
Disease Management Holistic concept of patient treatment taking intoaccount all medical aspects associated with thedisease.
Enteral nutritionApplication of liquid nutrition as tube or sip feedvia the gastrointestinal tract.
ExtracorporealTaking place outside the body.
Graft-versus-Host-Disease (aGvHD)Phase of Graft-versus-Host-Disease, caused by T-cells in the donor graft that attack the hostorganism.
Hemodiafiltration (HDF)Special mode of ESRD (end-stage renal disease)treatment, combining advantages of hemodialysisand hemofiltration, i.e. high elimination rates forsmall and large molecular weight substances viadiffusive and convective mechanisms, respectively.
Hemodialysis (HD)A treatment method for dialysis patients where the blood of the patient is cleansed by a dialyzer.The solute exchange between blood and dialysate is dominated by diffusive processes.
HemoperfusionExtracorporeal blood cleansing process to removetoxic substances from the blood using adsorbants.
HES (hydroxyethyl starch)Derived from waxy maize starch, HES solutionscan substitute deficient blood volume and improvethe viscosity of the blood.
Immunosuppressive agentDrug that artificially suppresses or weakens theimmune reaction of the organism. It is used in thetreatment of autoimmune diseases or to preventtransplanted organs being rejected.
IntraperitonealAdministration of a drug directly into the peritonealcavity.
Lipid emulsionsLipid emulsions are elements of parenteral nutri-tion and primarily provide energy and essentialfatty acids.
Mesothelial cellsCells of the mesothelium (layer of cells lining theperitoneal cavity).
Parenteral nutritionApplication of nutrients directly into the blood-stream of the patient (intravenously).
Peritoneal dialysis (PD)
Dialysis treatment method using the patient’speritoneum as a “filter” to cleanse his blood.
Peritoneal dialysis solutionSolution introduced into the abdominal cavity ofthe patient to adsorb toxins and excess water.
Polyclonal antibodiesAntibodies that recognize one specific structure,but are produced by different cell clones.
PortA fully implantable subcutaneous small port hous-ing with membrane and catheter for chemotherapy,infusion therapy, parenteral nutrition etc.
Single-use dialyzerDialyzer which is not used several times (reuse) but only one single time.
TransnasalVia the nose.
Trifunctional AntibodiesAntibodies that bind to three different cell types inparallel (e.g. tumor cells, T-cells and accessorycells) resulting in a tumor-specific immune reaction.
Vascular accessMode of connecting the patient’s blood circulationto the dialyzer. The vascular access must allowsufficient blood flow and connections as often asnecessary.
Volumetric pumpsElectronic pumps for intravenous infusion of fluidsand drugs for parenteral nutrition with high accu-racy (volumetric-based).
GLOSSARY
Health care terms

Affiliated Companies Consolidated Financial Statements Report Supervisory Board Supervisory Board Glossary Index 199
Financial terms
EBIT
Earnings before interest and income taxes.
EBITDA
Earnings before interest, income taxes, depreciation and amortization.
I /B /E /S
Institutional Broker Estimate System.
Investment rateInvestments in property, plant and equipment :Amount of property, plant and equipment at thebeginning of the period.
ROIC (Return on Invested Capital)Calculated by: (EBIT - taxes) : Invested capital
Invested capital = total assets + amortization ofgoodwill (accumulated) - deferred tax assets - cash and cash equivalents - trade accounts payable - accruals (without pension accruals) -other liabilities not bearing interest.
ROOA (Return on Operating Assets)Calculated by:EBIT x 100 : operating assets (average)Operating assets = total assets - deferred tax assets - trade accounts payable - paymentsreceived on account.
US GAAP
United States Generally Accepted AccountingPrinciples.
Working CapitalCurrent assets (including deferred assets) - accruals - trade accounts payable - other liabilities - deferred charges.
Products and services
ATG-Fresenius (anti T-lymphocyte globulin)Protein which suppresses T-lymphocytes.
balanceLactate-buffered peritoneal dialysis solution in adouble-chamber bag. When the contents of the two bags are mixed, the ready-to-use solution has a neutral pH value and a lower content of glucosedegradation products.
bicaVeraPure bicarbonate-buffered peritoneal dialysis solu-tion in a double-chamber bag. After mixing of thetwo compartments, the ready-to-use solution has aphysiological pH and a highly reduced amount ofglucose degradation products.
DiaSafeTM
Filter to obtain ultra-pure dialysis solution duringhemodialysis.
DibenFiber-rich standard tube feeding for patients withimpaired glucose tolerance.
EasyLabBlood gas analyzer for the analysis and the controlof blood parameters, e. g. electrolytes and pH.
FX-class dialyzerA new generation of dialyzers with increasedperformance and outstanding biocompatibility.Helixone® capillaries with their special three-dimensional microwave structure are built in highcapillary density into a specifically-designed housing which, among other benefits, leads to anoptimized flow distribution within the dialyzer.
GENIUS
Innovative hemodialysis therapy system based on a single-pass batch system. The dialysate is pre-pared as one batch individually for each treatment.
In-line filter blood bag systemBlood bag system with integrated filter for leuko-cyte filtration.
Intestamin®
Enteral supplement containing a high dose ofglutamine for the treatment of critically ill patients.
On-line Clearance MonitorOptional component of a hemodialysis machine tomeasure online the effective in-vivo dialyzer clear-ance for quality assurance purposes.
OptifluxTM dialyzerA new Fresenius Polysulfon® dialyzer generationfeaturing improved clearance rates and outstand-ing biocompatibility.
Prometheus®
Novel extracorporeal blood purification system,used for patients with liver disease to support theliver in its detoxification function.
stay.safe®
Biocompatible, safe and environmentally-friendlyperitoneal dialysis system using Biofine® as well as PIN and DISC technology, which eliminates theneed for clamps and breaking cones.

Index200
A
Accounting and valuation principles 118 ff.Acquisitions 9 f., 27 f., 32, 40, 45, 59 f.,
72, 81, 133Antibody therapies 54Approved capital 168Asset and capital structure 82 ff.
B
Balance sheet structure 13, 82 ff.
C
Cancer 54Capital increase 16, 167Cash and cash equivalents 144Cash flow 13, 80, 182Cash flow statement 80 f., 106 f., 182Cell therapies 54Clinical nutrition 39 ff., 52 f.Conditional capital 169Corporate Governance 20 ff.Currency and interest risk management 84, 87, 176 ff.Currency translation 64 f., 128Current assets 82
D
Dialysis care 32 ff.Dialysis products 32 ff.Distribution of earnings 196Dividend 16, 80, 170
E
Earnings 12, 74 f.Earnings per share 18, 75, 143Education 49Employees 49 ff., 84Employee participation 50Enteral nutrition 39 ff., 52 f.Entities to be consolidated 119 f.Environment 55 f.Equity ratio 13, 83
F
Financing 76 ff. Free cash flow 13, 80Fresenius Biotech 54
G
Group structure 63 f., 115
H
Health care industry 69 ff., 93 ff.Hemodialysis 32 ff.Hospital operations 45 f.
I
Immune therapy 54 f.Infusion technology 53Infusion therapy 41 f., 53Inventories 144Investments 81 ff.Investor Relations 17
M
Market capitalization 16, 20Minority interest 75, 167
N
Net income 12, 75Net interest 75, 139Non-current assets 82 f.
O
Operating cash flow 80Outlook 93 ff.
P
Parenteral nutrition 39 ff.Pensions 160 ff.Peritoneal dialysis 32 ff.Personnel expenses 84, 138Procurement 85, 98
Q
Quality management 86
R
Rating 92Research and Development 50 ff., 66Risk report 87 ff.ROE – Return on equity 84ROIC – Return on invested capital Inside
coverROOA – Return on operating assets 110
S
Sales 12, 73 f., 138Segment reporting 110 ff.Single-use dialyzer 32 ff.Share 14 ff.Shareholder structure 17Share price development 14 f.Stock option plan 22, 50Strategy 65 f.
T
Training 49Transformation of legal form 116 f.Transfusion technology 43Transplantation immunology 55
V
Value added 76 f.
W
Working capital 80
INDEX

TRANSFUSION TECHNOLOGY
Ω Blood bags
Ω Blood bag systems with in-line
filters
Ω Leukocyte filters
Ω Mixing devices
Ω Cooling and transportation systems
Ω Automatic blood component
processing systems
Ω Sealing devices
Ω Sterile docking devices
Ω Blood cell separators for
– Hemapheresis
– Therapeutic apheresis
Ω Stem cell bags
Ω Solutions
HELIOS KLINIKEN GROUP
The HELIOS Kliniken Group
consists of:
Ω HELIOS Kliniken GmbH:
– Group of clinics with acute hospi-
tals for all medical disciplines
– High quality medical treatment of
patients at all levels of care, up to
maximum care
Ω Wittgensteiner Kliniken AG (WKA):
– Operation and management of
post acute hospitals
VAMED
Worldwide projects and services
for health facilities:
Ω Feasibility studies
Ω Operational and organisational
planning
Ω IT planning
Ω Architectural planning
Ω Planning of medical-technical
equipment
Ω Complete medical and technical
equipment for hospitals /packages
Ω Medical-technical maintenance
Ω Building technology planning
Ω Facility management
Ω Project development and
management
Ω Turn-key projects
Ω Financial engineering
Ω General and technical management
of health facilities
VAMED is also responsible for the
projects of hospitalia international.
PHARMAPLAN
Engineering and plant design for the
pharmaceutical and medical device
industry:
Ω Feasibility studies
Ω Consulting and engineering
Ω Turn-key projects
Ω Validation and quality management
Ω Logistics and warehousing
Ω Services for pharmaceutical
production
Ω Training
Ω Facility management for
pharmaceutical companies
Ω Supply, installation and mainten-
ance of water systems/preparation
systems for the pharmaceutical
industry (Pharmatec)
BIOTECHNOLOGY
Ω Immunosuppressive agent
ATG-Fresenius S
Ω Fluids and disposables for organ
perfusion and preservation
Ω Cell products for research and
clinical application
Ω Vector production gene therapy
Fresenius ProServe Fresenius Biotech
Pro
duct
s an
d S
ervi
ces
of o
ur B
usin
ess
Seg
men
ts
HEMODIALYSIS
Ω Machines for
– Hemodialysis
– Hemodiafiltration
– Hemofiltration
Ω High- and Low-flux dialyzers
(Fresenius Polysulfone®)
Ω FX-class dialyzers (Helixone®)
Ω Heparin syringes
Ω Dialysis fluid filters
Ω Blood lines
Ω Dialysis cannulae
Ω Hemodiafilters
Ω Dialysis concentrates (liquid, dry)
Ω Rinsing solutions
Ω Disinfectants
Ω Water treatment systems
Ω Analysis devices
Ω Data management systems
ACUTE DIALYSIS
Ω Machines for acute dialysis
Ω Hemofilters
Ω Hemofiltration solutions
Ω Dialysis fluid concentrates
Ω Dialysis catheters
Ω Blood lines
Ω Plasma filters
PERITONEAL DIALYSIS
Ω Machines and tubing systems for
Automated Peritoneal Dialysis (APD)
Ω Peritoneal dialysis solutions
Ω CAPD systems
Ω CAPD double chamber systems
Ω Peritoneal dialysis catheters
Ω Accessories
Ω Data Management Systems
(Patient OnLine)
DIALYSIS CARE
Ω Dialysis clinics for chronic
hemodialysis treatment
Ω Acute inpatient dialysis treatment
Ω Training (hemodialysis and
peritoneal dialysis)
Ω Planning and installation of water
treatment systems for hemodialysis
Ω Planning of hemodialysis centers
SPECTRA RENAL
MANAGEMENT
Ω Laboratory and diagnostic dialysis-
related services
Ω Data management
Ω Managed care services for dialysis
patients
LIVER SUPPORT THERAPY
Ω Machines for liver support therapy
Ω Albumin filters
Ω Anion exchanger
Ω Neutral resin adsorber
Ω Citrate calcium anticoagulation
THERAPEUTICAL APHERESIS
LDL apheresis:
Ω DALI®
Immunoadsorption:
Ω PROSORBA®
Ω Immunosorba
Ω GLOBAFFIN
Ω CORAFFIN
INFUSION THERAPY
Ω Basic solutions
Ω Infusion solutions for osmotic
therapy
Ω Irrigation solutions/urology
Ω Infusion solutions for blood volume
replacement and hemodilution
therapy
Ω I.V. anaesthetics
Ω I.V. anti-infective drugs
Ω I.V. catecholamines
Ω I.V. analgesics
Ω Innovative packaging systems for
I.V. products
Ω Patient individual cytostatic infusion
therapies
Ω Medical devices
– PDMS – Patient data management
systems
– Volumetric infusion pumps and
syringe pumps
– Infusion and clinical fluid mana-
gement systems
– I.V. disposables and accessories
– I.V. anaesthesia and analgesia
systems
– Clinical medical systems for
wound drainage
– Technical equipment for irrigation
solutions
– Suprapubic drainage systems
– In-dwelling venous cannulae
– Implantable port systems
– Portable drug pumps
– Autotransfusion systems
– Blood gas and electrolytes analyzer
for point of care
Ω Disinfectants
CLINICAL NUTRITION
Parenteral nutrition
Ω Industrially compounded admix-
tures (2 and 3 chamber bags, all
in one bags)
Ω Standard and special amino acid
solutions
Ω Lipid emulsions
Ω Additives
Ω Compounding systems including
empty bags and calculation soft-
ware for nutrition therapy
Ω Patient-individual concept for
outpatient parenteral nutrition
Ω Scientific support and information
Ω Training and education
Ω Medical devices
– Devices for parenteral nutrition
and its application
– Volumetric infusion pumps
– Disposables and accessories
Enteral nutrition
Ω Sip and tube feeds
– Standard diets
– Disease-specific diets
– Nutritional supplements
Ω Oral amino acids/Keto acids
Ω Scientific support and information
Ω Training and education
Ω Management and provision of
outpatient therapies
Ω Medical devices
– Feeding tubes
– Transnasal tubes
– Percutaneous tubes
– Application technology
– Feeding pumps
– Giving sets
– Accessories
Fresenius Medical Care Fresenius Kabi
in million € 2005 2004 Change
Sales 809 813 0%
EBIT 20 9 122%
Net income 2 -10 –
Operating cash flow 19 23 -17%
Capital expenditure/acquisitions 1,519 29 –
Order intake 341 244 40%
Employees (December 31) 26,664* 9,398 –
* Includes the employees of HELIOS Kliniken since the company was consolidated effective December 31, 2005.
Key figures of the business segments
in million US$ 2005 2004 Change
Sales 6,772 6,228 9%
EBIT 939 852 10%
Net income 455 402 13%
Operating cash flow 670 828 -19%
Capital expenditure/acquisitions 449 399 13%
R+D expenses 51 51 0%
Employees (December 31) 50,250 46,949 7%
Dialysis products,Dialysis care,Extracorporeal therapies
in million € 2005 2004 Change
Sales 1,681 1,491 13%
EBIT 234 176 33%
Net income 111 79 41%
Operating cash flow 237 170 39%
Capital expenditure/acquisitions 351 68 –
R+D expenses 64 56 14%
Employees (December 31) 14,453 11,577 25%
Fresenius is a health care Group with products and services
for dialysis, the hospital and the medical care of patients at
home. In addition, Fresenius focuses on hospital operations
as well as on engineering and services for hospitals and the
pharmaceutical industry. Nearly 92,000 employees work with
dedication in the service of health in around 100 countries of
the globe.
Key
fig
ures
of
the
busi
ness
seg
men
ts
Infusion therapy,Clinical nutrition,Transfusion technology
Hospital operations, Services for hospitals, Engineering and services for the pharmaceutical industry
Umschlag_FGB05_e_RZ.qxd 17.03.2006 17:03 Uhr Seite 2

Corporate Head Office
Else-Kröner-Strasse 1
Bad Homburg v.d.H.
Postal address
Fresenius AG
61346 Bad Homburg v.d.H.
Contact for shareholders
Investor Relations
Telephone: ++496172608-2485
++496172608-2486
++496172608-2487
Telefax: ++496172608-2488
e-mail: [email protected]
Contact for journalists
Corporate Communications
Telephone: ++496172608-2302
Telefax: ++496172608-2294
e-mail: [email protected]
Fresenius Group in Figures
Report on 1st quarter 2006
Conference call May 3, 2006
Annual General Meeting,
Frankfurt am Main (Germany) May 10, 2006
Payment of dividend* May 11, 2006
Report on 1st half 2006
Analysts‘ meeting, Bad Homburg v.d.H.
Live webcast August 4, 2006
Report on 1st-3rd quarters 2006
Analysts‘ meeting, Bad Homburg v.d.H.
Live webcast
Press conference, Bad Homburg v.d.H.
Live webcast November 3, 2006
* subject to the prior approval of the Annual General Meeting
Financial calendar
in million € 2005 2004 2003 2002 2001US GAAP US GAAP US GAAP US GAAP US GAAP
Results of operations
Sales 7,889 7,271 7,064 7,507 7,307
EBIT 1) 969 845 781 837 762
Net income 222 168 115 134 93
Depreciation and amortization 320 315 325 341 494
Operating cash flow 780 851 776 697 509
Operating cash flow in % of sales 9.9% 11.7% 11.0% 9.3% 7.0%
Earnings per ordinary share in € 1) 5.28 4.08 2.79 3.25 2.27
Earnings per preference share in € 1) 5.31 4.11 2.82 3.28 2.30
Balance sheet
Total assets 11,594 8,188 8,347 8,915 9,867
Non-current assets 8,063 5,433 5,603 6,172 6,837
Shareholders’ equity 2) 5,130 3,347 3,214 3,369 3,689
Equity ratio 2) 44% 41% 39% 38% 37%
Investments 3) 2,247 421 430 507 1,233
Profitability
EBIT margin 1) 12.3% 11.6% 11.1% 11.1% 10.4%
Return on equity after taxes (ROE)4) 11.4% 10.5% 7.5% 8.3% 5.3%
Return on operating assets (ROOA)4) 11.7% 11.1% 9.8% 9.7% 9.0%
Return on invested capital (ROIC)4) 8.0% 7.4% 6.3% 6.5% 7.5%
Dividend per ordinary share in € 1.485) 1.35 1.23 1.14 1.03
Dividend per preference share in € 1.515) 1.38 1.26 1.17 1.06
Employees (December 31) 91,971 68,494 66,264 63,638 60,667
1) 2001: before special charge for US legal matters of Fresenius Medical Care2) Shareholders’ equity including minority interest3) Property, plant and equipment and intangible assets, acquisitions4) 2005: balance sheet adjusted for acquisition of HELIOS Kliniken5) Proposal
A 10-year overview is available on our website: www.fresenius-ag.com/Investor Relations
An
nu
al R
epor
t 20
05
ACHIEVING OUR GOALSAnnual Report 2005
Design concept/Realization: Hilger&Boie GmbH, WiesbadenPrint: Kempkes, GladenbachPhotography: Peter Granser, Stuttgart
The German version of this Annual Report is legally binding.
The financial statements of Fresenius AG and the consolidated statements in accordance with IFRS accounting principlesare available on our website and may be obtained upon request.
Further information and current news about our company are available on our website at: http://www.fresenius-ag.com
Forward-looking statements:This Annual Report contains forward-looking statements. These statements represent assessments which we have madeon the basis of the information available to us at the time. Should the assumptions on which the statements are basednot occur, or if risks should arise – as mentioned in the risk report – the actual results could differ materially from theresults currently expected.
Umschlag_FGB05_e_RZ.qxd 17.03.2006 17:03 Uhr Seite 1

Corporate Head Office
Else-Kröner-Strasse 1
Bad Homburg v.d.H.
Postal address
Fresenius AG
61346 Bad Homburg v.d.H.
Contact for shareholders
Investor Relations
Telephone: ++496172608-2485
++496172608-2486
++496172608-2487
Telefax: ++496172608-2488
e-mail: [email protected]
Contact for journalists
Corporate Communications
Telephone: ++496172608-2302
Telefax: ++496172608-2294
e-mail: [email protected]
Fresenius Group in Figures
Report on 1st quarter 2006
Conference call May 3, 2006
Annual General Meeting,
Frankfurt am Main (Germany) May 10, 2006
Payment of dividend* May 11, 2006
Report on 1st half 2006
Analysts‘ meeting, Bad Homburg v.d.H.
Live webcast August 4, 2006
Report on 1st-3rd quarters 2006
Analysts‘ meeting, Bad Homburg v.d.H.
Live webcast
Press conference, Bad Homburg v.d.H.
Live webcast November 3, 2006
* subject to the prior approval of the Annual General Meeting
Financial calendar
in million € 2005 2004 2003 2002 2001US GAAP US GAAP US GAAP US GAAP US GAAP
Results of operations
Sales 7,889 7,271 7,064 7,507 7,307
EBIT 1) 969 845 781 837 762
Net income 222 168 115 134 93
Depreciation and amortization 320 315 325 341 494
Operating cash flow 780 851 776 697 509
Operating cash flow in % of sales 9.9% 11.7% 11.0% 9.3% 7.0%
Earnings per ordinary share in € 1) 5.28 4.08 2.79 3.25 2.27
Earnings per preference share in € 1) 5.31 4.11 2.82 3.28 2.30
Balance sheet
Total assets 11,594 8,188 8,347 8,915 9,867
Non-current assets 8,063 5,433 5,603 6,172 6,837
Shareholders’ equity 2) 5,130 3,347 3,214 3,369 3,689
Equity ratio 2) 44% 41% 39% 38% 37%
Investments 3) 2,247 421 430 507 1,233
Profitability
EBIT margin 1) 12.3% 11.6% 11.1% 11.1% 10.4%
Return on equity after taxes (ROE)4) 11.4% 10.5% 7.5% 8.3% 5.3%
Return on operating assets (ROOA)4) 11.7% 11.1% 9.8% 9.7% 9.0%
Return on invested capital (ROIC)4) 8.0% 7.4% 6.3% 6.5% 7.5%
Dividend per ordinary share in € 1.485) 1.35 1.23 1.14 1.03
Dividend per preference share in € 1.515) 1.38 1.26 1.17 1.06
Employees (December 31) 91,971 68,494 66,264 63,638 60,667
1) 2001: before special charge for US legal matters of Fresenius Medical Care2) Shareholders’ equity including minority interest3) Property, plant and equipment and intangible assets, acquisitions4) 2005: balance sheet adjusted for acquisition of HELIOS Kliniken5) Proposal
A 10-year overview is available on our website: www.fresenius-ag.com/Investor Relations
An
nu
al R
epor
t 20
05
ACHIEVING OUR GOALSAnnual Report 2005
Design concept/Realization: Hilger&Boie GmbH, WiesbadenPrint: Kempkes, GladenbachPhotography: Peter Granser, Stuttgart
The German version of this Annual Report is legally binding.
The financial statements of Fresenius AG and the consolidated statements in accordance with IFRS accounting principlesare available on our website and may be obtained upon request.
Further information and current news about our company are available on our website at: http://www.fresenius-ag.com
Forward-looking statements:This Annual Report contains forward-looking statements. These statements represent assessments which we have madeon the basis of the information available to us at the time. Should the assumptions on which the statements are basednot occur, or if risks should arise – as mentioned in the risk report – the actual results could differ materially from theresults currently expected.
Umschlag_FGB05_e_RZ.qxd 17.03.2006 12:26 Uhr Seite 1