Accurate Utility Depth Measurements Using the Spar …optimalranging.com/docs/Utility Survey...
14
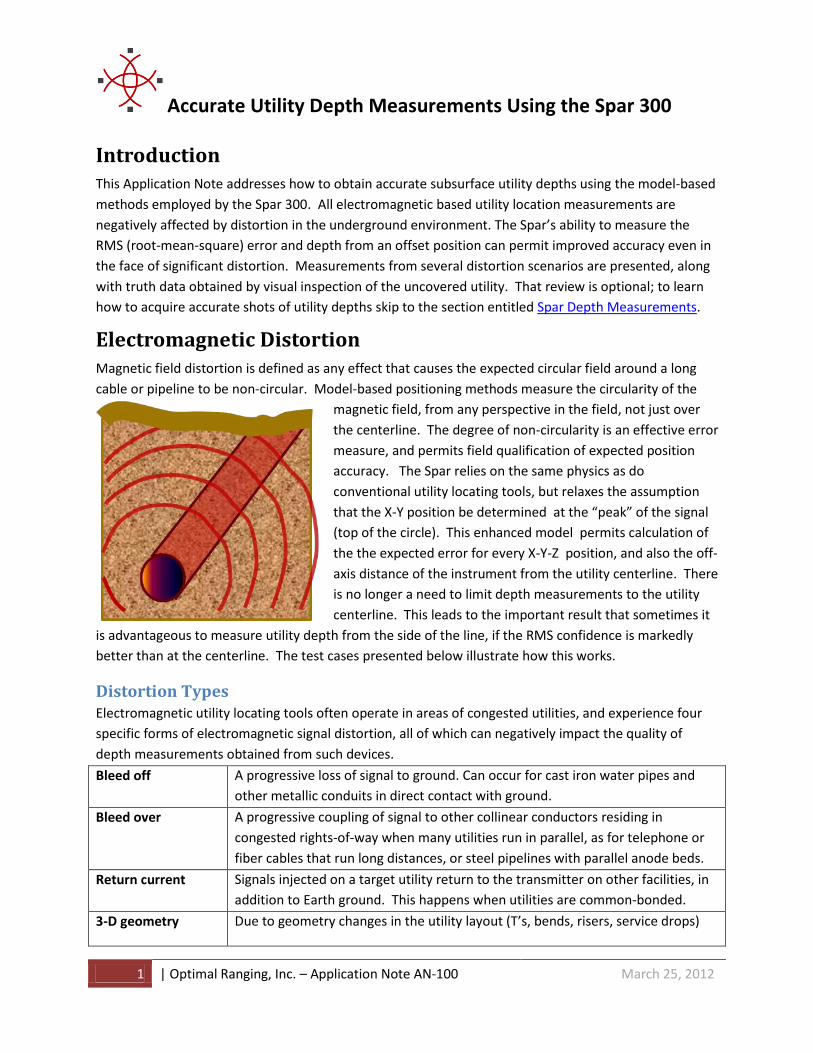
Accurate Utility Depth Measurements Using the Spar 300 1 | Optimal Ranging, Inc. – Application Note AN-100 March 25, 2012 This Application Note addresses how to obtain accurate subsurface utility depths using the model-based methods employed by the Spar 300. All electromagnetic based utility location measurements are negatively affected by distortion in the underground environment. The Spar’s ability to measure the RMS (root-mean-square) error and depth from an offset position can permit improved accuracy even in the face of significant distortion. Measurements from several distortion scenarios are presented, along with truth data obtained by visual inspection of the uncovered utility. That review is optional; to learn how to acquire accurate shots of utility depths skip to the section entitled Spar Depth Measurements. Magnetic field distortion is defined as any effect that causes the expected circular field around a long cable or pipeline to be non-circular. Model-based positioning methods measure the circularity of the magnetic field, from any perspective in the field, not just over the centerline. The degree of non-circularity is an effective error measure, and permits field qualification of expected position accuracy. The Spar relies on the same physics as do conventional utility locating tools, but relaxes the assumption that the X-Y position be determined at the “peak” of the signal (top of the circle). This enhanced model permits calculation of the the expected error for every X-Y-Z position, and also the off- axis distance of the instrument from the utility centerline. There is no longer a need to limit depth measurements to the utility centerline. This leads to the important result that sometimes it is advantageous to measure utility depth from the side of the line, if the RMS confidence is markedly better than at the centerline. The test cases presented below illustrate how this works. Distortion Types Electromagnetic utility locating tools often operate in areas of congested utilities, and experience four specific forms of electromagnetic signal distortion, all of which can negatively impact the quality of depth measurements obtained from such devices. Bleed off A progressive loss of signal to ground. Can occur for cast iron water pipes and other metallic conduits in direct contact with ground. Bleed over A progressive coupling of signal to other collinear conductors residing in congested rights-of-way when many utilities run in parallel, as for telephone or fiber cables that run long distances, or steel pipelines with parallel anode beds. Return current Signals injected on a target utility return to the transmitter on other facilities, in addition to Earth ground. This happens when utilities are common-bonded. 3-D geometry Due to geometry changes in the utility layout (T’s, bends, risers, service drops)
Transcript of Accurate Utility Depth Measurements Using the Spar …optimalranging.com/docs/Utility Survey...
Accurate Utility Depth Measurements Using the Spar 300
1 | Optimal Ranging, Inc. – Application Note AN-100 March 25, 2012
This Application Note addresses how to obtain accurate subsurface utility depths using the model-based
methods employed by the Spar 300. All electromagnetic based utility location measurements are
negatively affected by distortion in the underground environment. The Spar’s ability to measure the
RMS (root-mean-square) error and depth from an offset position can permit improved accuracy even in
the face of significant distortion. Measurements from several distortion scenarios are presented, along
with truth data obtained by visual inspection of the uncovered utility. That review is optional; to learn
how to acquire accurate shots of utility depths skip to the section entitled Spar Depth Measurements.
Magnetic field distortion is defined as any effect that causes the expected circular field around a long
cable or pipeline to be non-circular. Model-based positioning methods measure the circularity of the
magnetic field, from any perspective in the field, not just over
the centerline. The degree of non-circularity is an effective error
measure, and permits field qualification of expected position
accuracy. The Spar relies on the same physics as do
conventional utility locating tools, but relaxes the assumption
that the X-Y position be determined at the “peak” of the signal
(top of the circle). This enhanced model permits calculation of
the the expected error for every X-Y-Z position, and also the off-
axis distance of the instrument from the utility centerline. There
is no longer a need to limit depth measurements to the utility
centerline. This leads to the important result that sometimes it
is advantageous to measure utility depth from the side of the line, if the RMS confidence is markedly
better than at the centerline. The test cases presented below illustrate how this works.
Distortion Types Electromagnetic utility locating tools often operate in areas of congested utilities, and experience four
specific forms of electromagnetic signal distortion, all of which can negatively impact the quality of
depth measurements obtained from such devices.
Bleed off A progressive loss of signal to ground. Can occur for cast iron water pipes and
other metallic conduits in direct contact with ground.
Bleed over A progressive coupling of signal to other collinear conductors residing in
congested rights-of-way when many utilities run in parallel, as for telephone or
fiber cables that run long distances, or steel pipelines with parallel anode beds.
Return current Signals injected on a target utility return to the transmitter on other facilities, in
addition to Earth ground. This happens when utilities are common-bonded.
3-D geometry Due to geometry changes in the utility layout (T’s, bends, risers, service drops)

Accurate Utility Depth Measurements Using the Spar 300
2 | Optimal Ranging, Inc. – Application Note AN-100 March 25, 2012
Bleedoff
Bleedoff does not normally result in significant
distortion, i.e., the magnetic field emanating from the
targeted underground utility remains mostly circular.
However, the measured current on the line drops
fairly quickly, and depth measurements can be in
error. Thus there is still some nonconformity of the
measured data from the expected because of field
gradients (as illustrated at left).
Bleedover
Bleedover is a significant problem since it occurs
whenever utility lines lay in parallel over some distance.
Electromagnetic coupling between the lines causes the
signal placed on a target to jump over to other lines,
causing them to radiate the same signal. The non-
circular sum of all the signals is seen at ground level. A
conventional locator may find that the peak signal does
not represent the centerline of the utility, and the depth
is often even less reliable.
Return Current
Return current is similar to bleedover, in that multiple
collinear utility lines radiate the same signal, resulting
in a non-circular signature as seen by the locating
device at ground level. The distinction is that the
current is as a result of the utility lines being physically
“bonded” together at a common point, away from the
point of measurement.
3-D Geometry
Distribution pipelines and cables seldom follow
straight paths for long distances, and often have
“T” connections and other geometrical features
that result in non-circular fields. This type of
distortion is easiest to detect by monitoring the
measured RMS as the Spar is moved over the
area. Often these spatially limited signatures

Accurate Utility Depth Measurements Using the Spar 300
3 | Optimal Ranging, Inc. – Application Note AN-100 March 25, 2012
show up easily in logged position data, especially when the data collection mode is Continuous
Topo.
In this Application Note, we will focus on the effects of Bleedover and Return Currents, which
are often the hardest to detect since they are not localized, and can persist over long segments
of a utility right-of-way. Even when the magnetic field appears rounded, depth measurements
can be significantly impacted, as will be shown next.
The cases chosen for detailed analysis in this document are derived from actual field conditions at
several locations in the USA. They range from ideal (near perfect circular field) to a situation in which it
is impossible to measure the depth over the top of the utility.
Table 1. Test case “truth” geometry showing known offset and depths of target and bleedover cable(s).
Case Target cable Return or Bleedover cable Current Ratio
Offset Depth Offset Depth
1 0.45 0.88 m none none N/A
2 1.44 0.88 m 3.88 m 0.91 m 33% (bleedover)
3 2.00 0.88 m 2.00 m 0.36 m 33% (return)
4 2.20 0.88 m 3.88 m
0.02 m
0.91 m
0.85 m
33% (bleedover)
20% (return)

Accurate Utility Depth Measurements Using the Spar 300
4 | Optimal Ranging, Inc. – Application Note AN-100 March 25, 2012
Case 1 This undistorted case is used to show baseline performance compared to the others. The target utility is
a single utility line, Earth grounded at some far point, with no significant bleedover or return current
present. The plot on the left side shows the Peak and Null signals as a Spar is traversed across the top of
the utility. A peak signal is derived from a horizontally aligned magnetic sensor, and the null signal is
derived from a vertically aligned sensor. Since each Spar has two 3-D sensors, two peak signals (Top Y,
Bottom Y) and two null signals (top Z, bottom Z) are shown. As expected at the utility centerline, the
minimum nulls and maximum peaks coincide (all four sensors taken individually would determine the
same utility centerline.
The two plots on the right in Figure 1 show the error in offset and depth prediction as a function of
distance measured across the utility line. The positive and negative root-mean-square error is also
shown.
Even for this so-called undistorted case, the bounds start to diverge at positions beyond 2 meters from
the true utility centerline. This won’t necessarily be the case for all such situations, but at the test site
used to collect this Spar data, the right side of the utility centerline did exhibit some non-conformity to
the field model.
Figure 1. Undistorted field (Case 1), with the true centerline at 0.45 meters.
Case 2 A single bleedover cable is present, at a little less than 2.5 m (8 feet) to the side of the target. The depth
of the bleedover cable as well as the target is the same, but the current carried in that parallel cable is
only 1/3 of the value carried by the target. Even so, significant distortion is present, as can be observed
in the field data (left plot in Figure 2). The peak signals (Top Y and Bottom Y) appear rounded, but they
are in slightly different positions across the cable. The null signals (Top Z and Bottom Z) vary even more.
The Spar’s estimates of offset and depth errors are also shown in Figure 2, both of which get
0 1 2 30
0.05
0.1
0.15
0.2
0.25
distance, meters
Magnetic f
ield
, A
/m
Case 1: Magnitude
topY
topZ
botY
botZ
0 1 2 3-1.5
-1
-0.5
0
0.5
1
1.5
distance, meters
Err
or
(m)
Case 1: Offset Error
1- (+)
estimated
1- (-)
0 1 2 3-1.5
-1
-0.5
0
0.5
1
1.5
distance, meters
Err
or
(m)
Case 1: Depth Error
1- (+)
estimated
1- (-)

Accurate Utility Depth Measurements Using the Spar 300
5 | Optimal Ranging, Inc. – Application Note AN-100 March 25, 2012
progressively worse as the target cable is crossed and the Spar sees a larger influence from the
bleedover cable.
At the known true centerline (1.44 meters), neither the depth or offset measurements are that far off
from the true values. The depth measurement at the peak signal (Bottom Y) is shallow by only 10 cm.
Still, were the user to sweep across the utility prior to capturing a measured utility position, it would be
advantageous to make such measurements from the good side of the line, i.e., the left side.
Figure 2. One-sided distortion (Case 2) with the true position at 1.44 meters.
Case 3 A cable that is common-bonded to the target is present directly on top of the target, at a shallower depth. It returns 1/3 of the outgoing current back to the transmitter (as do the other cases). As demonstrated by the Figure 3 plots, this case results in high distortion near the true utility centerline.
Figure 3. Bleedover cable is directly over the target (Case 3) centered at 2 meters.
0 1 2 3 40
0.05
0.1
0.15
0.2
0.25
distance, meters
Magnetic f
ield
, A
/m
Case 2: Magnitude
topY
topZ
botY
botZ
0 1 2 3 4-1.5
-1
-0.5
0
0.5
1
1.5
distance, meters
Err
or
(m)
Case 2: Offset Error
1- (+)
estimated
1- (-)
0 1 2 3 4-1.5
-1
-0.5
0
0.5
1
1.5
distance, meters
Err
or
(m)
Case 2: Depth Error
1- (+)
estimated
1- (-)
0 1 2 3 40
0.02
0.04
0.06
0.08
0.1
0.12
distance, meters
Magnetic f
ield
, A
/m
Case 3: Magnitude
topY
topZ
botY
botZ
0 1 2 3 4-1.5
-1
-0.5
0
0.5
1
1.5
distance, meters
Err
or
(m)
Case 3: Offset Error
1- (+)
estimated
1- (-)
0 1 2 3 4-1.5
-1
-0.5
0
0.5
1
1.5
distance, meters
Err
or
(m)
Case 3: Depth Error
1- (+)
estimated
1- (-)

Accurate Utility Depth Measurements Using the Spar 300
6 | Optimal Ranging, Inc. – Application Note AN-100 © March 25, 2012
In fact, it is no longer possible to use the peak signals (Y) as a reasonable prediction of the utility
centerline. In this case, the peak value (red curve in the left-most plot in Figure 3) is 0.5 meters away
from the truth (2.00 meters). Errors will result if this peak position is used as a reference for the depth
measurement (as is required when using conventional cable locators). Using the Spar, the depth can be
fairly accurately measured from an offset position. In the plot at the right side of Figure 3, a depth error
of about 5 cm will occur if the measurement is taken from an offset position of 1 meter.
Case 4 Case 4, with two bleedover/return cables, represents two-sided distortion and will be discussed below.
Summary To summarize the results presented in this section, we can say:
Potentially large centerline and depth errors are possible in areas exhibiting distorted fields
Offset and Depth RMS confidence is a good predictor of actual error
Distortion can be detected by moving the Spar across the utility
Accurate depth measurement may be possible even when distorted conditions exist
Using the Trimble Access Utility Survey application, we’ll now observe how the Spar user can recognize
and deal with distortion in the field. The focus here is to optimize the accuracy of a single 3-D point.
In this case greater attention can be paid to local field conditions, moving the Spar across the utility line
at right-angles to the lay of the line. This differs from “Continuous Topo” mode which is used to collect
a large number of points while walking down the line. In this section, we demonstrated methods to
detect distortion and in some cases mitigating its effects on a single depth measurement. For example,
the method described here could be used at the site of a planned “test-hole”, to predict the depth prior
to excavation or vacuum extraction.
Model Fix In all conventional locating equipment, the utility centerline is estimated by finding the “peak” of the
magnetic signal strength. Although that is not necessary for the Spar’s model-based methods to
estimate depth, the peak signal strength is a useful parameter and can be
used to aid the horizontal confidence estimate on a site. When the
position of the peak differs from the Spar’s estimated centerline, the
error expectation must expand to encompass this divergence. It is also
very useful to annotate the peak position in the Job database for later
review, since the peak value is often used as the geospatial X-Y position.
Version 1.2.0 of Utility Survey (Trimble Access) includes a new Point
Measurement called “Utility Peak”. This can be used to create a special
point in the Job that annotates the peak signal position. Prior to selecting this measurement, the Spar

Accurate Utility Depth Measurements Using the Spar 300
7 | Optimal Ranging, Inc. – Application Note AN-100 © March 25, 2012
should be moved over ground to maximize the signal strength (dB value) at the top left of FieldSens
View. In the next figure, 70.6 dB is the maximum value, while the dB difference from the last “clear” is
2.44 dB. At any time a simple cursor touch on
the dB difference will clear the value to 0.00,
facilitating a very sensitive measurement of the
peak signal value.
From the Measure menu in FieldSens View, it’s
now possible to record the peak signal position
as a database point.
For the highest possible accuracy, we will further
see how the peak value can be used as a
reference for validating all the confidence
indicators prior to logging a Utility Point that
represents the best achievable 3-D position of
the underground utility. First, we have to switch
on “Model Fix” mode, from the checkbox on
page 3 of the Line panel in Trimble Access.
When Model Fix is on, any deviation between
the peak value and the currently estimated
centerline position is added to the horizontal
RMS error for the measurement. This deviation
is also logged in the Job for later review.
Furthermore, in Model Fix mode, when a signal
peak is marked, it’s possible to use the peak as a
reference position as the Spar moves across the
line. To see how this works, we click on Model
Fix and return to FieldSens View. A message
indicating that a Model Fix is pending appears.

Accurate Utility Depth Measurements Using the Spar 300
8 | Optimal Ranging, Inc. – Application Note AN-100 © March 25, 2012
Next, at the utility peak signal, a Measure “Utility
Peak” operation is invoked. This drops a green
circle at the point of the peak value, and expands
the horizontal confidence to include both the
peak and model fix on the utility line.
As can be seen at left, the red confidence box has
increased size compared to the last screen, and is
a direct result of the peak signal being measured.
In fact, when we observe the recorded peak point
HUK5 in the Job, we find that the recorded
horizontal error between the peak value and the
model is 4 cm (see h_O parameter in the Note).
Now that we have measured the peak value, it can be used as a marker for further analysis of the field.

Accurate Utility Depth Measurements Using the Spar 300
9 | Optimal Ranging, Inc. – Application Note AN-100 © March 25, 2012
We step right from the marked peak and then left, observing key FieldSens View parameters:
1. Verify red confidence box does not markedly change in size to the left compared to the right.
2. Check that the blue utility line and green peak mark remain in approximate alignment.
3. Compare the computed depth values (circled above) at the left, right, and centerline positions
are in agreement within the predicted error.
If any of these three field checks result in inconsistent depth values, field distortion is present on site
and some further inspection will be necessary prior to recording the 3-D Utility Point. The above case is
fairly clean, with little variation in the depth value over a distance of about 5 feet (1.6 m) left to right
over the utility. When we double the step to one side (5.76 feet, or 1.8 m), the depth value changes a
bit (to 3.02 ft, or 92 cm) but the confidence box
has expanded (±1.5 ft, or ±45 cm) as is typical for
increased offset from the line. The end result
for this case is that the depth value obtained at
the centerline (3.23 feet, or 0.99 m, ± 0.09 m),
has high confidence. A Measure “Utility Point”
can be invoked at any position within about a
meter of the line, and the depth value will not
vary more than a tenth of a foot (3 cm).
Maintaining Contact The following three screen shots show how the Peak marks, dropped on the screen when Model Fix is
active, remain present regardless of orientation. When the current position moves away from the
recorded peak so that the peak is beyond the current screen scale, the color turns yellow and a thin line

Accurate Utility Depth Measurements Using the Spar 300
10 | Optimal Ranging, Inc. – Application Note AN-100 © March 25, 2012
through the center indicates the expected yaw angle of the utility line. This can be used to validate
utility offset positions down-line from the point of peak measurement. When the yaw angle does not
agree with the current slope of the blue line, or
the blue line does not transect the dropped peak
mark, a new peak should be measured.
Repeated “Model Fix” peak measurements are
only necessary to maintain and achieve the
highest possible 3-D accuracy. Normally, the
user is alerted to the need for invoking such
detailed distortion mitigation steps by a non-
symmetrical behavior of the red confidence box
(or when inconsistent depth readings occur) as
the system is moved across the line. Thus it is
recommended to periodically cross the utility
line to allow the system to detect such conditions. When symmetry exists in the behavior of the quality
metrics presented above, a high accuracy point can be measured using Model Fix mode.
Asymmetry in the Field As another example, we show how the Spar system can be used to mitigate the distortion issues
presented in Case 2, with a highly confident depth and centerline estimate. As before, we measure the
utility peak to drop a reference point on the screen. We’ll use this to validate both the off-axis position
and the depth value as we cross the line from left to right.
The measured deviation in the signal peak position from the current model position results in a small
offset that is added to the horizontal confidence value.

Accurate Utility Depth Measurements Using the Spar 300
11 | Optimal Ranging, Inc. – Application Note AN-100 © March 25, 2012
Passing over the utility line from left to right, we obtain the following change in the FieldSens View
parameters, Note that in the next six screen
shots, the red box scaling remains fixed (0.375
feet, or 0.125 meters). Observe how the size of
the box reduces dramatically as the system is
moved from the left (near the source of an
interfering bleedover cable) to the right side.
The depth value is very inconsistent on the left
side of the line (minimum 1.12 ft) but stabilizes
on the right side at a value of about 2.4 feet (73
cm) ±0.15 ft (4 cm).

Accurate Utility Depth Measurements Using the Spar 300
12 | Optimal Ranging, Inc. – Application Note AN-100 © March 25, 2012
Using Multiple Frequencies In the sequence of screen shots above, note that two frequencies are in use during the scan over the top
of the utility by the Spar. Both 491 Hz and 8440 Hz were active at the transmitter, allowing the Spar
receiver to easily change between these two frequencies while qualifying the depth measurement. In
fact, this is another effective way to validate expected accuracy. No matter what frequency is used, the
depth and offset values should be the same, they refer to the same utility line that carries AC current at
both frequencies. Since bleedover results from electromagnetic coupling (by non-contact capacitive
and/or inductive effects), the degree of bleedover is a function of the frequency. Often in bleedover
conditions, there is a change in the size of the confidence box when the frequency is changed. When
bleedover is detected, it’s almost always better to use a lower frequency if enough signal can be
detected (> 15 dB minimum).
Distortion due to return currents is not dependent on frequency, and thus the behavior at the point of
measurement is similar regardless of the Spar frequency selection.
Both 10 Watt transmitters shipped as part of Spar kits (Metrotech i5000 and Vivax-Metrotech Loc-10Tx)
support two simultaneous frequency outputs in direct connection mode. The dual frequency output
mode is recommended when qualifying distortion conditions for situations in which the transmitter can
be connected directly to the utility line.
Conclusion Clearly for this example, a highly confident depth estimate is achievable only on the right side of the
line, due to measured distortion on the left side. The depth measurement made at the centerline is not
too far off, but rapid degradation of the depth confidence occurs just to the left of the centerline. Field
conditions will vary dramatically depending on frequency, the degree of signal coupling, and the
geometry of what is underground. The closer is the distorting influence to the target cable, the more
challenging is the positioning problem. Using the offset methods described here, the Spar user has an
effective tool for detecting and potentially mitigating these conditions. Often this simply means that a

Accurate Utility Depth Measurements Using the Spar 300
13 | Optimal Ranging, Inc. – Application Note AN-100 © March 25, 2012
better (more confident) depth value is obtained from a sideline position a couple of steps away from the
peak signal strength.
- All the results so far demonstrated how to deal with “one-sided” distortion, i.e., when the distorting
bleedover cable is on one side (or over the top) of the target utility. In those cases, we showed how
improved accuracy is possible using the Spar’s ability to measure depth from an offset position. In fact,
some situations are worse in that the distorting influences are on both sides of the target.
Case 4 Case 4 is such an example of two-sided distortion. Table 1 identifies the geometry of the two bleedover
cables, which lay about 2.5 meters to either side of the target. The peak and null signals are round and
symmetric, but the depth measurement taken at the centerline (2.2m) is too shallow by 15 cm (6”).
There are no sideline positions at which the RMS error is improved; in fact it becomes much worse away
from the centerline. The Spar’s Line mode offers no inherent accuracy advantage over conventional
equipment in such a case, however, it still effectively presents the RMS error as a warning that
distortion conditions are present. As the next section describes, advanced methods are necessary to
decouple distorting influences from signals arising from the target utility.
Figure 4. Two bleedover cables on each side of target (Case 4).
Precise mode Optimal Ranging’s model-based detection method is very general. In the results so far, we’ve assumed
there is only one target utility. All non-conformances to the one target model are lumped into RMS
error, which has been shown to be an effective predictor of depth accuracy. Interestingly, the model-
based method can be expanded to detect multiple utility lines simultaneously, with the goal of
identifying the bleedover and return current sources directly. When these enhancements to the
detection model used by the Spar, improved confidence in the position of the target utility is possible.
0 1 2 3 4 50
0.05
0.1
0.15
0.2
0.25
distance, meters
Magnetic f
ield
, A
/m
Case 4: Magnitude
topY
topZ
botY
botZ
0 1 2 3 4 5-1.5
-1
-0.5
0
0.5
1
1.5
distance, meters
Err
or
(m)
Case 4: Offset Error
1- (+)
estimated
1- (-)
0 1 2 3 4 5-1.5
-1
-0.5
0
0.5
1
1.5
distance, meters
Err
or
(m)
Case 4: Depth Error
1- (+)
estimated
1- (-)

Accurate Utility Depth Measurements Using the Spar 300
14 | Optimal Ranging, Inc. – Application Note AN-100 © March 25, 2012
This follows from the fact that once a disturbing influence is identified in terms of its physical
characteristics (depth, offset, current), the effects of this influence can be removed (subtracted) from
the total measured signal. The result is a more reliable centerline and depth estimate of the target
utility line.
This method is known as Precise mode, and is the subject of a future application note. The primary
benefit of the approach is when distortion is two-sided, and it isn’t possible to make a depth
measurement from the “good side” of the utility.
Figure 5 shows how by using Precise methods, the depth confidence at the centerline for Case 4
improves from ± 18 cm in Line mode to ± 8 cm in Precise mode. Data collection for the method relies on
stacking multiple successive Spar measurements together as the instrument is moved across the line.
Each of the black squares represents one Spar measurement of all six channels (two 3-D sensors). If a
subset of measurements is used (fewer than the nine sets of measurements), then the multi-line model
can still be used, though the confidence improvement is less. The red confidence box below uses all 54
measurements (9 positions times 6 channels), while the blue boxes represent lesser numbers of
measurements.
Figure 5. Precise mode detection of 3 cables.