Accreditation Council for Business Schools and Programs (ACBSP ...
67
Accreditation Council for Business Schools and Programs (ACBSP) Quality Assurance (QA) Report for Baccalaureate/Graduate Degree Programs Current as of August 2013 (the July 2012 template is current and may be used as well). Overview (O) 1. Complete all information requested. Submit your report as an attachment to [email protected] on or before February 15th or September 15th. This report should be limited to maximum of 50 pages. The average length of most good reports is 30 pages. To help reduce the page numbers you can remove the ACBSP examples used in this report template to help you complete the report. O2. Institution Name: Florida Memorial University Date: February 14, 2014 Address: 15800 NW 42 nd Avenue, Miami Gardens, FL 33054 O3. Year Accredited/Reaffirmed: 2000 / 2010 This Report Covers Years: 2011-2013 O4. List All Accredited Programs (as they appear in your catalog): The Bachelor of Science in Accounting The Bachelor of Science in Business Administration The Bachelor of Science in Finance The Bachelor of Science in Marketing The Masters of Business Administration (MBA) O5. List all programs that are in your business unit that are not accredited by ACBSP and how you distinguish accurately to the public between programs that have achieved accredited status and those that have not. Not applicable O6. List all campuses that a student can earn a business degree from your institution: Business degrees are earned on the main campus O7. Person completing report Name: Dr. Abbass Entessari
Transcript of Accreditation Council for Business Schools and Programs (ACBSP ...
Accreditation Council for Business Schools and Programs (ACBSP)
Quality Assurance (QA) Report
for
Baccalaureate/Graduate Degree Programs
Current as of August 2013 (the July 2012 template is current and may be used as well).
Overview (O) 1. Complete all information requested.
Submit your report as an attachment to [email protected] on or before February 15th or September 15th.
This report should be limited to maximum of 50 pages. The average length of most good reports is 30 pages. To help reduce the page
numbers you can remove the ACBSP examples used in this report template to help you complete the report.
O2. Institution Name: Florida Memorial University Date: February 14, 2014
Address: 15800 NW 42nd Avenue, Miami Gardens, FL 33054
O3. Year Accredited/Reaffirmed: 2000 / 2010 This Report Covers Years: 2011-2013
O4. List All Accredited Programs (as they appear in your catalog):
The Bachelor of Science in Accounting
The Bachelor of Science in Business Administration
The Bachelor of Science in Finance
The Bachelor of Science in Marketing
The Masters of Business Administration (MBA)
O5. List all programs that are in your business unit that are not accredited by ACBSP and how you distinguish accurately to the public
between programs that have achieved accredited status and those that have not.
Not applicable
O6. List all campuses that a student can earn a business degree from your institution:
Business degrees are earned on the main campus
O7. Person completing report Name: Dr. Abbass Entessari
Phone: (305) 623 4288, (305) 623 1441
E-mail address: [email protected]
ACBSP Champion name: Dr. Abbass Entessari, Dean of the School of Business
ACBSP Co-Champion name: Dr. Denis Callwood-Brathwaite, Associate Provost of Academic Affairs
O8. Conditions or Notes to be Addressed: You do not need to address Opportunity for Improvement (OFI)
Please explain and provide the necessary documentation/evidence for addressing each condition or note since your last report.
Are you requesting the Board of Commissioners to remove notes or conditions (if the justification for removal is lengthy consider attaching
an appendix to QA report) : Remove Note:
Remove Condition:
Not applicable
Do not remove note or condition. Explain the progress made in removing the note or condition:
Not applicable.
O9. The business unit must routinely provide reliable information to the public on their performance, including student achievement such as assessment results.
Describe how you routinely provide reliable information to the public on your performance, including student achievement such as assessment results and program results.
The School of Business routinely provide reliable information to the public on its performance through the School of Business Newsletter, Advisory Council meetings and workshops, University Web page (including the Monday morning Presidents massage), Florida Memorial Fact Books, weekly or bi-weekly Activity Reports to the Office of Academic Affairs.
Student Learning Outcome Assessment Results: Such as what you report in Standard #4, ETS, accounting assessment, management assessment, critical thinking, communication, etc. How do you make the results public?
The School of Business provides information on Student Learning Outcome Assessment Results to the public through the School of Business reports to the Office of Institutional Effectiveness, Advisory Council meetings and workshops, University Web page (currently under re-construction), Office of Academic Affairs, and reports to the alumni of the School of Business.
Program Results: Such as what you report in standard #6, graduation rats, retention rates, job placement, etc. How do you make the results public?
The School of Business provides information on standard #6 to the public through the Florida Memorial Fact Books prepared by the Office of the Institutional Effectiveness, School f Business Newsletter, School of Business Advisory Council meetings and workshops, University Web page (currently under re-construction), Office of Academic Affairs, and reports to the alumni of the School of Business.
Standard #1 Leadership
Organization
a. List any organizational or administrative personnel changes within the business unit since your last report.
Response: The following lists the personnel change in the School of Business:
1. Dr. Robert Pellegrino, the Associate Professor of Marketing, in no longer the MBA Director. Dr. Robert Labadie, the Professor of Business Administration, is the Acting MBA Director.
An Organizational Chart of the School of Business will be available in Appendix A of this document.
b. List all new sites where students can earn an accredited business degree (international campus, off-campus or on campus, on-line) that have been added since your last report?
Response: The School of Business offers all the degree programs on the main campus of Florida Memorial University.
Standard #2 Strategic Planning (this standard not typically addressed in the QA report) This is used as a place holder to allow all the other
standards to be addressed in the QA report and keep the numbering system consistent with self-studies and QA reports.
Response: It is not required.
Removing Note on Standard 2: Strategic Planning-
While a formal process for setting short term goals and strategic objectives is in place, it is not clear how the Business School will systematically
track progress toward its stated goals and objectives, nor how the action plans, goals and measurements are communicated to faculty, staff and
stakeholders.
Response:
1. How the Business School will systematically track progress toward its stated goals and objectives
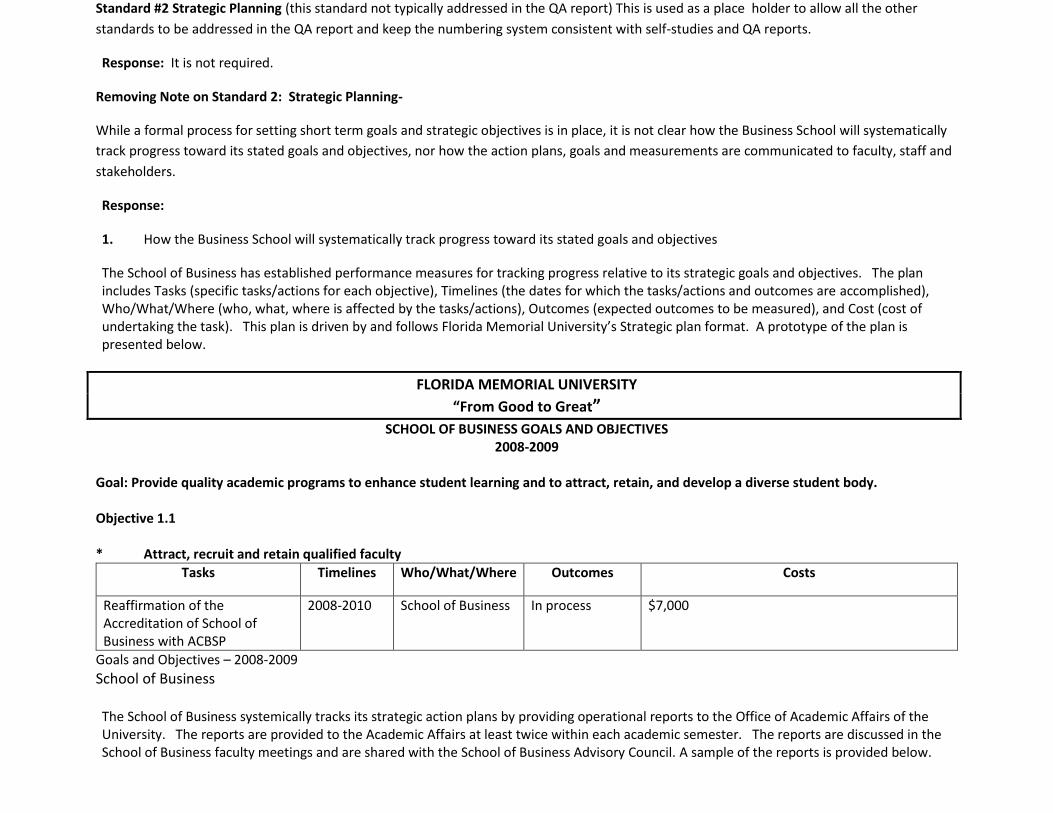
The School of Business has established performance measures for tracking progress relative to its strategic goals and objectives. The plan includes Tasks (specific tasks/actions for each objective), Timelines (the dates for which the tasks/actions and outcomes are accomplished), Who/What/Where (who, what, where is affected by the tasks/actions), Outcomes (expected outcomes to be measured), and Cost (cost of undertaking the task). This plan is driven by and follows Florida Memorial University’s Strategic plan format. A prototype of the plan is presented below.
FLORIDA MEMORIAL UNIVERSITY
“From Good to Great”
SCHOOL OF BUSINESS GOALS AND OBJECTIVES 2008-2009
Goal: Provide quality academic programs to enhance student learning and to attract, retain, and develop a diverse student body. Objective 1.1 * Attract, recruit and retain qualified faculty
Tasks Timelines Who/What/Where Outcomes Costs
Reaffirmation of the Accreditation of School of Business with ACBSP
2008-2010 School of Business In process $7,000
Goals and Objectives – 2008-2009 School of Business The School of Business systemically tracks its strategic action plans by providing operational reports to the Office of Academic Affairs of the University. The reports are provided to the Academic Affairs at least twice within each academic semester. The reports are discussed in the School of Business faculty meetings and are shared with the School of Business Advisory Council. A sample of the reports is provided below.

FLORIDA MEMORIAL UNIVERSITY Operational Report by Unit
Fall 2009 School: Business Dean: Dr. Abbass Entessari
Task/Objective Status Person Responsible Comment
Reaffirmation of the Accreditation of School of Business with ACBSP
In process Faculty, directors of the programs, Dean
The School of Business faculty and staff is completing the Self Study report
To provide consistency with the ACBSP Report Template, the School of Business will modify its Strategic planning reports to include Results of
Actions Taken. This will provide a systematic assessment and tracking of progress towards the School’s stated goals and objectives. The
modification will also make it easier to assess performance of the Strategic Plan by the faculty and other stake holders.
FLORIDA MEMORIAL UNIVERSITY
“From Good to Great”
SCHOOL OF BUSINESS GOALS AND OBJECTIVES 2008-2009
Goal: Provide quality academic programs to enhance student learning and to attract, retain, and develop a diverse student body. Objective 1.1 * Attract, recruit and retain qualified faculty
Tasks/Actions Timelines Who/What/Where Outcomes/Performance Measurement
Results of Action Taken
Cost Comments
Reaffirmation of the Accreditation of School of Business with ACBSP
2008-2010 School of Business faculty, directors, and Dean
100% Completion of the Self-Study Report to be submitted to ACBSP in due time
%80 of the Self-Study Report is completed
$7,000 NA
Goals and Objectives – 2008-2009 School of Business All the reports and action plans are sent to the faculty and staff within the School of Business. Relevant stake holders associated with the School of Business will also receive the School of Business reports.
Standard #3 Student and Stakeholder Focus
Complete the following table. Use a maximum of three or four examples, reporting what you consider to be the most important data. It is not
necessary to provide results for every process.
Response:
Removing Note on Standard 3: Student and Stakeholder Focus-
While it is clear that the Business School is very student-oriented, and that it collects data regarding student and stockholder satisfaction with
its programs, evidence of specific changes that have resulted from these assessments is lacking. Please provide evidence of positive uses of
assessment data for program or process improvement.
Response:
The School of Business has positively used assessment data for program or process improvement. The following examples represent some of
the actions taken by the School for program or process improvements.
* Development of the Student Complaint Resolution Form Process within the School of Business
Results of the Action Taken: One student has used the Form on an academic issue. The complaint was successfully resolved by the Complaint
Committee (the Form will be in the Appendix A of this report).
* Revision and Expansion of the School of Business Advisory Council
Results of the Action Taken: The Advisory Council of the School of Business has been revised to increase the membership (21 members). The
President of the Council and his officers were elected in the Fall 2011. The Council includes: a Curriculum Committee, an Internship
Committee, and an Executive Round Table Committee. To guarantee the dedication and association of the members, it was decided to charge
each Council member a $500.00 annual membership fee (data and information available upon request).
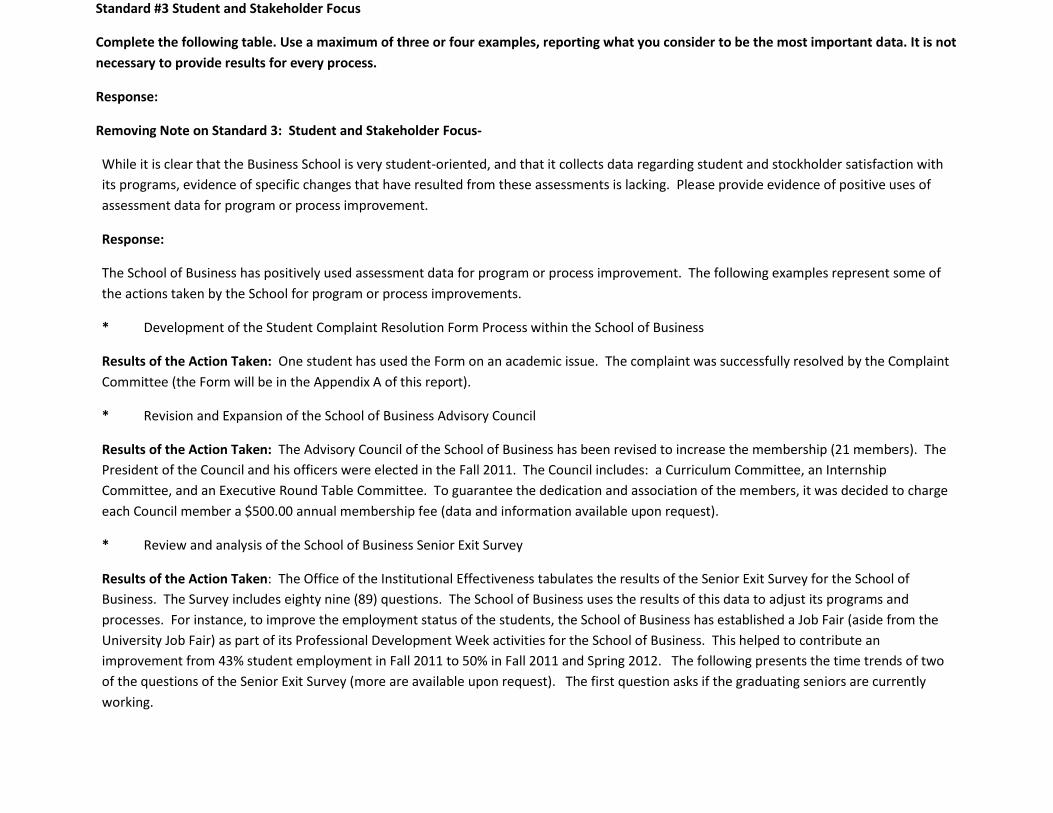
* Review and analysis of the School of Business Senior Exit Survey
Results of the Action Taken: The Office of the Institutional Effectiveness tabulates the results of the Senior Exit Survey for the School of
Business. The Survey includes eighty nine (89) questions. The School of Business uses the results of this data to adjust its programs and
processes. For instance, to improve the employment status of the students, the School of Business has established a Job Fair (aside from the
University Job Fair) as part of its Professional Development Week activities for the School of Business. This helped to contribute an
improvement from 43% student employment in Fall 2011 to 50% in Fall 2011 and Spring 2012. The following presents the time trends of two
of the questions of the Senior Exit Survey (more are available upon request). The first question asks if the graduating seniors are currently
working.
ARE YOU WORKING?
0
20
40
60
80
100
120
fall2009 spring 2010 fall 2010 spring 2011 fall 2011 spring 2012
NO
YES
0
10
20
30
40
50
60
70
0
10
20
30
40
50
60
70
fall2009 spring 2010 fall 2010 spring 2011 fall 2011 spring 2012
YES
NO
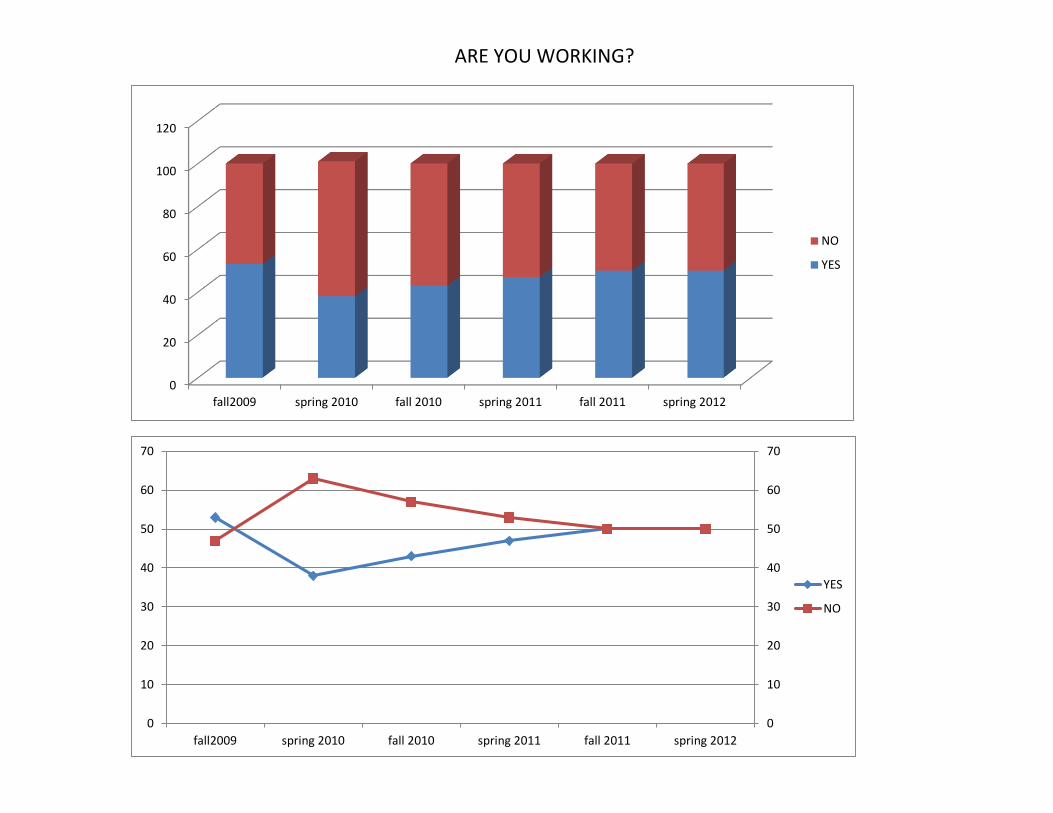
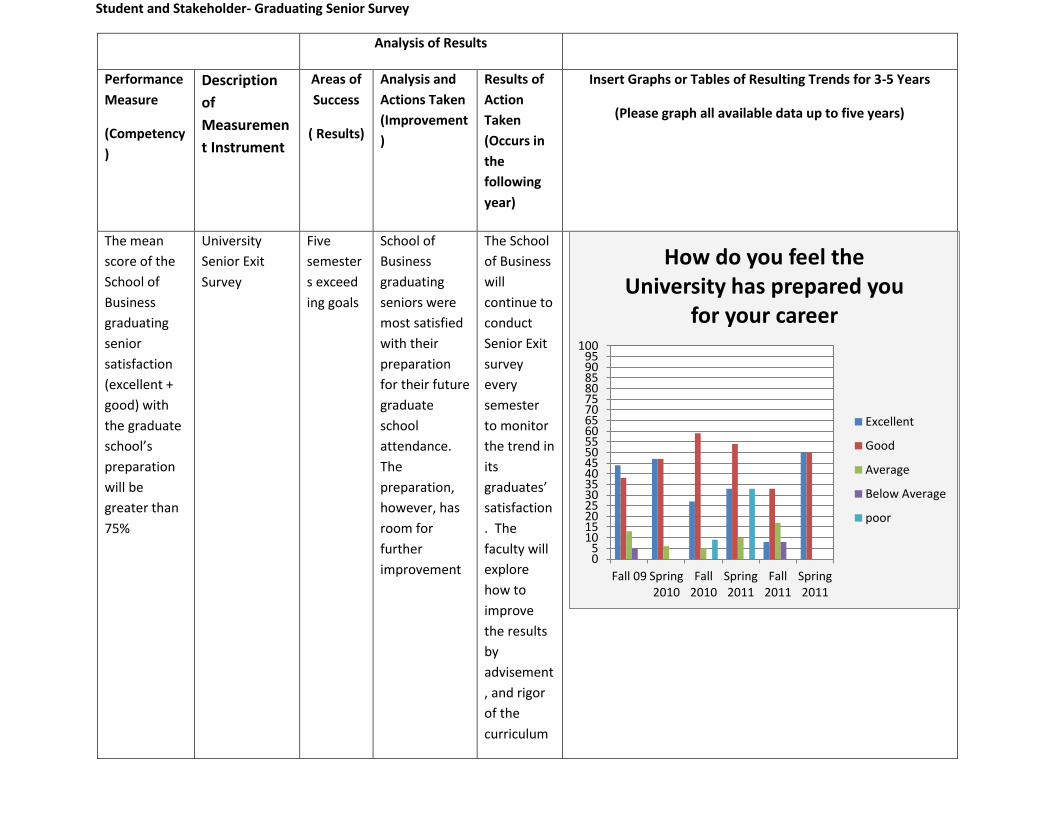
The Senior Exit Survey also asked students about their satisfaction with career preparation and development of the University and School
of Business programs. The results are shown in the following table. As the table indicates, more than sixty five (65%) percent of students
feel that the University and the School of Business has properly prepared them for their career.
0.055.05
10.0515.0520.0525.0530.0535.0540.0545.0550.0555.0560.0565.0570.0575.0580.0585.0590.0595.05
Fall 09 Spring 2010 Fall 2010 Spring 2011 Fall 2011 Spring 2011
How do you feel the University has prepared you for your career?
Excellent
Good
Average
Below Average
poor
0.055.05
10.0515.0520.0525.0530.0535.0540.0545.0550.0555.0560.0565.0570.0575.0580.0585.0590.0595.05
Fall 09 Spring 2010 Fall 2010 Spring 2011 Fall 2011 Spring 2011
How do you feel the University has prepared you for your career?
Excellent
Good
Average
Below Average
poor
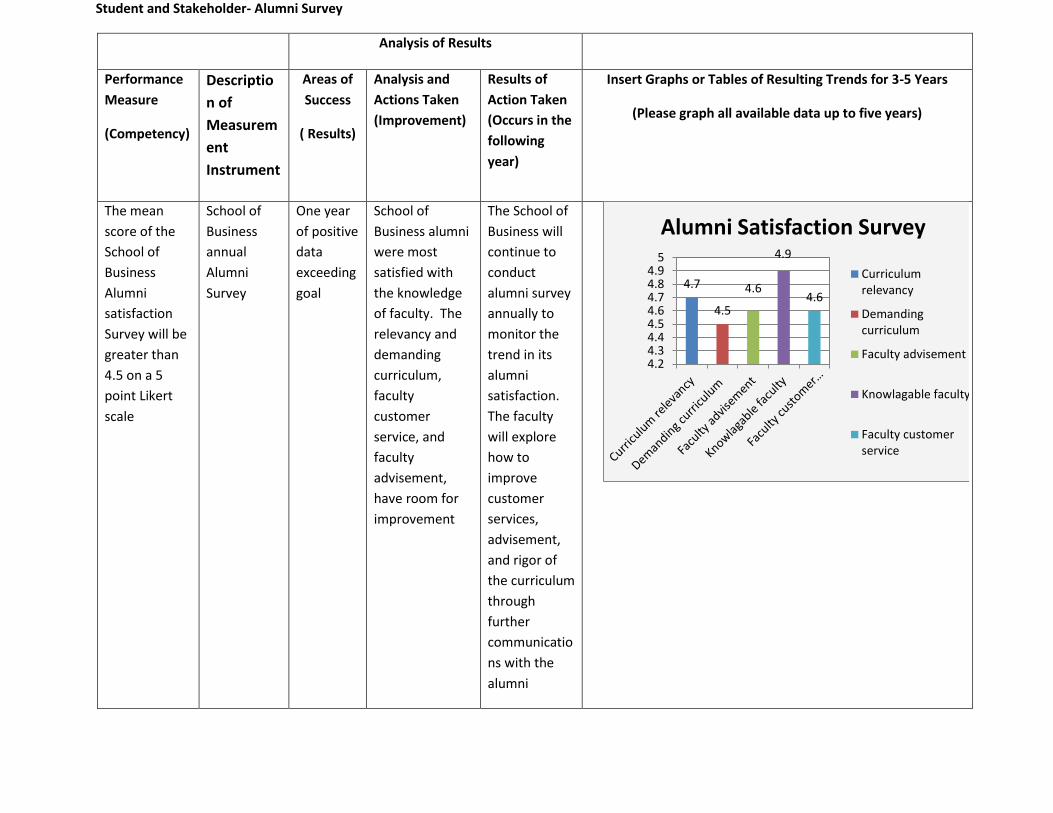
* Alumni Satisfaction Survey
Results of the Action Taken: The School of Business has developed an Alumni Satisfaction survey. The Survey measures curriculum relevancy,
demanding curriculum, faculty advisement, knowledge of faculty, and faculty customer services. The results for the 2011 academic year are
presented in the Student and Stakeholder- Alumni Survey table below.
* Internship Performance Evaluation, Professionalism, and Employability
Results of the Action Taken: The survey results for four (4) academic years are presented in the Student and Stakeholder tables (bellow)
for Students Internships Results, and Students’ potential for employment success (employability).
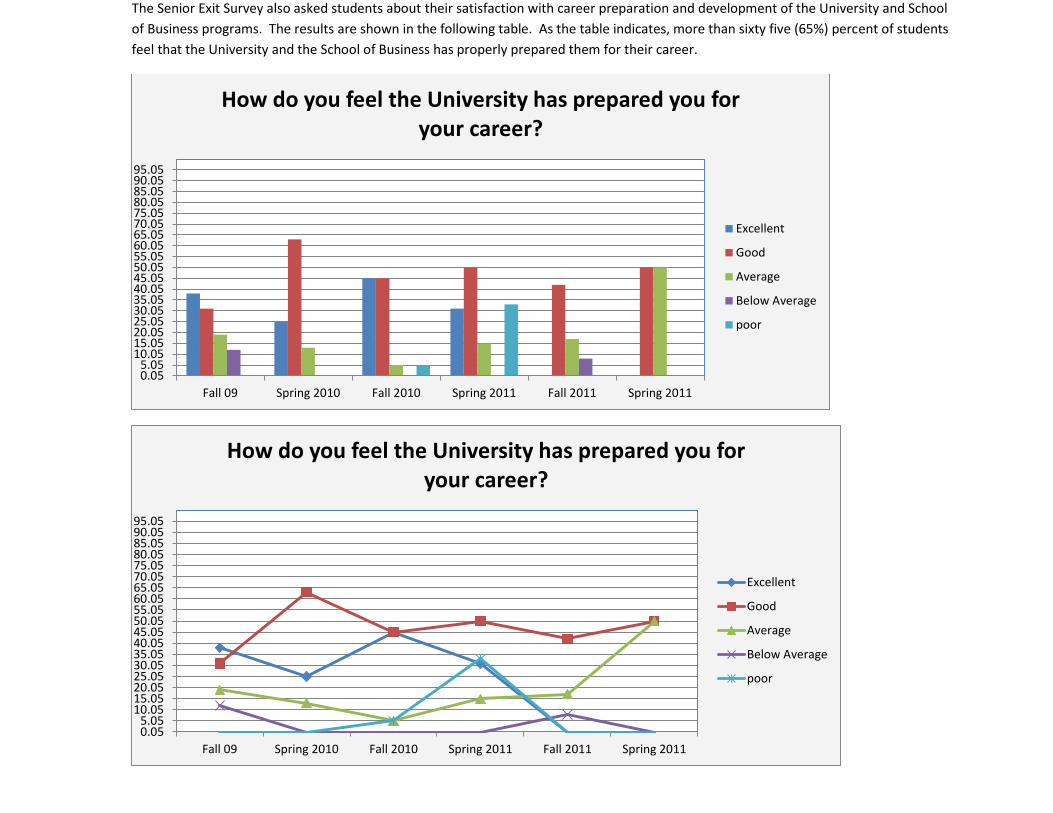
* Professional Development Activities Attendance
Results of the Action Taken: Due to review of School of Business Exit surveys, the School of Business established Professional
Development week for the students in 2003. The Week starts with a general opening theme (Globalization, Leadership,…) and includes
topics such as Internship Seminars, What is Needed for Academic Success, Royal Caribbean Cruise, Navigating Employment Seminars,
Surviving Corporate America, Professional Certification, and professional presentations. The Professional Development Week has been
well received by faculty and students and participation in the activities of the program has steadily increased, as demonstrated by the
following chart.
0
20
40
60
80
100
120
140
160
180
200
2007 2008 2009 2010 2011
Number of Students Attended Professional Development Activities
Number of Students
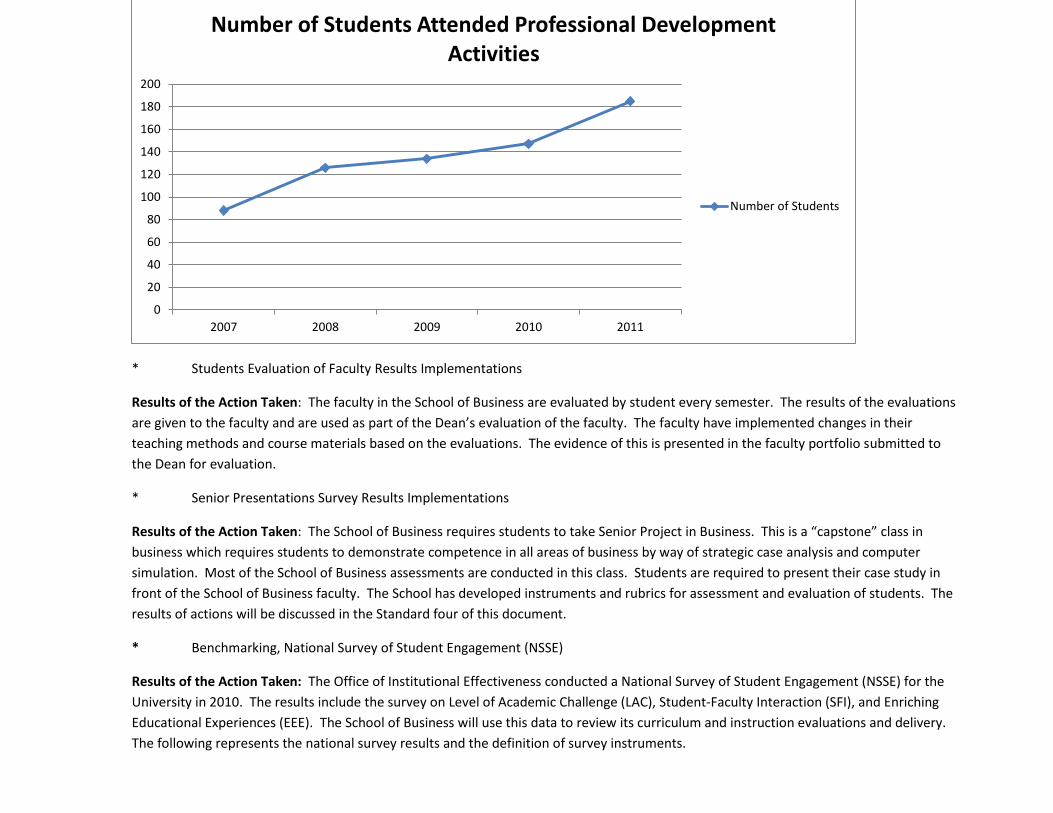
* Students Evaluation of Faculty Results Implementations
Results of the Action Taken: The faculty in the School of Business are evaluated by student every semester. The results of the evaluations
are given to the faculty and are used as part of the Dean’s evaluation of the faculty. The faculty have implemented changes in their
teaching methods and course materials based on the evaluations. The evidence of this is presented in the faculty portfolio submitted to
the Dean for evaluation.
* Senior Presentations Survey Results Implementations
Results of the Action Taken: The School of Business requires students to take Senior Project in Business. This is a “capstone” class in
business which requires students to demonstrate competence in all areas of business by way of strategic case analysis and computer
simulation. Most of the School of Business assessments are conducted in this class. Students are required to present their case study in
front of the School of Business faculty. The School has developed instruments and rubrics for assessment and evaluation of students. The
results of actions will be discussed in the Standard four of this document.
* Benchmarking, National Survey of Student Engagement (NSSE)
Results of the Action Taken: The Office of Institutional Effectiveness conducted a National Survey of Student Engagement (NSSE) for the
University in 2010. The results include the survey on Level of Academic Challenge (LAC), Student-Faculty Interaction (SFI), and Enriching
Educational Experiences (EEE). The School of Business will use this data to review its curriculum and instruction evaluations and delivery.
The following represents the national survey results and the definition of survey instruments.
0
20
40
60
80
100
120
140
160
180
200
2007 2008 2009 2010 2011
Number of Students Attended Professional Development Activities
Number of Students
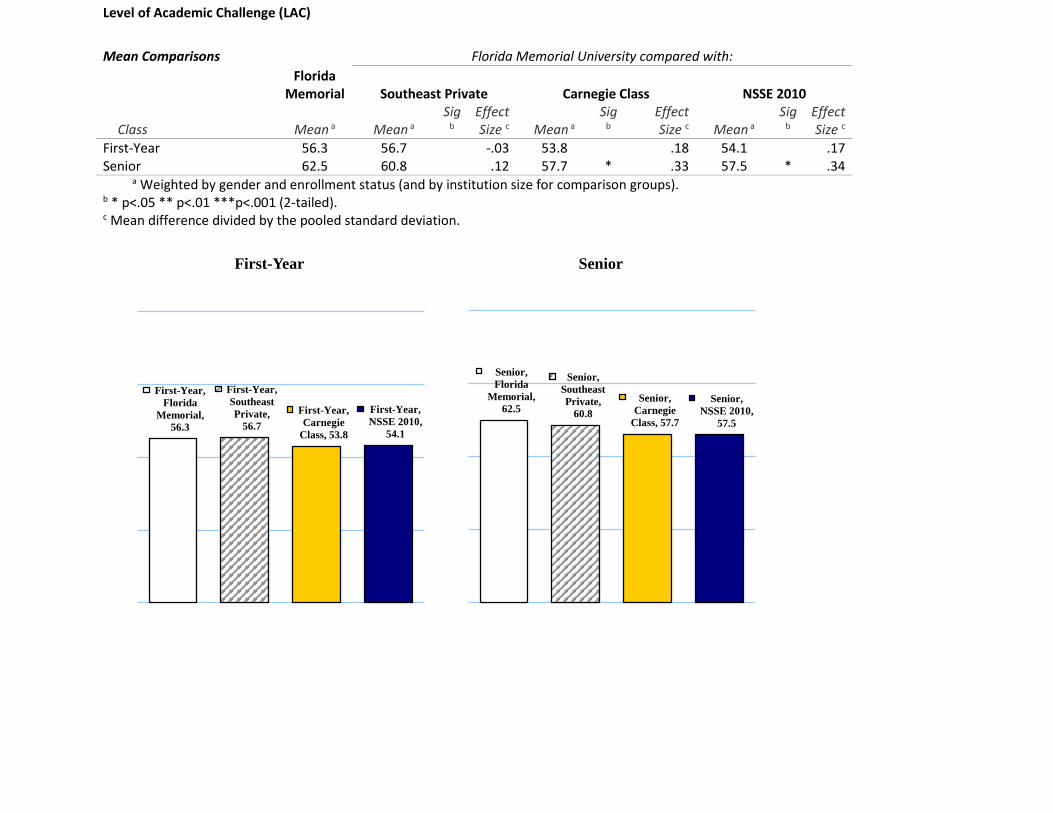
Level of Academic Challenge (LAC)
Mean Comparisons Florida Memorial University compared with:
Florida
Memorial Southeast Private Carnegie Class NSSE 2010
Class Mean a Mean a Sig
b Effect Size c Mean a
Sig b
Effect Size c Mean a
Sig b
Effect Size c
First-Year 56.3 56.7 -.03 53.8 .18 54.1 .17 Senior 62.5 60.8 .12 57.7 * .33 57.5 * .34
a Weighted by gender and enrollment status (and by institution size for comparison groups). b * p<.05 ** p<.01 ***p<.001 (2-tailed). c Mean difference divided by the pooled standard deviation.
First-Year,
Florida
Memorial,
56.3
First-Year,
Southeast
Private,
56.7
First-Year,
Carnegie
Class, 53.8
First-Year,
NSSE 2010,
54.1
First-Year
Senior,
Florida
Memorial,
62.5
Senior,
Southeast
Private,
60.8
Senior,
Carnegie
Class, 57.7
Senior,
NSSE 2010,
57.5
Senior
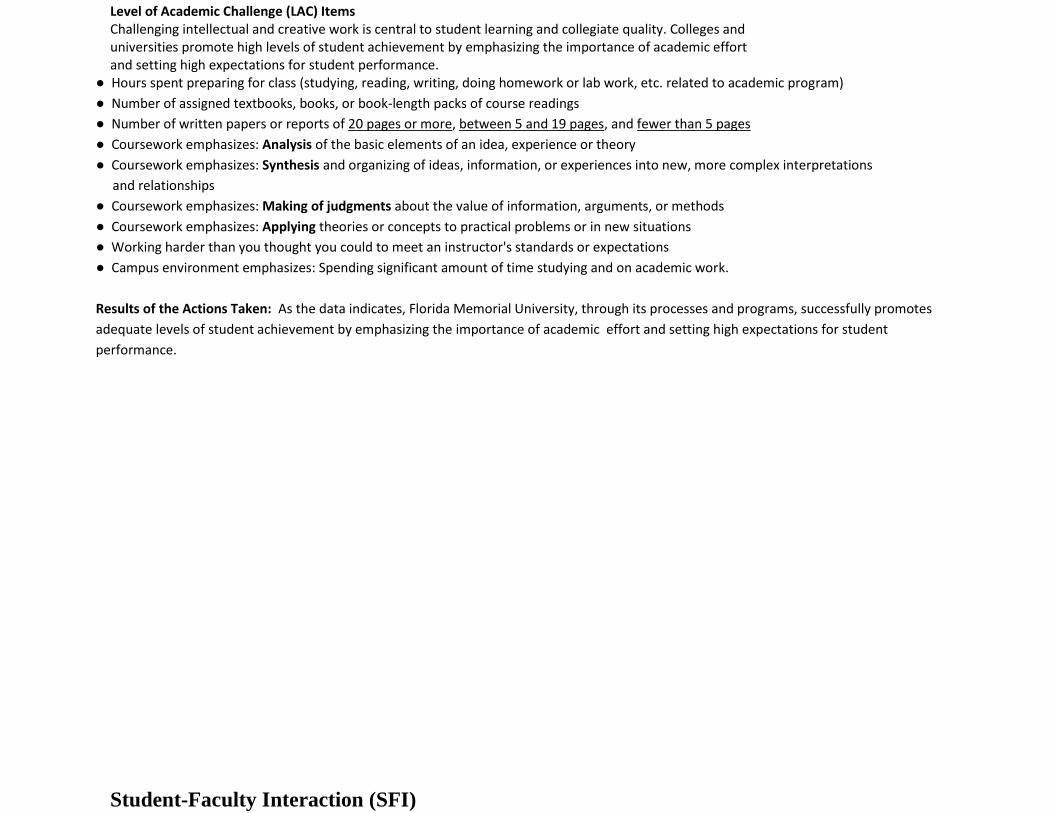
Level of Academic Challenge (LAC) Items Challenging intellectual and creative work is central to student learning and collegiate quality. Colleges and universities promote high levels of student achievement by emphasizing the importance of academic effort and setting high expectations for student performance.
● Hours spent preparing for class (studying, reading, writing, doing homework or lab work, etc. related to academic program)
● Number of assigned textbooks, books, or book-length packs of course readings
● Number of written papers or reports of 20 pages or more, between 5 and 19 pages, and fewer than 5 pages
● Coursework emphasizes: Analysis of the basic elements of an idea, experience or theory
● Coursework emphasizes: Synthesis and organizing of ideas, information, or experiences into new, more complex interpretations
and relationships
● Coursework emphasizes: Making of judgments about the value of information, arguments, or methods
● Coursework emphasizes: Applying theories or concepts to practical problems or in new situations
● Working harder than you thought you could to meet an instructor's standards or expectations
● Campus environment emphasizes: Spending significant amount of time studying and on academic work.
Results of the Actions Taken: As the data indicates, Florida Memorial University, through its processes and programs, successfully promotes
adequate levels of student achievement by emphasizing the importance of academic effort and setting high expectations for student
performance.
Student-Faculty Interaction (SFI)
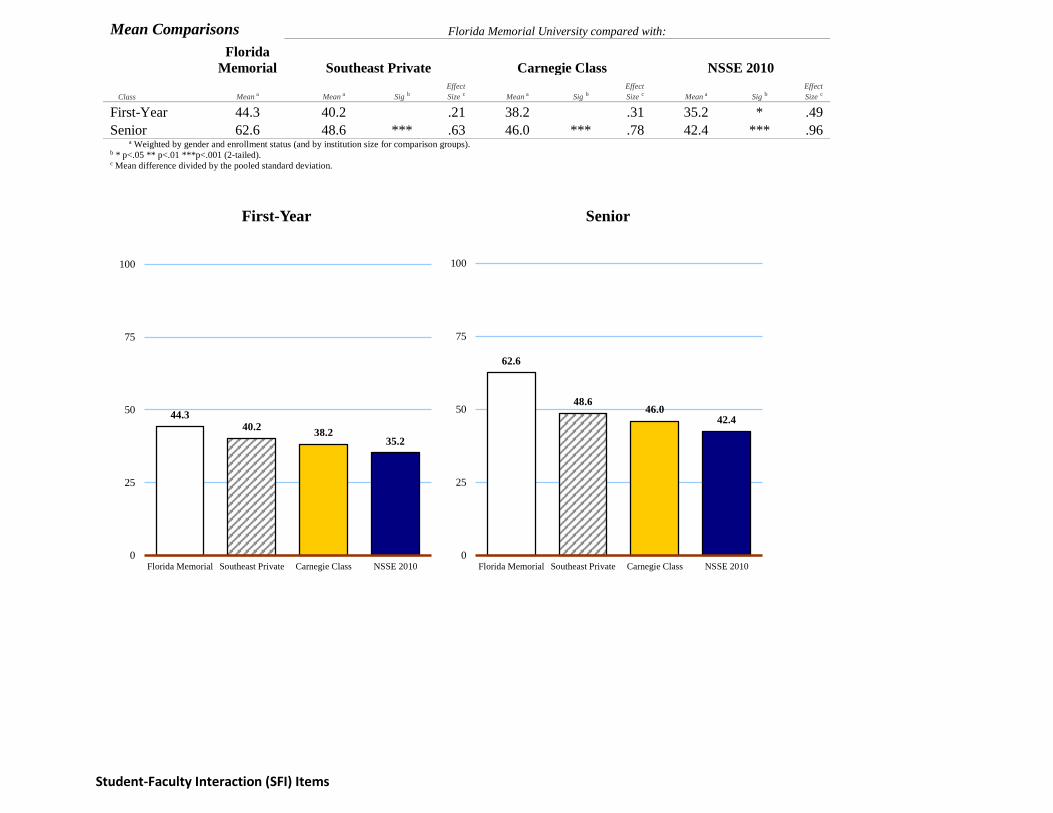
Mean Comparisons Florida Memorial University compared with:
Florida
Memorial Southeast Private Carnegie Class NSSE 2010
Class Mean a Mean a Sig b
Effect
Size c Mean a Sig b
Effect
Size c Mean a Sig b
Effect
Size c
First-Year 44.3 40.2 .21 38.2 .31 35.2 * .49
Senior 62.6 48.6 *** .63 46.0 *** .78 42.4 *** .96 a Weighted by gender and enrollment status (and by institution size for comparison groups).
b * p<.05 ** p<.01 ***p<.001 (2-tailed). c Mean difference divided by the pooled standard deviation.
Student-Faculty Interaction (SFI) Items
44.340.2
38.235.2
0
25
50
75
100
Florida Memorial Southeast Private Carnegie Class NSSE 2010
First-Year
62.6
48.646.0
42.4
0
25
50
75
100
Florida Memorial Southeast Private Carnegie Class NSSE 2010
Senior
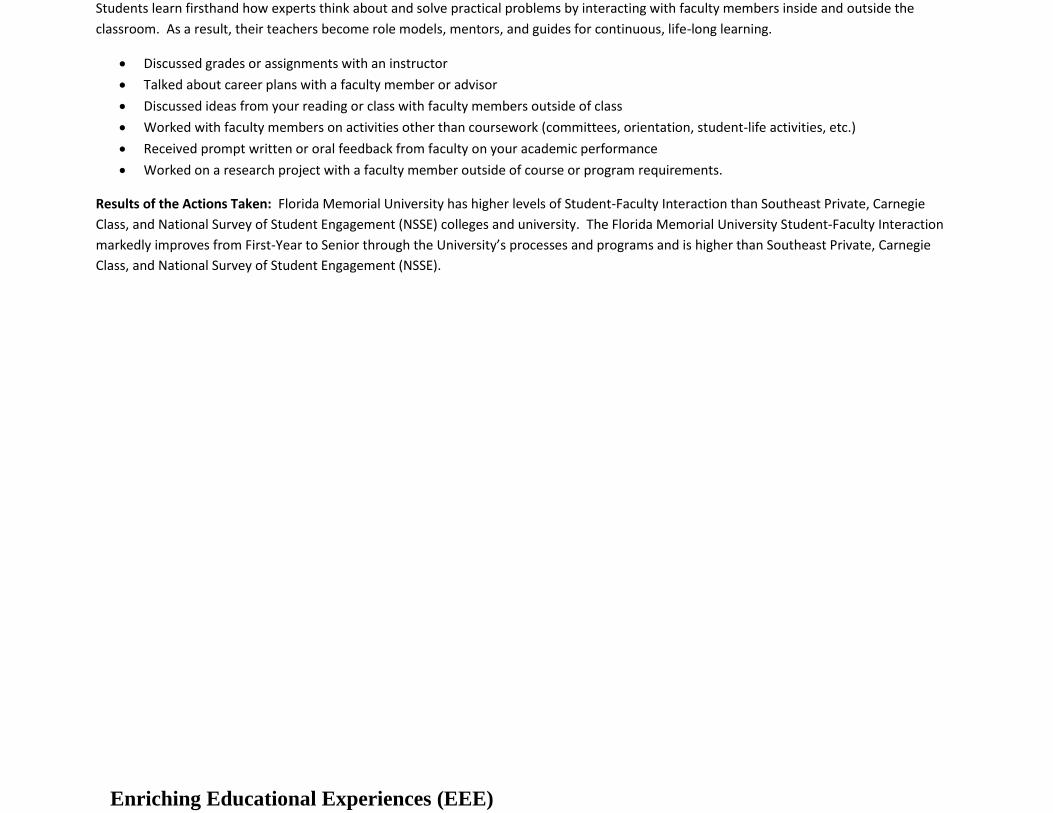
Students learn firsthand how experts think about and solve practical problems by interacting with faculty members inside and outside the
classroom. As a result, their teachers become role models, mentors, and guides for continuous, life-long learning.
Discussed grades or assignments with an instructor
Talked about career plans with a faculty member or advisor
Discussed ideas from your reading or class with faculty members outside of class
Worked with faculty members on activities other than coursework (committees, orientation, student-life activities, etc.)
Received prompt written or oral feedback from faculty on your academic performance
Worked on a research project with a faculty member outside of course or program requirements.
Results of the Actions Taken: Florida Memorial University has higher levels of Student-Faculty Interaction than Southeast Private, Carnegie
Class, and National Survey of Student Engagement (NSSE) colleges and university. The Florida Memorial University Student-Faculty Interaction
markedly improves from First-Year to Senior through the University’s processes and programs and is higher than Southeast Private, Carnegie
Class, and National Survey of Student Engagement (NSSE).
Enriching Educational Experiences (EEE)
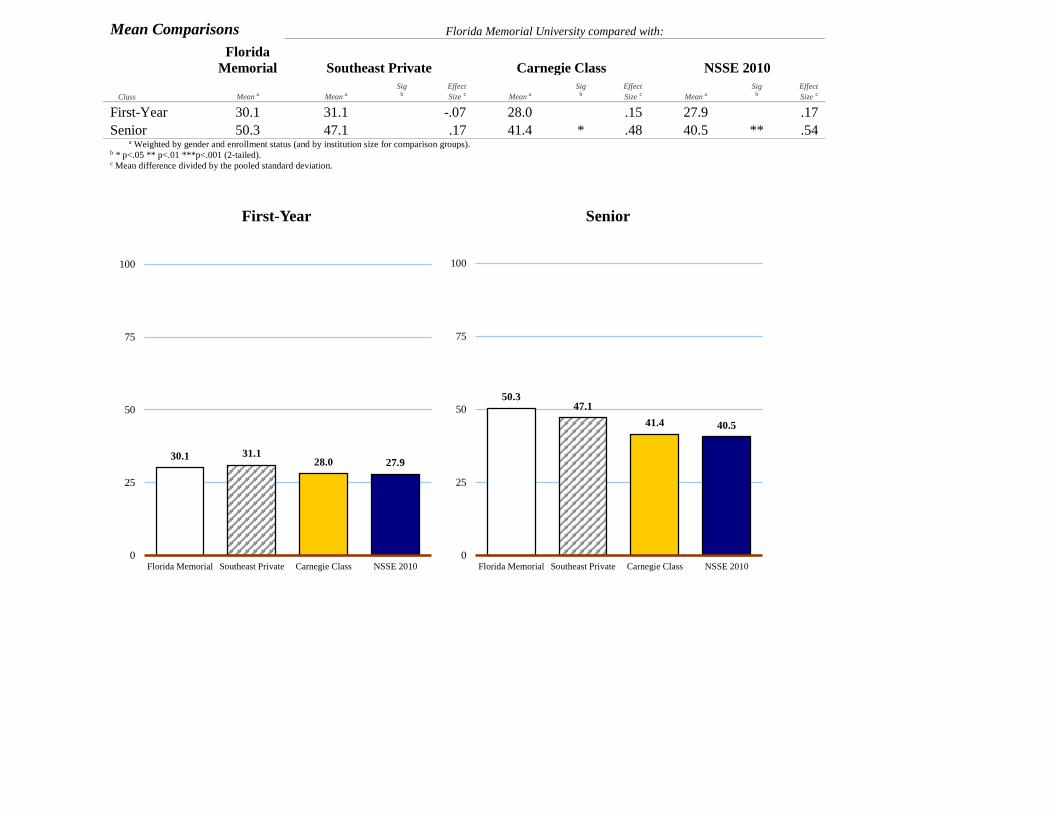
Mean Comparisons Florida Memorial University compared with:
Florida
Memorial Southeast Private Carnegie Class NSSE 2010
Class Mean a Mean a
Sig b
Effect
Size c Mean a
Sig b
Effect
Size c Mean a
Sig b
Effect
Size c
First-Year 30.1 31.1 -.07 28.0 .15 27.9 .17
Senior 50.3 47.1 .17 41.4 * .48 40.5 ** .54 a Weighted by gender and enrollment status (and by institution size for comparison groups).
b * p<.05 ** p<.01 ***p<.001 (2-tailed). c Mean difference divided by the pooled standard deviation.
30.1 31.128.0 27.9
0
25
50
75
100
Florida Memorial Southeast Private Carnegie Class NSSE 2010
First-Year
50.347.1
41.4 40.5
0
25
50
75
100
Florida Memorial Southeast Private Carnegie Class NSSE 2010
Senior
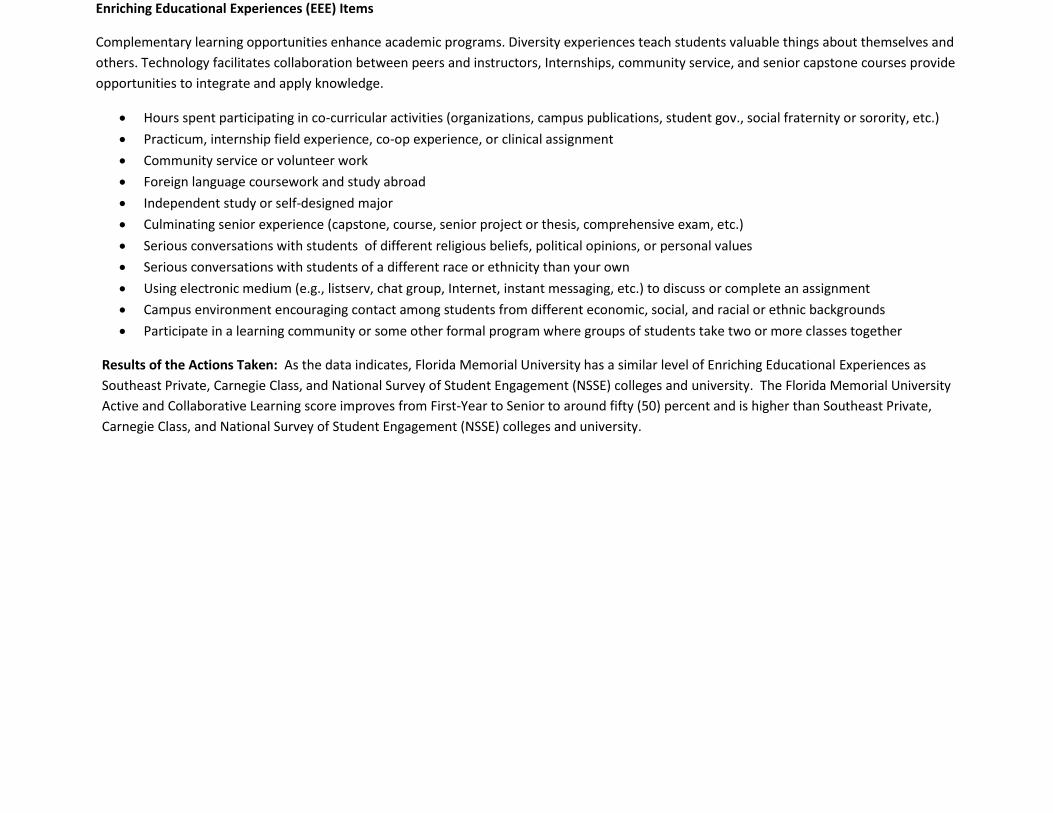
Enriching Educational Experiences (EEE) Items
Complementary learning opportunities enhance academic programs. Diversity experiences teach students valuable things about themselves and
others. Technology facilitates collaboration between peers and instructors, Internships, community service, and senior capstone courses provide
opportunities to integrate and apply knowledge.
Hours spent participating in co-curricular activities (organizations, campus publications, student gov., social fraternity or sorority, etc.)
Practicum, internship field experience, co-op experience, or clinical assignment
Community service or volunteer work
Foreign language coursework and study abroad
Independent study or self-designed major
Culminating senior experience (capstone, course, senior project or thesis, comprehensive exam, etc.)
Serious conversations with students of different religious beliefs, political opinions, or personal values
Serious conversations with students of a different race or ethnicity than your own
Using electronic medium (e.g., listserv, chat group, Internet, instant messaging, etc.) to discuss or complete an assignment
Campus environment encouraging contact among students from different economic, social, and racial or ethnic backgrounds
Participate in a learning community or some other formal program where groups of students take two or more classes together
Results of the Actions Taken: As the data indicates, Florida Memorial University has a similar level of Enriching Educational Experiences as
Southeast Private, Carnegie Class, and National Survey of Student Engagement (NSSE) colleges and university. The Florida Memorial University
Active and Collaborative Learning score improves from First-Year to Senior to around fifty (50) percent and is higher than Southeast Private,
Carnegie Class, and National Survey of Student Engagement (NSSE) colleges and university.
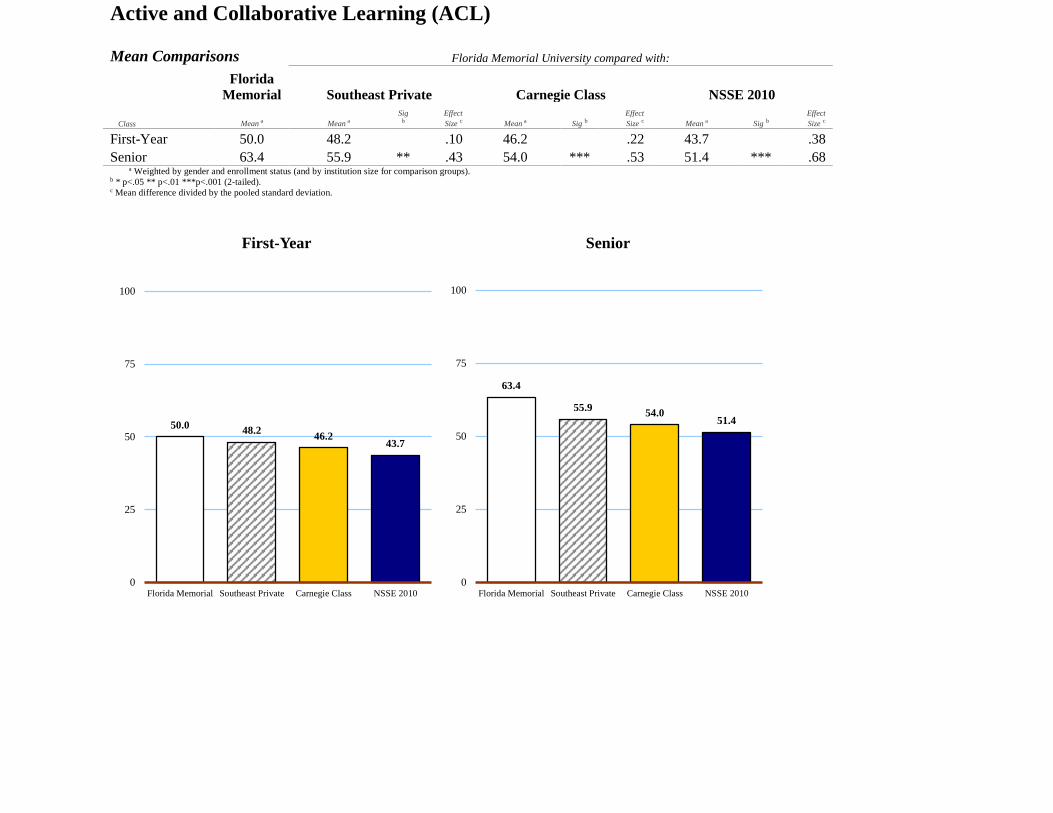
Active and Collaborative Learning (ACL)
Mean Comparisons Florida Memorial University compared with:
Florida
Memorial Southeast Private Carnegie Class NSSE 2010
Class Mean a Mean a
Sig b
Effect
Size c Mean a Sig b
Effect
Size c Mean a Sig b
Effect
Size c
First-Year 50.0 48.2 .10 46.2 .22 43.7 .38
Senior 63.4 55.9 ** .43 54.0 *** .53 51.4 *** .68 a Weighted by gender and enrollment status (and by institution size for comparison groups).
b * p<.05 ** p<.01 ***p<.001 (2-tailed). c Mean difference divided by the pooled standard deviation.
50.048.2
46.243.7
0
25
50
75
100
Florida Memorial Southeast Private Carnegie Class NSSE 2010
First-Year
63.4
55.954.0
51.4
0
25
50
75
100
Florida Memorial Southeast Private Carnegie Class NSSE 2010
Senior
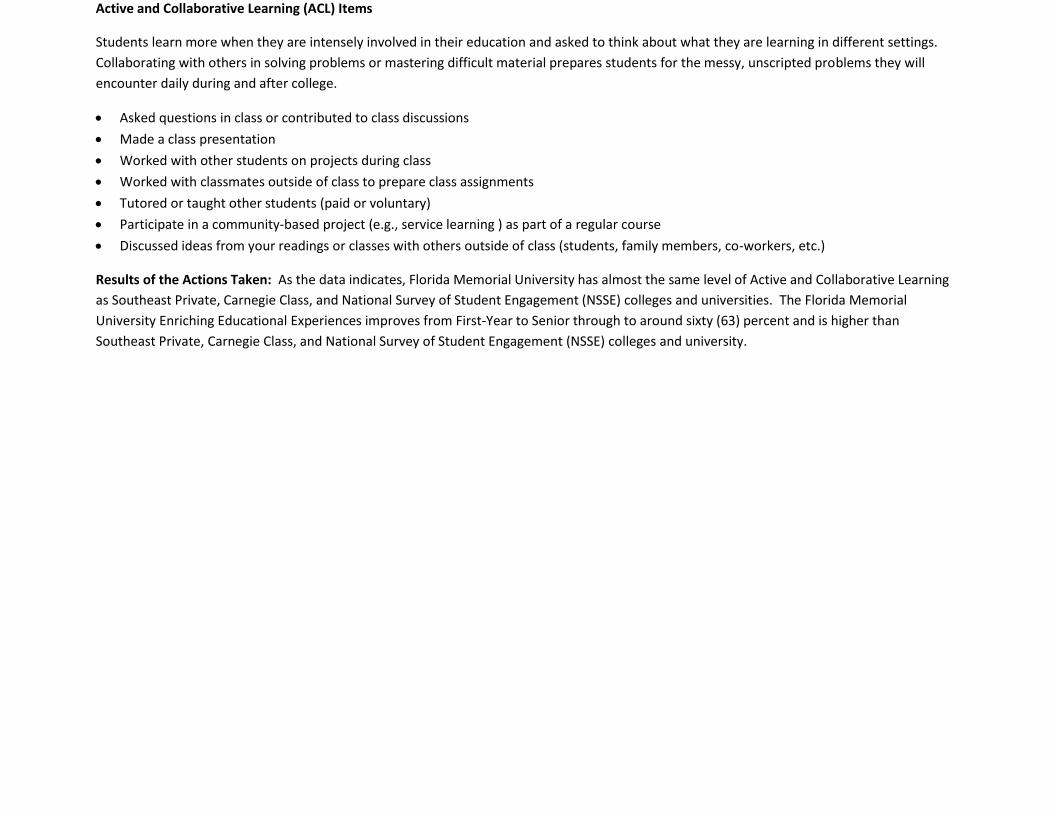
Active and Collaborative Learning (ACL) Items
Students learn more when they are intensely involved in their education and asked to think about what they are learning in different settings.
Collaborating with others in solving problems or mastering difficult material prepares students for the messy, unscripted problems they will
encounter daily during and after college.
Asked questions in class or contributed to class discussions
Made a class presentation
Worked with other students on projects during class
Worked with classmates outside of class to prepare class assignments
Tutored or taught other students (paid or voluntary)
Participate in a community-based project (e.g., service learning ) as part of a regular course
Discussed ideas from your readings or classes with others outside of class (students, family members, co-workers, etc.)
Results of the Actions Taken: As the data indicates, Florida Memorial University has almost the same level of Active and Collaborative Learning
as Southeast Private, Carnegie Class, and National Survey of Student Engagement (NSSE) colleges and universities. The Florida Memorial
University Enriching Educational Experiences improves from First-Year to Senior through to around sixty (63) percent and is higher than
Southeast Private, Carnegie Class, and National Survey of Student Engagement (NSSE) colleges and university.
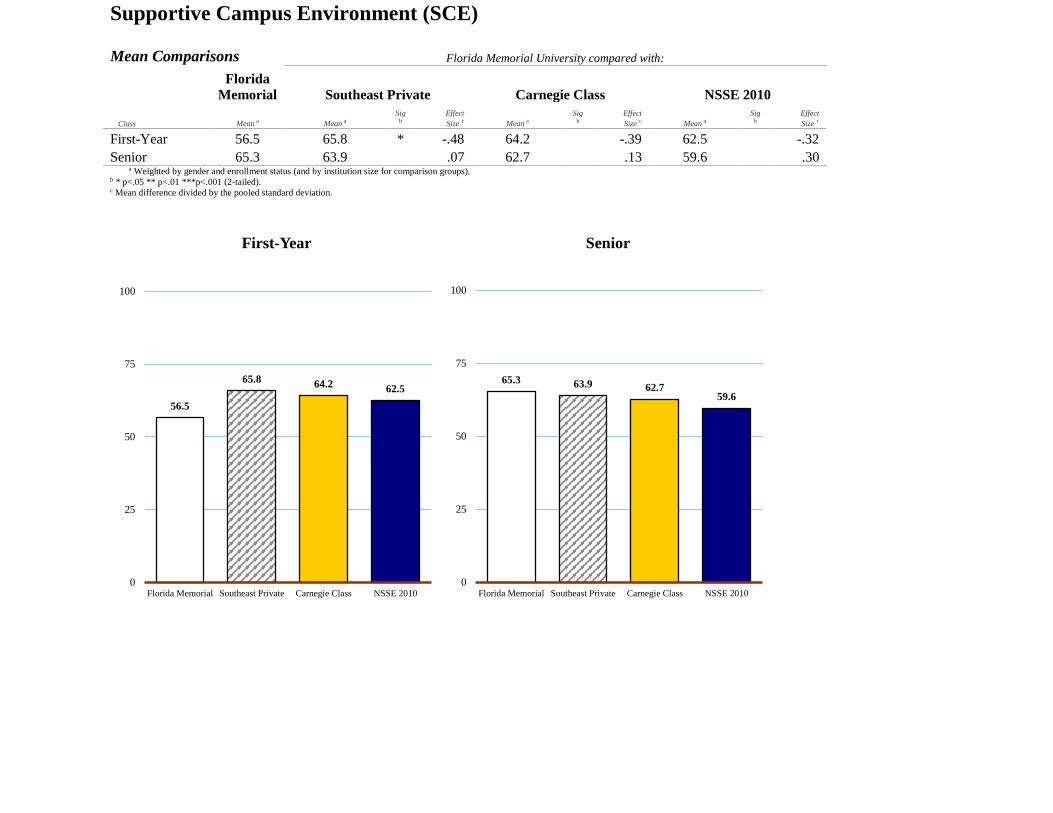
Supportive Campus Environment (SCE)
Mean Comparisons Florida Memorial University compared with:
Florida
Memorial Southeast Private Carnegie Class NSSE 2010
Class Mean a Mean a
Sig b
Effect
Size c Mean a
Sig b
Effect
Size c Mean a
Sig b
Effect
Size c
First-Year 56.5 65.8 * -.48 64.2 -.39 62.5 -.32
Senior 65.3 63.9 .07 62.7 .13 59.6 .30 a Weighted by gender and enrollment status (and by institution size for comparison groups).
b * p<.05 ** p<.01 ***p<.001 (2-tailed). c Mean difference divided by the pooled standard deviation.
56.5
65.864.2
62.5
0
25
50
75
100
Florida Memorial Southeast Private Carnegie Class NSSE 2010
First-Year
65.3 63.9 62.759.6
0
25
50
75
100
Florida Memorial Southeast Private Carnegie Class NSSE 2010
Senior
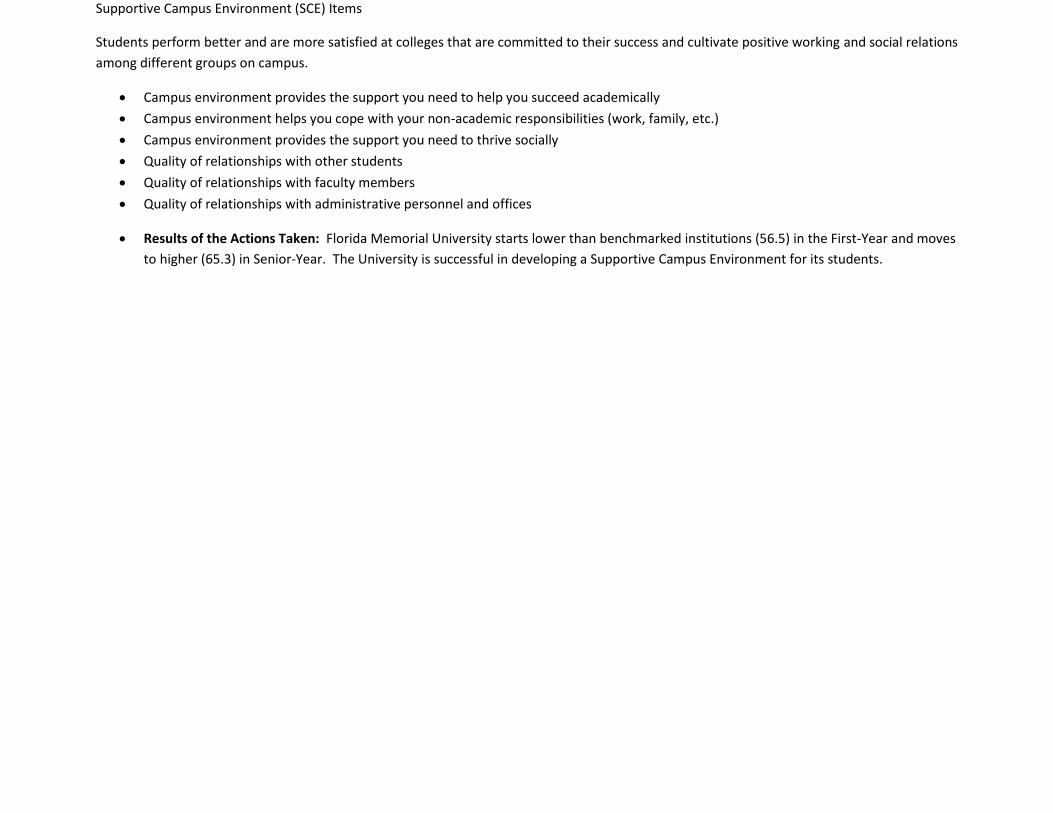
Supportive Campus Environment (SCE) Items
Students perform better and are more satisfied at colleges that are committed to their success and cultivate positive working and social relations
among different groups on campus.
Campus environment provides the support you need to help you succeed academically
Campus environment helps you cope with your non-academic responsibilities (work, family, etc.)
Campus environment provides the support you need to thrive socially
Quality of relationships with other students
Quality of relationships with faculty members
Quality of relationships with administrative personnel and offices
Results of the Actions Taken: Florida Memorial University starts lower than benchmarked institutions (56.5) in the First-Year and moves
to higher (65.3) in Senior-Year. The University is successful in developing a Supportive Campus Environment for its students.
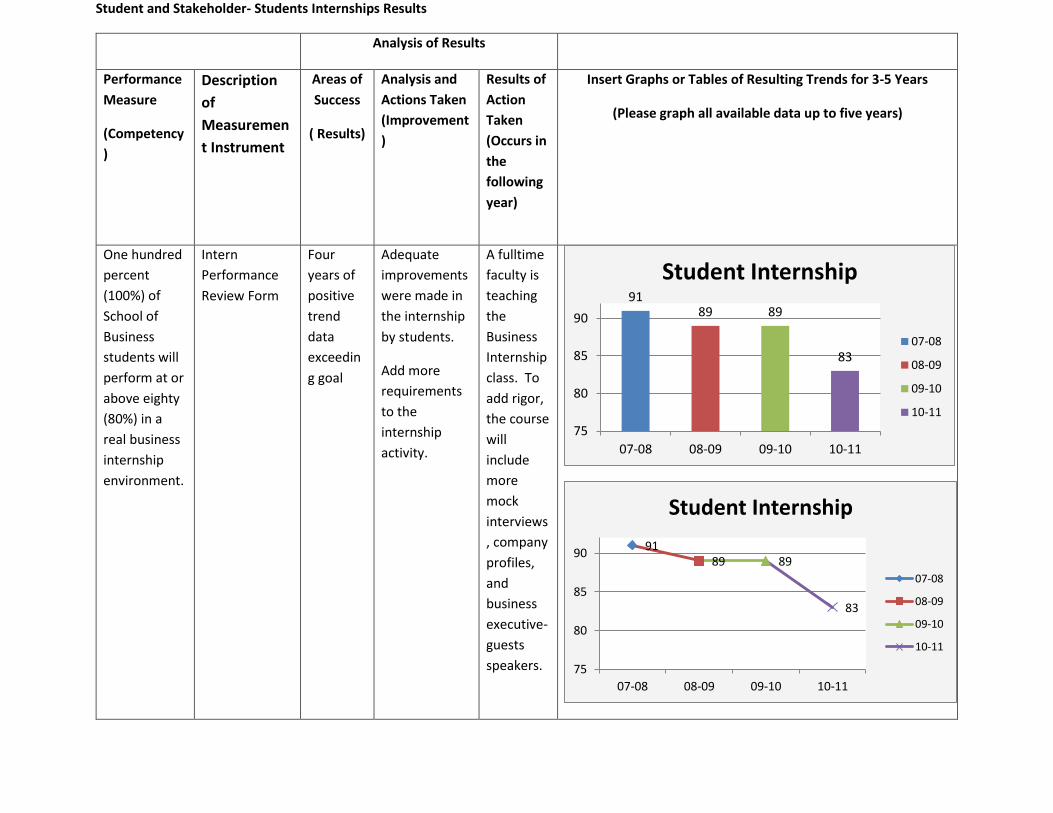
Student and Stakeholder- Students Internships Results
Analysis of Results
Performance
Measure
(Competency
)
Description
of
Measuremen
t Instrument
Areas of
Success
( Results)
Analysis and
Actions Taken
(Improvement
)
Results of
Action
Taken
(Occurs in
the
following
year)
Insert Graphs or Tables of Resulting Trends for 3-5 Years
(Please graph all available data up to five years)
One hundred
percent
(100%) of
School of
Business
students will
perform at or
above eighty
(80%) in a
real business
internship
environment.
Intern
Performance
Review Form
Four
years of
positive
trend
data
exceedin
g goal
Adequate
improvements
were made in
the internship
by students.
Add more
requirements
to the
internship
activity.
A fulltime
faculty is
teaching
the
Business
Internship
class. To
add rigor,
the course
will
include
more
mock
interviews
, company
profiles,
and
business
executive-
guests
speakers.
9189 89
83
75
80
85
90
07-08 08-09 09-10 10-11
Student Internship
07-08
08-09
09-10
10-11
9189 89
83
75
80
85
90
07-08 08-09 09-10 10-11
Student Internship
07-08
08-09
09-10
10-11

Student and Stakeholder- Students potential for employment success (Employability)
Analysis of Results
Performance
Measure
(Competency)
Description of
Measurement
Instrument
Areas of
Success
( Results)
Analysis and
Actions Taken
(Improvement)
Results of
Action Taken
(Occurs in
the following
year)
Insert Graphs or Tables of Resulting Trends for 3-5 Years
(Please graph all available data up to five years)
One hundred
percent (100%)
of School of
Business
students will
demonstrate at
or above eighty
(80%) potential
for employment
success
(employability).
Intern
Performance
Review Form
Four
years of
positive
trend
data
exceeding
goal of
minimum
80% goal
Adequate
improvements
were made in
making
students
involved in
practices that
improve
students’
employability.
Add more
requirements
and substance
to the
internship class
and activity.
A fulltime
faculty is
teaching the
Business
Internship
class. The
course will
include more
mock
interviews,
company
profiles, and
business
executive-
guests
speakers.
Students will
be required
to participate
in the School
of Business
job fairs and
other
external
employment
related
activities
93
8685
84
75
80
85
90
07-08 08-09 09-10 10-11
Students Employability
07-08
08-09
09-10
10-11
93
8685
84
75
80
85
90
07-08 08-09 09-10 10-11
Students Employability
07-08
08-09
09-10
10-11
Student and Stakeholder- Alumni Survey
Analysis of Results
Performance
Measure
(Competency)
Descriptio
n of
Measurem
ent
Instrument
Areas of
Success
( Results)
Analysis and
Actions Taken
(Improvement)
Results of
Action Taken
(Occurs in the
following
year)
Insert Graphs or Tables of Resulting Trends for 3-5 Years
(Please graph all available data up to five years)
The mean
score of the
School of
Business
Alumni
satisfaction
Survey will be
greater than
4.5 on a 5
point Likert
scale
School of
Business
annual
Alumni
Survey
One year
of positive
data
exceeding
goal
School of
Business alumni
were most
satisfied with
the knowledge
of faculty. The
relevancy and
demanding
curriculum,
faculty
customer
service, and
faculty
advisement,
have room for
improvement
The School of
Business will
continue to
conduct
alumni survey
annually to
monitor the
trend in its
alumni
satisfaction.
The faculty
will explore
how to
improve
customer
services,
advisement,
and rigor of
the curriculum
through
further
communicatio
ns with the
alumni
4.7
4.5
4.6
4.9
4.6
4.24.34.44.54.64.74.84.9
5
Alumni Satisfaction Survey
Curriculumrelevancy
Demandingcurriculum
Faculty advisement
Knowlagable faculty
Faculty customerservice
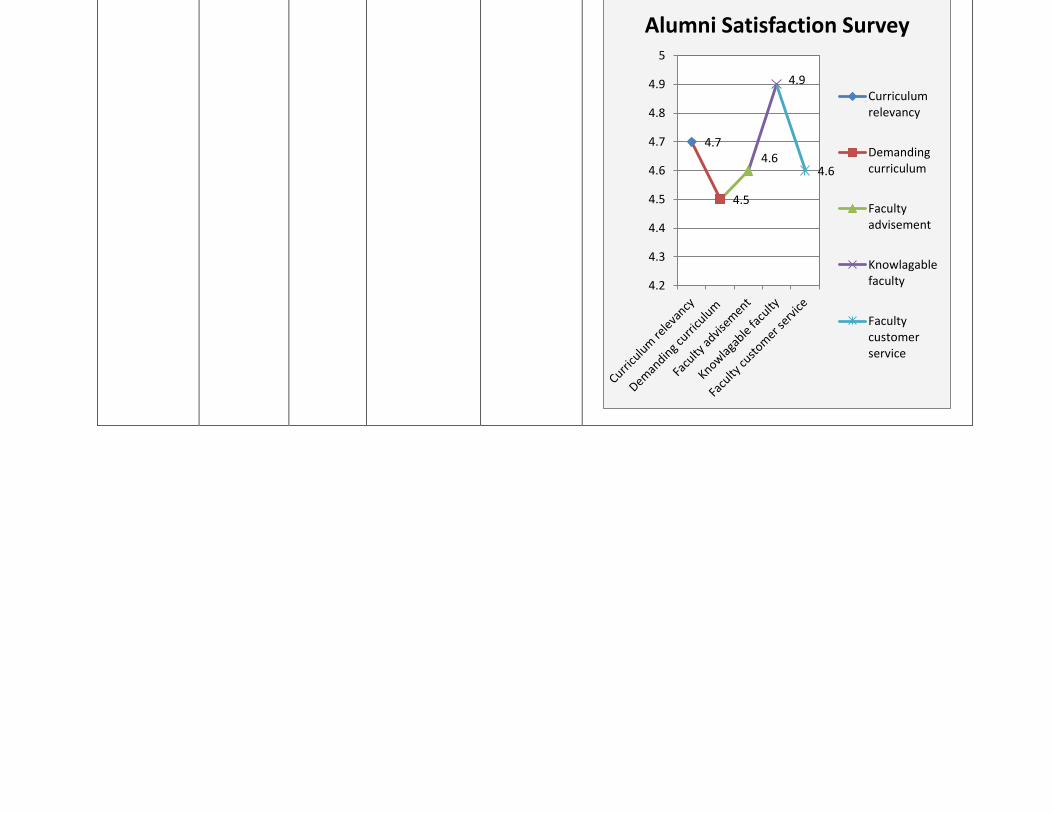
4.7
4.5
4.6
4.9
4.6
4.2
4.3
4.4
4.5
4.6
4.7
4.8
4.9
5
Alumni Satisfaction Survey
Curriculumrelevancy
Demandingcurriculum
Facultyadvisement
Knowlagablefaculty
Facultycustomerservice
Student and Stakeholder- Graduating Senior Survey
Analysis of Results
Performance
Measure
(Competency
)
Description
of
Measuremen
t Instrument
Areas of
Success
( Results)
Analysis and
Actions Taken
(Improvement
)
Results of
Action
Taken
(Occurs in
the
following
year)
Insert Graphs or Tables of Resulting Trends for 3-5 Years
(Please graph all available data up to five years)
The mean
score of the
School of
Business
graduating
senior
satisfaction
(excellent +
good) with
the graduate
school’s
preparation
will be
greater than
75%
University
Senior Exit
Survey
Five
semester
s exceed
ing goals
School of
Business
graduating
seniors were
most satisfied
with their
preparation
for their future
graduate
school
attendance.
The
preparation,
however, has
room for
further
improvement
The School
of Business
will
continue to
conduct
Senior Exit
survey
every
semester
to monitor
the trend in
its
graduates’
satisfaction
. The
faculty will
explore
how to
improve
the results
by
advisement
, and rigor
of the
curriculum
05
101520253035404550556065707580859095
100
Fall 09 Spring2010
Fall2010
Spring2011
Fall2011
Spring2011
How do you feel the University has prepared you
for your career
Excellent
Good
Average
Below Average
poor

05
101520253035404550556065707580859095
100
Fall09
Spring2010
Fall2010
Spring2011
Fall2011
Spring2011
How do you feel the University has prepared you
for your career
Excellent
Good
Average
Below Average
poor
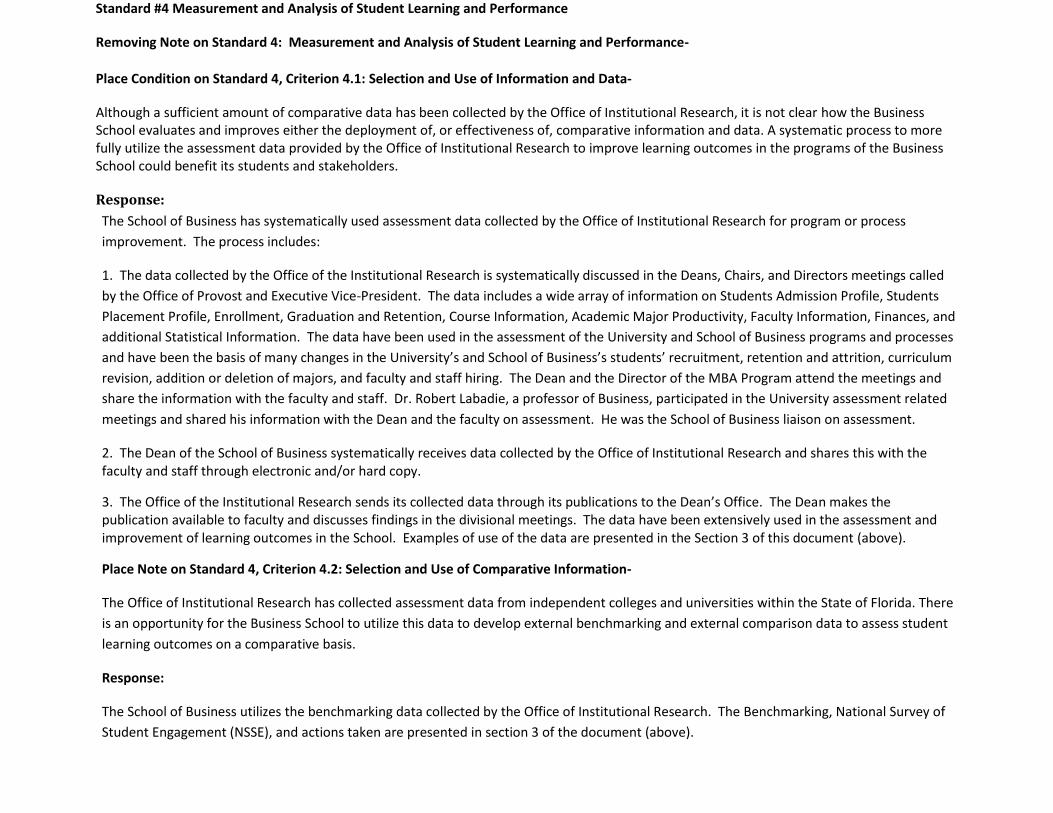
Standard #4 Measurement and Analysis of Student Learning and Performance
Removing Note on Standard 4: Measurement and Analysis of Student Learning and Performance-
Place Condition on Standard 4, Criterion 4.1: Selection and Use of Information and Data-
Although a sufficient amount of comparative data has been collected by the Office of Institutional Research, it is not clear how the Business School evaluates and improves either the deployment of, or effectiveness of, comparative information and data. A systematic process to more fully utilize the assessment data provided by the Office of Institutional Research to improve learning outcomes in the programs of the Business School could benefit its students and stakeholders.
Response:
The School of Business has systematically used assessment data collected by the Office of Institutional Research for program or process
improvement. The process includes:
1. The data collected by the Office of the Institutional Research is systematically discussed in the Deans, Chairs, and Directors meetings called
by the Office of Provost and Executive Vice-President. The data includes a wide array of information on Students Admission Profile, Students
Placement Profile, Enrollment, Graduation and Retention, Course Information, Academic Major Productivity, Faculty Information, Finances, and
additional Statistical Information. The data have been used in the assessment of the University and School of Business programs and processes
and have been the basis of many changes in the University’s and School of Business’s students’ recruitment, retention and attrition, curriculum
revision, addition or deletion of majors, and faculty and staff hiring. The Dean and the Director of the MBA Program attend the meetings and
share the information with the faculty and staff. Dr. Robert Labadie, a professor of Business, participated in the University assessment related
meetings and shared his information with the Dean and the faculty on assessment. He was the School of Business liaison on assessment.
2. The Dean of the School of Business systematically receives data collected by the Office of Institutional Research and shares this with the faculty and staff through electronic and/or hard copy.
3. The Office of the Institutional Research sends its collected data through its publications to the Dean’s Office. The Dean makes the publication available to faculty and discusses findings in the divisional meetings. The data have been extensively used in the assessment and improvement of learning outcomes in the School. Examples of use of the data are presented in the Section 3 of this document (above).
Place Note on Standard 4, Criterion 4.2: Selection and Use of Comparative Information-
The Office of Institutional Research has collected assessment data from independent colleges and universities within the State of Florida. There
is an opportunity for the Business School to utilize this data to develop external benchmarking and external comparison data to assess student
learning outcomes on a comparative basis.
Response:
The School of Business utilizes the benchmarking data collected by the Office of Institutional Research. The Benchmarking, National Survey of
Student Engagement (NSSE), and actions taken are presented in section 3 of the document (above).
Place OFI on Standard 4, Criterion 4.2: (Comparative Information)-
There is an opportunity for the Business School to enhance learning outcomes by extending the external benchmarking beyond Florida schools.
Response:
The School of Business has extended its benchmarking of the collected data to colleges and university outside the Florida. For instance, the
National Survey of Student Engagement (NSSE) compares the Southeast Private Colleges, Carnegie Class, and National Survey of Student
Engagement (NSSE). The Faculty Satisfaction benchmarking also includes comparison of four (4) year Catholic Colleges (comparison group 1),
and Nonsectarian, Catholic, Other Religions four year colleges (comparison group 2).
Place Condition on Standard 4, Criterion 4.4: Continuous Process Improvement: Student Learning Performance-
Although the Business School has collected internal outcome assessment data and implemented the results, there is little evidence of
subsequent improvement reported.
Response:
The School of Business, after completion of assessment reports of each cycle of its programs, calls for meetings of the faculty to discuss actions
required to improve the results. The meetings are titled Closing the Loop. Examples of subsequent improvement are presented below:
* Benchmarking, National Survey of Student Engagement (NSSE)
The Office of Institutional Effectiveness conducted a National Survey of Student Engagement (NSSE) for the University in 2010 (the results of
the survey are presented in Section 3 of this document (please see above)). The categories of survey include: Level of Academic Challenge
(LAC), Level of Academic Challenge (LAC), Student-Faculty Interaction (SFI), and Enriching Educational Experiences (EEE). The results show
definitive improvement in all categories for Florida Memorial University compared to other benchmarked colleges and universities.
* Professional Development Activities Attendance
The School of Business has established Professional Development week for the students (the results of the student attendance is presented in
Section 3 of this document (please see above)). The Professional Development Week has been well received by faculty and students and
participation in the activities of the program has steadily increased. The attendance by the students in the Professional Day activities has shown
a definitive improvement.
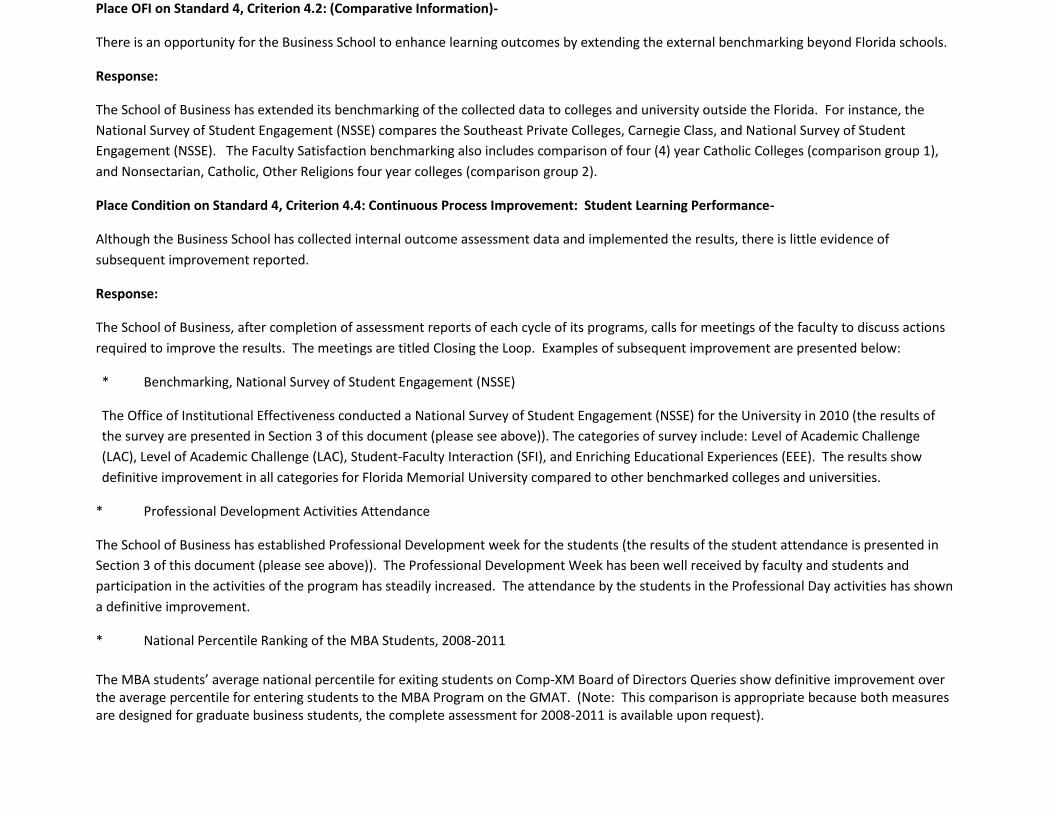
* National Percentile Ranking of the MBA Students, 2008-2011
The MBA students’ average national percentile for exiting students on Comp-XM Board of Directors Queries show definitive improvement over the average percentile for entering students to the MBA Program on the GMAT. (Note: This comparison is appropriate because both measures are designed for graduate business students, the complete assessment for 2008-2011 is available upon request).
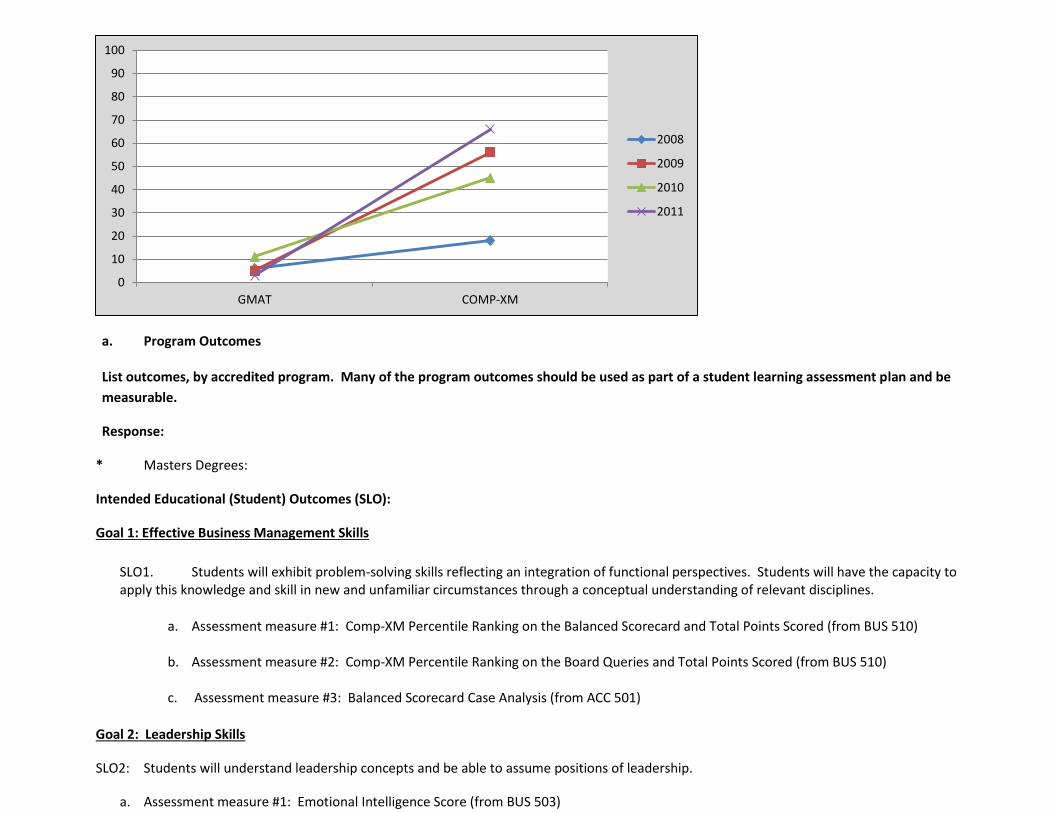
a. Program Outcomes List outcomes, by accredited program. Many of the program outcomes should be used as part of a student learning assessment plan and be
measurable.
Response:
* Masters Degrees:
Intended Educational (Student) Outcomes (SLO):
Goal 1: Effective Business Management Skills
SLO1. Students will exhibit problem-solving skills reflecting an integration of functional perspectives. Students will have the capacity to apply this knowledge and skill in new and unfamiliar circumstances through a conceptual understanding of relevant disciplines.
a. Assessment measure #1: Comp-XM Percentile Ranking on the Balanced Scorecard and Total Points Scored (from BUS 510)
b. Assessment measure #2: Comp-XM Percentile Ranking on the Board Queries and Total Points Scored (from BUS 510)
c. Assessment measure #3: Balanced Scorecard Case Analysis (from ACC 501)
Goal 2: Leadership Skills
SLO2: Students will understand leadership concepts and be able to assume positions of leadership.
a. Assessment measure #1: Emotional Intelligence Score (from BUS 503)
0
10
20
30
40
50
60
70
80
90
100
GMAT COMP-XM
2008
2009
2010
2011

b. Assessment measure #2: Peer evaluation of leadership skill on the Capstone Project (from BUS 510)
c. Assessment measure #3: Student performance on the ethical and leadership reflection papers.
SLO3: Students will be able to analyze complex business issues and situations that require coping with unforeseen events and managing in unpredictable environments.
a. Assessment measure #1: Debrief Exercise - Capstone Project (BUS 510)
b. Assessment measure #2: Learning and Growth Score on the Comp-XM Exam (BUS 510).
SLO4: Students will be able to understand and utilize ethical reasoning.
a. Assessment measure #1: Ethical Reasoning Simulation (from BUS 503)
b. Assessment measure #2: Ethical capsule in the Capstone simulation (available Spring 2012)
Goal 3: Interpersonal and Collaborative Skills
SLO5. Students will understand and value individual differences, facilitating an understanding of group dynamics and effective teamwork.
a. Assessment measure #1: Self Assessment Paper- both quantitative and qualitative assessment- (from BUS 501)
b. Assessment measure #2: Team Formation and View of Teams Exercise (from BUS 510)
c. Assessment measure #3: Peer Evaluations on Capstone Comprehensive Team Project
Goal 4: Analytical Management Skills
SLO6: Students will be able to use a strong base of business knowledge and reasoning ability to analyze discipline specific qualitative and
quantitative data to solve problems and make effective management decisions.
a. Assessment measure #1: Financial Analysis Exercise (from FIN 501)
b. Assessment measure #2: Break-even analysis (from ECO 501)
c. Assessment measure #3: Accounting, Finance and Marketing Board Queries on Comp-XM (from BUS 510)
Goal 5: Communication Skills
SLO7: Students will be able to effectively present information orally.
a. Assessment measure #1: Research article presentation (from BUS 503)
SLO8: Students will be able to effectively present information in writing.
a. Assessment measure #2: Marketing Strategy written case analysis (from MAR 501) b. Assessment measure #3: Business Writing Assessment from Ethical Reasoning Simulation (from BUS 503) – available Fall 2011 c. Assessment measure #4: Research report (from BUS 502)
* BS in Accounting
Intended Educational (Student) Outcomes (SLO):
1. Students should understand the basic accounting concepts essential to recording business transactions and preparing & analyzing financial
statements.
2. Students should be able to analyze and interpret data for managerial controlling, planning and decision making; including demonstrating
competency with the procedures and principles of managerial and cost accounting.
3. Students should be familiar with the theory and practice of Accounting for businesses, including business combination, multinational
enterprises, government and not-for-profit.
4. Students should demonstrate knowledge of business law, auditing principles and attestation of standards and procedures
5. Students should demonstrate knowledge of federal income taxation for the preparation of a comprehensive income tax return for individuals
and businesses.
* BS in Business Administration
Intended Educational (Student) Outcomes (SLO):
1. Business Administration Students will demonstrate Business knowledge, knowledge of major functional business areas.
2. Business Administration graduates will demonstrate strong quantitative and qualitative knowledge and analytical skill of major functional
business areas.
3. Business Administration graduates will develop strong interpersonal skills.
4. Business Administration alumni will demonstrate satisfaction with the curriculum, faculty, academic and professional development.
* BS in Finance
Intended Educational (Student) Outcomes (SLO):
1. Students will demonstrate knowledge of the major concepts and practices of financial analysis and management and develop analytical
decision making skills.
2. Students will demonstrate knowledge of investments and derivatives for the practical application of theory.
3. Students will demonstrate overall knowledge of finance and other major functional areas in business for careers in finance and business, and
/or graduate study.
* BS in Marketing
Intended Educational (Student) Outcomes (SLO):
1. Students should understand basic marketing principles and the fundamentals for successful retailing management, product and services marketing, electronic commerce, advertising, channel structure, and personal selling in order to effectively market themselves and the organization they represent.
2. Students should understand the fundamentals of consumer behavior and be able to perform a conceptual analysis of consumer behavior
individually, within a general retailing, or industrial personal selling context.
3. Students should demonstrate an understanding of current issues in marketing, there application in marketing contexts, and fundamental techniques of marketing research. a. Performance Results
Complete the following table. Use a maximum of three or four examples, reporting what you consider to be the most important data. It is not
necessary to provide results for every process.
Student Learning Results (Required for each accredited program, doctorate, masters, and baccalaureate)
Analysis of Results
Performance
Measure
(Competency)
Description of
Measurement
Instrument
Areas of
Success
( Current
Results)
Analysis of
Results and
action taken
(What did you
learn from the
results)
Results of
Action Taken
(Occurs in
the following
year, what is
your next
step)
Insert Graphs or Tables of Resulting Trends for 3-5 Years
(Please graph all available data up to five years)
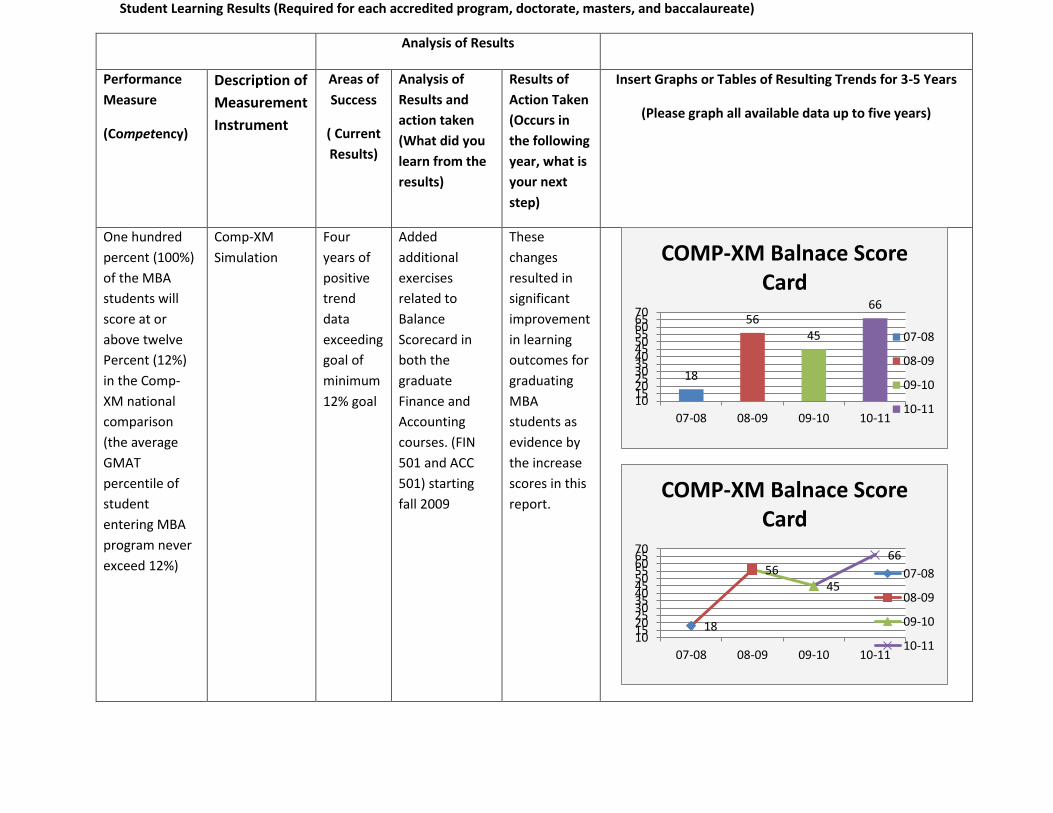
One hundred
percent (100%)
of the MBA
students will
score at or
above twelve
Percent (12%)
in the Comp-
XM national
comparison
(the average
GMAT
percentile of
student
entering MBA
program never
exceed 12%)
Comp-XM
Simulation
Four
years of
positive
trend
data
exceeding
goal of
minimum
12% goal
Added
additional
exercises
related to
Balance
Scorecard in
both the
graduate
Finance and
Accounting
courses. (FIN
501 and ACC
501) starting
fall 2009
These
changes
resulted in
significant
improvement
in learning
outcomes for
graduating
MBA
students as
evidence by
the increase
scores in this
report.
18
5645
66
10152025303540455055606570
07-08 08-09 09-10 10-11
COMP-XM Balnace Score Card
07-08
08-09
09-10
10-11
18
5645
66
10152025303540455055606570
07-08 08-09 09-10 10-11
COMP-XM Balnace Score Card
07-08
08-09
09-10
10-11
Student Learning Results (Required for each accredited program, doctorate, masters, and baccalaureate)
Analysis of Results
Performance
Measure
(Competency)
Description of
Measurement
Instrument
Areas of
Success
( Current
Results)
Analysis of
Results and
action taken
(What did you
learn from the
results)
Results of
Action Taken
(Occurs in
the following
year, what is
your next
step)
Insert Graphs or Tables of Resulting Trends for 3-5 Years
(Please graph all available data up to five years)
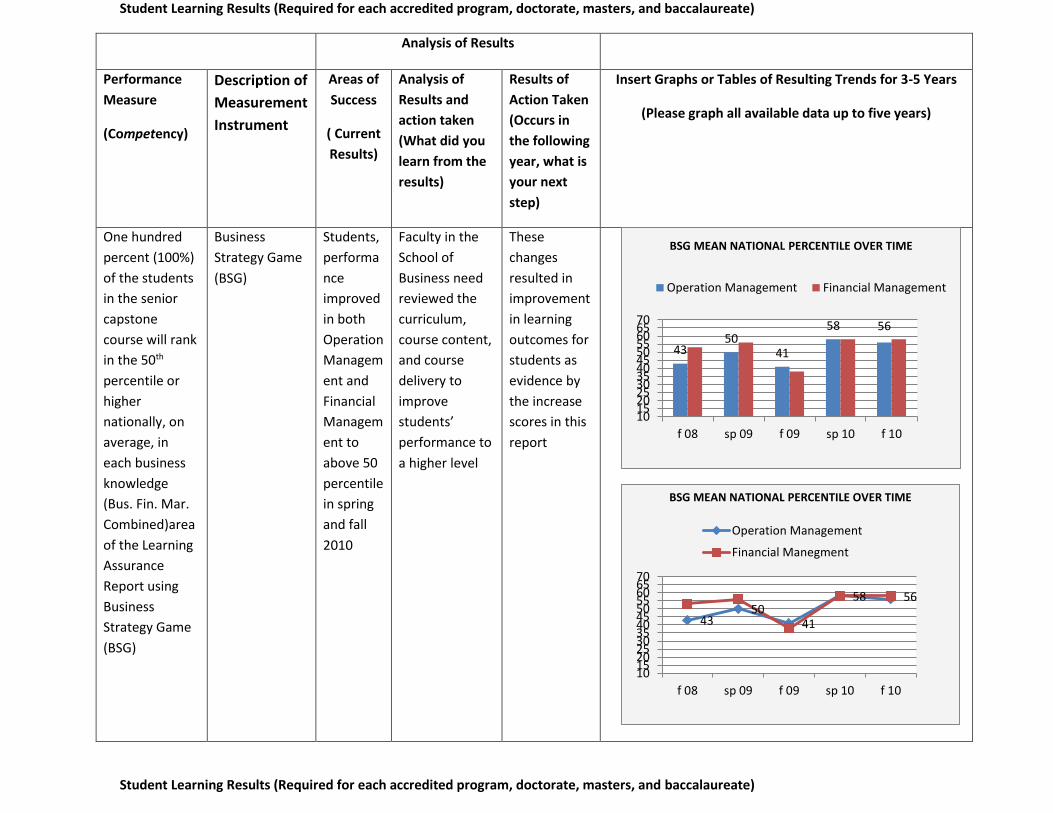
One hundred
percent (100%)
of the students
in the senior
capstone
course will rank
in the 50th
percentile or
higher
nationally, on
average, in
each business
knowledge
(Bus. Fin. Mar.
Combined)area
of the Learning
Assurance
Report using
Business
Strategy Game
(BSG)
Business
Strategy Game
(BSG)
Students,
performa
nce
improved
in both
Operation
Managem
ent and
Financial
Managem
ent to
above 50
percentile
in spring
and fall
2010
Faculty in the
School of
Business need
reviewed the
curriculum,
course content,
and course
delivery to
improve
students’
performance to
a higher level
These
changes
resulted in
improvement
in learning
outcomes for
students as
evidence by
the increase
scores in this
report
Student Learning Results (Required for each accredited program, doctorate, masters, and baccalaureate)
4350
41
58 56
10152025303540455055606570
f 08 sp 09 f 09 sp 10 f 10
BSG MEAN NATIONAL PERCENTILE OVER TIME
Operation Management Financial Management
4350
41
58 56
10152025303540455055606570
f 08 sp 09 f 09 sp 10 f 10
BSG MEAN NATIONAL PERCENTILE OVER TIME
Operation Management
Financial Manegment
Analysis of Results
Performance
Measure
(Competency)
Description of
Measurement
Instrument
Areas of
Success
( Current
Results)
Analysis of
Results and
action taken
(What did you
learn from the
results
Results of
Action Taken
(Occurs in
the following
year, what is
your next
step
Insert Graphs or Tables of Resulting Trends for 3-5 Years
(Please graph all available data up to five years)
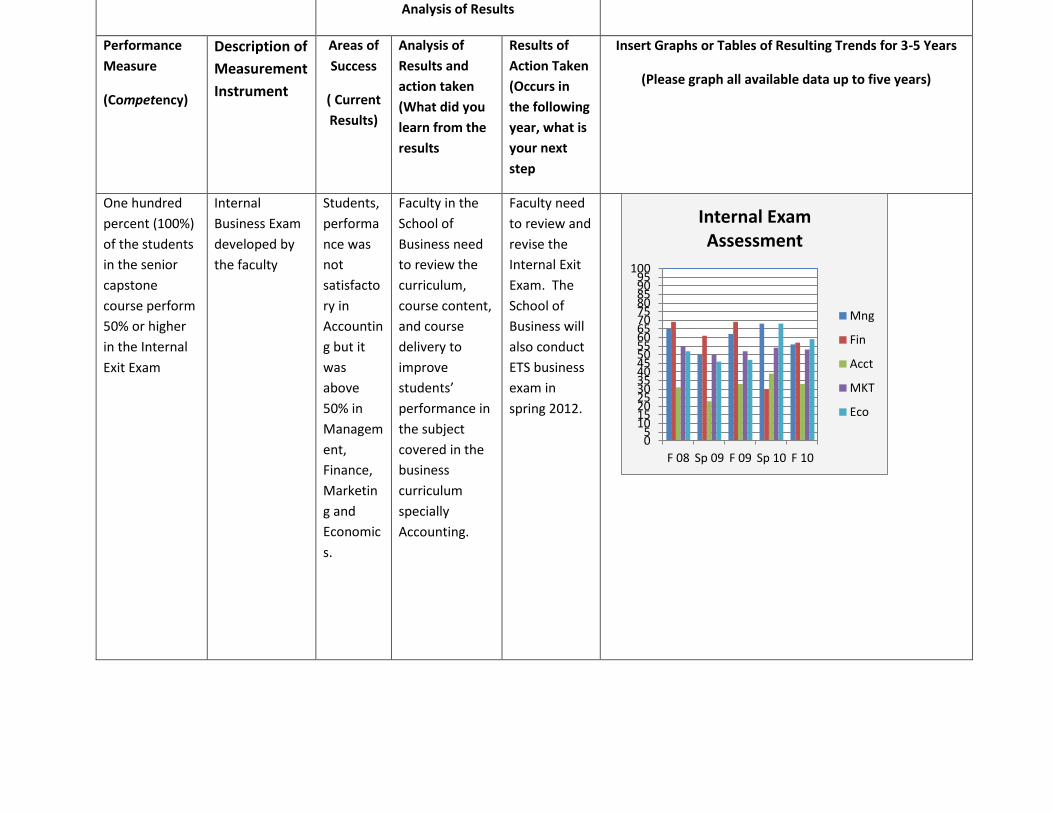
One hundred
percent (100%)
of the students
in the senior
capstone
course perform
50% or higher
in the Internal
Exit Exam
Internal
Business Exam
developed by
the faculty
Students,
performa
nce was
not
satisfacto
ry in
Accountin
g but it
was
above
50% in
Managem
ent,
Finance,
Marketin
g and
Economic
s.
Faculty in the
School of
Business need
to review the
curriculum,
course content,
and course
delivery to
improve
students’
performance in
the subject
covered in the
business
curriculum
specially
Accounting.
Faculty need
to review and
revise the
Internal Exit
Exam. The
School of
Business will
also conduct
ETS business
exam in
spring 2012.
05
101520253035404550556065707580859095
100
F 08 Sp 09 F 09 Sp 10 F 10
Internal Exam Assessment
Mng
Fin
Acct
MKT
Eco
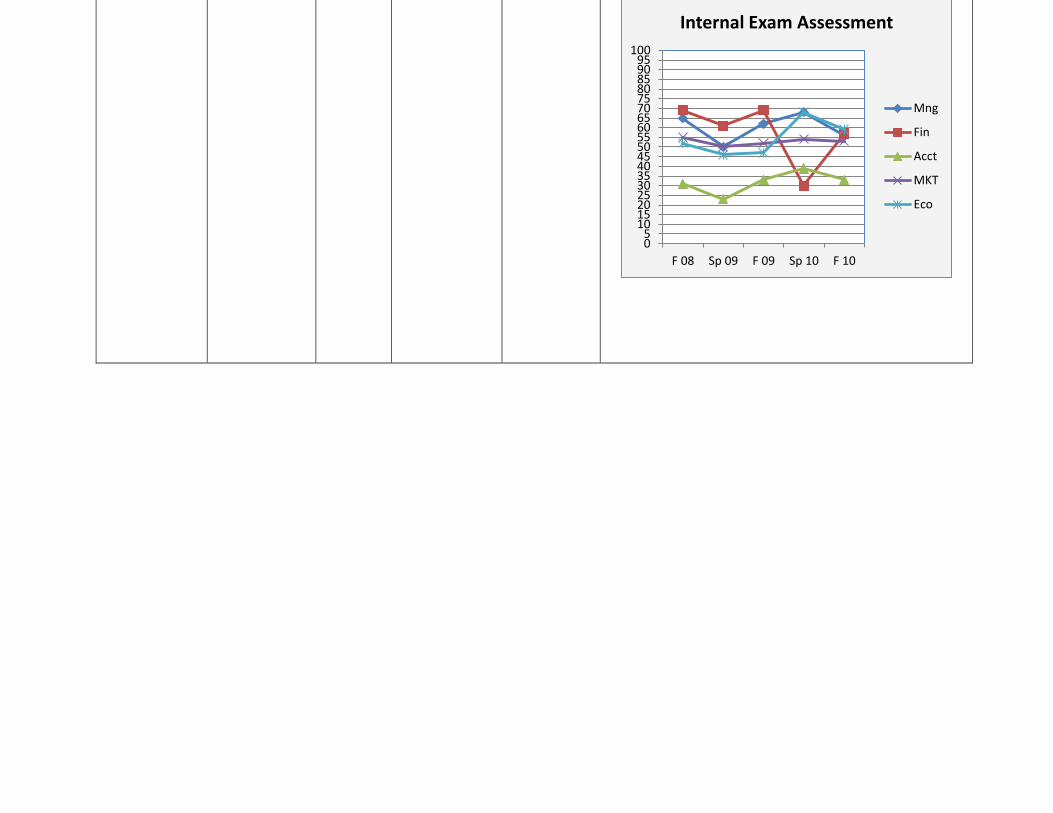
05
101520253035404550556065707580859095
100
F 08 Sp 09 F 09 Sp 10 F 10
Internal Exam Assessment
Mng
Fin
Acct
MKT
Eco
Standard #5 Faculty and Staff Focus
Complete the following table. Use a maximum of three or four examples, reporting what you consider to be the most important data. It is not
necessary to provide results for every process.
Removing Condition on Standard 5: Criterion 5.1: Human Resource Planning-
Although the faculty employment/selection process is described, it is not evident exactly what process is used to develop the Human Resource
Plan in the aggregate, or how the Human Resources Plan is deployed.
Response:
The Office of the Institutional Research annually provides data and information on Enrollment, Major Productivity, Students Headcount Trends,
(at least the last three years), Student Distribution by Classification (Freshman, Sophomore, Junior, Senior), Course Credit Hours for the School
of Business. The data is analyzed by the Dean and the faculty of the School of Business to develop the School of Business Human Resource Plan
and needs. The needs extracted from the Plan will be part of the School of Business short term Strategic Plan reported to the Office of the
Academic Affairs of the University.
Human Resource Deployment Plan, Recruitment and Appointment (From the Faculty Handbook, March 12, 2002)
The President of the University is responsible for the appointment of all persons to the faculty at Florida Memorial University. The Executive
Vice-President and Provost has the responsibility for recommending to the President candidates for appointment to the faculty. The
Chairpersons/Deans and their faculty are responsible for recruiting and recommending to the Vice-President candidates for appointment to the
faculty.
Guidelines for the Selection of Faculty are:
1. Prospective faculty members must provide evidence of competence in the field(s) for which they are to be employed. A master’s degree from a regionally accredited institution and 18 graduate credits in the subject area(s) are the minimum qualifications for a regular appointment to the faculty.
2. The personal and academic qualifications of prospective faculty must be consonant with the mission of Florida Memorial University and with the academic needs of the students served by the institution;
3. Prospective faculty must manifest a commitment to continuous professional development; 4. Nepotism – No individual shall be employed in a division or other unit under the direct supervision of a husband, wife, parent, child,
brother, or sister, who may have direct effect on that individual’s progress or performance. No faculty member, division chairperson/dean, director or other administrative officer shall vote upon, make recommendations, or in any way participate in decisions pertaining to any matter which may directly affect the appointment, promotion, salary, or other status or interest of a relative, as defined above.
Place Note on Standard 5, Criterion 5.4: Faculty Size and Load-
Given the addition of the MBA program and scheduling challenges, it is not evident how the college demonstrates that faculty/staff are of
sufficient numbers to ensure performance of essential faculty responsibilities.
Response:
The School of Business has added a secretary for the MBA Program. Dr. Barbara Edwards, Associate of Management has also joined the faculty
in fall 2011. The School of Business, however, needs additional faculty in Finance and Accounting. The School of Business has informed
Academic Affairs of these deficiencies. It is hoped that as the economy improves, the School of Business will be able to hire additional faculty.
General Notes:
* Faculty Satisfaction Benchmarking
The University, through its Faculty Development Office, conducted the 2010-2011 Higher Education Research Institute (HERI) Faculty Survey.
The survey is done by the Higher Education Research Institute at the University of California at Los Angeles. The comparison includes four (4)
year Catholic Colleges (comparison group 1), and Nonsectarian, Catholic, Other Religions four year colleges (comparison group 2). The Higher
Education Research Institute Faculty Survey answers questions such as: How do faculty perceive institutional priorities? How do faculty spend
their time inside and outside the classroom? What kinds of goals and expectations do faculty have for students? What pedagogical strategies
do faculty employ to engage students and what are the biggest sources of stress and satisfaction among faculty? In addition, the survey will
provide aggregate comparison data from peer institutions. This allows Florida Memorial University to more fully address the competitive
advantage of educational excellence and the movement from good to great (differentiation). The HERI survey not only enhances faculty
development programming, it provides for evidence based approaches to improve the student learning experience. The following tables provide
three examples of the HERI survey (comprehensive survey information is available upon request).
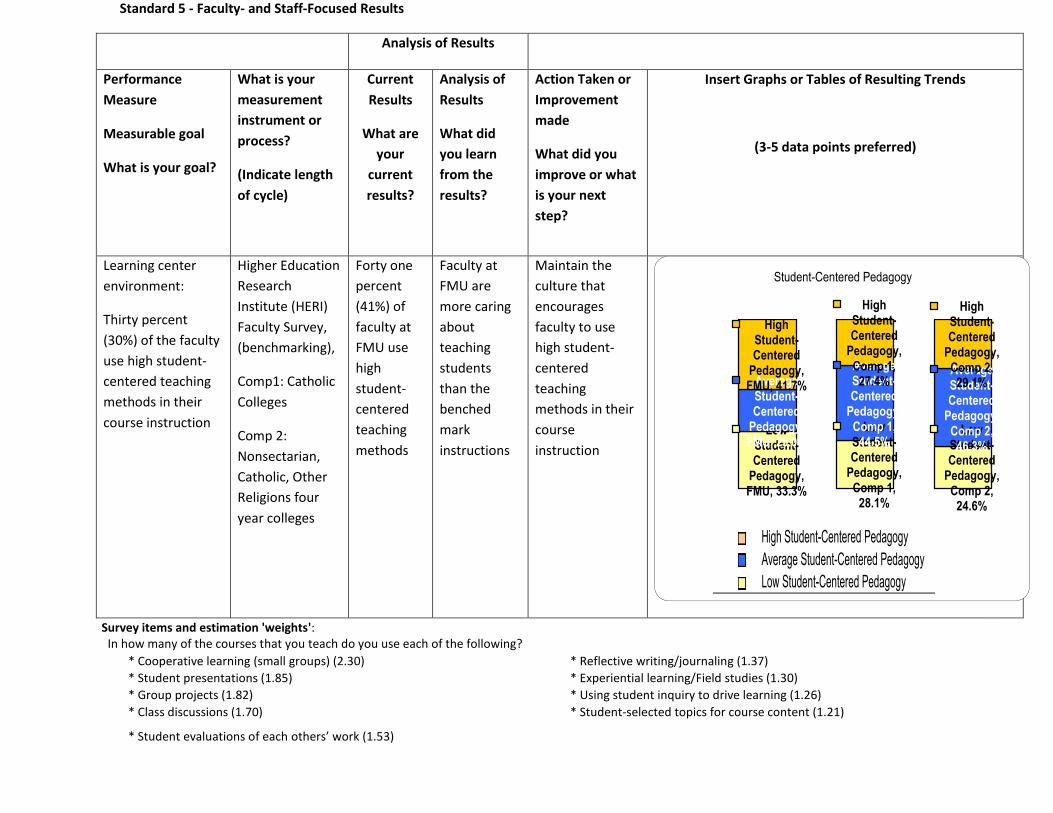
Standard 5 - Faculty- and Staff-Focused Results
Analysis of Results
Performance
Measure
Measurable goal
What is your goal?
What is your
measurement
instrument or
process?
(Indicate length
of cycle)
Current
Results
What are
your
current
results?
Analysis of
Results
What did
you learn
from the
results?
Action Taken or
Improvement
made
What did you
improve or what
is your next
step?
Insert Graphs or Tables of Resulting Trends
(3-5 data points preferred)
Learning center
environment:
Thirty percent
(30%) of the faculty
use high student-
centered teaching
methods in their
course instruction
Higher Education
Research
Institute (HERI)
Faculty Survey,
(benchmarking),
Comp1: Catholic
Colleges
Comp 2:
Nonsectarian,
Catholic, Other
Religions four
year colleges
Forty one
percent
(41%) of
faculty at
FMU use
high
student-
centered
teaching
methods
Faculty at
FMU are
more caring
about
teaching
students
than the
benched
mark
instructions
Maintain the
culture that
encourages
faculty to use
high student-
centered
teaching
methods in their
course
instruction
Survey items and estimation 'weights': In how many of the courses that you teach do you use each of the following?
* Cooperative learning (small groups) (2.30) * Reflective writing/journaling (1.37)
* Student presentations (1.85) * Experiential learning/Field studies (1.30)
* Group projects (1.82) * Using student inquiry to drive learning (1.26)
* Class discussions (1.70) * Student-selected topics for course content (1.21)
* Student evaluations of each others’ work (1.53)
Low Student-Centered
Pedagogy, FMU, 33.3%
Low Student-Centered
Pedagogy, Comp 1,
28.1%
Low Student-Centered
Pedagogy, Comp 2,
24.6%
Average Student-Centered
Pedagogy, FMU, 25.0%
Average Student-Centered
Pedagogy, Comp 1,
44.5%
Average Student-Centered
Pedagogy, Comp 2,
46.3%
High Student-Centered
Pedagogy, FMU, 41.7%
High Student-Centered
Pedagogy, Comp 1,
27.4%
High Student-Centered
Pedagogy, Comp 2,
29.1%
Student-Centered Pedagogy
High Student-Centered Pedagogy
Average Student-Centered Pedagogy
Low Student-Centered Pedagogy
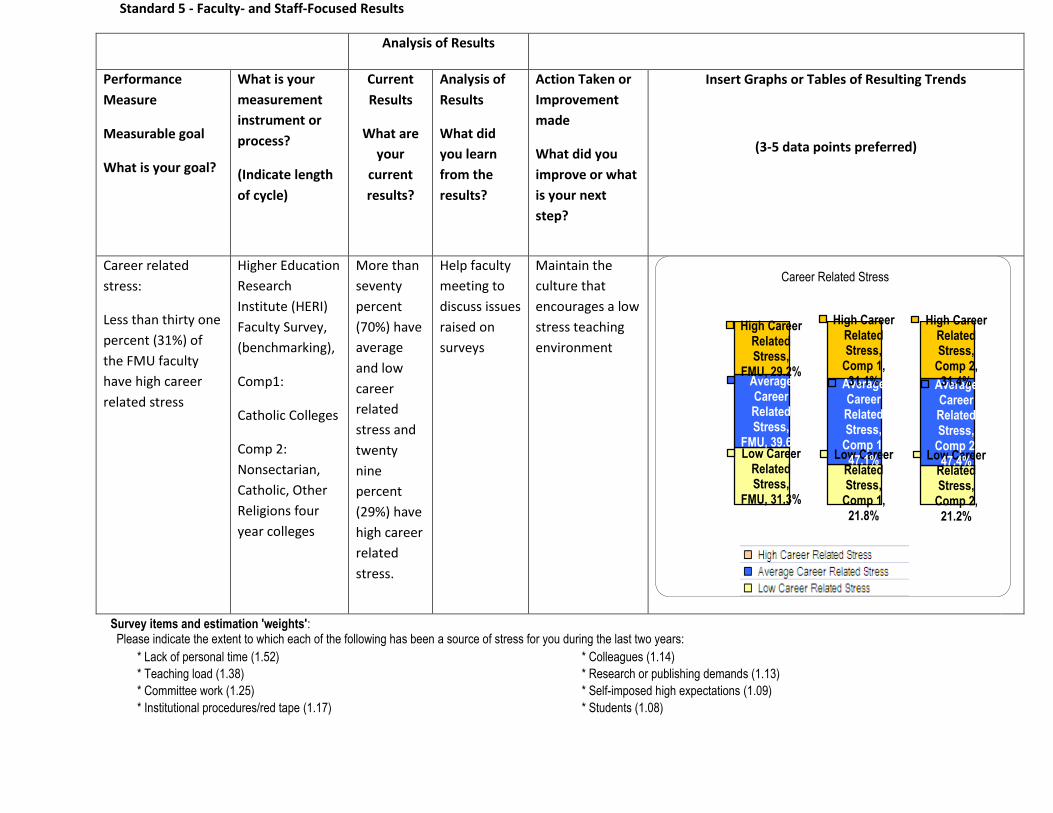
Standard 5 - Faculty- and Staff-Focused Results
Analysis of Results
Performance
Measure
Measurable goal
What is your goal?
What is your
measurement
instrument or
process?
(Indicate length
of cycle)
Current
Results
What are
your
current
results?
Analysis of
Results
What did
you learn
from the
results?
Action Taken or
Improvement
made
What did you
improve or what
is your next
step?
Insert Graphs or Tables of Resulting Trends
(3-5 data points preferred)
Career related
stress:
Less than thirty one
percent (31%) of
the FMU faculty
have high career
related stress
Higher Education
Research
Institute (HERI)
Faculty Survey,
(benchmarking),
Comp1:
Catholic Colleges
Comp 2:
Nonsectarian,
Catholic, Other
Religions four
year colleges
More than
seventy
percent
(70%) have
average
and low
career
related
stress and
twenty
nine
percent
(29%) have
high career
related
stress.
Help faculty
meeting to
discuss issues
raised on
surveys
Maintain the
culture that
encourages a low
stress teaching
environment
Survey items and estimation 'weights': Please indicate the extent to which each of the following has been a source of stress for you during the last two years:
* Lack of personal time (1.52) * Colleagues (1.14)
* Teaching load (1.38) * Research or publishing demands (1.13)
* Committee work (1.25) * Self-imposed high expectations (1.09)
* Institutional procedures/red tape (1.17) * Students (1.08)
Low Career Related Stress,
FMU, 31.3%
Low Career Related Stress,
Comp 1, 21.8%
Low Career Related Stress,
Comp 2, 21.2%
Average Career Related Stress,
FMU, 39.6%
Average Career Related Stress,
Comp 1, 47.1%
Average Career Related Stress,
Comp 2, 47.4%
High Career Related Stress,
FMU, 29.2%
High Career Related Stress,
Comp 1, 31.1%
High Career Related Stress,
Comp 2, 31.4%
Career Related Stress
Standard 5 - Faculty- and Staff-Focused Results
Analysis of Results
Performance
Measure
Measurable goal
What is your goal?
What is your
measurement
instrument or
process?
(Indicate
length of
cycle)
Current Results
What are your
current results?
Analysis
of Results
What did
you learn
from the
results?
Action Taken or
Improvement
made
What did you
improve or what
is your next
step?
Insert Graphs or Tables of Resulting Trends
(3-5 data points preferred)
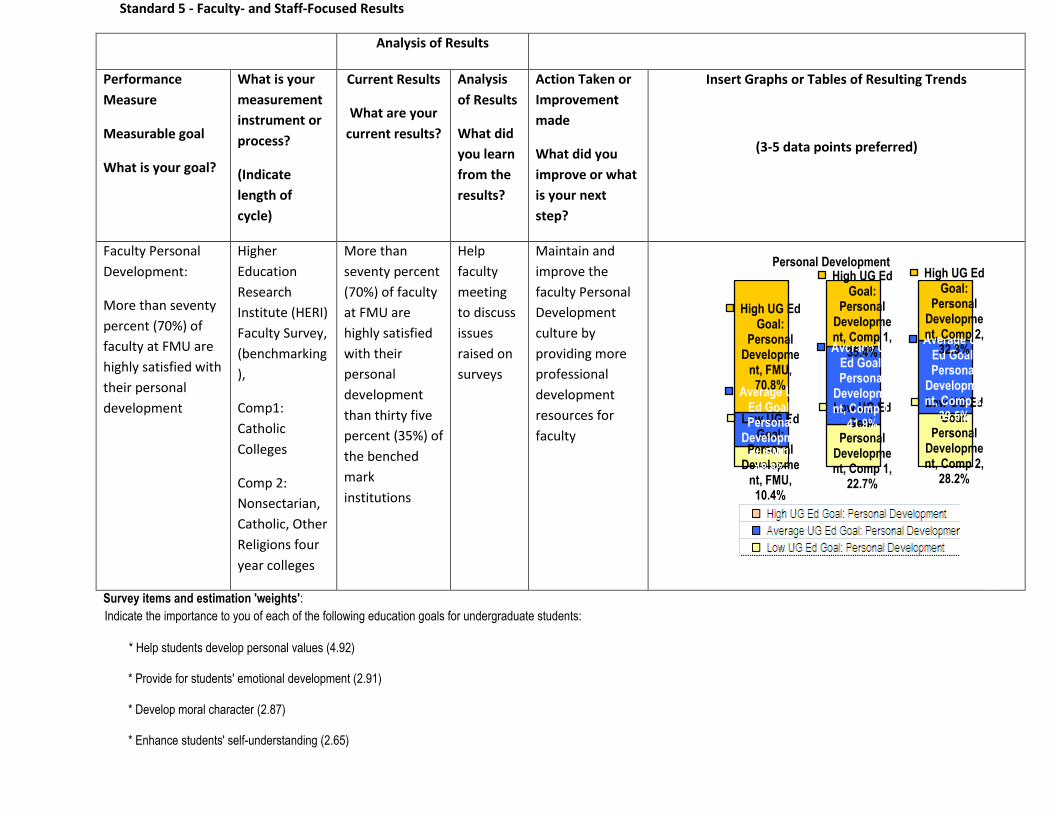
Faculty Personal
Development:
More than seventy
percent (70%) of
faculty at FMU are
highly satisfied with
their personal
development
Higher
Education
Research
Institute (HERI)
Faculty Survey,
(benchmarking
),
Comp1:
Catholic
Colleges
Comp 2:
Nonsectarian,
Catholic, Other
Religions four
year colleges
More than
seventy percent
(70%) of faculty
at FMU are
highly satisfied
with their
personal
development
than thirty five
percent (35%) of
the benched
mark
institutions
Help
faculty
meeting
to discuss
issues
raised on
surveys
Maintain and
improve the
faculty Personal
Development
culture by
providing more
professional
development
resources for
faculty
Survey items and estimation 'weights':
Indicate the importance to you of each of the following education goals for undergraduate students:
* Help students develop personal values (4.92)
* Provide for students' emotional development (2.91)
* Develop moral character (2.87)
* Enhance students' self-understanding (2.65)
Low UG Ed Goal:
Personal Developme
nt, FMU, 10.4%
Low UG Ed Goal:
Personal Development, Comp 1,
22.7%
Low UG Ed Goal:
Personal Development, Comp 2,
28.2%
Average UG Ed Goal: Personal
Development, FMU, 18.8%
Average UG Ed Goal: Personal
Development, Comp 1,
41.9%
Average UG Ed Goal: Personal
Development, Comp 2,
39.5%
High UG Ed Goal:
Personal Developme
nt, FMU, 70.8%
High UG Ed Goal:
Personal Development, Comp 1,
35.4%
High UG Ed Goal:
Personal Development, Comp 2,
32.3%
Personal Development
Standard 5 - Faculty- and Staff-Focused Results
Analysis of Results
Performance
Measure
Measurable goal
What is your goal?
What is your
measurement
instrument or
process?
(Indicate
length of
cycle)
Current Results
What are your
current results?
Analysis
of Results
What did
you learn
from the
results?
Action Taken or
Improvement
made
What did you
improve or what
is your next
step?
Insert Graphs or Tables of Resulting Trends
(3-5 data points preferred)
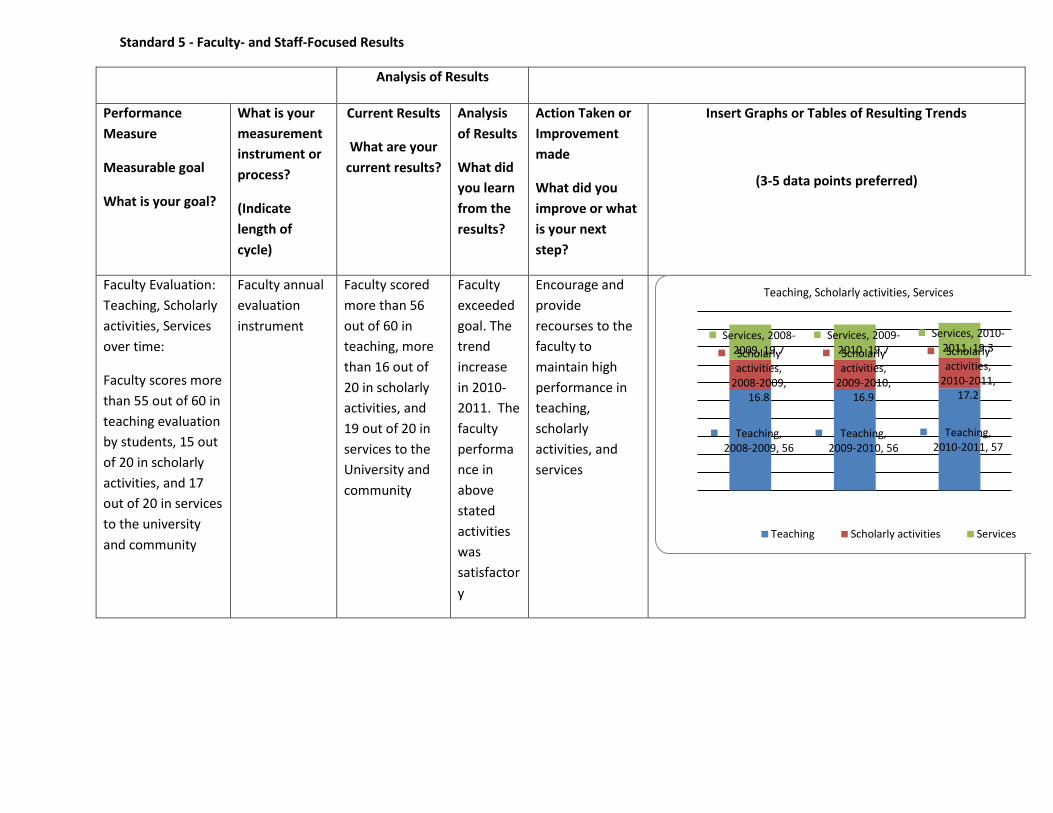
Faculty Evaluation:
Teaching, Scholarly
activities, Services
over time:
Faculty scores more
than 55 out of 60 in
teaching evaluation
by students, 15 out
of 20 in scholarly
activities, and 17
out of 20 in services
to the university
and community
Faculty annual
evaluation
instrument
Faculty scored
more than 56
out of 60 in
teaching, more
than 16 out of
20 in scholarly
activities, and
19 out of 20 in
services to the
University and
community
Faculty
exceeded
goal. The
trend
increase
in 2010-
2011. The
faculty
performa
nce in
above
stated
activities
was
satisfactor
y
Encourage and
provide
recourses to the
faculty to
maintain high
performance in
teaching,
scholarly
activities, and
services
Teaching, 2008-2009, 56
Teaching, 2009-2010, 56
Teaching, 2010-2011, 57
Scholarly activities,
2008-2009, 16.8
Scholarly activities,
2009-2010, 16.9
Scholarly activities,
2010-2011, 17.2
Services, 2008-2009, 19.7
Services, 2009-2010, 19.7
Services, 2010-2011, 19.3
Teaching Scholarly activities Services
Teaching, Scholarly activities, Services
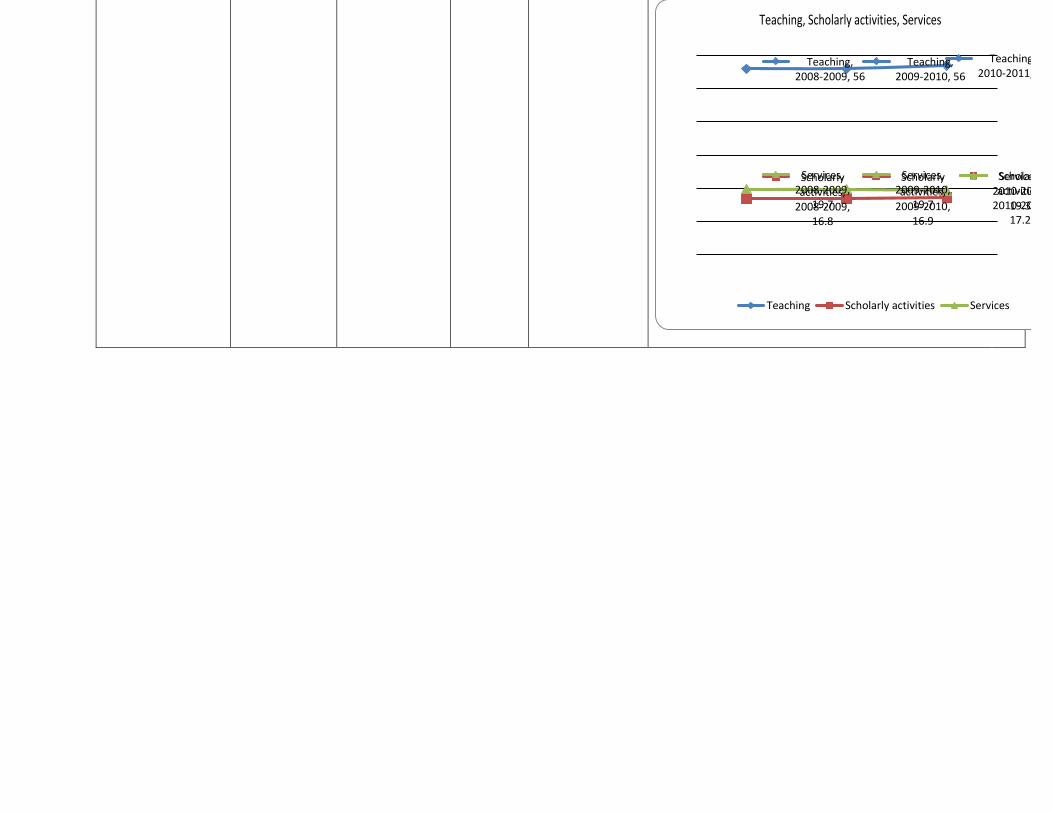
Teaching, 2008-2009, 56
Teaching, 2009-2010, 56
Teaching, 2010-2011, 57
Scholarly activities,
2008-2009, 16.8
Scholarly activities,
2009-2010, 16.9
Scholarly activities,
2010-2011, 17.2
Services, 2008-2009,
19.7
Services, 2009-2010,
19.7
Services, 2010-2011,
19.3
Teaching Scholarly activities Services
Teaching, Scholarly activities, Services

Faculty Qualifications
Complete the next two tables for new full-time and part-time faculty members since last self-study or QA report. Do not include faculty
members previously reported.
Standard 5 - NEW FULL-TIME FACULTY QUALIFICATIONS
NAME
(List alphabetically
by Last Name)
MAJOR
TEACHING
FIELD
COURSES TAUGHT
(List the Courses
Taught
During the Reporting
Period,
Do Not Duplicate
Listing)
LIST ALL EARNED
DEGREES
(State Degree as
Documented on
Transcript, Must
Include Major Field)
DOCUMENT OTHER
PROFESSIONAL
CERTIFICATION CRITIERA
Five Years Work Experience
Teaching Excellence
Professional Certifications
ACBSP
QUALIFICATION
1. Doctorate 2. Professional 3. Exception
Edwards, B. Management Business
Organization &
Management,
Business Internship &
Seminar
Human Resource
Management,
DBA, Business
Administration
MBA
Vice-President of
Institutional Advancement,
Special Assistant to the
president
Doctorate
Forbes, R. Accounting Principles of
Accounting I, II,
Intermediate
Accounting, I, II,
Managerial
Accounting
DBA, Accounting
MBA, Accounting
CPA Doctorate
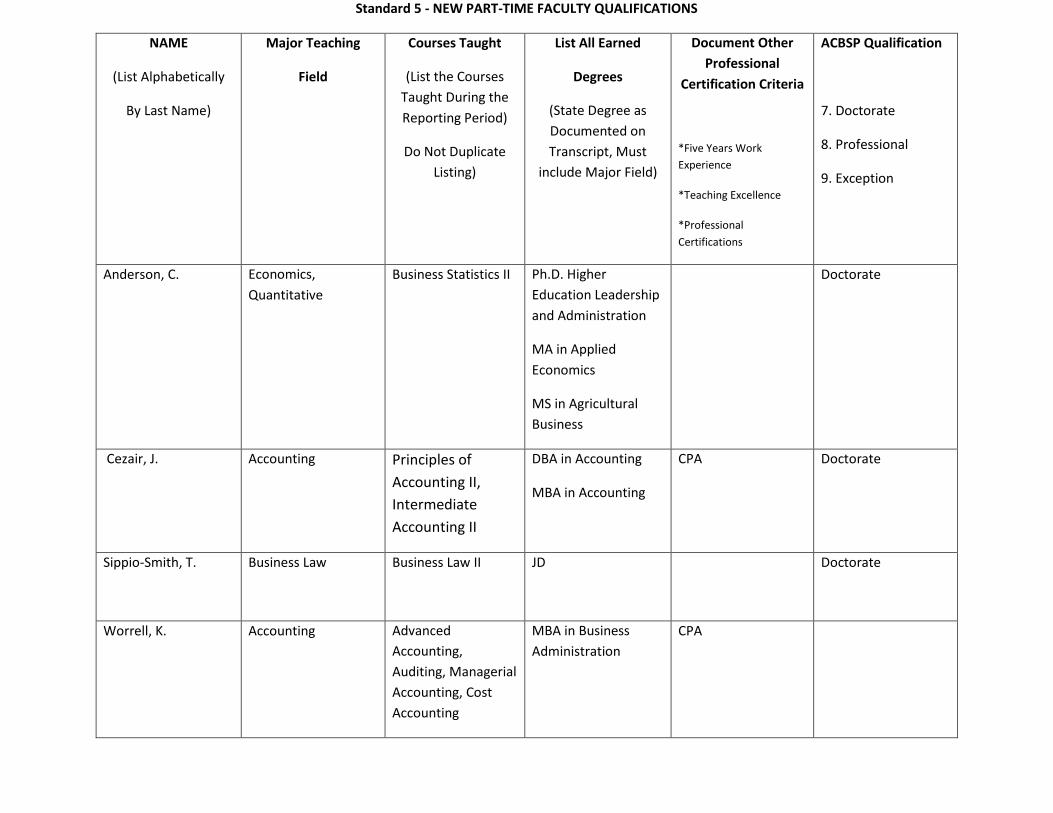
Standard 5 - NEW PART-TIME FACULTY QUALIFICATIONS
NAME
(List Alphabetically
By Last Name)
Major Teaching
Field
Courses Taught
(List the Courses
Taught During the
Reporting Period)
Do Not Duplicate
Listing)
List All Earned
Degrees
(State Degree as
Documented on
Transcript, Must
include Major Field)
Document Other
Professional
Certification Criteria
*Five Years Work
Experience
*Teaching Excellence
*Professional
Certifications
ACBSP Qualification
7. Doctorate
8. Professional
9. Exception
Anderson, C. Economics,
Quantitative
Business Statistics II
Ph.D. Higher
Education Leadership
and Administration
MA in Applied
Economics
MS in Agricultural
Business
Doctorate
Cezair, J. Accounting Principles of
Accounting II,
Intermediate
Accounting II
DBA in Accounting
MBA in Accounting
CPA Doctorate
Sippio-Smith, T. Business Law Business Law II JD
Doctorate
Worrell, K. Accounting Advanced
Accounting,
Auditing, Managerial
Accounting, Cost
Accounting
MBA in Business
Administration
CPA
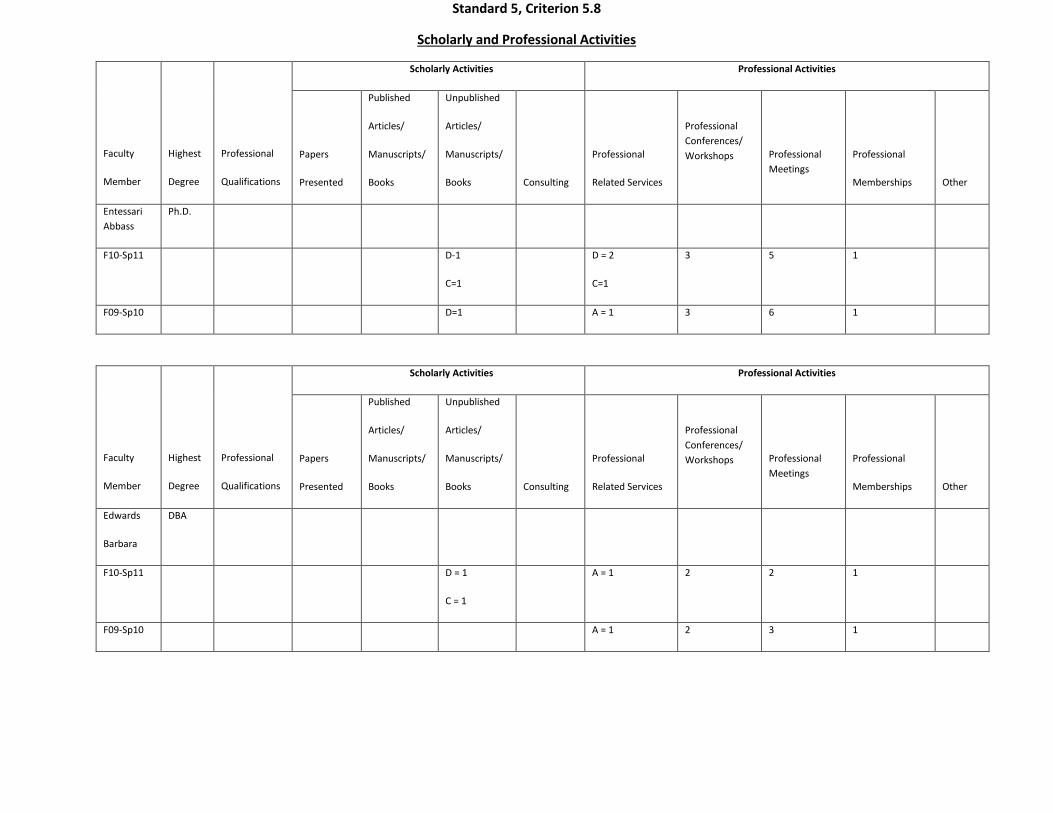
Standard 5, Criterion 5.8
Scholarly and Professional Activities
Faculty
Member
Highest
Degree
Professional
Qualifications
Scholarly Activities Professional Activities
Papers
Presented
Published
Articles/
Manuscripts/
Books
Unpublished
Articles/
Manuscripts/
Books
Consulting
Professional
Related Services
Professional
Conferences/
Workshops
Professional
Meetings
Professional
Memberships
Other
Entessari
Abbass
Ph.D.
F10-Sp11 D-1
C=1
D = 2
C=1
3 5 1
F09-Sp10 D=1 A = 1 3 6 1
Faculty
Member
Highest
Degree
Professional
Qualifications
Scholarly Activities Professional Activities
Papers
Presented
Published
Articles/
Manuscripts/
Books
Unpublished
Articles/
Manuscripts/
Books
Consulting
Professional
Related Services
Professional
Conferences/
Workshops
Professional
Meetings
Professional
Memberships
Other
Edwards
Barbara
DBA
F10-Sp11 D = 1
C = 1
A = 1 2 2 1
F09-Sp10 A = 1 2 3 1
Faculty
Member
Highest
Degree
Professional
Qualifications
Scholarly Activities Professional Activities
Papers
Presented
Published
Articles/
Manuscripts/
Books
Unpublished
Articles/
Manuscripts/
Books
Consulting
Professional
Related Services
Professional
Conferences/
Workshops
Professional
Meetings
Professional
Memberships
Other
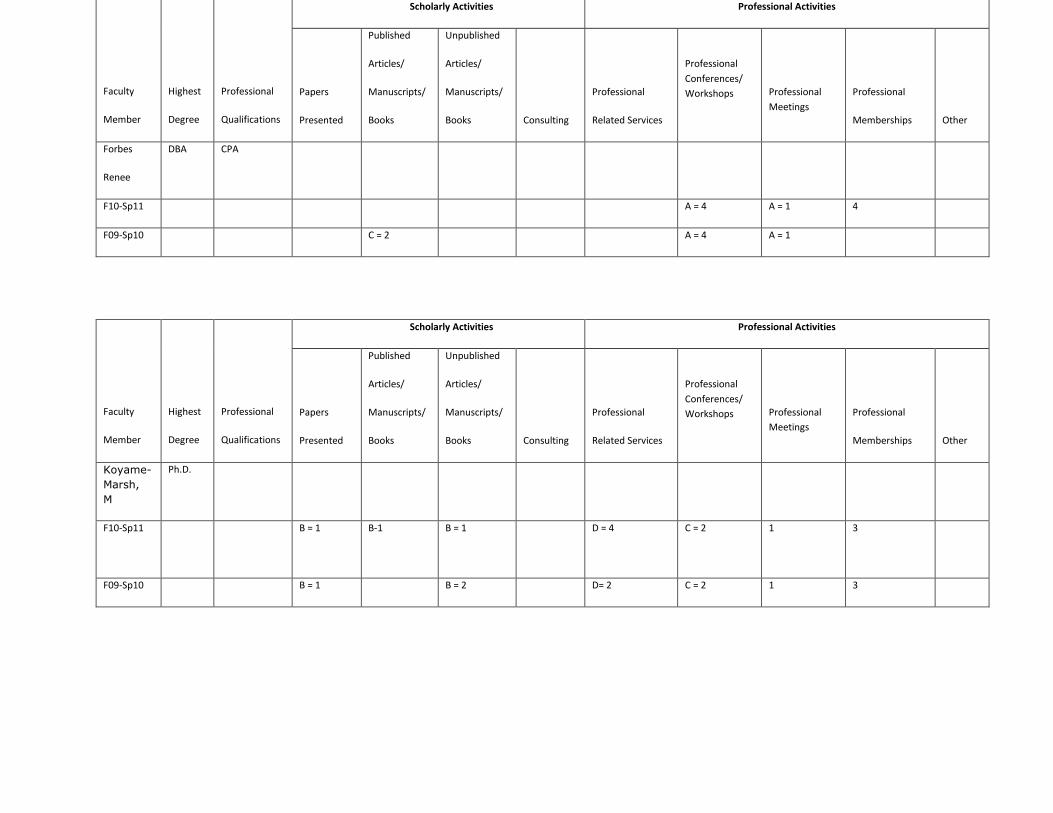
Forbes
Renee
DBA CPA
F10-Sp11 A = 4 A = 1 4
F09-Sp10 C = 2 A = 4 A = 1
Faculty
Member
Highest
Degree
Professional
Qualifications
Scholarly Activities Professional Activities
Papers
Presented
Published
Articles/
Manuscripts/
Books
Unpublished
Articles/
Manuscripts/
Books
Consulting
Professional
Related Services
Professional
Conferences/
Workshops
Professional
Meetings
Professional
Memberships
Other
Koyame-
Marsh,
M
Ph.D.
F10-Sp11 B = 1 B-1 B = 1 D = 4 C = 2 1 3
F09-Sp10 B = 1 B = 2 D= 2 C = 2 1 3
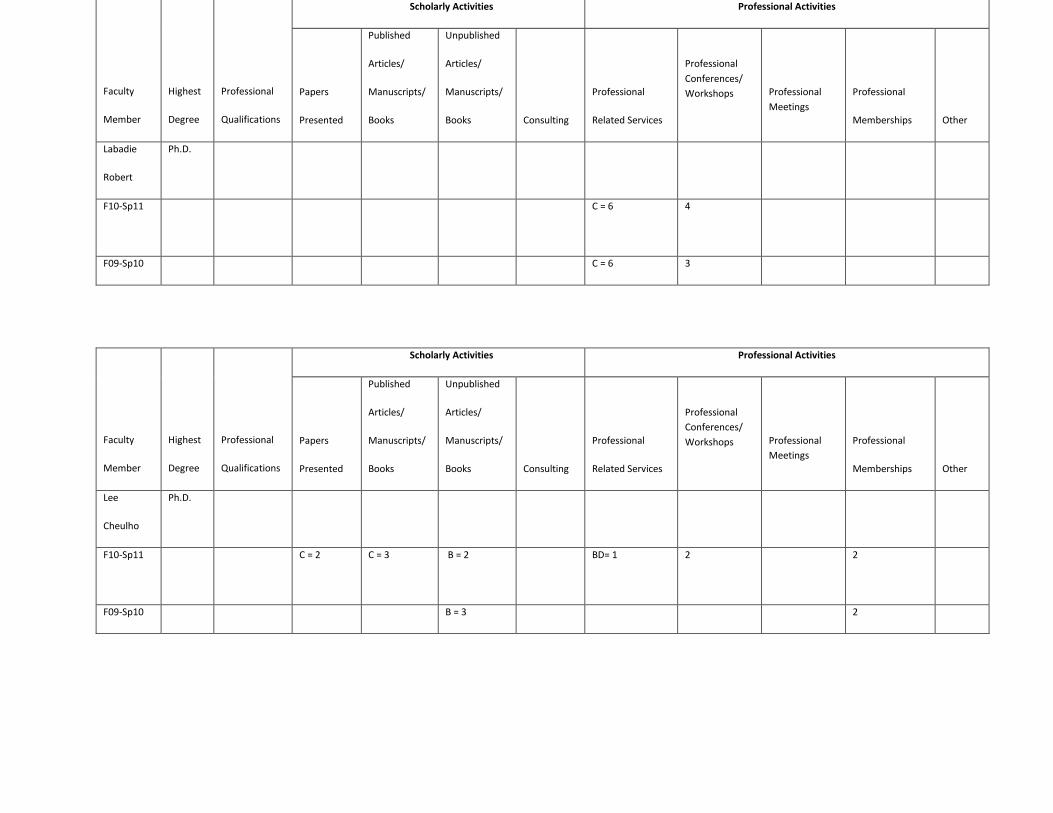
Faculty
Member
Highest
Degree
Professional
Qualifications
Scholarly Activities Professional Activities
Papers
Presented
Published
Articles/
Manuscripts/
Books
Unpublished
Articles/
Manuscripts/
Books
Consulting
Professional
Related Services
Professional
Conferences/
Workshops
Professional
Meetings
Professional
Memberships
Other
Labadie
Robert
Ph.D.
F10-Sp11 C = 6
4
F09-Sp10 C = 6 3
Faculty
Member
Highest
Degree
Professional
Qualifications
Scholarly Activities Professional Activities
Papers
Presented
Published
Articles/
Manuscripts/
Books
Unpublished
Articles/
Manuscripts/
Books
Consulting
Professional
Related Services
Professional
Conferences/
Workshops
Professional
Meetings
Professional
Memberships
Other
Lee
Cheulho
Ph.D.
F10-Sp11 C = 2 C = 3 B = 2 BD= 1 2 2
F09-Sp10 B = 3 2

Faculty
Member
Highest
Degree
Professional
Qualifications
Scholarly Activities Professional Activities
Papers
Presented
Published
Articles/
Manuscripts/
Books
Unpublished
Articles/
Manuscripts/
Books
Consulting
Professional
Related Services
Professional
Conferences/
Workshops
Professional
Meetings
Professional
Memberships
Other
Lucky
William
Ph.D.
F10-Sp11 B=3 C=2
D=2
A=2
C = 1
B = 2
5 1 1
F09-Sp10 B = 2 C=2
D=2
A=2
C = 1
B = 2
D = 1
3 1 1
Faculty
Member
Highest
Degree
Professional
Qualifications
Scholarly Activities Professional Activities
Papers
Presented
Published
Articles/
Manuscripts/
Books
Unpublished
Articles/
Manuscripts/
Books
Consulting
Professional
Related Services
Professional
Conferences/
Workshops
Professional
Meetings
Professional
Memberships
Other
Pellegrino
Kimberly
Ph.D.
F10-Sp11 B = 1 B-3 B = 7 1 1
F09-Sp10 B = 2 B = 2 B=2 B = 4 1 1 0
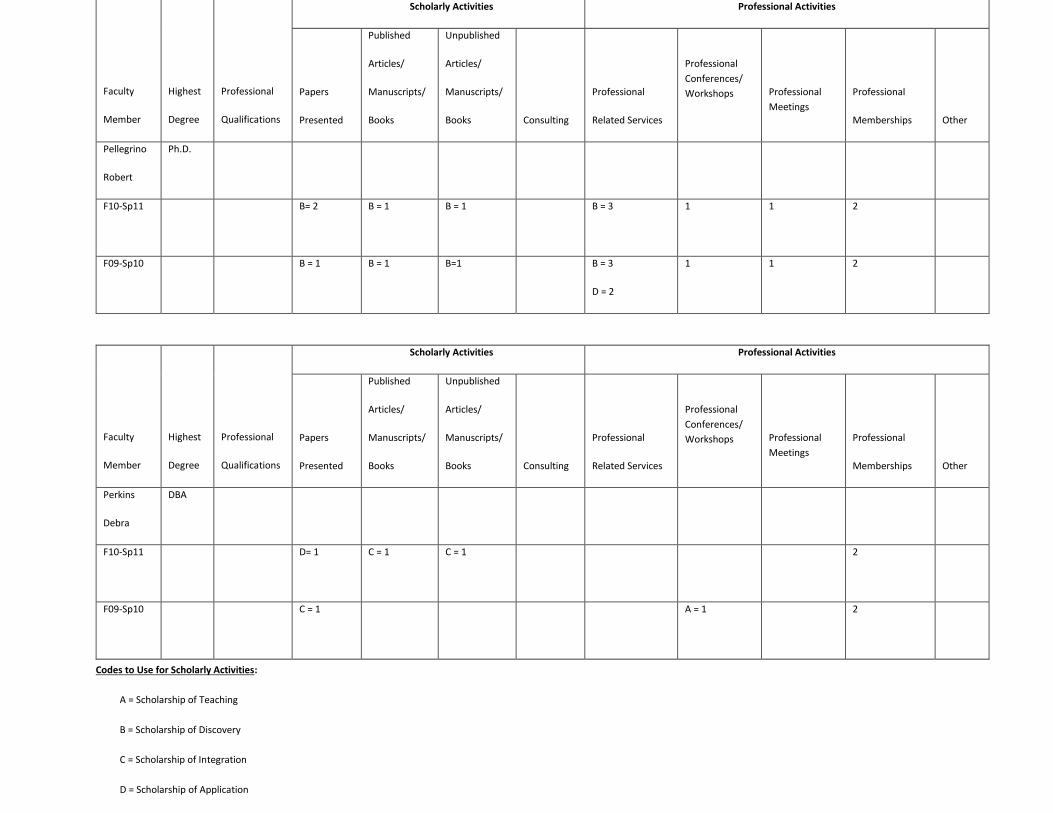
Faculty
Member
Highest
Degree
Professional
Qualifications
Scholarly Activities Professional Activities
Papers
Presented
Published
Articles/
Manuscripts/
Books
Unpublished
Articles/
Manuscripts/
Books
Consulting
Professional
Related Services
Professional
Conferences/
Workshops
Professional
Meetings
Professional
Memberships
Other
Pellegrino
Robert
Ph.D.
F10-Sp11 B= 2 B = 1 B = 1 B = 3 1 1 2
F09-Sp10 B = 1
B = 1 B=1 B = 3
D = 2
1 1 2
Faculty
Member
Highest
Degree
Professional
Qualifications
Scholarly Activities Professional Activities
Papers
Presented
Published
Articles/
Manuscripts/
Books
Unpublished
Articles/
Manuscripts/
Books
Consulting
Professional
Related Services
Professional
Conferences/
Workshops
Professional
Meetings
Professional
Memberships
Other
Perkins
Debra
DBA
F10-Sp11 D= 1 C = 1
C = 1 2
F09-Sp10 C = 1
A = 1 2
Codes to Use for Scholarly Activities:
A = Scholarship of Teaching
B = Scholarship of Discovery
C = Scholarship of Integration
D = Scholarship of Application
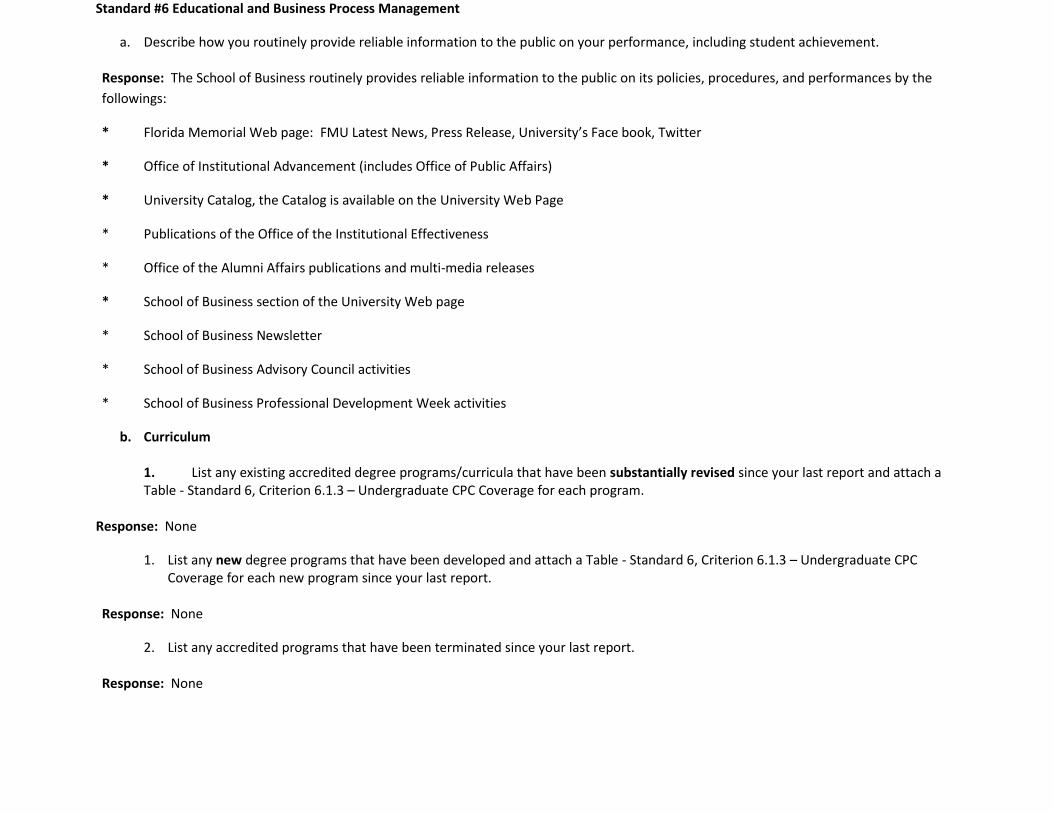
Standard #6 Educational and Business Process Management
a. Describe how you routinely provide reliable information to the public on your performance, including student achievement.
Response: The School of Business routinely provides reliable information to the public on its policies, procedures, and performances by the
followings:
* Florida Memorial Web page: FMU Latest News, Press Release, University’s Face book, Twitter
* Office of Institutional Advancement (includes Office of Public Affairs)
* University Catalog, the Catalog is available on the University Web Page
* Publications of the Office of the Institutional Effectiveness
* Office of the Alumni Affairs publications and multi-media releases
* School of Business section of the University Web page
* School of Business Newsletter
* School of Business Advisory Council activities
* School of Business Professional Development Week activities
b. Curriculum 1. List any existing accredited degree programs/curricula that have been substantially revised since your last report and attach a Table - Standard 6, Criterion 6.1.3 – Undergraduate CPC Coverage for each program.
Response: None
1. List any new degree programs that have been developed and attach a Table - Standard 6, Criterion 6.1.3 – Undergraduate CPC Coverage for each new program since your last report.
Response: None
2. List any accredited programs that have been terminated since your last report.
Response: None
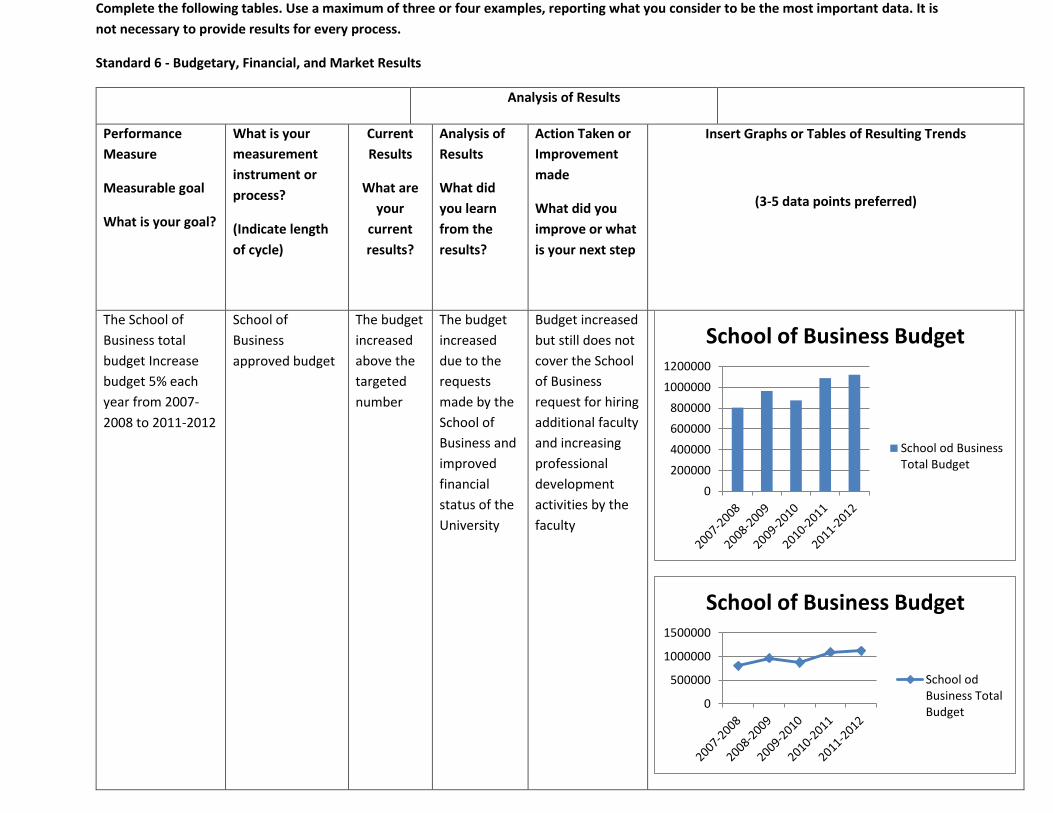
Complete the following tables. Use a maximum of three or four examples, reporting what you consider to be the most important data. It is
not necessary to provide results for every process.
Standard 6 - Budgetary, Financial, and Market Results
Analysis of Results
Performance
Measure
Measurable goal
What is your goal?
What is your
measurement
instrument or
process?
(Indicate length
of cycle)
Current
Results
What are
your
current
results?
Analysis of
Results
What did
you learn
from the
results?
Action Taken or
Improvement
made
What did you
improve or what
is your next step
Insert Graphs or Tables of Resulting Trends
(3-5 data points preferred)
The School of
Business total
budget Increase
budget 5% each
year from 2007-
2008 to 2011-2012
School of
Business
approved budget
The budget
increased
above the
targeted
number
The budget
increased
due to the
requests
made by the
School of
Business and
improved
financial
status of the
University
Budget increased
but still does not
cover the School
of Business
request for hiring
additional faculty
and increasing
professional
development
activities by the
faculty
0
200000
400000
600000
800000
1000000
1200000
School of Business Budget
School od BusinessTotal Budget
0
500000
1000000
1500000
School of Business Budget
School odBusiness TotalBudget
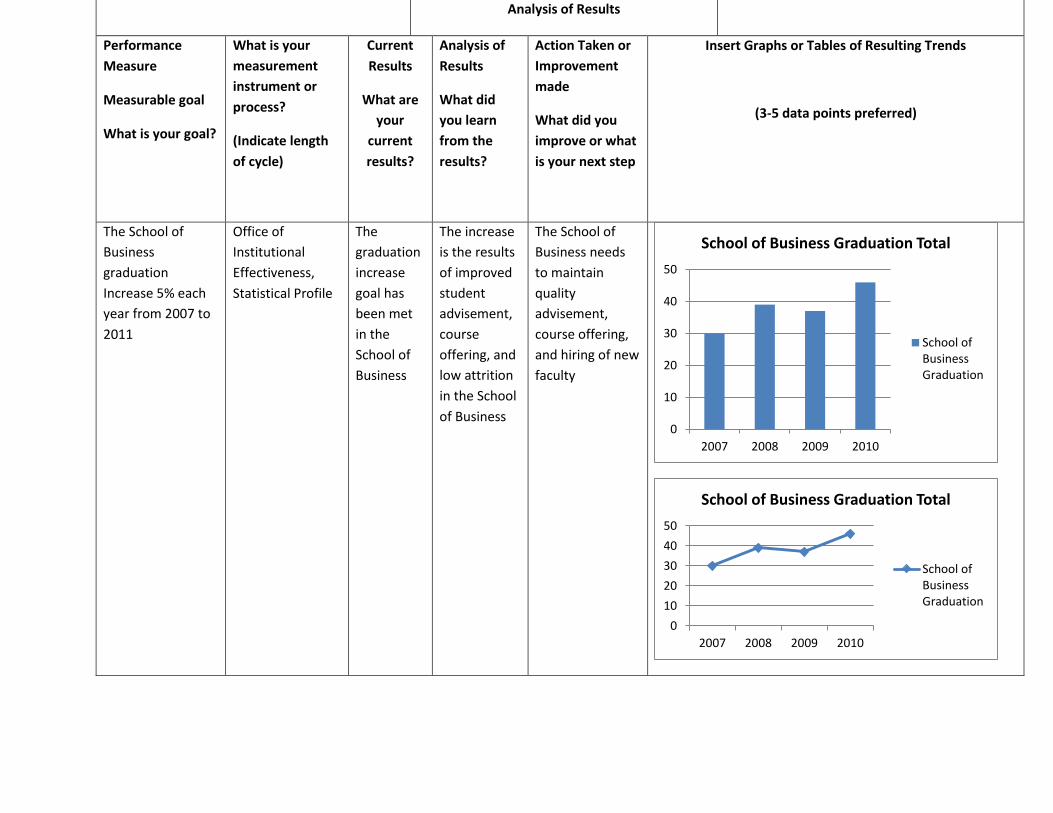
Analysis of Results
Performance
Measure
Measurable goal
What is your goal?
What is your
measurement
instrument or
process?
(Indicate length
of cycle)
Current
Results
What are
your
current
results?
Analysis of
Results
What did
you learn
from the
results?
Action Taken or
Improvement
made
What did you
improve or what
is your next step
Insert Graphs or Tables of Resulting Trends
(3-5 data points preferred)
The School of
Business
graduation
Increase 5% each
year from 2007 to
2011
Office of
Institutional
Effectiveness,
Statistical Profile
The
graduation
increase
goal has
been met
in the
School of
Business
The increase
is the results
of improved
student
advisement,
course
offering, and
low attrition
in the School
of Business
The School of
Business needs
to maintain
quality
advisement,
course offering,
and hiring of new
faculty
0
10
20
30
40
50
2007 2008 2009 2010
School of Business Graduation Total
School ofBusinessGraduation
0
10
20
30
40
50
2007 2008 2009 2010
School of Business Graduation Total
School ofBusinessGraduation
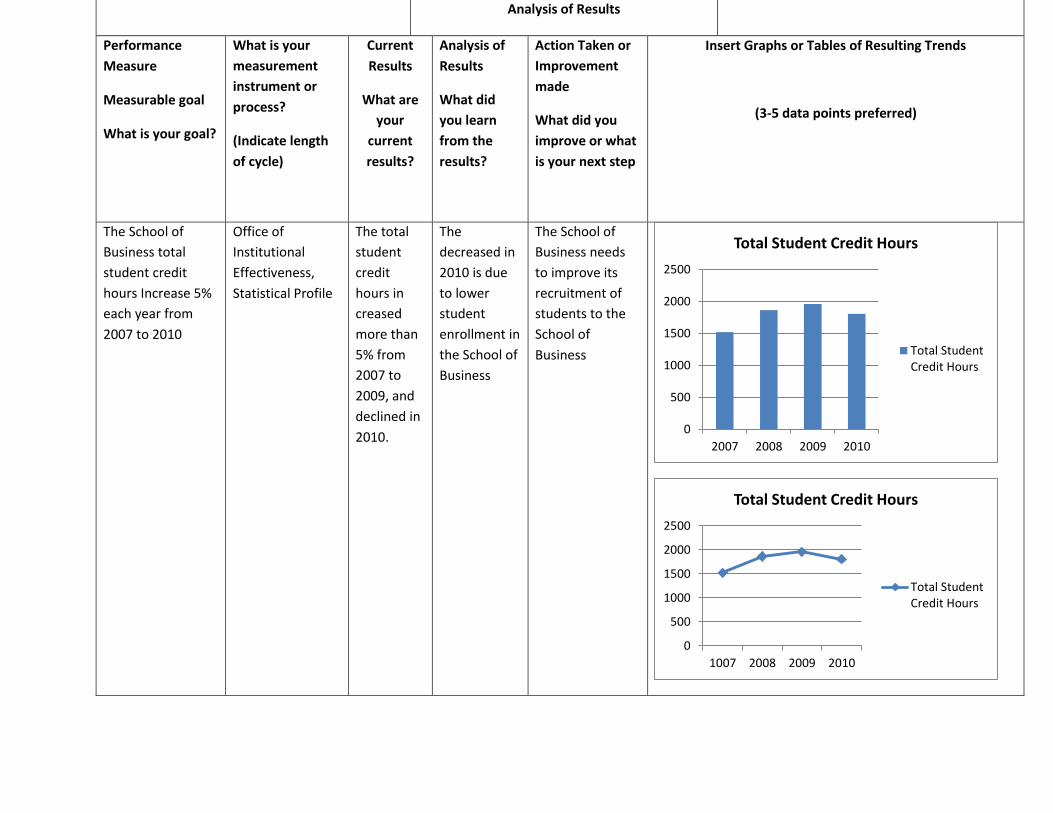
Analysis of Results
Performance
Measure
Measurable goal
What is your goal?
What is your
measurement
instrument or
process?
(Indicate length
of cycle)
Current
Results
What are
your
current
results?
Analysis of
Results
What did
you learn
from the
results?
Action Taken or
Improvement
made
What did you
improve or what
is your next step
Insert Graphs or Tables of Resulting Trends
(3-5 data points preferred)
The School of
Business total
student credit
hours Increase 5%
each year from
2007 to 2010
Office of
Institutional
Effectiveness,
Statistical Profile
The total
student
credit
hours in
creased
more than
5% from
2007 to
2009, and
declined in
2010.
The
decreased in
2010 is due
to lower
student
enrollment in
the School of
Business
The School of
Business needs
to improve its
recruitment of
students to the
School of
Business
0
500
1000
1500
2000
2500
2007 2008 2009 2010
Total Student Credit Hours
Total StudentCredit Hours
0
500
1000
1500
2000
2500
1007 2008 2009 2010
Total Student Credit Hours
Total StudentCredit Hours
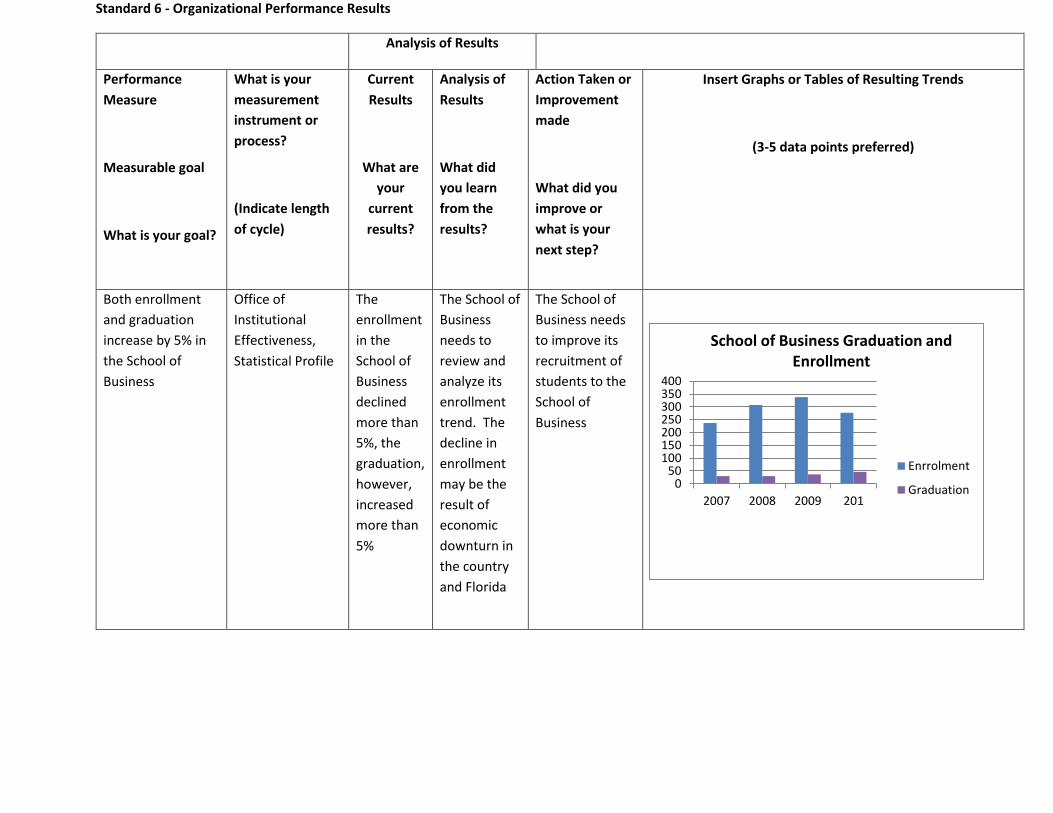
Standard 6 - Organizational Performance Results
Analysis of Results
Performance
Measure
Measurable goal
What is your goal?
What is your
measurement
instrument or
process?
(Indicate length
of cycle)
Current
Results
What are
your
current
results?
Analysis of
Results
What did
you learn
from the
results?
Action Taken or
Improvement
made
What did you
improve or
what is your
next step?
Insert Graphs or Tables of Resulting Trends
(3-5 data points preferred)
Both enrollment
and graduation
increase by 5% in
the School of
Business
Office of
Institutional
Effectiveness,
Statistical Profile
The
enrollment
in the
School of
Business
declined
more than
5%, the
graduation,
however,
increased
more than
5%
The School of
Business
needs to
review and
analyze its
enrollment
trend. The
decline in
enrollment
may be the
result of
economic
downturn in
the country
and Florida
The School of
Business needs
to improve its
recruitment of
students to the
School of
Business
050
100150200250300350400
2007 2008 2009 201
School of Business Graduation and Enrollment
Enrrolment
Graduation

050
100150200250300350400
2007 2008 2009 2010
School of Business Graduation and Enrollment
Enrrolment
Graduation
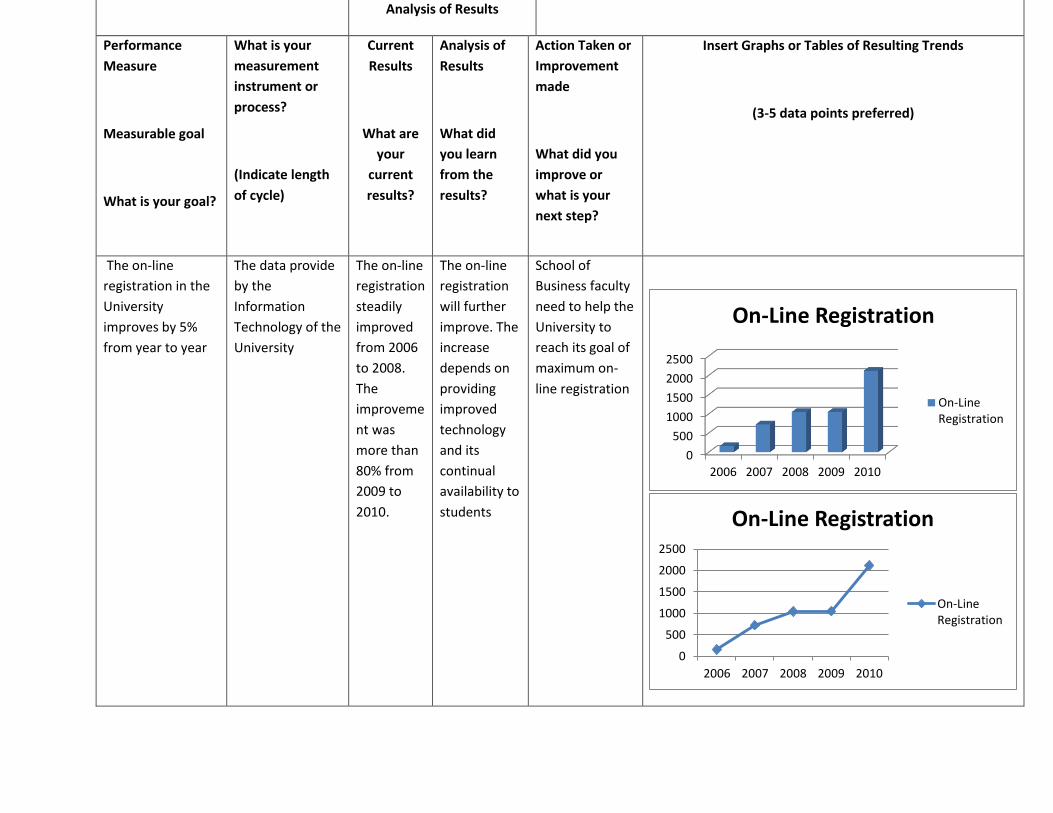
Analysis of Results
Performance
Measure
Measurable goal
What is your goal?
What is your
measurement
instrument or
process?
(Indicate length
of cycle)
Current
Results
What are
your
current
results?
Analysis of
Results
What did
you learn
from the
results?
Action Taken or
Improvement
made
What did you
improve or
what is your
next step?
Insert Graphs or Tables of Resulting Trends
(3-5 data points preferred)
The on-line
registration in the
University
improves by 5%
from year to year
The data provide
by the
Information
Technology of the
University
The on-line
registration
steadily
improved
from 2006
to 2008.
The
improveme
nt was
more than
80% from
2009 to
2010.
The on-line
registration
will further
improve. The
increase
depends on
providing
improved
technology
and its
continual
availability to
students
School of
Business faculty
need to help the
University to
reach its goal of
maximum on-
line registration
0
500
1000
1500
2000
2500
2006 2007 2008 2009 2010
On-Line Registration
On-LineRegistration
0
500
1000
1500
2000
2500
2006 2007 2008 2009 2010
On-Line Registration
On-LineRegistration
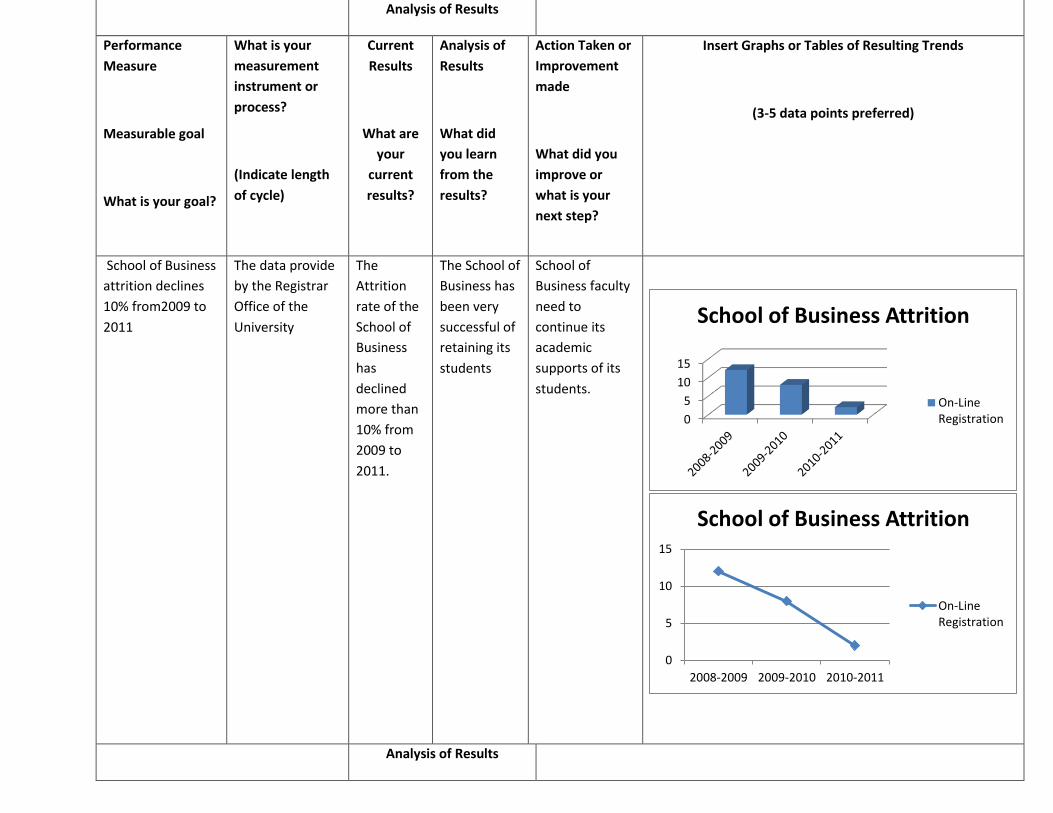
Analysis of Results
Performance
Measure
Measurable goal
What is your goal?
What is your
measurement
instrument or
process?
(Indicate length
of cycle)
Current
Results
What are
your
current
results?
Analysis of
Results
What did
you learn
from the
results?
Action Taken or
Improvement
made
What did you
improve or
what is your
next step?
Insert Graphs or Tables of Resulting Trends
(3-5 data points preferred)
School of Business
attrition declines
10% from2009 to
2011
The data provide
by the Registrar
Office of the
University
The
Attrition
rate of the
School of
Business
has
declined
more than
10% from
2009 to
2011.
The School of
Business has
been very
successful of
retaining its
students
School of
Business faculty
need to
continue its
academic
supports of its
students.
Analysis of Results
0
5
10
15
School of Business Attrition
On-LineRegistration
0
5
10
15
2008-2009 2009-2010 2010-2011
School of Business Attrition
On-LineRegistration
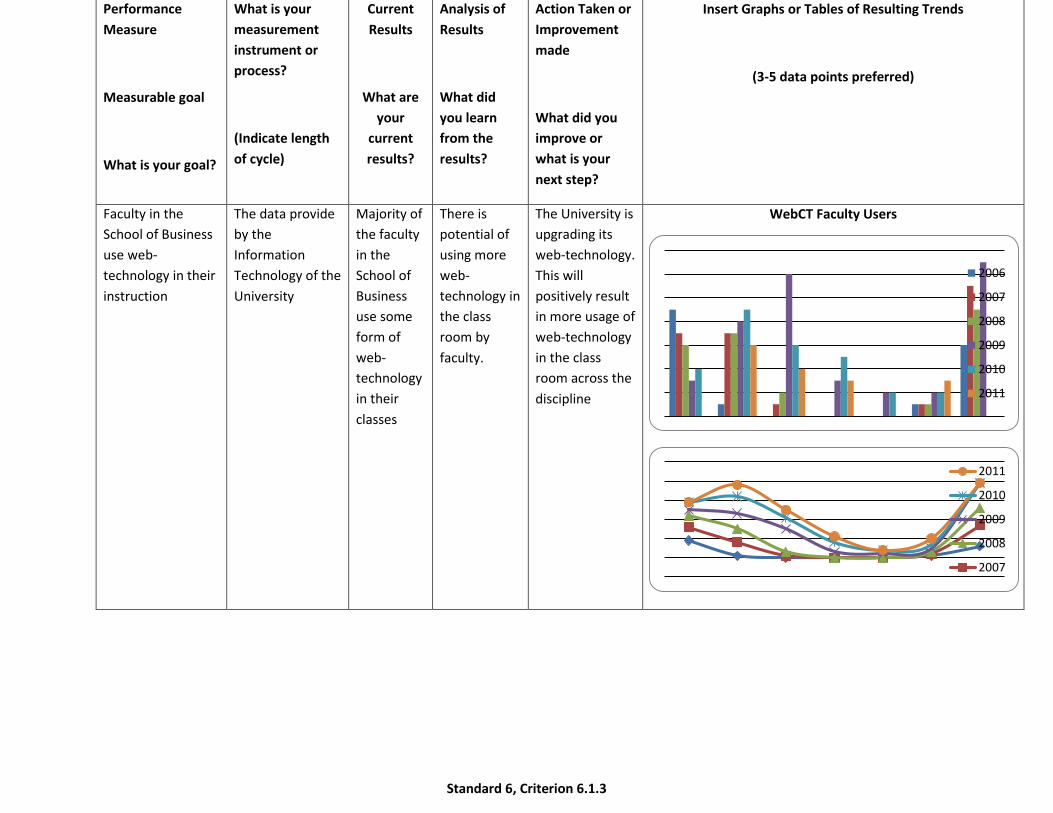
Performance
Measure
Measurable goal
What is your goal?
What is your
measurement
instrument or
process?
(Indicate length
of cycle)
Current
Results
What are
your
current
results?
Analysis of
Results
What did
you learn
from the
results?
Action Taken or
Improvement
made
What did you
improve or
what is your
next step?
Insert Graphs or Tables of Resulting Trends
(3-5 data points preferred)
Faculty in the
School of Business
use web-
technology in their
instruction
The data provide
by the
Information
Technology of the
University
Majority of
the faculty
in the
School of
Business
use some
form of
web-
technology
in their
classes
There is
potential of
using more
web-
technology in
the class
room by
faculty.
The University is
upgrading its
web-technology.
This will
positively result
in more usage of
web-technology
in the class
room across the
discipline
WebCT Faculty Users
Standard 6, Criterion 6.1.3
2006
2007
2008
2009
2010
2011
2011
2010
2009
2008
2007
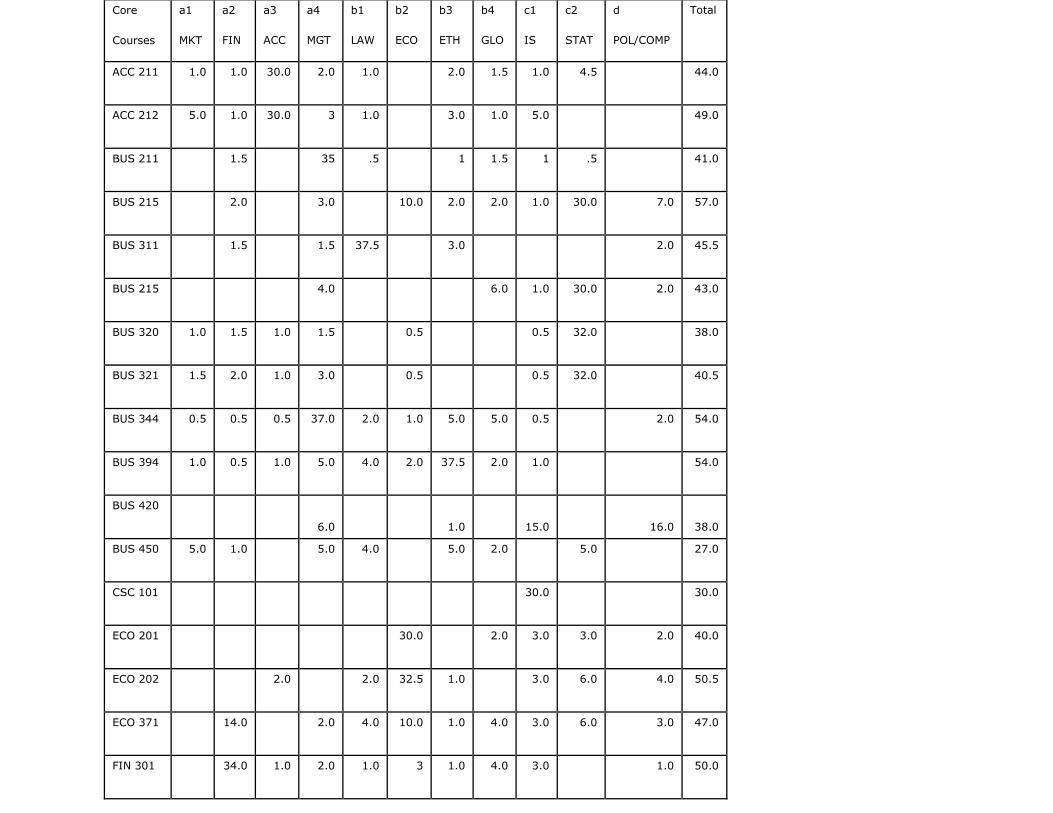
Core
Courses
a1
MKT
a2
FIN
a3
ACC
a4
MGT
b1
LAW
b2
ECO
b3
ETH
b4
GLO
c1
IS
c2
STAT
d
POL/COMP
Total
ACC 211 1.0 1.0 30.0 2.0 1.0
2.0 1.5 1.0 4.5
44.0
ACC 212 5.0 1.0 30.0 3 1.0
3.0 1.0 5.0
49.0
BUS 211
1.5
35 .5 1 1.5 1 .5
41.0
BUS 215
2.0
3.0
10.0 2.0 2.0 1.0 30.0 7.0 57.0
BUS 311
1.5
1.5 37.5
3.0
2.0 45.5
BUS 215
4.0
6.0 1.0 30.0 2.0 43.0
BUS 320 1.0 1.5 1.0 1.5
0.5
0.5 32.0
38.0
BUS 321 1.5 2.0 1.0 3.0
0.5
0.5 32.0
40.5
BUS 344 0.5 0.5 0.5 37.0 2.0 1.0 5.0 5.0 0.5
2.0 54.0
BUS 394 1.0 0.5 1.0 5.0 4.0 2.0 37.5 2.0 1.0
54.0
BUS 420
6.0
1.0
15.0
16.0
38.0
BUS 450 5.0 1.0
5.0 4.0
5.0 2.0
5.0
27.0
CSC 101
30.0
30.0
ECO 201
30.0
2.0 3.0 3.0 2.0 40.0
ECO 202
2.0
2.0 32.5 1.0
3.0 6.0 4.0 50.5
ECO 371 14.0
2.0 4.0 10.0 1.0 4.0 3.0 6.0 3.0 47.0
FIN 301
34.0 1.0 2.0 1.0 3 1.0 4.0 3.0
1.0 50.0

HRM 350 1.5
37.0 6.0 1.0 5.0 2.0 0.5
1.0 54.0
MAR 301 37.5
1.0 3.0 2.0 1.0
4.0 2.0
0.5 51.0
Total 54.5 60.5 67.5 150 65 91.5 67.5 37.0 71.0 149.0 40.0
APENDIX A
Student CRS Complaint/Grievance Form
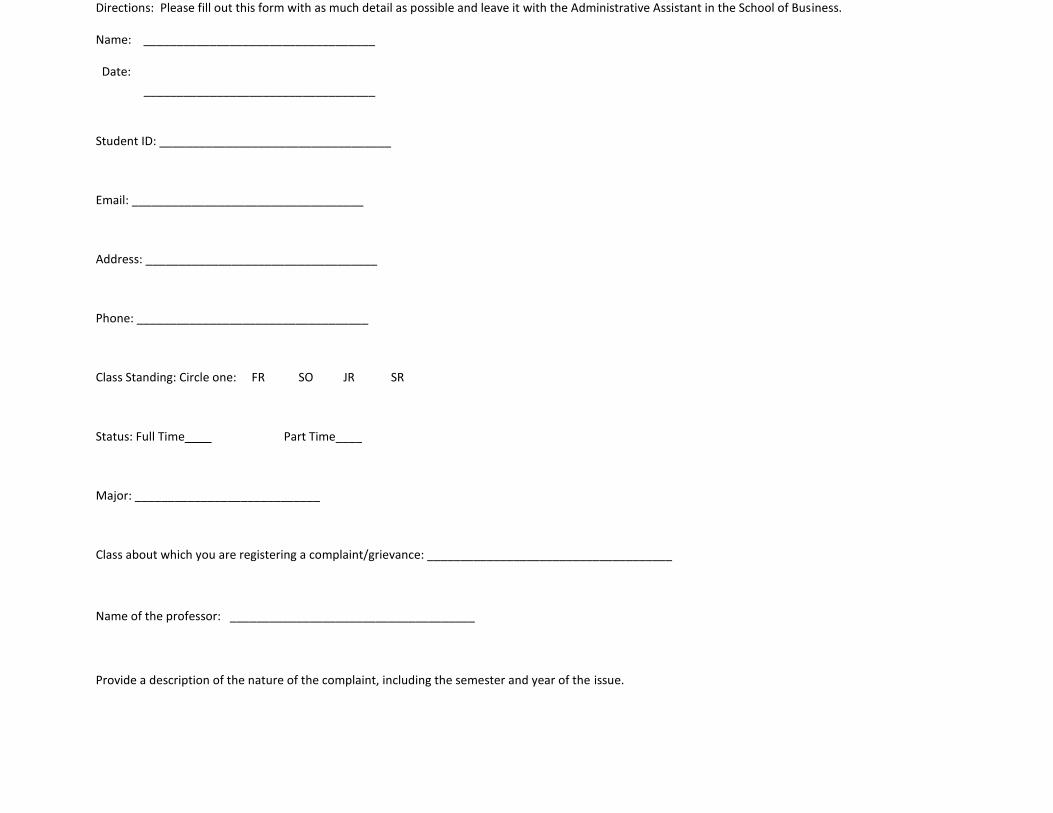
Directions: Please fill out this form with as much detail as possible and leave it with the Administrative Assistant in the School of Business.
Name: ___________________________________
Date:
___________________________________
Student ID: ___________________________________
Email: ___________________________________
Address: ___________________________________
Phone: ___________________________________
Class Standing: Circle one: FR SO JR SR
Status: Full Time____ Part Time____
Major: ____________________________
Class about which you are registering a complaint/grievance: _____________________________________
Name of the professor: _____________________________________
Provide a description of the nature of the complaint, including the semester and year of the issue.
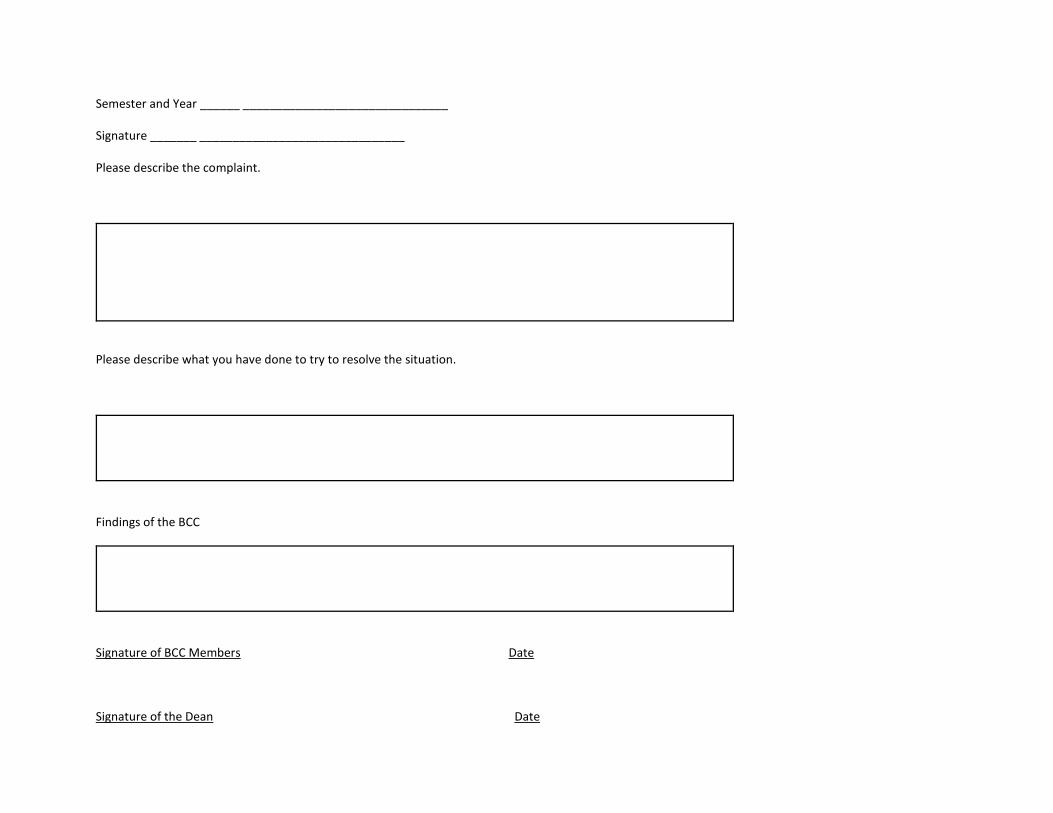
Semester and Year ______ _______________________________
Signature _______ _______________________________
Please describe the complaint.
Please describe what you have done to try to resolve the situation.
Findings of the BCC
Signature of BCC Members Date
Signature of the Dean Date

A PROMISE. A
FUTURE.
DR. ROBERT PELLEGRINO Associate Professor of
Marketing and
November 30, 2011
MS. SOPHRETTA BENJAMIN Administrative Assistant
DR. BARBARA EDWARDS Associate Professor of
Management
DR. WILLIAM LUCKY, JR. Director and
Assistant Professor of Marketing
BUSINESS ADMINISTRATION
DR. ROBERT LABADIE Professor of
Business Administration
DR. RITA KOYAME-MARSH Associate Professor of
Economics
DR. KIMBERLY PELLEGRINO Associate Professor of
Management
ACCOUNTING
DR. RENEE FORBES-WILLIAMS Associate Professor of Accounting
MARKETING
FINANCE
DR. CHEULHO LEE Director and
Associate Professor of Finance
MBA PROGRAM Director
DR. ABBASS ENTESSARI
DEAN and Professor of Economics
DR. DEBRA PERKINS Associate Professor of
Management
Ms. Paulette Elliott MBA Secretary